

Submitted:
22 September 2026
Posted:
22 September 2026
You are already at the latest version
Abstract
Urban biodiversity monitoring increasingly combines field surveys with automated technologies, but species detected by only one approach may represent ecologically structured subsets rather than random omissions. We integrated 2025 bird records from monthly visual transect surveys, autonomous acoustic monitoring, and infrared camera traps in Shanghai Botanical Garden, China. Annual presence–absence data were analyzed without comparing absolute monitoring efficiency. Manual surveys detected 112 wild bird species and multi-source automated monitoring detected 101; 83 species were shared, 29 were manual-only, and 18 were automated-only, yielding 130 species in total (Jaccard = 0.638; Sørensen = 0.779). In a multivariable logistic model with joint detection as the outcome, resident status was positively associated with joint detection (adjusted OR = 7.76, 95% CI = 1.71–35.19, p = 0.008), whereas regional rarity in Shanghai was negatively associated with joint detection (adjusted OR = 0.287, 95% CI = 0.113–0.728, p = 0.009). These associations show that method-exclusive detections under the 2025 protocols were non-random with respect to residency and regional commonness, although unequal temporal coverage limits causal interpretation. Periodic visual surveys, continuous acoustic monitoring, image-based evidence, and expert validation provide complementary components of long-term urban bird monitoring.
Keywords:
urban biodiversity
; bird monitoring
; passive acoustic monitoring
; camera trapping
; method-exclusive detection
; botanical garden
1. Introduction
Urbanization reshapes ecological communities and can reduce native species representation, but cities still retain substantial biodiversity and therefore remain relevant to conservation and monitoring. Global analyses have shown that urban bird and plant assemblages are strongly filtered by anthropogenic land cover while still retaining many native species [1], and a study spanning more than 48,000 cities found that green-space availability is an increasingly important correlate of urban bird diversity as city size increases [2]. Urban birds have consequently become a mature model system for understanding ecological responses to urbanization [3]. Botanical gardens represent a particularly useful subset of urban green spaces because they combine heterogeneous vegetation, relatively stable management boundaries, long-term biological records, and research infrastructure. Nevertheless, their potential as long-term environmental monitoring platforms remains underused [4].
Conventional bird surveys based on transects or point counts remain fundamental because trained observers can integrate visual information, behavior, flight characteristics, habitat context, and vocalizations during species identification. However, field surveys are constrained by observer availability, survey duration, weather, and the temporal window in which observations are conducted. Autonomous recording units and passive acoustic monitoring (PAM) can extend sampling across time and retain permanent records that can be re-examined [5,6]. At the same time, comparisons between human surveys and acoustic recorders cannot be interpreted simply as comparisons of efficiency because their effective detection spaces and sensory pathways differ [7]. More generally, nondetection does not imply true absence when detection probability is less than one [8] and observed acoustic species richness is sensitive to recording duration, spatial coverage, and community composition [9]. Systematic evaluations of autonomous recording have therefore emphasized both the scalability of PAM and the need to interpret it within explicit sampling designs [10].
Recent advances in automated sound classification have greatly increased the scalability of acoustic biodiversity monitoring. Deep-learning systems such as BirdNET can process large volumes of recordings and generate species-level candidate detections [11]. Nevertheless, automated classifications remain sensitive to species identity, recording quality, environmental noise, geographic context, and confidence thresholds, and false-positive as well as false-negative detections remain important methodological concerns [12,13]. A recent global evaluation of BirdNET across continents and biomes further showed substantial variation in recall and species-specific performance and demonstrated that optimal confidence thresholds depend on species and analytical objectives [14]. Consequently, automated classifier outputs generally require threshold selection, manual review, or other forms of independent validation before being interpreted as confirmed species occurrences.
Empirical comparisons in urban green spaces have already demonstrated that conventional surveys and passive acoustic monitoring produce overlapping but non-identical bird inventories. In Wanzuitou Wetland Park, Guangzhou, Bai et al. recorded 48 species using transect surveys and 49 using AI-assisted acoustic monitoring, with 27 species shared between approaches [15]. In Chunshen Park, Shanghai, Tan et al. reported 49 species from passive acoustic monitoring and 32 from transect surveys, of which 24 were detected by both methods [16]. These studies establish that acoustic and field-based surveys can complement one another rather than function as interchangeable sampling approaches. The unresolved question is therefore not whether complementarity exists, but whether species that remain exclusive to one monitoring approach represent ecologically structured subsets of the bird community.
There are reasons to expect such structure. Species detectability is itself non-random: bird size, habitat specialization, taxonomic identity, singing rate, and detection distance can systematically influence whether individuals are detected in field surveys or acoustic data [17,18]. Resident and regionally common species also have repeated opportunities to enter multiple monitoring datasets, whereas transient, infrequently occurring, or regionally rare species may be more sensitive to the temporal and spatial windows of observation. Visual surveys may record species that provide weak or infrequent acoustic cues, whereas continuous acoustic monitoring can encounter vocal species during brief periods when no observer is present. Adding image-based monitoring further broadens the evidence base by providing an independent visual detection pathway. Thus, understanding monitoring complementarity requires moving beyond the question of how many species each method detects toward examining which species become method-exclusive and what ecological characteristics they share.
Here, we used a one-year bird monitoring dataset from Shanghai Botanical Garden, a large urban botanical garden with a long history of bird observations and a multi-source biodiversity monitoring system. In 2025, bird monitoring combined monthly fixed-transect visual surveys with autonomous acoustic recorders and infrared camera traps. Automated acoustic candidates were subjected to confidence filtering, expert review, and additional verification before inclusion in the confirmed species inventory; camera detections provided an independent image-based source of evidence. Because manual and automated approaches differed substantially in survey timing, duration, spatial deployment, and detection mechanisms, we did not attempt to compare absolute detection efficiency. Instead, we addressed two questions: (1) to what extent did manual surveys and multi-source automated monitoring produce overlapping versus method-exclusive annual bird inventories, and (2) were residency status and regional commonness associated with whether species were jointly detected or remained method-exclusive under the 2025 monitoring protocols? We expected R-coded residents to have repeated opportunities to enter both inventories, whereas species classified as regionally rare in Shanghai would be more likely to remain method-exclusive.
2. Materials and Methods
2.1. Study Area
The study was conducted in Shanghai Botanical Garden (SHBG), located in southern Xuhui District within the central urban area of Shanghai, China. Established in 1974, the garden covers 81.86 ha and contains 24 specialized gardens and two greenhouses [19,20]. Its functions include ex situ plant conservation, plant germplasm development and utilization, horticultural and cultural displays, and public science education. According to SHBG institutional records current to 2026, its living collections comprise approximately 11,500 plant taxa and the garden has developed more than 110 ornamental cultivars for urban landscapes. An established plant science education program supports public engagement. Long-term plant introduction, cultivation, and landscape management have created a heterogeneous mosaic of wooded vegetation, shrublands, lawns, water bodies, and intensively managed horticultural areas, providing potential foraging, resting, and stopover habitats for urban birds.
Following the 2025 study period, the State Council approved the establishment of Shanghai Chenshan National Botanical Garden in 2026 [21]. SHBG and Shanghai Chenshan Botanical Garden participate in its development; it is the third national botanical garden approved in China [22]. This subsequent institutional development provides context for SHBG’s long-term conservation and monitoring role; the present analyses concern only the 2025 bird inventories at SHBG.
To support sustained monitoring of biodiversity conservation outcomes, the Shanghai Academy of Environmental Sciences and SHBG jointly developed the Shanghai Botanical Garden Integrated Biodiversity Observatory, with guidance and support from the Shanghai Municipal Bureau of Ecology and Environment. According to the observatory’s institutional records, it is Shanghai’s first urban biodiversity monitoring station. Equipment was positioned with reference to biodiversity hotspots within the garden. The observatory integrates automated biological monitoring, real-time measurement of environmental variables, and a data management platform to support long-term observation and public science displays. Its current equipment inventory comprises 102 monitoring units spanning birds, mammals, fish, insects, and environmental variables. These include autonomous acoustic recorders and video systems for birds, underwater video systems for fish, infrared camera traps for mammals, insect monitoring devices, and environmental sensors. The integrated system is designed to support around-the-clock observation, although operational schedules and data availability vary among devices.
The 102 units describe the broader observatory infrastructure rather than the sampling effort analyzed here. The present study focused exclusively on 2025 bird detections obtained from manual transect surveys, autonomous acoustic monitoring, and infrared camera trapping. The location of SHBG and the monitoring stations included in the analysis are shown in Figure 1. The monitoring design and study-specific data coverage are detailed below.
2.2. Monitoring Design and Analytical Scope
Three sources of bird observations were available during 2025: manual fixed-transect surveys, autonomous acoustic monitoring, and infrared camera trapping. Twelve acoustic recorders and 12 infrared camera traps were deployed across the garden. Data from 11 acoustic stations with sufficiently continuous records across the standardized analytical period were included; one acoustic station was excluded because its operational record was too incomplete for the annual inventory analysis.
For the purposes of this study, multi-source automated monitoring was defined as the union of bird species confirmed by autonomous acoustic monitoring and infrared camera trapping after quality control. Fixed bird-video systems were not included in the automated-monitoring species inventory because they were deployed only in selected focal areas and differed substantially from the acoustic and infrared networks in spatial coverage and monitoring purpose. Video records could nevertheless contribute auxiliary visual evidence during the verification of uncertain detections.
The three monitoring approaches differed substantially in temporal coverage, spatial configuration, sampling effort, and detection mechanism. Manual surveys consisted of monthly visual observations along a fixed transect; acoustic devices sampled continuously over several months from fixed stations; and infrared cameras operated throughout most or all of the year at fixed locations. Consequently, the study was not designed to compare absolute detection efficiency, detection probability, or species richness per unit effort among monitoring approaches. Instead, analyses were conducted at the annual species presence-absence level and focused on the overlap and complementarity of the resulting species inventories.

Table 1.
Summary of bird-monitoring approaches used in Shanghai Botanical Garden in 2025.
| Monitoring approach | Monitoring period/frequency | Spatial configuration and effort | Detection and quality-control criteria |
|---|---|---|---|
| Manual fixed-transect survey | January-December 2025; one survey per month; 12 surveys | Fixed transect ~2.5 km; 25 m on each side; ~4 h per survey; 3-4 observers | Visual confirmations only; surveys conducted under rain-free conditions |
| Autonomous acoustic monitoring (Al Knows Nature-2023-v) | 20 May-30 December 2025; 24 h/day continuous operation | 11 stations included; recorders mounted ~3 m above ground; archived bird-call WAV files: mono, 48 kHz, 16-bit PCM; 177-225 effective operating days per station | Confidence score ≥60% for candidate screening; same species within 5 min at a station treated as one independent event; expert review and secondary verification |
| Infrared camera trapping (UOVision UML7) | 1 January-31 December 2025 | 12 cameras; mounted ~0.5 m above ground; 338-359 effective camera-days per unit | Species-level AI classifications with confidence ≥80% manually reviewed; lower-confidence and ambiguous records manually identified; same species within 30 min at a camera treated as one independent event |
The monitoring effort summarized above was used to characterize the design and interpret the limits of cross-method comparisons rather than to standardize detection effort among approaches.
2.3. Manual Visual Bird Surveys
Manual bird surveys were conducted once per month throughout 2025, resulting in 12 surveys covering the entire calendar year. Exact survey dates and weather conditions are provided in Table S1. All surveys were conducted under rain-free conditions, mainly in clear or cloudy weather.
A fixed-transect method was used. The survey route followed the main paths through the garden and had a total length of approximately 2.5 km. Birds occurring within approximately 25 m on either side of the transect were recorded. Each survey started in the morning, lasted approximately 4 h, and was conducted by three to four SHBG staff members experienced in bird identification.
Importantly, only birds that were visually confirmed were included in the manual-survey species inventory used in this study. Vocalizations could assist observers in locating individuals, but records based exclusively on auditory identification without visual confirmation were not included. This protocol differs from conventional point-count protocols that routinely combine visual and auditory detections and should therefore be considered when interpreting differences between manual and acoustic species inventories.
For the present analysis, observations from the 12 monthly surveys were pooled to generate an annual binary species inventory. Individual counts and relative abundance from the manual surveys were not analyzed because abundance information had not been collected in a fully standardized manner across all surveys. The annual pooled inventory was retained in the final monitoring database; however, complete month-resolved species lists were no longer available for October-December 2025. Therefore, month-specific analyses and fully temporally matched comparisons with the acoustic-monitoring period were not conducted.
2.4. Autonomous Acoustic Monitoring
Bird sounds were monitored using Al Knows Nature-2023-v autonomous acoustic units (Al Knows Nature, Beijing, China). Each unit was installed at approximately 3 m above ground and operated continuously for 24 h per day. The hardware uses two front-end microphones (with support for up to four channels) and automatically collects ambient sound and segments intervals containing effective bird vocalizations. According to the manufacturer specifications, the units support front-end white-noise reduction of approximately 15-30 dB, a frequency response of 20 Hz-20 kHz, a signal-to-noise ratio of 70 dB (A-weighted), and microphone sensitivity of at least -20 dB (0 dB = 1 V/Pa at 1 kHz). The hardware supports multiple sampling rates (32, 48, 96, and 192 kHz); the archived bird-call WAV files from the 2025 monitoring dataset were stored as mono audio at 48 kHz with 16-bit PCM encoding. The associated recognition system generated candidate bird identifications together with classification confidence, recording time, and monitoring-station information. The manufacturer-rated acoustic acquisition range is up to approximately 100 m under suitable conditions; this specification was not treated as an ecological detection radius in the present analysis. A versioned identifier for the proprietary recognition model was not retained in the archived operational export; references to the recognition system therefore denote the model deployed by the monitoring platform during 2025 rather than a publicly reproducible classifier release.
Although 12 acoustic devices were deployed in the garden, 11 stations generated data of sufficient continuity for the 2025 analysis. The standardized analytical period extended from 20 May to 30 December 2025. The units operated continuously throughout the day, while the monitoring platform retained automatically segmented intervals containing detected sound signals for subsequent recognition and review. Temporary interruptions associated with maintenance, communication, or equipment operation resulted in variation among stations, with individual stations contributing 177-225 effective monitoring days.
Because effective monitoring duration differed among stations and acoustic detectability can be affected by species vocal behavior and local sound-propagation conditions, raw station-level species richness was not used for inferential comparisons among locations in the main analysis. Instead, all confirmed acoustic detections were pooled to construct the annual acoustic species inventory.
2.5. Acoustic Candidate Screening and Expert Validation
Automated acoustic detections were processed using a multi-stage quality-control procedure consisting of algorithmic screening, independent-event definition, comparison with previously verified records, expert review, secondary identification, and final confirmation.
First, classifications with an algorithmic confidence score of ≥60% were retained as candidate records for further verification. The 60% threshold was used solely as an initial screening criterion and was not interpreted as a probability that the species was truly present. A candidate exceeding this threshold was therefore not automatically accepted as a confirmed species occurrence.
To reduce repeated counts arising from prolonged vocal activity by the same individual, detections of the same species occurring at the same acoustic station within a 5-min interval were combined into a single independent acoustic event.
Candidate species and their associated independent-event records were subsequently compared with previously verified bird records from SHBG. Experienced bird specialists evaluated the plausibility of each candidate species with reference to its known distribution and residency in Shanghai, season of occurrence, monitoring date, local monitoring context, and representative audio segments. Species considered uncertain after this first-stage review, together with the relevant acoustic records, were returned to the technical identification team for secondary assessment. Secondary outcomes were classified as confirmed, revised, or invalid, and the two review stages were integrated to produce the final acoustic species inventory.
Because 2025 represented the initial operational phase of the automated acoustic monitoring system, a conservative criterion was applied to candidate species that had not previously been verified in SHBG. Such candidates were included in the final inventory only when independent supporting evidence was available, such as a visually confirmed manual observation, infrared image, or another independently verifiable record. Candidates lacking independent confirmation were retained for future reassessment but were excluded from the species inventory and statistical analyses reported here.
This procedure was designed primarily to reduce the entry of unverified false-positive classifications into the annual species dataset rather than to estimate classifier sensitivity or specificity. The 2025 operational export did not retain a complete clip-by-clip audit trail of the number of records entering and leaving each validation stage; accordingly, this study reports the validation workflow at the candidate-species and associated-record level and does not estimate clip-level precision, recall, or reviewer throughput.
2.6. Infrared Camera Monitoring
Twelve UML7 infrared-triggered camera traps (UOVision, China) were operated across SHBG during 2025. Cameras were installed approximately 0.5 m above ground. According to the manufacturer specifications, the UML7 uses a 5-MP CMOS sensor, an F1.6 lens with 65°/90° field-of-view options, and a passive infrared (PIR) detector with a nominal detection range of up to 25 m and a trigger response of approximately 0.5 s; the housing is rated to IP68. The nominal monitoring period extended from 1 January to 31 December 2025, although occasional equipment interruptions resulted in 338-359 effective camera-days per unit.
Images were transmitted to a backend identification system for automated classification. When the system assigned an image to a species with a confidence score of ≥80%, the classification was subsequently reviewed by trained personnel before acceptance. Images with lower classification confidence, classifications resolved only to a higher taxonomic level, or otherwise ambiguous outputs were evaluated manually by experienced reviewers. Images from which species identity could not be determined reliably because of poor image quality, small target size, or other limitations were excluded.
To reduce repeated observations of the same animal, consecutive images of the same species from the same camera within a 30-min interval were treated as a single independent camera event. A subsequent detection after more than 30 min was treated as a new independent event.
The present study used camera-trap records only to establish species presence. Independent-event frequency was not compared quantitatively with individual counts from manual surveys or acoustic event frequency. Confirmed bird species from the camera-trap dataset were combined with the confirmed acoustic inventory to construct the multi-source automated-monitoring species set.
2.7. Taxonomic Standardization and Ecological Attributes
Species names and taxonomic assignments were standardized across manual, acoustic, and infrared datasets before analysis. Scientific and English names followed AviList v2025 [23], as implemented in the Shanghai Bird Checklist 2025 [24]. Regional residency status and commonness in Shanghai were obtained from the same checklist, which is updated annually and released by the Bird Records Committee of the Shanghai Wild Bird Society. Because the complete checklist is distributed through a Chinese-language WeChat platform, the exact species-level residency and regional-commonness classifications used in the present analyses are reproduced in Table S2 to ensure reproducibility independently of access to the original download channel.
Residency categories included resident (R), summer visitor (S), winter visitor (W), passage migrant (Mp), and vagrant or wandering migrant (Mv). For descriptive summaries, checklist categories marked with an asterisk because of limited breeding records were retained in the relevant major residency group; thus, W and W* were grouped as winter visitors, and Mp and Mp* as passage migrants. Species with composite or uncertain residency classifications were retained as ‘composite/other’ for descriptive summaries rather than being assigned arbitrarily to a single category.
Regional commonness was classified by the Shanghai checklist as common (c), uncommon (uc), or rare (r). Importantly, ‘regional rarity’ in this study refers specifically to occurrence status within Shanghai and should not be interpreted as global rarity, conservation-threat status, or low abundance within SHBG.
The White-browed Laughingthrush (Pterorhinus sannio), classified as a category-B species in Shanghai but representing an established wild population, was retained in analyses of wild birds. The Black Swan (Cygnus atratus) is classified as an introduced category-F species; although it was recorded during manual surveys, it was excluded from the wild-bird inventory and all cross-method similarity and ecological-attribute analyses.
Following standardization, each wild bird species detected in 2025 was assigned to one of three mutually exclusive detection categories: jointly detected (recorded by both manual surveys and multi-source automated monitoring), manual-only (recorded by manual surveys but not by automated monitoring), or automated-only (recorded by multi-source automated monitoring but not by manual surveys). For analyses comparing jointly detected species with species detected by only one approach, the manual-only and automated-only groups were pooled and termed method-exclusive detections. ‘Method-exclusive’ refers only to the monitoring approaches and observation period examined in this study and does not imply that a species can never be detected by the other method.
2.8. Statistical Analyses
2.8.1. Species-Inventory Complementarity
The annual manual species inventory consisted of all wild bird species recorded during the 12 fixed-transect surveys after exclusion of introduced species. The automated species inventory was defined as the union of quality-controlled acoustic and infrared-camera detections.
Overlap between the two annual species inventories was quantified using the Jaccard similarity index, J = a/(a + b + c), and the Sørensen similarity index, S = 2a/(2a + b + c), where a is the number of species detected by both approaches, b is the number detected only by manual surveys, and c is the number detected only by automated monitoring.
These indices were used exclusively to describe compositional overlap. They were not interpreted as measures of relative survey efficiency because monitoring effort, temporal coverage, spatial coverage, and sensory detection processes differed substantially between approaches.
2.8.2. Ecological Attributes of Method-Exclusive Detections
We evaluated whether species-level residency status and regional rarity were associated with whether a species was jointly detected by manual and automated monitoring or remained method-exclusive. The binary response variable was joint detection (1 = detected by both approaches; 0 = detected by only one approach). Two prespecified predictors were entered simultaneously in a multivariable logistic regression: resident status (1 = R-coded resident in the Shanghai checklist; 0 = any other residency classification) and regional rarity (1 = rare [r]; 0 = common or uncommon [c + uc]). Adjusted odds ratios (aORs), 95% confidence intervals, and two-sided p-values were reported. Because residency and regional commonness may covary, coefficients were interpreted as mutually adjusted associations rather than causal or fully independent ecological effects.
To assess sensitivity to uncertain residency coding, the logistic model was refitted after excluding species with composite, directional, or missing residency codes (W/S, Mp/S, Mp/W, S/W, ↓, and missing values), retaining only R, W/W*, S, Mp/Mp*, and Mv categories. This analysis evaluated whether the principal directions of association were robust to excluding ambiguous residency classifications.
Two additional analyses were treated as exploratory. First, passerine versus non-passerine composition was compared among the jointly detected, manual-only, and automated-only groups using a 3 × 2 Pearson chi-square test. Second, passage migrants (Mp/Mp*) versus all other residency categories were compared among the same three detection groups. Cramér’s V was reported as an effect-size measure for both exploratory chi-square analyses.
All analyses were conducted in Python 3.13.5 using SciPy 1.17.0 and statsmodels 0.14.6. The species-level variables required to reproduce the primary analyses are provided in Supplementary Table S2, and complete model/test output is provided in Supplementary Table S3. Event-level acoustic and camera records and spatially explicit monitoring data are not required to reproduce the analyses reported here and are retained as part of the ongoing long-term biodiversity monitoring program.
3. Results
3.1. Complementarity of Species Detection Between Manual and Multi-Source Automated Monitoring
Manual transect surveys recorded 113 bird species during 2025. After exclusion of the introduced Black Swan (Cygnus atratus), the annual manual inventory comprised 112 wild bird species. Autonomous acoustic monitoring confirmed 98 species after confidence filtering, expert review, and secondary verification, while infrared camera traps confirmed 18 bird species. After merging and deduplicating the acoustic and camera-trap records, the multi-source automated-monitoring inventory contained 101 species. Combining the manual and automated inventories yielded a total of 130 wild bird species recorded in Shanghai Botanical Garden during 2025.
Of these 130 species, 83 were detected by both manual surveys and automated monitoring, whereas 29 species were detected only by manual surveys and 18 species only by automated monitoring (Figure 2). The resulting Jaccard and Sørensen similarity indices were 0.638 and 0.779, respectively. Thus, the two monitoring approaches shared a substantial proportion of the annual species inventory, but 47 species (36.2% of the combined inventory) remained exclusive to one approach.
Infrared camera trapping contributed additional detections within the automated-monitoring system. Of the 18 bird species recorded by infrared cameras, three-Red-billed Starling (Spodiopsar sericeus), White-browed Laughingthrush (Pterorhinus sannio), and Oriental Turtle Dove (Streptopelia orientalis)-were not detected acoustically. Their inclusion increased the automated-monitoring inventory from 98 acoustic species to 101 species. However, all three were also recorded by manual surveys; therefore, infrared cameras increased complementarity among automated data sources but did not increase the number of species classified as automated-only.
Overall, these results show that the two monitoring approaches generated neither redundant nor fully independent inventories. Instead, manual and multi-source automated monitoring captured a large, shared core of species while each retained a distinct set of method-exclusive detections.
3.2. Ecological Attributes of Method-Exclusive Detections
3.2.1. Primary Multivariable Associations
Among the 83 jointly detected species, 27 (32.5%) were R-coded residents, whereas only 2 of 47 method-exclusive species (4.3%) were residents. Regionally rare species showed the opposite pattern: 9 of 83 jointly detected species (10.8%) were classified as rare in Shanghai, compared with 18 of 47 method-exclusive species (38.3%). No R-coded resident species in the 2025 dataset was simultaneously classified as regionally rare.
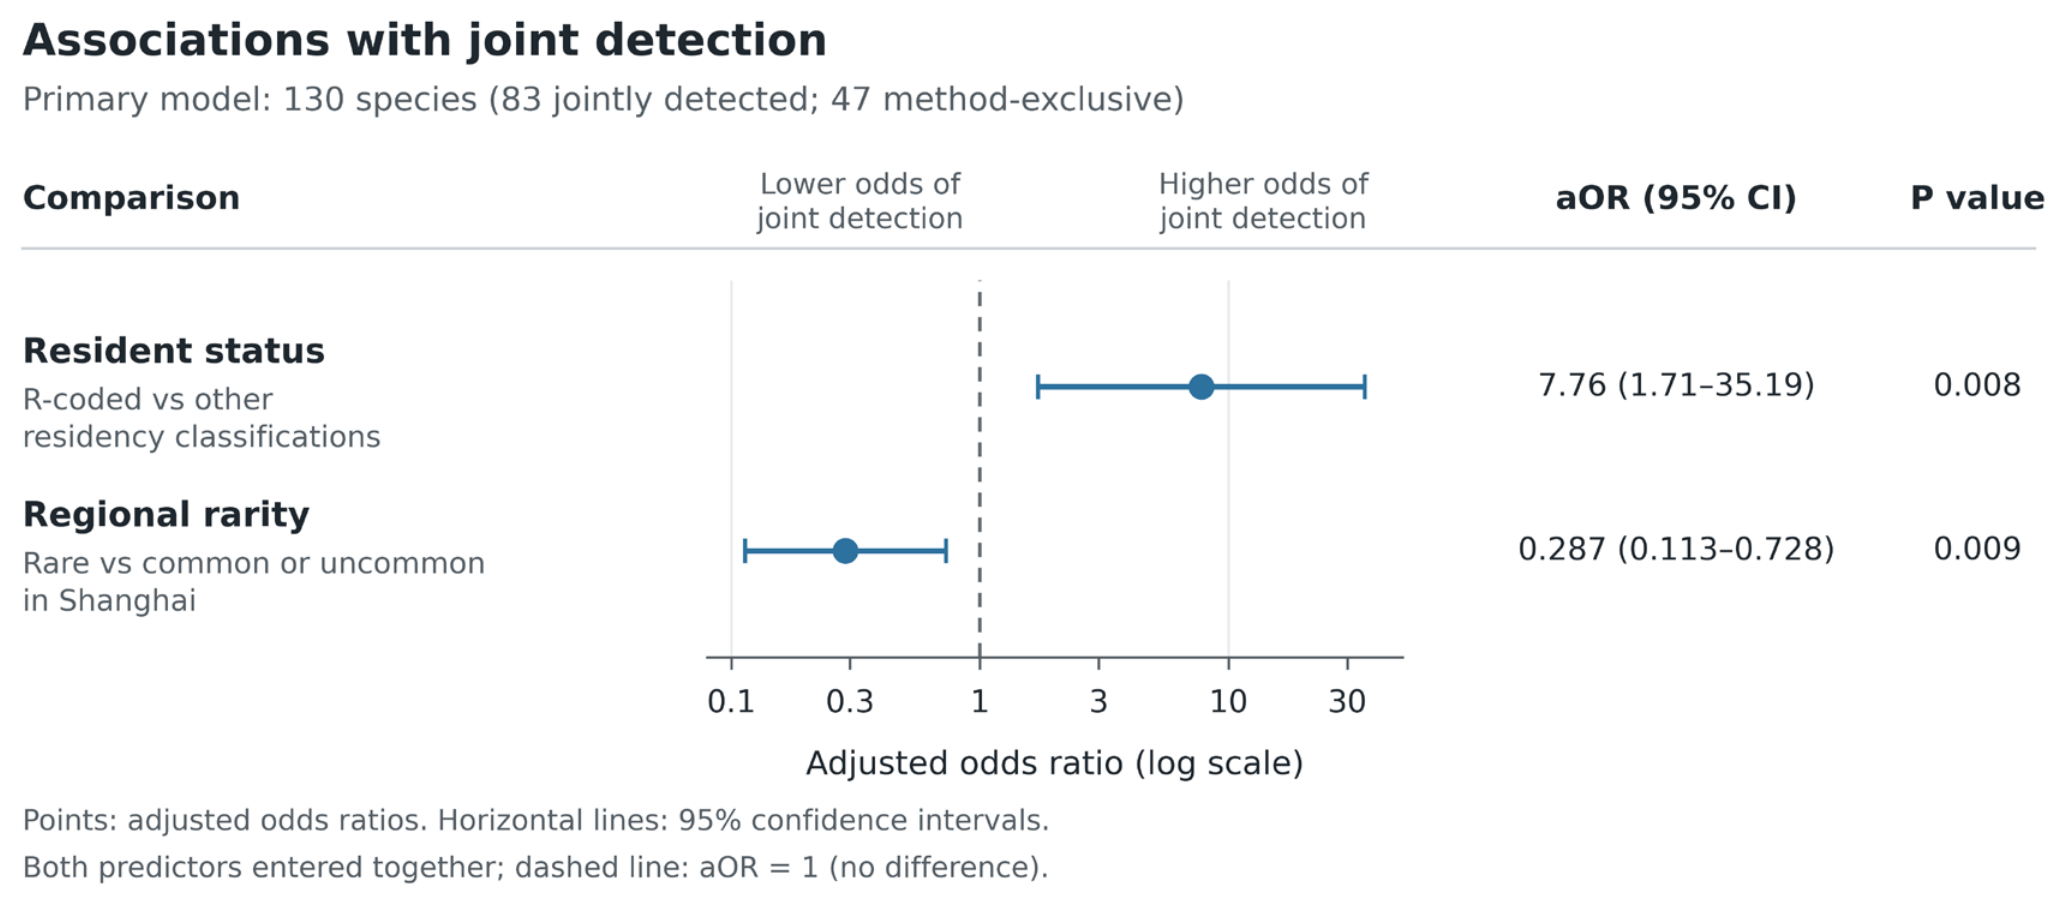
In the multivariable logistic model, resident status was positively associated with joint detection after adjustment for regional rarity (aOR = 7.76, 95% CI = 1.71–35.19, p = 0.008). Regional rarity was negatively associated with joint detection after adjustment for resident status (aOR = 0.287, 95% CI = 0.113–0.728, p = 0.009), equivalent to approximately 3.48-fold higher adjusted odds of being method-exclusive rather than jointly detected for regionally rare species (Figure 3).
The sensitivity model excluded 17 species with composite, directional, or missing residency codes (n = 113 retained). The resident-status association remained strong (aOR = 10.23, 95% CI = 2.22–47.11, p = 0.003). The regional-rarity coefficient remained in the same direction but was attenuated and its 95% confidence interval included the null (aOR = 0.401, 95% CI = 0.153–1.048, p = 0.062). Thus, the association with resident status was robust to residency-code restriction, whereas the regional-rarity association should be interpreted more cautiously.
3.2.2. Exploratory Taxonomic and Migratory Patterns
Exploratory analyses suggested additional, but statistically weaker, differences among detection categories. Passerines accounted for 74.7% of jointly detected species (62 of 83), 48.3% of manual-only species (14 of 29), and 66.7% of automated-only species (12 of 18). The overall 3 × 2 comparison between passerine and non-passerine composition yielded χ2 = 6.871, df = 2, and Cramér’s V = 0.230. The association did not remain significant after Holm correction across the two exploratory tests (adjusted p = 0.064).
The manual-only group nevertheless contained a numerically higher proportion of non-passerines (51.7%) than either the jointly detected or automated-only groups. These detections included several waterbirds, shorebirds, herons, and raptors, suggesting a possible taxonomic difference in the types of species contributed by manual visual surveys. Because the adjusted test did not reach the predefined significance threshold, this pattern was treated as exploratory rather than confirmatory.
Passage migrants also showed a descriptive difference among groups. Passage migrants accounted for 50.0% of automated-only species (9 of 18), compared with 25.3% of jointly detected species (21 of 83) and 27.6% of manual-only species (8 of 29). The overall comparison yielded χ2 = 4.411, df = 2, and Cramér’s V = 0.184, with Holm-adjusted p = 0.110.
Accordingly, the higher proportion of passage migrants among automated-only detections should be regarded as a descriptive tendency rather than statistical evidence of preferential detection of migrants by automated monitoring.
4. Discussion
4.1. Complementarity Reflects Differences in Detection Windows Rather Than Relative Survey Performance
Manual surveys and multi-source automated monitoring produced substantially overlapping but non-identical annual bird inventories in Shanghai Botanical Garden. Of the 130 wild bird species recorded in 2025, 83 were detected by both approaches, whereas 29 were recorded only manually and 18 only by automated monitoring. Thus, although the Sørensen similarity between the two inventories was 0.779, more than one-third of the combined annual inventory was detected by only one of the two approaches.
This pattern is consistent with previous studies showing that human surveys and passive acoustic monitoring often recover overlapping but complementary subsets of bird communities. Comparisons between autonomous recorders and human point counts depend strongly on differences in effective detection range and sampling configuration [7], while broader evaluations of autonomous recording emphasize the influence of survey design and the restricted acoustic availability of some species [10]. Urban studies in China have reached similar conclusions: both the Guangzhou wetland study and the Shanghai Chunshen Park study found substantial overlap but also sizeable method-exclusive components [15,16].
The present study differs from a standardized method-performance comparison because monitoring effort was intentionally not equalized among approaches. Manual surveys covered the full calendar year but consisted of one approximately 4-h survey per month, acoustic monitoring operated continuously at fixed stations from late May to late December, and infrared cameras operated for most of the year. The approaches also relied on different detection cues: the manual inventory required visual confirmation, acoustic monitoring depended on vocal activity and sound propagation, and camera trapping depended on animals entering camera detection zones [25]. Under these circumstances, differences in annual species richness cannot be interpreted as differences in monitoring efficiency. Instead, each method sampled a different combination of temporal, spatial, and sensory detection opportunities.
This distinction is especially important for interpreting the 47 method-exclusive species. A species absent from one annual inventory was not necessarily absent from the garden, nor inherently undetectable by that method. Rather, it was not confirmed within the particular sampling window created by that monitoring protocol. Method-exclusive detections should therefore be understood as conditional outcomes of survey design and species ecology, not as permanent method-specific species.
4.2. Method-Exclusive Detections Were Associated with Residency and Regional Commonness
The strongest result of this study was not the difference in total species numbers, but the association between species attributes and whether detections were shared across monitoring approaches. In the mutually adjusted model, R-coded residents had substantially higher odds of joint detection, whereas species classified as regionally rare in Shanghai had lower odds of joint detection. These associations show that the annual joint-versus-exclusive detection categories were non-uniform with respect to residency and regional commonness under the 2025 monitoring protocols. However, because temporal coverage was unequal among methods, the analysis cannot separate intrinsic species-level detectability from protocol-specific differences in opportunities for detection.
The resident-status association is consistent with the expectation that species available to observers repeatedly across the year have more opportunities to enter more than one inventory. Residents can potentially be encountered during many survey occasions, whereas seasonal visitors and transient migrants occupy shorter temporal windows. Similarly, species occurring infrequently at the regional scale may be more vulnerable to incomplete temporal or spatial sampling. Acoustic survey coverage and recording duration can substantially alter observed richness [9], and multi-species monitoring designs frequently represent common species more consistently than rare species [26]. Bioacoustic and occupancy-based approaches have likewise been used to strengthen monitoring of rare breeding populations [27]. In the present study, these mechanisms remain plausible interpretations rather than directly isolated causal effects.
The two ecological axes should not, however, be interpreted as fully independent mechanisms. No R-coded resident species in the 2025 dataset was simultaneously classified as regionally rare, and the regional-rarity association weakened in the sensitivity analysis that excluded composite, directional, and missing residency codes. By contrast, the resident-status association remained strong. The rarity result should therefore be interpreted as supportive evidence of a non-uniform association with detection category rather than as a fully independent causal effect.
Regional commonness was derived from the Shanghai bird checklist and represents how frequently a species is encountered across the Shanghai region. It is not equivalent to abundance within Shanghai Botanical Garden, global population rarity, or conservation-threat status. Therefore, the present results do not show that globally rare or threatened birds are inherently more likely to be method exclusive. They show that species regarded as less frequently encountered within the regional avifauna were more often unique to one annual monitoring inventory in the full model.
More generally, detectability is linked to species attributes rather than being a purely random observation process. Bird detectability varies with body size, habitat specialization, diet, taxonomic group, singing rate, and acoustic detection distance [17,18]. Although these traits were not measured directly here, they provide plausible mechanisms by which monitoring protocols with different temporal and sensory windows may contribute to non-uniform subsets of method-exclusive detections. Multi-year data will be needed to evaluate these mechanisms directly using richer species traits and explicit detection models.
Taken together, the multivariable and sensitivity analyses shift the interpretation of complementarity away from a simple comparison of species counts. Resident status showed the most robust association with whether species entered both annual inventories, while regional rarity provided additional but less sensitivity-stable evidence that species occurrence characteristics were associated with method-exclusive detection under the 2025 monitoring design.
4.3. Exploratory Patterns Were Consistent with Different Sensory Biases Among Monitoring Approaches
Two additional patterns were apparent but did not remain statistically significant after Holm correction. Non-passerines represented 51.7% of the manual-only group compared with 25.3% of jointly detected species, and passage migrants represented 50.0% of automated-only detections compared with approximately one-quarter of jointly detected and manual-only species.
The first pattern is biologically plausible because the manual survey protocol required visual confirmation. Human observers could use body shape, flight behavior, plumage, position within the habitat, and other visual cues that are unavailable to acoustic classifiers. Some waterbirds and raptors also vocalize relatively infrequently or are more readily detected visually than acoustically [7]. More broadly, species-level detectability is known to vary among taxonomic groups and with traits related to body size, habitat and acoustic availability [17,18]. At the same time, the present pattern should not be generalized to all non-passerines because the adjusted statistical comparison did not reach the predefined significance level.
The higher proportion of passage migrants among automated-only records may reflect the greater temporal continuity of fixed acoustic monitoring. A bird present in the garden for only a short migratory stopover could fall between monthly manual survey dates, whereas continuously operating recorders provide many more temporal opportunities for detection. Long-duration acoustic sampling is known to increase observed richness and improve the chance of encountering infrequently detected species [9,10]. However, the present comparison was not statistically significant after multiple-testing correction, and the acoustic recorders did not cover a complete calendar year. The migrant pattern should therefore be treated as a hypothesis for testing with multi-year data rather than evidence that automated monitoring is inherently superior for migratory birds.
These exploratory findings illustrate why monitoring complementarity cannot be reduced to a single technological advantage. Visual, acoustic, and image-based methods each interact differently with species behavior. Future analyses incorporating traits directly related to detectability, such as vocal activity, body size, vertical stratum, habitat association, and diel activity, may provide a more mechanistic explanation of method-exclusive detections than broad taxonomic categories alone [17,18].
4.4. Multi-Source Monitoring Requires Verification Rather Than Uncritical Automation
A second methodological implication concerns the interpretation of automated detections. Automated monitoring can greatly increase the volume and temporal resolution of biodiversity observations, but algorithmic classifications cannot automatically be treated as confirmed species occurrences. BirdNET and related systems demonstrate the scalability of automated bird-sound recognition [11], yet classifier performance varies among species, regions, recording conditions, and confidence thresholds [12,13,14]. Recent studies further show that false-positive rates can differ markedly among species and that species-specific or context-dependent thresholds can improve precision relative to a single universal threshold [29,30].
For this reason, the acoustic workflow used in the present study treated automated classifications as candidate detections rather than final records. Candidate classifications first passed a confidence threshold, were grouped into independent events, compared with existing verified records, reviewed by experienced personnel, and, when necessary, subjected to secondary identification. Records representing species not previously verified within the garden required additional independent evidence before inclusion. The purpose of this workflow was to prioritize a conservative confirmed annual inventory rather than maximize the number of algorithmic detections. The 60% confidence score was therefore a screening threshold, not a claim of 60% occurrence probability or a universal accuracy threshold.
This logic is consistent with recent recommendations for avian PAM, which emphasize standardized metadata, traceability to original recordings, and the integration of automated classification with manual validation [31]. Global evaluations likewise stress that optimal confidence thresholds vary with species and analytical objectives and that expert validation remains important for reliable ecological interpretation [14]. These considerations are particularly relevant when automated detections are intended to enter long-term biodiversity databases, where a small number of unverified false positives can disproportionately affect species inventories and subsequent ecological analyses.
At the same time, the conservative verification protocol introduced an important asymmetry. Previously unverified acoustic candidates were required to obtain additional supporting evidence, whereas visually confirmed manual records were not subjected to an identical historical-record filter. This approach likely reduced false-positive acoustic records, but it may also have excluded genuine low-frequency or previously undocumented acoustic detections. Consequently, the 18 automated-only species should be viewed as a conservative estimate of automated contribution rather than a complete estimate of all potentially valid species detectable acoustically.
Infrared cameras contributed three species that were absent from the validated acoustic inventory, and all three were also detected manually. Camera trapping therefore did not increase the automated-only category in this dataset, and its contribution should not be overstated in terms of species richness. Its importance in the multi-source framework lies instead in providing an independent image-based detection pathway and opportunities for cross-validation, while remaining subject to its own imperfect-detection and sampling constraints [25].
4.5. Implications for Long-Term Biodiversity Monitoring in Urban Botanical Gardens
Botanical gardens offer several characteristics favorable for long-term urban biodiversity monitoring: relatively stable management boundaries, well-documented vegetation, repeated access to fixed sites, long-term staff involvement, and the possibility of integrating biological monitoring with environmental measurements. A recent global review nevertheless found that botanical gardens and arboreta remain sparsely represented in published long-term environmental monitoring, highlighting substantial unrealized capacity [4].
The results from Shanghai Botanical Garden suggest that a useful long-term strategy is not to replace conventional biodiversity surveys with automated devices, but to assign different monitoring components complementary roles. Periodic field surveys provide visual and behavioral information and retain contextual expert judgement. Autonomous acoustic devices provide temporal continuity and permanent sound records that can be reprocessed as classification algorithms improve. Infrared cameras provide independent visual evidence. Expert review and transparent validation rules then connect these data streams into a defensible species database.
For long-term monitoring, methodological continuity may be more valuable than continually increasing the number of devices. Maintaining fixed monitoring locations, documenting equipment changes, recording effective operating time, standardizing independent-event definitions, and preserving links between classifier outputs and original evidence will make interannual comparisons increasingly informative. Recent recommendations for bird PAM in China similarly emphasize standardized equipment metadata, deployment protocols, processing workflows, links to original recordings, and tiered data-sharing mechanisms [31].
As additional years accumulate, the current species-inventory comparison can develop into more rigorous analyses of occupancy, migration phenology, temporal turnover, and habitat associations. These future analyses require finer-resolution site- and time-specific records than those used in the present annual presence-absence comparison. The current study should therefore be regarded as an initial step toward a longitudinal monitoring framework rather than a complete assessment of avian community dynamics.
4.6. Limitations
Several limitations should be considered. First, manual and automated monitoring differed substantially in survey effort and temporal design. Manual surveys covered the full year but occurred only once per month, whereas acoustic monitoring was continuous but began on 20 May; infrared cameras covered most of the full year but used a different detection mechanism. In addition, although the final annual manual inventory was retained, complete month-resolved species lists were unavailable for October-December 2025. A fully temporally matched sensitivity analysis restricted to the acoustic-monitoring period could therefore not be performed. Annual detection categories may consequently reflect both differences among detection pathways and unequal temporal availability, particularly for seasonal visitors. The observed associations should be interpreted as characteristics of the annual inventories generated by the 2025 monitoring protocols, not as standardized method-specific detection probabilities, causal effects, or intrinsic species preferences for a particular monitoring method.
Second, manual surveys included only visually confirmed birds. Many conventional point-count protocols combine visual and auditory detections, meaning that comparisons with published human-survey-versus-recorder studies are not methodologically exact. The visual-only criterion increased separation between the sensory pathways of the manual and acoustic inventories and may partly explain the exploratory taxonomic differences observed.
Third, the study was based on annual presence-absence. Standardized abundance estimates were unavailable across all monitoring approaches, and no formal correction for species-specific detection probability was performed. Nondetection can therefore reflect imperfect detectability rather than true absence [8,28], and the present analysis cannot determine whether method-exclusive detections resulted from differences in local abundance, behavior, temporal occupancy, sampling effort, or detection probability.
Fourth, ecological attributes were derived from regional classifications. ‘Rare’ described commonness across Shanghai rather than within the botanical garden, and residency status represented regional migratory classification rather than demonstrated year-round occupancy of the study site. Residency and regional commonness were included simultaneously in the primary logistic model, but they may still represent correlated ecological processes that cannot be fully separated with a single-year species-level dataset. The sensitivity analysis further showed that the resident association was robust to exclusion of ambiguous residency codes, whereas the regional-rarity association was attenuated. The rarity result should therefore be interpreted more cautiously and re-evaluated with larger multi-year datasets and additional species-level covariates.
Finally, the conservative validation rule for previously unverified acoustic candidates was stricter than the inclusion criterion applied to manual visual observations. This asymmetry reduced the risk of false-positive automated records but may have biased the automated inventory downward for rare or newly occurring species. In addition, the 2025 operational export did not preserve a complete clip-level audit trail through each review stage, preventing retrospective estimation of clip-level validation rates. Because automated classifier performance and optimal thresholds vary among species and regions [14,29,30], future monitoring should preserve stage-specific audit counts and independently validated samples for estimating false-positive and false-negative rates.
5. Conclusions
This study shows that complementarity between manual visual surveys and automated bird monitoring extends beyond differences in annual species richness. Among 130 wild bird species recorded in Shanghai Botanical Garden during 2025, 83 were detected by both approaches, 29 only manually, and 18 only through automated monitoring. In a mutually adjusted species-level model, R-coded resident status was strongly associated with joint detection, whereas regional rarity was associated with lower odds of joint detection in the full dataset. The resident association remained robust when ambiguous residency codes were excluded, while the rarity association was attenuated, indicating that the latter should be interpreted more cautiously.
Because the monitoring approaches differed in effort, temporal coverage, spatial deployment, and detection cues, these findings characterize complementarity under the 2025 monitoring protocols rather than absolute method efficiency. Long-term biodiversity monitoring in urban botanical gardens can benefit from combining periodic expert visual surveys, continuous autonomous acoustic monitoring, image-based evidence, and transparent multi-stage validation. Future multi-year monitoring with harmonized temporal documentation, explicit detection models, and environmental covariates will be needed to test the generality and mechanisms of the species-level associations identified here.
Supplementary Materials
The following supporting information can be downloaded at the website of this paper posted on Preprints.org, Table S1: Dates and weather conditions for the 12 manual visual bird surveys conducted in 2025; Table S2: Minimum reproducible species-level dataset for the 130 wild bird species, including annual detection status by manual survey, autonomous acoustic monitoring, and infrared camera trapping, detection category, residency status, regional commonness, and taxonomic order; Table S3: Coefficients, standard errors, adjusted odds ratios, confidence intervals, p-values, exploratory chi-square tests, and inventory similarity metrics; File S1: Analysis code used to reproduce the principal statistics; requirements.txt: Python package dependencies for File S1.
Author Contributions
Conceptualization, W.Y.; methodology, J.G.; investigation, J.G.; writing-original draft preparation, J.G.; writing-review and editing, Y.Z.; formal analysis, J.G.; visualization, Y.Z.; supervision, W.Y.; project administration, W.Y. All authors have read and agreed to the published version of the manuscript.
Funding
This research was funded by the Shanghai Municipality Science and Technology Commission, grant number 23DZ1204601, and the Shanghai Landscaping & City Appearance Administrative Bureau, grant numbers G240304 and B260302.
Institutional Review Board Statement
Not applicable. The study involved non-invasive visual observation, passive acoustic monitoring, and infrared camera trapping of free-ranging wild birds. No animals were captured, handled, marked, or experimentally manipulated.
Informed Consent Statement
Not applicable.
Data Availability Statement
The minimum dataset required to reproduce the central analyses is provided in Supplementary Table S2 and will be publicly available with the article. It includes species-level annual detection status by manual surveys, autonomous acoustic monitoring, and infrared camera trapping, detection category, residency status, regional commonness, and taxonomic attributes. Analysis code and its package dependencies are supplied as File S1 and requirements.txt. Event-level acoustic and camera-trap records, exact monitoring coordinates, and other site-by-time data are part of an ongoing long-term biodiversity monitoring program and are not publicly released at this stage because they are being curated for subsequent multi-year integrative analyses. Plant, environmental, soil, and soil microbial datasets associated with the broader monitoring program are likewise not part of the present article and are not released here. Reasonable requests for access to additional data may be directed to the corresponding author.
Acknowledgments
We thank the staff and bird-monitoring team of Shanghai Botanical Garden and the technical personnel involved in equipment operation, acoustic review, image verification, and data management.
Declaration of Generative AI and AI-Assisted Technologies in the Manuscript Preparation Process
During the preparation of this manuscript, the authors used ChatGPT (OpenAI) to assist with manuscript structuring, language refinement, reference-format checking, and development of analysis code. The authors reviewed and edited all outputs, independently verified the references and statistical results against the underlying species-level dataset and take full responsibility for the content of this publication. Generative AI was not used to generate, classify, or validate bird observations or to create raw monitoring data. Figure 2 and Figure 3 were generated from the study data using scripted statistical graphics. The locator panels in Figure 1 use official standard maps with editable schematic location overlays.
Conflicts of Interest
The authors declare no conflict of interest. The funders had no role in the design of the study; in the collection, analyses, or interpretation of data; in the writing of the manuscript; or in the decision to publish the results.
References
- Aronson, M.F.J.; La Sorte, F.A.; Nilon, C.H.; Katti, M.; Goddard, M.A.; Lepczyk, C.A.; Warren, P.S.; Williams, N.S.G.; Cilliers, S.; Clarkson, B.; et al. A global analysis of the impacts of urbanization on bird and plant diversity reveals key anthropogenic drivers. Proc. R. Soc. B 2014, 281, 20133330. [Google Scholar] [CrossRef]
- Hughes, A.C.; Orr, M.C.; Lei, F.; Yang, Q.; Qiao, H. Understanding drivers of global urban bird diversity. Glob. Environ. Change 2022, 76, 102588. [Google Scholar] [CrossRef]
- Marzluff, J.M. A decadal review of urban ornithology and a prospectus for the future. Ibis 2017, 159, 1–13. [Google Scholar] [CrossRef]
- Yajima, M.; Murray, M.; McElwain, J. A framework for long-term environmental monitoring using living plant collections in botanic gardens: A global review and case study from Trinity College Botanic Garden. Plants People Planet 2025, 7, 954–968. [Google Scholar] [CrossRef]
- Shonfield, J.; Bayne, E.M. Autonomous recording units in avian ecological research: Current use and future applications. Avian Conserv. Ecol. 2017, 12, 14. [Google Scholar] [CrossRef]
- Gibb, R.; Browning, E.; Glover-Kapfer, P.; Jones, K.E. Emerging opportunities and challenges for passive acoustics in ecological assessment and monitoring. Methods Ecol. Evol. 2019, 10, 169–185. [Google Scholar] [CrossRef]
- Darras, K.; Batáry, P.; Furnas, B.J.; Celis-Murillo, A.; Van Wilgenburg, S.L.; Mulyani, Y.A.; Tscharntke, T. Comparing the sampling performance of sound recorders versus point counts in bird surveys: A meta-analysis. J. Appl. Ecol. 2018, 55, 2575–2586. [Google Scholar] [CrossRef]
- Kéry, M.; Schmidt, B.R. Imperfect detection and its consequences for monitoring for conservation. Community Ecol. 2008, 9, 207–216. [Google Scholar] [CrossRef]
- Wood, C.M.; Kahl, S.; Chaon, P.; Peery, M.Z.; Klinck, H. Survey coverage, recording duration and community composition affect observed species richness in passive acoustic surveys. Methods Ecol. Evol. 2021, 12, 885–896. [Google Scholar] [CrossRef]
- Darras, K.; Batáry, P.; Furnas, B.J.; Grass, I.; Mulyani, Y.A.; Tscharntke, T. Autonomous sound recording outperforms human observation for sampling birds: A systematic map and user guide. Ecol. Appl. 2019, 29, e01954. [Google Scholar] [CrossRef]
- Kahl, S.; Wood, C.M.; Eibl, M.; Klinck, H. BirdNET: A deep learning solution for avian diversity monitoring. Ecol. Inform. 2021, 61, 101236. [Google Scholar] [CrossRef]
- Pérez-Granados, C. BirdNET: Applications, performance, pitfalls and future opportunities. Ibis 2023, 165, 1068–1075. [Google Scholar] [CrossRef]
- Cole, J.S.; Michel, N.L.; Emerson, S.A.; Siegel, R.B. Automated bird sound classifications of long-duration recordings produce occupancy model outputs similar to manually annotated data. Ornithol. Appl. 2022, 124, duac003. [Google Scholar] [CrossRef]
- Funosas, D.; Sebastián-González, E.; Morant, J.; Marín Gómez, O.H.; Mendoza, I.; Mohedano-Muñoz, M.A.; Santamaría, E.; Bastianelli, G.; Márquez-Rodríguez, A.; Budka, M.; et al. A global assessment of BirdNET performance: Differences among continents, biomes, and species. Ecol. Indic. 2026, 182, 114550. [Google Scholar] [CrossRef]
- Bai, H.; Yu, S.; Pan, X.; Ling, J.; Wu, J.; Xie, K.; Liu, Y.; Chen, X. AI-assisted recognition for passive acoustic monitoring of birds in urban wetland parks. Biodivers. Sci. 2024, 32, 24188. [Google Scholar] [CrossRef]
- Tan, J.; Zhu, D.; Wang, Q.; Wang, M. Application of passive acoustic technology in monitoring bird diversity in urban park green space: A case study of Chunshen Park in Minhang District, Shanghai. Biodivers. Sci. 2024, 32, 24262. [Google Scholar] [CrossRef]
- Johnston, A.; Newson, S.E.; Risely, K.; Musgrove, A.J.; Massimino, D.; Baillie, S.R.; Pearce-Higgins, J.W. Species traits explain variation in detectability of UK birds. Bird. Study 2014, 61, 340–350. [Google Scholar] [CrossRef]
- Sólymos, P.; Matsuoka, S.M.; Stralberg, D.; Barker, N.K.S.; Bayne, E.M. Phylogeny and species traits predict bird detectability. Ecography 2018, 41, 1595–1603. [Google Scholar] [CrossRef]
- Shanghai Botanical Garden. Shanghai Botanical Garden. Available online: https://english.shanghai.gov.cn/en-Parks/20231220/bfe6a47b21c74edd96d6aa6e547be48c.html (accessed on 4 September 2026).
- Zhang, T.; Yan, W.; Guo, J. How Can an Urban Botanical Garden in a Densely Built-Up Landscape Develop Sustainably with Urban Renewal?—The Case of Shanghai Botanical Garden. J. Zool. Bot. Gard. 2024, 5, 719–732. [Google Scholar] [CrossRef]
- State Council of the People’s Republic of China. Approval of the Establishment of Shanghai Chenshan National Botanical Garden in Shanghai; Guo Han [2026] No. 58. 2026. Available online: https://www.gov.cn/zhengce/content/202607/content_7074090.htm (accessed on 17 September 2026). (In Chinese)
- Shen, B. Chenshan National Botanical Garden: What Does National Status Mean? The Paper. 3 July 2026. Available online: https://www.thepaper.cn/newsDetail_forward_33509254 (accessed on 17 September 2026). (In Chinese)
- AviList Core Team. AviList: The Global Avian Checklist, v2025. 2025. [CrossRef]
- Bird Records Committee of the Shanghai Wild Bird Society. Shanghai Bird Checklist 2025. 2025. Available online: https://mp.weixin.qq.com/s/WgdZI_dYdvKSoM5mvA1y5A (accessed on 6 September 2026). (In Chinese)
- Burton, A.C.; Neilson, E.; Moreira, D.; Ladle, A.; Steenweg, R.; Fisher, J.T.; Bayne, E.; Boutin, S. Wildlife camera trapping: A review and recommendations for linking surveys to ecological processes. J. Appl. Ecol. 2015, 52, 675–685. [Google Scholar] [CrossRef]
- Sanderlin, J.S.; Block, W.M.; Ganey, J.L. Optimizing study design for multi-species avian monitoring programmes. J. Appl. Ecol. 2014, 51, 860–870. [Google Scholar] [CrossRef]
- Abrahams, C.; Geary, M. Combining bioacoustics and occupancy modelling for improved monitoring of rare breeding bird populations. Ecol. Indic. 2020, 112, 106131. [Google Scholar] [CrossRef]
- MacKenzie, D.I.; Nichols, J.D.; Lachman, G.B.; Droege, S.; Royle, J.A.; Langtimm, C.A. Estimating site occupancy rates when detection probabilities are less than one. Ecology 2002, 83, 2248–2255. [Google Scholar] [CrossRef]
- Singer, D.; Hagge, J.; Kamp, J.; Hondong, H.; Schuldt, A. Aggregated time-series features boost species-specific differentiation of true and false positives in passive acoustic monitoring of bird assemblages. Remote Sens. Ecol. Conserv. 2024, 10, 517–530. [Google Scholar] [CrossRef]
- Scanferla, J.; Brambilla, M.; Brambilla, G.; Hilpold, A.; Marchetti, A.E.; Puff, F.; Tappeiner, U.; Anderle, M. Determining species-specific thresholds to improve precision in passive acoustic monitoring. Ecol. Inform. 2025, 91, 103423. [Google Scholar] [CrossRef]
- Hao, Z.; Shen, X.; Si, X.; Zhao, Y.; Wei, C.; Wu, F.; Xu, X.; Que, P.; Dong, L.; Hua, F.; Zhang, L.; Zhang, C.; Liu, Y. Standards and recommendations for passive acoustic monitoring of birds in China. Biodivers. Sci. 2026, 34, 25474. [Google Scholar] [CrossRef]
Figure 1.
Location of Shanghai Botanical Garden (SHBG) and automated bird-monitoring stations used in the 2025 analysis. (a) Shanghai in China; (b) SHBG in Shanghai Municipality; (c) stations within SHBG. Stations 01–11 are acoustic stations with co-located infrared cameras; R12 is the additional infrared-camera station. Panels (a) and (b) use Ministry of Natural Resources standard maps: China Map, 1:42,000,000, GS (2019)1656, and China Provincial Map—Shanghai Municipality, 1:1,000,000, GS (2017)1268, respectively. Both maps are reproduced in full of approval numbers retained; the Shanghai and SHBG symbols are schematic overlays. The SHBG guide map in (c) is reproduced with institutional authorization. Station positions and the dashed boundary are schematic.
Figure 1.
Location of Shanghai Botanical Garden (SHBG) and automated bird-monitoring stations used in the 2025 analysis. (a) Shanghai in China; (b) SHBG in Shanghai Municipality; (c) stations within SHBG. Stations 01–11 are acoustic stations with co-located infrared cameras; R12 is the additional infrared-camera station. Panels (a) and (b) use Ministry of Natural Resources standard maps: China Map, 1:42,000,000, GS (2019)1656, and China Provincial Map—Shanghai Municipality, 1:1,000,000, GS (2017)1268, respectively. Both maps are reproduced in full of approval numbers retained; the Shanghai and SHBG symbols are schematic overlays. The SHBG guide map in (c) is reproduced with institutional authorization. Station positions and the dashed boundary are schematic.
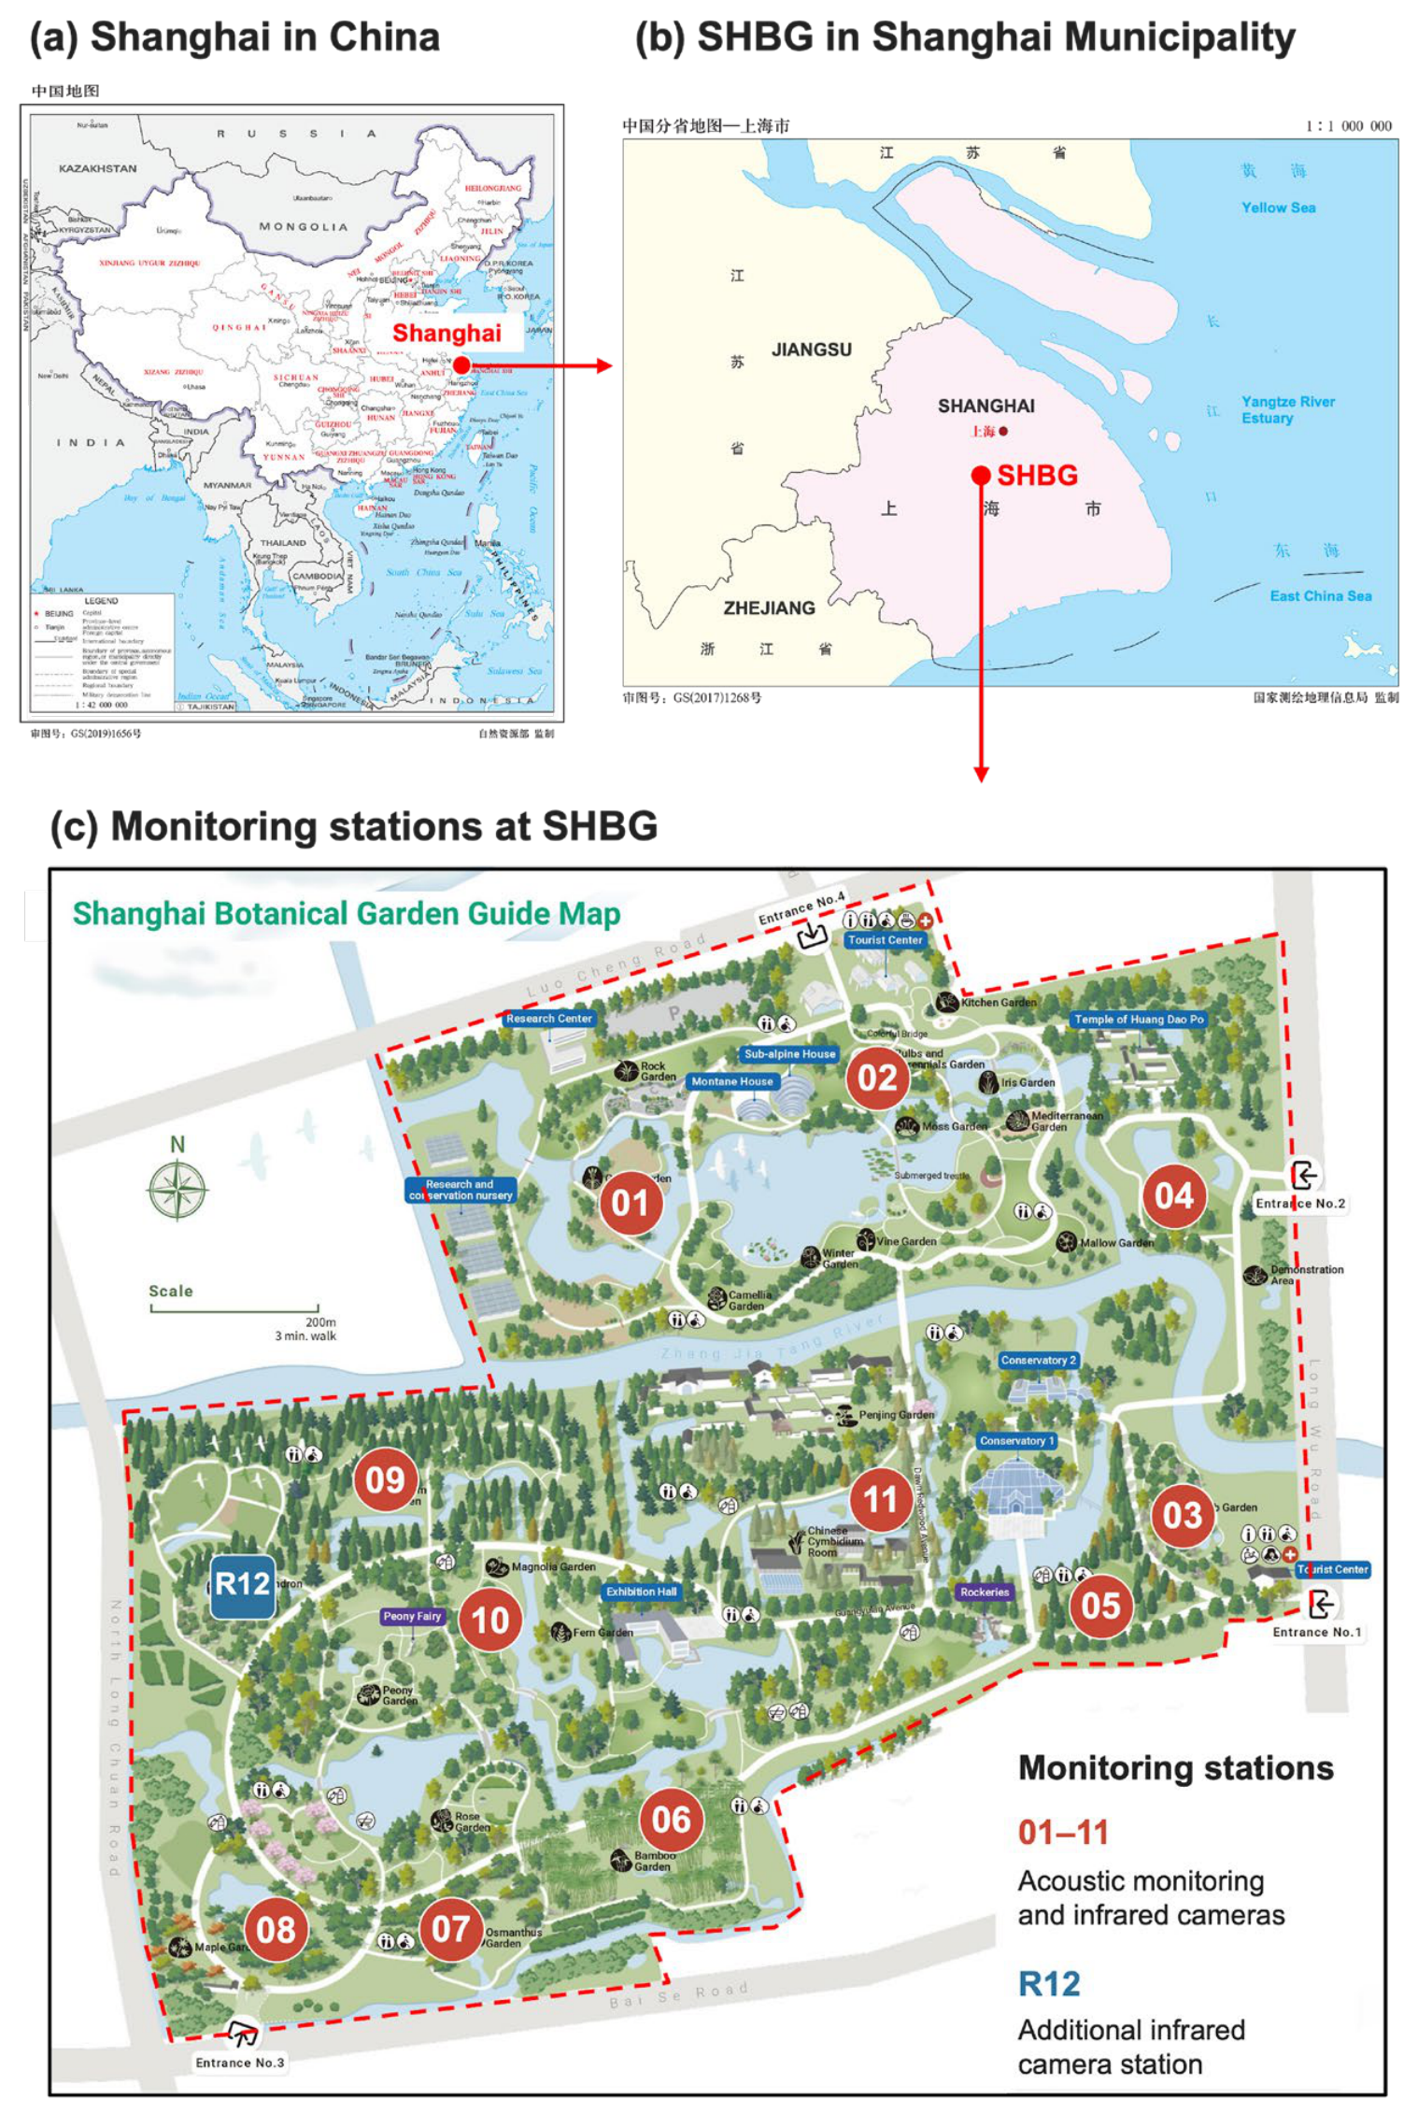
Figure 2.
Complementarity of annual bird species detection between manual surveys and multi-source automated monitoring. The automated inventory represents the union of quality-controlled autonomous acoustic and infrared-camera detections.
Figure 2.
Complementarity of annual bird species detection between manual surveys and multi-source automated monitoring. The automated inventory represents the union of quality-controlled autonomous acoustic and infrared-camera detections.
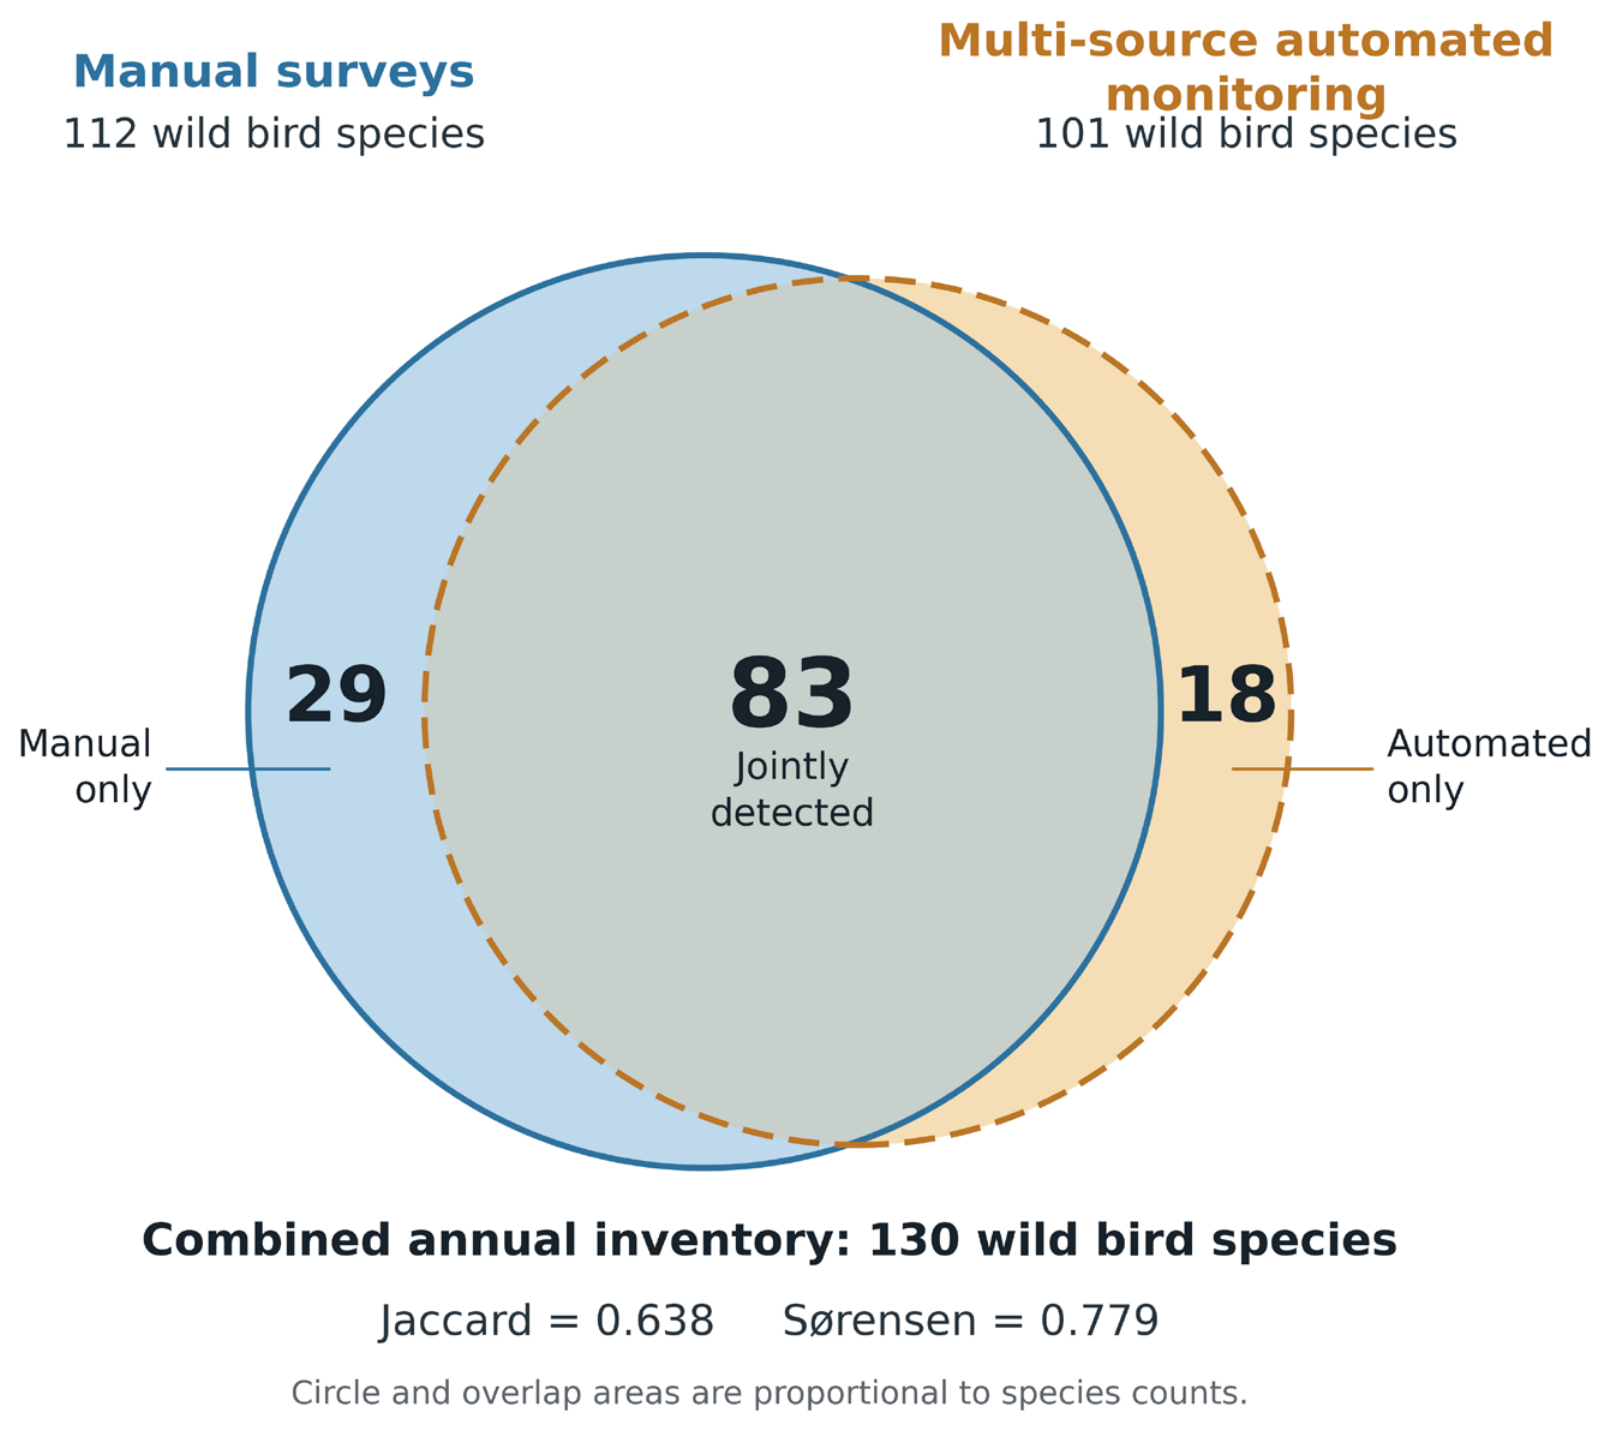
Figure 3.
Adjusted associations of resident status and regional rarity with joint detection. Odds ratios are from a multivariable logistic regression in which the response was joint detection (1) versus method-exclusive detection (0), and both predictors were entered simultaneously. Values >1 indicate higher odds of joint detection; values <1 indicate higher odds of method-exclusive detection.
Figure 3.
Adjusted associations of resident status and regional rarity with joint detection. Odds ratios are from a multivariable logistic regression in which the response was joint detection (1) versus method-exclusive detection (0), and both predictors were entered simultaneously. Values >1 indicate higher odds of joint detection; values <1 indicate higher odds of method-exclusive detection.
Disclaimer/Publisher’s Note: The statements, opinions and data contained in all publications are solely those of the individual author(s) and contributor(s) and not of MDPI and/or the editor(s). MDPI and/or the editor(s) disclaim responsibility for any injury to people or property resulting from any ideas, methods, instructions or products referred to in the content. |
© 2026 by the authors. Licensee MDPI, Basel, Switzerland. This article is an open access article distributed under the terms and conditions of the Creative Commons Attribution (CC BY) license.
Copyright: This open access article is published under a Creative Commons CC BY 4.0 license, which permit the free download, distribution, and reuse, provided that the author and preprint are cited in any reuse.