
Submitted:
21 September 2026
Posted:
22 September 2026
You are already at the latest version
Abstract
Green hydrogen produced via water electrolysis using renewable energy is central to the energy transition, but high production costs remain a major barrier. Solar photovoltaic (PV) and wind farms are dominant renewable sources, yet each has drawbacks: PV is inexpensive but limited in operating hours, while wind is costlier but offers steadier output. This paper introduces the Combined Hydrogen and Power (CHyP) concept, a co-production configuration in which hydrogen and electricity are treated as primary products for an industrial off-taker within a hydrogen hub. The electrolyzer is sized from the generation duration curve to maximize annual hydrogen output and is operated at nominal load to limit failures and maintenance. The resulting surplus electricity is sold to a nearby end user, integrating electricity revenues as a cost offset in the LCOH. Simulations of 500 MW hybrid wind–photovoltaic plants across Spain identify an optimal wind share of 27%. Assuming a surplus electricity price of 60 €/MWh, minimum LCOH values range from 1.68 to 4.40 €/kg, with values below 2 €/kg in selected locations.
Keywords:
co-production of hydrogen and power
; green hydrogen
; LCOH
; hybrid renewable energy systems
1. Introduction
1.1. Green Hydrogen and Techno-Economic Challenges
Achieving climate neutrality by 2050 requires deep decarbonization of emission-intensive sectors where direct electrification is technically or economically challenging. Global hydrogen demand reached almost 100 Mt in 2024, with production still dominated by unabated fossil fuels and low-carbon hydrogen accounting for less than 1% of the total [1,2]. Green hydrogen produced via water electrolysis powered by renewable energy sources (RES) is therefore increasingly viewed as a key energy carrier for decarbonizing hard-to-abate sectors such as heavy transport, steelmaking, aviation, and chemicals because of its relatively high energy density and versatility [3,4,5,6]. System-level assessments indicate that, in ambitious mitigation scenarios, hydrogen could supply up to roughly 20–25% of global final energy demand by mid-century and enable cumulative CO2 abatement on the order of several tens of gigatons when produced and used in low-carbon pathways [2,6]. These figures are strongly scenario and region dependent, but they illustrate the potential strategic role of hydrogen in deep decarbonization.
The European Union has positioned itself as a frontrunner in this transition. The 2020 Hydrogen Strategy targets 40 GW of renewable electrolysis capacity by 2030 and promotes “hydrogen valleys”, integrated regional ecosystems for hydrogen production, storage, transport, and use, as flagship instruments to develop hydrogen hubs around industrial clusters [4,7]. In this paper, the term “hydrogen hub” is used in a broad sense to denote spatial clusters where hydrogen production, infrastructure, and demand (often co-located with power and heat networks) are integrated; these may include projects formally labeled as “hydrogen valleys” as well as other industrial clusters with substantial hydrogen and electricity demand. Such initiatives aim to reduce dependence on imported fossil gas, enhance energy security, and strengthen Europe’s position in clean-technology value chains.
Despite this momentum, green hydrogen remains considerably more expensive than fossil-based alternatives under current market conditions. The International Energy Agency (IEA) [2] reports that the cost gap between low-carbon hydrogen and unabated fossil-based production remains a key barrier, currently exacerbated by lower natural gas prices and increased electrolyzer costs outside China. However, this gap is expected to narrow by 2030; in the IEA’s Stated Policies Scenario (STEPS), renewable hydrogen production costs could fall to under 2 USD/kg in China and to a range of 3–4 USD/kg in other regions with abundant renewable resources and low cost of capital [2]. Recent techno-economic syntheses focused on policy-active regions (EU, US, Asia-Pacific) report green hydrogen production costs typically in the range of about 3.5–6 USD/kg under favorable conditions [8]. Detailed case studies of optimally sited hybrid photovoltaic (PV)–wind (WF)–electrolyzer plants in California and northern Germany, Brazil, Egypt, and Australia report levelized costs of hydrogen (LCOH) between roughly 2 and 6 €/kg depending on resource quality, financing conditions, and plant configuration [9,10,11,12,13,14]. These examples underscore both the progress achieved and the wide dispersion of LCOH as a function of site-specific and market parameters. They should therefore be interpreted as location- and scenario-specific rather than as globally representative cost benchmarks.
Techno-economic assessments consistently highlight electricity price, electrolyzer investment cost, and annual operating hours as dominant drivers of LCOH, together with site-specific factors such as renewable resource quality, grid and infrastructure availability, and proximity to large offtakers [1,6,15,16]. According to [17], the weighted-average levelized cost of electricity (LCOE) from newly commissioned utility-scale solar PV and onshore wind projects in 2023 lies in the range of a few tens of USD/MWh, with best-in-class projects in resource-rich regions achieving values below about 30 USD/MWh. Such low renewable generation costs are a necessary but not sufficient condition for competitive green hydrogen: even with cheap electricity, high electrolyzer capital expenditures (CAPEX), limited utilization, and additional balance-of-plant costs can keep LCOH well above fossil benchmarks [2,8,15,18]. For the Iberian region, the Iberian Renewable Hydrogen Index (IBHYX) [19] provides a market-based benchmark for renewable hydrogen prices that can be used to assess the competitiveness of specific production schemes. Overall, these considerations motivate plant concepts that simultaneously increase electrolyzer utilization and unlock additional value streams in order to close the remaining cost gap.
1.2. Electrolysis Technologies and Operational Constraints
Alkaline water electrolysis (AEL), proton exchange membrane (PEM) electrolysis, and solid-oxide (SOEC) electrolysis are the most mature pathway for green hydrogen production. AEL and PEM technologies have reached a technology readiness level (TRL) of 9 and are commercially available for large-scale applications [20,21]. AEL offers comparatively low specific investment costs by relying on non-precious catalysts, but exhibits limited part-load flexibility and slower dynamic response, which may be problematic when following highly intermittent renewable profiles [20,21]. PEM electrolyzers can operate at high current densities and respond rapidly to variable power inputs, making them well suited for direct coupling with PV and wind farms (WF), albeit at higher CAPEX due to the use of platinum-group metals and titanium [20,21]. High-temperature SOEC can achieve high electrical efficiency when waste heat is available, but still lags behind AEL and PEM in terms of commercial maturity and long-term durability [21].
Beyond technology choice, operating strategies have a material impact on performance and lifecycle cost. Recent degradation studies on PEM water electrolysis show that frequent load cycling and operation at very high current densities can noticeably increase voltage decay rates and shorten stack lifetimes compared with smoother operating profiles [22,23]. Complementary experimental work on AEL reveals that strongly variable operation accelerates catalyst degradation, whereas steady-state conditions preserve catalyst integrity over longer periods [24]. Optimization-based analyses that couple degradation models with replacement strategies further demonstrate that aggressive flexible operation can increase operating expenditures through more frequent stack refurbishments [25]. Recent reviews of PEM electrolyzer degradation mechanisms and modeling frameworks likewise stress that operating profiles, start-stop cycles, and power allocation strategies should be explicitly represented when assessing lifetime costs and optimal plant operation [23,24,25,26].
Taken together, this evidence suggests that operational strategies ensuring high but relatively stable loading are desirable from a techno-economic standpoint, particularly for large plants directly coupled to variable RES. At the same time, many techno-economic studies, including the present work, still represent degradation via average rates and lifetime assumptions rather than through fully dynamic degradation models. This limitation should be kept in mind when comparing results with more detailed degradation-driven optimization frameworks [23,24,25,26]. This provides a strong motivation for concepts such as the Combined Hydrogen and Power (CHyP) configuration considered here, where the electrolyzer is intentionally operated at (or near) nominal load and short-term flexibility is provided primarily by adjusting the electricity exported to external off-takers.
1.3. Hybrid Renewable Supply and Renewable-to-Hydrogen System Design
Dedicated RES-to-hydrogen plants face a well-known design trade-off: electrolyzers are capital-intensive assets that require high annual operating hours to achieve low LCOH, while stand-alone PV plants typically provide capacity factors corresponding to roughly 1,500 equivalent full-load hours per year in most climates [17,27]. This falls significantly short of the several-thousand-hour utilization levels typically sought to amortize electrolyzer CAPEX [28], leaving the electrolyzer idle for long periods if it is sized to match PV peak power [28,29,30]. A common response is to oversize renewable capacity relative to the electrolyzer, thus increasing the number of hours in which electrolyzer demand can be met but inevitably generating substantial electricity surpluses during peak production [2,28]. If these surpluses are curtailed or remunerated at low tariffs, the effective cost of the electricity actually used for hydrogen production rises, partly offsetting the expected cost reduction [13].
Hybrid PV–wind configurations are increasingly recognized as a baseline strategy to mitigate these issues [9,31]. Because of the partial temporal complementarity of solar and wind resources, hybrid plants can smooth the net power profile, enhance electrolyzer utilization, and reduce the need for short-term battery storage [9,10,11,12,13,32,33,34,35,36,37]. Techno-economic assessments of hybrid PV–WF–electrolyzer systems consistently identify the renewable LCOE, electrolyzer full-load hours, and the sizing ratio between renewable capacity and electrolyzer power as the main drivers of LCOH [2,9,10,11,12,13,32,33,36,38]. In many of these studies, short-term batteries are considered an additional degree of freedom; however, oversized storage tends not to be cost-effective unless hydrogen prices are very high or solar resources are extremely intermittent [34,35].
Practical case studies in Germany, California, Brazil, Egypt, and Australia further illustrate how regional differences in solar and wind resources, project CAPEX, and market conditions lead to a wide spread in LCOH values even for qualitatively similar hybrid layouts [10,11,12,13,14]. Locations that combine high-quality renewable resources with large industrial offtake and supportive regulatory frameworks can approach the lower end of the currently reported LCOH range, whereas projects in less favorable contexts remain far from cost parity with fossil-based hydrogen. Most of these studies treat electricity prices as exogenous (either fixed or given by generic time series), with hydrogen usually modeled as the primary product and electricity as an input cost or a secondary export option.
1.4. Co-Production, Polygeneration and Multi-Product Configurations
Beyond pure RES-to-hydrogen schemes, various co-production and polygeneration architectures seek to improve project economics by valorizing multiple energy outputs. In this work, the term “co-production” is used when electricity and hydrogen are the two main products of a system, and “polygeneration” when additional products such as heat, water, or hydrogen-derived chemicals are also supplied. Although part of the literature refers to the former as cogeneration [40,46,48,59], that term is here reserved for its conventional meaning, namely the combined production of power and useful heat, which is not the case in the present work: no heat is recovered, and the renewable output is allocated between two marketable products.
At the plant scale, several analyses of WF–PV–electrolyzer–battery (WPEB) systems show that allocating a fraction of renewable power to hydrogen production can reduce curtailment and enhance financial metrics such as net present value and payback period, provided that hydrogen prices remain sufficiently high in the analyzed scenarios [36]. Scenario-based techno-economic assessments of large wind farms with flexible allocation of power between the grid and electrolyzers demonstrate that co-producing hydrogen and electricity can be attractive when electricity prices are low and hydrogen prices are high, although electricity and hydrogen tariffs are typically treated as exogenous and simplified [39]. At the distribution and micro-grid level, hybrid systems combining PV, WF, diesel backup, batteries, and electrolysis co-produce electricity and green hydrogen while optimizing techno-economic and environmental performance through multi-criteria decision-making frameworks [34,35,37,40]. In many of these configurations, hydrogen is still modeled primarily as an energy storage medium or a secondary co-product that supports off-grid or weak-grid electricity supply.
Heat and by-product utilization further widen the design space. Combined hydrogen and heat (CHyH) generation schemes recover low-grade heat from PEM electrolyzers for district heating, raising overall energy efficiency to values approaching 95% in the specific case studies where a suitable district-heating demand is available and heat is fully monetized [41]. Robust scheduling models for integrated electricity–heat–hydrogen systems with bidirectional heat exchange between electrolyzers and district-heating networks [42], together with case studies where electrolysis waste heat feeds district heating [43] or wastewater-treatment polygeneration schemes co-produce hydrogen and ammonia [44], confirm that embedding hydrogen production within broader infrastructures can enhance renewable utilization and improve economic indicators. Industrial polygeneration systems recovering medium- and high-grade waste heat from steel plants to simultaneously supply electricity, process heat, and hydrogen further improve exergy efficiency and reduce specific hydrogen costs in the analyzed configurations [45].
Solar-thermal-based and biomass-based polygeneration concepts likewise illustrate the potential of multi-product configurations. Case studies coupling parabolic-trough collectors, organic Rankine cycle (ORC) units, and electrolyzers co-produce electricity and hydrogen with reasonable solar-to-product efficiencies and payback periods under favorable solar and cost assumptions [46,47,48]. More advanced architectures integrate solar concentration systems, supercritical CO2 Brayton and ORC cycles to co-produce electricity, water, and hydrogen at competitive LCOH in the specific resource and boundary conditions considered [49], while conceptual biomass gasification–SOFC–waste-heat recovery systems can reach high overall energy efficiencies and LCOH values in the mid-range of current green hydrogen costs [50]. Power-to-X routes converting green hydrogen into ammonia or methanol leverage similar hybrid PV–WF configurations and economies of scale, with LCOH typically in the 4–6 €/kg range under favorable conditions in the Egyptian case study analyzed in [14]. Valorization of the oxygen by-product from electrolysis can further reduce LCOH on the order of 10–20% where sufficient demand exists and high-purity oxygen can be marketed [51].
Overall, these studies confirm that multi-output systems exploiting heat, oxygen, and hydrogen derivatives can significantly improve energy and economic performance in appropriately matched contexts. However, most of the above multi-product works focus on thermodynamic or exergy optimization and treat electricity and hydrogen markets in a simplified manner, often assuming fixed tariffs or generic price scenarios. Hydrogen is frequently considered as a secondary product or storage medium rather than as a fully market-exposed commodity co-optimized alongside electricity at the plant level.
1.5. Hydrogen Hubs, Valleys and Regional Integration
At the regional scale, hydrogen hubs and valleys have emerged as key frameworks to integrate production, infrastructure, and demand. The term “hydrogen hub” is used to denote regional clusters where hydrogen production, transport, storage, and use are co-located and co-planned with other industrial demand, while recognizing that European initiatives typically refer to flagship integrated projects as hydrogen valleys [4,7]. Spatial-optimization methods such as H2Locate [52] and hydrogen-valley modeling approaches [53,54] show that resource availability, existing grids and pipelines, and proximity to large industrial consumers jointly determine the most suitable locations for large-scale electrolytic hydrogen production. These studies emphasize that purely resource-based siting can lead to sub-optimal outcomes even in areas with excellent renewable potential, and that coordinated planning of production, storage, and transmission assets can substantially reduce both system costs and LCOH.
In parallel, value-chain analyses highlight that electricity costs and electrolyzer CAPEX remain dominant contributors to LCOH and that hydrogen demand is increasingly concentrated in industrial clusters where integration with power networks and process-heat systems is essential to unlock cost reductions [16]. On the operational side, recent optimization frameworks explicitly link electrolyzer dispatch to electricity-market conditions and product flexibility. Mixed-integer linear programming models that compute the LCOH from the offtaker’s standpoint show that configurations with higher product flexibility, for example systems that can vary the share of energy delivered as hydrogen versus electricity, can achieve lower effective LCOH than systems that only export surplus power at fixed tariffs [55]. Integrated electro-thermal energy systems with hydrogen production from offshore wind participating in multi-level electricity markets further demonstrate that coordinated participation across day-ahead, intraday, and balancing markets can improve profitability and reduce curtailment [56]. Market-based techno-economic frameworks for hydrogen–electricity co-production systems indicate that solid-oxide-based configurations can achieve positive profits under a range of future price scenarios and that specific features of electricity price statistics strongly influence annual profit [57].
These frameworks clearly underscore the importance of modeling hydrogen and electricity as co-products interacting with markets. Nevertheless, they typically focus on generic large-scale technology options, policy scenarios, or offshore wind contexts and only rarely address the detailed design of a specific hybrid PV–WF plant embedded within an industrial hub, with explicit consideration of power purchase agreement (PPA)-like tariffs representative of industrial offtake.
1.6. Research Gap and CHyP Concept
Taken together, the literature can be broadly classified into three overlapping categories. The first group comprises surplus-to-hydrogen schemes that produce hydrogen from curtailed or very low-priced electricity, including hybrid PV–WF configurations where tariffs are simplified and market dynamics are only coarsely represented [9,10,11,12,13,14,34,35,36,37,39,58]. A second group encompasses multi-product energy systems, including studies described in the literature as cogeneration or polygeneration in which electricity, hydrogen, heat, and sometimes water or chemicals are co-produced, but where market interactions and value stacking are treated in a simplified manner, typically via fixed tariffs or stylized price scenarios [14,41,43,44,45,46,47,48,49,50,51,59]. A third group focuses on decentralized hybrid systems and micro-grids in which hydrogen is mainly treated as an energy-storage medium or secondary by-product to support off-grid or weak-grid electricity supply, rather than as a fully market-exposed commodity co-optimized alongside electricity [34,35,37,40]. Although these categories are not mutually exclusive, they highlight the predominance of either purely technical optimization or highly simplified market representations in most existing studies.
More recent works explicitly address the interaction between hydrogen and electricity products and markets, for instance, by analyzing the economics of converting renewable power to hydrogen under fluctuating electricity prices and efficient sizing considerations [28], by optimizing project configurations from the offtaker’s standpoint [55] or by analyzing hydrogen–electricity co-production systems under different electricity-price scenarios [56,57]. These frameworks clearly point to the importance of product flexibility and market-based operation, but they typically do not focus on the detailed dimensioning of hybrid PV–WF plants embedded in specific industrial hubs, nor do they combine such design questions with spatial screening across a real national system.
What is largely missing is a structured framework in which a hybrid PV–WF plant is designed and operated as a CHyP unit within an industrial hub, where hydrogen and electricity are both primary, market-valued products. In particular, three aspects remain underexplored. First, there is a need for systematic dimensioning of the electrolyzer based on the generation duration curve of a hybrid RES plant, explicitly targeting high and relatively stable operating hours in line with recent degradation findings and modeling insights [22,23,24,25,26]. Second, the explicit valuation of electricity surpluses through PPA-like tariffs representative of industrial offtake within hubs is seldom addressed; surplus electricity is often treated as a low-value by-product or as purely curtailed power, which obscures its potential contribution to lowering the effective LCOH. Third, few studies provide a spatially explicit assessment of hybrid PV–WF–electrolyzer configurations across a real national system, jointly considering regional differences in renewable resources, their impact on LCOH, and the interaction with existing hydrogen hubs or industrial clusters.
In this context, the present work introduces the CHyP concept: a 500 MW hybrid PV–WF plant directly coupled to a PEM electrolyzer, located within a hydrogen hub and co-producing hydrogen and electricity for an industrial consumer. CHyP is defined as a hybrid PV–wind power plant whose output is allocated between hydrogen production and direct electricity supply to an industrial offtaker, with both hydrogen and electricity treated as main products that jointly determine project viability. The electrolyzer is sized and operated at nominal load to maximize annual hydrogen production while limiting degradation due to partial operation, and surplus electricity is sold at a tariff consistent with recent wind power purchase agreements in Spain. The study quantifies how the share of wind power in the hybrid plant affects the LCOH in representative locations across all Spanish autonomous communities, thereby assessing the techno-economic potential of CHyP as a regionally adaptable pathway to competitive green hydrogen. While degradation and electricity markets are represented through average rates and a single PPA-like tariff rather than fully dynamic models, the proposed framework serves as a bridge between purely technical surplus-to-hydrogen designs and more detailed market-based co-production studies by explicitly linking plant sizing, product allocation, and regional resource variability.
2. Methods
The production unit analyzed in this study consists of a PEM electrolyzer directly powered by a hybrid renewable energy plant, combining PV and WF sources. The electrolyzer always operates at its nominal design point, in order to minimize degradation [22]. To determine the number of operating hours per year, the generation duration curve of the hybrid plant is obtained, by sorting hourly net electricity production from the highest value to the lowest. The product of the coordinates at each point on this curve (power times hours) determines the amount of electricity generated at the corresponding power level. If this electricity is supplied to an electrolyzer operating at that power, the annual hydrogen production can be estimated, assuming an average specific consumption (). The annual electricity input to the electrolyzer () is therefore a fraction of the total electricity production of the hybrid plant, which includes contributions from both PV (EPV) and WF (EWF) sources. This results in electricity surpluses that may be difficult to export to the grid. Here, the co-production concept becomes relevant: if hydrogen production is aimed at an industrial consumer, the same consumer is also likely to have electricity demand, which can be partially met by those surplus generation hours. In order to facilitate this integrated energy supply, the facility should ideally be located within a hydrogen hub, as promoted by the European Union [7]. Figure 1 illustrates the CHyP concept, described in detail in the introduction section.
From the electricity generation duration curve of the hybrid power plant, and considering the average specific consumption of the electrolyzer, the point of maximum hydrogen production can be identified. However, in this study, that point is replaced by the one that achieves 90% of the maximum hydrogen output while maximizing the number of operating hours, thereby reducing the LCOH. Once the annual electricity supplied to the electrolyzer is determined, the electricity surplus is assumed to be sold to the industrial consumer at a predefined tariff (). Given that the surplus generation duration curve closely resembles that of a WF, a sale tariff of 60 €/MWh has been assumed, consistent with recent wind power purchase agreement signed in Spain [60].
While solar PV exhibits low costs [17], it typically produces electricity for approximately 1,500 equivalent full-load hours per year, with time-varying output [27,29,30]. In contrast, wind farms, though more expensive [17], can produce electricity over a larger fraction of the year [61], although its output remains variable. To balance these complementary characteristics, both energy sources have been considered in this study at different shares.
As the LCOH is evaluated within the Spanish context, the economic assumptions adopted are aligned with those used for the IBHYX [19] and are summarized in Table 1. The stack degradation is assumed to be 0.12% per 1,000 operating hours, with a nominal electricity consumption of 55.5 kWh/kg. The stack is assumed to be replaced after 80,000 h of operation. Following the methodology presented in [62], the average specific consumption over the project‘s lifetime is estimated at 57.44 kWh/kg. The LCOH is obtained from Equation 1, whose components are detailed in equations 2 to 9. The nominal escalation rate of the operational costs is assumed to be zero and the capital recovery factor (CRF) is specified in Equation 10, where wacc stands for the weighted average capital cost and N is the lifespan of the project.
Equation 2 defines the investment cost of the electrolyzer (CAPEXELY) as a function of its specific investment cost (INVELY,e) and the annual operating hours (H). The operational costs associated with electricity supply to the electrolyzer (CAPOPEXfeedstock) are calculated using Equation 3, where the LCOE is derived in Equations 4 to 6. These equations consider the specific investment costs of PV and WF plants (INVPVe and INVWFe), their respective operation and maintenance costs (OMPV and OMWF), and their installed peak capacities (PPV and PWF). The maintenance of the electrolyzer is represented in Equation 7, based on the capital investment and a maintenance factor (fom). The operational costs regarding the stack replacement are modeled by Equation 8 as a function of the total operating hours before replacement (Hstack), and the replacement factor (frs). Finally, the revenues from electricity surplus sales (REVENUESsurpluses) are quantified in Equation 9.
Following the described procedure, a case study was conducted to calculate the LCOH in multiple locations in Spain. One representative site was selected in each autonomous community, prioritizing areas with the highest wind energy potential based on data from the Global Wind Atlas [63]. For each selected location, hourly time series data for wind and solar power output were obtained from [64] (based on the methods described in [29,61]) and the European Commission’s PVGIS tool [30] respectively.
At each site, a 500 MW hybrid renewable energy system was modeled where the contribution of wind and solar power was varied from 0% to 100% in increments. The corresponding LCOH was calculated for each configuration to identify the optimal mix that minimizes hydrogen production costs.
3. Results
Figure 2 illustrates the calculated LCOH and the corresponding LCOE as a function of the wind power share for a representative location in the autonomous community of Aragón (Spain). The wind power share ranges from 0% (i.e., a 500 MW plant fully based on solar PV) to 100% (i.e., 500 MW entirely from wind power). When relying exclusively on wind power, the LCOH reaches 3.5 €/kg H2, whereas using only solar power results in a cost of 5.75 €/kg H2. All hybrid wind–solar configurations considered result in a lower LCOH than the solar-only configuration, while the optimum hybrid configuration also outperforms the wind-only case. For this specific location —the one yielding the lowest LCOH among all regions—the minimum value achieved is 1.68 €/kg H2, corresponding to a wind power share of 26%, which translates into an LCOE of 37.34 €/MWh.
The same analysis was conducted for each autonomous community in Spain. The minimum LCOH values, together with the corresponding wind power shares, resulting LCOEs and electrolyzer operating hours for all selected locations, are summarized in Figure 3 and Table 2. Table 2 orders the autonomous communities by increasing LCOH and also includes the LCOE corresponding to the wind share that minimizes the LCOH. As expected, a similar trend is observed between LCOH and LCOE, with lower LCOH values generally associated with lower LCOEs. The lowest LCOH values are observed in locations with higher wind energy potential, with the optimal wind power share being 27% on average. The LCOH ranges from 1.68 to 4.4 €/kg, meaning that even in the least favorable autonomous communities, the hybridization of solar and wind yields a competitive cost when compared to the official Iberian renewable hydrogen price index (5.97 €/kg as of 24/06/2025) [19]. It is also worth noting that the assumed electricity sale tariff of 60 €/MWh is significantly higher than the resulting LCOE in the best-performing locations —by up to 60%.
4. Discussion
To interpret the resulting LCOH, its components have been grouped into two terms: , and have been combined in the electrolyzer term (ELY), whereas and have been combined in the energy term (ENERGY). Figure 4 shows these two terms for each Spanish autonomous community. In the nine communities with the lowest LCOH, the ENERGY term is negative or very small. This occurs because revenues are higher (in absolute value) than the CAPEX and OPEX of the hybrid power plant. In the remaining communities, the LCOE is higher, so hybrid-plant costs are not fully offset by revenues and the ENERGY term becomes substantially larger, although the ELY term remains the dominant contribution.
The ENERGY term mainly depends on the LCOE, because including revenues ensures that all electricity generation is used, either in the electrolyzer or supplied to an industrial consumer. The ELY term is largely driven by CAPEX and therefore correlates with the inverse of the electrolyzer operating hours (η). Figure 5 shows the strong correlation obtained with these independent variables.
Taking this into account, a multivariable linear regression is derived, yielding equation 11, which attains an R2 of 98.31%.
Figure 6 shows the scatter of minimum LCOH values (red points), together with iso-LCOH lines used to classify them. The electrolyzer operating hours vary markedly across locations, reflecting differences in the local renewable resource, whereas LCOH is strongly influenced by the LCOE. This is evident in the five locations with the lowest LCOH, which all cluster around 2 €/kg because their LCOE is nearly the same (about 37 €/MWh), even though electrolyzer operating hours range from 4800 to 5800.
5. Conclusions
Green hydrogen has emerged as a key enabler of the energy transition, especially in hard-to-abate sectors. However, its widespread adoption is currently limited by high production costs. To address this challenge, this paper proposes a co-production-based business model aimed at reducing the LCOH through two main strategies: (i) the hybridization of wind and solar power to optimize electricity supply, and (ii) the sale of electricity surpluses to industrial end-users. For this model to be effective, the electrolyzer must be located in an industrial hub where demand for both hydrogen and electricity is ensured. The analysis demonstrates a clear economic benefit from hybridizing renewable sources for hydrogen production in Spain. Across all autonomous communities, the combined use of wind and solar consistently lowers the LCOH compared to configurations relying on a single source, with optimal systems typically featuring a wind share of around 27%. The lowest LCOH—1.68 €/kg H2—was observed in Aragón, but even in less favorable regions, values remain below 4.4 €/kg, significantly under the official Iberian Renewable Hydrogen Index price. Additionally, the LCOE corresponding to the optimal wind share is substantially lower than the assumed electricity sale tariff, further reinforcing the economic viability of this co-production approach. Overall, these findings support the strategic deployment of hybrid renewable-powered electrolyzer systems as a regionally adaptable and cost-effective pathway for industrial green hydrogen production in Spain. Finally, the optimum LCOH can be explained to a large extent by only two variables—the LCOE and the electrolyzer operating hours—both driven by the local resource and the wind–solar mix in the hybrid power plant.
Author Contributions
Conceptualization, J.I.L. and E.A.; methodology, J.I.L., E.A. and J.R.P.; software, S.N.; validation, J.I.L., E.A. and J.R.P.; formal analysis, J.R.P.; investigation, S.N.; resources, J.I.L. and E.A.; writing—original draft preparation, S.N.; writing—review and editing, J.I.L., E.A. and J.R.P.; visualization, E.A.; supervision, J.I.L. and E.A.; project administration, E.A.; funding acquisition, E.A. All authors have read and agreed to the published version of the manuscript.
Data Availability Statement
Dataset available on request from the authors.
Acknowledgments
Authors acknowledge to Rafael Mariño Chair on New Energy Technologies and Repsol Foundation Chair in Energy Transition of Comillas Pontifical University for their support.
Conflicts of Interest
The authors declare no conflicts of interest.
Abbreviations
The following abbreviations are used in this manuscript:
| AEL | Alkaline electrolyzer |
| CAPEX | Capital expenditures |
| CHyH | Combined hydrogen and heat |
| CHyP | Combined hydrogen and power |
| EU | European Union |
| IBHYX | Iberian Renewable Hydrogen Index |
| IEA | International Energy Agency |
| LCOE | Levelized cost of electricity |
| LCOH | Levelized cost of hydrogen |
| ORC | Organic Rankine cycle |
| PEM | Proton exchange membrane electrolyzer |
| PPA | Power purchase agreement |
| PV | Photovoltaic |
| SOEC | Solid oxide electrolyzer |
| STEPS | Stated Policies Scenario |
| TRL | Technology readiness level |
| US | United States |
| USD | United States Dollar |
| WF | Wind farm |
| WPEB | Wind farm-photovoltaic-electrolyzer-battery |
References
- International Energy Agency (IEA), World Energy Outlook 2025, Paris: International Energy Agency, 2025. https://www.iea.org/reports/world-energy-outlook-2025. (Accessed on December 21, 2025).
- International Energy Agency (IEA), Global Hydrogen Review 2025, Paris: International Energy Agency, 2025. https://www.iea.org/reports/global-hydrogen-review-2025. (Accessed on December 21, 2025).
- S. E. Hosseini, M. A. Wahid, “Hydrogen production, distribution, storage and power conversion in a hydrogen economy - A technology review,” Chemical Engineering Journal Advances, vol. 8, art. no. 100172, 2021. [CrossRef]
- M. van der Spek, C. Banet, C. Bauer, P. Gabrielli, W. Goldthorpe, M. Mazzotti, et al., “Perspective on the hydrogen economy as a pathway to reach net-zero CO2 emissions in Europe,” Energy & Environmental Science, vol. 15, no. 3, pp. 1034–1077, 2022. [CrossRef]
- F. Superchi, A. Mati, C. Carcasci, A. Bianchini, “Techno-economic analysis of wind-powered green hydrogen production to facilitate the decarbonization of hard-to-abate sectors: A case study on steelmaking,” Applied Energy, vol. 342, art. no. 121198, 2023. [CrossRef]
- M. Jayachandran et al., “Challenges and Opportunities in Green Hydrogen Adoption for Decarbonizing Hard-to-Abate Industries: A Comprehensive Review,” IEEE Access, vol. 12, pp. 23363–23388, 2024. [CrossRef]
- Clean Hydrogen Partnership, “Hydrogen Valleys,” Clean Hydrogen Partnership. https://www.clean-hydrogen.europa.eu/get-involved/hydrogen-valleys_en. (Accessed on December 21, 2025).
- E. Curcio, “Techno-economic analysis of hydrogen production: Costs, policies, and scalability in the transition to net zero,” International Journal of Hydrogen Energy, vol. 128, pp. 473–487, 2025. [CrossRef]
- M. Benghanem, A. Mellit, H. Almohamadi, S. Haddad, N. Chettibi, A. M. Alanazi, et al., “Hydrogen Production Methods Based on Solar and Wind Energy: A Review,” Energies, vol. 16, no. 2, art. no. 757, 2023. [CrossRef]
- P. Fabianek, R. Madlener, “Techno-economic analysis and optimal sizing of hybrid PV-wind systems for hydrogen production by PEM electrolysis in california and northern germany,” International Journal of Hydrogen Energy, vol. 67, pp. 1157–1172, 2024. [CrossRef]
- S. F. Macedo, D. Peyerl, “Prospects and economic feasibility analysis of wind and solar photovoltaic hybrid systems for hydrogen production and storage: A case study of the brazilian electric power sector,” International Journal of Hydrogen Energy, vol. 47, no. 19, pp. 10460–10473, 2022. [CrossRef]
- N. A. S. Elminshawy, S. Diab, Y. E. S. Yassen, O. Elbaksawi, “An energy-economic analysis of a hybrid PV/wind/battery energy-driven hydrogen generation system in rural regions of egypt,” Journal of Energy Storage, vol. 80, art. no. 110256, 2024. [CrossRef]
- Z. Abdin, N. Al Khafaf, B. McGrath, “Feasibility of hydrogen hybrid energy systems for sustainable on- and off-grid integration: An australian REZs case study,” International Journal of Hydrogen Energy, vol. 57, pp. 1197–1207, 2024. [CrossRef]
- R. Ragab, M. Hamdi, H. A. El Salmawy, M. A. Ismail, “Optimized system for combined production of electricity/green hydrogen for multiple energy pathways: a case study of Egypt,” Clean Energy, vol. 8, no. 4, pp. 219–236, 2024. [CrossRef]
- Ajanovic, M. Sayer, R. Haas, “The economics and the environmental benignity of different colors of hydrogen,” International Journal of Hydrogen Energy, vol. 47, no. 57, pp. 24136–24154, 2022. [CrossRef]
- X. Yan, W. Zheng, Y. Wei, Z. Yan, “Current status and economic analysis of green hydrogen energy industry chain,” Processes, vol. 12, no. 2, art. no. 315, 2024. [CrossRef]
- International Renewable Energy Agency (IRENA), Renewable Power Generation Costs in 2023, Abu Dhabi: IRENA, 2024. https://www.irena.org/-/media/Files/IRENA/Agency/Publication/2024/Sep/IRENA_Renewable_power_generation_costs_in_2023.pdf (Accessed on December 21, 2025).
- D. J. Jovan, G. Dolanc, “Can Green Hydrogen Production Be Economically Viable under Current Market Conditions,” Energies, vol. 13, no. 24, art. no. 6599, 2020. [CrossRef]
- MIBGAS Green Energy, “Iberian Renewable Hydrogen Index (IBHYX),” MIBGAS Green Energy. https://greenenergy.mibgas.es/indice. (Accessed on December 21, 2025).
- S. M. Saba, M. Müller, M. Robinius, D. Stolten, “The investment costs of electrolysis – A comparison of cost studies from the past 30 years,” International Journal of Hydrogen Energy, vol. 43, no. 3, pp. 1209–1223, 2018. [CrossRef]
- S. Shiva Kumar, H. Lim, “An overview of water electrolysis technologies for green hydrogen production,” Energy Reports, vol. 8, pp. 13793–13813, 2022. [CrossRef]
- Siracusano, S. Trocino, N. Briguglio, F. Pantò, A. S. Aricò, “Analysis of performance degradation during steady-state and load-thermal cycles of proton exchange membrane water electrolysis cells,” Journal of Power Sources, vol. 468, art. no. 228390, 2020. [CrossRef]
- F. Maoulida, D. Guilbert, M.-B. Camara, B. Dakyo, “Dynamic electrical degradation of PEM electrolyzers under renewable energy intermittency: Mechanisms, diagnostics, and mitigation strategies – A comprehensive review,” Renewable and Sustainable Energy Reviews, vol. 225, art. no. 116170, 2025. [CrossRef]
- R. A. Márquez, F. Kluge, R. Hanke-Rauschenbach, U. Krewer, “Insights into catalyst degradation during alkaline water electrolysis under variable operation,” Energy & Environmental Science, vol. 18, pp. 7170–7187, 2025. [CrossRef]
- M. Arnold, J. Brandt, G. Tjarks, A. Vanselow, R. Hanke-Rauschenbach, “Cost-optimized replacement strategies for water electrolysis systems affected by degradation,” Energy Conversion and Management: X, vol. 28, art. no. 101261, 2025. [CrossRef]
- Makhsoos, M. Kandidayeni, B. G. Pollet, L. Boulon, “Proton exchange membrane water electrolyzers degradation models review: Implications for power allocation and energy management,” Journal of Power Sources, vol. 655, art. no. 238003, 2025. [CrossRef]
- Foro Nuclear, “Energía 2024,” Foro Nuclear. https://www.foronuclear.org/publicaciones-archivo/energia-archivo/energia-2024-version-online/. (Accessed on December 21, 2025).
- G. Glenk, S. Reichelstein, “Economics of converting renewable power to hydrogen,” Nature Energy, vol. 4, pp. 216–222, 2019. [CrossRef]
- S. Pfenninger, I. Staffell, “Long-term patterns of European PV output using 30 years of validated hourly reanalysis and satellite data,” Energy, vol. 114, pp. 1251–1265, 2016. [CrossRef]
- European Commission, Joint Research Centre, “PVGIS,” PVGIS. https://re.jrc.ec.europa.eu/pvg_tools/en/. (Accessed on December 21, 2025).
- M. S. Herdem, D. Mazzeo, N. Matera, C. Baglivo, N. Khan, A. Afnan, et al., “A brief overview of solar and wind-based green hydrogen production systems: Trends and standardization,” International Journal of Hydrogen Energy, vol. 48, pp. 340–353, 2023. [CrossRef]
- T. Ikuerowo, S. O. Bade, A. Akinmoladun, B. A. Oni, “The integration of wind and solar power to water electrolyzer for green hydrogen production,” International Journal of Hydrogen Energy, vol. 76, pp. 75–96, 2024. [CrossRef]
- M. Al-Mahmodi, O. Ayadi, Y. Wang, A. Al-Halhouli, “Sensitivity-based techno-economic assessment approach for electrolyzer integration with hybrid photovoltaic–wind plants for green hydrogen production,” International Journal of Hydrogen Energy, vol. 97, pp. 904–919, 2025. [CrossRef]
- X. Li, X. Lv, W. Zhang, C. Xu, “Can energy storage make off-grid photovoltaic hydrogen production system more economical?” Frontiers of Engineering Management, vol. 10, no. 3, pp. 672–694, 2023. [CrossRef]
- Z. Abdin, W. Mérida, “Hybrid energy systems for off-grid power supply and hydrogen production based on renewable energy: A techno-economic analysis,” Energy Conversion and Management, vol. 196, pp. 1068–1079, 2019. [CrossRef]
- R. Li, X. Jin, P. Yang, X. Sun, G. Zhu, Y. Zheng, et al., “Techno-economic analysis of a wind–photovoltaic–electrolysis–battery hybrid energy system for power and hydrogen generation,” Energy Conversion and Management, vol. 276, art. no. 116854, 2023. [CrossRef]
- B. Ma, J. Zheng, Z. Xian, B. Wang, H. Ma, “Optimal operation strategy for wind–photovoltaic power-based hydrogen production systems considering electrolyzer start-up characteristics,” Processes, vol. 12, no. 8, art. no. 1756, 2024. [CrossRef]
- J. Liu, J. Wang, Y. Tang, J. Jin, W. Li, “Solar photovoltaic–thermal hydrogen production system based on full-spectrum utilization,” Journal of Cleaner Production, vol. 430, art. no. 139340, 2023. [CrossRef]
- M. Rezaei, K. R. Khalilpour, M. A. Mohamed, “Co-production of electricity and hydrogen from wind: A comprehensive scenario-based techno-economic analysis,” International Journal of Hydrogen Energy, vol. 46, no. 35, pp. 18242–18256, 2021. [CrossRef]
- S. Das, S. De, R. Dutta, S. De, “Multi-criteria decision-making for techno-economic and environmentally sustainable decentralised hybrid power and green hydrogen cogeneration system,” Renewable and Sustainable Energy Reviews, vol. 191, art. no. 114135, 2024. [CrossRef]
- D. Burrin, S. Roy, A. P. Roskilly, A. Smallbone, “A combined heat and green hydrogen (CHH) generator integrated with a heat network,” Energy Conversion and Management, vol. 246, art. no. 114686, 2021. [CrossRef]
- P. Han, X. Xu, Z. Yan, M. Shahidehpour, Z. Tan, H. Wang, et al., “Robust scheduling of integrated electricity–heat–hydrogen system considering bidirectional heat exchange between alkaline electrolyzers and district heating networks,” IEEE Transactions on Power Systems, early access, 2023.
- D. Tommasini, N. O. Marx, W. Yimmer, S. Reuter, H. Kauko, “Electrolysis waste heat utilization for district heating — A Norwegian case study,” Smart Energy, vol. 20, art. no. 100207, 2025. [CrossRef]
- M. Alrbai, S. Al-Dahidi, L. Al-Ghussain, B. Shboul, H. Hayajneh, A. Alahmer, “Assessment of the polygeneration approach in wastewater treatment plants for enhanced energy efficiency and green hydrogen/ammonia production,” Process Safety and Environmental Protection, vol. 192, pp. 803–821, 2024. [CrossRef]
- M. Taheripour, M. Kahani, M. H. Ahmadi, “A hybrid poly-generation system for power and hydrogen production by thermal recovery from waste streams in a steel plant: Techno-economic analysis,” Energy Reports, vol. 11, pp. 2921–2934, 2024. [CrossRef]
- P. Lykas, E. Bellos, A. Kitsopoulou, C. Sammoutos, C. Tzivanidis, “Electricity and hydrogen cogeneration: A case study simulation via the Aspen Plus tool,” Energy, vol. 290, art. no. 130903, 2024. [CrossRef]
- S. Baral, J. Šebo, “Techno-economic assessment of green hydrogen production integrated with hybrid and organic rankine cycle (ORC) systems,” Heliyon, vol. 10, no. 4, art. no. e25742, 2024. [CrossRef]
- P. Lykas, N. Georgousis, A. Kitsopoulou, D. N. Korres, E. Bellos, C. Tzivanidis, “A Detailed Parametric Analysis of a Solar-Powered Cogeneration System for Electricity and Hydrogen Production,” Applied Sciences, vol. 13, no. 1, art. no. 433, 2023. [CrossRef]
- G. Wang, D. Li, T. Zou, Y. Duan, “Design and performance evaluation of an innovative solar concentration polygeneration system,” Renewable Energy, vol. 251, art. no. 123441, 2025. [CrossRef]
- Tera, S. Zhang, G. Liu, “A conceptual hydrogen, heat and power polygeneration system based on biomass gasification, SOFC and waste heat recovery units: Energy, exergy, economic and emergy (4E) assessment,” Energy, vol. 295, art. no. 131015, 2024. [CrossRef]
- F. Eckl, A. Moita, R. Castro, R. C. Neto, “Valorization of the by-product oxygen from green hydrogen production: A review,” Applied Energy, vol. 378, art. no. 124817, 2025. [CrossRef]
- C. Fisher et al., “Analysing hydrogen hub locations: Resources, energy, and social impact,” International Journal of Hydrogen Energy, vol. 70, pp. 641–653, 2024. [CrossRef]
- S. Rosén, L. Göransson, M. Taljegård, M. Lehtveer, “Modeling of a ‘Hydrogen Valley’ to investigate the impact of a regional pipeline for hydrogen supply,” Frontiers in Energy Research, vol. 12, art. no. 1420224, 2024. [CrossRef]
- E. A. Bekele, A. Sgaramella, A. Ciancio, G. Lo Basso, L. De Santoli, L. M. Pastore, “Hydrogen valleys to foster local decarbonisation targets: A multiobjective optimisation approach for energy planning,” Applied Energy, vol. 402, art. no. 126851, 2025. [CrossRef]
- F. Bastarrica, R. Li, V. Mak-Hau, S. A. Gorji, “Levelized cost of hydrogen from offtakers standpoint: An overlooked perspective via case studies in Warrnambool, Australia,” International Journal of Hydrogen Energy, vol. 166, art. no. 150558, 2025. [CrossRef]
- X. Li, Y. Du, Z. Tan, H. He, W. Fan, “Optimal operation model of electrothermal integrated energy system including hydrogen production from offshore wind power participating in multi-level market,” International Journal of Hydrogen Energy, vol. 114, pp. 250–266, 2025. [CrossRef]
- D. J. Laky, N. P. Cortes, J. C. Eslick, A. A. Noring, N. Susarla, C. Okoli, et al., “Market optimization and technoeconomic analysis of hydrogen–electricity coproduction systems,” Energy & Environmental Science, vol. 17, pp. 9509–9525, 2024. [CrossRef]
- Ganter, T. H. Ruggles, P. Gabrielli, G. Sansavini, K. Caldeira, “Utilizing curtailed wind and solar power to scale up electrolytic hydrogen production in Europe,” Environmental Science & Technology, vol. 59, no. 7, pp. 3495–3507, 2025. [CrossRef]
- W. Li, Y. Wang, L. Xu, Y. Tang, X. Wu, J. Liu, “Thermodynamic evaluation of electricity and hydrogen cogeneration from solar energy and fossil fuels,” Energy Conversion and Management, vol. 256, art. no. 115344, 2022. [CrossRef]
- S&P Global Commodity Insights, “Rising costs, lower revenues for European wind and solar lift PPA breakeven points,” S&P Global Commodity Insights. https://www.spglobal.com/commodity-insights/en/news-research/latest-news/electric-power/011824-rising-costs-lower-revenues-for-european-wind-and-solar-lift-ppa-breakeven-points. (Accessed on December 21, 2025).
- Staffell, S. Pfenninger, “Using Bias-Corrected Reanalysis to Simulate Current and Future Wind Power Output,” Energy, vol. 114, pp. 1224–1239, 2016. [CrossRef]
- Clean Hydrogen Observatory, Manual – Levelised Cost of Hydrogen (LCOH) Calculator, 2024. https://observatory.clean-hydrogen.europa.eu/sites/default/files/2024-06/Manual%20-%20Levelised%20Cost%20of%20Hydrogen%20%28LCOH%29%20Calculator.pdf. (Accessed on December 21, 2025).
- Global Wind Atlas, “Global Wind Atlas,”. https://globalwindatlas.info/en/. (Accessed on December 21, 2025).
- Renewables.ninja, “Renewables.ninja,”. https://www.renewables.ninja/. (Accessed on December 21, 2025).
Figure 1.
CHyP concept.
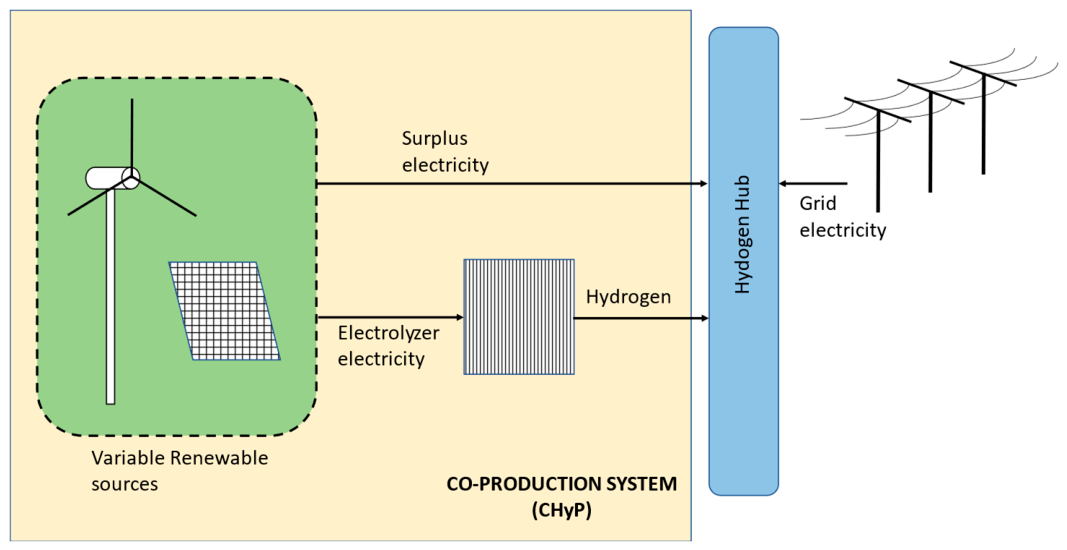
Figure 2.
LCOH and LCOE as a function of the wind power share for the autonomous community of Aragón in Spain.
Figure 2.
LCOH and LCOE as a function of the wind power share for the autonomous community of Aragón in Spain.
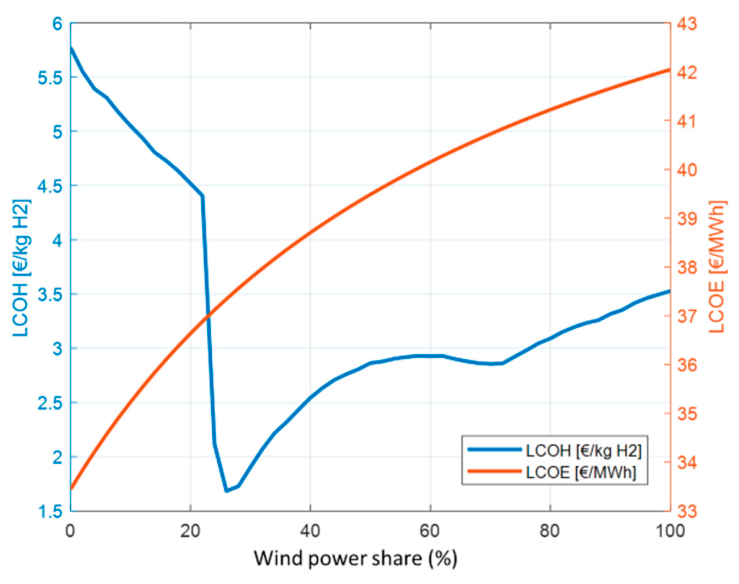
Figure 3.
Geographic distribution of the minimum LCOH across the autonomous communities of Spain. The color scale represents the minimum LCOH achieved in each region (a), and the associated wind power share at which this minimum occurs (b).
Figure 3.
Geographic distribution of the minimum LCOH across the autonomous communities of Spain. The color scale represents the minimum LCOH achieved in each region (a), and the associated wind power share at which this minimum occurs (b).
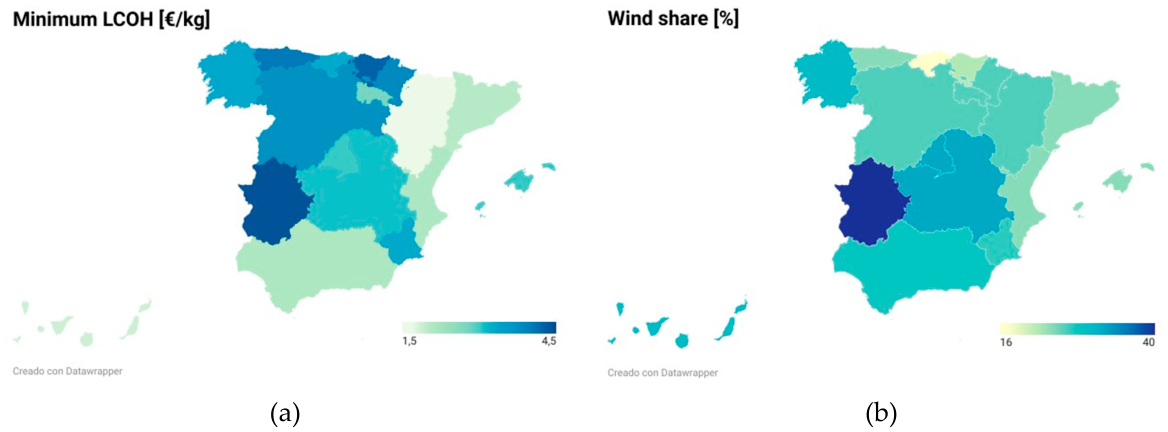
Figure 4.
Main terms of the LCOH in each autonomous community.
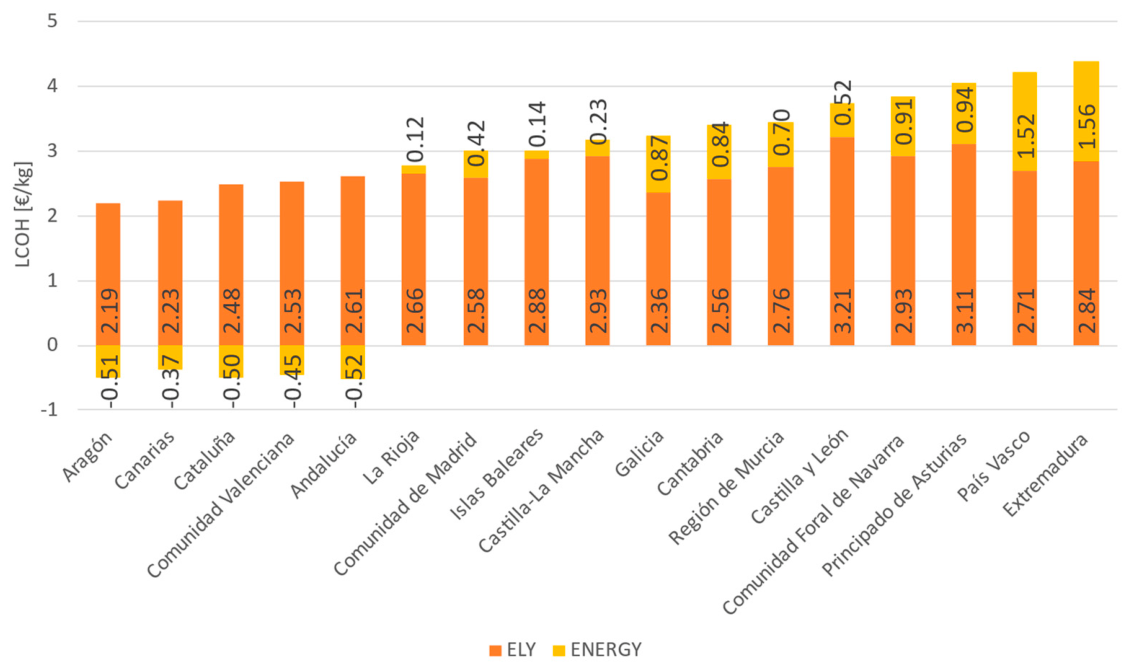
Figure 5.
Linear regression analysis of LCOH terms as a function of its corresponding explanatory variables.
Figure 5.
Linear regression analysis of LCOH terms as a function of its corresponding explanatory variables.
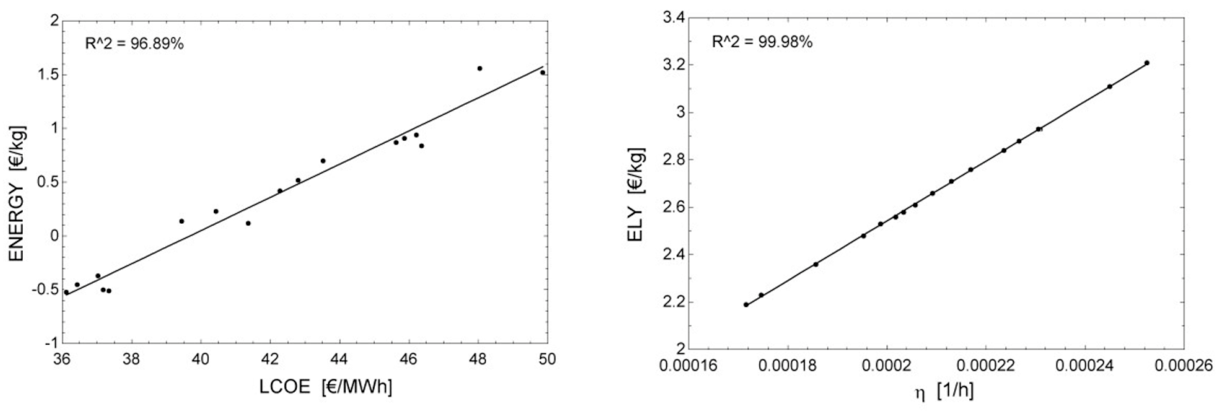
Figure 6.
Coordinates of the minimum LCOH for each autonomous community (red points) on the LCOE-H plane. Black lines show the iso-LCOH contours derived from equation 11.
Figure 6.
Coordinates of the minimum LCOH for each autonomous community (red points) on the LCOE-H plane. Black lines show the iso-LCOH contours derived from equation 11.
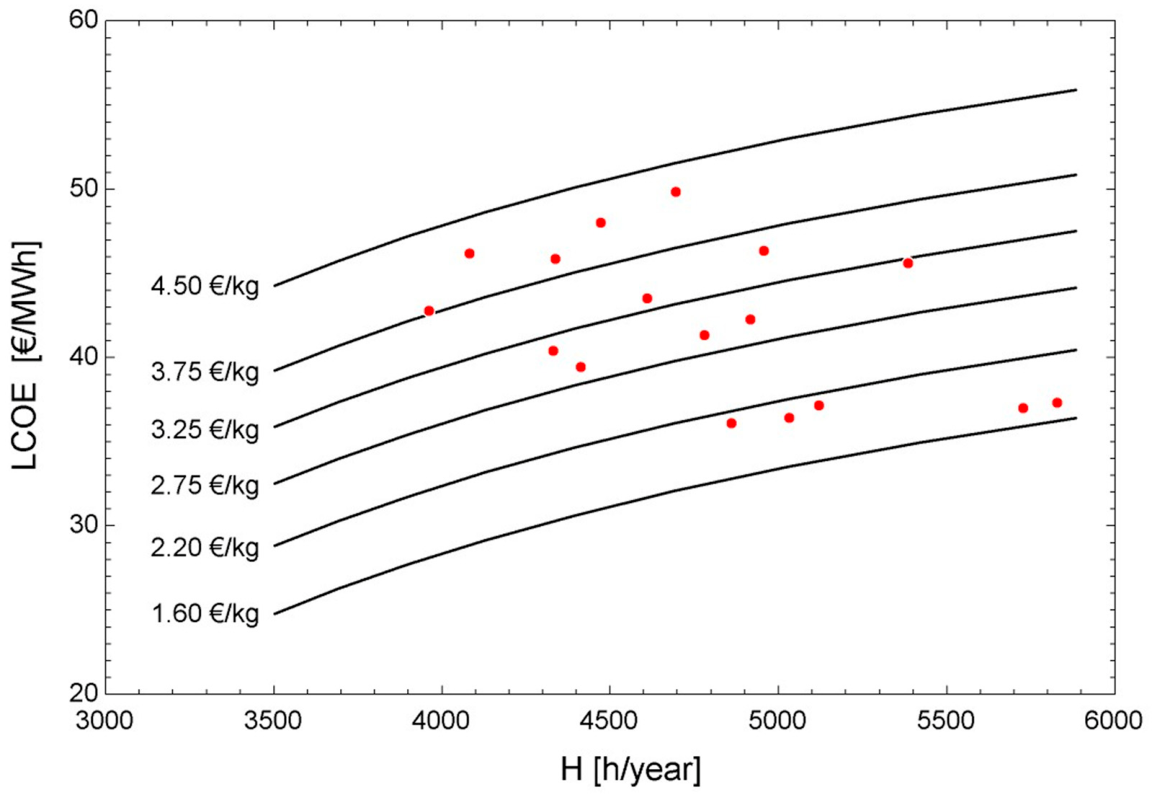

Table 1.
Economic assumptions [19].
Table 1.
Economic assumptions [19].
| Variable | Value | Units |
| 1,600 | €/kW | |
| fom | 4 | % |
| 57.44 | kWh/kg | |
| 500 | €/kW | |
| 5 | €/kW-year | |
| 1,100 | €/kW | |
| 50 | €/kW-year | |
| N | 25 | years |
| 80,000 | h | |
| 15 | % | |
| wacc | 7.74 | % |
Table 2.
Values of LCOH in every autonomous community in Spain, corresponding wind power share and resulting LCOE of the hybrid power system.
Table 2.
Values of LCOH in every autonomous community in Spain, corresponding wind power share and resulting LCOE of the hybrid power system.
| Autonomous community | Min. LCOH [€/kg H2] |
Wind share [%] |
LCOE [€/MWh] |
H [h/year] |
| Aragón | 1.68 | 26 | 37.34 | 5829 |
| Canarias | 1.86 | 30 | 37.03 | 5727 |
| Cataluña | 1.98 | 24 | 37.18 | 5121 |
| Comunidad Valenciana | 2.08 | 24 | 36.43 | 5032 |
| Andalucía | 2.1 | 28 | 36.11 | 4861 |
| La Rioja | 2.78 | 26 | 41.36 | 4780 |
| Comunidad de Madrid | 3.01 | 32 | 42.27 | 4917 |
| Islas Baleares | 3.02 | 24 | 39.44 | 4412 |
| Castilla-La Mancha | 3.17 | 32 | 40.43 | 4330 |
| Galicia | 3.24 | 30 | 45.62 | 5386 |
| Cantabria | 3.4 | 18 | 46.36 | 4957 |
| Región de Murcia | 3.45 | 28 | 43.52 | 4610 |
| Castilla y León | 3.73 | 26 | 42.80 | 3961 |
| Comunidad Foral de Navarra | 3.84 | 26 | 45.86 | 4337 |
| Principado de Asturias | 4.05 | 24 | 46.21 | 4082 |
| País Vasco | 4.23 | 22 | 49.85 | 4695 |
| Extremadura | 4.4 | 40 | 48.04 | 4472 |
Disclaimer/Publisher’s Note: The statements, opinions and data contained in all publications are solely those of the individual author(s) and contributor(s) and not of MDPI and/or the editor(s). MDPI and/or the editor(s) disclaim responsibility for any injury to people or property resulting from any ideas, methods, instructions or products referred to in the content. |
© 2026 by the authors. Licensee MDPI, Basel, Switzerland. This article is an open access article distributed under the terms and conditions of the Creative Commons Attribution (CC BY) license (http://creativecommons.org/licenses/by/4.0/).
Copyright: This open access article is published under a Creative Commons CC BY 4.0 license, which permit the free download, distribution, and reuse, provided that the author and preprint are cited in any reuse.