

Submitted:
21 September 2026
Posted:
22 September 2026
You are already at the latest version
Abstract
Panscape is presented as an integrated Rust-based command-line framework for processing and summarizing multiple pangenomic data types. Its functionality includes read and FASTQ preprocessing, motif and regular-expression scanning, alignment and annotation support, PAF- and GFA-based graph analysis, VCF comparison, and pangenome database construction. Benchmarking of an optimized implementation on a single-core system showed improved performance in 17 of 18 tested command–dataset combinations, with speedups ranging from 1.05-fold to 2.32-fold. These results suggest that workflow integration and implementation-level optimization can improve the accessibility and efficiency of pangenomic analyses.
Keywords:
pangenomics
; long reads
; bacterial pangenomics
; graphs
; pangraphs
Introduction
Genomics is increasingly moving from a reference-centred model toward pangenomic representations that capture genetic diversity across individuals, populations, or closely related organisms. Advances in sequencing technologies, genome assembly, and computational genomics have enabled the generation of large collections of genome assemblies, revealing substantial sequence variation that may not be represented by a single reference genome. This limitation is particularly relevant to structural variation, presence–absence variation, repetitive sequences, and lineage- or population-specific genomic regions. Pangenomic approaches address this limitation by representing genetic information derived from multiple genomes and thereby providing a broader representation of genomic diversity (Eizenga et al., 2020; Hyun et al., 2022; Zhao et al., 2018).
A pangenome can be defined as the collective genomic content observed across a defined group of related organisms. In the traditional gene-based framework, the pangenome is commonly divided into a core genome, consisting of genes or sequences shared across the analysed genomes, and an accessory genome, consisting of genes or sequences present in only a subset of genomes. The relative sizes of these components can provide information about genomic conservation, gene gain and loss, and population-level diversity. These concepts are particularly important in microbial genomics, where differences in gene content can result from processes such as horizontal gene transfer, gene duplication, and gene loss (Aggarwal et al., 2022; Hyun et al., 2022; Tonkin-Hill et al., 2020).
Pangenomic analysis is also increasingly important in plant and crop genomics. A single reference genome can fail to capture alleles and genomic regions present in other accessions, potentially resulting in the loss or under-representation of biologically relevant variation. For example, analysis of cultivated and wild rice identified extensive sequence variation and presence–absence variation across accessions, demonstrating the value of pan-genome resources for studying genetic diversity and identifying variants relevant to crop improvement (Zhao et al., 2018). More broadly, pangenomic approaches have been applied to the investigation of agronomically important traits, genetic diversity, and crop improvement, including the identification of genomic regions that may be absent from a conventional reference genome (Aggarwal et al., 2022).
In microbial and infectious-disease research, pangenomic analysis provides a framework for investigating variation in gene content among pathogen populations. Comparative analyses of microbial pathogen pangenomes have demonstrated structured patterns of conserved and variable genetic content, while computational approaches such as Panaroo and ggCaller have been developed to improve pangenome construction, gene annotation, and clustering across populations of microbial genomes (Hyun et al., 2022; Horsfield et al., 2023; Tonkin-Hill et al., 2020). Such analyses can support the investigation of antimicrobial resistance, virulence-associated variation, host adaptation, and other population-level genomic characteristics.
Pangenomic representations have consequently become relevant to a wide range of applications, including crop improvement, microbial surveillance, evolutionary genomics, and biomedical research. In contrast to a conventional linear reference, pangenome graphs can represent multiple alternative sequences and genomic paths within a single computational structure. These graph-based representations can support sequence alignment, variant calling, genotyping, visualization, and other analyses in which variation relative to a single reference may otherwise be difficult to represent (Eizenga et al., 2020).
Despite these advances, the pangenomics software ecosystem remains diverse and distributed across different analytical tasks. Existing tools address different components of the workflow, including pangenome construction, gene clustering, annotation, graph generation, variant analysis, and visualization. For example, Panaroo focuses on producing polished prokaryotic pangenomes while accounting for errors associated with genome annotation and assembly; ggCaller integrates gene prediction, functional annotation, and clustering using graph-based approaches; IPGA provides an integrated web-based environment for prokaryotic genome and pangenome analysis; and Panakeia provides a framework for bacterial pangenome analysis (Beier & Thomson, 2022; Horsfield et al., 2023; Liu et al., 2022; Tonkin-Hill et al., 2020).
The diversity of available software provides researchers with multiple analytical options, but it can also make the construction of reproducible workflows more complex. Different applications may use different input formats, algorithms, data structures, annotation strategies, and computational requirements. In particular, errors or inconsistencies in genome annotation can propagate into downstream pangenome analyses. Tonkin-Hill et al. (2020) demonstrated that annotation errors can substantially affect estimates of gene content, motivating approaches that explicitly account for such errors during pangenome construction. Similarly, ggCaller was developed partly to reduce redundant and inconsistent gene prediction and annotation across large collections of genomes (Horsfield et al., 2023).
A related challenge concerns the choice of computational representation. Gene-based pangenome approaches provide a convenient framework for identifying homologous genes and analysing gene presence or absence, whereas graph-based approaches provide a representation in which alternative genomic sequences and paths can be explicitly modelled. These approaches therefore address complementary analytical objectives. Pangenome graphs have been proposed for applications including read alignment, variant calling, genotyping, visualization, functional genomics, and association studies (Eizenga et al., 2020). Gene-based methods, meanwhile, remain particularly useful for studying gene-content variation and reconstructing core and accessory genomes (Beier & Thomson, 2022; Zhou et al., 2020).
The comparison and evaluation of pangenome tools also present methodological challenges. Differences in algorithms, genome quality, annotation procedures, data structures, and computational environments can influence the resulting pangenome. Consequently, assessments of pangenome software need to consider multiple factors, including accuracy, sensitivity, scalability, computational time, memory requirements, annotation consistency, and the interpretability of results. The development of integrated and graph-based tools demonstrates ongoing efforts to improve the efficiency and consistency of these analyses (Horsfield et al., 2023; Liu et al., 2022; Tonkin-Hill et al., 2020).
Visualization and downstream interpretation represent additional challenges. Large pangenome graphs may contain numerous nodes, paths, alleles, and relationships that are difficult to inspect using conventional linear genome browsers. Visualization systems designed specifically for pangenomic data have therefore been developed to facilitate exploration and interpretation. PanVA, for example, provides an interactive environment for analysing pangenomic variants, while graph-based pangenome frameworks provide visualization as one of their broader analytical applications (Eizenga et al., 2020; van den Brandt et al., 2024).
These computational and visualization challenges are important because the practical value of pangenomics depends not only on the ability of algorithms to detect genomic variation, but also on whether their outputs can be analysed consistently, reproduced across datasets, and interpreted in biologically meaningful contexts. Developing integrated workflows that combine genome processing, pangenome construction, annotation, variant analysis, visualization, and quality control could therefore help reduce workflow fragmentation and facilitate the application of pangenomics to microbial, agricultural, and biomedical research.
Methods
Panscape Framework and Workflow Integration
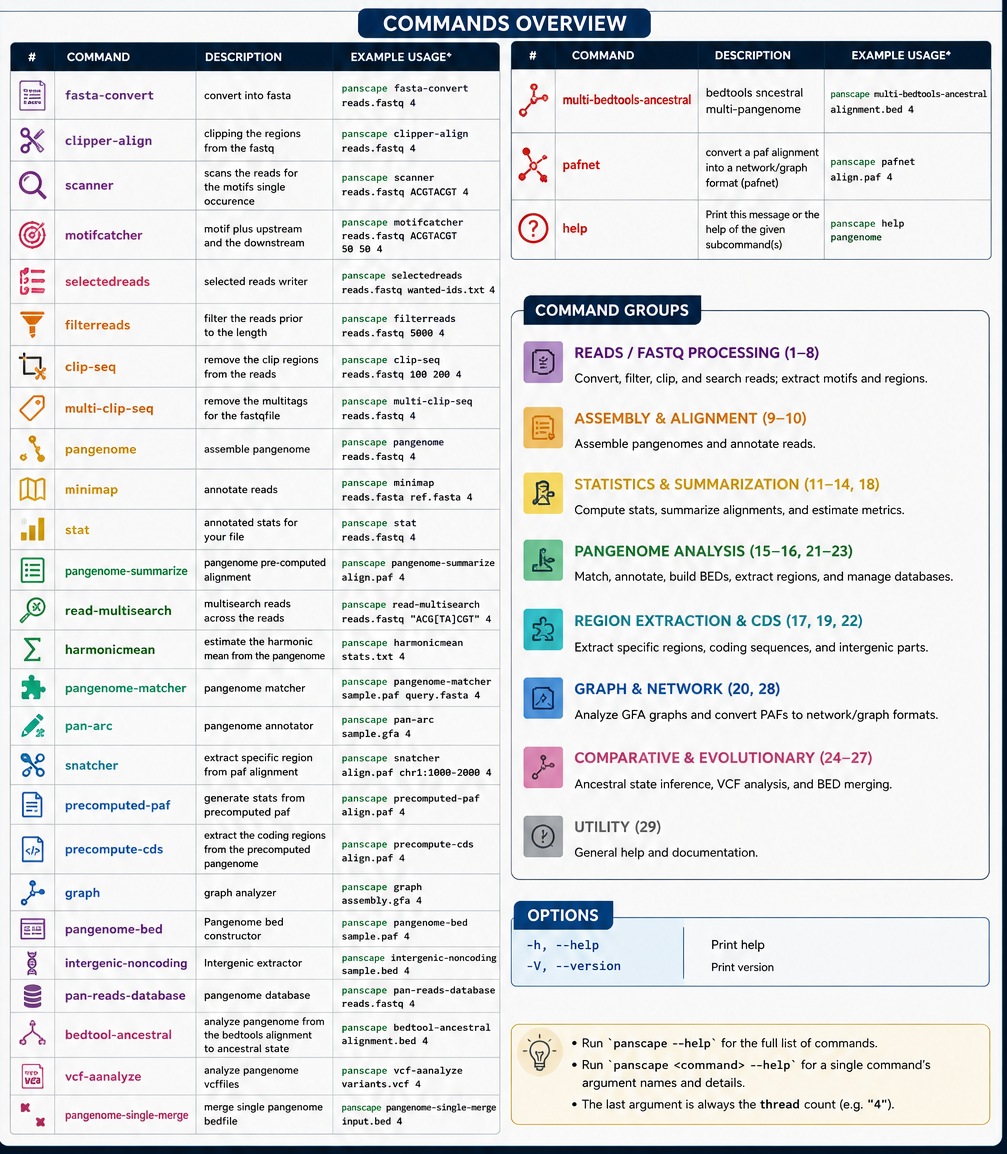
Panscape is implemented as a single Rust command-line executable and is distributed through Codeberg (https://codeberg.org/gsablok/panscape). The framework was designed to support downstream processing, comparison, and interpretation of pangenomic outputs rather than to replace specialized pangenome graph-construction tools. Its 24 subcommands cover several stages of a long-read and graph-oriented pangenomics workflow, including sequence preprocessing, alignment and annotation, graph summarization, variant comparison, and pangenome database construction (Figure 1; Supplementary Table 1).
The preprocessing components support format conversion, sequence-length filtering, motif and regular-expression scanning, and adapter or tag removal from FASTA and FASTQ files. For alignment and annotation, Panscape supports read alignment using minimap2-derived outputs, extraction of coding sequences and messenger RNA features from GFF annotations, and coding-sequence extraction based on miniprot results. The framework also provides utilities for comparing and summarizing PAF alignments, matching cross-alignments, extracting regions from alignment-guided sequences, and summarizing GFA-based pangenome graphs. Additional subcommands support VCF-based variant comparison, ancestral-state analysis, and construction of a pangenome database using SQLite-backed read storage.
Panscape is complemented by two Bash-based workflows: Longpan (https://codeberg.org/gsablok/longpan), which supports long-read pangenome construction and annotation, and Graphpan (https://codeberg.org/gsablok/graphpan), which supports graph-oriented pangenome processing. In this workflow, Panscape functions as an ancillary analysis layer for interpreting, comparing, and summarizing outputs generated by pangenome graph aligners, variant-calling procedures, and assembly and annotation pipelines. The assembly and database workflow integrates hifiasm, compleasm, and miniprot, with SQLite used to support read storage and retrieval.
Each subcommand accepts an explicit thread-count parameter. Internally, this parameter controls a Rayon-based parallel execution pool, allowing users to adjust computational parallelism according to the available hardware. The framework therefore provides a unified command-line interface while retaining the ability to process individual workflow components independently.
Functional Validation
Functional correctness was evaluated using a bundled test set containing GFA graphs, PAF alignments, paired FASTA files, and a real PacBio HiFi FASTQ dataset. Validation was performed for commands with predefined reference outputs, including graph summarization, cross-PAF matching, and PAF-guided FASTA region extraction. The generated outputs were compared with the corresponding reference files using checksums. A command was considered functionally consistent when its output was byte-identical to the expected reference output.
This validation strategy was designed to test deterministic output generation for representative graph, alignment, and sequence-extraction operations. It does not constitute a biological accuracy assessment of the underlying assemblies, alignments, annotations, or variant calls. Instead, it evaluates whether the implemented Panscape operations reproduce the expected computational results for the supplied test cases.
Benchmark Design
The effect of implementation-level optimizations was evaluated by comparing an original build with an optimized build of the same Panscape codebase. The optimized implementation incorporated buffered input and output, a corrected FASTA-parsing routine, Rayon-based parallelization support, and reductions in algorithmic complexity. Both builds were compiled with the same Rust toolchain, rustc 1.75, and the default Cargo release profile.
Synthetic datasets consisting of 20,000-bp reads were generated at three input sizes: 15, 50, and 100 MB. For each size, both FASTA and FASTQ files were prepared. FASTQ files included randomly generated Phred-like quality strings to provide a quality-score field during format-specific processing. Each command, input size, and file-format combination was executed with a single thread. Wall-clock time was measured using date +%s.%N, and program output was redirected to /dev/null to minimize the influence of output writing on the measured runtime. The reported time for each combination was the best result from three runs.
The benchmark environment contained one available CPU core (nproc = 1). Accordingly, the experiment was designed to isolate the effects of parsing, I/O, and algorithmic optimizations. It did not evaluate the scaling behaviour of the Rayon-based parallel implementation on multi-core systems. The results should therefore be interpreted as single-thread implementation benchmarks rather than as measurements of the maximum throughput achievable by Panscape on production hardware.
Results
Functional Validation
Panscape reproduced the expected outputs for the tested graph, alignment, and sequence-extraction operations. For graph summarization, cross-PAF matching, and PAF-guided FASTA region extraction, the generated files were byte-identical to the bundled reference outputs according to checksum comparison. These findings support the functional consistency of the tested subcommands on the supplied GFA, PAF, FASTA, and PacBio HiFi FASTQ examples. The validation also demonstrates that Panscape can operate across several commonly used pangenomic intermediate formats. In particular, the framework can summarize graph representations in GFA format, process alignment relationships represented in PAF format, and extract sequence regions guided by those alignments.
Benchmark Performance
Across the 18 tested combinations of input format, dataset size, and command, the optimized build was faster than the original implementation in 17 cases. Observed speedups ranged from 1.05-fold to 2.32-fold (Supplementary Table 2). The largest improvement was observed for the scanner command on the 15-MB FASTA dataset, which achieved a 2.32-fold speedup. The stat command showed a 1.67-fold improvement on the same input size. For most commands, the performance advantage remained above 1.2-fold when processing 100-MB inputs, indicating that the optimizations were not restricted to the smallest test files. The benchmark also identified one reported regression. The filterreads command on the 100-MB FASTQ input was described as approximately 6% slower in the optimized build, and the 50-MB FASTQ condition showed only a marginal improvement of approximately 1.05-fold. The reported regression was reproduced across five additional runs, suggesting that it was not attributable solely to measurement noise. This result indicates that optimization effects were command- and format-dependent, with FASTQ processing imposing a different performance profile from FASTA processing (Table 1). The timing results should be interpreted (Supplementary Table 1) within the constraints of the experimental design. Because all runs used one thread and a single-core environment, they measure the effects of non-threading implementation changes and do not establish how Panscape scales with additional CPU cores.
Scope of the Contribution
Taken together, the validation and benchmark results indicate that Panscape provides a functionally consistent and performance-oriented support layer for several pangenomic data products. Its principal contribution is workflow integration: read and sequence preprocessing, annotation support, PAF and VCF comparison, GFA graph summarization, region extraction, and database construction are exposed through one command-line framework. This breadth complements specialized graph-construction and gene-clustering applications by providing utilities for the processing and interpretation of their outputs. The current evaluation nevertheless supports a bounded conclusion. Panscape demonstrated reproducible outputs on the supplied validation cases and improved single-thread runtime in most of the tested synthetic-data conditions. It did not yet establish biological accuracy, cross-platform robustness, multi-core scalability, or superiority over specialized tools for individual pangenomic tasks. These dimensions should be addressed in future evaluations using standardized datasets, independent implementations, explicit memory measurements, and benchmarks spanning short-read, HiFi, and ultra-long-read sequencing technologies.
Author Contributions
GS conceived the software, coded the software and wrote the paper.
Conflicts of Interest
GS declared there is no conflict of interest.
References
- Aggarwal, S. K.; Singh, A.; Choudhary, M.; Kumar, A.; Rakshit, S.; Kumar, P.; Bohra, A.; Varshney, R. K. Pangenomics in microbial and crop research: Progress, applications, and perspectives. Genes 2022, 13(4), 598. [Google Scholar] [CrossRef] [PubMed]
- Beier, S.; Thomson, N. R. Panakeia – A universal tool for bacterial pangenome analysis. BMC Genom. 23 2022, 265. [Google Scholar] [CrossRef] [PubMed]
- Eizenga, J. M.; Novak, A. M.; Sibbesen, J. A.; Heumos, S.; Ghaffaari, A.; Hickey, G.; Chang, X.; Seaman, J. D.; Rounthwaite, R.; Ebler, J.; Rautiainen, M.; Garg, S.; Paten, B.; Marschall, T.; Sirén, J.; Garrison, E. Pangenome graphs. Annu. Rev. Genom. Hum. Genet. 21 2020, 139–162. [Google Scholar] [CrossRef] [PubMed]
- Gautreau, G.; Bazin, A.; Gachet, M.; Planel, R.; Burlot, L.; Dubois, M.; Perrin, A.; Médigue, C.; Calteau, A.; Cruveiller, S.; Matias, C.; Ambroise, C.; Rocha, E. P. C.; Vallenet, D. PPanGGOLiN: Depicting microbial diversity via a partitioned pangenome graph. PLoS Comput. Biol. 2020, 16(3), e1007732. [Google Scholar] [CrossRef] [PubMed]
- Golchha, N. C.; Nighojkar, A.; Nighojkar, S. Bacterial pangenome: A review on the current strategies, tools and applications. In Medinformatics; 2024. [Google Scholar]
- Horsfield, S. T.; Tonkin-Hill, G.; Croucher, N. J.; Lees, J. A. Accurate and fast graph-based pangenome annotation and clustering with ggCaller. Genome Res. 2023, 33(9), 1622–1637. [Google Scholar] [CrossRef] [PubMed]
- Hyun, J. C.; Monk, J. M.; Palsson, B. O. Comparative pangenomics: Analysis of 12 microbial pathogen pangenomes reveals conserved global structures of genetic and functional diversity. BMC Genom. 2022, 23, 7. [Google Scholar] [CrossRef] [PubMed]
- Iranzadeh, A.; Mulder, N. Bacterial pan-genomics. In Microbial Genomics in Sustainable Agroecosystems; Springer, 2019; pp. 21–38. [Google Scholar] [CrossRef]
- Lassalle, F.; Veber, P.; Jauneikaite, E.; Didelot, X. Automated reconstruction of all gene histories in large bacterial pangenome datasets and search for co-evolved gene modules with Pantagruel. In bioRxiv; 2019. [Google Scholar] [CrossRef]
- Liu, D.; Zhang, Y.; Fan, G.; Sun, D.; Zhang, X.; et al. IPGA: A handy integrated prokaryotes genome and pan-genome analysis web service. In iMeta; 2022. [Google Scholar] [CrossRef] [PubMed]
- Puente-Sánchez, F.; Hoetzinger, M.; Buck, M.; Bertilsson, S. Exploring environmental intra-species diversity through non-redundant pangenome assemblies. Mol. Ecol. Resour. 2023, 23(7), 1724–1736. [Google Scholar] [CrossRef] [PubMed]
- Tonkin-Hill, G.; MacAlasdair, N.; Ruis, C.; Weimann, A.; Horesh, G.; Lees, J. A.; Gladstone, R. A.; Lo, S.; Beaudoin, C.; Floto, R. A.; Frost, S. D. W.; Corander, J.; Bentley, S. D.; Parkhill, J. Producing polished prokaryotic pangenomes with the Panaroo pipeline. Genome Biol. 21 2020, 180. [Google Scholar] [CrossRef] [PubMed]
- Tiwary, B. K. Evolutionary pan-genomics and applications. In Pan-genomics: Applications, challenges, and future prospects; Elsevier, 2020; pp. 65–80. [Google Scholar]
- van den Brandt, A.; Jonkheer, E. M.; van Workum, D. J. M.; van de Wetering, H.; Smit, S.; Vilanova, A. PanVA: Pangenomic variant analysis. IEEE Trans. Vis. Comput. Graph. 2024, 30(8), 4895–4909. [Google Scholar] [CrossRef] [PubMed]
- Zekic, T.; Holley, G.; Stoye, J. Pan-genome storage and analysis techniques. In Comparative Genomics: Methods and Protocols (Methods in Molecular Biology; Springer, 2018; Vol. 1704, pp. 29–53. [Google Scholar]
- Zhao, Q.; Feng, Q.; Lu, H.; Li, Y.; Wang, A.; Tian, Q.; Zhan, Q.; Lu, Y.; Zhang, L.; Huang, T.; et al. Pan-genome analysis highlights the extent of genomic variation in cultivated and wild rice. Nat. Genet. 50 2018, 278–284. [Google Scholar] [CrossRef] [PubMed]
- Zhou, Z.; Charlesworth, J.; Achtman, M. Accurate reconstruction of bacterial pan- and core genomes with PEPPAN. Genome Res. 2020, 30(11), 1667–1679. [Google Scholar] [CrossRef] [PubMed]

Table 1.
Comparative analysis of pangenome software and panscape.
| Feature | panscape | PGGB | Minigraph-Cactus | Minigraph | Panaroo |
| Primary purpose | Integrated pangenomic workflow | Reference-free pangenome graph construction | Pangenome graph construction | Fast pangenome graph construction | Gene-centric bacterial pangenomics |
| Language / implementation | Rust | Pipeline integrating multiple tools | Cactus + Minigraph ecosystem | C/C++-based tool | Python |
| Raw FASTQ/FASTA processing | Yes | Limited; mainly sequence preparation | Not primary focus | Not primary focus | Primarily assembled genomes/annotations |
| Motif searching | Yes | No | No | No | No |
| Read filtering/clipping | Yes | No | No | No | No |
| PAF analysis | Yes | Uses PAF internally | Yes, through components | Yes | Not its main focus |
| GFA graph analysis | Yes | Core function | Core function | Core function | GML-based gene graph |
| Genome annotation | Yes | Limited/downstream | Limited/downstream | Limited | Core function |
| VCF analysis | Yes | Yes, through vg-related workflow | Yes | Yes/downstream | Not primary |
| Ancestral-state analysis | Yes | Not a primary feature | Not a primary feature | Not a primary feature | Limited |
| Read database | Yes | No | No | No | No |
| Integrated single executable | Yes | No; multiple components | No; multiple components | More focused | Primarily pipeline/software |
| Main strength | Breadth and integration | High-quality reference-free graphs | Complex, scalable genome graphs | Computational efficiency | Gene presence/absence and bacterial genomes |
Disclaimer/Publisher’s Note: The statements, opinions and data contained in all publications are solely those of the individual author(s) and contributor(s) and not of MDPI and/or the editor(s). MDPI and/or the editor(s) disclaim responsibility for any injury to people or property resulting from any ideas, methods, instructions or products referred to in the content. |
© 2026 by the author. Licensee MDPI, Basel, Switzerland. This article is an open access article distributed under the terms and conditions of the Creative Commons Attribution (CC BY) license.
Copyright: This open access article is published under a Creative Commons CC BY 4.0 license, which permit the free download, distribution, and reuse, provided that the author and preprint are cited in any reuse.