
Submitted:
20 September 2026
Posted:
22 September 2026
You are already at the latest version
Abstract
Technological advancements have been responsible for a significant part of the growth in agricultural productivity in recent years. Digital technologies have a high potential to enable the development of the agricultural sector, reshape value chains, and significantly contribute to more productive, resilient, and transparent food systems; however, their adoption in Brazil remains uneven due to regional disparities and structural bottlenecks. The research investigated this problem to build and validate the Digital Technology Adoption Conditioning Analysis Model (MAC-AgriTech), through a case study with Brazilian agricultural data, encompassing the identification of conditioning factors, their territorial evaluation, and the proposition of actions, while providing structured data collection and analysis instruments. The spatial analysis revealed deep territorial asymmetries, concentrating resources and infrastructure in the South and Southeast regions. Econometric modeling demonstrated that digital adoption is primarily driven by the producer’s digital familiarity, connectivity quality, and property scale, with 77% of producers identifying acquisition and maintenance costs as the primary barrier. The transition to digital agriculture in Brazil requires targeted, multidimensional public policies—such as expanded rural connectivity, technical training, and subsidized credit—to overcome regional gaps, and to increase agricultural competitiveness, efficiency, and sustainability.
Keywords:
digital technologies
; adoption conditioning factors
; digital agriculture
; public policies
; agricultural economics
1. Introduction
The global agrifood system faces severe systemic pressures associated with continuous population growth, accelerated urbanization, and the undeniable impacts of climate change, demanding innovative responses to ensure food security without compromising natural resources. In Brazil, agribusiness accounts for approximately 23% of the Gross Domestic Product (GDP), sustaining the country’s position as one of the world’s leading food exporters [1].
Historically, national agricultural productivity growth has been driven by technological innovations: between 1975 and 2015, technological gains accounted for 59% of the growth in the gross value of production, drastically outperforming labor (25%) and land (16%) [2]. In this context, digital technologies—encompassing the Internet of Things (IoT), Artificial Intelligence (AI), advanced georeferencing, robotics, and blockchain-based traceability networks—emerge as the primary vector to increase operational efficiency, reduce costs, and mitigate climatic risks.
Despite their great potential and various government and private initiatives, the adoption of these tools at the farm level remains uneven. Market surveys indicate that approximately 50% of farmers use or consider precision agriculture solutions, highlighting a significant share of producers left behind in the innovation process [3]. Academic literature points out that technological incorporation is not homogeneous, being strongly modulated by local and regional conditioning factors. Given this problem, the objective of this study was to propose and validate the Digital Technology Adoption Conditioning Analysis Model (MAC-AgriTech), providing structured instruments to support private strategies and public policies.
2. Materials and Methods
2.1. State of the Art and Identification of Conditioning Factors
The investigation of the state of the art was structured through a systematic review based on the PCC acronym (Population/Problem, Concept, and Context), using the international scientific databases Web of Science and Scopus for the period between 2016 and 2024. The search string combined synonyms related to determinants, adoption of digital technologies/precision agriculture, and rural properties, resulting in an initial selection of 103 original and review articles after eliminating duplicates.
The bibliometric analysis performed with the Bibliometrix package (R) evidenced a strong annual growth trend in publications on the topic, with recent expressive peaks, reflecting the scientific urgency to understand the bottlenecks of agricultural digitalization. Geographically, China, Brazil, Italy, and the United States stand out as the main poles of scientific production in the field.
Through a detailed Synthesis Matrix, the conditioning factors extracted from the literature were consolidated into five fundamental analytical dimensions. The construction of the Synthesis Matrix conceived as a dynamic methodological instrument for the extraction, summarization, and systematic organization of information from the 103 articles selected in the literature review.
As supported in the literature and incorporated into the thesis’s architecture, the matrix does not constitute a rigid or unified model, but rather a tool intrinsically linked to the researcher’s inventiveness and analytical interpretation, serving as essential support for formulating integrative writing and cross-referencing thematic axes [4,5].
In the practical operation of this work, each row of the matrix represented a mapped study broken down into standardized columns—encompassing authorship metadata, alignment with the thesis’s research questions, employed methodologies (such as multi-method approaches, Delphi techniques, regressions, and structural modeling), and the multi-factorial incidence of conditioning factors across economic, social, technological, environmental, and political-institutional dimensions —, thereby enabling the rigorous consolidation of the state of the art regarding the conditioning factors for the adoption of digital technologies in agriculture. The five fundamental analytical dimensions are:
- Economic Factors: Encompass acquisition costs for hardware and software, continuous operational expenses (energy, connectivity), expectations of financial return and profitability, access to subsidized credit lines, and operational scale;
- Social and Human Capital Factors: Involve the producer’s sociodemographic profile (age, education level), experience and familiarity with digital tools, cultural predisposition toward innovation, and risk tolerance;
- Technological and Infrastructure Factors: Consider the perception of ease of use, technology compatibility with actual farm problems, data security and privacy, and the availability of basic network infrastructure (connectivity);
- Environmental and Geographical Factors: Aggregate biophysical and spatial characteristics such as total farm size in hectares, regional location, topographic restrictions, climatic types, and the nature of cultivated crops;
- Political and Institutional Factors: Contextualize the governance environment, access to agricultural cooperatives, support from market-leading companies, technical assistance and rural extension, and the regulatory framework.
The theory of innovation adoption establishes that a farmer’s adherence behavior does not occur in isolation, being conditioned by structural and cognitive constraints. Analyzing conditioning factors helps understand why highly efficient innovations encounter severe barriers in specific territories [6]. While economic factors dictate the financial viability of the investment, social and human capital factors determine the producer’s capacity for intellectual assimilation of the tool. Simultaneously, technological and infrastructure constraints (such as the lack of connectivity) act as insurmountable barriers that paralyze the diffusion of cloud- and IoT-based systems, justifying systemic public planning approaches [7].
2.2. Digital Agriculture and the Evolution of Production Paradigms
Digital technologies rely on digital content through the acquisition and processing of large volumes of data produced throughout the stages of the production chain, from pre-production to post-production, passing through the production phase [8].
The evolution of digital agriculture (Figure 1) represents the successive incorporation of scientific innovations structured into four major technological milestones [9]:
- Agriculture 1.0: based on manual techniques and animal traction, featuring low technological intensity and high vulnerability to climate conditions;
- Agriculture 2.0: characterized by the introduction of heavy mechanization (tractors and harvesters) and the Green Revolution package (monocultures, conventional genetic improvement, and synthetic chemical inputs);
- Agriculture 3.0: defined by the advent of precision agriculture, satellite guidance (GPS), and computer systems for mapping the spatial variability of crops;
- Agriculture 4.0: represents the contemporary stage where the integration of Big Data, IoT, cloud computing, artificial intelligence, and robotics enables process automation and real-time data-driven decision-making.
Digital agriculture has become a fundamental pillar for modern agribusiness, offering a vast range of benefits that drive efficiency, sustainability, and profitability in the sector. Through the collection and analysis of precise data on crops, climate, soil, and other crucial factors, producers can make more assertive management decisions, optimizing the use of inputs such as fertilizers, pesticides, and water, which results in cost reduction and lower environmental impact.
Furthermore, digital agriculture contributes significantly to increasing productivity and product quality, enabling real-time monitoring of crop conditions, early detection of pests and diseases, and localized application of treatments. Process automation and the use of smart machinery also optimize field labor, making it more efficient and less dependent on intensive manual work. In a scenario of growing food demand and challenges imposed by climate change, digital agriculture presents itself as an indispensable tool to guarantee food security in a sustainable and competitive manner.
Modern agricultural management is grounded in data analysis, the central principle of “Precision Agriculture.” This approach recognizes the spatial and temporal variability of crops, advocating the differentiated application of inputs based on precise measurements of the specific needs of each location, thus optimizing profitability [10]. Although global digitization may seem recent, the concept of “Precision Agriculture” emerged in the 1990s, and by the early 2000s, specialized consultancies and equipment for map-guided variable-rate input applications were already available. The major evolution now lies in the vast range of tools and possibilities available, which significantly simplifies this work. Greater accessibility to technologies such as software, sensors, and analysis tools expands opportunities to make agriculture progressively more sustainable and efficient, generating benefits for society.
Across all these terms—such as digital agriculture, precision agriculture, and Agriculture 4.0—digitally obtained data are used to interpret the past, predict future actions and events, and make more timely and precise decisions through constant monitoring [11].
According to the research [12], the main digital technologies adopted in the field include AI, IoT, and Robotics. The Internet of Things (IoT) in agriculture can be defined as a network system composed of smart objects, such as sensors and devices, that autonomously produce and consume information [13,14,15]. Its main objective is to connect the physical world of agriculture to the virtual world, allowing producers and managers to make faster and more accurate decisions based on real-time data. Literature highlights that IoT is fundamental for information gathering (using sensors and cameras to collect soil and plant data), control (automation of irrigation systems and input application), and prediction (using data to forecast failures and trends). The main barrier to the adoption of this technology in Brazil is still the lack of connectivity—a challenge that, once overcome, can drive a new revolution in the field [15].
Artificial Intelligence (AI) in agriculture involves the use of computer systems and algorithms to optimize and automate processes, transforming large volumes of data into valuable information for decision-making [16]. AI is not a single technology, but rather a combination of various tools, such as machine learning and computer vision, which act in synergy to increase productivity, efficiency, and sustainability in the field [8].
Using cameras on drones or machinery to analyze crop images, AI can, for instance, identify and map pests, diseases, or weeds with high precision, enabling targeted input application, which reduces waste and environmental impact [12]. Through the analysis of historical climate, soil, and yield data, AI creates predictive models capable of forecasting crop yield, the best harvest time, or fertilizer requirements, helping producers make more strategic decisions and optimize resources [16].
Georeferencing and Geolocation in agriculture are also digital technologies used to locate points on Earth and utilize this data to improve production and management on rural properties. They are essential technologies for precision agriculture because they allow farming practices to be more efficient and sustainable based on real-time spatial data [17].
Robotics in agriculture refers to the use of robots and automated systems to optimize processes, increase productivity, and enhance sustainability in the field [18]. Robotics in agriculture is not limited to replacing manual labor, but rather multiplying human labor capacity, allowing producers to focus on more strategic tasks involving management and data analysis. Application examples include autonomous tractors and sprayers, harvesting and sorting robots, and weed-control robots (such as small robots that use artificial intelligence to identify and remove weeds either mechanically or through localized spraying, significantly reducing the amount of herbicides used in the crop) [19].
The concept of Blockchain in agriculture refers to the application of distributed ledger technology to create a secure, immutable, and decentralized digital registry system. Its main objective is to increase transparency and trust throughout the production chain, from farm to final consumer [20]. One of its primary functions is to assist in traceability and product authenticity along the production chain, as blockchain allows every stage of a product’s lifecycle (planting, harvesting, processing, transport) to be recorded, creating an altered-proof digital history. Consumers can, for example, use a QR code to verify a product’s origin, ensuring its authenticity and food safety [15].
Digital agriculture plays a crucial role throughout the agribusiness supply chain, transcending direct benefits to producers in the field. By optimizing on-farm management and production, it positively impacts subsequent stages such as storage, transport, processing, and distribution of agricultural products. Enhanced traceability provided by digital technologies ensures greater transparency and food safety for consumers, enabling the monitoring of food origin and production conditions. Furthermore, the logistical efficiency provided by digital supply chain management reduces losses and costs, benefiting all links from the input supplier to the final consumer, thus strengthening the competitiveness and sustainability of the entire agrifood system.
2.3. Proposal and Methodology
From a methodological perspective, this study is characterized as applied research with a mixed approach (quantitative and qualitative), structured through technical survey procedures and a case study. As supported by [21], a case study constitutes an in-depth empirical investigation of a delimited object, capable of capturing the complexity of real-world phenomena within their own context.
Thus, the investigation combined the use of secondary and official statistical databases with primary data collection via questionnaires applied to rural producers and experts, enabling not only the mapping of territorial asymmetries in Brazilian agriculture, but also the construction, statistical testing, and validation of the technological adoption conditioning analysis model.
The structure under the Digital Technology Adoption Conditioning Analysis Model (MAC-AgriTech), implemented five rigorous methodological steps:
- Step 1 (Scoping and Planning): formal definition of the research problem and analytical hypotheses aimed at testing regional asymmetries, the centrality of human capital, and the efficacy of models based on primary data. Given the context already presented, this research sets out to investigate the following problem: how to analyze the conditioning factors for the adoption of digital technologies in agriculture through structured data instruments, in order to support strategies for expanding digital transformation in the sector?”
- Step 2 (Model Construction and Identification of Conditioning Factors): exhaustive mapping of the state of the art via systematic review (PCC), bibliometric analysis using the Bibliometrix package (R), and consolidation into a Synthesis Matrix, resulting in a taxonomy of 25 conditioning variables organized across the five theoretical dimensions. To analyze the conditioning factors at the national level, a territorial survey using secondary data was conducted, including searches on official institutional websites and support from experts. In addition, more than 20 data requests were submitted to the Federal Government’s Open Data Portal using the Freedom of Information Act form. Below is the table with the conditioning 11 factors used (Figure 2), as these were the ones from which information could be extracted from Brazilian databases.
- Step 3 (Data Collection - Secondary): a dual phase involving, first, the gathering of government open data via the Brazilian Access to Information Law (LAI), highlighting structural variables extracted from the Brazilian Agricultural Census [22]. The data were tabulated by municipality to calculate the percentages of establishments possessing each conditioning factor, categorized into scores from 1 to 3 according to percentage ranges (< 35%, 35%–75%, and > 75%). Using the R software and IBGE shapefile files, a spatial map of the average indices per municipality was generated, complemented by a correlation analysis between the variables.
- Step 3 (Data Collection – Primary): Due to the temporal lag of official databases, primary data collection was structured through the Plataforma AgriTech Brasil (https://plataforma-agrotech.com), developed in Python. This platform was developed for this study and is freely available for anyone in the world to use. The platform features two modules: the diagnostic module, aimed at rural producers to input data and access reports, and the data visualization module, intended for policymakers to analyze strategic data. The form captured 94 valid responses from rural producers. In the diagnostic module, the rural producer receives a customized report containing their data, their Digital Technology Conditioning Factors Availability Index (ICT) — calculated using a normalized formula from 0% to 100% based on four dimensions —, comparisons with state and national averages, and maturity bands inspired by statistical quartiles (Low up to 25%, Medium between 25% and 75%, and High above 75%).
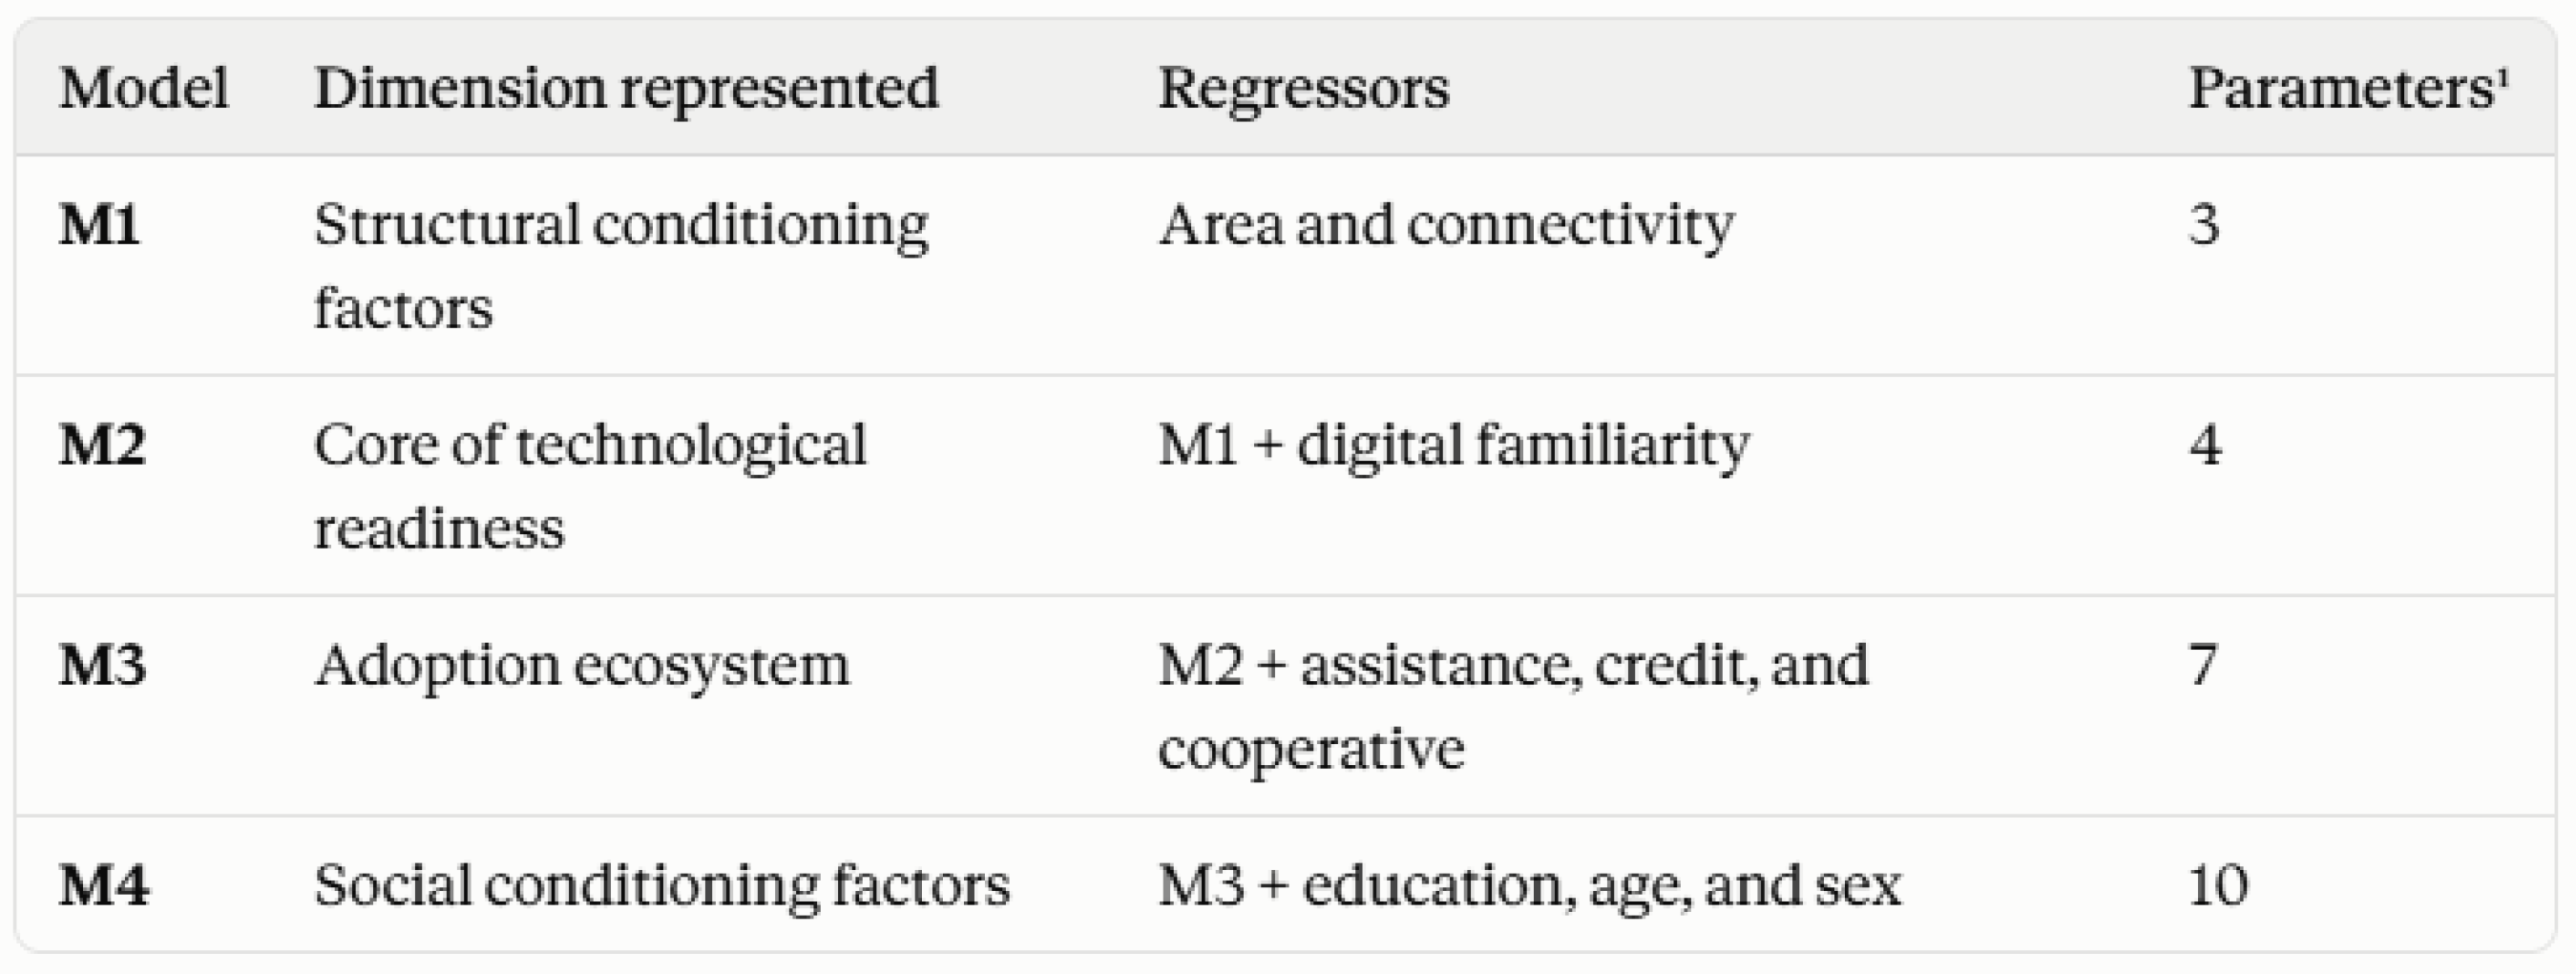
- Step 4 (Statistical and Spatial Analysis): robust analytical treatment comprising territorial mapping in Geographic Information Systems (SIG) via R and the construction of Pearson correlation matrices to evaluate associations among basic infrastructures. To measure the contribution of conditioning factors to the probability of digital adoption, Firth’s Penalized Logistic Regression was applied—an advanced statistical method developed to correct small-sample bias and overcome quasi-complete data separation issues. Model fit and predictive performance (M1 to M4) (Table 1), were validated using Receiver Operating Characteristic (ROC) curves, Area Under the Curve (AUC), Brier scores, leave-one-out cross-validation (LOOCV), and bootstrap resampling with 2,000 replications;
- Step 5 (Public Policy Formulation and Evaluation): translation of analytical outputs into practical recommendations through structured consultation with 9 public and private sector specialists. Specialists evaluated the maturity degree (1–5 Likert scale) of current Brazilian public instruments mapped for each main conditioning (e.g., FUST, 5G auctions, Harvest Plans, Inovagro lines, and Digital ATER) and defined priorities and adoption bottlenecks across six nationally prominent supply chains (Coffee, Fruit growing, Grains, Horticulture, Sugarcane, and Cotton).
3. Results
3.1. Territorial Analysis and Conditioning Availability (Secondary Data)
Spatial mapping from the Brazilian Agricultural Census microdata revealed a deep structural asymmetry nationwide (Figure 3). The Southern region stood out with approximately 85% of its municipalities classified in the upper tiers of infrastructure availability, followed by the Southeast (16%). Conversely, no municipality in the North, Northeast, and Center-West regions reached the highest scale tiers, concentrating the lowest index values. Pearson correlation matrices showed robust positive associations between basic infrastructure indicators: cooperative access strongly correlated with electrical grid access (r=0.85), as did internet access with electrical power (r=0.77), empirically proving that electricity acts as an unavoidable systemic prerequisite for rural digitalization.
3.2. Determinants of Technology Adoption (Primary Data and Modeling)
The analysis of the rural producers’ sample indicated an overall condition availability index of 45.4% (medium). The demographic profile revealed a predominantly mature audience (29% aged 55 to 65) and male gender (66%), families averaging 4 members, and a strong concentration in micro-properties (60% with up to 50 ha), with soybeans as the leading specific crop (19%). Regarding the conditioning factors, commercialization, education, and digital familiarity showed the highest availability, while credit, private support, and technical assistance represented the lowest relative bottlenecks. Concerning technologies, sensors/IoT lead adoption (45%), with water management being the main perceived value vector (49%), whereas the high cost of acquisition and maintenance stands out overwhelmingly as the primary barrier (77%).
Estimation of the four Firth logistic regression specifications indicated model M2 as the most parsimonious and best-fitted (lowest AIC and BIC), showing that digital adoption is directly associated with three main vectors (Figure 4):
- Digital Familiarity: producers with moderate or high familiarity showed adoption odds 9.06 times higher (OR=9.06; 95%CI:3.13-29.75; p<0.001) compared to those with low familiarity, highlighting the central weight of human capital.
- Connectivity: each increase in network infrastructure level multiplied adoption odds by 3.77 (OR=3.77;95%CI:1.28-13.59; p=0.015).
- Property Scale: moving up a cultivated area bracket showed an odds ratio of 3.27 (OR=3.27;95%CI:1.53-8.32; p=0.001).
Regarding friction points declared in the field, acquisition, installation, and maintenance costs stood out as the primary barrier (77%), followed by a lack of trained personnel (24%) and difficulty in measuring economic gains (22%).
Descriptive results indicate higher technology adoption rates among producers with specialized technical assistance (82.1% vs. 51.5%), access to rural credit (73.7% vs. 51.8%), and cooperative membership (71.8% vs. 52.7%). However, it is noteworthy that these are raw associations and do not control potential confounding factors, such as larger land size, better connectivity, or digital familiarity.
3.3. Specialist Evaluation Across Crop Chains
Qualitative evaluation with specialists showed that technological demands vary according to agronomic specifics: considering the overall and final averages obtained for the main applications for the adoption of digital technologies, the following order was observed: 1) Input efficiency (59%), highlighting fruit growing; 2) Water and energy management (58%), highlighting horticulture; 3) Production management (57%), highlighting coffee; 4) Agricultural machinery management (50%), highlighting sugarcane and grains; 5) Logistics management (35%), highlighting sugarcane; 6) Integration with the productive chain (34%), highlighting fruit and vegetable production.
The overview of the main drivers for the adoption of digital technologies demonstrated that: 1) Productivity Enhancement leads across all chains (average of 94%), recording levels between 88% and 100%; 2) Climate/Phytosanitary Vulnerabilities come next, with an average of 85%; 3) Market Demands (ESG) (average: 75%); and 4) The Social Factor (average: 32%) occupies the lowest positions in the motivations for technology adoption in most crops, except in Horticulture, which breaks this pattern by raising the social vector to 78%.
The overview of the main conditioning factors for technology adoption that need to be improved demonstrated that: 1) connectivity emerges as the most critical cross-cutting bottleneck across practically all chains, leading demands in coffee (100%), grains (89%), fruit growing (78%), horticulture (78%), sugarcane (75%), and cotton (75%); 2) the need for improvements in machinery and training exhibits high and complementary rates across crops, standing out in equipment upgrades for cotton (88%) and grains (78%), as well as in workforce training for fruit growing (78%) and cotton (88%); 3) while the vast majority of crops prioritize network technology and machinery, horticulture stands out by concentrating its main challenge on the pursuit of specialized technical assistance (89%
4. Discussion
Based on the research’s methodological structure, considering all steps from planning to model validation and the insights gained through the practical application of the developed instruments and the case study conducted, the Conditioning Analysis Model for Technology Adoption in Agriculture (MAC-AgriTech) (Figure 5) was reorganized and deepened into five sequential and cyclical steps, as shown in Figure 36 and detailed below
-
Step 1: Planning and scope delimitation
- ○
- Objective: Establish the methodological foundations and the spatial/sectoral scope of the investigation.
- ○
-
Actions:
- ▪
- Definition of the unit of analysis (municipalities, agricultural hubs, or individual rural establishments).
- ▪
- Selection of production chains, if applicable (e.g., grains, coffee, horticulture, sugarcane, fruit growing, and cotton).
- ▪
- Formulation of research questions and analytical hypotheses regarding the factors that facilitate or hinder digital transformation.
- ○
-
Instruments:
- ▪
- Review of academic and grey literature;
- ▪
- Bibliographic analysis;
- ▪
- Synthesis matrix;
- ▪
- Investigation planning.
- ○
-
Deliverables:
- ▪
- Investigation target audience;
- ▪
- Research questions and hypotheses;
- ▪
- Investigation schedule.
-
Step 2: Identification of Conditioning Factors
- ○
- Objective: Map the multi-factorial set that conditions technological adoption in the field.
- ○
-
Actions:
- ▪
- Structuring of conditioning factors;
- ▪
- Structuring of the dimensions of analysis for the conditioning factors of interest.
- ○
-
Instruments:
- ▪
- Categorization, descriptive grouping, or classification.
- ○
-
Deliverables:
- ▪
- List of conditioning factors of interest, divided by analysis dimensions.
-
Step 3: Data collection (secondary and/or primary)
- ○
- Objective: Seek data that portrays the reality of the availability of conditioning factors and their contribution to the adoption of digital technologies.
- ○
-
Actions:
- ▪
- Survey of available secondary data, such as agricultural census and profile, credit, training and technical assistance, and infrastructure;
- ▪
- Application of primary data collection instruments;
- ▪
- Data processing.
- ○
-
Instruments:
- ▪
- Online and free platform provided by the thesis: https://plataforma-agrotech.com/diagnostico;
- ▪
- Government systems such as SIDRA/IBGE, Rural Credit Matrix/BACEN, among others.
- ○
-
Deliverables:
- ▪
- Data spreadsheet (secondary research);
- ▪
- Data spreadsheet (primary research).
-
Step 4: Analyses
- ○
- Objective: Perform an evaluation of the obtained data, extracting the factors of greatest relevance for industrial policies.
- ○
-
Actions:
- ▪
- Application of the Agricultural Conditioning Availability Index (ICA), used in this thesis;
- ▪
- Statistical Modeling: application of logistic regression (such as Firth’s estimator) to identify the contribution of conditioning factors to the adoption of digital technologies;
- ▪
- Analysis of the sample profile and other information, such as most adopted digital technologies and implementation barriers.
- ▪
- Analysis of expert opinion on the main applications of digital technologies in agriculture, main drivers, main crops, and main conditioning factors to be improved.
- ○
-
Instruments:
- ▪
- Conditioning Availability Index (including territorial heat maps and radar charts);
- ▪
- Logistic regression (such as Firth’s estimator);
- ▪
- Expert consultation (with mean analysis and chart generation);
- ▪
- Analysis form for the main applications of digital technologies in agriculture, main drivers, main crops, and main conditioning factors to be improved.
- ○
-
Deliverables:
- ▪
- Evaluation of the availability of conditioning factors;
- ▪
- Evaluation of the contribution of these conditioning factors to the adoption of digital technologies;
- ▪
- Evaluation of the sample profile and other data;
- ▪
- Evaluation of expert opinion on the main applications of digital technologies in agriculture, main drivers, main crops, and main conditioning factors to be improved.
-
Step 5: Suggestions for Improvements and Public Policies
- ○
- Objective: Translate analytical findings into practical guidelines for public and private intervention.
- ○
-
Actions:
- ▪
- Review of academic and grey literature to identify the main public policy instruments aimed at the elements of analysis;
- ▪
- Consultation with experts on other instruments and suggestions for new instruments, based on the diagnosis already carried out in the investigation;
- ▪
- In-depth analysis of available data: analysis of credit operations, for example, to evaluate the concentration of resources, borrower profiles, and the terms/costs of indebtedness aimed at modernization, contributions to productivity, and connectivity and training priorities;
- ○
-
Instruments:
- ▪
- Expert consultation (with mean analysis and chart generation);
- ▪
- Public policy suggestion form;
- ▪
- Econometric analysis.
- ○
-
Deliverables:
- ▪
- Public policy suggestions.
The development and validation of the MAC-AgriTech model successfully bridged the methodological gap between macro-territorial diagnostics and micro-level behavioral analysis of rural producers. Findings prove that the transition to Agriculture 4.0 does not rely solely on commercial equipment availability but requires the prior consolidation of cross-cutting pillars: qualified human capital (digital familiarity), stable connectivity infrastructure, and appropriate operational scale.
5. Conclusions
The advancement of digital agriculture represents an inescapable vector for sustainable development, climate resilience, and global food security, proving to be an essential tool to meet the growing demand for food without increasing pressure on natural resources. In the Brazilian context, the agricultural sector plays a strategic economic and social role; however, the incorporation of digital-based and precision technological innovations still occurs in a deeply heterogeneous manner.
Faced with this problem, this thesis proposed and validated the Conditioning Analysis Model for Digital Technology Adoption in Agriculture (MAC-AgriTech), structuring quantitative and qualitative instruments capable of mapping, explaining, and guiding digital transformation in the field.
The investigation began with the formulation of four research questions and a set of structured hypotheses to uncover the conditioning factors of technological adoption. Through a systematic literature review and the construction of a synthesis matrix grounded in classical premises of scientific methodology, it was found that the adoption of 4.0 technologies in the field is not an isolated phenomenon, but the reflection of a multidimensional matrix composed of economic, social, technological, environmental, and institutional factors.
The case study conducted, combining data retrieval from official statistical bases (such as the IBGE Agricultural Census) and primary data collection via a digital platform with rural producers and experts, made it possible to answer the core objectives of the research and consolidate important findings:
- Territorial and Regional Asymmetries: spatial analysis revealed a clear concentration of infrastructure and resources in the South and Southeast regions, while the North and Northeast regions face severe basic structural bottlenecks. The strong positive correlation identified between access to electricity, connectivity, and cooperative ties demonstrates that overcoming the digital divide depends on integrated investments in essential public infrastructure.
- Technological Adoption and Predictability: the application of advanced statistical models, notably Firth’s penalized logistic regression, proved that the adoption of digital technologies is dictated primarily by three core pillars: the producer’s digital familiarity, the quality of connectivity, and the scale of the property. Robustness tests and internal validation confirmed that the parsimonious model focused on these predictive cores exhibits excellent discriminatory capacity and probabilistic quality.
- Sectoral Heterogeneity and Experts’ View: the breakdown of the analysis into specific crops (coffee, fruit growing, grains, horticulture, sugarcane, and cotton) revealed that each sector has distinct priorities. While grains and sugarcane demand heavy automation and machinery fleet management, coffee and fruit growing concentrate their pain points on production management, phytosanitary monitoring, and market requirements (ESG). Furthermore, the evaluation by experts and the examination of institutional credit portfolios demonstrated that current public policy instruments still lack capillarity and focused attention toward small and medium producers, running into critical barriers of price, lack of trained personnel, and insufficient network signal.
The work fills a gap in specialized literature by proposing a unified model that connects macro-territorial diagnosis to the micro-analysis of rural producer behavior. From a practical and applied standpoint, the provision of the digital platform (AgriTech Brazil Platform) and the public policy evaluation matrix delivers operational decision-support tools to society, cooperatives, financial institutions, the sector, and government policymakers. This enables the design of multidimensional interventions — such as the expansion of rural connectivity networks, the promotion of digital literacy laboratories, and the creation of unbureaucratic credit lines for 4.0 equipment.
However, limitations inherent to this study are recognized, grounded in the temporal lag of official secondary databases in Brazil and the cross-sectional nature of the primary data collected, which prevents purely causal long-term inferences. As directions for future research, the sample expansion of the diagnostic form to new municipalities and production chains is recommended.
As a contribution of the research, in addition to the model and data presented, the AgriTech Brazil Platform is available online and free of charge to anyone wishing to use it. Furthermore, from the insights gained through this research, the researcher submitted contributions to IBGE for the 2027 Agricultural Census, serving as a relevant contribution in terms of data collection and advancements in public policies for the sector.
In short, the MAC-Agro model consolidates itself as a replicable instrument aligned with the contemporary challenges of Brazilian agriculture, providing a robust framework to guide digital transformation strategies in the field toward a more productive, efficient, and sustainable future.
6. Patents
The software registration request for the AgriTech Brazil Platform was filed with the Brazilian National Institute of Industrial Property, through the AUSPIN Agency of the University of São Paulo, under protocol number PC-2026-0063.
Data Availability Statement
The secondary data supporting the spatial analysis were obtained from the Brazilian Institute of Geography and Statistics (IBGE) Agricultural Census and are publicly available at https://censoagro2017.ibge.gov.br/. The primary survey data and interactive diagnostic tools generated during this study are openly accessible via the Plataforma AgriTech Brasil at https://plataforma-agrotech.com. The source code and supplementary verification files are archived and publicly available in the institutional repository associated with the research.
Abbreviations
The following abbreviations are used in this manuscript:
| Acronym/Term | Translation/Full Name |
| MAC-AgriTech | Conditioning Analysis Model for Digital Technology Adoption in Agriculture |
| ICT/ICA | Digital Technology Conditioning Factors Availability Index |
| PCC | Population, Concept, and Context |
| OR | Odds Ratio |
| AIC/BIC | Akaike Information Criterion/Bayesian Information Criterion |
| ROC/AUC | Receiver Operating Characteristic/Area Under the Curve |
| LOOCV | Leave-One-Out Cross-Validation |
| IoT | Internet of Things |
| AI | Artificial Intelligence |
| ESG | Environmental, Social, and Governance |
| GPS | Global Positioning System |
| IBGE | Brazilian Institute of Geography and Statistics |
| CEPEA | Center for Advanced Studies in Applied Economics |
| BACEN | Central Bank of Brazil |
| AUSPIN | USP Innovation Agency |
| INPI | National Institute of Industrial Property |
| LAI | Access to Information Law |
| ATER | Technical Assistance and Rural Extension |
| FUST | Fund for the Universalization of Telecommunications Services |
References
- CEPEA/CNA. PIB do agronegócio 2024. Available at: https://www.cepea.org.br/br/pib-do-agronegocio-brasileiro.aspx. Accessed on: Apr/25.
- EMBRAPA. Trajetória da Agricultura Brasileira. 2018. Available at: https://www.embrapa.br/en/visao/trajetoria-da-agricultura-brasileira. Accessed on: Jun/23.
- MCKINSEY. “A mente do agricultor brasileiro na era digital”. 2021.
- KLOPPER, Rembrandt; LUBBE, Sam; RUGBEER, Hemduth. The matrix method of literature review. In: Induction to Research Methodology. Potchefstroom: North-West University, 2007.
- BOTELHO, Louise de Lira Roedel; CUNHA, Cristiano Castro de Almeida; MACEDO, Marcelo. O método da revisão integrativa nos estudos organizacionais. Gestão & Sociedade, v. 5, n. 11, p. 121–136, 2011. [CrossRef]
- SUNDING, David; ZILBERMAN, David. The agricultural innovation process: research and technology adoption in a changing agricultural sector. In: GARDNER, B. L.; RAUSSER, G. C. (Ed.). Handbook of Agricultural Economics. Amsterdam: Elsevier, 2001. v. 1, p. 207-261.
- SOUZA, F; BUAINAIN, A; SILVEIRA, J.; VINHOLIS, M. Condicionantes da adoção de inovações tecnológicas na agricultura. Cadernos de Ciência & Tecnologia, Brasília, v. 28, n. 1, p. 223-255, jan./abr. 2011.
- MASSRUHÁ, S. M. F. S. et al. (Ed.). Agricultura digital: pesquisa, desenvolvimento e inovação nas cadeias produtivas. Brasília, DF: Embrapa, 2020.
- BAZZI, C. L.; SCHENATTO, K.; SOBJAK, R. Conceitos sobre o Agro 4.0 e Indústria 4.0. In: DIAS, M. et al. (Org.). Agro 4.0: fundamentos, realidades e perspectivas para o Brasil. Rio de Janeiro: Autografia, 2023. p. 44-57.
- FERRAZ, N. Agricultura de precisão e agricultura digital na prática: os benefícios das tecnologias digitais para o agronegócio. Cap. 5. Livro Agro 4.0: Fundamentos, Realidades e Perspectivas para o Brasil. Rio de Janeiro, RJ. 2023. ISBN: 978-85-518-5052-7.
- KLERKX, Laurens; JAKKU, Emma; LABARTHE, Pierre. A review of social science on digital agriculture, smart farming and agriculture 4.0: New contributions and a future research agenda. NJAS: Wageningen Journal of Life Sciences, v. 90-91, p. 100315, 2019. [CrossRef]
- BOLFE, E. L. et al. Agricultura digital no Brasil: tendências, desafios e oportunidades. Campinas: Embrapa, 2020.
- MIORANDI, Daniele et al. Internet of things: Vision, applications and research challenges. Ad Hoc Networks, v. 10, n. 7, p. 1497-1516, 2012. [CrossRef]
- TAN, L.; WANG, N. Future internet: The internet of things. 3rd International Conference on Advanced Computer Theory and Engineering (ICACTE), v. 5, p. V5-376-V5-380, 2010.
- SILVA, E. C. Internet of Things (IOT): um estudo exploratório em agronegócios. 2018. 147f. Dissertação (Mestrado em Ciência da Computação) - UFRGS, Porto Alegre, 2018.
- JORGE, L. A. C. et al. Tecnologias em agricultura inteligente: Eficiência e sustentabilidade. Research, Society and Development, v. 10, n. 4, 2021.
- SOUSA, M. M. et al. Uso de georreferenciamento e sensoriamento remoto na agricultura. Jornacitec Botucatu, n. 1, p. 1-8, 2024. [CrossRef]
- INAMASU, R. Y. et al. Agricultura de precisão e agricultura digital. TECCOGS – Revista Digital de Tecnologias Cognitivas, n. 20, p. 17-36, jul./dez., 2014.
- VALDIERO, A. C. et al. Tecnologias Inovadoras Aplicadas em Sistemas Agrícolas. Anais do Conbea, 2016.
- MOUGAYAR, W. Blockchain para negócios: promessa, prática e aplicação da nova tecnologia da internet. Rio de Janeiro: Alta Books, 2018.
- MARCONI, Marina de Andrade; LAKATOS, Eva Maria. Fundamentos de metodologia científica. 8. ed. São Paulo: Atlas, 2017.
- IBGE. Censo Agropecuário Brasil 2017. Available at: https://censoagro2017.ibge.gov.br/. Accessed on: Aug/25.
Figure 1.
The evolution of digital agriculture.
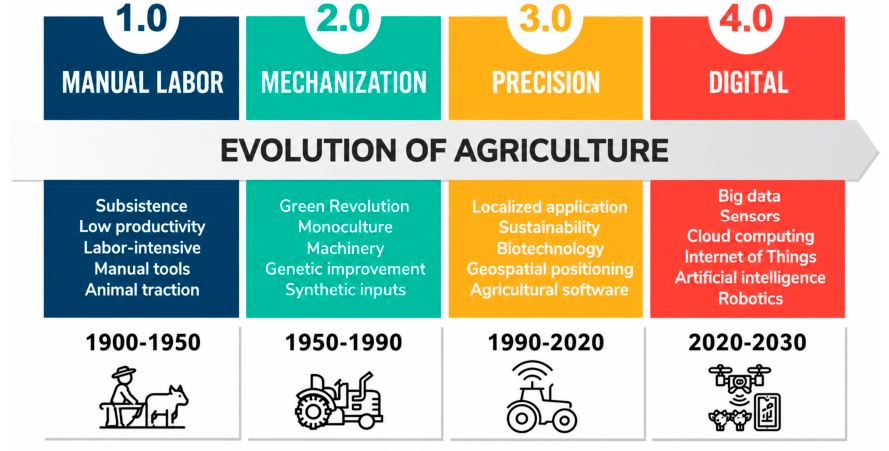
Figure 2.
Conditioning factors for the adoption of digital technologies.
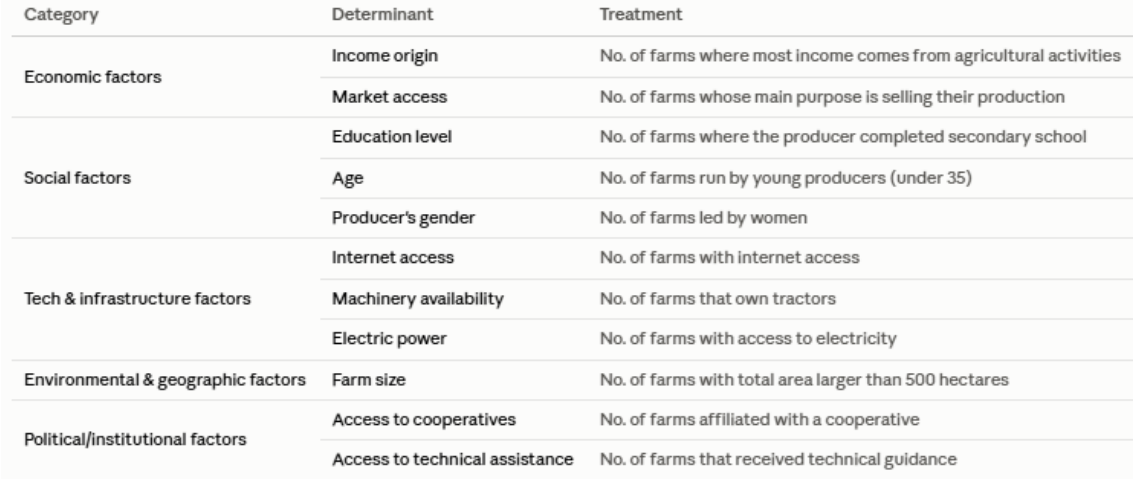
Figure 3.
Spatial map of the municipal index of conditioning factors availability.
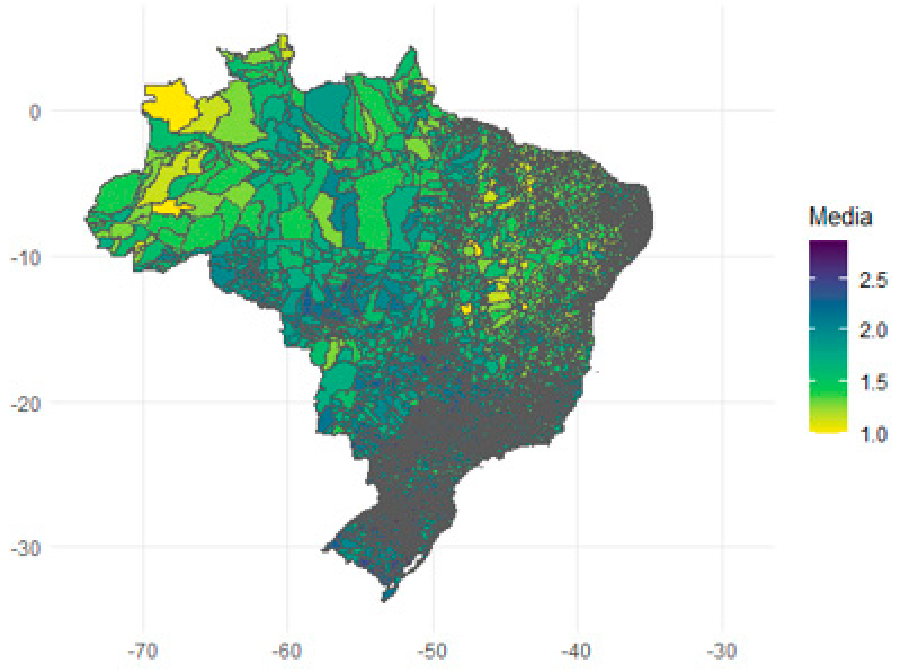
Figure 4.
Observed rates of digital technology adoption.
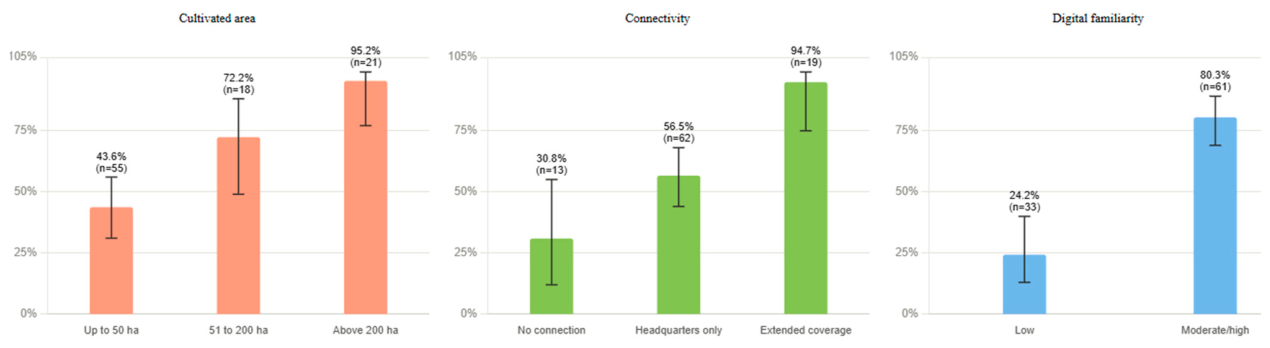
Figure 5.
Model for analyzing conditioning factors for technology adoption.
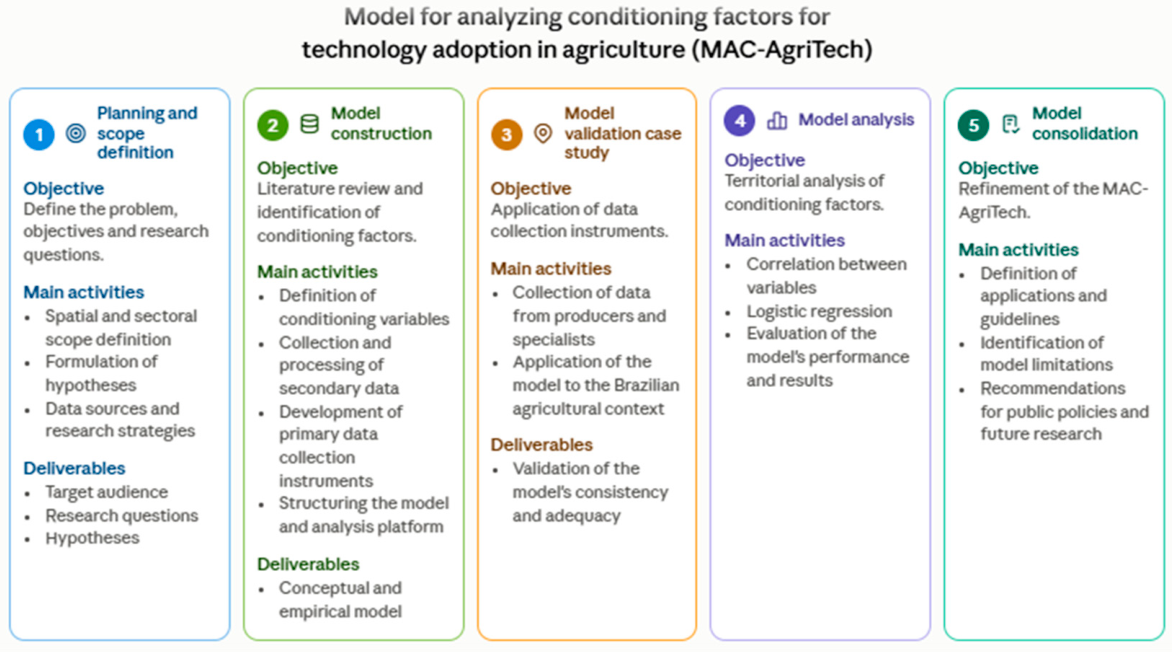

Table 1.
Description of the estimated specifications.
Disclaimer/Publisher’s Note: The statements, opinions and data contained in all publications are solely those of the individual author(s) and contributor(s) and not of MDPI and/or the editor(s). MDPI and/or the editor(s) disclaim responsibility for any injury to people or property resulting from any ideas, methods, instructions or products referred to in the content. |
© 2026 by the authors. Licensee MDPI, Basel, Switzerland. This article is an open access article distributed under the terms and conditions of the Creative Commons Attribution (CC BY) license (http://creativecommons.org/licenses/by/4.0/).
Copyright: This open access article is published under a Creative Commons CC BY 4.0 license, which permit the free download, distribution, and reuse, provided that the author and preprint are cited in any reuse.