
Submitted:
21 September 2026
Posted:
22 September 2026
You are already at the latest version
Abstract
β2-Microglobulin (β2M) is an important biomarker associated with kidney dysfunction, dialysis-related amyloidosis, and inflammatory disorders, motivating the development of highly sensitive detection platforms. Here, we propose a nonlinear terahertz (THz) sensing platform based on graphene-enhanced third-harmonic generation (THG) for β2M detection. Unlike conventional graphene plasmonic sensors that rely on linear resonance shifts, the proposed approach exploits the strong dependence of graphene’s nonlinear optical response on its Fermi energy. Adsorption of charged β2M molecules alters graphene’s carrier concentration and Fermi energy, resulting in measurable changes in the THG response.
The sensor consists of periodically patterned graphene micro-ribbons coupled to a gold substrate through a thin Kerr nonlinear dielectric spacer, forming a resonant metasurface with strong THz field confinement. The combined effects of graphene plasmonic resonances and cavity-enhanced field localization significantly enhance THG at relatively low incident intensities. The effects of graphene Fermi energy, dielectric thickness, and excitation intensity on the sensing performance are systematically investigated.
The results demonstrate concentration-dependent shifts in the THG spectral response and intensity, with increasing β2M concentration producing a progressive shift toward higher frequencies. The proposed sensor detects β2M concentrations as low as 0.0001 g/L, achieving a sensitivity of 971 THz·L/g and a figure of merit (FOM) of 1706 L/g. These results demonstrate improved detection performance compared with conventional linear plasmonic sensing and highlight the potential of graphene-enhanced THG metasurfaces for sensitive, tunable, and compact THz biosensing and biomedical diagnostics.
Keywords:
Third Harmonic Generation
; biosensor
; Electric double layer
; electrolyte gating
; graphene
1. Introduction
Biosensors have emerged as crucial analytical platform for early disease diagnosis [1], personalized medicine [2] and biomolecular analysis [3]. Based on the International Union of Pure and Applied Chemistry (IUPAC), a biosensor combines a biological recognition element with a transducer to alter biochemical interactions into measurable signals [4]. Between different detecting platforms, optical biosensors have attracted considerable attention due to their high sensitivity, rapid response, and label-free detection capabilities [5]. They have been remarkably applied for the sensing of biomolecules include proteins [6], nucleic acids [7], antibodies [8], and disease biomarkers [9], enabling applications in medical diagnostics [10], environmental monitoring [11] and biotechnology [12].
Advancement in nanophotonics and two-dimensional materials have opened new gates for nonlinear optical biosensing, while nonlinear optical effects have become fundamental to a wide range of advanced photonic technologies, such as laser frequency conversion [13], ultrashort pulse generation [14], all-optical signal processing [15], and ultrafast optical switching [16]. These influences are also increasingly important in nanoscale photonic devices, where robust light–matter interactions can significantly increase optical responses. Between two-dimensional materials, graphene has attracted considerable attention due to its exceptionally large third-order nonlinear optical susceptibility, making it a perfect candidate for third-harmonic generation (THG)-based sensing [17]. In contrast with conventional linear sensing approaches that depend on changes in reflectance or resonance conditions, THG-based biosensors use the nonlinear interaction between intense electromagnetic fields and graphene, enabling enhanced sensitivity to local refractive-index variations induced by biomolecular binding events [18]. These specific nonlinear characteristics make graphene a promising material for the development of highly sensitive and compact optical biosensors. [19,20]. In essence, nonlinear optics evaluates how materials react to high intensity light where the polarization no longer scales linearly with the electric field. Under such conditions, traditional linear phenomena-such as reflection, refraction, and scattering, which appear mainly from photon-electron interactions-occur alongside much weaker nonlinear contributions. These nonlinear processes begin with effective photon-photon interactions and typically come into view only under strong electromagnetic fields. However, in suitably engineered materials or structures that boost local field strength, nonlinear responses can be Strongly enhanced, supporting higher efficiency and stronger functional effects [21,22]. The field of nonlinear optics is generally considered to have begun with the observation of second-harmonic generation (SHG) by Franken and colleagues in 1961, shortly after Maiman demonstrated the first functioning laser in 1960. Optical effects are referred to nonlinear when a material’s response to an electromagnetic field no longer scales relatively with the field’s strength. A familiar case is SHG, which emerges from components of the atomic polarization that shift with the square of the applied field. Consequently, the output at twice the fundamental frequency increases approximately with the square of the incident laser intensity [23].
Among various 2D material, Graphene shows significantly high nonlinear optical pattern when exposed to an electromagnetic field. Due to the linear energy dispersion of its Dirac fermions, graphene exhibits noticeable nonlinear responses, especially in the terahertz and microwave regimes. Its nonlinear optical properties have been extensively investigated through techniques including four-wave mixing, which show that graphene exhibits a very large third-order optical susceptibility that alters only somewhat with wavelength in the infrared range. Additionally, this third-order nonlinearity can be controlled electrically, permitting tunability of the optical response. Generally, the nonlinear pattern of an optical medium arises from its optical constants due to the influence of intense electromagnetic fields [24]. Graphene’s crystal lattice belongs to the D6h point group, which is categorized as a centrosymmetric two-dimensional material. Due to this inversion symmetry, all second-order nonlinear optical processes are forbidden in pristine graphene under the electric-dipole approximation. Consequently, phenomena like SHG, second-order susceptibility (2), and connected second-order nonlinear conductivities do not happen intrinsically in pristine monolayer graphene [25]. On the other hand, graphene exhibits remarkably high third-order nonlinear optical pattern. particularly, its third-harmonic generation (THG) efficiency is sufficiently strong compared to various traditional bulk materials, due to its linear energy dispersion, high carrier mobility, and strong light–matter interaction at atomic scale. These third-order effects-including THG, Kerr nonlinearity, and four-wave mixing-enable graphene to act as a strong platform for nonlinear photonic devices [25]. In the THG phenomenon frequency with generated by an applied field at frequency where three photons of frequency are destroyed and one photon with frequency is created in this process [24,25,26,27].
This study reports an integrated atomistic and optical modelling framework for investigating the sensing of β2-microglobulin (β2-m) through third-harmonic generation (THG) in graphene-based sensing platforms. The computational approach combines SDA version 7.2.2 software, GROMACS, and COMSOL Multiphysics version 6.2 to capture the molecular interactions and their corresponding optical responses across multiple length scales. Emphasis is placed on the wild-type β2-m monomer and its interaction with the graphene surface during the early stages of adsorption. The primary objective is to examine how adsorption-induced conformational changes, charge redistribution, and interfacial physicochemical interactions influence the optical characteristics of the device. By establishing a direct connection between protein-level molecular patterns and theoretically measurable third-harmonic signals, the framework provides valuable insights into the mechanisms governing graphene-based biosensing performance. Here, the sensing response is evaluated from the resonance-frequency shift of the third-harmonic generation (THG) spectrum, with the resonance position determined from the THG response under different analyte concentrations. Accordingly, the reported sensitivity and figure of merit characterize the nonlinear THG-based readout of the proposed graphene plasmonic structure. The present study focuses on identifying a plasmonic configuration that maximizes the THG resonance shift under identical operating and analyte conditions. A direct quantitative comparison between linear and THG readouts using the same structure, analyte model, and noise assumptions is beyond the scope of the present work and will be considered in future studies.
In this work, graphene has an initial Fermi energy of approximately 0.3 eV, with the Dirac point around 2 V. The negatively charged β-2M (−2e) is treated as an external electrostatic charge rather than as direct charge transfer to graphene. Its presence in the electrolyte modifies the electric double layer (EDL), resulting in a change in graphene’s carrier density and Fermi energy. Thus, the key mechanism considered here is EDL-induced electrostatic gating
2. Theory and Design of Experiment:
Figure 1. illustrates the geometry of the suggested nonlinear graphene metasurface. Metasurfaces are two-dimensional metamaterials whose subwavelength-scale unit cells (meta-atoms) can be geometrically engineered to precisely control the phase, amplitude, and polarization of light, enabling high-performance optical devices and advanced manipulation of light propagation [30]. The design features an array of graphene nanoribbons placed on a dielectric, which is homogeneously and periodically arranged to top a gold substrate. The dielectric material has a refractive index of 2.1, and the gold substrate maintains a constant thickness of 1 μm. To minimize reflection and absorption of scattered waves at the boundaries, perfectly matched layers (PMLs) are applied at both the top and bottom of the structure. The overall diagram of this setup is shown in Figure 1. The computational domain is discretized using a highly refined mesh.
Graphene’s optical properties arise from its unique two-dimensional band structure and are governed by intraband and interband electronic transitions [28,29,30]. These transitions enable broadband optical conductivity, ultrafast carrier dynamics, and strong light–matter interaction, making graphene highly suitable for photonic and optoelectronic applications [28,29,30]. The linear optical conductivity related to intraband transitions is generally described by the Drude dispersion model, defined as [31,32]:
Were
is the electron relaxation time that accounts for the optical loss, e is the electron charge, angular frequency, and ħ is the reduced Planck constant [31,32]. The linear conductivity of graphene depends on the wave frequency, Fermi energy, and electron relaxation time, which is influenced by temperature, external fields, sample quality, and substrate material, according to
Where is the mobility of the graphene sample and is the Fermi velocity . It has been reported that the mobility of graphene may go beyond at room temperature and the value of is in the picosecond range [24]. Because of its 2D nature, graphene has a sub-nanometer thickness, which can be neglected in numerical modelling and considered as a surface current. The linear component of this surface current is written as:
Where is the electric field along the x-direction on the surface [24]. The nonlinear optical response of Graphene, generally, can be expressed in terms of the nonlinear surface conductivity tensor (). It described as follows [24,25,26]:
And
With θ(z) as the Heaviside step function, the third-order conductivity is dominated by its imaginary part, while scattering and thermal effects are neglected [24,25,26,27]. In third-harmonic generation (THG), three photons at the fundamental frequency () combined to generate one photon at , satisfying energy conservation [24,26]. The resulting nonlinear surface current is given by [24,25,26,27,28,29]
Where N is number of graphene layer. In our computation we used three layers of graphene. Third-order nonlinear effects in ultra-thin materials, such as graphene, are naturally weak, which needs high input intensities to create noticeable nonlinear responses. Meanwhile these high inputs, the resulting nonlinear signals are often small, limiting the overall efficiency of nanoscale optical devices [31,32,33]. In the nanoscale, increasing nonlinear effects depended on vitally on the high confinement of the optical field and its spatial overlap with the material. Plasmonic and metasurface structures can provide this confinement by concentrating light into deep subwavelength volumes, thus enhancing light–matter interactions. Hence, both theoretical and experimental attempts in nonlinear nano photonics have been directed toward designing structures that maximize near-field enhancement and mode overlap, enabling higher performance third-order nonlinear processes in ultra-thin materials [34].
Plasmonic is the study and manipulation of light at the nanoscale, focusing on how electromagnetic waves interact with collective electron oscillations in metals, known as surface plasmons [35]. In application optical devices, metallic plasmons are often limited by ohmic losses and the intrinsically fixed features of metals, which cause energy dissipation as heat and limit the propagation length of plasmonic waves. Moreover, the superficial penetration of electromagnetic waves into metals means that the optical response of bulk metals is mainly governed by weak light-matter interactions near the metal-dielectric interface. At the nanoscale, on the other hand, surface plasmon polaritons (SPPs) can greatly improve light-matter interactions, allowing increased nonlinear optical phenomena [36]. Graphene plasmonic has attracted great focus because of its capability to confine electromagnetic energy at scales below the wavelength of light. A main property of graphene is its strong near- confinement allowed by surface plasmon polaritons (SPPs). Despite metals, graphene’s optical response can be actively adjusted by applying gate voltage or chemical doping, making it a highly flexible material for optoelectronic applications. Its two-dimensional structure permits SPP-induced field enhancement to surpass what is generally possible in conventional metallic systems. In addition, graphene shows relatively low losses at high carrier densities, further growing its attraction for photonic and optical devices. These features make graphene a favorable candidate for modern applications such as optical sensing, photonic switching, and communication technologies [36,37].
The main goal of this research is to design a highly sensitive graphene-based sensor based on third harmonic generation (THG) to detect remarkably low concentrations of biomolecules like a β₂-microglobulin (β₂M). β₂M is a small (~12 kDa), non-glycosylated protein that constitutes the light chain of a major histocompatibility complex class I (MHC-I) molecules, expressed on nearly all nucleated cells [38]. It is continuously released into circulation and primarily eliminated via renal filtration, making its serum concentration a reliable indicator of kidney function [39]. In healthy individuals, β₂M levels typically fall within 1-3 mg/L, whereas significantly elevated concentrations are associated with renal dysfunction, inflammatory conditions, and hematological malignancies [40]. In patients undergoing long duration hemodialysis patients, β₂M can accumulate up to 20-60 mg/L, contributing to protein aggregation and dialysis-related amyloidosis [41]. Furthermore, β₂M serves as a clinically relevant prognostic marker in disorder such as myeloma and lymphoma, where its levels correlate with disease progression and tumor burden [42].
The sensing mechanism considered in this work is based on the electrostatic coupling between β₂M adsorption at the graphene/electrolyte interface and the electronic properties of graphene. To establish a connection across length scales, we combined atomistic molecular-dynamics simulations with continuum electrostatic calculations and electromagnetic simulations of the THG response. The resulting workflow is made of the following steps: (i) molecular characterization of β₂M adsorption on graphene, (ii) representation of the resulting interfacial charge perturbation within the electrolyte, (iii) calculation of the corresponding electric-double-layer (EDL) response and graphene electrostatic gating, and (iv) evaluation of the resulting modification of the THG spectrum.
The molecular-scale description of β₂M adsorption on graphene are obtained from Molecular Dynamics (MD) simulations reported in Maschio’s PhD thesis [43,44], which highlight the role of the protein in reshaping the electric double layer (EDL) at the interface. The simulations indicate that the protein preferentially adsorbs onto graphene adopting a stable orientation, where specific amino acids residues establish direct contact with the surface. The most stable orientation of the protein on graphene, obtained from enhanced sampling simulations using Temperature Replica Exchange Molecular Dynamics (T-REMD), is shown in Figure 2. These simulations, with an aggregated sampling time of 3.1 μs, were carried out using the OPLS-AA force field and the SPC/E water model within the GROMACS simulation package [45].
These results reveal that β₂M tends to adopt a predominantly horizontal orientation relative to graphene sheet (Figure 2). Among the protein residues in contact with the surface at distances smaller than 3.5 Å, ASP34, GLU36, GLU44 carries a negative charge, ARG45, LYS48 and ARG81 carry a positive charge, while the remaining residues are neutral. This local charge distribution contributes to local modulation of the electrostatic potential at the interface, depending on the overall protein charge.
The adsorption of β₂M onto graphene leads to a detectable and stable modification of the interfacial electrostatic environment, owing to its size and net charge. This, in turn, affects the surface potential and influences the sensor response [46]. The sensing mechanism assumes an aqueous electrolyte environment, consistent with physiological conditions, where β₂M is present in solution and interacts with the graphene surface. The atomistic results provides the molecular basis for the continuum electrostatic description. In the continuum model, β₂M is represented by an effective charged object positioned at the graphene/electrolyte interface, while retaining the dimensions and net electrostatic character identified from the atomistic simulations. For the purposes of the present model, β₂M is approximated as a sphere with an estimated diameter of ≈ 3.0 nm and with a computed hydrodynamic diameter in the range of 4.5–5.0 nm, as estimated using HYDROPRO10 [44], accounting for hydration effects relative to an equivalent spherical volume. The protein diameter, derived from atomistic simulations, is incorporated as an input parameter in the COMSOL-based calculations.
In the present model, the net charge of β₂M is treated as an external electrostatic perturbation rather than as direct charge transfer to graphene. This distinction is important because the sensing mechanism considered here is electrostatic gating mediated by the EDL. Applying a gate voltage creates an electrical double layer (EDL) at the graphene/electrolyte interface, composed of the Helmholtz layer (including adsorbed species such as β₂M) and the diffuse Gouy–Chapman layer, inducing charge redistribution in graphene and shifting its Fermi level to tune its electronic properties. Graphene’s quantum capacitance, arising from its low density of states near the Dirac point, acts in series with the EDL capacitance to define the effective capacitance and control charge accumulation [47]. This combined effect enhances local electric fields, improves third harmonic generation efficiency, and enables highly sensitive detection of low biomolecule concentrations, making the system promising for advanced biosensing applications such as protein detection and medical diagnostics [48,49].
Our model is based on the change in the Fermi energy of the graphene layer induced by a specific concentration of the target molecule. To establish the concentration-to-optical-response relationship, the β₂M concentration is first used to calculate the electrostatic potential generated in the electric double layer (EDL) at the graphene/electrolyte interface. This potential acts as an external gate potential and modifies the carrier density of graphene according to
where is the EDL capacitance and is the elementary charge. The corresponding Fermi-energy shift is then calculated as
where is the Fermi velocity and is the residual carrier concentration. Thus, the concentration- dependent optical response follows the sequence [53,54]:
The model which is used for Electric Double layer (EDL) is stern model which is described as below [51,52,53,54]:
Where its Helmholtz layer and Gouy-Chapman capacitance which computed as below respectively:
Where is the permittivity of free space, the relative permittivity of the electrolyte inside the Helmholtz layer and size of the solvated particle [54].
Where is a Debye length which given by for a monovalent electrolyte, where is the concentration of the electrolyte, is the electric charge and is the thermal energy [54].
To achieve our purpose, we apply incident wave with an intensity of is incident vertically from the top with transverse magnetic (TM) polarization from the first port, while the second port is located at the bottom of the structure. Photons with frequency ω are extinguished, and third-order harmonic (TH) radiation with a frequency of 3ω is generated. The thickness of the backside metal, assumed to be gold, is chosen to be much larger than its THz skin depth. As a result, the metallic layer functions as a perfect reflecting mirror, achieving zero transmission. The optical constants of gold in the terahertz range are described using the Drude model as follows [57,58]:
Where is the plasma frequency, is the damping frequency, and is the dielectric constant at in finite frequency. It should be noted that gold exhibits a third-order nonlinear susceptibility of in the near-infrared region. However, its nonlinear framework at low THz frequencies has not been reported in the literature. At these frequencies, gold possesses extremely high conductivity and can be effectively treated as a perfect electric conductor. Consequently, electromagnetic fields do not penetrate the gold, preventing any interaction with its nonlinear properties. Therefore, the contribution of gold to the nonlinear response of the metasurface at low THz frequencies can be considered negligible [58]. This design leverages the unique properties of Graphene, such as its strong nonlinear optical response and tunable bandgap, to enhance third harmonic generation (THG) and other nonlinear effects in the far infrared and THz frequency ranges. By combining localized plasmon-polaritons resonances, and electrical tunability, the proposed metasurface offers significant potential for advanced nonlinear optical applications.
The conversion efficiency (CE) of third-harmonic generation is defined as [32]:
Where is the output power at the third-order harmonic frequency, and is the input power at the fundamental frequency. The output radiation is calculated via
Where is the Poynting vector passing through the boundary curve and is the normal vector to the boundary surface. By normalizing the computed power values, which are given in Watts, this assumption enables us to analyzes the results on a consistent and physically reasonable scale [59]. Although water exhibits strong absorption in the THz frequency range, THz interactions with aqueous electrolytes can still be analyzed through their dielectric response over short propagation distances. In this work, the dielectric properties of the electrolyte solution are described using the Debye–Falkenhagen theory of ionic atmosphere relaxation, which accounts for the frequency-dependent dielectric behavior of electrolyte solutions. According to this theory, the dielectric constant of the solution increases with the square root of the ion concentration and can be expressed as , where is the dielectric constant of pure water, is the electrolyte concentration, and is a coefficient dependent on the electrolyte type. The equations used in this study are established formulations adopted from the literature. The novelty of the present study lies in applying graphene-enhanced THG in the THz regime for β2M detection and analyzing the resulting nonlinear optical response to β2M-induced changes in graphene’s electronic properties [60].
3. Results and Discussion
The proposed structure employs a carefully engineered multilayer configuration optimized to enhance third-order harmonic generation (THG). In this design, the interplay between material dispersion, plasmonic response, and field confinement is tuned to maximize nonlinear interaction within the active region. A comprehensive analysis is conducted to evaluate the absorption and reflection spectra and power outflow characteristics. These optical and electromagnetic responses are examined under varying Fermi energy levels, dielectric layer thicknesses, and carrier relaxation times. The performance of the system is studied across a broad frequency range from 1.5 to 3.5 THz, enabling a detailed assessment of how tunable material parameters influence the nonlinear conversion process. This investigation provides valuable insights into optimizing multilayer photonic platforms for high-efficiency THz harmonic generation.
To further optimize the nonlinear response of the proposed structure, we investigate the influence of key geometric parameters, with particular emphasis on the thickness of the dielectric layer. For this purpose, the previously analyzed factors-absorption, reflection and power outflow-are re-evaluated for different dielectric thicknesses. Figure 3(a–c) illustrates the corresponding results, highlighting how variations in dielectric thickness modify field confinement and consequently alter the overall nonlinear performance of the device. These observations provide a deeper understanding of the geometric tuning mechanisms that can be employed to enhance third-order harmonic generation in multilayer THz structures.
As shown in Figure 3, increasing the dielectric height shifts the resonance peak toward lower frequencies. This shift indicates a transition of the resonant frequency to lower energy. The pattern can be attributed to the decreased vertical confinement of the plasmonic modes and the redistribution of the local electromagnetic field, which effectively increases the optical mode volume and reduces the resonance energy.
The absorption, reflectance, and TH power outflow spectra of the structure are analyzed for various Fermi energies-Ef = 0.2, 0.3, 0.4, 0.46, and 0.5 eV across the same frequency range, with the corresponding results presented in Figure 4a–c. It is evident that each Fermi energy level produces a distinct resonance associated with the excitation of surface plasmon polaritons. This pattern demonstrates that graphene absorbs light at specific frequencies, thereby reducing the transmission of the fundamental field. As Fermi energy increases, the electron population in higher energy states also increases, resulting in a shift of both the resonance frequency and the transmission minimum toward higher values. In these simulations, Fermi energies of 0.2 eV, 0.3 eV, 0.4 eV, and 0.5 eV were used, while the relaxation time was fixed at 0.5 ps and the dielectric thickness at 8 µm. Figure 4a-c, illustrate the absorption, reflectance, and TH power outflow of graphene at different Fermi energies, respectively.
In the next step of our optimization, we investigate the optical performance of the sensor under different carrier mobilities. To achieve this, we use the relationship between relaxation time and the carrier mobility of graphene, as described by Equation (3). This equation indicates a direct correlation between these parameters. Accordingly, in this computation we apply three different relaxation times: 0.3 ps, 0.5 ps, and 0.7 ps. Throughout this analysis, the Fermi energy is fixed at 0.3 eV, and the dielectric thickness is maintained at 8 µm. Figure 5a-c, illustrate the absorption, reflectance, and TH power outflow of graphene at different relaxation time, respectively.
To study the impact of the input field intensity on the generated field power and conversion efficiency, the input intensity was varied from 0.001 to 0.12 MW*cm⁻² at a fixed frequency of 3 THz, as shown in Figure 6. Higher input intensities increase the number of photons in the structure, thereby enhancing the probability of three photons at frequency ω interacting to generate a photon at frequency 3ω. Interestingly, the THG conversion efficiency can reach relatively high values (−65 dB) even at comparatively low fundamental-field input intensities when exciting the proposed nonlinear graphene metasurface. Figure 6 illustrates this variation. In these simulations, the parameters used were a Fermi energy of 0.3 eV a relaxation time of 0.5 ps, and a dielectric thickness of 8 µm.
Figure 7(a–d) illustrates the electric field enhancement under different incident light intensities, demonstrating the relationship between light intensity and field enhancement. As the incident light intensity increases, the electric field enhancement in the graphene-based THG structure also increases. This result indicates that higher excitation intensities lead to stronger electric field localization, thereby enhancing the third-harmonic generation (THG) response of the graphene structure.
In this section, we examine how the proximity of a protein molecule alters the electrostatic environment adjacent to a graphene surface. Building on the theoretical framework introduced earlier, the evaluation of the electric field and potential inside the Electric Double Layer (EDL) begins with the Poisson equation. After establishing the computational domain and boundary conditions, a set of numerical simulations was carried out to extract and compare the relevant electrostatic profiles. These graphical outputs enabled a detailed assessment of the modifications introduced when quantum capacitance is incorporated into the model, particularly regarding the spatial variation of potential and field strength.
Within the compact layer, the electrostatic pattern was determined by solving the Poisson equation, . In contrast, transport in the diffuse region was described using a coupled Nernst–Planck–Poisson formulation to provide a more realistic depiction of ion and protein motion [61,62,63,64]:
together with
Here, , , and represent the diffusivity, charge valence, and concentration of species ; is time; is the Faraday constant; is the universal gas constant; is temperature; is the electrostatic potential; and are the medium and vacuum permittivities; and denotes the net charge density.
Figure 8a and Figure 8b presents the resulting distributions, highlighting the corresponding potential and electric-field patterns formed within the EDL.
In this step, we compute the absorption, reflectance, and third-harmonic power outflow for different concentrations of β2-microglobulin. As discussed in the previous chapter, the presence of this protein in its wild-type form carries a net charge of −2. This negative charge induces electron doping in graphene, leading to an increase in its Fermi energy. Consequently, the optical response of graphene is modified, resulting in a noticeable shift of the absorption and reflectance peaks toward higher frequencies. Figure 9 illustrates this pattern clearly, where increasing the concentration of β2-microglobulin produces a systematic blue shift in the spectral features. This shift arises from the strong coupling between the charged biomolecules and the graphene surface, which alters the carrier density and thus the nonlinear optical properties of the system. Moreover, the enhancement in Fermi energy significantly influences the third-harmonic generation process, leading to changes in the magnitude of the third-harmonic power outflow. These results highlight the sensitivity of graphene’s linear and nonlinear optical responses to biomolecular adsorption, underscoring its potential application as a highly sensitive biosensing platform. In this study, (0.1 mg/L) is considered the lowest simulated concentration of β₂M, rather than a formal limit of detection. This concentration was selected to evaluate the response of the proposed sensing platform at a low, clinically relevant concentration. A true experimental detection limit would require experimental measurements and statistical analysis.
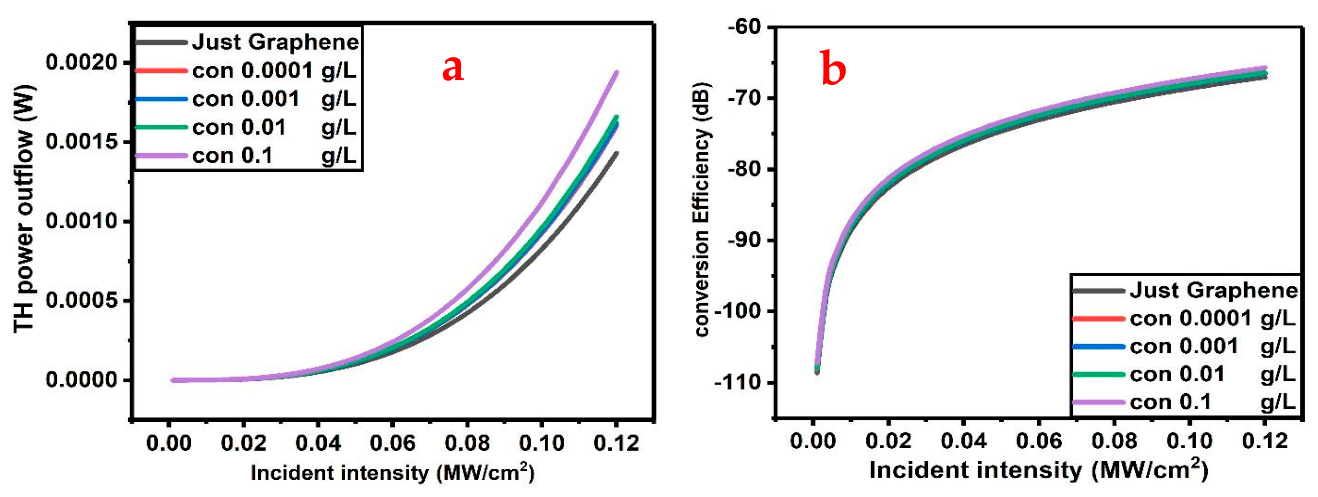
In the final step of our computation, we investigate the conversion efficiency and third-harmonic power outflow as functions of the incident optical intensity. For this purpose, the input intensity is varied from 0.001 MW/cm² to 0.12 MW/cm² for different concentrations of the biomolecule. As shown in the Figure 10, increasing the incident intensity leads to pronounced variations in both the conversion efficiency and the third-harmonic output.
This pattern is attributed to the nonlinear optical response of graphene, where higher input intensities enhance the nonlinear polarization responsible for third-harmonic generation. These results demonstrate that both incident intensity and molecular concentration are key factors in optimizing third-harmonic generation, reinforcing the potential of this system for tunable nonlinear optical and biosensing applications. Figure 10 shows the conversion efficiency and TH power outflow in different incident intensity.
To address in a quantitative fashion the performance of our sensor – namely, sensitivity, accuracy and reliability – we use the following parameters:
Here, f denotes the frequency, c represents the protein concentration, is the peak position of absorption, S indicates the sensitivity, FWHM refers to the full width at half maximum, Q is the quality factor, FOM stands for the figure of merit, SNR denotes the signal-to-noise ratio, and DA represents detection accuracy.

Table 1.
Key parameters influencing the performance of the sensor in different concentrations of β₂-macroglobulin in nonlinear optics.
Table 1.
Key parameters influencing the performance of the sensor in different concentrations of β₂-macroglobulin in nonlinear optics.
| Sensor parameters performance |
β2-M C=0.0001 g/L |
β2-M C=0.001 g/L |
β2-M C= 0.01 g/L |
β2-M C=0.1g/L |
|---|---|---|---|---|
| S (THz*L/g) | 971 | 117.500 | 15.932 | 2.473 |
| FOM (L/g) | 1706 | 198 | 25 | 3.58 |
| Q | 4.31 | 4.17 | 3.99 | 3.77 |
| SNR | .170 | .198 | .253 | .358 |
| DA (1/THz) | 1.75 | 1.68 | 1.58 | 1.44 |
By employing third-harmonic generation (THG) in our sensor design, we achieved a sensitivity of 117.5 THz·L/g and a figure of merit (FOM) of 198 L/g at a β2-microglobulin concentration of 0.001 g/L. In contrast, under the same operating conditions, the sensor operating in the linear regime exhibited a sensitivity of 84.74 THz·L/g and an FOM of 51 L/g [33]. These results demonstrate that the THG-based approach significantly enhances both the sensitivity and overall sensing performance compared to the conventional linear regime. Consequently, the proposed nonlinear sensing strategy offers improved detection capabilities for β2-microglobulin, making it a promising platform for highly sensitive biomarker detection and biomedical diagnostic applications. The results presented in Figure 3, Figure 4, Figure 5, Figure 6, Figure 7, Figure 8, Figure 9 and Figure 10 are based on numerical simulations and have not yet been experimentally validated. Therefore, the predicted sensing performance should be considered theoretical and require experimental verification. Experimental validation and characterization of the proposed sensor will be pursued in future work.
4. Conclusions
In conclusion, this work presents a nonlinear ultrathin graphene metasurface for efficient third-harmonic generation (THG) at terahertz (THz) frequencies under relatively low excitation intensities. The proposed structure combines graphene plasmonic resonances with Fabry–Pérot cavity resonances in the dielectric layer, producing strong electromagnetic field confinement and significantly enhancing the nonlinear response. Owing to graphene’s strong third-order nonlinear conductivity in the THz regime, the metasurface achieves a THG conversion efficiency of approximately −65 dB at an incident intensity of ~0.1 MW·cm⁻², demonstrating its potential for low-power nonlinear THz applications.
The proposed metasurface also provides high tunability and reconfigurability through control of the graphene Fermi energy, dielectric thickness, and carrier relaxation time. These parameters enable effective control of the resonance frequency, nonlinear conductivity, and optical losses, allowing the THG response to be engineered for different operating frequencies. Such flexibility makes the proposed platform suitable for compact and adaptive THz nonlinear optical devices.
Furthermore, the sensing performance was investigated using β2-microglobulin (β2M) as a target biomolecule. Increasing β2M concentration produces a measurable shift of the resonance toward higher frequencies due to the negative charge of the protein and its interaction with graphene, which modifies the effective Fermi energy and plasmonic response. This concentration-dependent behavior demonstrates the strong sensitivity of the nonlinear metasurface to biochemical changes.
Overall, the proposed graphene-based THG metasurface offers a compact, efficient, tunable, and highly sensitive platform for THz frequency conversion and biosensing, with promising applications in integrated THz photonic systems, biomolecular detection, and biomedical diagnostics.
References
- Metkar; Kisan, Sanjay; Girigoswami, Koyeli. Diagnostic biosensors in medicine–a review. Biocatal. Agric. Biotechnol. 2019, 17, 271–283. [Google Scholar] [CrossRef]
- Arya, V.; Kumar, D.; Chaudhary, V. S.; Kumari, S.; Sahu, A.; Sharma, S.; Singh, R. Recent advancements and emerging trends in biosensors: A review on disease diagnosis and personalized Medicine. IEEE Transactions on NanoBioscience 2026. [Google Scholar] [CrossRef]
- Purohit, B.; Vernekar, P. R.; Shetti, N. P.; Chandra, P. Biosensor nanoengineering: Design, operation, and implementation for biomolecular analysis. Sens. Int. 2020, 1, 100040. [Google Scholar] [CrossRef]
- Turner, A.P.F. Biosensors: Sense and sensibility. Chem. Soc. Rev. 2013, 42, 3184–3196. [Google Scholar] [CrossRef]
- Huang, L.; Tian, H.; Zhou, J.; Liu, Q.; Zhang, P.; Ji, Y. Label-free optical sensor by designing a high-Q photonic crystal ring–slot structure. Opt. Commun. 2015, 335, 73–77. [Google Scholar] [CrossRef]
- Piliarik, Marek; Sandoghdar, Vahid. Direct optical sensing of single unlabelled proteins and super-resolution imaging of their binding sites. Nat. Commun. 2014, 5.1, 4495. [Google Scholar] [CrossRef]
- Endo, T.; Kerman, K.; Nagatani, N.; Takamura, Y.; Tamiya, E. Label-free detection of peptide nucleic acid− DNA hybridization using localized surface plasmon resonance based optical biosensor. Anal. Chem. 2005, 77(21), 6976–6984. [Google Scholar] [CrossRef]
- Cunha, D. R.; Marques, S. S.; Alves, P.; Correia-da-Silva, G.; Quinaz, M. B.; Segundo, M. A. Automated renewable label-free optical sensor for quantification of therapeutic monoclonal antibodies. Talanta 2025, 295, 128328. [Google Scholar] [CrossRef]
- Wei, Y.; Zhou, W.; Wu, Y.; Zhu, H. High sensitivity label-free quantitative method for detecting tumor biomarkers in human serum by optical microfiber couplers. ACS Sens. 2021, 6(12), 4304–4314. [Google Scholar] [CrossRef]
- Pirzada, Muqsit; Altintas, Zeynep. Recent progress in optical sensors for biomedical diagnostics. Micromachines 2020, 11.4, 356. [Google Scholar] [CrossRef]
- Long, Feng; Zhu, Anna; Shi, Hanchang. Recent advances in optical biosensors for environmental monitoring and early warning. Sensors 2013, 13.10, 13928–13948. [Google Scholar] [CrossRef]
- Vigneshvar, S.; Sudhakumari, C. C.; Senthilkumaran, B.; Prakash, H. Recent advances in biosensor technology for potential applications–an overview. Front. Bioeng. Biotechnol. 2016, 4, 11. [Google Scholar] [CrossRef]
- Wang, C.; Wen, Y.; Sun, J.; Zhou, J. Recent progress on optical frequency conversion in nonlinear metasurfaces and nanophotonics. ES Mater. Manuf. 2022, 17(2), 1–13. [Google Scholar] [CrossRef]
- Ge, Y.; Zhu, Z.; Xu, Y.; Chen, Y.; Chen, S.; Liang, Z.; Fan, D. Broadband nonlinear photoresponse of 2D TiS2 for ultrashort pulse generation and all-optical thresholding devices. Adv. Opt. Mater. 2018, 6(4), 1701166. [Google Scholar] [CrossRef]
- Koos, C.; Jacome, L.; Poulton, C.; Leuthold, J.; Freude, W. Nonlinear silicon-on-insulator waveguides for all-optical signal processing. Opt. Express 2007, 15(10), 5976–5990. [Google Scholar] [CrossRef]
- Friberg, S. T. E. P. H. E. N. R.; Smith, P. E. T. E. R. W. Nonlinear optical glasses for ultrafast optical switches. IEEE J. Quantum Electron. 1987, 23.12, 2089–2094. [Google Scholar] [CrossRef]
- Hong, S. Y.; Dadap, J. I.; Petrone, N.; Yeh, P. C.; Hone, J.; Osgood, R. M., Jr. Optical third-harmonic generation in graphene. Phys. Rev. X 2013, 3(2), 021014. [Google Scholar] [CrossRef]
- Rostami, Habib; Polini, Marco. Theory of third-harmonic generation in graphene: A diagrammatic approach. Phys. Rev. B 2016, 93.16, 161411. [Google Scholar] [CrossRef]
- Suresh, Sagadevan; Arivuoli, Dakshanamoorthy. Nanomaterials for nonlinear optical (NLO) applications: a review. Rev. Adv. Mater. Sci. 2012, 30.3, 243–253. [Google Scholar]
- Arcangeli, A.; Rossella, F.; Tomadin, A.; Xu, J.; Ercolani, D.; Sorba, L.; Roddaro, S. Gate-tunable spatial modulation of localized plasmon resonances. Nano Lett. 2016, 16(9), 5688–5693. [Google Scholar] [CrossRef]
- Kauranen, Martti; Zayats, Anatoly V. Nonlinear plasmonics. Nat. Photonics 2012, 6.11, 737–748. [Google Scholar] [CrossRef]
- Caridad, J. M.; McCloskey, D.; Rossella, F.; Bellani, V.; Donegan, J. F.; Krstic, V. Effective wavelength scaling of and damping in plasmonic helical antennae. Acs Photonics 2015, 2(6), 675–679. [Google Scholar] [CrossRef]
- Shen, Yuen-Ron. Principles of nonlinear optics; 1984. [Google Scholar]
- Boyd, Robert W.; Gaeta, Alexander L.; Giese, Enno. Nonlinear optics. In Springer Handbook of Atomic, Molecular, and Optical Physics; Springer International Publishing: Cham, 2008; pp. 1097–1110. [Google Scholar]
- Castro Neto, A. H.; Guinea, F.; Peres, N. M.; Novoselov, K. S.; Geim, A. K. The electronic properties of graphene. Rev. Mod. Phys. 2009, 81(1), 109–162. [Google Scholar] [CrossRef]
- Ornigotti, Marco; Carvalho, David N.; Biancalana, Fabio. Nonlinear optics in graphene: theoretical background and recent advances. La. Riv. Del Nuovo Cim. 2023, 46.6, 295–380. [Google Scholar] [CrossRef]
- Cheng, Jin-Luo; Vermeulen, Nathalie; Sipe, J. E. Third order optical nonlinearity of graphene. New J. Phys. 2014, 16.5, 053014. [Google Scholar] [CrossRef]
- Davoudi, Maryam; Zanbouri, Zeinab; Sabaeian, Mohammad. "Enhancing third-order harmonic generation in a graphene-gold grating structure with MgF2 substrate at terahertz frequencies. Physica Scr. 2025, 100.8, 085559. [Google Scholar]
- Ueno, Akira; Hu, Juejun; An, Sensong. AI for optical metasurface. npj Nanophotonics 2024, 1.1, 36. [Google Scholar] [CrossRef]
- Sabaeian, Mohammad; Baridi, Ghassem. Graphene plasmonic-assisted enhancement of linear and nonlinear optical properties of conic-shaped InAs/GaAs quantum dots with wetting layer. Superlattices Microstruct. 2020, 144, 106582. [Google Scholar] [CrossRef]
- Sabaeian, Mohammad; Baridi, Ghassem. Coupling the graphene plasmonic with terahertz emission of truncated conic-shaped InAs/GaAs quantum dots: A passive approach to enhance the intersubband optical properties. Physica E Low.-Dimens. Syst. Nanostructures 2021, 134, 114834. [Google Scholar] [CrossRef]
- Baridi, G.; Gharaaty, S.; Hajati, Y.; Sabaeian, M. Hybrid quantum dot-graphene layers with improved optical properties in the terahertz spectrum region. Physica E Low.-Dimens. Syst. Nanostructures 2023, 146, 115524. [Google Scholar] [CrossRef]
- Baridi, G.; Liaquat, A.; Martini, L.; Rapuzzi, F.; Clericò, V.; Amado, M.; Diez, E.; Abidi, E.H.; Maschio, M.C.; Corni, S.; et al. Computational Simulation of a Surface Plasmonic Resonance Biosensor for β2-Microglobulin Based on Electrolyte-Gated Graphene. Sensors 2026, 26(9), 2815. [Google Scholar] [CrossRef]
- Shang, M.; Li, P. L.; Wang, Y. H.; Luo, J. W. Third-order nonlinear optical properties of graphene composites: A review. Chin. Phys. B 2021, 30(8), 080703. [Google Scholar] [CrossRef]
- Ri, C. S.; Im, S. J.; Pae, J. S.; Ho, K. S.; Han, Y. H.; Herrmann, J. Nanoscale magnetization and third-order nonlinearity by the plasmon-induced inverse Faraday effect in graphene-covered semiconductors. Phys. Rev. B 2019, 100(15), 155404. [Google Scholar] [CrossRef]
- Gray, Stephen K. Theory and modeling of plasmonic structures. J. Phys. Chem. C 2013, 117.5, 1983–1994. [Google Scholar] [CrossRef]
- Khurgin, Jacob B. How to deal with the loss in plasmonics and metamaterials. Nat. Nanotechnol. 2015, 10.1, 2–6. [Google Scholar] [CrossRef]
- Jablan, Marinko; Buljan, Hrvoje; Soljačić, Marin. Plasmonics in graphene at infrared frequencies. Phys. Rev. B—Condensed Matter Mater. Phys. 2009, 80.24, 245435. [Google Scholar] [CrossRef]
- Mage, M. G.; Lee, L.; Ribaudo, R. K.; Corr, M.; Kozlowski, S.; McHugh, L.; Margulies, D. H. A recombinant, soluble, single-chain class I major histocompatibility complex molecule with biological activity. Proc. Natl. Acad. Sci. 1992, 89(22), 10658–10662. [Google Scholar] [CrossRef]
- Amici, G.; Virga, G.; Da Rin, G.; Grandesso, S.; Vianello, A.; Gatti, P.; Bocci, C. Serum beta-2-microglobulin level and residual renal function in peritoneal dialysis. Nephron 1993, 65(3), 469–471. [Google Scholar] [CrossRef]
- Bianchi, C.; Donadio, C.; Tramonti, G.; Consani, C.; Lorusso, P.; Rossi, G. Reappraisal of serum β2-microglobulin as a marker of GFR. Ren. Fail. 2001, 23(3-4), 419–429. [Google Scholar] [CrossRef]
- Stein, G.; Schneider, A.; Thoss, K.; Ritz, E.; Schaefer, K.; Hüller, M.; Sperschneider, H.; Marzoll, I. Beta 2-microglobulin serum concentration and associated amyloidosis in dialysis patients. Nephrol. Dial. Transplant. Off. Publ. Eur. Dial. Transpl. Assoc.-Eur. Ren. Assoc. 1991, 6, 57–61. [Google Scholar]
- Brancolini, G.; Maschio, M.C.; Cantarutti, C.; Corazza, A.; Fogolari, F.; Bellotti, V.; Corni, S.; Esposito, G. Citrate stabilized gold nanoparticles interfere with amyloid fibril formation: D76N and ∆N6 β2-microglobulin variants. Nanoscale 2018, 10, 4793–4806. [Google Scholar] [CrossRef]
- Brancolini, G.; Corazza, A.; Vuano, M.; Fogolari, F.; Mimmi, M.C.; Bellotti, V.; Stoppini, M.; Corni, S.; Esposito, G. Probing the influence of citrate-capped gold nanoparticles on an amyloidogenic protein. Acs Nano 2015, 9, 2600–2613. [Google Scholar] [CrossRef]
- Maschio, M.C. Modeling an Amyloidogenic Protein in Solution and on Surfaces. Ph.D. Thesis, University of Modena and Reggio Emilia, Modena, Italy, 2019. [Google Scholar]
- Van Der Spoel, D.; Lindahl, E.; Hess, B.; Groenhof, G.; Mark, A. E.; Berendsen, H. J. GROMACS: fast, flexible, and free. J. Comput. Chem. 2005, 26(16), 1701–1718. [Google Scholar] [CrossRef]
- Ortega, Alvaro; Amorós, D.; De La Torre, J. García. Prediction of hydrodynamic and other solution properties of rigid proteins from atomic-and residue-level models. Biophys. J. 2011, 101.4, 892–898. [Google Scholar] [CrossRef]
- Demir, Baris; Searles, Debra J. Investigation of the ionic liquid graphene electric double layer in supercapacitors using constant potential simulations. Nanomaterials 2020, 10.11, 2181. [Google Scholar]
- Xu, Huilong; Zhang, Zhiyong; Peng, Lian-Mao. Measurements and microscopic model of quantum capacitance in graphene. Appl. Phys. Lett. 2011, 98.13. [Google Scholar] [CrossRef]
- Xia, J.; Chen, F.; Li, J.; Tao, N. Measurement of the quantum capacitance of graphene. Nat. Nanotechnol. 2009, 4(8), 505–509. [Google Scholar] [CrossRef]
- Abbas, G.; Sonia, F. J.; Jindra, M.; Cervenka, J.; Kalbac, M.; Frank, O.; Velicky, M. Electrostatic gating of monolayer graphene by concentrated aqueous electrolytes. J. Phys. Chem. Lett. 2023, 14(18), 4281–4288. [Google Scholar] [CrossRef]
- Wu, Jianzhong. Understanding the electric double-layer structure, capacitance, and charging dynamics. Chem. Rev. 2022, 122.12, 10821–10859. [Google Scholar] [CrossRef]
- Burt, Ryan; Birkett, Greg; Zhao, X. S. A review of molecular modelling of electric double layer capacitors. Phys. Chem. Chem. Phys. 2014, 16.14, 6519–6538. [Google Scholar] [CrossRef]
- Mouro, João; et al. "Analytical modeling and experimental characterization of drift in electrolyte-gated graphene field-effect transistors. npj 2D Mater. Appl. 2025, 9.1. [Google Scholar] [CrossRef]
- Gongadze, E.; Petersen, S.; Beck, U.; Van Rienen, U. Classical Models of the Interface between an Electrode and an Electrolyte. COMSOL conference, 2009, October; pp. 14–16. [Google Scholar]
- Meric, I.; Han, M. Y.; Young, A. F.; Ozyilmaz, B.; Kim, P.; Shepard, K. L. Current saturation in zero-bandgap, top-gated graphene field-effect transistors. Nat. Nanotechnol. 2008, 3(11), 654–659. [Google Scholar] [CrossRef]
- Béraud, A.; Sauvage, M.; Bazán, C. M.; Tie, M.; Bencherif, A.; Bouilly, D. Graphene field-effect transistors as bioanalytical sensors: Design, operation and performance. Analyst 2021, 146(2), 403–428. [Google Scholar] [CrossRef]
- Liu, Y.; Zhu, S.; Zhou, Q.; Cao, Y.; Fu, Y.; Gao, L.; Xu, Y. Enhanced third-harmonic generation induced by nonlinear field resonances in plasmonic-graphene metasurfaces. Opt. Express 2020, 28(9), 13234–13242. [Google Scholar] [CrossRef]
- Yan, D.; Qiu, Y.; Zhao, C.; Li, X.; Zhang, L.; Li, J. Enhanced terahertz third-harmonic generation based on the graphene-assisted meta-grating structure. Diam. Relat. Mater. 2024, 142, 110818. [Google Scholar] [CrossRef]
- Shcherbakov, Vladimir V.; et al. Dielectric characteristics, electrical conductivity and solvation of ions in electrolyte solutions. Materials 2021, 14.19, 5617. [Google Scholar]
- Nasari, H.; Abrishamian, M. S. Nonlinear terahertz frequency conversion via graphene microribbon array. Nanotechnology 2016, 27.30, 305202. [Google Scholar] [CrossRef]
- Zhang, W.; Chen, X.; Wang, Y.; Wu, L.; Hu, Y. Experimental and modeling of conductivity for electrolyte solution systems. ACS Omega 2020, 5(35), 22465–22474. [Google Scholar] [CrossRef]
- Baridi, G.; Liaquat, A.; Martini, L.; Nappi, L.; Rapuzzi, F.; Clericò, V.; Abidi, E.H.; Meziani, Y.M.; Amado, M.; Diez, E.; et al. Graphene-Based Chemical Field-Effect Transistors: Impact of Electric Double Layer Model and Quantum Capacitance on Na+ Detection Capabilities. Micromachines 2026, 17(4). [Google Scholar] [CrossRef]
- Zhang, Guigen. Simulating the Electrical Double Layer Capacitance. Proceedings of the COMSOL Conference 2010. [Google Scholar] [CrossRef]
Figure 1.
Schematic of the proposed nonlinear graphene metasurface and interaction process: (a) 3D view of graphene nanoribbons on a dielectric layer over a gold substrate; (b) 2D cross-sectional view (graphene in black, dielectric in red, gold in yellow); inset: third harmonic generation schematic mechanism.
Figure 1.
Schematic of the proposed nonlinear graphene metasurface and interaction process: (a) 3D view of graphene nanoribbons on a dielectric layer over a gold substrate; (b) 2D cross-sectional view (graphene in black, dielectric in red, gold in yellow); inset: third harmonic generation schematic mechanism.
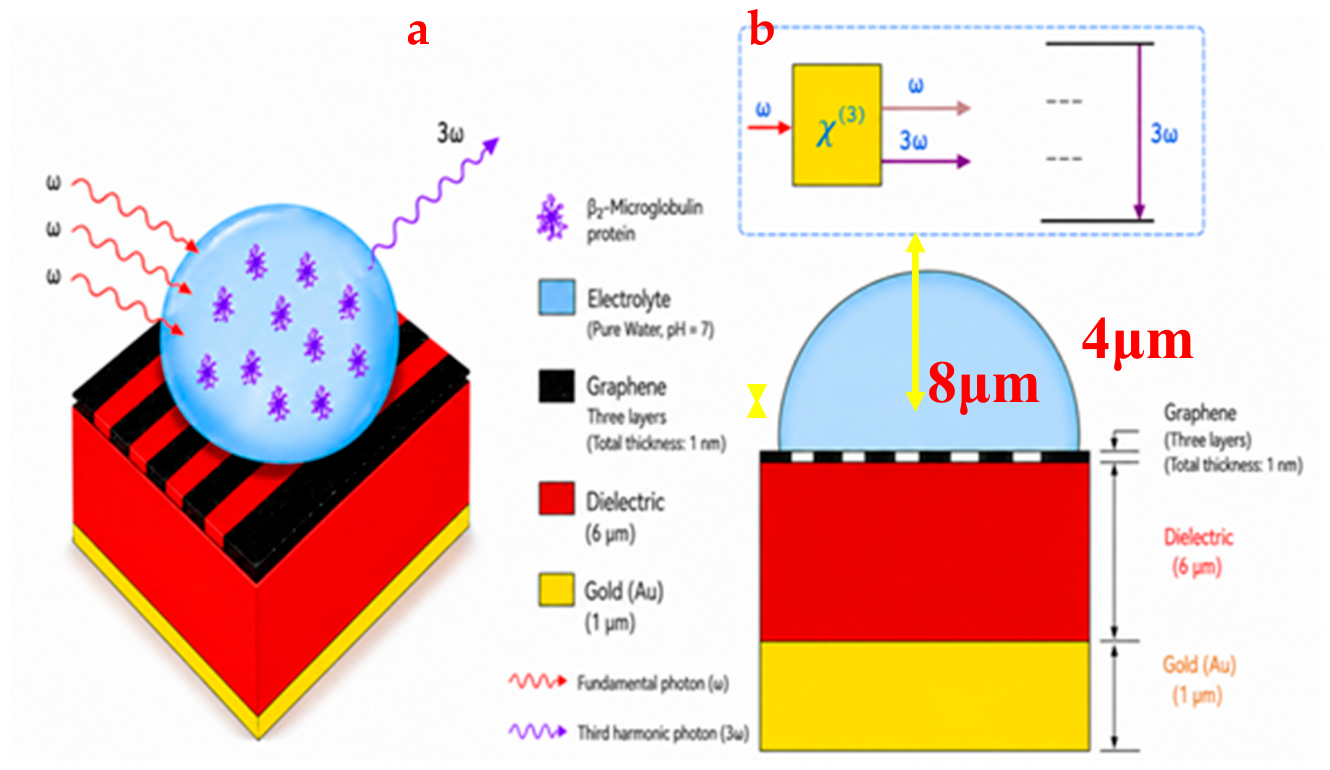
Figure 2.
Dipole Moment of 333.21 Debye of β₂-microglobulin (β₂M) adsorbed on graphene, calculated from 3.1 μs of Temperature Replica Exchange Molecular Dynamics (T-REMD) simulations. The results illustrate the contribution of adsorbed biomolecules to the interfacial electric double layer (EDL), beyond that of electrolyte ions alone. Positively and negatively charged residues interacting with the graphene surface at the interface are shown in blue and red (licorice representation), respectively, highlighting charge distribution at the interface relevant to local field modulation.
Figure 2.
Dipole Moment of 333.21 Debye of β₂-microglobulin (β₂M) adsorbed on graphene, calculated from 3.1 μs of Temperature Replica Exchange Molecular Dynamics (T-REMD) simulations. The results illustrate the contribution of adsorbed biomolecules to the interfacial electric double layer (EDL), beyond that of electrolyte ions alone. Positively and negatively charged residues interacting with the graphene surface at the interface are shown in blue and red (licorice representation), respectively, highlighting charge distribution at the interface relevant to local field modulation.
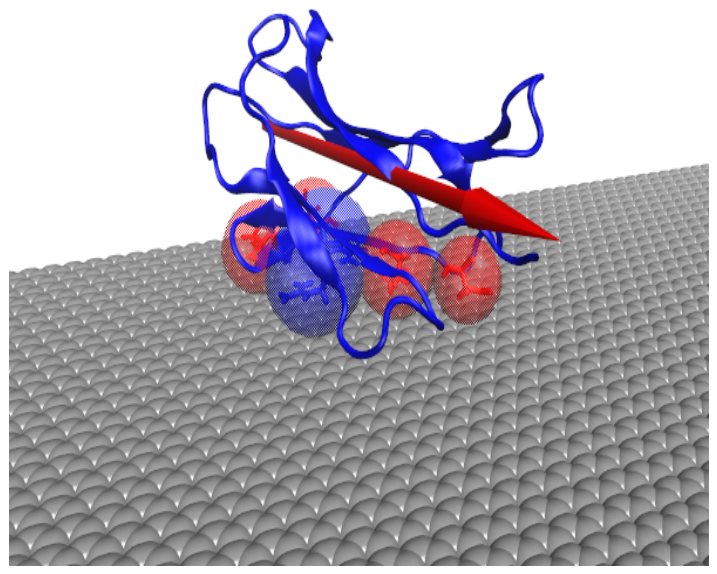
Figure 3.
(a)–(c). Absorption, reflection, and Third Harmonic Generation (THG) power outflow spectra for different dielectric thicknesses (H) across the frequency range of 1.5–3.5 THz. In all simulations, the graphene relaxation time, Fermi energy of graphene and irritated wave are taken as 0.5 ps, 0.3 eV and 30 respectively.
Figure 3.
(a)–(c). Absorption, reflection, and Third Harmonic Generation (THG) power outflow spectra for different dielectric thicknesses (H) across the frequency range of 1.5–3.5 THz. In all simulations, the graphene relaxation time, Fermi energy of graphene and irritated wave are taken as 0.5 ps, 0.3 eV and 30 respectively.
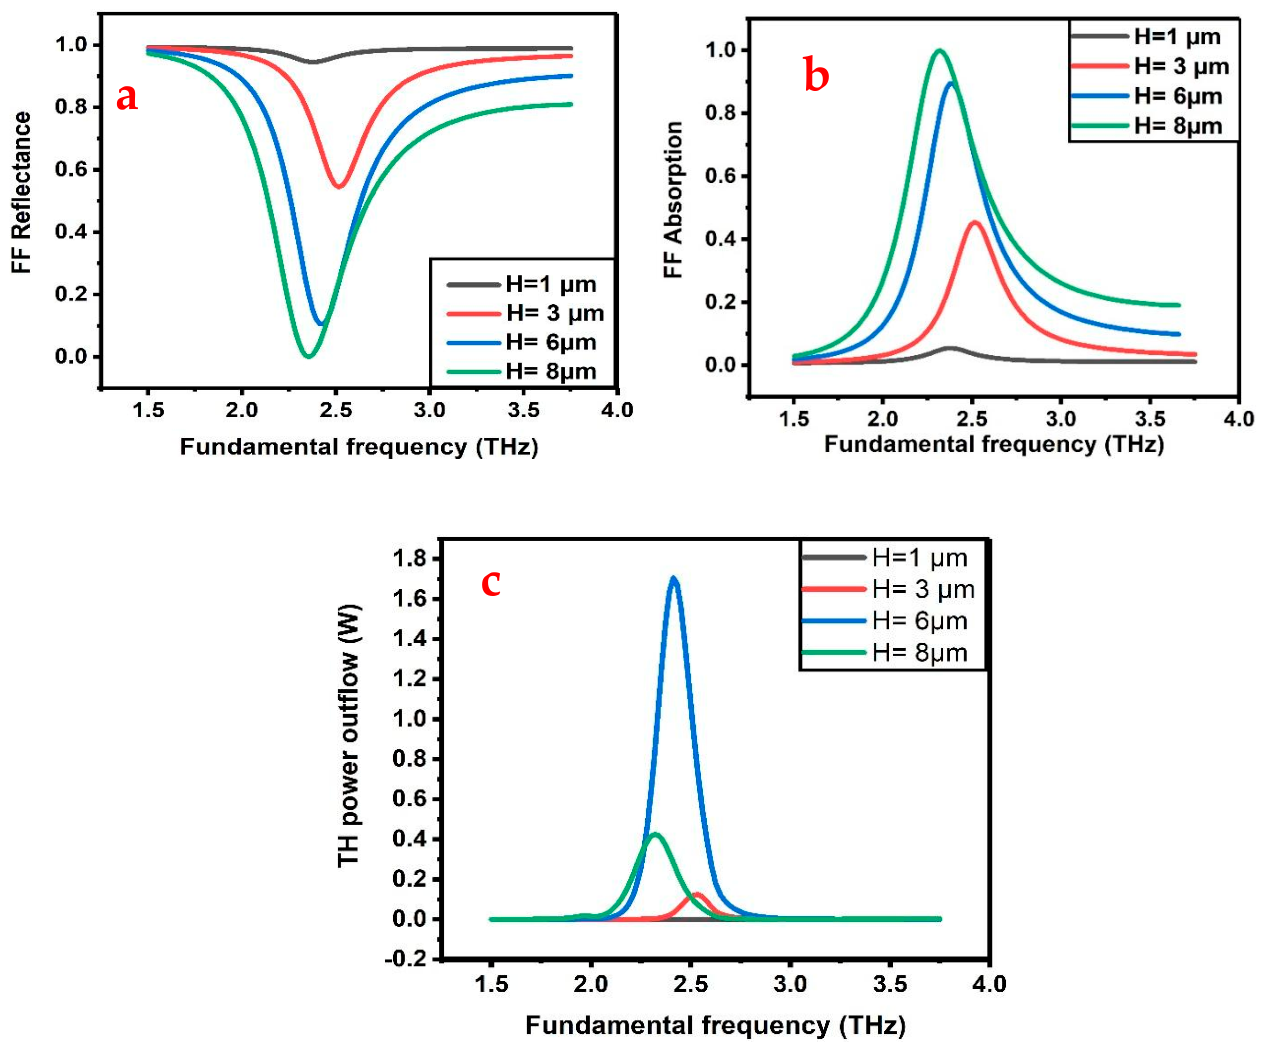
Figure 4.
(a)–(c). Absorption, reflection, and Third Harmonic Generation (THG) power outflow spectra for different Fermi energy of Graphene () across the frequency range of 1.5–3.5 THz. In all simulations, the graphene relaxation time, thickness of dielectric and irritated wave are taken as 0.5 ps, 8um and 30 respectively.
Figure 4.
(a)–(c). Absorption, reflection, and Third Harmonic Generation (THG) power outflow spectra for different Fermi energy of Graphene () across the frequency range of 1.5–3.5 THz. In all simulations, the graphene relaxation time, thickness of dielectric and irritated wave are taken as 0.5 ps, 8um and 30 respectively.
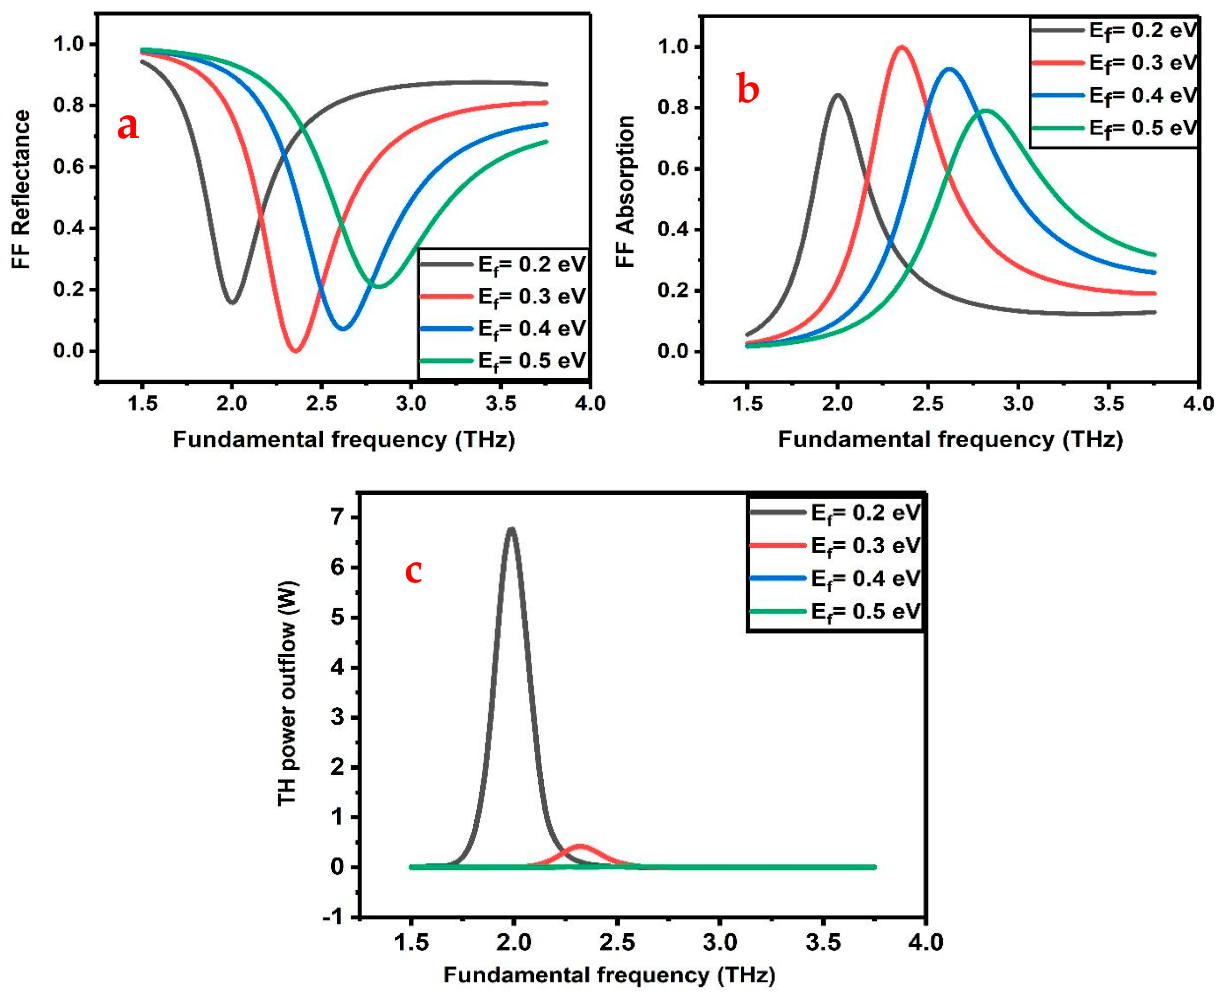
Figure 5.
(a)–(c). Absorption, reflection, and Third Harmonic Generation (THG) power outflow spectra for different relaxation time (τ) of Graphene micro ribbon across the frequency range of 1.5–3.5 THz. In all simulations, the thickness of dielectric, Fermi energy of graphene and irritated wave are taken as 8um, 0.3 eV and 30
respectively.
Figure 5.
(a)–(c). Absorption, reflection, and Third Harmonic Generation (THG) power outflow spectra for different relaxation time (τ) of Graphene micro ribbon across the frequency range of 1.5–3.5 THz. In all simulations, the thickness of dielectric, Fermi energy of graphene and irritated wave are taken as 8um, 0.3 eV and 30
respectively.
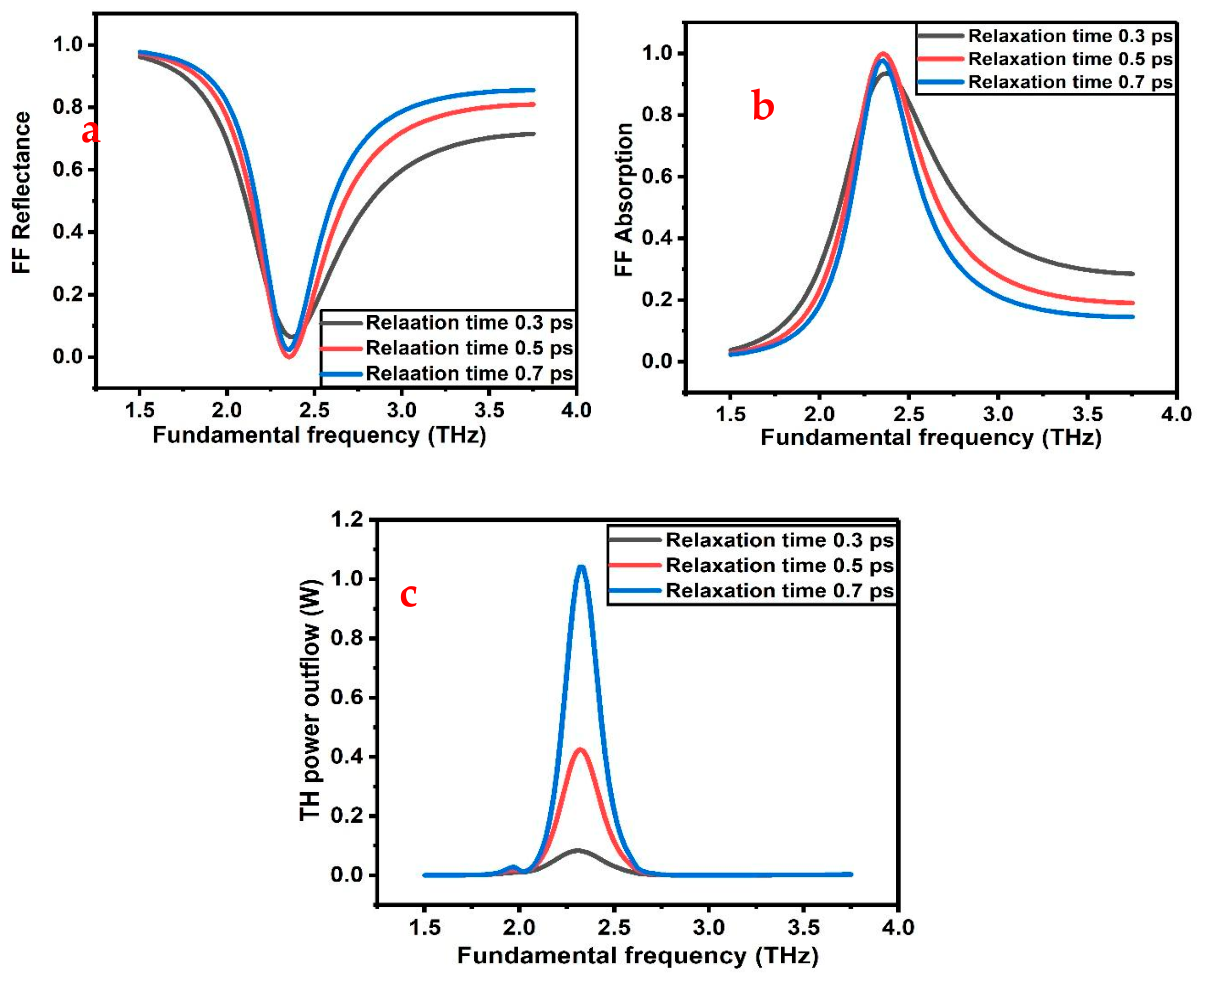
Figure 6.
Computed THG conversion efficiency as functions of the incident FF wave intensity at fundamental frequency of 3 THz. In all simulations, the graphene relaxation time, Fermi energy of graphene and thickness of dielectric are taken as 0.5 ps, 0.3 eV and 8um respectively.
Figure 6.
Computed THG conversion efficiency as functions of the incident FF wave intensity at fundamental frequency of 3 THz. In all simulations, the graphene relaxation time, Fermi energy of graphene and thickness of dielectric are taken as 0.5 ps, 0.3 eV and 8um respectively.
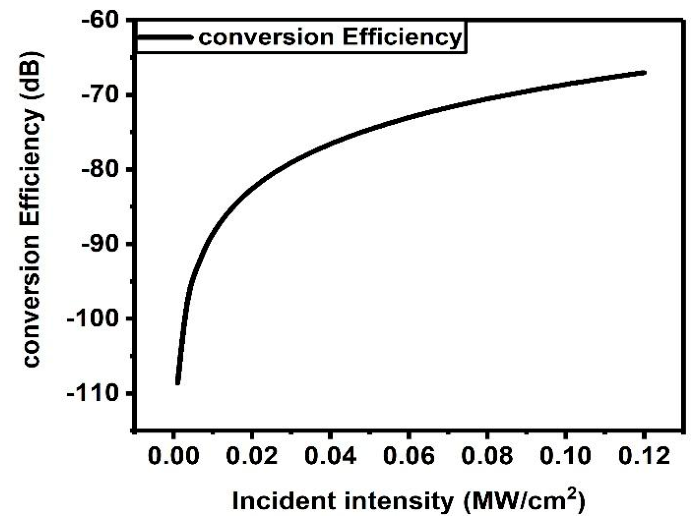
Figure 7.
Normalized spatial distribution of the electric field (V/m) for the Third Harmonic Generation wave at the plasmon resonance frequency of 1.5 THz for different intensity of irritated ()wave in Graphene micro ribbon: (a) , (b) , (c) and (d) . In all simulations, the Fermi energy of graphene, dielectric high and relaxation time are taken as .3 eV, and .5 ps respectively.
Figure 7.
Normalized spatial distribution of the electric field (V/m) for the Third Harmonic Generation wave at the plasmon resonance frequency of 1.5 THz for different intensity of irritated ()wave in Graphene micro ribbon: (a) , (b) , (c) and (d) . In all simulations, the Fermi energy of graphene, dielectric high and relaxation time are taken as .3 eV, and .5 ps respectively.
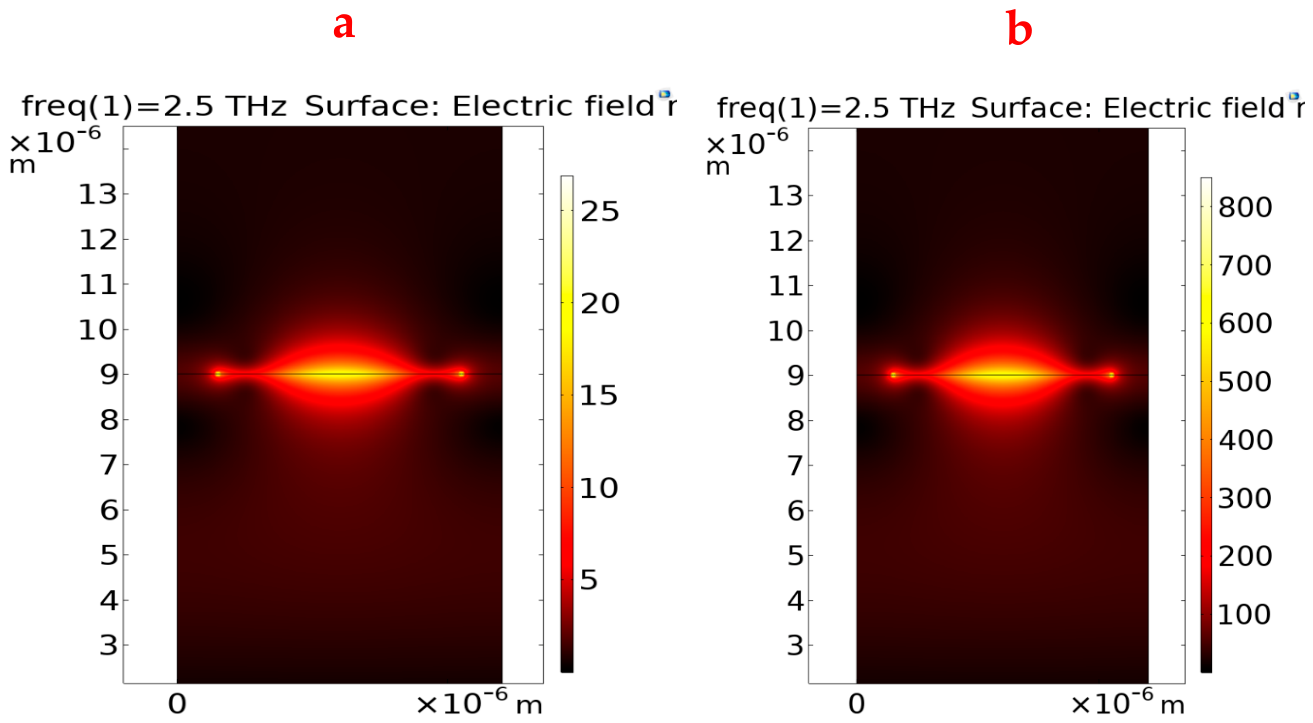
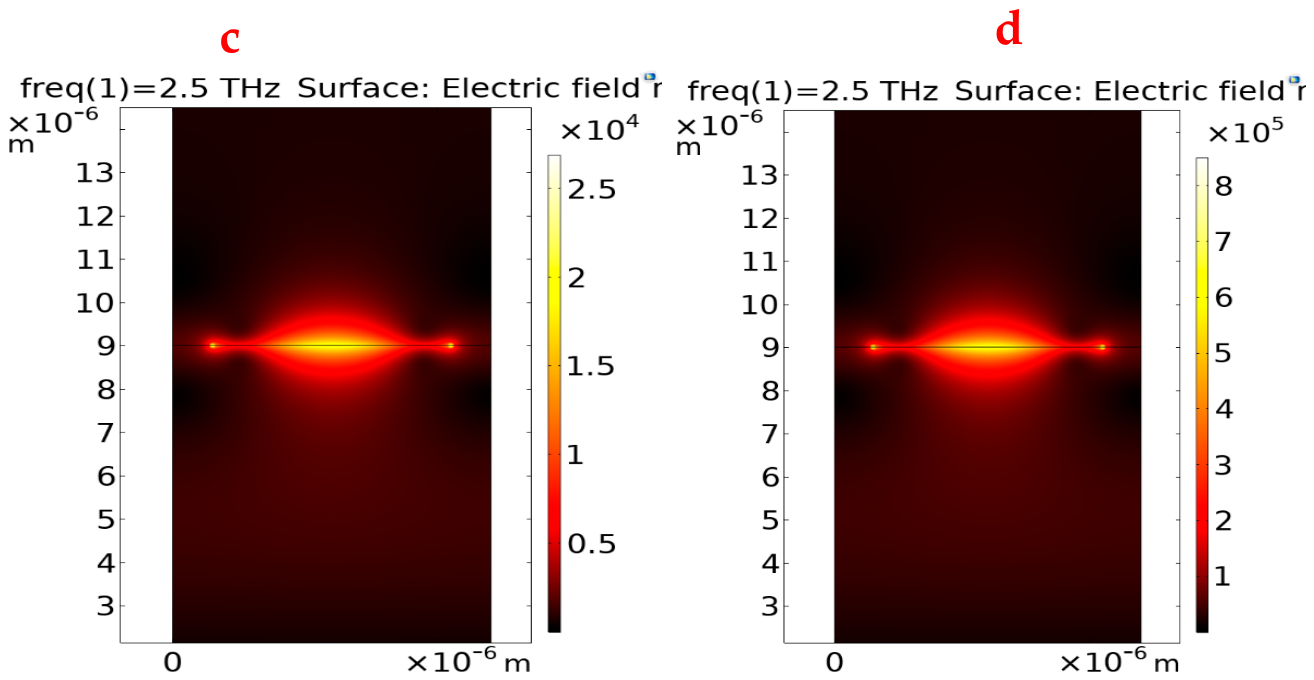
Figure 8.
Panels a–b shows the electric potential (a), electric field (b) in the electrolyte, including the region near the electric double layer (EDL). The simulation uses the Stern model of EDL integrated with quantum capacitance of Graphene.
Figure 8.
Panels a–b shows the electric potential (a), electric field (b) in the electrolyte, including the region near the electric double layer (EDL). The simulation uses the Stern model of EDL integrated with quantum capacitance of Graphene.
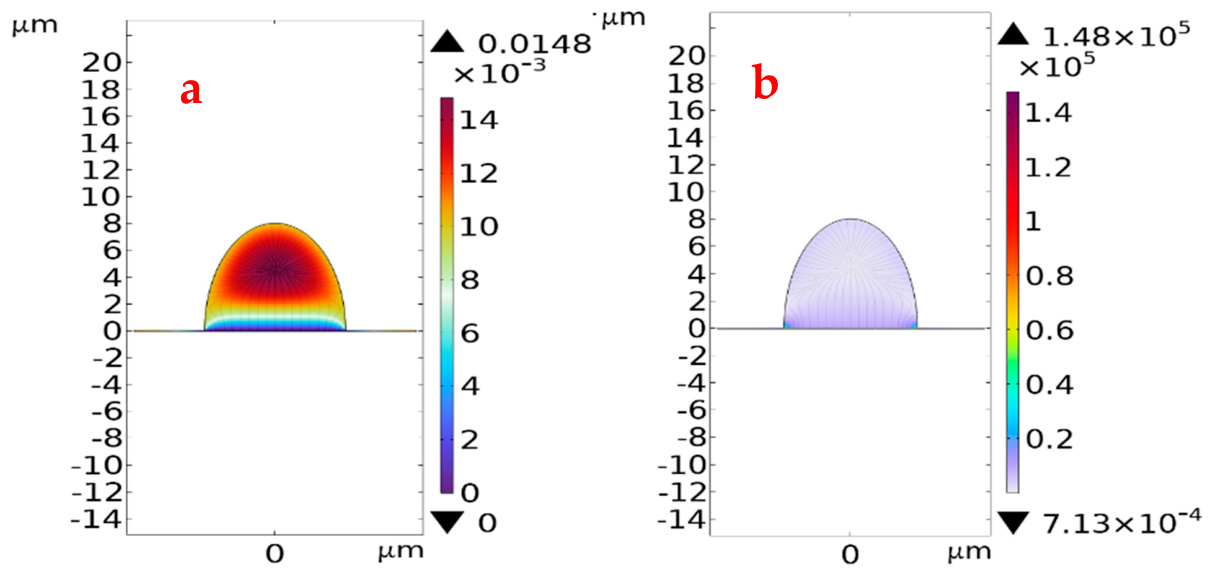
Figure 9.
Absorption (a), (b) reflection, (c) Third Harmonic Generation (THG) power outflow spectra and (d) FWHM for different protein concentration across the frequency range of 1.5–3.5. In all simulations, the graphene relaxation time, Fermi energy of graphene, irritated wave intensity and thickness of dielectric are taken as 0.5 ps, 0.3 eV, 30 and 8um respectively.
Figure 9.
Absorption (a), (b) reflection, (c) Third Harmonic Generation (THG) power outflow spectra and (d) FWHM for different protein concentration across the frequency range of 1.5–3.5. In all simulations, the graphene relaxation time, Fermi energy of graphene, irritated wave intensity and thickness of dielectric are taken as 0.5 ps, 0.3 eV, 30 and 8um respectively.
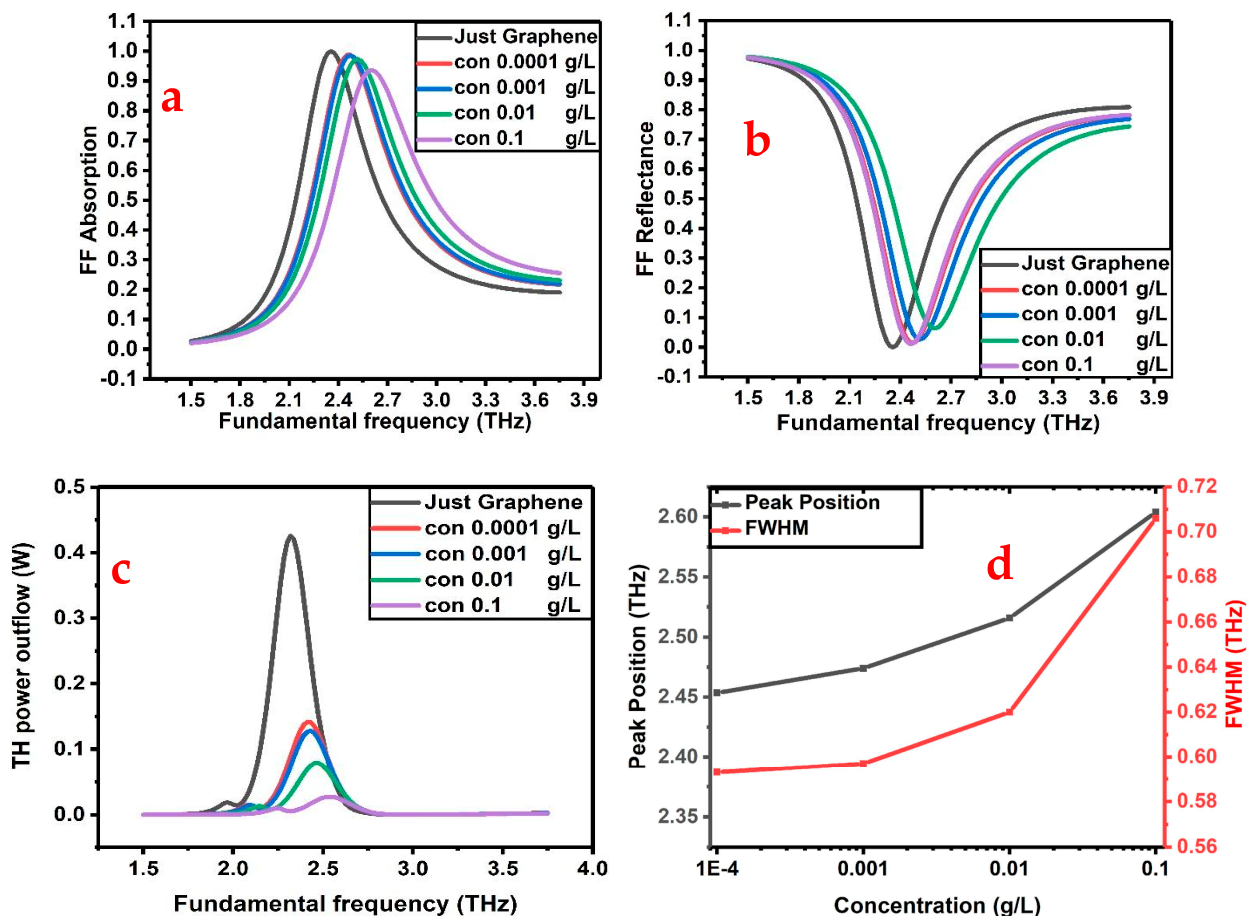
Figure 10.
Effect of incident intensity on (a) conversion efficiency and (b) third harmonic generation power outflow as functions of the incident wave intensity at fundamental frequency of 3 THz with different concentration of protein. In all simulations, the graphene relaxation time, Fermi energy of graphene and thickness of dielectric are taken as 0.5 ps, 0.3 eV and 8um respectively.
Figure 10.
Effect of incident intensity on (a) conversion efficiency and (b) third harmonic generation power outflow as functions of the incident wave intensity at fundamental frequency of 3 THz with different concentration of protein. In all simulations, the graphene relaxation time, Fermi energy of graphene and thickness of dielectric are taken as 0.5 ps, 0.3 eV and 8um respectively.
Disclaimer/Publisher’s Note: The statements, opinions and data contained in all publications are solely those of the individual author(s) and contributor(s) and not of MDPI and/or the editor(s). MDPI and/or the editor(s) disclaim responsibility for any injury to people or property resulting from any ideas, methods, instructions or products referred to in the content. |
© 2026 by the authors. Licensee MDPI, Basel, Switzerland. This article is an open access article distributed under the terms and conditions of the Creative Commons Attribution (CC BY) license (http://creativecommons.org/licenses/by/4.0/).
Copyright: This open access article is published under a Creative Commons CC BY 4.0 license, which permit the free download, distribution, and reuse, provided that the author and preprint are cited in any reuse.