

Submitted:
20 September 2026
Posted:
21 September 2026
You are already at the latest version
Abstract
Reliable prediction of tunnelling-induced ground deformation is essential for assessing differential settlement of surface buildings and deformation of subsurface structures in densely built urban areas. This study establishes a multi-source engineering-evidence framework for parameter selection in the modified Peck model. An interval database containing 39 published correction-coefficient records is compiled to investigate the maximum-settlement correction coefficient α and settlement-trough-width correction coefficient β, while an independent dataset comprising 24 international shield-tunnelling cases and 84 surface and subsurface observations is used to evaluate depth-dependent settlement characteristics. Descriptive statistics, the Mann–Whitney U test, Cliff’s δ, bootstrap resampling, interval Monte Carlo simulation, and case-level trend analysis are employed. The median values α are 0.650 for soft soil and 0.550 for composite strata. Although the difference is not statistically significant (p=0.150,δ=0.302), interval Monte Carlo analysis gives a probability of 0.907 that the median α is higher in soft soil, indicating a directional ground-condition dependence. In contrast, β shows substantial between-group overlap and no robust ground-condition dependence. With increasing normalized observation depth z/T, i(z)/i(0) decreases strongly (ρ=-0.898), whereas Smax(z)/Smax(0) generally increases, with consistent within-case trends in 17/17 and 20/22 cases, respectively. The results support treating α as a ground-conditioned prior and β as an updateable project-specific parameter rather than prescribing either as a fixed constant. The proposed framework provides a transparent basis for settlement assessment of the built environment and highlights the need for depth-dependent corrections when subsurface structures are involved.
Keywords:
Shield tunnelling
; modified Peck model
; correction coefficient
; strata dependence
; parameter uncertainty
; depth effect
1. Introduction
Tunnel excavation inevitably disturbs the initial stress state of the surrounding ground and induces ground loss, stress redistribution, and associated surface and subsurface deformation [1,2,3,4]. Excessive or nonuniform ground movements may induce differential settlement and angular distortion of overlying buildings [5,6,7,8,9,10] and may also affect foundations [11,12,13], basements [14,15,16], buried utilities [17,18,19], and existing underground structures [20,21,22,23]. Reliable prediction of tunnelling-induced settlement is therefore essential for deformation control and risk assessment [24,25]. Among the available approaches, the Gaussian settlement-trough model proposed by Peck [26] remains one of the most widely used engineering methods because of its simple formulation and clear physical interpretation. Subsequent empirical observations further related the settlement-trough width to tunnel depth and ground conditions [27], while field measurements demonstrated that the characteristics of the settlement trough also vary below the ground surface [28]. Mechanics-based analytical solutions have meanwhile provided alternative descriptions of tunnelling-induced ground movements [29].
Considerable research has subsequently focused on extending settlement prediction from idealized single-tunnel conditions to more complex excavation scenarios. Suwansawat and Einstein [30] described settlement troughs above twin tunnels using a superposition approach, while Chen et al. [31] investigated ground movements induced by parallel EPB tunnelling in silty soils. Fang et al. [32] examined subsurface settlement due to shield tunnelling and provided systematic observations of settlement-trough variation with depth. Xie et al. [33] analyzed the surface settlement induced by a large-diameter shield tunnel in Shanghai. These studies show that settlement magnitude and trough geometry are sensitive to tunnel configuration, observation depth, and project conditions, limiting the direct transfer of a single set of Peck parameters among different projects.
Accordingly, increasing attention has been paid to improved empirical formulations and parameter modification. Lu et al. [34] developed a Gaussian-function-based formulation for predicting tunnelling-induced ground settlement. Wang et al. [35] proposed a new calculation method for tunnelling-caused stratum settlement, in which the settlement influence range and settlement at different depths were considered. Ding et al. [36] investigated shield-tunnelling-induced settlement in soil–rock composite strata, highlighting the influence of heterogeneous ground conditions on settlement prediction. Deng et al. [37] analyzed shield-tunnelling-induced surface settlement along curved sections from the perspective of ground loss. Gao et al. [38] modified the Peck formula for water-rich sandy cobble strata, whereas Li et al. [39] developed a modified Peck formulation for a double-track shield tunnel beneath an expressway subgrade. These studies demonstrate that modification of the maximum settlement and settlement-trough width is often required when the conventional Peck model is applied beyond its original empirical conditions.
Recent studies have further examined the effects of tunnel layout, heterogeneous strata, and construction conditions on settlement-trough characteristics. Kannangara et al. [40] investigated surface settlement induced by twin tunnelling in silty sand, and Hou et al. [41] analyzed four shield tunnels with complex spatial relationships in clay. Guo et al. [42] examined the evolution of relationships between construction parameters and settlement under soil–rock mixed-face conditions, while Li et al. [43] investigated settlement patterns of super-large-diameter shield tunnels in composite strata. Lou et al. [44] considered surface settlement associated with double-line shield tunnelling with a large longitudinal slope, and Wang et al. [45] extended settlement prediction to subsurface observations in sandy cobble strata. More recently, Kong et al. [46] explicitly related Peck-type settlement parameters to tunnel depth, radius, and tunnel gap, further illustrating that maximum settlement and trough width are not invariant empirical quantities.
The influence of construction disturbance and deformation mode has also received increasing attention. Peng et al. [47] investigated the effects of deviations in jacking force and cutterhead torque during shield tunnelling in soft ground. Zhou et al. [48] developed a stochastic-medium-theory-based prediction method for surface settlement induced by bias tunnels, extending settlement prediction to asymmetric tunnel convergence conditions. Zhou et al. [49] further investigated settlement of an existing tunnel subjected to undercrossing excavation through a theoretical prediction framework, demonstrating the importance of evaluating ground deformation at the depth of subsurface structures rather than relying solely on surface settlement. Data-driven approaches have also emerged as a complementary direction; for example, Ye et al. [50] employed machine learning for forecasting shield-tunnelling-induced settlement. Nevertheless, for preliminary design and engineering interpretation, Peck-type empirical models remain attractive because their principal parameters have direct geometric and deformation-related meanings.
Despite these advances, most existing Peck modifications have been developed from individual projects or specific geological conditions, and the reported correction coefficients consequently exhibit considerable between-study variability. A cross-project quantitative assessment of whether the correction of maximum settlement and settlement-trough width shows consistent ground-condition dependence remains limited. In addition, many published correction coefficients are reported as ranges rather than point estimates, meaning that the uncertainty embedded in the original engineering evidence should be retained during statistical comparison. Another issue concerns observation depth: parameters calibrated from surface settlement troughs cannot necessarily be transferred directly to buried structures because both trough width and maximum settlement evolve with depth.
To address these issues, this study establishes a multi-source engineering-evidence framework for the modified Peck model, as illustrated in Figure 1. Two complementary databases are employed to address different questions. The first comprises reported correction-coefficient intervals and is used to examine the statistical characteristics and ground-condition dependence of the maximum-settlement coefficient and trough-width coefficient . Descriptive statistics, Mann–Whitney tests, Cliff’s, bootstrap resampling, interval Monte Carlo simulation, and construction-method sensitivity analysis are used to evaluate parameter evidence while retaining the uncertainty of the originally reported intervals. The second database, compiled independently from the international shield-tunnelling cases reported by Fang et al. [32], is used to quantify the depth dependence of i(z)/i(0) and Smax(z)/Smax(0). The two evidence streams are not numerically merged; instead, they provide complementary support for parameter selection and physical interpretation. Based on these results, a staged framework is developed for initial parameter selection, project-specific refinement, field back-analysis, dynamic updating, and depth-dependent deformation assessment.
2. Theoretical Framework and Modified Peck Model
2.1. Conventional Peck Model and Settlement-Trough Characteristics
Underground excavation inevitably disturbs the initial stress equilibrium of the surrounding ground and induces ground loss and stress redistribution, resulting in a spatially distributed deformation field around the tunnel. Figure 2 schematically illustrates the propagation of tunnelling-induced ground deformation from the excavation zone to adjacent subsurface structures, the ground surface, and overlying buildings. Such deformation may directly affect existing tunnels, buried pipelines, and other subsurface facilities, while its upward propagation can further generate surface settlement and differential ground movements. In densely built urban areas, these movements may lead to differential settlement, angular distortion, cracking, and other serviceability problems in overlying or adjacent buildings and structures. Therefore, an accurate and practical description of the tunnelling-induced settlement trough is essential for evaluating excavation-induced deformation and the associated risks to both subsurface structures and surface buildings.
Among the available prediction approaches, the empirical model proposed by Peck has been widely used because of its simple formulation and clear engineering interpretation. The transverse surface settlement trough is represented by a Gaussian distribution as follows:
where S0(x) is the predicted settlement at a horizontal distance x from the tunnel centerline, with settlement taken as positive downward; Smax,0 is the maximum settlement at the centerline of the settlement trough; and i0 is the horizontal distance from the tunnel centerline to the inflection point of the Gaussian settlement curve.
Accordingly, Smax,0 characterizes the magnitude of the settlement trough, whereas i0 controls its width and spatial extent. The geometric meanings of these characteristic parameters are illustrated in Figure 3.
For the Gaussian settlement trough described by Eq. (1), the settlement volume per unit tunnel length can be obtained by integrating the settlement profile over the transverse direction:
where Vs,0 denotes the settlement-trough volume per unit tunnel length.
If the ground-loss ratio Vl is defined as the ratio of the volume of ground loss to the tunnel excavation volume, the ground-loss volume per unit tunnel length can be expressed as AVl, where A is the tunnel excavation cross-sectional area. Under the commonly adopted volume-compatibility assumption, Vs,0 = AVl, and the maximum settlement can therefore be written as:
For a circular tunnel of diameter D, . Equations (1)-(3) show that the conventional Peck model characterizes the transverse settlement trough primarily through the maximum settlement Smax,0 and the trough-width parameter i0. However, the values predicted using baseline Peck parameters may deviate from field observations under different geological and construction conditions, motivating the introduction of correction coefficients for both the settlement magnitude and trough width.
2.2. Modified Peck Model and Identification of Correction Coefficients
Although the conventional Peck model provides a convenient representation of tunnelling-induced ground settlement, the actual magnitude and width of the settlement trough may deviate systematically from the baseline predictions because of variations in ground conditions, tunnel geometry, construction method, and ground-loss characteristics. To retain the Gaussian form of the conventional Peck model while improving its adaptability to engineering observations, a maximum-settlement correction coefficient and a settlement-trough-width correction coefficient are introduced. The modified settlement profile is expressed as:
Accordingly, the characteristic parameters of the modified settlement trough are:
where Smax,m and im denote the maximum settlement and settlement trough width corresponding to the modified model, respectively.
Therefore, quantifies the deviation in settlement magnitude from the baseline Peck prediction, whereas quantifies the corresponding deviation in settlement trough width. When , Eq. (4) red uces to the conventional Peck model given by Eq. (1).
To determine the characteristic parameters of an observed settlement trough, Eq. (4) can be linearized using field monitoring data. For the jth monitoring point, let xj denote the horizontal distance from the tunnel centerline and Sj the measured settlement magnitude. Taking the natural logarithm of the Gaussian settlement function gives:
Defining:
Eq. (7) can be written in the linear regression form
where a and b are the theoretical intercept and slope, respectively, and represents the residual error.
Comparison between Eqs. (6) and (8) gives
For n monitoring points, the least-squares estimates of the slope and intercept are:
The maximum settlement and trough-width parameter fitted from the monitoring data are therefore:
Relative to the baseline Peck parameters Smax,0 and i0, the corresponding correction coefficients can then be obtained as:
where a and b denote the theoretical regression coefficients, whereas and are their least-squares estimates obtained from the monitoring data.
Correspondingly, and are estimated correction coefficients. For notational simplicity, the hats over and are omitted in the subsequent statistical analysis. The two correction coefficients are not completely independent from the perspective of settlement-trough volume. Based on Eqs. (2) and (5), the modified settlement-trough volume is
and hence
Therefore, when a ground-loss ratio is independently available, the consistency between and the inferred change in settlement-trough volume should be examined. When and are used as statistical priors rather than deterministic constants, they should also be jointly updated using project-specific monitoring data.
3. Multi-Source Engineering Data and Analysis Methods
3.1. Correction-Coefficient Database
The engineering evidence used in this study consists of two complementary datasets. The first dataset contains reported correction-coefficient intervals and is used to investigate the statistical characteristics and ground-condition dependence of and . The second dataset contains surface and subsurface settlement observations from international shield-tunnelling cases and is used independently to evaluate the depth-dependent evolution of the settlement trough. Because the two datasets describe different quantities and were compiled under different parameter definitions, they were not numerically pooled.
The correction-coefficient database comprises 39 published engineering records. For each record, the ground category, geographical region, construction method, reported lower and upper bounds of and, and source information were retained. The records were classified into four ground categories: soft soil, composite strata, gravelly soil, and sandy soil. Soft soil and composite strata contain 17 and 15 records, respectively, whereas gravelly soil and sandy soil contain only four and three records. Given these sample sizes, inferential comparisons between ground conditions were restricted to the soft-soil and composite-strata groups, while the gravelly-soil and sandy-soil records were retained for descriptive analysis only.
Three of the 39 records involved non-shield construction methods, including shallow-buried tunnelling, mining, and pipe jacking. These records were retained in the complete database to preserve the composition of the collected evidence, but were subsequently excluded in the shield-only sensitivity analysis. In addition, the ground classification of two records could not be fully resolved from the available source descriptions. These records were retained and explicitly flagged rather than being assigned a more precise classification than supported by the original information. The composition of the correction-coefficient database is summarized in Table 1.
3.2. International Dataset for Depth-Effect Assessment
An independent dataset of surface and subsurface settlement observations was compiled from 24 shield-tunnelling cases reported by Fang et al. [32], providing a total of 84 observations at different depths. The cases cover the United Kingdom, the United States, Ireland, Japan, Canada, Mexico, Thailand, mainland China, and Taiwan, and involve a range of shield construction methods, including hand-excavated, mechanical, open-face, slurry, and earth-pressure-balance shields. The extracted variables include the tunnel centerline depth , tunnel diameter D, observation depth z, settlement-trough width i(z), and maximum settlement Smax(z). Values not reported in the source were retained as missing and were not imputed.
Because absolute settlement-trough parameters are strongly affected by tunnel burial depth and geometric scale, the overburden thickness above the tunnel crown was defined as:
where is the depth of the tunnel centerline and D is the tunnel diameter.
The normalized observation depth was then expressed as z/T. The geometric definitions of , D, z, and T, together with the corresponding surface and subsurface settlement-trough parameters, are schematically illustrated in Figure 4.
For each tunnelling case, the surface observation was adopted as the reference condition. The normalized settlement-trough width and maximum settlement were therefore defined as i(z)/i(0) and Smax(z)/Smax(0) respectively. These normalized ratios describe the relative evolution of settlement-trough geometry with observation depth. As the observation position approaches the tunnel, changes in i(z)/i(0) characterize the variation in trough width, whereas changes in Smax(z)/Smax(0) reflect the corresponding evolution of settlement magnitude.
It should be emphasized that the depth-effect dataset and the correction-coefficient database describe different quantities. The former provides i(z) and Smax(z) at different observation depths, whereas the latter provides the correction coefficients and relative to a baseline Peck model. Because these quantities were not defined under a unified parameter-identification procedure, the two datasets were not numerically pooled. Instead, the correction-coefficient database was used to investigate the statistical distributions and ground-condition dependence of and , while the international dataset was used as an independent source of evidence for evaluating the depth dependence of settlement-trough characteristics.
3.3. Statistical and Uncertainty Analysis
The statistical analysis comprised descriptive comparison, between-group inference, interval uncertainty propagation, construction-method sensitivity analysis, and depth-effect assessment, as summarized in Figure 5. First, the midpoint of each reported and interval was used for descriptive analysis. The mean, standard deviation, median, interquartile range (IQR), and 5th–95th percentile range were calculated for each ground category. Because the gravelly-soil and sandy-soil groups contained only four and three records, respectively, formal between-group inference was restricted to soft soil and composite strata.
Differences between the soft-soil and composite-strata groups were evaluated using a two-sided Mann-Whitney U test, with Cliff’s adopted as a nonparametric effect-size measure. A positive indicates a tendency for higher parameter values in soft soil, whereas a negative value indicates the opposite. Uncertainty in the difference between group medians was further quantified using 20,000 nonparametric bootstrap resamples. To retain the uncertainty contained in the originally reported parameter intervals, interval Monte Carlo sampling was also performed. For each realization, one value was independently sampled from a uniform distribution bounded by the reported lower and upper limits of each record, after which the median difference between the soft-soil and composite-strata groups was calculated. This procedure was repeated 20,000 times for both and , yielding the median between-group difference, its 95% interval, and the probability that the median parameter value in soft soil exceeds that in composite strata. The uniform distribution was used only to represent uncertainty within the reported intervals in the absence of additional probabilistic information.
To assess the influence of construction method, a shield-only sensitivity analysis was conducted by excluding the three non-shield records and recalculating the Mann–Whitney U test and Cliff’s . The full-database and shield-only results were then compared to evaluate the robustness of the inferred ground-condition effects.
The depth-effect dataset was analyzed independently. Spearman rank correlations were calculated between the normalized observation depth z/T and the normalized responses i(z)/i(0) and Smax(z)/Smax(0), with linear trends fitted for visualization. Because multiple observations could originate from the same tunnelling case, a slope was additionally estimated for each case with observations at multiple depths, and the consistency of the expected slope direction was evaluated using an exact binomial test. This case-level analysis avoids treating repeated observations within the same project as fully independent samples. The significance level was set at 0.05, while interpretation was based jointly on statistical significance, effect size, bootstrap uncertainty, interval Monte Carlo results, and case-level directional consistency.
4. Results
4.1. Distributions of the Correction Coefficients
The reported intervals of the maximum-settlement correction coefficient and the settlement-trough-width correction coefficient exhibit considerable variability among the collected engineering records. Figure 6 and Figure 7 present the reported and intervals for soft-soil conditions, respectively, whereas Figure 8 and Figure 9 show the corresponding intervals for composite strata. The soft-soil and composite-strata groups contain substantially more records than the gravelly-soil and sandy-soil groups and therefore provide the primary basis for subsequent between-group inference.
To provide a representative basis for descriptive comparison, the midpoint of each reported interval was calculated. Figure 10 compares the midpoint distributions of and between soft soil and composite strata, and the corresponding descriptive statistics for all four ground categories are summarized in Table 2.
For , the soft-soil group has a median of 0.650 and an interquartile range of 0.530–0.700, compared with a median of 0.550 and an interquartile range of 0.350–0.700 for composite strata. The midpoint distribution of therefore shows a tendency toward higher values in soft soil. In contrast, the median values of are relatively close, at 0.795 for soft soil and 0.750 for composite strata, with substantial overlap between their interquartile ranges. Owing to the limited numbers of gravelly-soil and sandy-soil records, their statistics are reported for descriptive purposes only and are not used for population-level inference.
4.2. Ground-Condition Dependence and Interval Uncertainty
The statistical comparison between soft soil and composite strata is summarized in Table 3 and Figure 11. For , the median midpoint value is 0.650 in soft soil and 0.550 in composite strata. The Mann–Whitney U test gives p=0.150, while Cliff’s , indicating a moderate directional tendency toward higher values in soft soil. The bootstrap estimate of the median difference is 0.100, with a 95% confidence interval of [-0.107, 0.350].
When the originally reported parameter intervals are retained through interval Monte Carlo sampling, the median between-group difference in is 0.104, with a 95% interval of . The probability that the median value in soft soil exceeds that in composite strata is 0.907. Although both the bootstrap and Monte Carlo intervals include zero, the direction of the effect remains predominantly positive. The available evidence therefore indicates a ground-condition-related tendency in , but does not establish a statistically robust deterministic difference between the two groups.
For , the two groups show substantially greater overlap. Cliff’s and the Mann–Whitney U test gives. The bootstrap median difference is 0.000 with a 95% confidence interval of, while the interval Monte Carlo analysis gives a median difference of -0.012 with a 95% interval of . The probability that the median value in soft soil exceeds that in composite strata is 0.442. These results provide insufficient evidence for a systematic ground-condition dependence of within the present database.
4.3. Construction-Method Sensitivity
The complete correction-coefficient database contains three records obtained using non-shield construction methods. To evaluate whether these records materially influence the inferred ground-condition differences, the analysis was repeated using shield-tunnelling records only. After exclusion of the three non-shield records, all 17 soft-soil records were retained, whereas the number of composite-strata records decreased from 15 to 13.
For , the median values in soft soil and composite strata are 0.650 and 0.500, respectively. Cliff’s increases from 0.302 for the complete database to 0.394 for the shield-only dataset, while the corresponding p-value decreases from 0.150 to 0.071. Thus, restricting the analysis to shield-tunnelling records strengthens the directional difference in , although the result remains above the conventional significance threshold of 0.05.
In contrast, remains insensitive to the ground-condition classification after restriction to shield-tunnelling records. The median values are 0.795 for soft soil and 0.700 for composite strata, with Cliff’s and . The construction-method sensitivity analysis therefore does not alter the principal statistical pattern observed in the complete database: exhibits a directional ground-condition signal, whereas shows little evidence of a consistent between-group difference.

Table 4.
Sensitivity analysis based on shield-tunnelling records only.
| Parameter | n(Soft soil/Composite strata) | Median (Soft soil) |
Median (Composite strata) |
Cliff’s | p |
| 17/13 | 0.650 | 0.500 | 0.394 | 0.071 | |
| 17/13 | 0.795 | 0.700 | 0.032 | 0.900 |
4.4. Depth Dependence of Settlement-Trough Characteristics
The international shield-tunnelling dataset reveals a pronounced depth dependence of settlement-trough geometry. As shown in Figure 12 and Table 5, the normalized settlement-trough width i(z)/i(0) decreases markedly with increasing normalized observation depth z/T. Based on 42 subsurface observations from 17 cases, the pointwise Spearman rank correlation coefficient is with. Moreover, all 17 cases containing observations at multiple depths exhibit negative within-case slopes. The corresponding exact binomial test gives , demonstrating strong case-level consistency in the direction of change.
The normalized maximum settlement Smax(z)/Smax(0) shows a different pattern. Based on 56 subsurface observations from 22 cases, the Spearman rank correlation coefficient is , with. Although the pointwise relationship is substantially more scattered than that of the settlement-trough width, 20 of the 22 cases exhibit positive within-case slopes. The exact binomial test gives , indicating a highly consistent positive trend at the case level.
These results show that, as the observation position approaches the tunnel, the settlement trough generally becomes narrower while the maximum settlement tends to increase. The depth dependence is particularly strong and consistent for the trough-width parameter, whereas the maximum-settlement response exhibits greater between-case scatter. Some individual cases show local non-monotonic variations, which may reflect differences in ground conditions, monitoring configurations, and construction-induced disturbances; therefore, the identified trends should be interpreted as general cross-case patterns rather than as strictly monotonic behavior in every project.
5. Discussion
5.1. Interpretation and Dependence of the Correction Coefficients
The two correction coefficients represent different geometric characteristics of the modified Peck settlement trough. The coefficient scales the maximum settlement, whereas modifies the trough width. In the present database, exhibits a directional dependence on ground condition: the median value is 0.650 for soft soil and 0.550 for composite strata, with Cliff’s . Although the between-group difference is not statistically significant (), interval Monte Carlo analysis gives a probability of 0.907 that the median in soft soil exceeds that in composite strata. The signal becomes stronger after restricting the analysis to shield-tunnelling records (,). These results support the use of as a ground-conditioned prior rather than as a deterministic stratum-specific constant.
The observed tendency is consistent with the greater compressibility and lower stiffness of soft soils, together with construction disturbance and post-shield consolidation. In composite strata, relatively stiff layers may restrain overall deformation, whereas the position and inclination of the soil–rock interface and local construction conditions can introduce substantial scatter. Ground type therefore provides only a first-order explanation for the variability in .
By contrast, shows no robust ground-condition dependence. Its distributions for soft soil and composite strata overlap substantially, and this conclusion is unchanged in the shield-only analysis. The inferred is influenced not only by ground properties but also by the baseline formulation of i, tunnel-depth definition, monitoring-section extent, and tunnel configuration. Therefore, the current evidence does not support assigning solely according to ground type. In addition, and should not be interpreted independently because . Their joint selection should therefore remain consistent with the implied settlement-trough volume and, where available, the independently estimated ground-loss ratio.
5.2. Engineering Implications and Parameter Updating
The international dataset demonstrates a systematic depth dependence of the settlement trough. The normalized trough width i(z)/i(0) decreases markedly with increasing z/T (), and all 17 cases with multiple observation depths exhibit negative within-case slopes. In contrast, Smax(z)/Smax(0) generally increases with depth; despite greater scatter, positive slopes are observed in 20 of 22 cases. These results indicate that the settlement field becomes progressively narrower and more concentrated as the observation position approaches the tunnel.
This depth dependence has direct implications for deformation assessment of the built environment. Surface-calibrated Peck parameters may be suitable for evaluating ground movements affecting surface buildings, but direct extrapolation to buried pipelines, existing tunnels, basements, or other subsurface structures may misrepresent both the magnitude and spatial concentration of deformation. Depth-dependent values of i(z) and Smax(z) should therefore be incorporated when subsurface structural responses are assessed.
For engineering application, the statistical results should be treated as initial parameter priors rather than fixed design values. A staged parameter-selection and updating strategy is therefore proposed, as summarized in Figure 13. During preliminary design, the median may be adopted as the central estimate, the interquartile range as the preferred search interval, and the 5th–95th percentile range as a broader uncertainty envelope. Before construction, these ranges should be refined using comparable projects, site investigation, tunnel geometry, groundwater conditions, and numerical analysis. During tunnelling, and should be jointly updated using field monitoring, while the consistency of with the inferred ground loss or settlement-trough volume should be checked. For subsurface structures, the updated parameters should be combined with the depth-dependent corrections identified above. The corresponding data-derived initial priors are summarized in Table 6.
5.3. Limitations and Future Research
The present study is subject to four main limitations. First, the 39 records are study-level parameter intervals rather than raw settlement profiles fitted under a unified procedure, so heterogeneity in parameter definition and fitting method cannot be fully eliminated. Second, the sample sizes remain limited, particularly outside the soft-soil and composite-strata groups, and ground condition may be partially confounded with project-specific factors. Third, the interval Monte Carlo analysis assumes uniform uncertainty within each reported interval; this assumption represents a lack of information within the interval rather than a physical probability distribution. Fourth, the international depth-effect data were obtained from a single compilation source and therefore provide complementary physical evidence rather than direct external validation of the correction-coefficient database.
Future work should prioritize the collection of raw transverse settlement profiles together with tunnel geometry, overburden conditions, groundwater information, construction parameters, and monitoring time. Re-estimating and under a unified objective function would allow geological and methodological effects to be separated more clearly. With a larger standardized database, hierarchical statistical models could then be used to quantify the contributions of ground and construction variables, while independently validated depth-dependent relationships could be developed for subsurface deformation prediction.
6. Conclusions
This study developed a multi-source engineering-evidence framework for evaluating and selecting the correction parameters of the modified Peck model. The main conclusions are as follows.
(1) The maximum-settlement correction coefficient exhibits a clear directional dependence on ground condition. Soft soil shows a higher median than composite strata, and the effect remains directionally consistent after uncertainty propagation and shield-only sensitivity analysis. However, the between-group difference does not reach conventional statistical significance. Therefore, is better treated as a ground-conditioned prior than as a fixed stratum-specific constant.
(2) The settlement-trough-width correction coefficient shows substantial overlap between soft soil and composite strata, with little evidence of a systematic ground-condition effect. Accordingly, should not be prescribed solely according to ground type and should instead be calibrated using project-specific geological, geometric, and construction information.
(3) Settlement-trough characteristics vary systematically with observation depth. The normalized trough width i(z)/i(0) decreases markedly with increasing z/T, whereas Smax(z)/Smax(0) generally increases. Thus, the deformation field becomes narrower and more concentrated toward the tunnel, indicating that surface-calibrated Peck parameters should not be transferred directly to subsurface deformation assessment.
(4) The correction coefficients are most appropriately used within a staged parameter-updating framework. Statistical distributions can provide initial priors, which should subsequently be refined using project-specific information and field monitoring. Joint updating of and should remain consistent with settlement-trough volume or independently estimated ground loss, while depth-dependent corrections should be incorporated when evaluating subsurface structures. This provides a practical basis for deformation assessment of both surface buildings and underground infrastructure.
Author Contributions
Conceptualization, Z.N. and P.Z.; methodology, Z.N. and P.Z.; software, Z.N., P.Z., and L.L.; validation, Z.N., P.Z. and X.S.; investigation, Z.N., L.S., and L.L.; resources, P.Z., L.S., and X.S.; data curation, Z.N. and P.Z.; writing—original draft preparation, Z.N., P.Z., L.S. and Q.H.; writing—review and editing, P.Z., L.S., X.S., and Q.H.; visualization, Z.N., P.Z., and L.L.; supervision, P.Z.; project administration, P.Z. and L.S.; funding acquisition, Z.N. All authors have read and agreed to the published version of the manuscript.
Funding
This research was funded by the Innovation Capability Support Plan of Shaanxi Province Innovation Team, grant number 2020TD-005.
Data Availability Statement
The data will be made available upon reasonable request.
Acknowledgments
The authors would like to sincerely thank all colleagues and technical staff involved in the railway field measurements and data processing for their valuable support and assistance in this work.
Conflicts of Interest
The authors declare no conflicts of interest.
References
- Ansari, A.; Samanta, M. Empirical Modelling of Tunnelling Induced Ground Deformations Based on Comprehensive Case Assessment. Geotech. Geol. Eng. 2026, 44, 138. [Google Scholar] [CrossRef]
- Zhou, P.Y.; Wang, J.B.; Song, Z.P.; Cao, Z.L.; Pei, Z.M. Construction method optimization for yransfer section between cross passage and main tunnel of metro station. Front Earth Sc.-Switz. 2022, 10, 770888. [Google Scholar] [CrossRef]
- Tian, X.; Song, Z.; Zhang, Y. Monitoring and reinforcement of landslide induced by tunnel excavation: A case study from Xiamaixi tunnel. Tunn. Undergr. Sp. Tech 2021, 110, 103796. [Google Scholar] [CrossRef]
- Zhao, M.; Cheng, Y.; Song, Z.; Wang, T.; Zhang, Y.; Gong, Y.; Song, Y. Stability analysis of TBM tunnel undercrossing existing high-speed railway tunnel: a case study from Yangtaishan Tunnel of Shenzhen Metro Line 6. Adv. Civ. Eng. 2021, 2021, 6674862. [Google Scholar] [CrossRef]
- Song, Z.; Li, S.; Zhang, X.; Wang, J.; Wang, T. Study on strata settlement regular pattern induced by tunnel construction based on Peck formula. J. Xi’an Univ. Archit. Technol. (Natural Science Edition) 2018, 50, 190–195. [Google Scholar]
- Fan, S.; Song, Z.; Xu, T.; Wang, K.; Zhang, Y. Tunnel deformation and stress response under the bilateral foundation pit construction: A case study. Arch. Civ. Mech. Eng. 2021, 21, 109. [Google Scholar] [CrossRef]
- Li, Y.; Du, X.; Meng, H.; Chen, X.; Zhang, H. Stress redistribution of loess due to tunnelling of shallow tunnels. Tunn. Undergr. Sp. Tech 2026, 170, 107393. [Google Scholar] [CrossRef]
- Farrell, R.; Mair, R.; Sciotti, A.; Pigorini, A. Building response to tunnelling. Soils Found. 2014, 54, 269–279. [Google Scholar] [CrossRef]
- Moosazadeh, S.; Namazi, E.; Aghababaei, H.; Marto, A.; Mohamad, H.; Hajihassani, M. Prediction of building damage induced by tunnelling through an optimized artificial neural network. Eng. Comput-Ger. 2019, 35, 579–591. [Google Scholar] [CrossRef]
- Zhang, R.; Liu, W.; Wei, Z.; Han, J.; Shao, G.; Li, S. Settlement Characteristics and Control Parameters for the Integrated Construction of Large-Section Underground Structures and Airport Terminals: A Case Study. Buildings-Basel 2025, 15, 3139. [Google Scholar] [CrossRef]
- Xu, J.; Wang, Y.; Gao, M.; Ni, J.; Cao, L. Effects of foundation pressure and building stiffness on tunnel-separated footing interaction. Can. Geotech. J. 2025, 62, 1–20. [Google Scholar] [CrossRef]
- Xu, J.; Franza, A.; Marshall, A.M.; Losacco, N. Role of footing embedment on tunnel–foundation interaction. J. Geotech. Geoenviron 2021, 147, 06021009. [Google Scholar] [CrossRef]
- Mroueh, H.; Shahrour, I. Three-dimensional finite element analysis of the interaction between tunneling and pile foundations. Int. J. Numer Anal. Met. 2002, 26, 217–230. [Google Scholar] [CrossRef]
- Ng, C.; Shi, J.; Mašín, D.; Sun, H.; Lei, G. Influence of sand density and retaining wall stiffness on three-dimensional responses of tunnel to basement excavation. Can. Geotech. J. 2015, 52, 1811–1829. [Google Scholar] [CrossRef]
- Xu, J.; Gui, J.; Sheil, B. A numerical investigation of the role of basements on tunnel-frame interaction in sandy soil. Comput Geotech. 2024, 169, 106197. [Google Scholar] [CrossRef]
- Shi, J.; Ng, C.; Chen, Y. Three-dimensional numerical parametric study of the influence of basement excavation on existing tunnel. Comput Geotech. 2015, 63, 146–158. [Google Scholar] [CrossRef]
- Zhang, C.; Yu, J.; Huang, M. Effects of tunnelling on existing pipelines in layered soils. Comput Geotech. 2012, 43, 12–25. [Google Scholar] [CrossRef]
- Vorster, T.; Klar, A.; Soga, K.; Mair, R. Estimating the effects of tunneling on existing pipelines. J. Geotech. Geoenviron 2005, 131, 1399–1410. [Google Scholar] [CrossRef]
- Zhang, Z.; Zhang, M.; Zhao, Q. A simplified analysis for deformation behavior of buried pipelines considering disturbance effects of underground excavation in soft clays. Arab J. Geosci. 2015, 8, 7771–7785. [Google Scholar] [CrossRef]
- Li, Y.; Han, K. Analysis of the Coupled Deformation Pattern of Existing Underground Structural Clusters Due to Undercrossing by a Super-Large-Diameter Shield Tunnel. Appl. Sci. 2026, 16, 1102. [Google Scholar] [CrossRef]
- Fei, R.; Wu, H.; Peng, L. Prediction and control of existing high-speed railway tunnel deformation induced by shield undercrossing based on BO-XGboost. Sustainability-Basel 2024, 16, 10563. [Google Scholar] [CrossRef]
- Zeng, L.; Zhang, D.; Lian, C.; Zhang, J.; Yin, H. Study on the influence of an under-crossing parallel double-line shield tunnel on the existing tunnel structure. Mathematics-Basel 2023, 11, 3125. [Google Scholar] [CrossRef]
- Huo, R.K.; Zhou, P.Y.; Song, Z.P.; Wang, J.B.; Li, S.H.; Zhang, Y.W. Study on the settlement of large-span metro station’s baseplate caused by the tunnels newly built beneath it. Adv. Mech. Eng. 2019, 11, 1–13. [Google Scholar] [CrossRef]
- Macchiarulo, V.; Milillo, P.; DeJong, M.J.; Gonzalez Marti, J.; Sánchez, J.; Giardina, G. Integrated InSAR monitoring and structural assessment of tunnelling-induced building deformations. Struct. Control Health Monit. 2021, 28, e2781. [Google Scholar] [CrossRef]
- He, C.-Y.; Ding, Z.; Huang, F. Probabilistic Prediction of Ground Deformation Induced by Shield Tunneling. Rock Mech. Rock Eng. 2026, 1–20. [Google Scholar] [CrossRef]
- Peck, R.B. Deep excavations and tunnelling in soft ground. Proc.int.conf.on Smfe 1969, 4, 225–290. [Google Scholar]
- O’Reilly, M.P.; New, B.M. Settlements above tunnels in the United Kingdom—their magnitude and prediction. In Tunnelling ’82: Proceedings of the Third International Symposium on Tunnelling; Institution of Mining and Metallurgy: London, UK, 1982; pp. 173–181. [Google Scholar]
- Mair, R.; Taylor, R.; Bracegirdle, A. Subsurface settlement profiles above tunnels in clays. Geotechnique 1993, 43, 315–320. [Google Scholar] [CrossRef]
- Loganathan, N.; Poulos, H. Analytical prediction for tunneling-induced ground movements in clays. J. Geotech. Geoenviron 1998, 124, 846–856. [Google Scholar] [CrossRef]
- Suwansawat, S.; Einstein, H.H. Describing settlement troughs over twin tunnels using a superposition technique. J. Geotech. Geoenviron 2007, 133, 445–468. [Google Scholar] [CrossRef]
- Chen, R.; Zhu, J.; Liu, W.; Tang, X. Ground movement induced by parallel EPB tunnels in silty soils. Tunn. Undergr. Sp. Tech 2011, 26, 163–171. [Google Scholar] [CrossRef]
- Fang, Y.-S.; Wu, C.-T.; Chen, S.-F.; Liu, C. An estimation of subsurface settlement due to shield tunneling. Tunn. Undergr. Sp. Tech 2014, 44, 121–129. [Google Scholar] [CrossRef]
- Xie, X.Y.; Yang, Y.B.; Ji, M. Analysis of ground surface settlement induced by the construction of a large-diameter shield-driven tunnel in Shanghai, China. Tunn. Undergr. Sp. Tech 2016, 51, 120–132. [Google Scholar] [CrossRef]
- Lu, D.C.; Lin, Q.T.; Tian, Y.; Du, X.L.; Gong, Q.M. Formula for predicting ground settlement induced by tunnelling based on Gaussian function. Tunn. Undergr. Sp. Tech 2020, 103. [Google Scholar]
- Wang, J.B.; Zhou, P.Y.; Song, Z.P.; Li, S.H.; Zhang, Q. A new calculation method for tunneling-caused stratum settlement. Ksce J. Civ. Eng. 2022, 26, 2624–2640. [Google Scholar] [CrossRef]
- Ding, J.; Zhang, S.; Zhang, H.; Guo, C.; Liao, Z.; Liu, H. Ground settlement caused by shield tunneling in soil-rock composite strata. J. Perform. Constr. Fac. 2021, 35, 04021057. [Google Scholar] [CrossRef]
- Deng, H.S.; Fu, H.L.; Yue, S.; Huang, Z.; Zhao, Y.Y. Ground loss model for analyzing shield tunneling-induced surface settlement along curve sections. Tunn. Undergr. Sp. Tech 2022, 119. [Google Scholar] [CrossRef]
- Gao, Y.; Liu, Y.; Tang, P.; Mi, C. Modification of peck formula to predict surface settlement of tunnel construction in water-rich sandy cobble strata and its program implementation. Sustainability-Basel 2022, 14, 14545. [Google Scholar] [CrossRef]
- Li, Y.; Lin, J.; Yan, S.; Du, J. Modification of the Peck formula for a double-track shield tunnel under expressway subgrade. Symmetry 2022, 14, 1904. [Google Scholar] [CrossRef]
- Kannangara, K.P.M.; Ding, Z.; Zhou, W.-H. Surface settlements induced by twin tunneling in silty sand. Undergr. Space 2022, 7, 58–75. [Google Scholar] [CrossRef]
- Hou, Y.; Zhou, M.; Zhang, D.; Fang, Q.; Sun, Z.; Tian, Y. Analysis of four shield-driven tunnels with complex spatial relations in a clay stratum. Tunn. Undergr. Sp. Tech 2022, 124, 104478. [Google Scholar] [CrossRef]
- Guo, S.F.; Wang, B.K.; Zhang, P.; Wang, S.N.; Guo, Z.H.; Hou, X.Y. Influence analysis and relationship evolution between construction parameters and ground settlements induced by shield tunneling under soil-rock mixed-face conditions. Tunn. Undergr. Sp. Tech 2023, 134, 105020. [Google Scholar] [CrossRef]
- Li, J.; Liu, A.; Xing, H. Study on ground settlement patterns and prediction methods in Super-Large-Diameter shield tunnels constructed in composite strata. Appl. Sci. 2023, 13, 10820. [Google Scholar] [CrossRef]
- Lou, P.; Li, Y.; Tang, X.; Lu, S.; Xiao, H.; Zhang, Z. Influence of double-line large-slope shield tunneling on settlement of ground surface and mechanical properties of surrounding rock and segment. Alex. Eng. J. 2023, 63, 645–659. [Google Scholar] [CrossRef]
- Wang, F.; Du, X.L.; Li, P.F. Prediction of subsurface settlement induced by shield tunnelling in sandy cobble stratum. J. Rock Mech. Geotech. 2024, 16, 192–212. [Google Scholar] [CrossRef]
- Kong, F.; Lu, D.; Lin, Q.; Du, X. Explicit Peck formula applied to ground displacement based on an elastic analytical solution for a shallow tunnel. Front Struct. Civ. Eng. 2024, 18, 1637–1648. [Google Scholar] [CrossRef]
- Peng, L.; Huang, R.; Seiki, T.; Nie, D.; Yamaoka, S.; Dong, Q.; Lu, P. Study of the influence of deviations in both jacking force and cutterhead torque during shield tunnelling in soft ground. Sci. Rep.-Uk 2025, 15, 26947. [Google Scholar] [CrossRef]
- Zhou, P.; Song, Z.; Wang, J.; Zhang, Y.; Tian, X. Prediction method for ground surface settlement induced by bias tunnel based on stochastic medium theory. Chin. J. Geotech. Eng. 2025, 47, 589–598. [Google Scholar]
- Zhou, P.; Wang, J.; Song, Z.; Tian, X.; Zhang, Y.; Xiao, W.; Yagiz, S. Theoretical prediction method for settlement of existing tunnel induced by undercrossing. Transp. Geotech. 2026, 102111. [Google Scholar] [CrossRef]
- Ye, X.W.; Jin, T.; Chen, Y.M. Machine learning-based forecasting of soil settlement induced by shield tunneling construction. Tunn. Undergr. Sp. Tech 2022, 124. [Google Scholar]
Figure 1.
Research framework of multi-source engineering evidence.
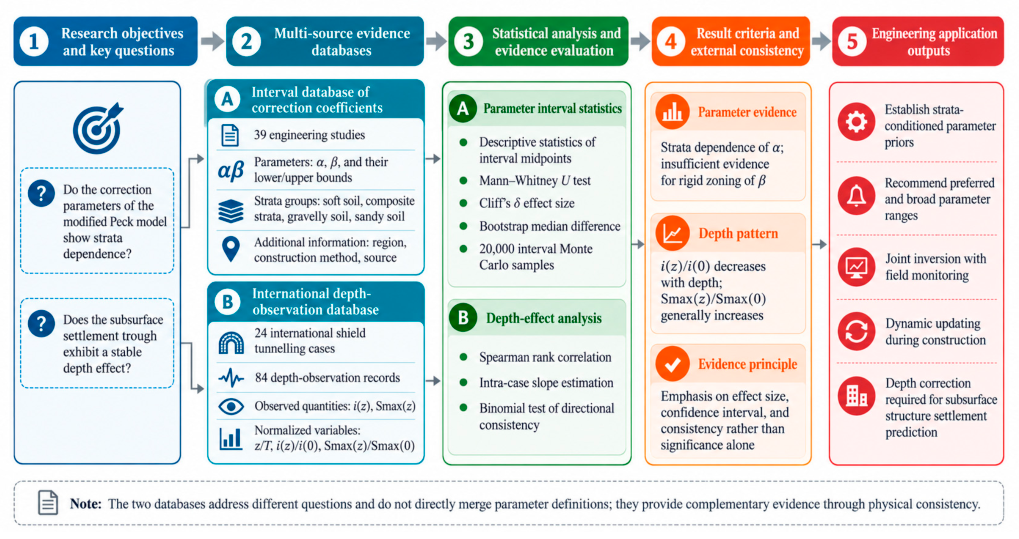
Figure 2.
Schematic illustration of ground deformation propagation and associated structural impacts induced by tunnel excavation.
Figure 2.
Schematic illustration of ground deformation propagation and associated structural impacts induced by tunnel excavation.
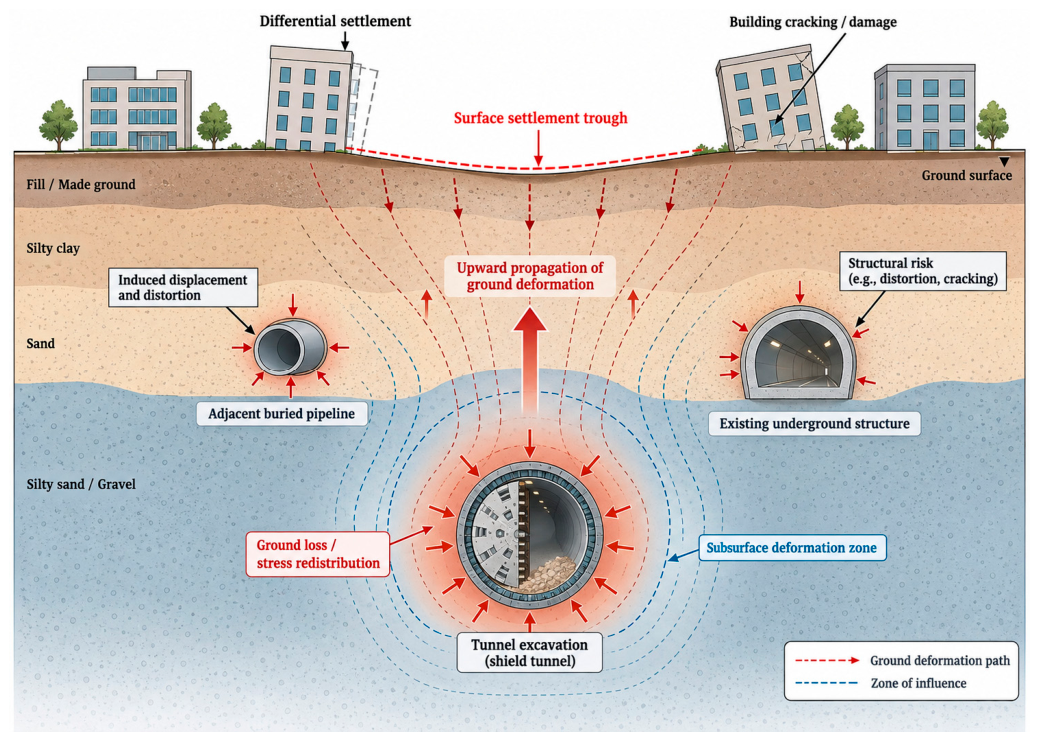
Figure 3.
Schematic representation of the conventional Peck settlement trough and its characteristic parameters.
Figure 3.
Schematic representation of the conventional Peck settlement trough and its characteristic parameters.
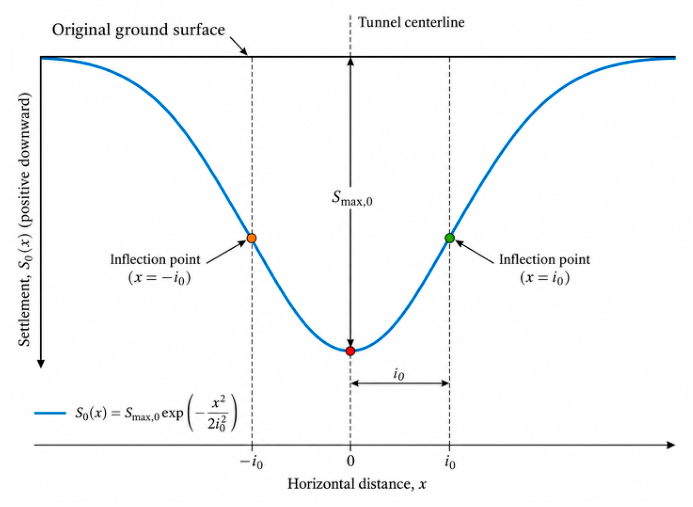
Figure 4.
Schematic definition of normalized observation depth and depth-dependent settlement-trough parameters.
Figure 4.
Schematic definition of normalized observation depth and depth-dependent settlement-trough parameters.
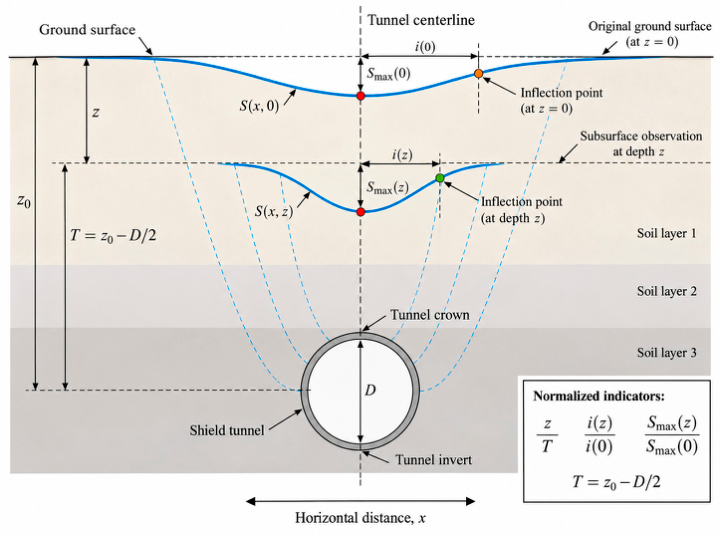
Figure 5.
Statistical framework for interval uncertainty propagation and case-level depth-effect evaluation.
Figure 5.
Statistical framework for interval uncertainty propagation and case-level depth-effect evaluation.
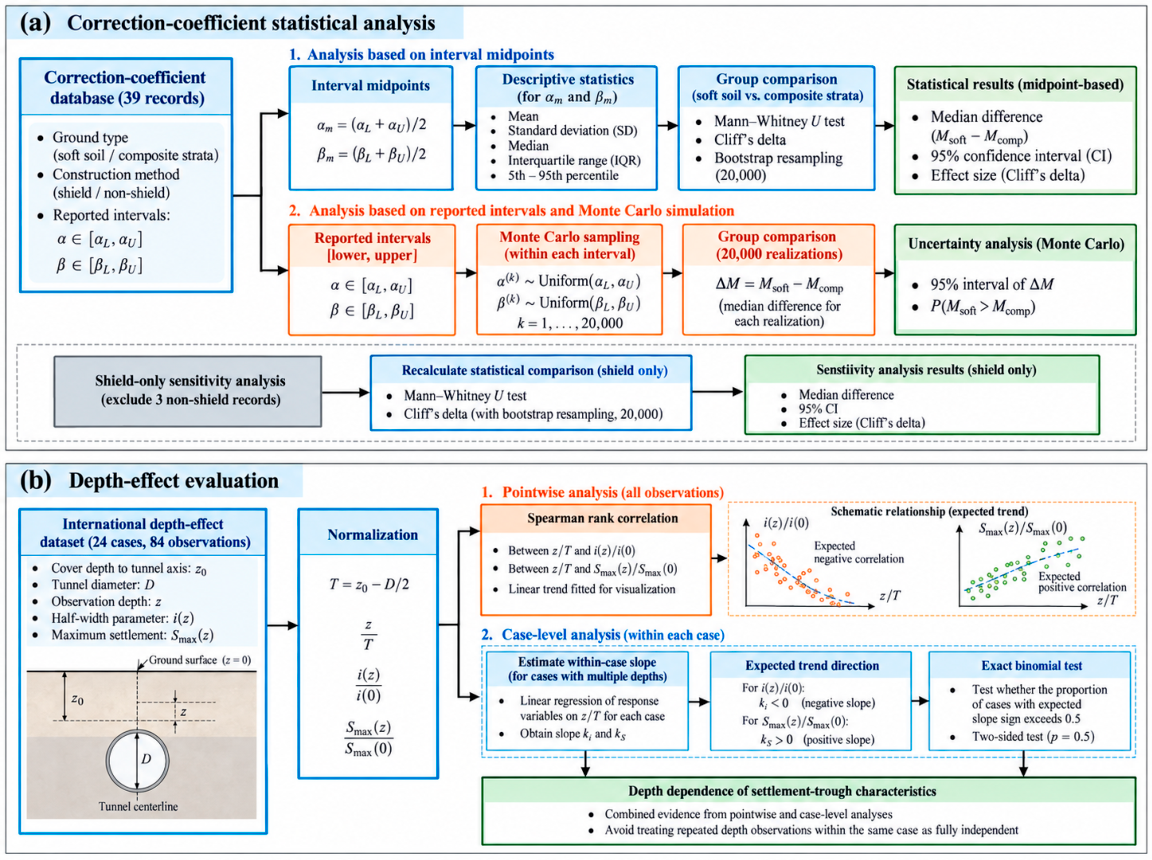
Figure 6.
Reported intervals of the maximum-settlement correction coefficient for soft soil..
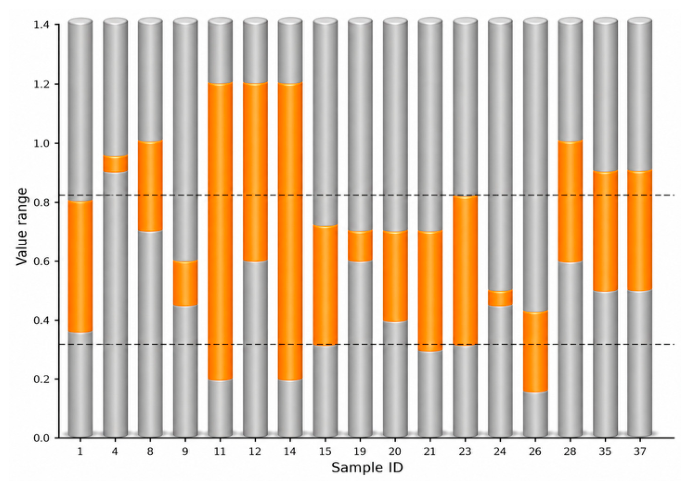
Figure 7.
Reported intervals of the settlement-trough-width correction coefficient for soft soil.
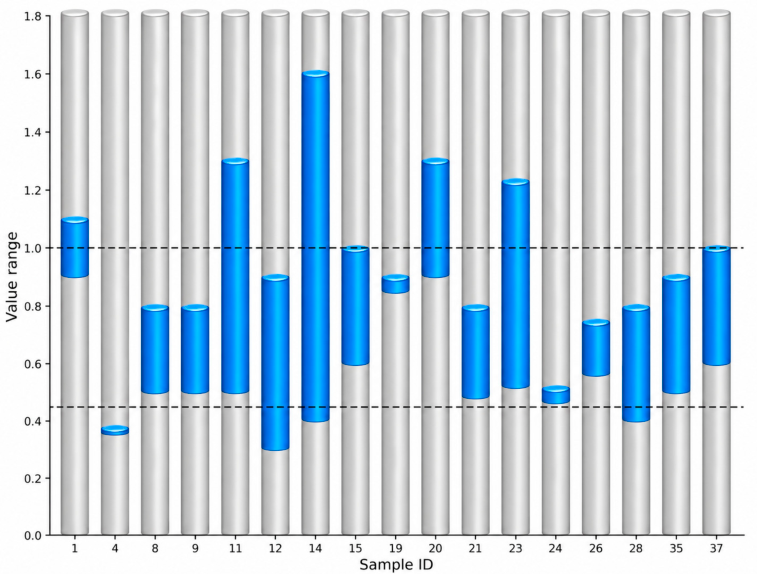
Figure 8.
Reported intervals of the maximum-settlement correction coefficient for composite strata.
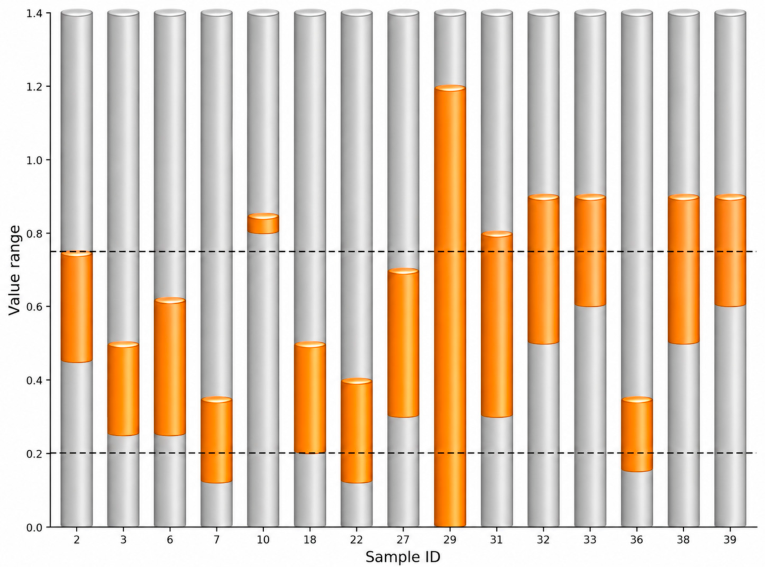
Figure 9.
Reported intervals of the settlement-trough-width correction coefficient for composite strata.
Figure 9.
Reported intervals of the settlement-trough-width correction coefficient for composite strata.
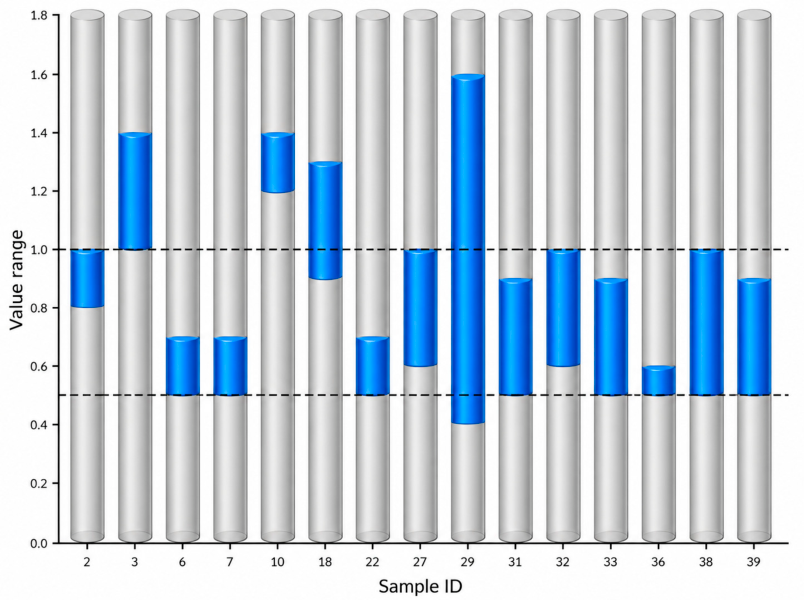
Figure 10.
Distributions of the interval midpoints of and under different ground conditions.
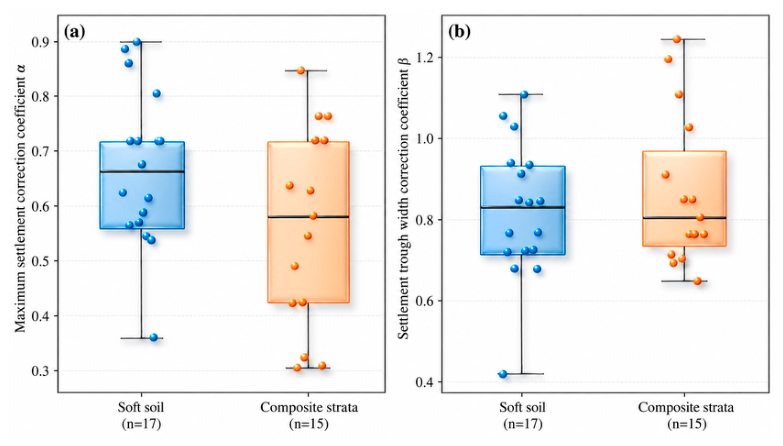
Figure 11.
Interval Monte Carlo uncertainty analysis of the between-group differences in and .
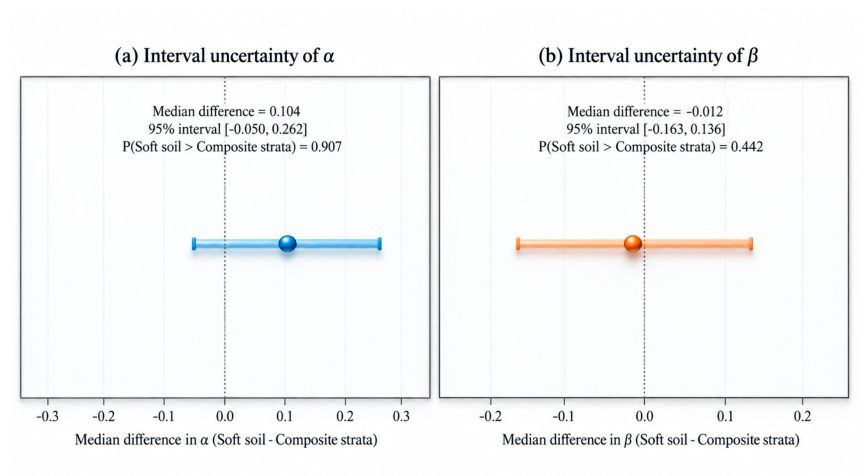
Figure 12.
Normalized depth dependence of settlement-trough width and maximum settlement in international shield-tunnelling cases.
Figure 12.
Normalized depth dependence of settlement-trough width and maximum settlement in international shield-tunnelling cases.
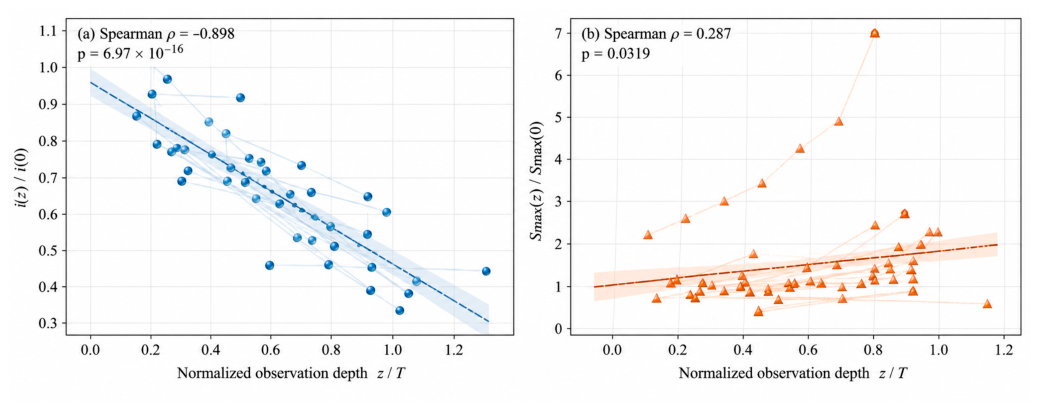
Figure 13.
Framework for staged selection and updating of modified Peck-model parameters for surface and subsurface deformation assessment.
Figure 13.
Framework for staged selection and updating of modified Peck-model parameters for surface and subsurface deformation assessment.
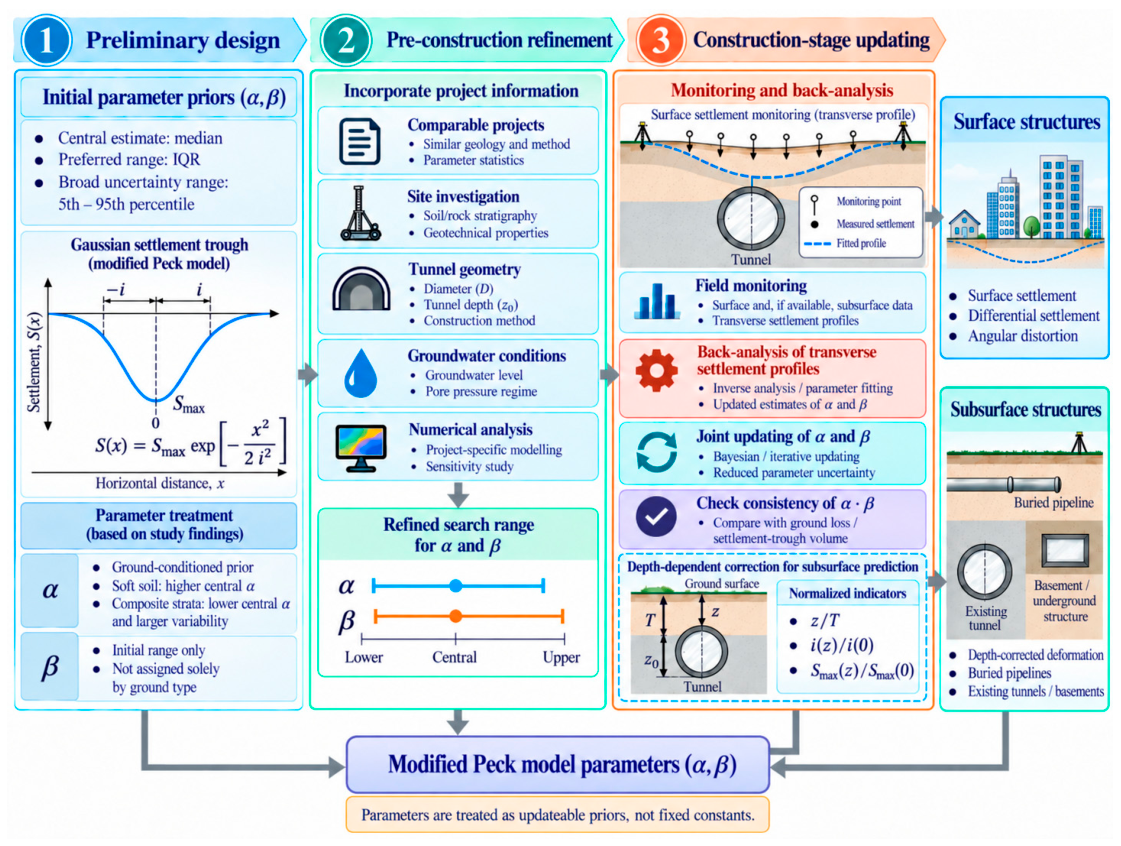
Table 1.
This is a table. Tables should be placed in the main text near to the first time they are cited.
Table 1.
This is a table. Tables should be placed in the main text near to the first time they are cited.
| Ground type | No. of datasets | Shield tunnelling | Other construction methods | Overall range of | Overall range of |
| Soft soil | 17 | 17 | 0 | 0.172-1.200 | 0.300-1.600 |
| Composite strata | 15 | 13 | 2 | 0.000-1.200 | 0.400-1.600 |
| Gravelly soil | 4 | 4 | 0 | 0.300-1.200 | 0.500-1.748 |
| Sandy soil | 3 | 2 | 1 | 0.107-0.809 | 0.176-0.900 |
Table 2.
Descriptive statistics of the interval midpoints of the correction coefficients.
| Ground type | Parameter | n | Mean | Standard deviation | Median | Interquartile range | 5th–95th percentile |
| Soft soil | 17 | 0.644 | 0.159 | 0.650 | 0.530–0.700 | 0.453–0.888 | |
| 17 | 0.772 | 0.185 | 0.795 | 0.650–0.895 | 0.554–1.046 | ||
| Composite strata | 15 | 0.526 | 0.201 | 0.550 | 0.350–0.700 | 0.247–0.776 | |
| 15 | 0.823 | 0.221 | 0.750 | 0.672–0.935 | 0.600–1.222 | ||
| Gravelly soil | 4 | 0.635 | 0.174 | 0.671 | 0.562–0.744 | 0.432–0.789 | |
| 4 | 1.079 | 0.443 | 0.985 | 0.770–1.294 | 0.698–1.592 | ||
| Sandy soil | 3 | 0.467 | 0.215 | 0.519 | 0.375–0.585 | 0.259–0.637 | |
| 3 | 0.537 | 0.258 | 0.610 | 0.430–0.680 | 0.286–0.736 |
Table 3.
Comparison of correction coefficients between soft soil and composite strata.
| Parameter | U | p | Cliff’s | Bootstrap median difference [95% CI] | Interval Monte Carlo median difference [95% interval] | P(Soft soil>Composite strata) |
| 166.000 | 0.150 | 0.302 | 0.100 [-0.107, 0.350] | 0.104 [-0.050, 0.262] | 0.907 | |
| 120.000 | 0.791 | -0.059 | 0.000 [-0.200, 0.175] | -0.012 [-0.163, 0.136] | 0.442 |
Table 5.
Depth dependence of settlement-trough characteristics in international shield-tunnelling cases.
Table 5.
Depth dependence of settlement-trough characteristics in international shield-tunnelling cases.
| Response | No. of subsurface observations | No. of cases | Spearman’s |
Pointwise p-value |
Cases with consistent trend direction | Exact binomial p-value |
| i(z)/i(0) | 42 | 17 | -0.898 | 6.97e-16 | 17/17(-) | 7.63e-06 |
| Smax(z)/ Smax (0) | 56 | 22 | 0.287 | 0.0319 | 20/22(+) | 6.06e-05 |
Table 6.
Data-derived initial priors for the modified Peck-model correction coefficients.
| Ground type | Parameter | Central value | Preferred range (IQR)) | Broad range (5th–95th percentile) | Application guidance |
| Soft soil | 0.650 | 0.530–0.700 | 0.453–0.888 | May be used as a strata-conditioned prior; must be updated using field monitoring data | |
| 0.795 | 0.650–0.895 | 0.554–1.046 | Should not be prescribed solely according to ground type | ||
| Composite strata | 0.550 | 0.350–0.700 | 0.247–0.776 | Should be calibrated considering rockhead position and construction method | |
| 0.750 | 0.672–0.935 | 0.600–1.222 | May be used as a strata-conditioned prior; must be updated using field monitoring data |
Disclaimer/Publisher’s Note: The statements, opinions and data contained in all publications are solely those of the individual author(s) and contributor(s) and not of MDPI and/or the editor(s). MDPI and/or the editor(s) disclaim responsibility for any injury to people or property resulting from any ideas, methods, instructions or products referred to in the content. |
© 2026 by the authors. Licensee MDPI, Basel, Switzerland. This article is an open access article distributed under the terms and conditions of the Creative Commons Attribution (CC BY) license (http://creativecommons.org/licenses/by/4.0/).
Copyright: This open access article is published under a Creative Commons CC BY 4.0 license, which permit the free download, distribution, and reuse, provided that the author and preprint are cited in any reuse.