
Submitted:
19 September 2026
Posted:
20 September 2026
You are already at the latest version
Abstract
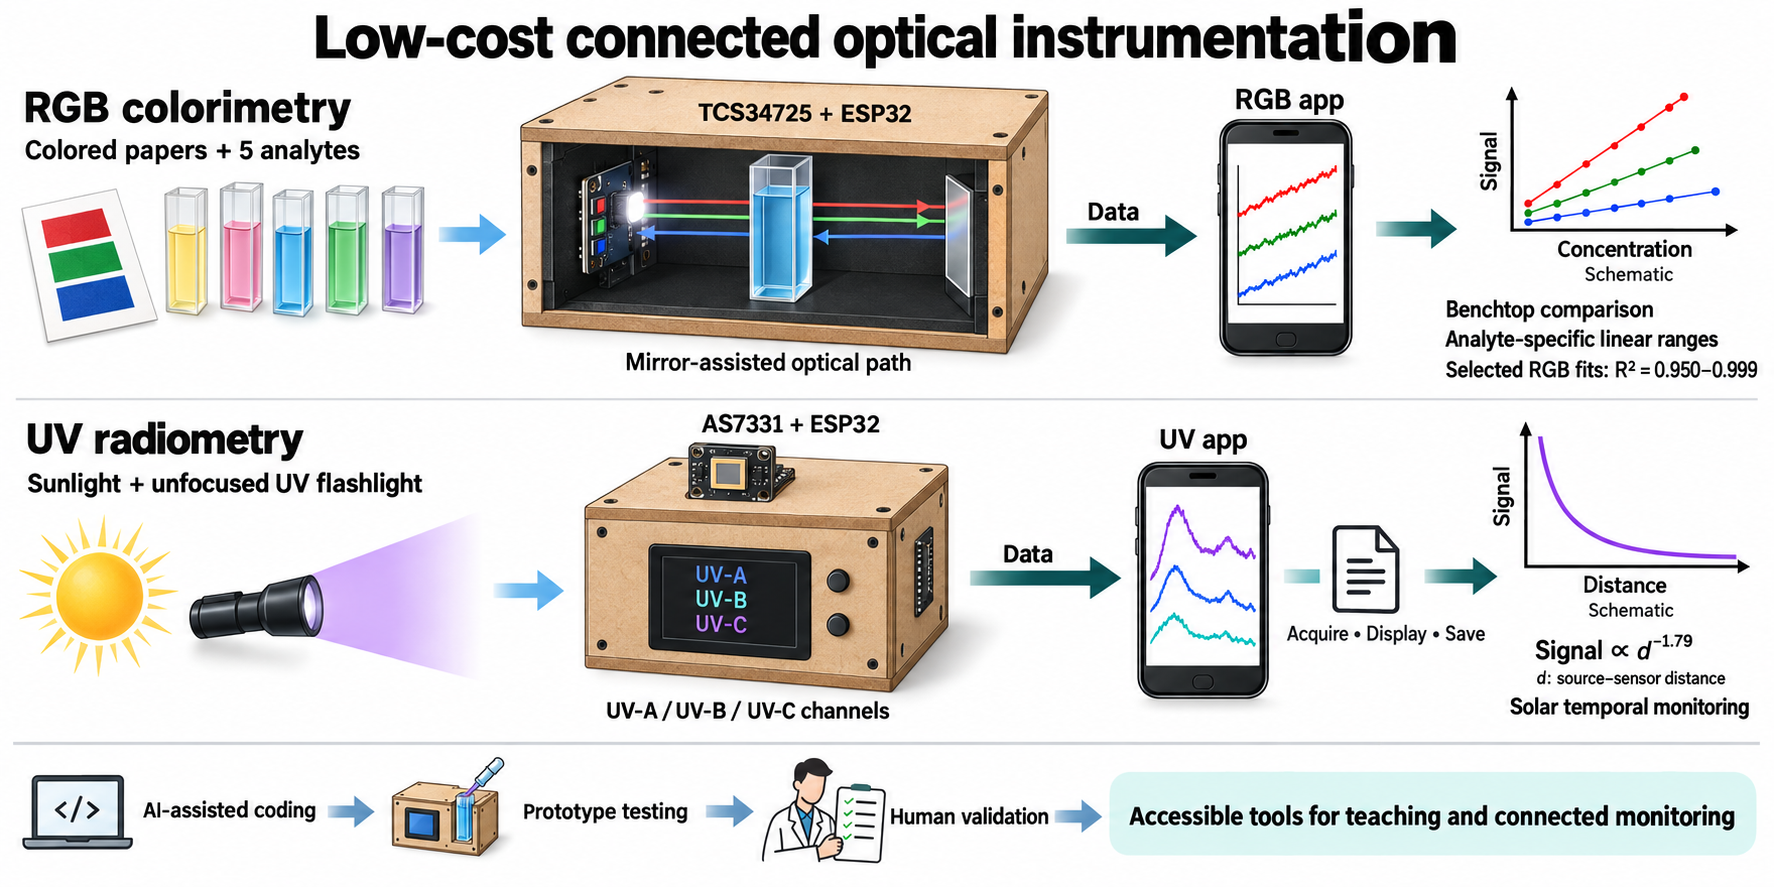
Limited access to analytical instrumentation motivates the development of affordable alternatives. This study describes the construction and evaluation of two ESP32-based optical prototypes: an RGB colorimeter using a TCS34725 sensor and an ultraviolet radiometer using an AS7331 sensor. The RGB device combined a darkened chamber with a mirror-assisted optical path and was evaluated using colored papers and solutions of potassium permanganate, methylene blue, rhodamine B, zinc phthalocyanine, and free-base tetraphenylporphyrin. Paper measurements distinguished colors but differed from nominal RGB codes due to factors as print configuration and paper type. Comparisons with a benchtop spectrophotometer revealed analyte- and channel-dependent linear ranges, with R² values of 0.950-0.999 for selected RGB fits. In a test using an unfocused UV flashlight, the recorded signal decreased with increasing source-sensor distance, exhibiting behavior close to that predicted by the inverse-square law. Solar monitoring yielded temporal profiles qualitatively similar to commercial records obtained at a different location and date. Dedicated applications supported data acquisition, visualization, and storage. Artificial intelligence assisted development under human supervision. The results indicate potential for accessible instrumentation, experimental teaching, and connected monitoring, while emphasizing application-specific calibration and the limitations of the evaluated configurations.
Keywords:
Do-It-Yourself (DIY) prototypes
; open-source hardware
; spectrophotometry
; solar radiometry
; ESP32
; democratization of science
; internet of analytical things (IoAT)
; environmental monitoring
1. Introduction
Chemical analysis plays an indispensable role in contemporary society, serving as a fundamental cornerstone of environmental monitoring, clinical diagnosis, and food safety [1,2]. The systematic surveillance and quantification of specific chemical species—both ionic and molecular, including heavy metals, pesticides, and toxic volatile organic compounds (VOCs)—are crucial for assessing environmental health and mitigating ecotoxicological risks [1,2,3,4]. In clinical medicine, the accurate determination of biomarkers in blood or saliva, such as creatinine, bilirubin, lipids, and hemoglobin, is a vital requirement for accurate disease diagnosis, assessment of organ function, and monitoring of patient treatment [2,5]. Within this analytical framework, spectrophotometric and colorimetric methods, which are based on the linear correlation between light absorption and analyte concentration defined by the Beer-Lambert law, are widely established as robust techniques for determining contaminants, nutrients, and active metabolites in various matrices, such as clinical fluids, water systems, and agricultural soils [2,6,7,8]. Educational initiatives focused on teaching visible spectroscopy and radiation–matter interactions have employed simplified systems built by students to reinforce absorbance concepts in a practical and engaging manner [6,8,9,10,11].
Despite the analytical reliability and high precision of conventional commercial spectrophotometers, their widespread adoption is severely limited by prohibitive acquisition and maintenance costs, their large laboratory footprint, and the need for highly specialized technical operators [1,2,6,8]. These economic and physical limitations restrict high-quality analytical testing to centralized laboratory facilities, hindering rapid, real-time, on-site (in situ) monitoring [2,4,12]. Consequently, the development of portable and affordable Do-It-Yourself (DIY) prototypes based on open-source electronic platforms—such as Arduino and Raspberry Pi—has emerged as a transformative approach to providing affordable sensing solutions with comparable analytical performance, also enabling the development of integrated tools for low-cost electronics and electrochemical instrumentation in undergraduate laboratories [2,13,14,15]. From an educational perspective, standard laboratory spectrophotometers typically operate as closed, proprietary “black boxes,” concealing their optical and electronic principles from students [8,16]. In contrast, the construction of transparent DIY photometers using readily available components—such as light-emitting diodes (LEDs) as monochromatic or broadband sources, light-dependent resistors (LDRs) or integrated color sensors as phototransducers, and 3D-printed or PVC-based cuvette holders—democratizes science education by directly engaging students in physical assembly and the fundamental physics of light–matter interactions [2,6,8,14,16,17].
The practical utility of low-cost DIY optical devices spans a diverse range of industrial and research sectors, including food quality control (e.g., the quantification of synthetic dyes such as tartrazine and brilliant blue [14] or the detection of food adulterants) and fuel characterization (e.g., the spectrophotometric determination of iron(III) in bioethanol fuel using customized smartphone-based sensors [1]). Beyond liquid-phase photometry, the custom fabrication of radiometers using open-source microcontrollers represents a critical capability for solar and atmospheric sciences [18]. Whereas standard photometers measure narrow-field radiance to analyze light attenuation along the sample path, radiometers measure global solar irradiance, capturing direct and diffuse radiation components over a wider field of view [18]. In environmental chemistry and physical meteorology, the development of multispectral radiometers based on digital UV/visible sensors (such as the AS7331 or AS7265x) or linear variable interference filters (VIFs) coupled to photodiode arrays (PDAs) enables continuous monitoring of ultraviolet radiation levels (UVA, UVB, UVC) [15,18], calculation of aerosol optical depth (AOD/POA) [18], and assessment of atmospheric radiative forcing [18]. These DIY instruments provide vital, spatially distributed datasets essential for solar energy modeling and for assessing the impacts of anthropogenic climate change [18].
In recent years, the exponential growth of “maker culture” and open-hardware movements has catalyzed the consolidation of the Internet of Analytical Things (IoAT), introducing a connected paradigm to analytical chemistry [1,19]. Within this framework, chemical sensors are no longer operated as isolated, stand-alone measurement systems; instead, they are integrated as active intelligent nodes within a global sensor network [19]. Modern open-source microcontrollers, such as dual-core ESP32 and Raspberry Pi platforms, feature integrated Wi-Fi and Bluetooth Low Energy (BLE) communication protocols, allowing DIY colorimeters and radiometers to automatically process analytical signals, manage measurements, and transmit data directly to cloud-based databases, decentralized servers, or mobile user dashboards [4,20]. This technological synergy facilitates real-time remote environmental surveillance and decentralized point-of-care clinical diagnostics, providing highly efficient, data-driven analytical monitoring for remote or resource-limited regions worldwide [1,19]. This decentralization of analytical hardware is strengthened by integrating edge intelligence (Edge Intelligence) and embedded machine learning models (TinyML) into low-cost microcontrollers, enabling highly complex on-site spectral analyses [21,22]. Correct the citation format!
However, a distinct gap remains in the scientific literature: few studies integrate comprehensive, multi-analyte validation of low-cost RGB reflectance colorimetry against high-resolution benchtop instruments while simultaneously evaluating a connected multispectral UV radiometer on a single microcontroller platform. This work addresses that gap by presenting a complete technical and experimental validation of two connected DIY prototypes based on the ESP32 and high-performance digital sensors. The first is an RGB reflectance-based spectrophotometer validated through quantitative determinations of five structurally diverse dyes and complexes (Methylene Blue, Rhodamine B, Zinc Phthalocyanine, Tetraphenylporphyrin, and Potassium Permanganate) in aqueous and organic media. Measurements of solid systems (papers) with standardized colors in the RGB system were also performed to achieve reliable color recognition. The second is a multispectral UV radiometer employing the AS7331 digital sensor, validated through irradiance–distance profiles and sunlight measurements (in the cities of Amargosa and Barreiras, Bahia/Brazil). The results reported here demonstrate the precise limits, calibration modes, and structural corrections required to employ these low-cost devices as reliable scientific instruments.
2. Materials and Methods
To ensure scientific reproducibility, the experimental procedures, hardware architectures, and data flows are detailed below. All physical structural components were fabricated using rapid prototyping and laser-cutting techniques, and the firmware was developed exclusively for the ESP32 microcontroller platform (using the Arduino IDE for programming and compilation, given its open-source libraries).
The commercial reference spectrophotometer used was a Global Trade Technology UV-5100 instrument, operating over a broad spectral range of 190 to 800 nm. Spectrophotometric measurements of liquid solutions were performed in standard quartz or glass cuvettes with an optical path length of exactly 1.0 cm. All organic solvents were used as received from the manufacturers, and the water used to prepare aqueous solutions was distilled before use. The compounds KMnO₄ (Proquimios, analytical grade, 99%), Methylene Blue (Cinética, >99%), and Rhodamine B (Merck, analytical grade, 98%) were purchased commercially and used without further purification. H₂-TPP and ZnPc were synthesized following classical procedures well established in the literature. For H2-TPP, the reaction involved an equimolar mixture of pyrrole and benzaldehyde in the presence of acetic acid and nitrobenzene, under acid reflux, as described by De Paula et al. [23]. Zinc phthalocyanine was prepared by refluxing phthalonitrile in the presence of zinc chloride in 1-hexanol and drops of DBU, under an inert atmosphere, at 127 ºC for 24 hours in a Schlenk tube, as described in previously published studies [24].
For controlled ultraviolet radiation measurements, an ultraviolet flashlight equipped with adjustable beam focus (Lelong, LE- 8303) was used.
2.1. Architecture of the RGB Spectrophotometer Prototype
The DIY RGB spectrophotometer was designed as a compact, portable, and connected system based on the dual-core ESP32 microcontroller platform, connected to a TCS34725 digital color sensor module (purchased commercially through international shopping platforms) (Figure 1). The TCS34725 sensor incorporates a 3x4 photodiode filter array (Red, Green, Blue, and Clear/White channels) together with an integrated 16-bit analog-to-digital converter (ADC) to convert raw light intensities into digital counts. The optical architecture includes an integrated neutral-white LED emitter and a custom cuvette holder, fabricated together with the entire structural enclosure of the prototype from laser-cut MDF (medium-density fiberboard), with a matte-black interior coating to ensure an environment completely sealed against external light, with an optical path length fixed at exactly 1.00 cm. Owing to a hardware design limitation, the integrated LED of the TCS34725 module could not be switched off via software during runtime. This prevented the acquisition of a true electronic dark-current background, thus restricting the operational workflow of the prototype to a blank-only reference mode, in which the initial transmission of light through the pure solvent was stored as the 100% transmittance baseline (I0). Pseudo-absorbance values for each RGB channel were calculated locally using the standard Beer-Lambert relationship: Abs_C = -log10(C_sample / C_blank), where C_sample and C_blank represent the raw digital counts of channel C (R, G, or B). The ESP32 firmware manages continuous readings in “Continuous mode,” peak-count acquisition, and telemetry, transmitting structured lines through serial or BLE connections. This enables local processing and export in CSV format via Python scripts or spreadsheet editors. In addition, a relative “modeled scan” from 400 to 750 nm was reconstructed by applying three normalized Gaussian transfer functions centered at 470 nm (Blue), 530 nm (Green), and 620 nm (Red). It is essential to state that this modeled spectral curve is intended strictly for relative visual comparison; the reconstructed wavelength axis in nanometers does not correspond to direct physical wavelength dispersion and lacks the physical spectral resolution of a commercial benchtop spectrophotometer.
To enable liquid-phase determinations and optimize this optical architecture, an essential structural modification was made to the mechanical holder. The TCS34725 digital color sensor was originally designed to operate predominantly in direct diffuse reflectance mode, an arrangement highly suited to the chromatic characterization of opaque solid surfaces (such as the colored cards and papers described in Section 2.5). However, when measuring homogeneous solutions in transmission cuvettes, most of the luminous flux emitted by the integrated LED was found to pass through the liquid sample without returning an energetically significant amount to the active photodiode array, resulting in a low signal-to-noise ratio and channel instability. To overcome this geometric limitation, a flat reflecting mirror was integrated into the mechanical face opposite the sensor emitter, precisely aligned with the optical axis of the illumination beam (Figure 1). This arrangement creates a reflection-based double-pass optical geometry (reflectance-assisted transmission), forcing the transmitted radiation to pass back through the 1.00 cm cuvette toward the active detection area of the TCS34725. This simple, low-cost adaptation maximized the sample-modulated light flux reaching the photodiodes, reducing fluctuations and providing a substantial increase in the sensitivity and metrological reproducibility of the RGB channels. Although the addition of the mirror does not give the prototype the physical resolution of a conventional double-beam scanning spectrophotometer, it provided the optical system with the robustness and operational stability required for subsequent analytical validations.
2.2. “Monitor RGB BLE” Android Application
To automate data acquisition and transition from a wired serial-USB pipeline to a fully mobile workflow, a dedicated Android application entitled “Monitor RGB BLE” was developed. In this project, the Monitor RGB (Figure 2) and UV Radiometer (Figure 4) applications were developed interactively with the assistance of the Codex model (Plus, Version 6.0 and earlier), dynamically integrating experimental laboratory requirements with ESP32 C++ firmware programming, real-time user interface design, and successive tests on physical devices. “Monitor RGB BLE” was implemented using the Expo framework and React Native in TypeScript, employing the react-native-ble-plx library to manage wireless communication via Bluetooth Low Energy (BLE), and the react-native-svg library for dynamic graphical rendering of transmittance, reflectance, and pseudo-absorbance profiles (Figure 2). Communication is based on a custom BLE UART protocol that operates with newline-delimited text-string commands. The application establishes a secure BLE connection with the ESP32 (using the standard Nordic UART Service UUID: 6E400001-B5A3-F393-E0A9-E50E24DCCA9E) to transmit control commands (such as blank calibration, initiation of continuous-mode readings, and modeled scanning) and receive structured telemetry lines. To mitigate packet loss and graphical data latency during continuous operation, the application implements an efficient BLE scanning routine, diagnostics of active GATT connections, and batched graphical updates to prevent interface freezing. During real-time operation, incoming notifications are processed through an incremental line parser with a line buffer, a crucial design decision because individual BLE notifications do not guarantee delivery of a complete text line per packet.
The software provides an interactive assistant for auxiliary calibration using printed color cards (described in Section 2.5), a solvent blank reference routine (blank-only), dedicated modes for stable peak acquisition, and visual reconstruction of the modeled 400–750 nm scan. Data are saved locally through the expo-file-system API in a structured relational format containing raw counts (raw), percentage transmittance (trans), and calculated absorbances (calcAbs). The entire historical dataset, together with graph screenshots generated using react-native-view-shot, can be compressed into ZIP format using the JSZip library and shared instantly via expo-sharing. The UV radiometer application followed the same technical development method and connected architecture, adapted to synchronously display, process, and record UVA, UVB, and UVC irradiances, total UV power, and accumulated dose, as well as continuous time series. Both applications were compiled as native Android APKs for Android 8.0 or later and validated together with the physical prototypes.
2.3. Architecture of the Multispectral UV Radiometer
The multispectral UV radiometer was built using the AS7331 digital UV sensor (purchased commercially through international shopping platforms) connected to an ESP32 microcontroller. The AS7331 is a highly integrated, low-power CMOS sensor featuring separate detection channels for the UVA (315–400 nm), UVB (280–315 nm), and UVC (200–280 nm) bands. The sensor was configured in continuous measurement mode with adjustable gain (up to 16X or 64X for low-light conditions) and digital integration cycles to optimize count resolution. The complete autonomous acquisition system integrates a 0.96-inch I2C OLED display (SSD1306) to show real-time UVA/UVB/UVC/Total UV values, an integrated microSD card module for stand-alone data logging, and a serial transmission link via Bluetooth Classic to transmit data to a remote terminal or mobile dashboard. The prototype enclosure was developed similarly to that of the RGB prototype, using an MDF (medium-density fiberboard) box. All internal circuits, including the ESP32 microcontroller, OLED display, and microSD card reader, were housed and protected inside this MDF box, while only the AS7331 digital UV sensor was mounted outside the structure, directly exposed to the sun to freely receive incident natural or artificial ultraviolet light during measurements (Figure 3).
2.4. Web Dashboard and Android Application for the UV Radiometer
To facilitate long-term atmospheric monitoring and controlled laboratory photochemical experiments, a connected telemetry ecosystem was developed for the UV radiometer, consisting of a Web Dashboard and a dedicated Android application (Figure 4). The Web Dashboard is built as a local web application served through browsers that support the Web Serial and Web Bluetooth APIs, enabling direct communication through a USB-serial cable or BLE GATT notifications. The interface supports two main operating modes: (i) ‘Timed Sessions,’ in which the user sets a precise recording duration and a Peak Parameter Interval (PPH) using structured commands, and (ii) ‘Real-Time Sessions,’ which stream continuous data to the screen. To minimize memory usage and transmission bandwidth during solar campaigns lasting several hours, the Web Dashboard supports a ‘Peak Recording by Window’ feature, whereby the system records only the maximum UV intensity within a configurable time window. In addition, the dashboard can issue remote commands to list, verify, and transfer log files stored on the microSD card (using a protocol structured by the FILES_BEGIN and FILES_END markers). The companion Android application integrates this HTML/JS interface into a local WebView, connecting Javascript calls to a native Java BLE UART manager (MainActivity.kt and BleUartManager.kt). This architecture requires Android 8.0 or later and explicit location permissions for BLE. A crucial technical distinction must be maintained between Bluetooth Classic Serial (RFCOMM) and Bluetooth Low Energy (BLE) GATT protocols; they are not electronically or programmatically equivalent, with BLE requiring precise characteristic-based read/write notifications to prevent connection drops and data corruption.
2.5. Functional Calibration of the RGB Prototype Using Colored Papers
To verify the functional response of the TCS34725 RGB sensor and ensure correct channel mapping, a qualitative solid-surface reflectance calibration was designed using a standardized sheet containing ten printed color cards (CIE standard): White (#FFFFFF; no ink), Black (#101010), Gray (#808080), Red (#C83C3C), Green (#33A65C), Blue (#2D6FD2), Cyan (#2FA8C8), Magenta (#C85AA5), Yellow (#D9C44A), and an additional “Reference Blue” (#1A86E3) [1]. This test was developed as a rapid diagnostic protocol to identify possible channel swaps in the firmware, assess the effect of optical geometry and sensor-to-surface distance, and confirm the consistency of the hexadecimal color code displayed by the mobile application. The procedure was implemented through a specific calibration function programmed into the “Monitor RGB BLE” mobile application. The user initiates the process through the application, which first requests a white reference reading using a standard sheet of white paper for reflectance calibration. After this initial blank step, the application guides the user through sequential on-screen instructions to place each printed color strip under the sensor, maintaining a fixed incidence geometry and distance for individual recording of the RGB channels. The test sheet was printed using an Epson L495 inkjet printer at an exact scale of 100%, on white, matte laid paper with a basis weight of 180 g/m2, ensuring that all automatic enhancement, contrast enhancement, or photo correction features of the printer were completely disabled to preserve nominal color values. It must be explicitly stated that this colored-paper test is strictly qualitative and auxiliary; it serves as a functional demonstration of the communication flow between the firmware, mobile application, and physical surfaces, and does not replace rigorous analytical calibration for cuvette solutions using a solvent blank, liquid standards of known concentration, replicates, and commercial benchtop spectrophotometers.
2.6. Preparation of Solutions, Analytes, and Benchtop Spectrophotometric Comparison
To assess the optical response and linear range of the low-cost RGB spectrophotometer, five distinct analytical solutions were prepared.
Stock solutions were prepared in distilled water for KMnO₄ (6.606 × 10⁻³ mol dm⁻³), Rhodamine B (4.630 × 10⁻⁴ mol dm⁻³), and methylene blue (1.000 × 10⁻³ mol dm⁻³). Analytical-grade tetrahydrofuran was used to prepare the zinc(II) phthalocyanine (ZnPc) solution (1.000 × 10⁻³ mol dm⁻³), while analytical-grade toluene was used to prepare the free-base tetraphenylporphyrin (H₂-TPP) solution (1.009 × 10⁻³ mol dm⁻³).
The analytical curve for each compound was constructed by adding aliquots of stock solution (5, 10, 15, or 20 µL, depending on the solution) to a cuvette containing 3.000 mL of the corresponding solvent. Successive additions were made until deviations from the Lambert-Beer law were observed. Measurements to construct the analytical curve for each analyte were initially performed on the benchtop spectrophotometer over the 400 to 750 nm range, followed by measurement of the same solution in the cuvette using the RGB prototype.
On the benchtop instrument, the absorbance value selected to construct the analytical curve corresponded to that observed at the wavelength of maximum absorption for each analyte: λ = 526 nm for KMnO₄, λ = 555 nm for Rhodamine B, λ = 665 nm for methylene blue, λ = 668 nm for ZnPc, and λ = 440 nm for H₂-TPP. The wavelength of 440 nm was chosen as the reference for H₂-TPP because the intense Soret-band peak at 432 nm exceeded the upper absorbance limit of the benchtop instrument detector, resulting in saturated readings. In contrast, all ten analytical points remained within the measurable linear range at 440 nm.
2.7. Experimental Tests of the UV Radiometer
The multispectral UV radiometer was validated through two distinct experimental protocols:1. Irradiance–distance profile: the radiometer response was measured at six precise physical distances (10, 20, 30, 40, 50, and 60 cm) from a stabilized UV flashlight, assessing the spatial power distribution without adjusting the beam focus;
2. Outdoor solar campaigns: continuous outdoor monitoring was performed at the Federal University of Recôncavo of Bahia, Teacher Training Center (UFRB-CFP) (Coordinates: 13°01’24.94”S 39°36’46.55”W) on August 07, 2026, from 10:00 to 16:30.
For comparison, the data collected in outdoor measurements with the prototype were correlated with measurements performed in Barreiras, Bahia/Brazil (12°08’52.60”S 45°01’19.70”W), on August 08, 2025, from 8:38 to 13:59, using a SOLAR LIGHT PMA2100 radiometer equipped with UV-A + UV-B probes (PMA 2107; S/N 17566).
2.8. Data Scale Corrections and Mathematical Data Processing
Specific mathematical transformations were performed to process the raw sensor counts. For the RGB color sensor, the raw digital counts of the Red (R), Green (G), and Blue (B) channels were converted into pseudo-absorbance (Abs_C) at each concentration point using the following relationship:
where C_sample and C_blank are the raw 16-bit count values of channel C (R, G, or B) for the sample and the calibration solvent, respectively.
Abs_C = -log10( C_sample / C_blank )
For the UV radiometer, radiation counts were recorded without conversion to irradiance. The analysis was based solely on the count vs distance relationship.
However, for measurements performed under sunlight, the data were converted into irradiance through cross-calibration using a theoretical clear-sky model (Clear-Sky Solar Model), validated with historical and sensing data from the National Institute for Space Research - CPTEC/INPE [25] for the geographical region of the experiment. For each spectral band i, a proportionality constant (ki) was calculated to relate the measured raw counts (Countspeak,i) to the theoretically expected maximum clear-sky solar irradiance (Iref,i) at the local coordinates at solar noon, as shown in Equation 2
Mathematical processing was performed through commands in the GEMINI artificial intelligence platform (PRO version, available in the UFRB virtual environment).
The AS7331 sensor comprises channels for detecting UV-A, UV-B, and UV-C radiation. However, the ozone layer and water vapor in the atmosphere filter out UV-C radiation. The raw sensor count in this channel is due to thermal/electronic noise from the detector, which is canceled out after processing.
At each analysis time (t), the instantaneous irradiance, I(t), was calculated for each band, as shown in Equations 3 (A, B, and C) for each channel.
3. Results and Discussion
3.1. Validation of the RGB Prototype and Calibration Regimes
Initially, colorimetric measurements were performed using sheets printed with different colors, coded in CIE and RGB coordinates. Figure 5 shows the selected colors (and their corresponding references) and the analysis results obtained and displayed by the application developed for this measurement.
The results obtained with the printed standards demonstrated that the prototype could qualitatively distinguish variations in lightness and chromatic composition through the relative responses of the red, green, and blue channels. The set consisted of neutral lightness standards, corresponding to unprinted white, black, and gray, and chromatic standards: red, green, blue, cyan, magenta, yellow, and reference blue, as compiled in Table 1. These materials enabled verification of the integrated operation of the illumination, sensor, optical compartment, and signal conversion routine for the color displayed in the application.
The neutral lightness standards provided an important reference for interpreting the results. White, owing to its higher overall reflectance, produced the highest detected signal level, while black exhibited the lowest reflected radiation intensity. Gray showed intermediate behavior, consistent with its visual reflectance. This response confirmed that the system was sensitive to the overall amount of light returned to the sensor, an essential property for reflectance measurements. However, the difference between these standards should not be interpreted as an absolute colorimetric scale, because the measured signal also depends on the spectral distribution of the illumination source, the sensitivity of each sensor channel, and the optical collection geometry.
For the chromatic standards, each color was found to produce a specific combination of intensities in the R, G, and B channels, allowing their relative differentiation. On red, green, and blue surfaces, the analytical interpretation should primarily consider the relative predominance of the channel associated with the spectral range most strongly reflected by the sample, rather than only the graphical appearance displayed by the application. Similarly, the secondary colors cyan, magenta, and yellow exhibited combined responses in two or more channels, as expected for materials that simultaneously reflect broader regions of the visible spectrum. Thus, the results showed that the sensor can recognize differences in hue and intensity in colored solid materials, fulfilling the purpose of functional verification of the prototype.
At times, the hue and color code displayed in the application differ slightly from the actual color printed on the paper. This can be explained by factors such as the texture of the paper used and the type of printing ink. Nevertheless, the variations in colors and codes are almost imperceptible to the human eye.
The difference between the coded color and the estimated color does not invalidate the ability of the prototype to detect relative color changes; however, it defines the scope of interpretation. The tests with printed papers demonstrated that the device is suitable as a tool for qualitative verification of the RGB channels and the operational stability of the reflectance system. On the other hand, they do not constitute sufficient quantitative calibration for the analysis of solutions in cuvettes, because the optical response of a printed surface differs from that obtained in liquid systems, where radiation absorption and transmission phenomena predominate.
Thus, the printed standards were useful for confirming the relative sensitivity of the device to different visual stimuli and identifying limitations in color estimation by the application. Quantitative validation of the prototype for analytical purposes must remain grounded in curves obtained using a solvent blank, known liquid standards, and comparison with the benchtop spectrophotometer, as performed for the dyes evaluated in this work.
Visual discrepancies between the color displayed in the measurement and visual inspection of the physical material can be attributed to paper texture, print quality, and residual diffuse reflections.
Johnson and colleagues [3] developed a system based on reflectance measurements using the TCS3200 sensor and evaluated the color change of six porphyrin derivatives exposed to alcohol vapors. Other studies discussed the use of the AMS AS7265x multichannel sensor in food measurements [21] and, in other reports, measurements of concrete and paper to obtain the “spectral signature” of different substances [26], as well as different sensors, their functionalities, operating limits, advantages, and disadvantages for environmental, food, and clinical analyses
3.2. Validation of the RGB Prototype for Liquid Systems
Measurements in liquid media were performed using substances with different characteristics, as illustrated in Figure 6. The substances studied can be divided into 3 groups: one inorganic salt (KMnO4) and 4 organic substances, comprising 2 smaller structures (Methylene Blue and Rhodamine B) and 2 macrocyclic structures (zinc phthalocyanine and tetraphenylporphyrin).
Evaluation of the spectral curves and sensor response for each substance reveals excellent overlap between the absorption band of KMnO4 and the G channel of the sensor. Similarly, good overlap can be observed between the R channel and the absorption band of methylene blue, and between the G channel and the absorption band of RhB. Moderate correlations were recorded for the macrocyclic systems (Table 2). For ZnPc, the R channel shows reasonable overlap with the most intense absorption band, and, for H2-TPP, the R and G channels overlap with the Q bands. In the latter case, the B channel is shifted relative to the main absorption band (a saturated signal occurring at 420 nm).
The relationship between the concentration variation of the substances studied and the absorbance signal measured with the standard instrument remains linear throughout the range investigated, in accordance with the Lambert-Beer law. Comparing this correlation with the sensor channel signals as concentration increases reveals certain distinctive features. For KMnO4, the G and B channels are the most sensitive; however, linearity is restricted to a narrower concentration range. Interestingly, despite providing the lowest analytical signal, the R channel exhibits a linear response over the same range as the standard spectrophotometer, that is, throughout the entire concentration range studied (Table 2). One possible explanation is saturation of the G and B channels owing to the large amount of reflected light reaching the sensor in these channels. For the R channel, the amount of light reaching the sensor is lower (as shown by the overlap of the spectral curve and sensor signal in Figure 6 for this substance). Thus, this channel can respond linearly over a wider concentration range. This hypothesis is supported by the analysis of the linear correlation between the standard spectrophotometer and the RGB channels of the sensor. Graphical analysis shows complete overlap between the R channel of the sensor and the calibration curve of the substance measured with the standard instrument.
A similar analysis can be performed for the other substances. For methylene blue, the R channel responds with greater sensitivity. However, for the reasons already presented, the G-channel signal can be used over a wider concentration range (Table 2). Although evident, the B-channel signal does not exhibit equally satisfactory linearity. Thus, the R channel can be used for analyses over a narrower concentration range, whereas, when the analytical range is extended, the G channel responds satisfactorily with a good linear correlation. The correlation observed between the RGB channels and the standard spectrophotometer signal supports the discussion presented. For RhB, the distinctive feature concerns the R channel, which produces signals slightly below zero in measurements performed with the prototype. In this case, the amount of light reflected and measured by the sensor is greater than the incident light. This occurs because of RhB fluorescence, which is observed in the red region. For this substance, the G and B channels exhibit similar correlations with the standard instrument. These characteristics are supported by the spectral analysis, in which overlap between the absorption band and the G- and B-channel signals can be seen in the spectrum. Thus, although the G and B channels can both be used, the G channel is more sensitive.
The analysis is similar for the macrocyclic compounds. However, given the spectral nature of these substances, a highly significant correlation can be observed throughout the analytical range for ZnPc, with excellent data correlations when compared with measurements from the standard instrument (Table 2). For this substance in particular, strong light absorption leads to lower reflection, preventing saturation of the detection channels and allowing accurate responses throughout the concentration range studied. For H2-TPP, deviations from the Lambert-Beer law were observed at concentrations above 200 µmol.dm-3. This deviation is less noticeable in the R channel. Nevertheless, the best correlation between measurements performed with the prototype and the standard instrument is reliable up to a concentration of approximately 120 µmol.dm-3 for any of the channels (Table 2).
The results obtained in this work are consistent with some published reports employing the same sensor. Mohammed et al. [5] used the TCS3200 sensor controlled by an Arduino Nano to quantify potassium in human saliva through a specific reaction between the ion present in saliva and a colorimetric reagent, resulting in a system with light absorption at 450 nm. The study indicated a linear response between 0.2-2.2 mg/mL. Similarly, Oliveira and colleagues [1] constructed a prototype using the same sensor investigated in this work, controlled by an Arduino Uno microcontroller. In the cited study, the authors also investigated the sensor response to a set of organic dyes (tartrazine, phenolphthalein, indigo blue, bromocresol green, and Ponceau red). The results described are consistent with those reported here. Antela and colleagues [14] conducted studies with the TCS34725 sensor controlled by a Rasperry Pi4 microcontroller, evaluating food dyes (tartrazine, allura red, and brilliant blue). They observed a good correlation over a range of 0.01-0.05 mmol.dm-3 for tartrazine, whereas the linear range was considerably narrower for the other dyes.
The discrepancies observed between the data from this study and those reported in the literature using the same sensor arise essentially from the specific features of the firmware and programming code developed for the ESP32. Variations in control logic directly affect the sampling rate, signal filtering, and mathematical routines used to process the raw data. In addition, aspects of prototype construction may cause less pronounced discrepancies in the results. For example, the measurement compartment of the prototype developed here, including the cuvette holder, is entirely painted black to prevent residual diffuse reflection. Compensation to promote light reflection was achieved by using a flat mirror positioned diametrically opposite the sensor. In the study by Oliveira [1], this aspect was evaluated, and a white 3D-printed cuvette holder made of a polymeric material that reflected incident light was selected.
The operating configuration of a standard spectrophotometer is based on the principle of light transmission. However, reflection-based systems can provide less expensive and simpler alternatives while achieving an appreciable level of accuracy and reliability. Patel and colleagues [2] compiled an extensive and informative review of the differences among sensors, microcontrollers, and construction geometries, indicating that systems based on the reflection principle—such as the prototype developed here—can offer advantages over other configurations, including use with turbid, opaque, and solid systems.
3.3. Validation of the UV Radiometer Through Experimental Protocols
Figure 7 presents the radiometer response as a function of distance in a test performed using a purple black-light UV LED flashlight without beam adjustment. After individual readings that deviated substantially from the central tendency at each position were excluded, a progressive increase in irradiance was observed as the source was brought closer to the sensor.
As illustrated in Figure 7, a nonlinear decrease in the raw count (UV-Total) is observed, with behavior close to that predicted by the inverse-square law of distance () [27]. As the distance doubles, for example, from 10 cm to 20 cm, the detected intensity is attenuated by approximately 70%, asymptotically approaching minimum values at 50 cm. This response validates the ideal radiometric behavior of the sensor in response to the geometric divergence of the radiant beam.
The theoretical model is described as I = (P/4π).r-2 and the result obtained was I = 383.7.r-1.79. The experimentally obtained model yielded a value of -1.79, in good agreement with the expected theoretical value.
The outdoor campaigns under solar radiation showed temporal profiles consistent with the daily variation in irradiance. Figure 8 presents measurements performed with the prototype using the AS7331 sensor in Amargosa/BA and with the commercial radiometer, providing UV values measured in Barreiras/BA. Despite the geographical difference between the two locations, the time of year was similar. The measurements indicated excellent convergence.
For the prototype, adjustments based on the results provided by CPTEC/INPE [25] yielded correction constants for each channel used: kUVA = ; kUVB = ; kUVC = .
In this work, the distribution of radiation throughout the day was observed to follow the same profile in both scenarios used as measurement models. In Barreiras, the experiment began earlier than in Amargosa. Geographical distance, solar incidence angle, local temperature, and local air quality are factors that influence agreement between measurements. However, for the purposes discussed in this work, it can be concluded that the prototype exhibits excellent consistency in measured values and is a highly suitable alternative for radiometry in controlled environments or under sunlight.
A recent study conducted in Peru [15] described the design, assembly, programming, measurements, and mathematical processing of a prototype using the same sensor. The authors used Python to write the code and a Raspberry Pi OS microcontroller. Similarly to the findings described here, Puma and colleagues concluded that the prototype is a viable alternative, both in technical terms and in terms of the investment required compared with a commercial radiometer.
In Brazil, in 2025, a Ph.D. thesis [18] developed a multispectral solar radiometer for UV and aerosol monitoring.
Other reports openly available on the internet [28] compile results from studies involving the AS7265x sensor, which combines three integrated sensors (AS72651, AS72652, and AS72653).
3.4. Metrological Challenges, Data Scale Corrections, and Corrective Actions
During the experimental development of DIY and open-source scientific hardware, systematic anomalies in data transmission and scale factors frequently arise because of local numeric formats, floating-point conversions in firmware, and software export protocols. Rather than treating raw open-source data as closed boxes, a rigorous audit of the entire data pipeline was performed, and we applied essential mathematical corrections to restore the physical consistency of the metadata. Table 3 summarizes the metrological limitations identified in the original files, their specific physical or electronic causes, and the corresponding corrective actions implemented in this work.
3.5. Maker Culture, DIY, Accessibility, and the Internet of Analytical Things (IoAT)
The successful development and validation of the RGB colorimeter and multispectral UV radiometer highlight the transformative potential of “maker culture” and the Do-It-Yourself (DIY) philosophy in scientific instrumentation. Traditionally, analytical chemistry laboratories, environmental research stations, and educational institutions have been constrained by the high capital costs associated with commercial spectrophotometers and metrological radiometers [1,2]. By using low-cost digital sensors, open-source microcontrollers such as the ESP32, and rapid prototyping tools such as 3D printing and mobile application development, high-quality analytical testing can be democratized. These affordable platforms enable students and researchers in resource-limited settings to build, customize, and deeply understand the physics of the instruments they operate, moving away from the proprietary “black-box” model of commercial systems [12,29]. This democratization movement is supported globally by open-hardware networks and scientific cooperatives that promote the sharing of open designs for spectrometers and other low-cost instruments [29,30,31].However, a critical metrological balance must be maintained: the low cost and ease of assembly of DIY devices do not eliminate the fundamental scientific need for rigorous validation, calibration, replicates, and direct comparison with established reference methods. Although a TCS34725 sensor costs less than US$ 10, its analytical utility is only achieved when accompanied by solvent baseline referencing, segmented linear regimes, and systematic data pipelines. This connected-instrument paradigm represents the core of the Internet of Analytical Things (IoAT), in which sensors act as intelligent, connected nodes in a decentralized network, transmitting environmental or clinical data in real time to cloud-based servers. Recent metrological investigations demonstrate that multichannel photometers based on digital color sensors, when properly calibrated and validated against commercial spectrophotometers, can achieve statistically comparable precision for complex chemical determinations, consolidating the analytical robustness of the IoT-based sensor paradigm [17,32]. Within the IoAT framework, although artificial intelligence can assist with code generation, data analysis, and signal modeling, it is essential to emphasize that IoAT does not imply machine autonomy. Ultimate responsibility for calibration, quality control, scientific interpretation, and experimental validation remains strictly under human supervision. The machine serves as a tool to expand human capabilities, not as a substitute for scientific judgment.
3.6. AI-Assisted Maker Workflow and Responsible Use
In accordance with the principles of scientific transparency and responsible research, this study declares the structured use of generative artificial intelligence and large language models (LLMs) as auxiliary tools. Specifically, platforms such as Codex, Claude, Claude Code, Gemini, and NotebookLM were used during the development process. These tools served as assistants for: (i) writing, reviewing, and debugging the microcontroller firmware in C++ and the mobile application code in TypeScript, (ii) structuring and verifying data processing pipelines in Python and Excel, (iii) organizing literature reviews, and (iv) providing guidance on electronics and optical geometries. To organize the workflow, an additional tool, the Obsidian software (freeware), was used to organize all successful and unsuccessful steps in the development of each prototype. This tool organizes the workflow as a kind of “neural network” (Figure 9) that allows the analyst to identify previously evaluated paths, preventing repeated decision-making. This software is not classified as AI, but it is connected to the files generated by the AI tools used, creating a visually accessible system for understanding the workflow.It is essential to state clearly that, although these AI tools were highly instrumental in learning and rapid code prototyping, they did not perform any physical measurements, did not independently define the experimental criteria, and do not have coauthor status. All experimental results, raw sensor counts, and comparative data were collected physically and through actual experimental work. Generative AI outputs were treated strictly as working hypotheses requiring independent verification, physical testing, and debugging on the actual hardware. AI-generated texts or claims were never cited as scientific evidence; only peer-reviewed literature, primary manufacturer datasheets, and verified experimental files are included among the research sources consulted here.
4. Conclusions
This study presented a detailed experimental and technical validation of two portable, low-cost optical devices built on the ESP32 platform: an RGB reflectance-based spectrophotometer and a multispectral UV radiometer. Measurements performed on paper with colors standardized in the RGB and CIE systems showed signal discrepancies depending on the color and channel; however, the nuances are visually imperceptible. Thus, it can be safely stated that the differences observed between the measured and standardized values are strongly linked to paper type, ink penetration, and irregular reflectance. Adjustments can be made by changing these parameters, or corrections can be implemented through code. For liquid systems, the RGB prototype successfully resolved segmented linear calibration regimes for complex analytes such as Methylene Blue, Rhodamine B, and H₂-TPP, while maintaining broad single-regime linear ranges for Zinc Phthalocyanine and Potassium Permanganate. The multispectral UV radiometer demonstrated excellent sensitivity, capturing spatial power-decay relationships consistent with the inverse-square law of distance and yielding a theoretically supported relationship. Naturally, data processing can be refined through measurements with different UV radiation sources of known power, with calibration and correction implemented through code. In outdoor tests, the prototype produced data consistent with the standard radiometer after corrections using data available on the Brazilian platform of the National Institute for Space Research (CPTEC/INPE) as a reference. By successfully validating these low-cost prototypes against commercial standards, this work consolidates the democratizing potential of open scientific hardware in chemistry education, decentralized point-of-care diagnostics, and connected ecological monitoring networks within IoAT.
Author Contributions
C.S.C.M.: Conceptualization, prototype development, software programming, and original draft preparation. V.S.S.: Investigation, data curation, visualization, and field measurements (ultraviolet sunlight experiments in Amargosa, Bahia). Y.H.C.F. and K.S.P.: Investigation and field measurements (ultraviolet sunlight experiments in Barreiras, Bahia). D.R.S. and Y.N.W.: Methodology, validation, and manuscript reviewing and editing. R.D.P.: Conceptualization, methodology, project administration, funding acquisition, manuscript reviewing and editing, and overall supervision. R.D.P. serves as the corresponding author. All authors have read and agreed to the published version of the manuscript.
Funding
Bahia State Research Support Foundation (FAPESB, fellow number 1963/2025, Project 4745/2025).
Institutional Review Board Statement
No applicable.
Informed Consent Statement
No applicable.
Data Availability Statement
Information about technical details and programming code are available from the corresponding author upon request.
Acknowledgments
The authors would like to thank the Federal University of Recôncavo of Bahia (UFRB) and the Federal University of Western Bahia (UFOB) for providing facilities and laboratory infrastructure. We would like to express our deep gratitude to Prof. Dr. Pierre Mothé Esteves (Federal University of Rio de Janeiro-Rio de Janeiro/Brazil) for motivating us to develop this work. Also, we are grateful for Personalize Brindes & Gráfica for helping us during the construction of prototypes chambers developed into this study.
Conflicts of Interest
The authors declare no conflicts of interest
References
- Oliveira, G.C.; Machado, C.C.S.; Inácio, D.K.; Petruci, J.F.S.; Silva, S.G. RGB color sensor for colorimetric determinations: Evaluation and quantitative analysis of colored liquid samples. Talanta 2022, 241, 123244. [Google Scholar] [CrossRef] [PubMed]
- Patel, A.K.; Shrivas, K.; Thakur, K.; Sharma, A.; Deb, M.K.; Kailasa, S.K.; Shankar, R.; Arakawa, T. Advances in Arduino-Based optical devices for colorimetric detection in Environmental, Food, and clinical applications. J. Ind. Eng. Chem. 2026, 159, 129–152. [Google Scholar] [CrossRef]
- Johnson, B.J.; Erickson, J.S.; Kim, J.; Malanoski, A.P.; Leska, I.A.; Monk, S.M.; Edwards, D.J.; Young, T.N.; Verbarg, J.; Bovais, C.; Russell, R.D.; Stenger, D.A. Miniaturized reflectance devices for chemical sensing. Meas. Sci. Technol. 2014, 25, 095101. [Google Scholar] [CrossRef]
- Cadeado, A.N.S.; Silva, S.G. Development of a portable optical device with a multi-channel spectrometer sensor for quantification of glycerol in wine: a maker approach for on-site analysis. Anal. Methods 2023, 15, 4477–4484. [Google Scholar] [CrossRef] [PubMed]
- Mohammed, A.; Karthik, V.; Robita Chanu, O. Point of care detection of potassium in saliva using colorimetric optical absorption. Mater. Today Proc. 2022, 50, 225–230. [Google Scholar] [CrossRef]
- Oliveira, P.C.C.; Leite, M.A.P. Spectrophotometry in High School: Construction of a Low-Cost Photometer with Readily Available Components. Quím. Nova Esc. 2016, 38, 181–186. [Google Scholar] [CrossRef]
- Skoog, D.A.; West, D.M.; Holler, F.J.; Crouch, S.R. Fundamentals of Analytical Chemistry, 8th ed.; Pioneira Thomson Learning: São Paulo, Brazil, 2006. [Google Scholar]
- DelMonache, G.; Gogoi, P.; Ge, X.; Wang, X.; Snider, R.; Szeglowski, O.; Cook, T.R.; Wang, Z.; Li, Y.C. Multipurpose DIY Spectrophotometer for Teaching Analytical Chemistry. J. Chem. Educ. 2025, 102, 852–856. [Google Scholar] [CrossRef]
- Grasse, E.K.; Torcasio, M.H.; Smith, A.W. Teaching UV–Vis Spectroscopy with a 3D-Printable Smartphone Spectrophotometer. J. Chem. Educ. 2016, 93, 146–151. [Google Scholar] [CrossRef]
- Lietard, A.; Screen, M.A.; Flindt, D.L.; Jordan, C.J.C.; Robson, J.M.; Verlet, J.R.R. A Combined Spectrophotometer and Fluorometer to Demonstrate the Principles of Absorption Spectroscopy. J. Chem. Educ. 2021, 98, 3871–3877. [Google Scholar] [CrossRef]
- Pap, L.G. An Inexpensive 3D-Printable Do-It-Yourself Visible Spectrophotometer for Online, Hybrid, and Classroom-Based Learning. J. Chem. Educ. 2021, 98, 2584–2591. [Google Scholar] [CrossRef]
- Chagas, A.M. A Discussion on the Necessity for Open Source Hardware in Neuroscience Research. Online seminar. University of Sussex / World Wide Open Source, 29 March. Available online: https://world-wide.org/seminar/discussion-necessity-open-source-mnkels4k (accessed on 13 September 2026).
- Brown, E.W.; Glasscott, M.W.; Conley, K.; Barr, J.; Ray, J.D.; Moores, L.C.; Netchaev, A. ACEstat: A DIY Guide to Unlocking the Potential of Integrated Circuit Potentiostats for Open-Source Electrochemical Analysis. Anal. Chem. 2022, 94, 4906–4912. [Google Scholar] [CrossRef] [PubMed]
- Antela, K.U.; Sáez-Hernández, R.; Cervera, M.L.; Morales-Rubio, Á.; Luque, M.J. Development of an automated colorimeter controlled by Raspberry Pi. Anal. Methods 2023, 15, 512–518. [Google Scholar] [CrossRef] [PubMed]
- Puma, C.F.; Yucra, J.L.; Calla, Y.G.; Solis, J.L.; Postigo, M.; Leon-Salas, W.D.; Vizcardo, M.A. Development of a UV meter using the sensor AS7331 and a Raspberry Pi 4B. J. Phys. Conf. Ser. 2025, 3088, 012006. [Google Scholar] [CrossRef]
- González-Laprea, J.; Smith-Rincón, C.E.; García-Goitia, M.F.; Coronel, M.; Fernandez, L.; Borrero-González, L.J. 3D-Printable RGB LED Photometer Controlled by an Arduino–Python Interface for Molecular Absorption Applications in Chemistry Laboratories. J. Chem. Educ. 2025, 102, 3615–3622. [Google Scholar] [CrossRef]
- Machado, C.C.S.; Cadeado, A.N.S.; da Mota, Y.S.N.; Petruci, J.F.S.; Silva, S.G. Evaluation of the performance of 3D printed (spectro)photometers based on multi-channel color sensors for colorimetric determinations. Anal. Methods 2024, 16, 8427–8436. [Google Scholar] [CrossRef] [PubMed]
- Sayão, A.C. Study and Development of the Design Parameters of a Multispectral Solar Radiometer Based on a Variable Interference Filter for Environmental and Aerosol Sensing. Ph.D. Thesis, Polytechnic School, University of São Paulo, São Paulo, Brazil, 2015. [Google Scholar] [CrossRef]
- Capella, J.V.; Bonastre, A.; Campelo, J.C.; Ors, R.; Peris, M. IoT & environmental analytical chemistry: Towards a profitable symbiosis. Trends Environ. Anal. Chem. 2020, 27, e00095. [Google Scholar] [CrossRef]
- Machado, C.C.S.; Petruci, J.F.S.; Silva, S.G. An IoT optical sensor for photometric determination of oxalate in infusions. Microchem. J. 2021, 168, 106466. [Google Scholar] [CrossRef]
- Srinivasagan, R.; Mohammed, M.; Alzahrani, A. TinyML-Sensor for Shelf Life Estimation of Fresh Date Fruits. Sensors 2023, 23, 7081. [Google Scholar] [CrossRef] [PubMed]
- Bitra, V.S.; Verma, S.; Rao, B.T. TinyML-Raman: A novel IoT based field-deployable spectra analysis for accurate identification of pharmaceuticals and trace dye-pesticide mixtures from facile SERS method. Anal. Chim. Acta 2024, 1322, 343063. [Google Scholar] [CrossRef] [PubMed]
- De Paula, R.; Faustino, M.A.F.; Pinto, D.C.G.A.; Neves, M.G.P.M.S.; Cavaleiro, J.A.S. Kinetic study of meso-tetraphenylporphyrin synthesis under microwave irradiation. J. Heterocycl. Chem. 2008, 45, 453–459. [Google Scholar] [CrossRef]
- Moser, F.H.; Thomas, A.L. Phthalocyanine Compounds; Reinhold Publishing Corporation: New York, NY, USA, 1963. [Google Scholar]
- National Institute for Space Research (INPE). Center for Weather Forecasting and Climate Studies (CPTEC). Satellite and Environmental Sensor Division (DISSM). Available online: https://satelite.cptec.inpe.br/home/index.jsp (accessed on 13 September 2026).
- Landoni, B. Let’s Build a Spectrometer. Open-Electronics. Available online: https://www.open-electronics.org/lets-build-a-spectrometer/ (accessed on 13 September 2026).
- Palmer, J.M.; Grant, B.G. The Art of Radiometry; SPIE Press: Bellingham, WA, USA, 2009; Volume Chapter 2, pp. 15–28. [Google Scholar] [CrossRef]
- Circuit. DIY Colorimeter Using AS7265x Spectroscopy Sensor & ESP32 Webserver. In Circuit Schools; Schools, Ed.; 28 February; Available online: https://www.circuitschools.com/diy-colorimeter-using-as7265x-spectroscopy-sensor-esp32-webserver/ (accessed on 13 September 2026).
- Gathering for Open Science Hardware (GOSH). GOSH Manifesto. Available online: https://openhardware.science/gosh-manifesto/ (accessed on 13 September 2026).
- Renzenbrink, T. $35 DIY Spectrometer Gets Its Own Collaborative Database. Elektor Magazine. 12 September. Available online: https://www.elektormagazine.com/articles/35-diy-spectrometer-gets-its-own-collaborative-database (accessed on 13 September 2026).
- Fernando, P.; Kuznetsov, S. OScH in the Wild: Dissemination of Open Science Hardware and Implications for HCI. In Proceedings of the 2020 CHI Conference on Human Factors in Computing Systems, Honolulu, HI, USA, 25-30 April 2020; Association for Computing Machinery: New York, NY, USA, 2020; pp. 1–13. [Google Scholar] [CrossRef]
- Cadeado, A.N.S.; Machado, C.C.S.; Costa, M.Q.; Silva, S.G. A palm-sized wireless device for colorimetric nitrite determination in water. Microchem. J. 2022, 183, 108138. [Google Scholar] [CrossRef]
Figure 1.
External and internal views of the RGB colorimetric prototype. The device has an MDF structure and a measurement compartment with a matte-black interior coating, intended to reduce interference from ambient light and residual diffuse reflections. Inside, the holder positions the cuvette between the TCS34725 sensor module, with integrated LED illumination, and a flat mirror on the opposite face. The mirror redirects radiation transmitted through the sample toward the sensor, while the ESP32 microcontroller acquires and transmits the signals to the monitoring application.
Figure 1.
External and internal views of the RGB colorimetric prototype. The device has an MDF structure and a measurement compartment with a matte-black interior coating, intended to reduce interference from ambient light and residual diffuse reflections. Inside, the holder positions the cuvette between the TCS34725 sensor module, with integrated LED illumination, and a flat mirror on the opposite face. The mirror redirects radiation transmitted through the sample toward the sensor, while the ESP32 microcontroller acquires and transmits the signals to the monitoring application.
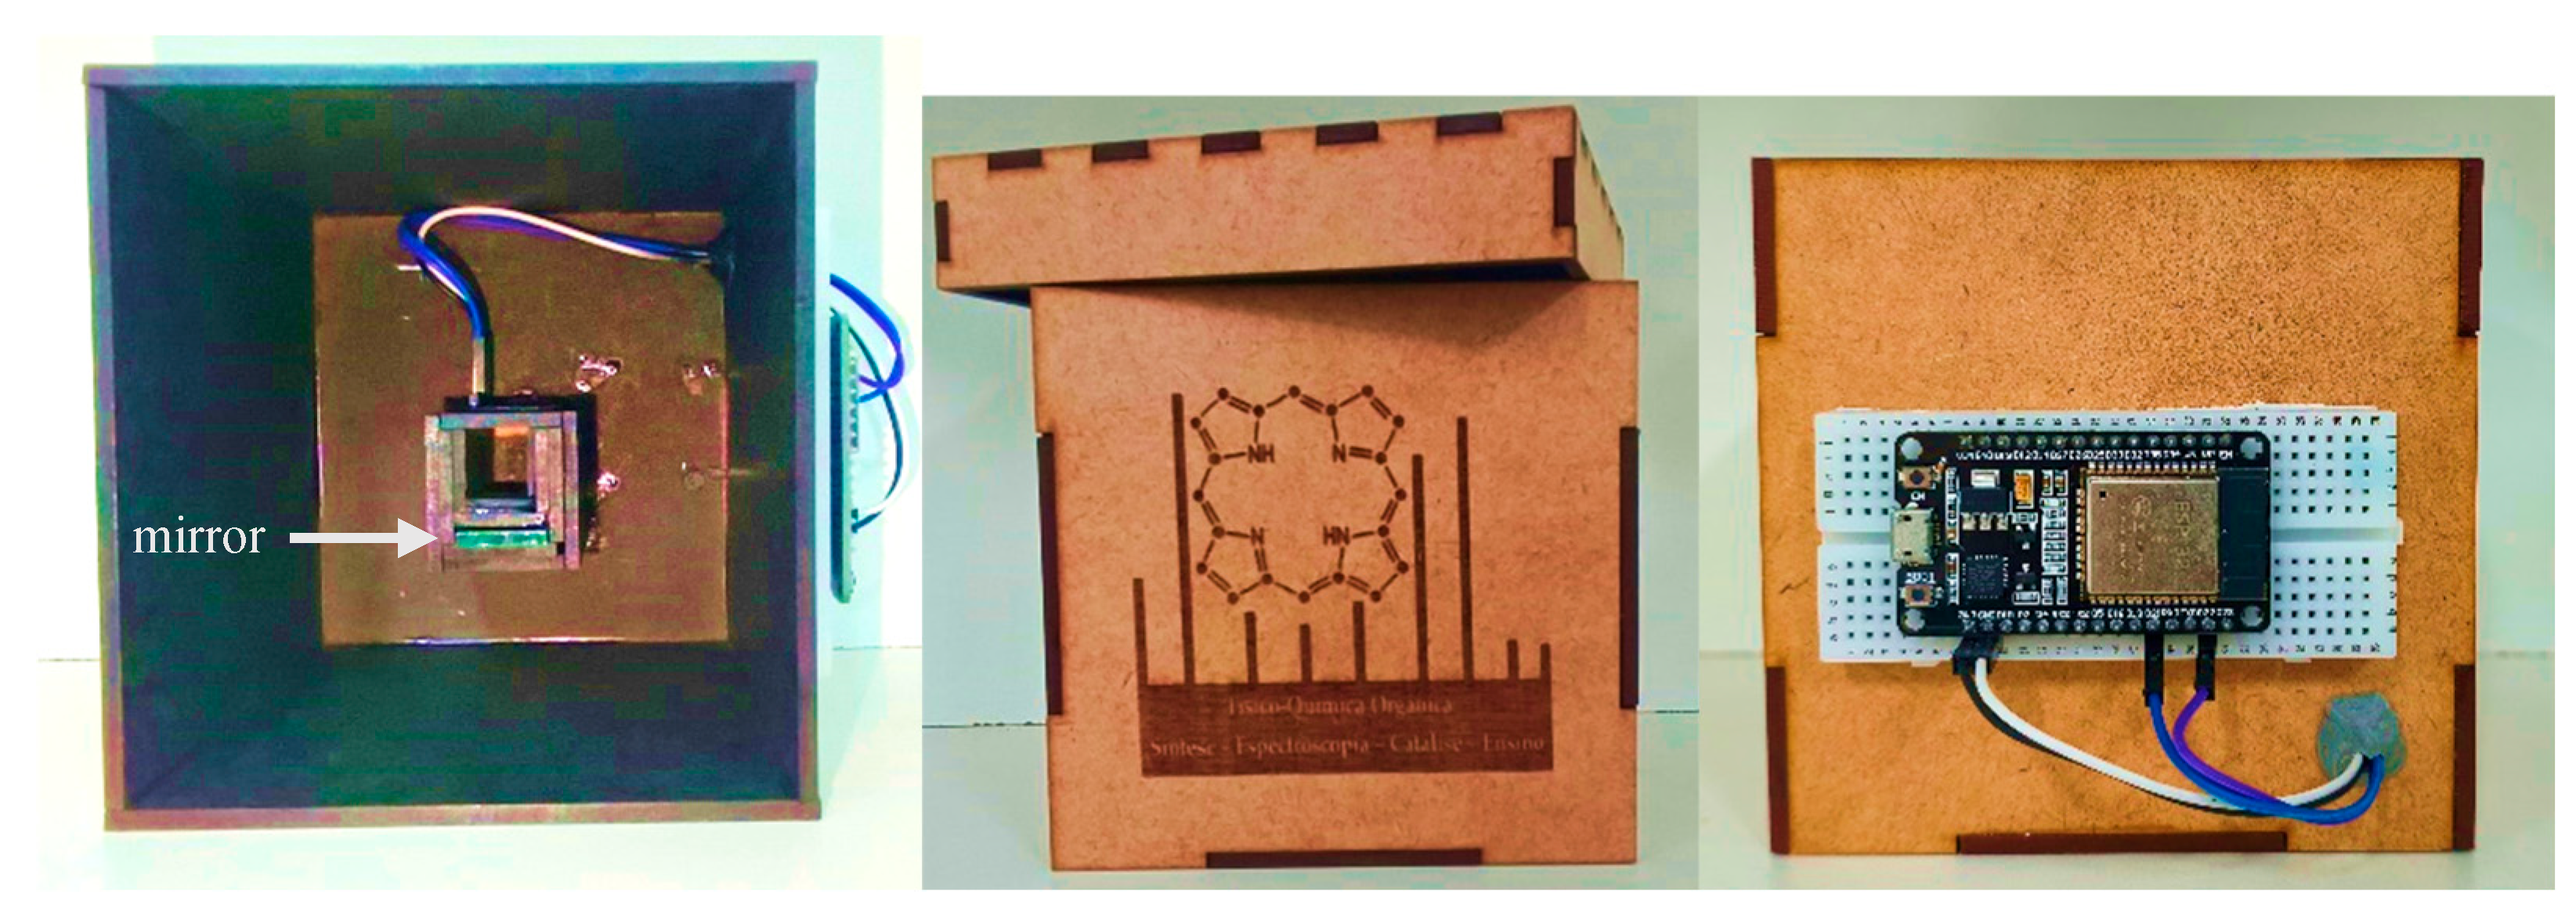
Figure 2.
Data visualization interface in the Monitor RGB application. The screenshots show different sets of pseudo-absorbance measurements for the red (R), green (G), and blue (B) channels, identified by their respective colors. The horizontal axis indicates the sequence of the ten recorded points, while the vertical axis shows pseudo-absorbance calculated relative to the blank. Lines connect the measurements to facilitate tracking of the responses and do not represent regression fits. The vertical scales vary between panels. The interface allows simultaneous visualization of all three channels and identification of trends and variations during acquisition.
Figure 2.
Data visualization interface in the Monitor RGB application. The screenshots show different sets of pseudo-absorbance measurements for the red (R), green (G), and blue (B) channels, identified by their respective colors. The horizontal axis indicates the sequence of the ten recorded points, while the vertical axis shows pseudo-absorbance calculated relative to the blank. Lines connect the measurements to facilitate tracking of the responses and do not represent regression fits. The vertical scales vary between panels. The interface allows simultaneous visualization of all three channels and identification of trends and variations during acquisition.
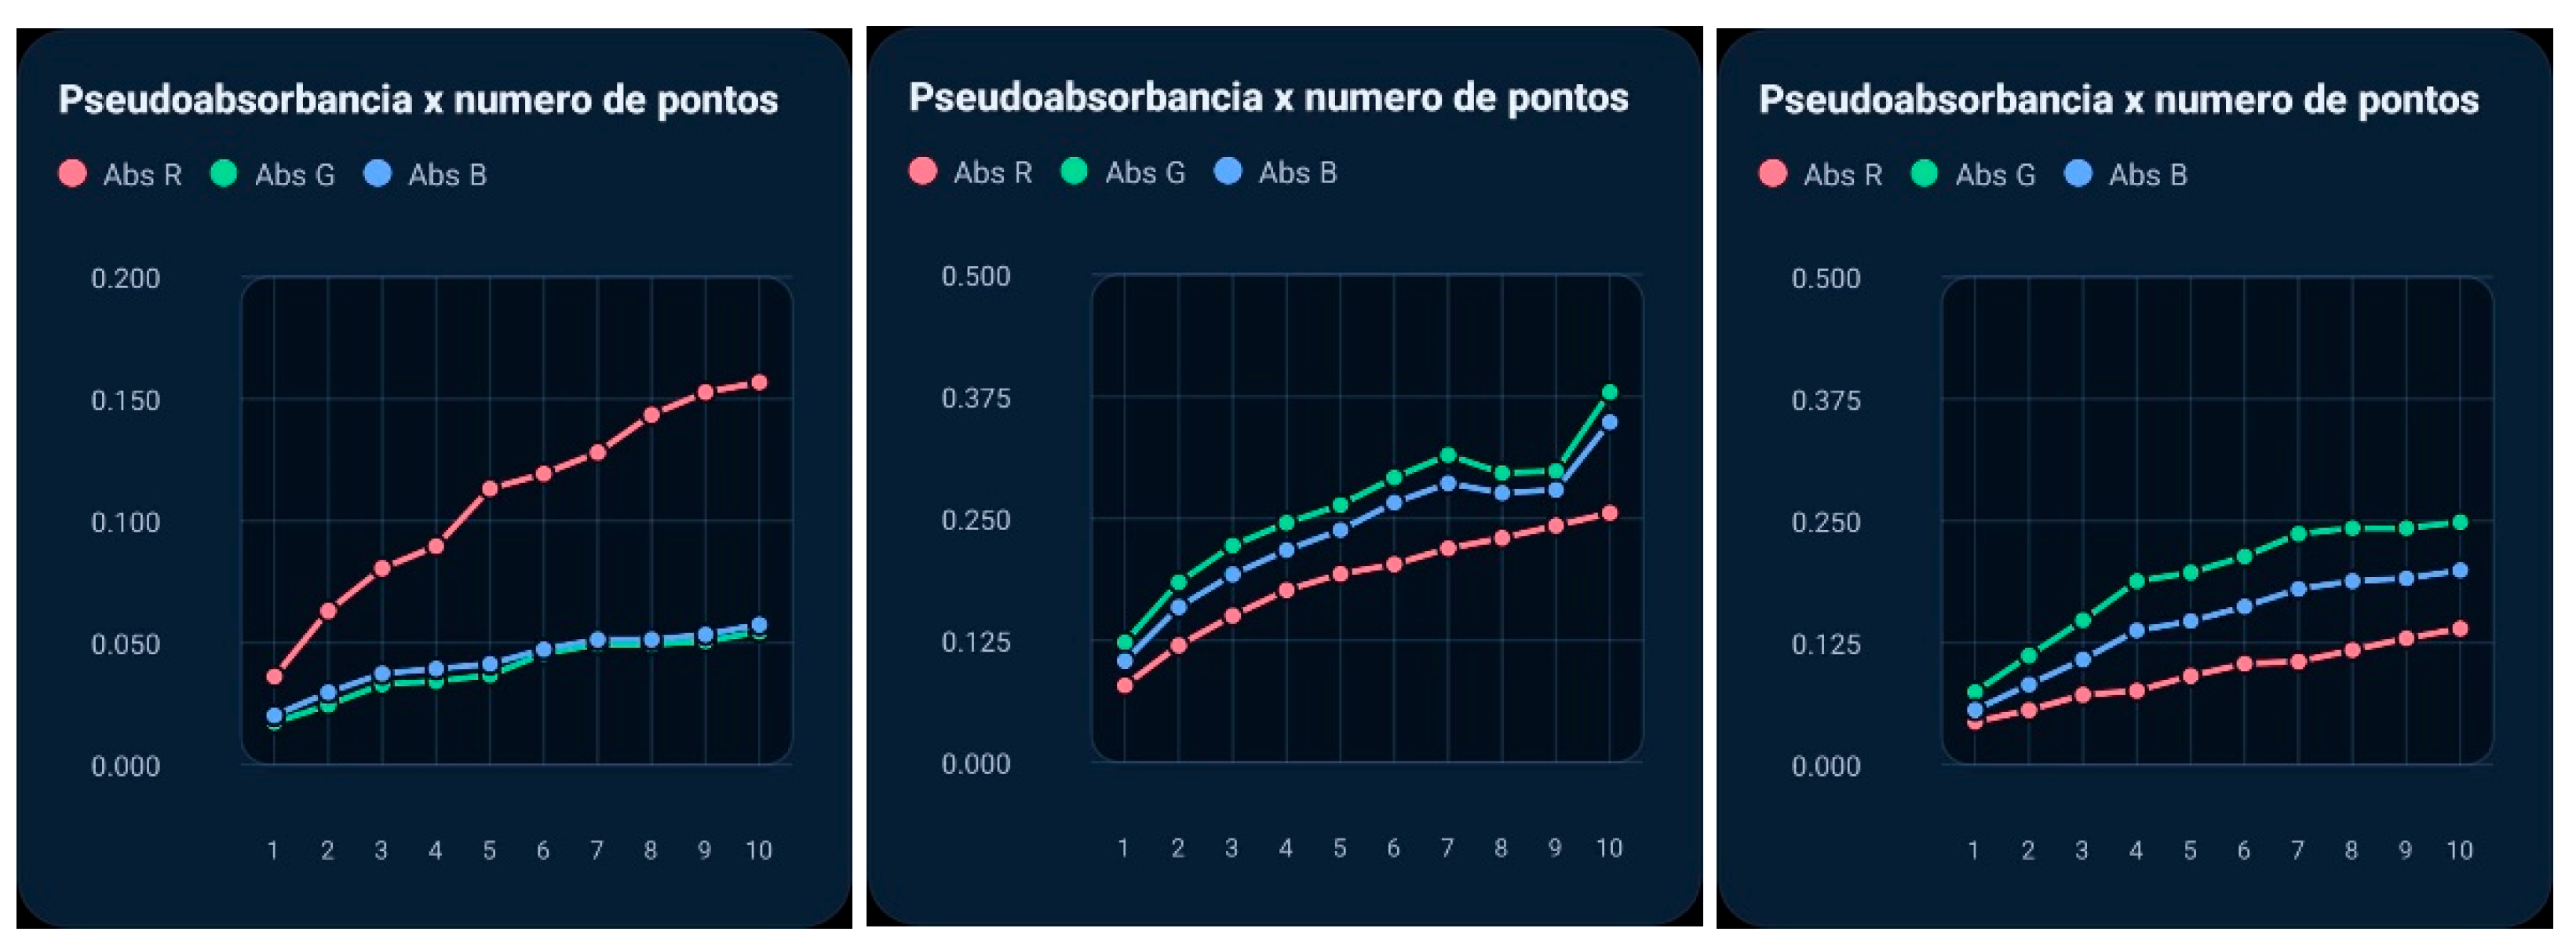
Figure 3.
External and internal views of the ultraviolet radiometer prototype. The device has an MDF structure housing the ESP32 microcontroller, OLED display, and microSD card storage module. The AS7331 sensor is positioned outside the box, allowing radiation to reach its sensitive surface, with detection channels for the UV-A, UV-B, and UV-C bands. The ESP32 manages signal acquisition, storage, and transmission to the monitoring system, while the display enables local viewing of the readings.
Figure 3.
External and internal views of the ultraviolet radiometer prototype. The device has an MDF structure housing the ESP32 microcontroller, OLED display, and microSD card storage module. The AS7331 sensor is positioned outside the box, allowing radiation to reach its sensitive surface, with detection channels for the UV-A, UV-B, and UV-C bands. The ESP32 manages signal acquisition, storage, and transmission to the monitoring system, while the display enables local viewing of the readings.
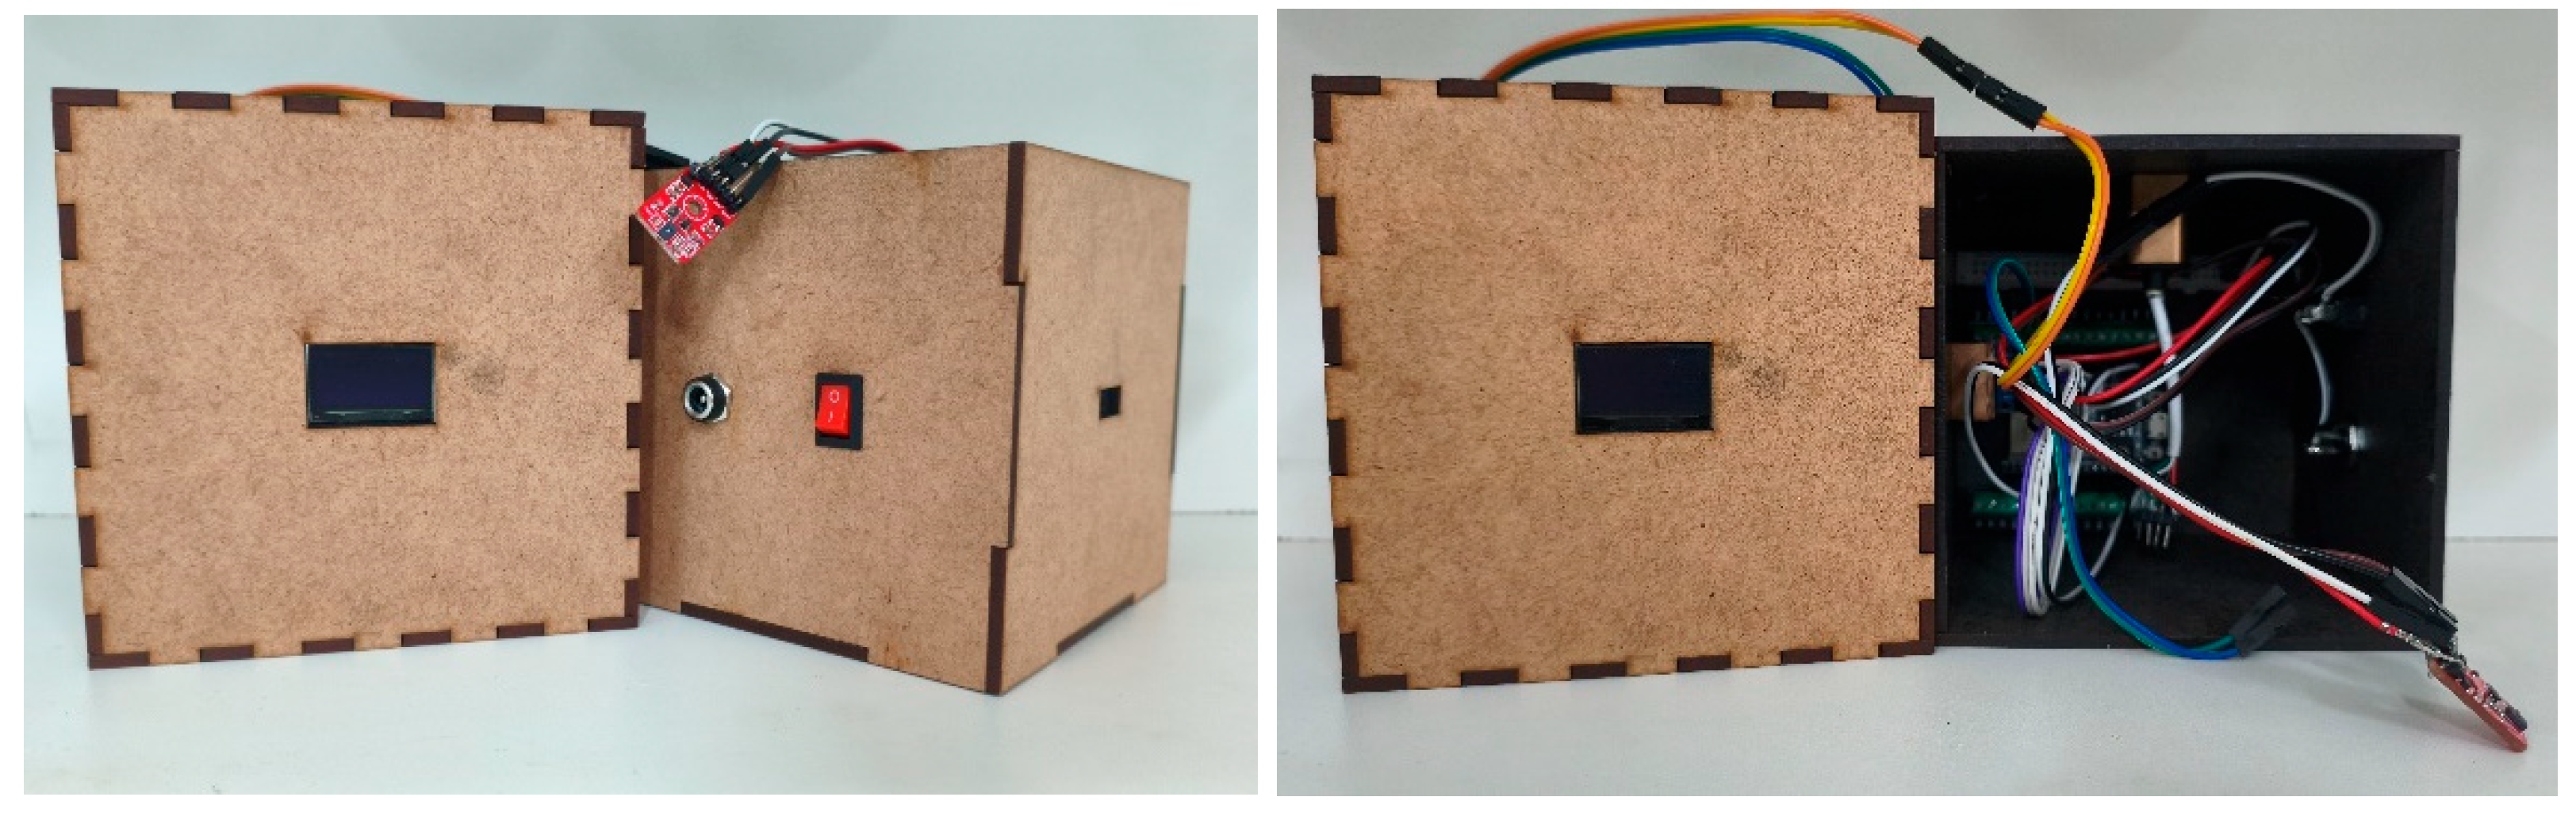
Figure 4.
Interface of the UV radiometer monitoring application. The configuration screen allows selection of timed or continuous modes, definition of the session duration and peak-recording time window, and activation of data storage in CSV format on the microSD card. The main dashboard displays fields for UV-A, UV-B, UV-C, and total UV irradiances, in µW cm⁻², the session graph history, elapsed time, and accumulated dose, in mJ cm⁻². In the screenshot shown, the dashboard is disconnected from the ESP32 and awaiting data; therefore, the zero values displayed do not represent experimental results.
Figure 4.
Interface of the UV radiometer monitoring application. The configuration screen allows selection of timed or continuous modes, definition of the session duration and peak-recording time window, and activation of data storage in CSV format on the microSD card. The main dashboard displays fields for UV-A, UV-B, UV-C, and total UV irradiances, in µW cm⁻², the session graph history, elapsed time, and accumulated dose, in mJ cm⁻². In the screenshot shown, the dashboard is disconnected from the ESP32 and awaiting data; therefore, the zero values displayed do not represent experimental results.
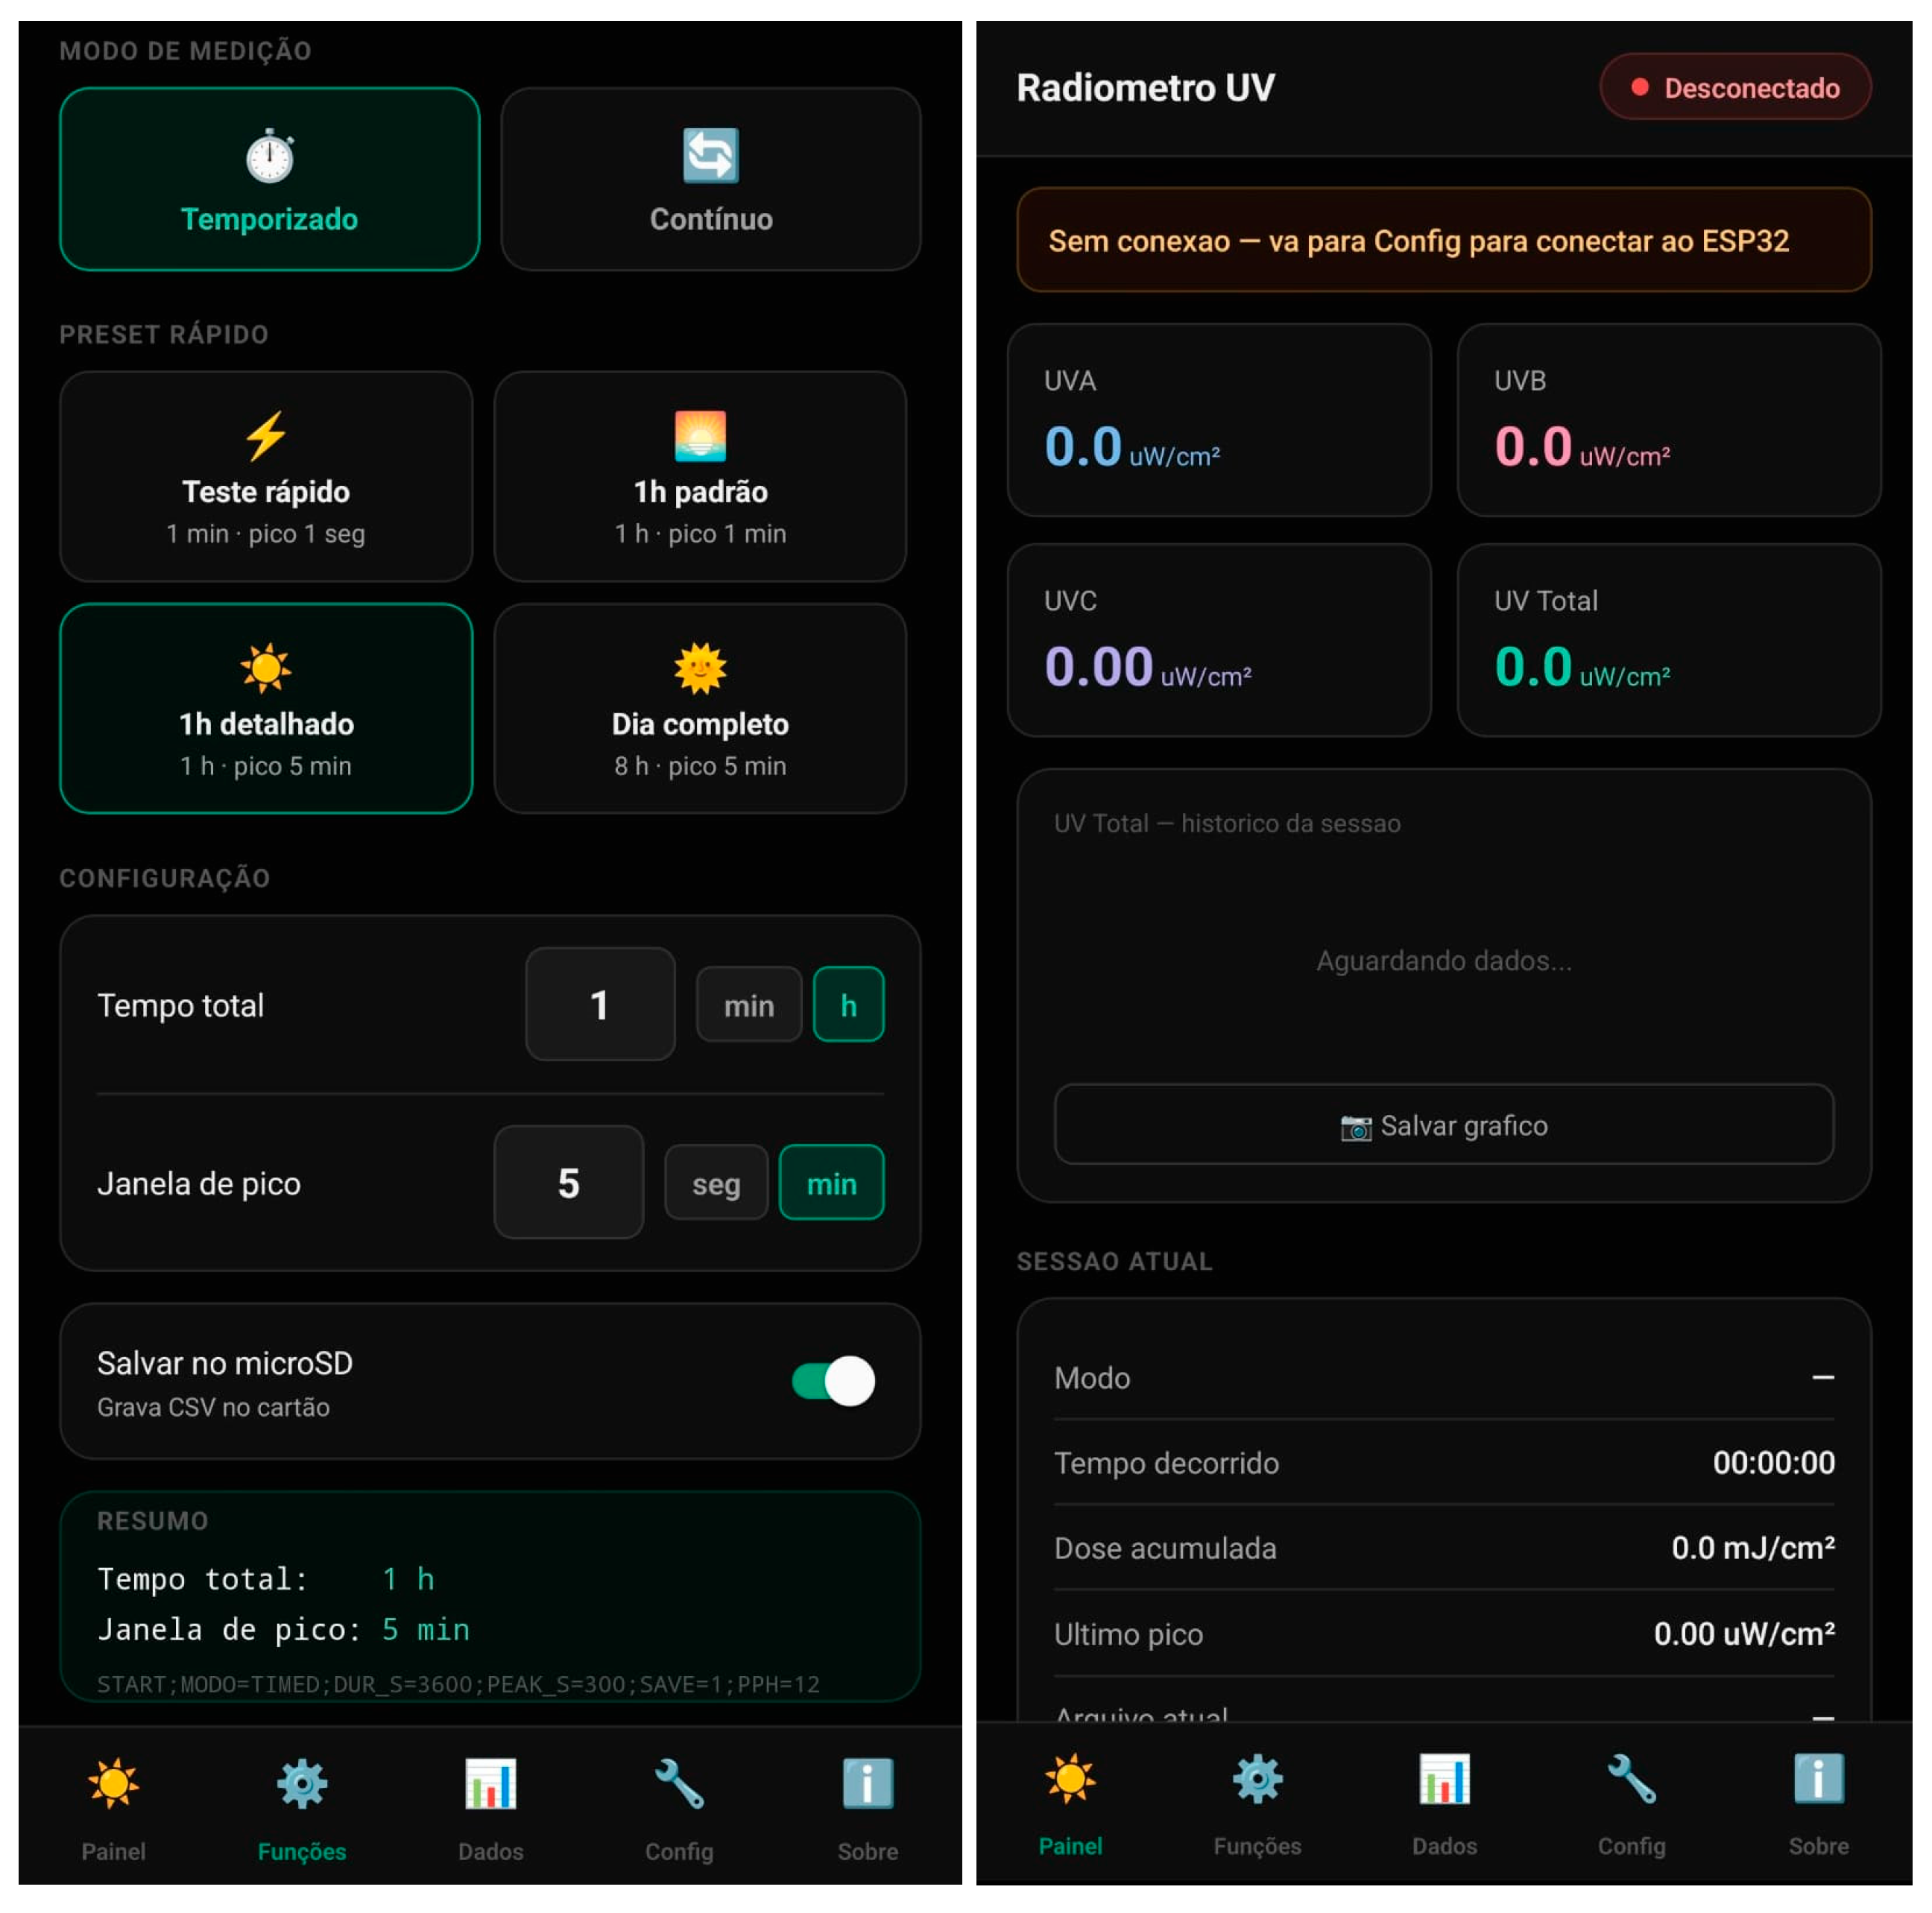
Figure 5.
Top: Papers printed with different standardized colors (left) and their digital version (right) in CIE coordinates; Middle: Colorimetric measurements of selected colors (from left to right: green, magenta, and blue); Bottom: Screenshot of the colors selected in the measurement.
Figure 5.
Top: Papers printed with different standardized colors (left) and their digital version (right) in CIE coordinates; Middle: Colorimetric measurements of selected colors (from left to right: green, magenta, and blue); Bottom: Screenshot of the colors selected in the measurement.
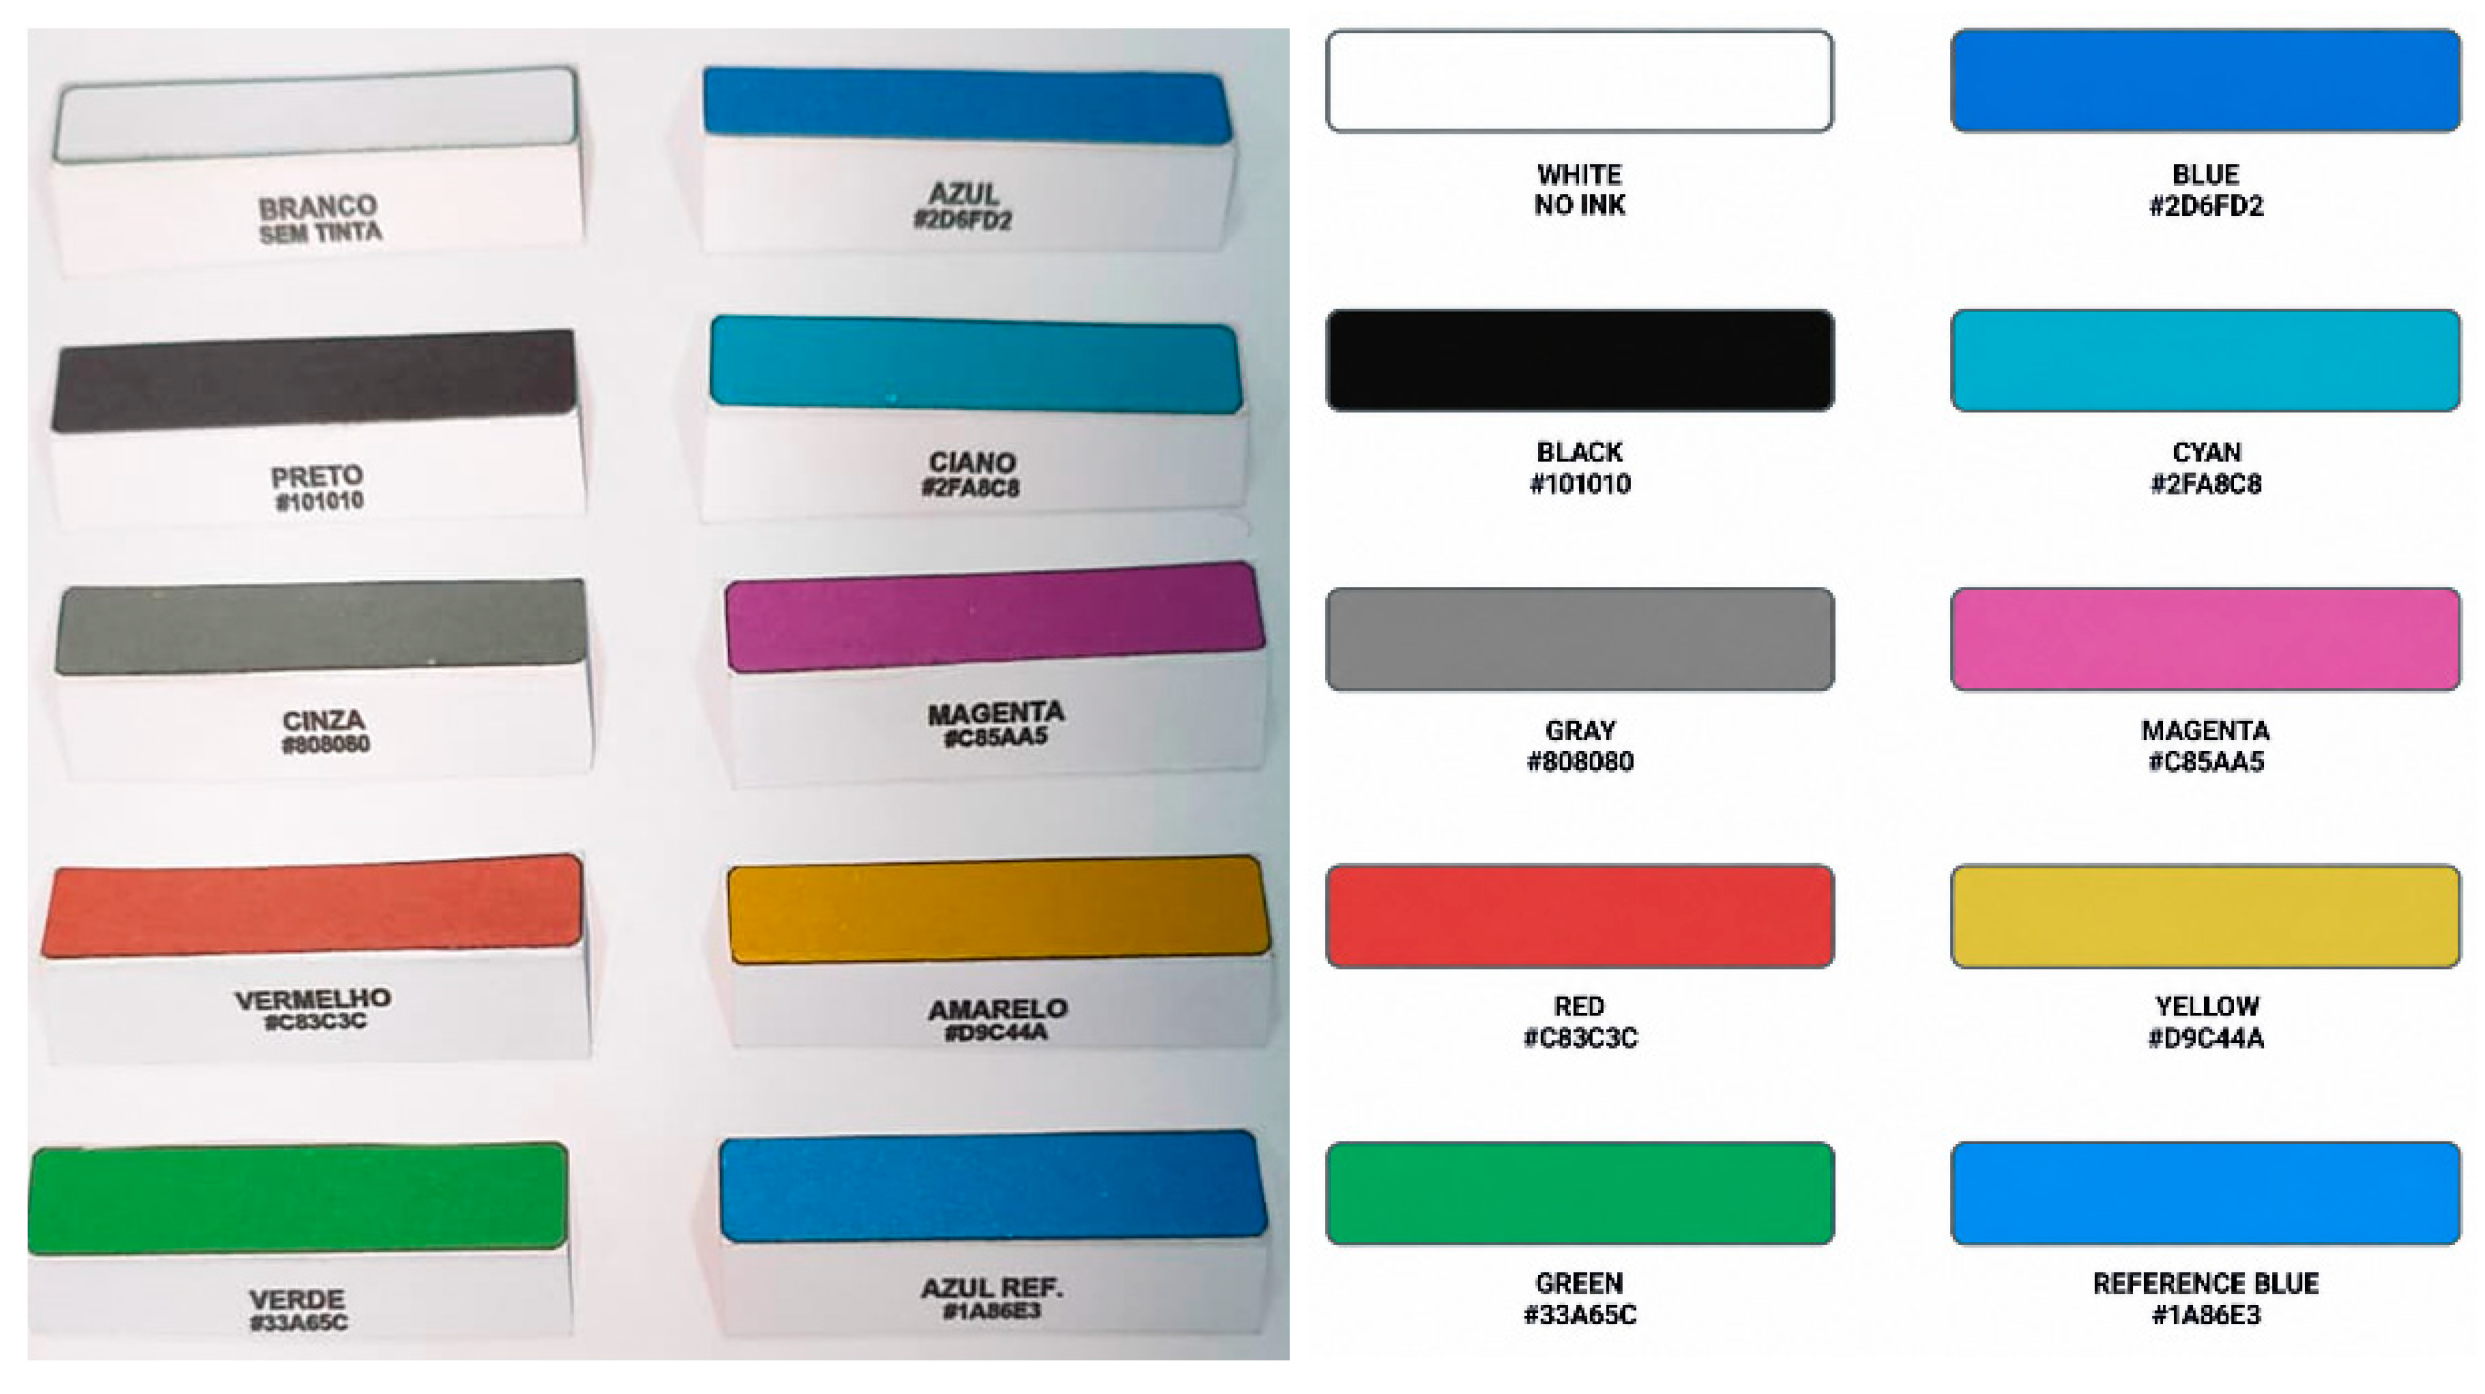
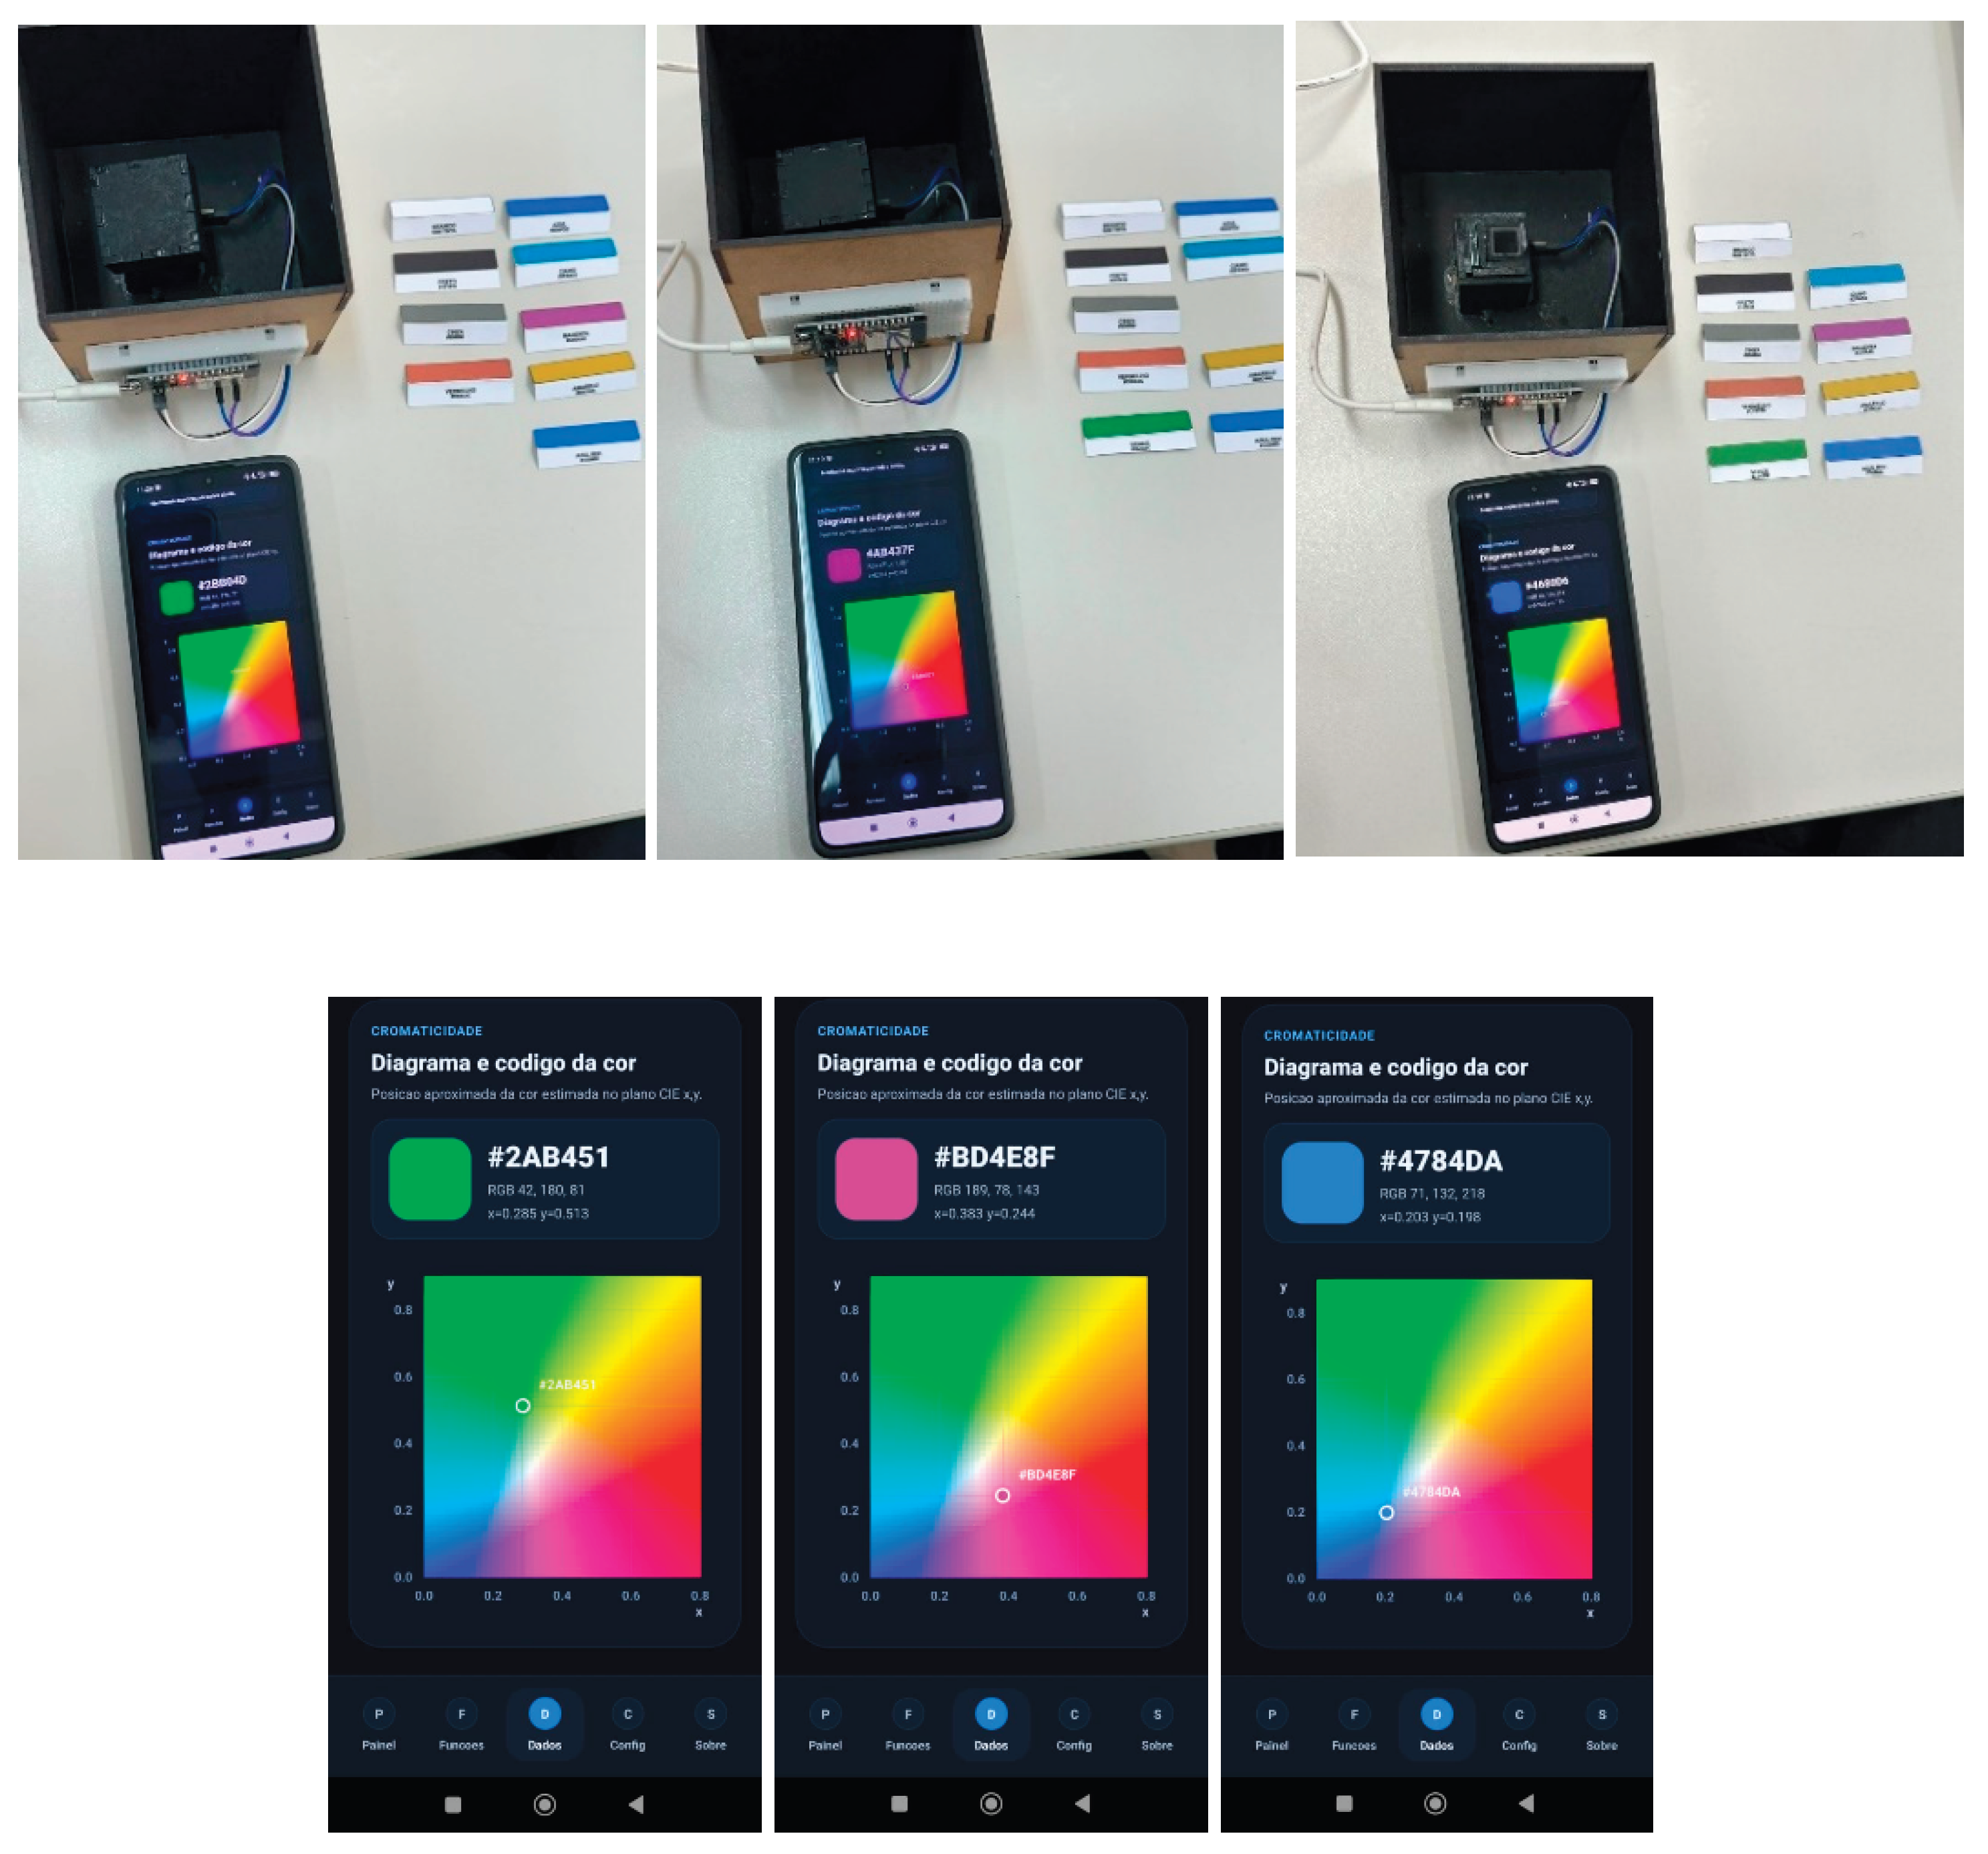
Figure 6.
Left: spectral curve of the substance obtained with the standard spectrophotometer (black-line curves) and curves obtained from the RGB channels of the sensor; Middle: response curves of the RGB channels as a function of the concentration variation of each substance; Right: correlation between the calibration curve obtained with the standard spectrophotometer and the RGB channels of the sensor. From top to bottom: Potassium permanganate (KMnO4), Methylene Blue (MB), Rhodamine B (RhB), Zinc Phthalocyanine (ZnPc), and 5,10,15,20-meso-tetrakis(phenyl)porphyrin (H2-TPP).
Figure 6.
Left: spectral curve of the substance obtained with the standard spectrophotometer (black-line curves) and curves obtained from the RGB channels of the sensor; Middle: response curves of the RGB channels as a function of the concentration variation of each substance; Right: correlation between the calibration curve obtained with the standard spectrophotometer and the RGB channels of the sensor. From top to bottom: Potassium permanganate (KMnO4), Methylene Blue (MB), Rhodamine B (RhB), Zinc Phthalocyanine (ZnPc), and 5,10,15,20-meso-tetrakis(phenyl)porphyrin (H2-TPP).
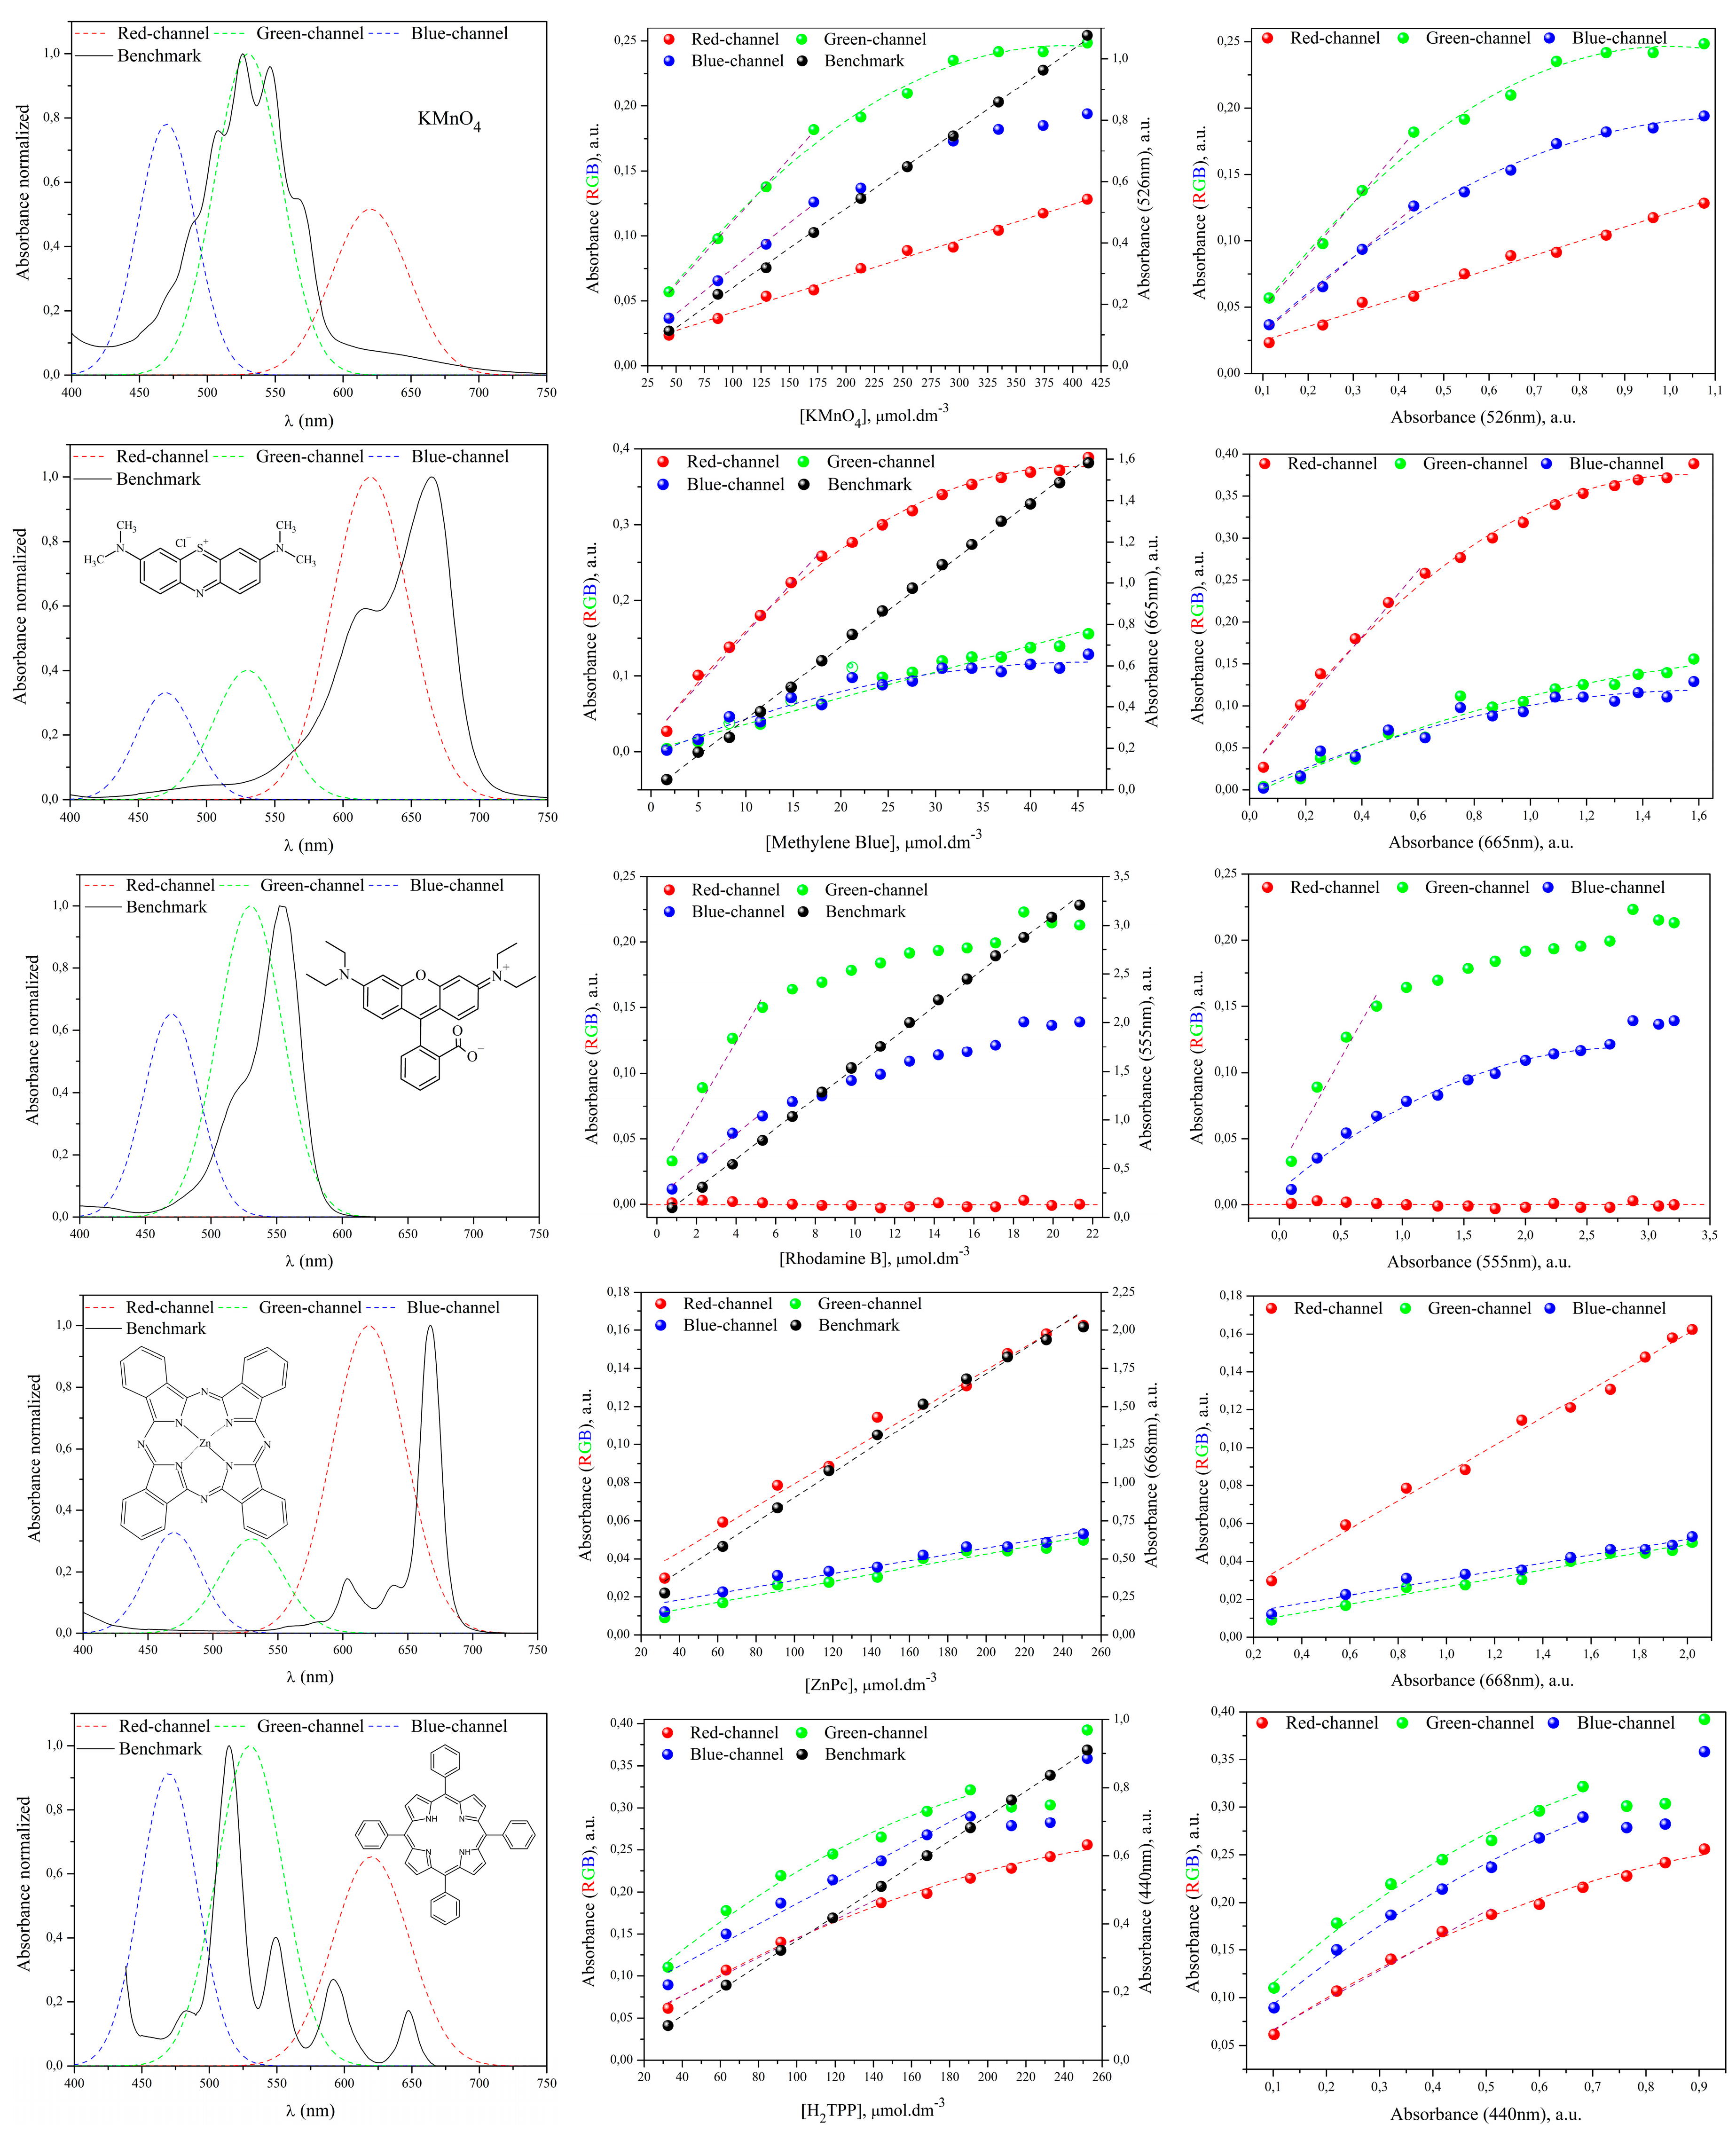
Figure 7.
Correlation between distance and Total Ultraviolet radiation count (UV-Total).
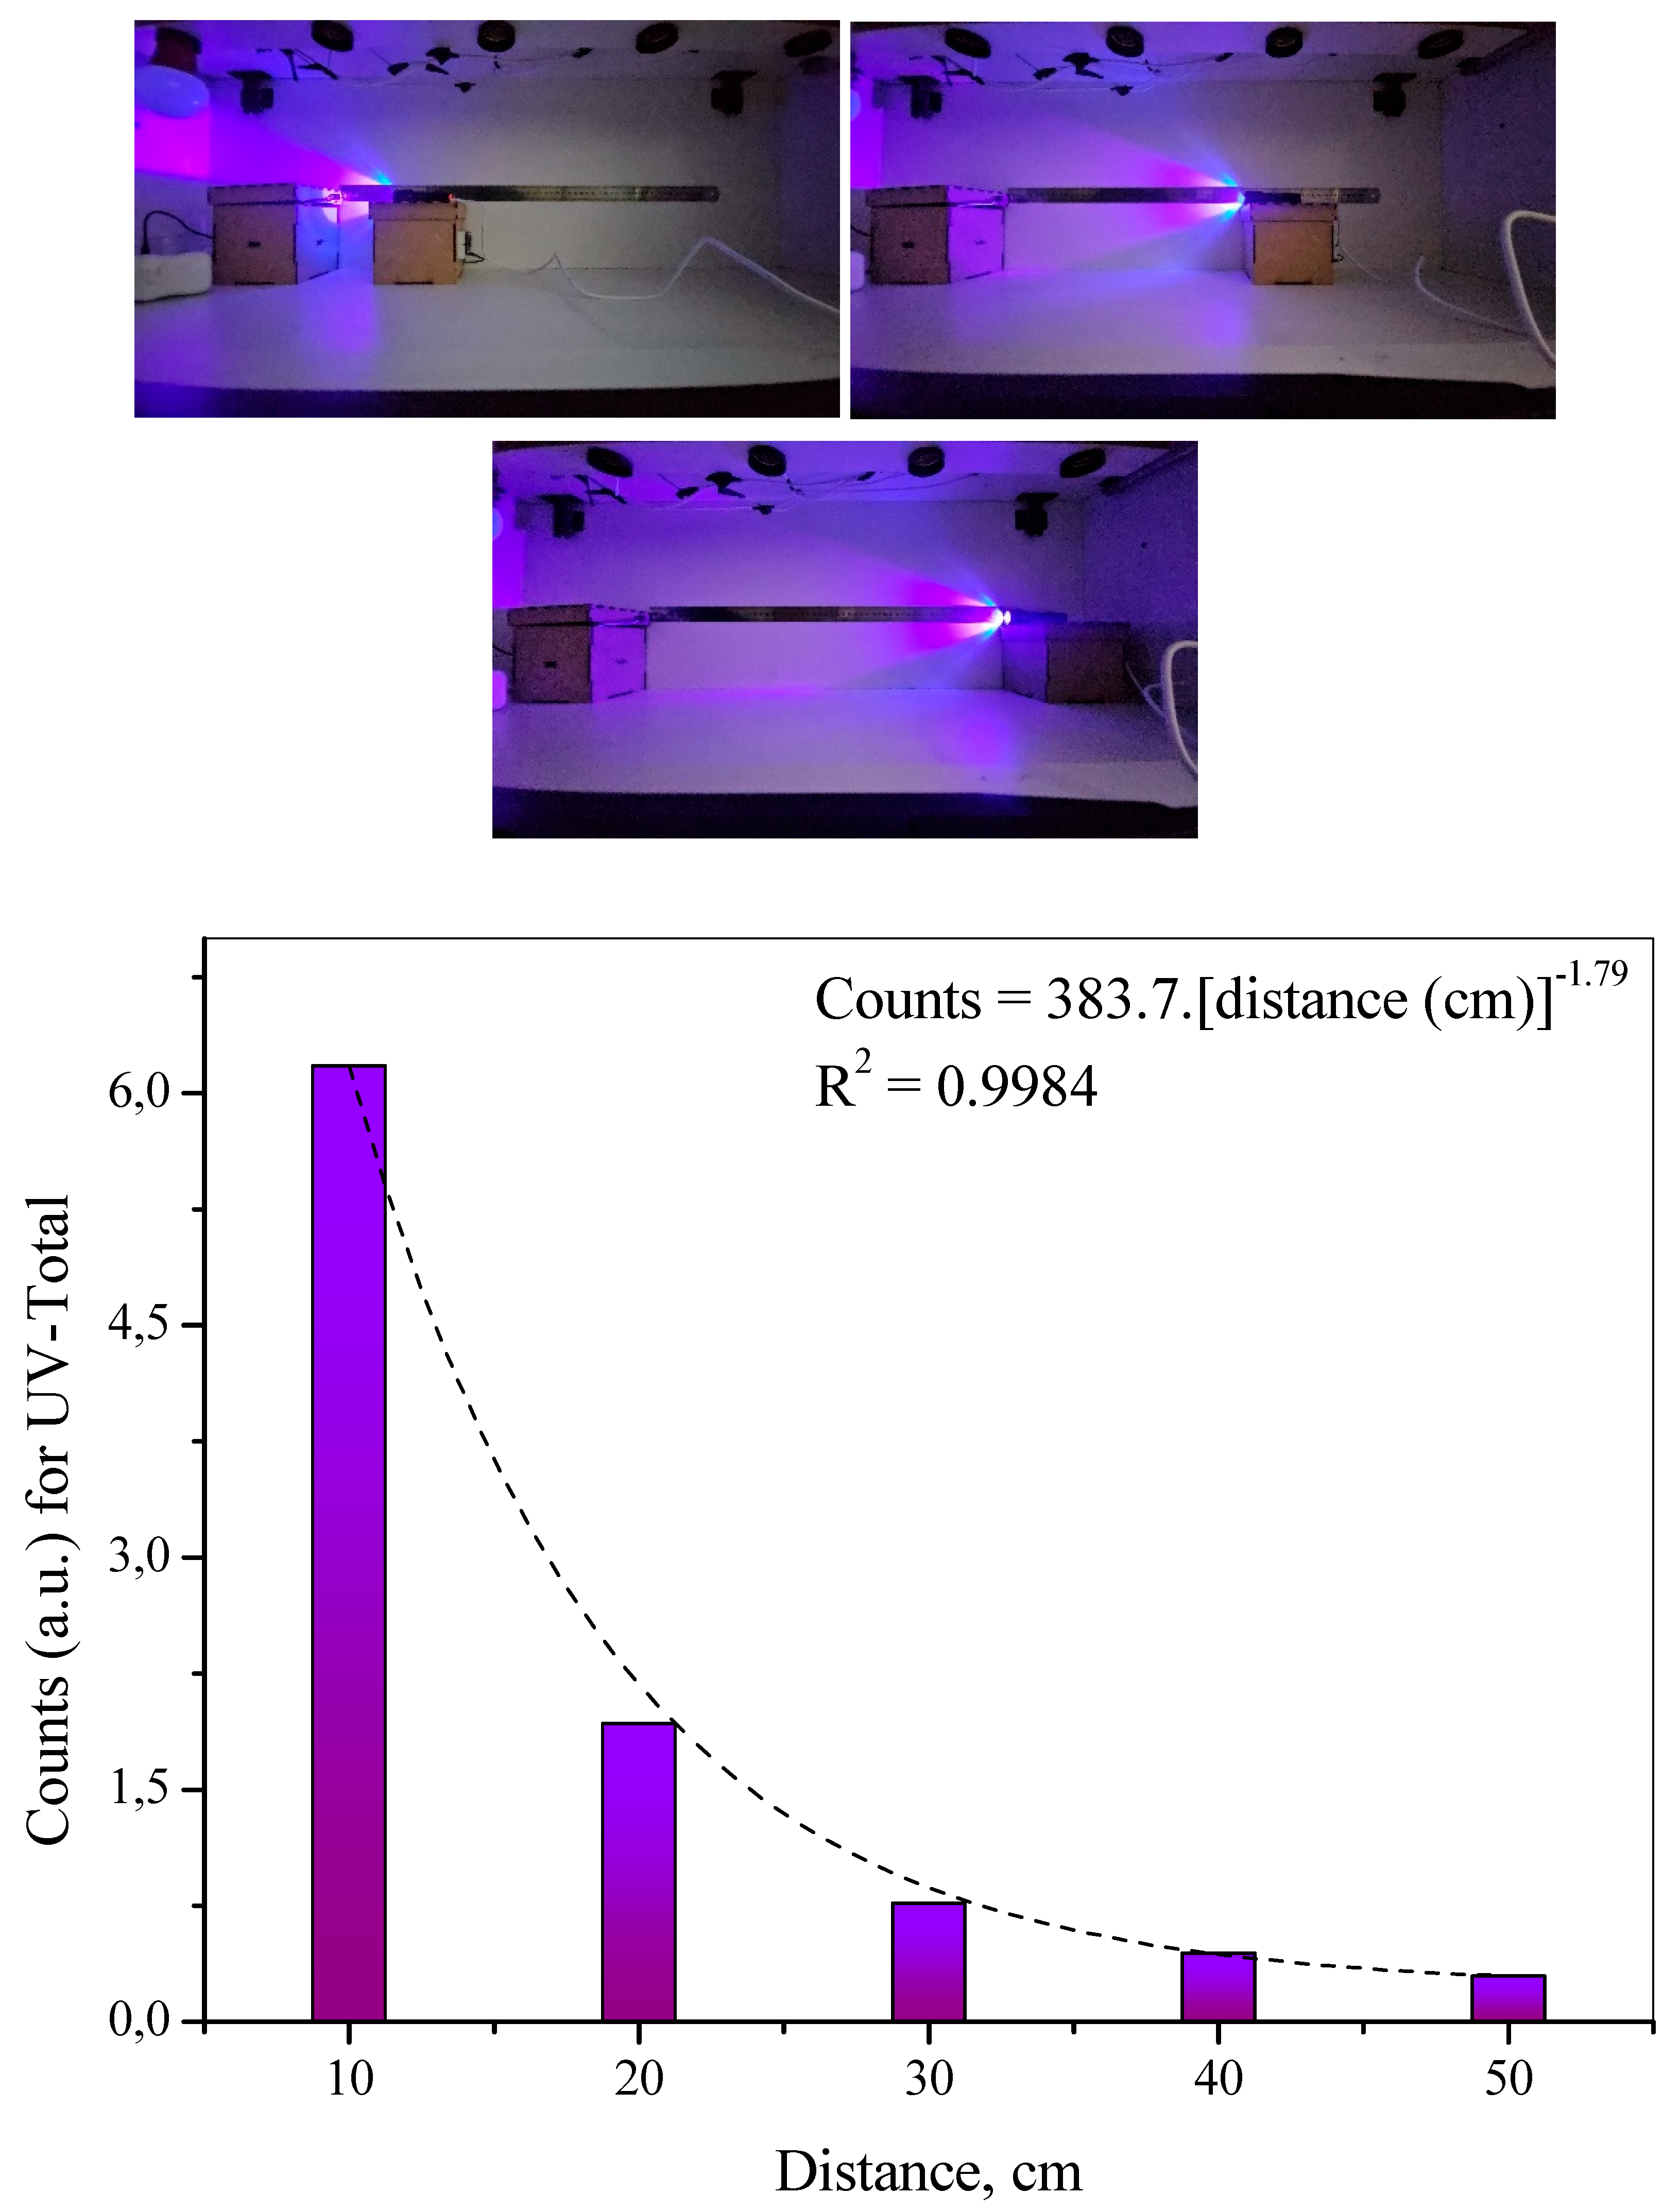
Figure 8.
Ultraviolet radiation measurements performed in the cities of Amargosa (with the prototype using the AS7331 sensor), on Aug 7th 2026, and Barreiras (with the commercial radiometer), on Aug 8th 2025. For measurements performed with the prototype, the values were corrected using the meteorological data available from CPTEC/INPE.
Figure 8.
Ultraviolet radiation measurements performed in the cities of Amargosa (with the prototype using the AS7331 sensor), on Aug 7th 2026, and Barreiras (with the commercial radiometer), on Aug 8th 2025. For measurements performed with the prototype, the values were corrected using the meteorological data available from CPTEC/INPE.
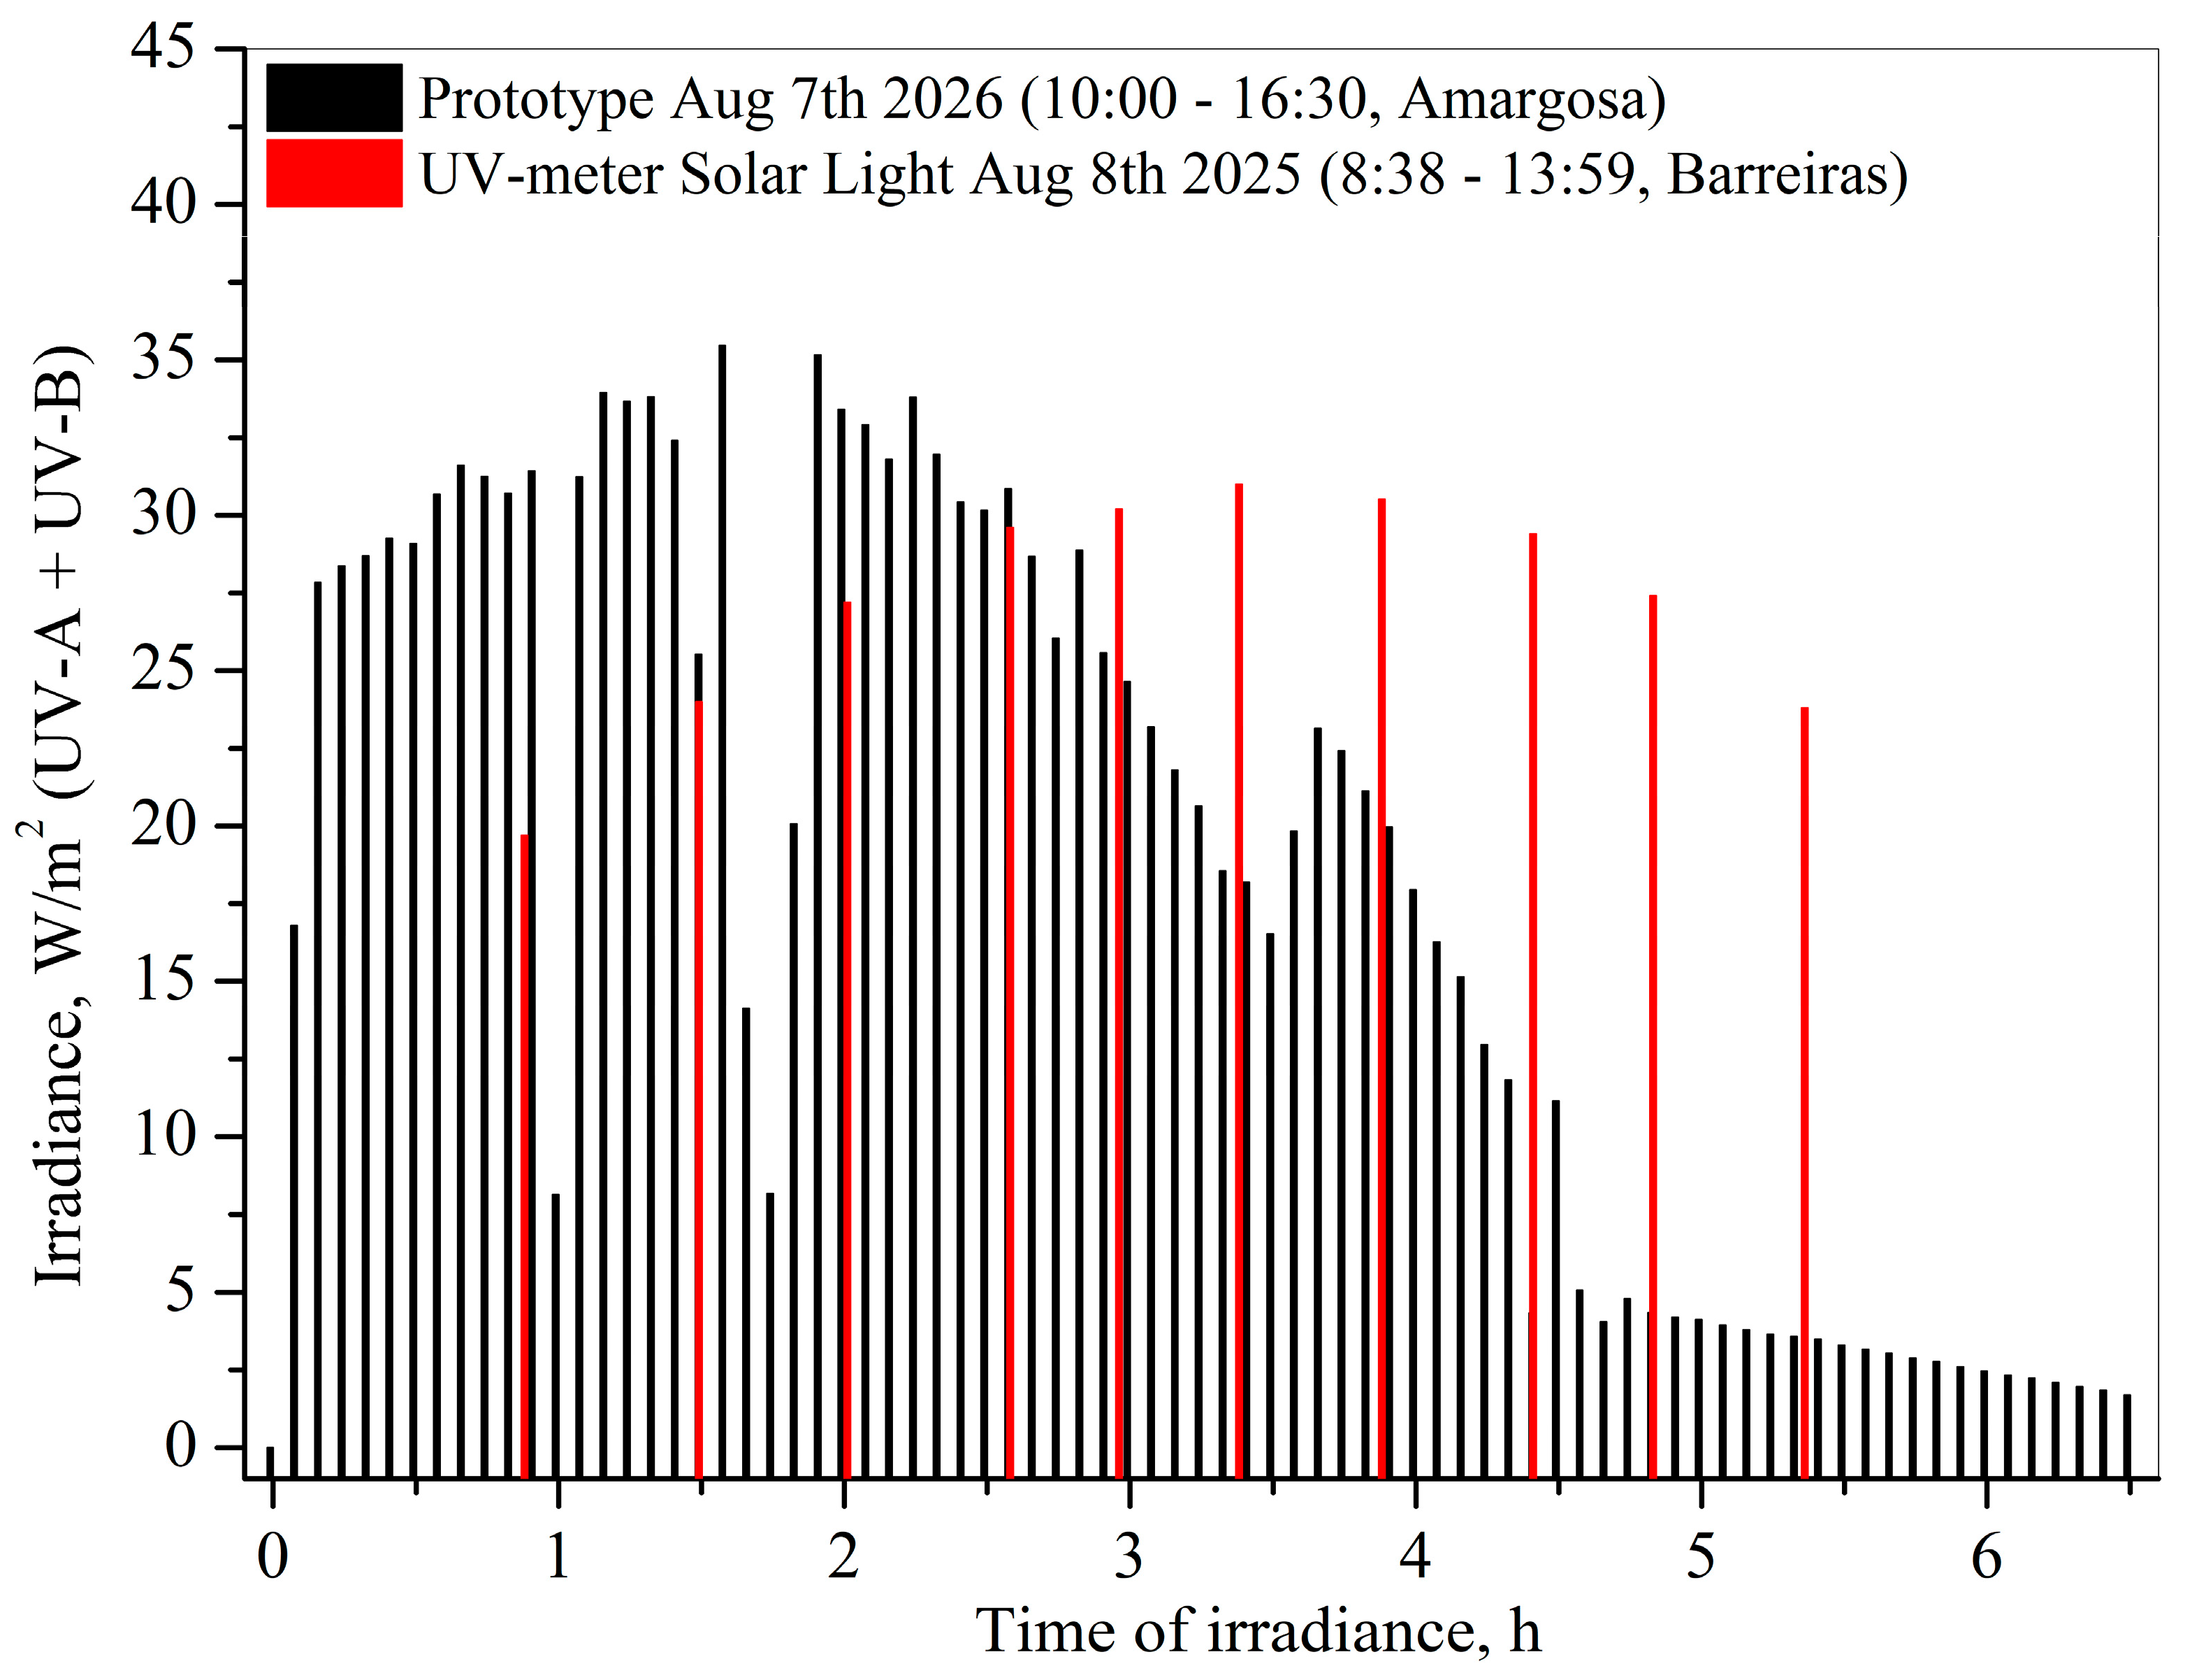
Figure 9.
Use of Obsidian to organize data collected throughout the project, in which the entire workflow was organized through a direct connection with AI (Codex). .
Figure 9.
Use of Obsidian to organize data collected throughout the project, in which the entire workflow was organized through a direct connection with AI (Codex). .
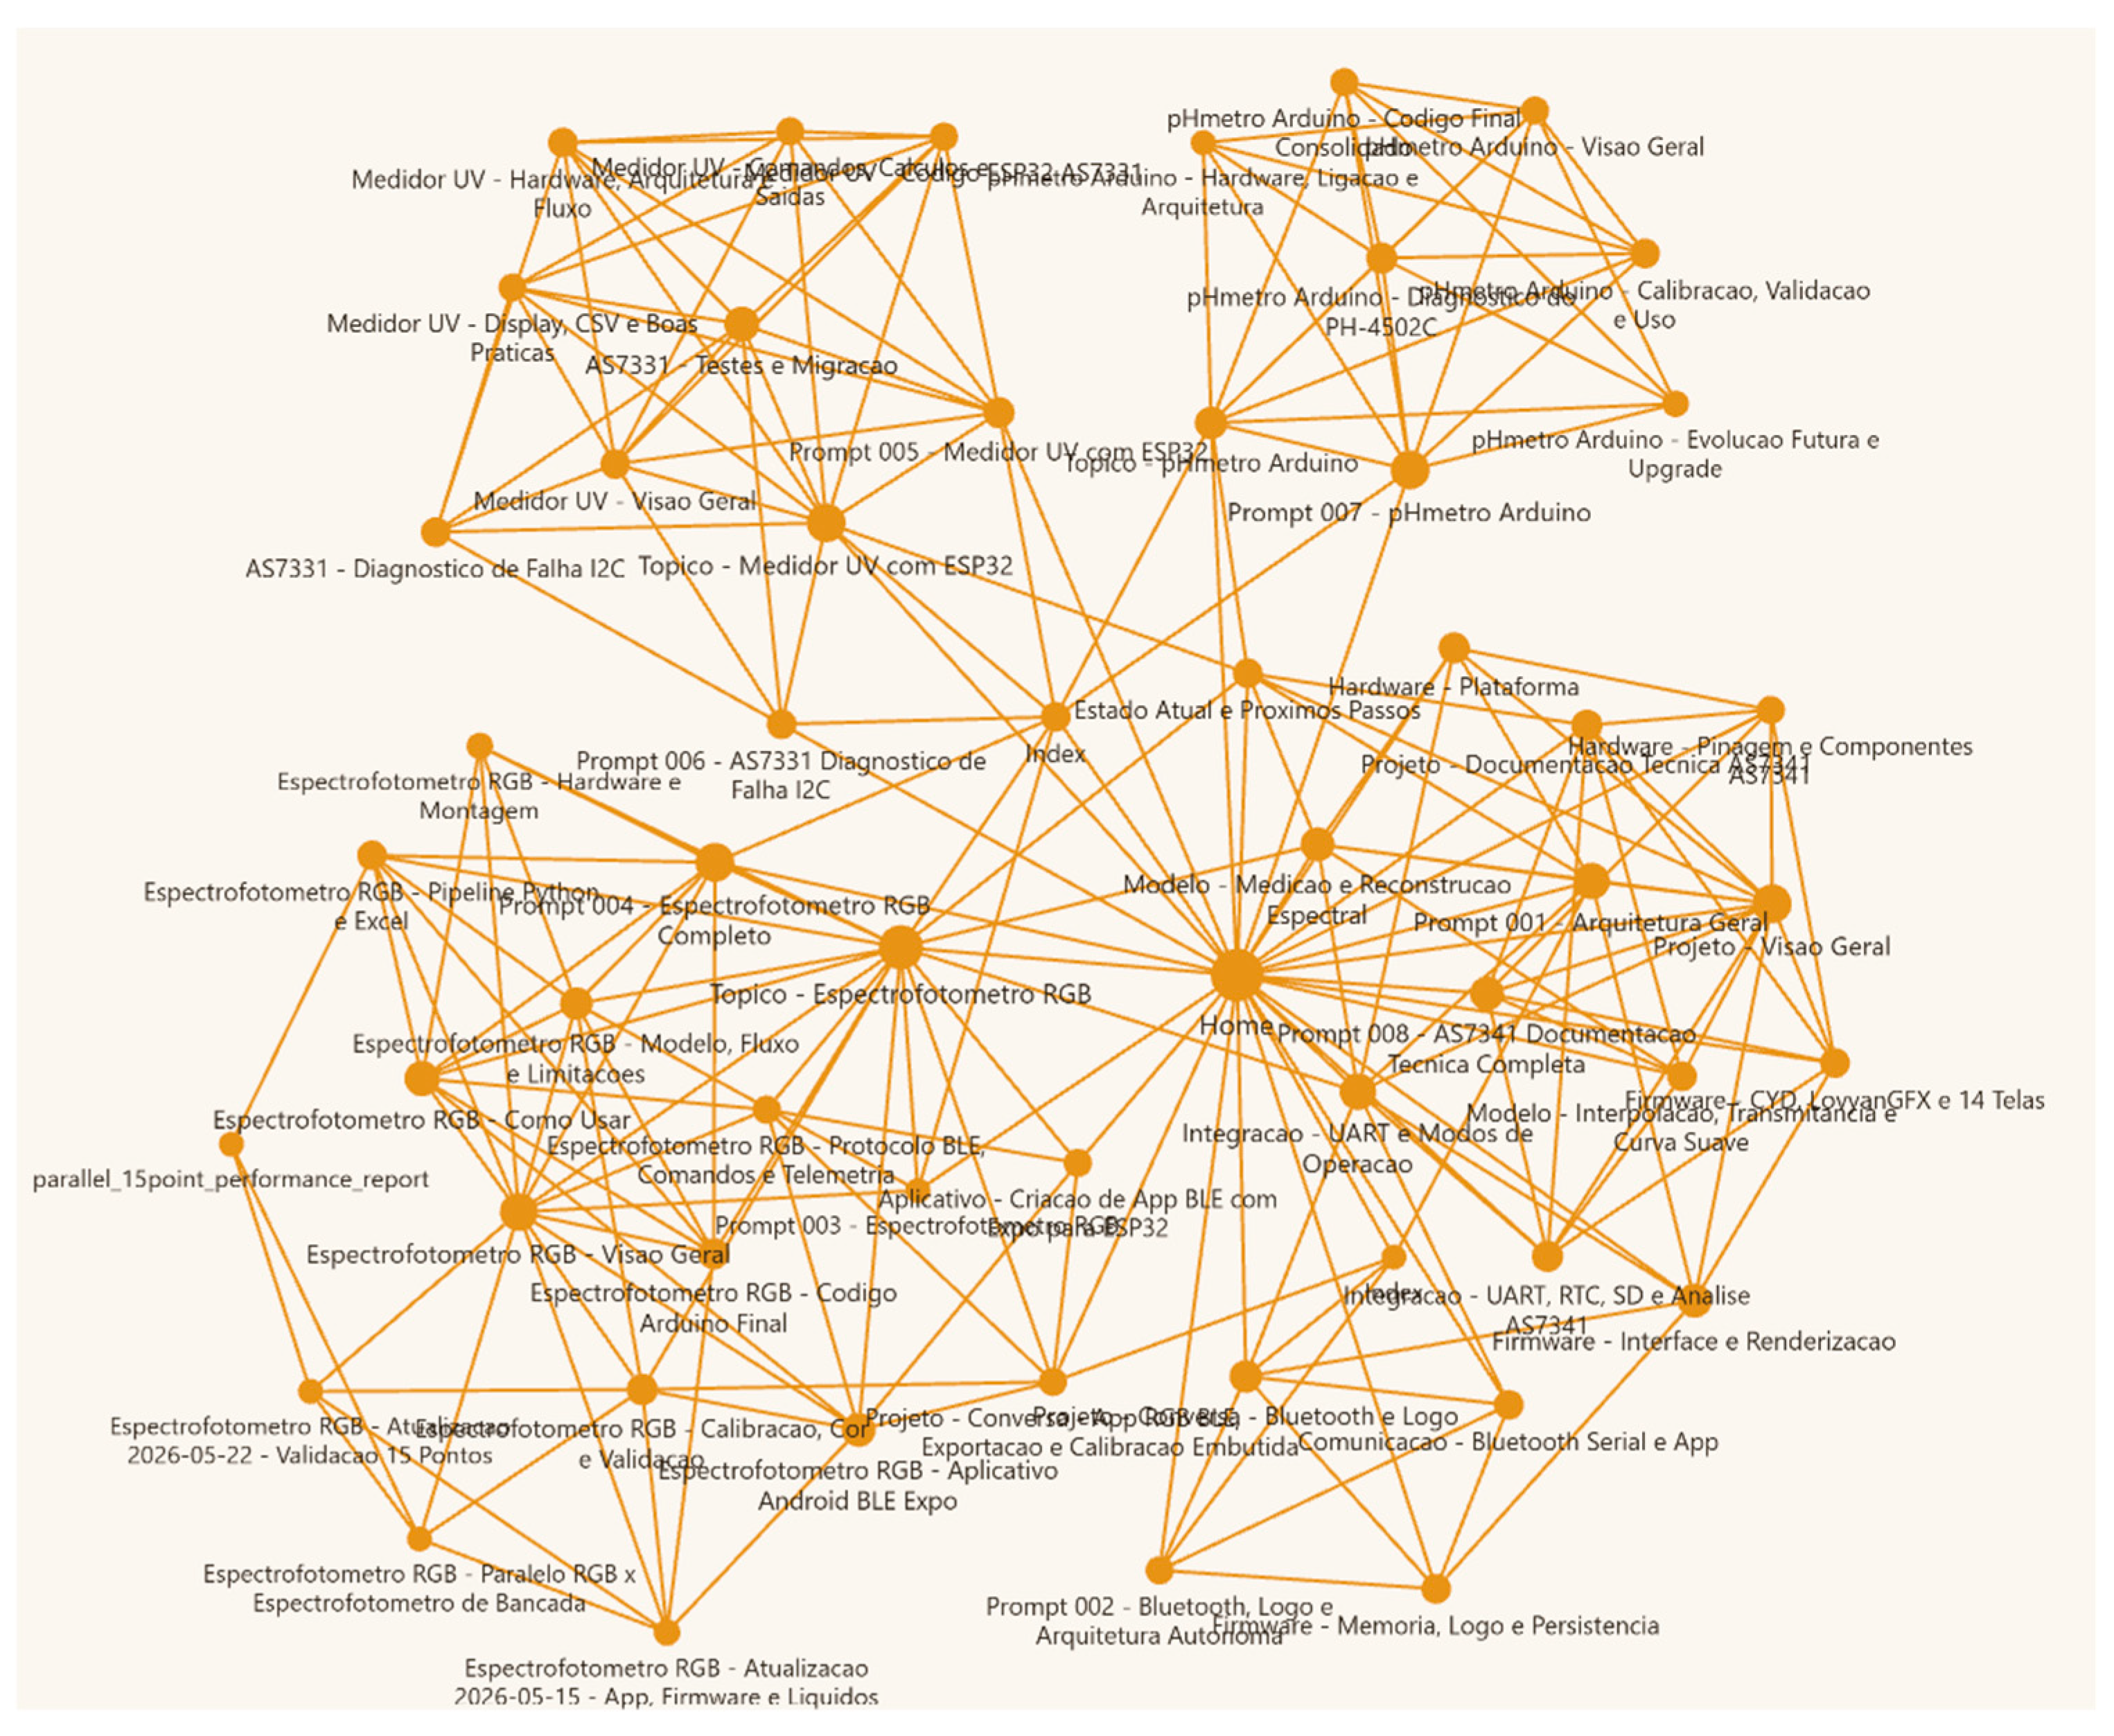

Table 1.
Observed color and standard reference vs parameters measured by the prototype in CIE and RGB coordinates.
Table 1.
Observed color and standard reference vs parameters measured by the prototype in CIE and RGB coordinates.
| Color | Standard reference (CIE) | Measured (CIE) | Standard RGB | Measured RGB |
|---|---|---|---|---|
| White (no ink) | #FFFFFF | #FFFFFF | 255, 255, 255 | 255, 255, 255 |
| Gray | #808080 | #63776F | 128, 128, 128 | 99, 119, 111 |
| Black | #101010 | #2F252F | 16, 16, 16 | 47, 37, 47 |
| Blue | #2D6FD2 | #4784DA | 45, 111, 210 | 71, 132, 218 |
| Cyan | #2FA8C8 | #3BBDEE | 47, 168, 200 | 59, 189, 238 |
| Green | #33A65C | #2AB451 | 51, 166, 92 | 42, 180, 81 |
| Yellow | #D9C44A | #DBC241 | 217, 196, 74 | 219, 194, 65 |
| Magenta | #C85AA5 | #BD4E8F | 200, 90, 165 | 189, 78, 143 |
| Red | #C83C3C | #DD5E62 | 200, 60, 60 | 221, 94, 98 |
| Reference Blue | #1A86E3 | #4B94F2 | 26, 134, 227 | 75, 148, 242 |
Table 2.
Absorption data for the substances studied, obtained with the RGB prototype and the standard spectrophotometer. Measurements were evaluated for each channel, and the linear range is presented, together with the calibration equation according to the Lambert-Beer law and the correlation coefficient (R2).
Table 2.
Absorption data for the substances studied, obtained with the RGB prototype and the standard spectrophotometer. Measurements were evaluated for each channel, and the linear range is presented, together with the calibration equation according to the Lambert-Beer law and the correlation coefficient (R2).
| Analyte | Device | Component | Linear Range (μmol.dm-3) | Equation | R2 |
|---|---|---|---|---|---|
| KMnO4 | RGB sensor | R | 43.0-412.0 | 2.77x10⁻⁴[dye] + 1.34x10⁻² | 0.99154 |
| G | 43.0-172.0 | 9.73x10⁻⁴[dye] + 1.35x10⁻² | 0.99903 | ||
| B | 43.0-172.0 | 6.96x10⁻⁴[dye] + 5.29x10⁻³ | 0.99751 | ||
| UV-Vis | Absorbance | 43.0-412.0 | 2.59x10⁻³[dye] - 4.84x10⁻³ | 0.99932 | |
| MB | RGB sensor | R | 1.60-18.0 | 1.37x10⁻²[dye] + 1.96x10⁻² | 0.98157 |
| G | 1.60-46.0 | 3.47x10⁻³[dye] + 1.57x10⁻³ | 0.97514 | ||
| B | - | - | - | ||
| UV-Vis | Absorbance | 1.60-46.0 | 3.51x10⁻²[dye] - 8.12x10⁻³ | 0.99867 | |
| RhB | RGB sensor | R | - | - | - |
| G | 0.70-5.35 | 2.55x10⁻²[dye] + 2.15x10⁻² | 0.95038 | ||
| B | 0.70-5.35 | 1.22x10⁻²[dye] + 4.67x10⁻³ | 0.97591 | ||
| UV-Vis | Absorbance | 0.70-21.0 | 1.56x10⁻¹[dye] - 2.44x10⁻² | 0.99868 | |
| ZnPc | RGB sensor | R | 32.0-250.0 | 5.97x10⁻⁴[dye] + 1.96x10⁻² | 0.98343 |
| G | 32.0-250.0 | 1.82x10⁻⁴[dye] + 6.17x10⁻³ | 0.95092 | ||
| B | 32.0-250.0 | 1.71x10⁻⁴[dye] + 1.15x10⁻² | 0.95323 | ||
| UV-Vis | Absorbance | 32.0-250.0 | 8.12x10⁻³[dye] + 8.94x10⁻² | 0.98934 | |
| H2TPP | RGB sensor | R | 32.0-140.0 | 1.11x10⁻³[dye] + 3.13x10⁻² | 0.98023 |
| G | - | - | - | ||
| B | 32.0-180.0 | 1.21x10⁻³[dye] + 6.52x10⁻² | 0.97934 | ||
| UV-Vis | Absorbance | 32.0-250.0 | 3.66x10⁻³[dye] - 1.55x10⁻² | 0.99993 |
Table 3.
Metrological limitations, causes, and corrective actions.
| Identified Limitation | Dataset / Affected File |
Physical / Electronic Cause | Corrective Action Implemented |
|---|---|---|---|
| Decimal Format Loss (Scale Factor 10,000) |
Benchtop XLSX files for MB, RhB, ZnPc, H₂-TPP, and KMnO₄ | Loss of decimal separators during automated script-based transfers of raw data from the commercial benchtop software, storing, for example, 1.0884 as 10884. | Systematic division of all benchtop absorbance values >10 by a factor of 10,000 to restore metrological consistency (a.u.). |
| Implicit Decimal Shift (Scale Factor 1,000) |
solar campaigns | Integers stored in local spreadsheet formats with three implicit decimal places during long-term continuous logging on the microSD card. | Division of all continuous solar intensities by 1,000. This restored numerical consistency, making total UV exactly equal to the sum of UVA + UVB + UVC. |
| Absence of Dark-Current Subtraction | TCS34725 RGB colorimeter (all 5 compounds) | Firmware and hardware design limitation whereby the integrated LED of the module could not be switched off via software during runtime. | Declared as a methodological limitation. The system was operated exclusively in blank-only transmission reference mode. |
| Soret-Band Saturation in the Spectrophotometer | H₂-TPP in toluene (peak at 432 nm) | The extremely high molar absorptivity of the H₂-TPP Soret band at 432 nm saturated the commercial benchtop detector (>4.0 a.u.). | Shift of the comparison wavelength to 440 nm, where both the reference values and the RGB values remained within measurable linear limits. |
Disclaimer/Publisher’s Note: The statements, opinions and data contained in all publications are solely those of the individual author(s) and contributor(s) and not of MDPI and/or the editor(s). MDPI and/or the editor(s) disclaim responsibility for any injury to people or property resulting from any ideas, methods, instructions or products referred to in the content. |
© 2026 by the authors. Licensee MDPI, Basel, Switzerland. This article is an open access article distributed under the terms and conditions of the Creative Commons Attribution (CC BY) license (http://creativecommons.org/licenses/by/4.0/).
Copyright: This open access article is published under a Creative Commons CC BY 4.0 license, which permit the free download, distribution, and reuse, provided that the author and preprint are cited in any reuse.