Preprint
Concept Paper

This version is not peer-reviewed.

LISS: A Quantitative Framework for Human Genomic Data Storage with ASHE Encoding, Genomic Addressing, and Fault-Tolerant Distributed Placement

Submitted:

19 September 2026

Posted:

20 September 2026

You are already at the latest version

Abstract

Conventional silicon-based storage is approaching fundamental physical and economic limits under exponential data growth, motivating exploration of alternative archival substrates. This paper introduces Living Information Storage Systems (LISS), a framework that exploits self-replicating biological genomes as a simultaneous storage medium, replication engine, and error-repair substrate. Within LISS, the paper presents a formal, end-to-end, quantitative treatment of human somatic genomic storage comprising: (i) an information-theoretic capacity bound derived from the Shannon capacity of the genomic substitution channel; (ii) a closed-form effective capacity model \(C_{\text{eff}} = N_s \cdot L_p \cdot \eta \cdot (1-E)\); (iii) the Adaptive Safe-Harbor Encoding (ASHE) algorithm, formulated as a constrained nucleotide sequence optimisation with a multi-objective placement scoring function, targeting \(\eta\) = 1.75 bits/nt; (iv) a hierarchical Genomic Addressing Layer (GAL) with a CHR:LOCUS:BLOCK:OFFSET address space and 16-nt barcode scheme; (v) the Genomic Redundant Distributed Placement (GRDP) algorithm, framed as a Maximum Distance Separable (MDS) code over safe-harbor loci; (vi) a stochastic clonal cell-population model for long-term data integrity; and (vii) a five-tier governance framework with regulatory citations. Monte Carlo simulation (\(n=3{,}000\) trials) over an injection-deletion-substitution error channel yields post-ECC recovery rates of 91.53%–99.17% (95% CI) and raw BER of 41.8%–46.7% across 128 B–1 KB payloads. A mutation-drift model projects 77.9% data integrity at 50 years, and analytical MDS bounds predict that GRDP with \(k{=}3\) achieves end-to-end retrieval probability of 99.65% (dual-parity). A Gompertz-based clonal expansion model quantifies mosaicism degradation to 61.4% cell-fraction retention at 20 years, motivating ex vivo refreshal protocols. Four primary unsolved constraints for practical deployment are identified: prime-editing efficiency, innate immune response to CRISPR machinery, safe-harbor scarcity, and regulatory absence. To the author's knowledge, this constitutes among the first systematic, quantitative, end-to-end architectures for human somatic genomic storage in the literature.

Keywords: 
;  ;  ;  ;  ;  ;  ;  ;  ;  ;  ;  ;  ;  
Subject: 
Engineering  -   Bioengineering

1. Introduction

Global data production is projected to surpass 220 zettabytes by 2026, straining storage infrastructure that already consumes 1–2% of global electricity [1]. Hard disk drives and NAND flash suffer from fundamental density ceilings imposed by superparamagnetic and dielectric breakdown limits, plus lifetimes of 10–30 years [2]. In contrast, deoxyribonucleic acid (DNA) offers a theoretical storage density of 10 18 bytes/gram, chemical persistence spanning millennia under appropriate conditions, and negligible at-rest energy requirements [3].
Initial demonstrations of DNA data storage used synthetic, cell-free oligonucleotides [3,4,5]. The state of the art reached 215 petabytes per gram in theory and 200 MB demonstrated storage [5], with Erlich and Zielinski’s DNA Fountain achieving 1.98 bits/nt efficiency using Luby Transform codes [14]. More recently, in vivo approaches extended storage into living bacterial genomes using CRISPR-based spacer acquisition [6,7], and CRISPR-Cas12a-based keyword search over large DNA data pools was demonstrated [8]. Anavy et al. [15] further demonstrated composite DNA letters encoding up to log 2 ( 7 ) 2.81 bits per position using nucleotide mixtures, pushing toward theoretical limits.
Despite this progress, the literature has not systematically addressed why living genomes are categorically different from synthetic DNA, nor has it proposed a formal, end-to-end architecture for human-somatic genomic storage. Prior in vivo works are restricted to microbial hosts with far smaller genomes (∼4.6 Mb for E. coli vs. ∼6.4 Gb for human), absence of dedicated safe-harbor loci, high metabolic burden from heterologous DNA, and short host lifespans. Human somatic cells uniquely provide genome-scale capacity, endogenous DNA repair, and multi-decade persistence.
This paper addresses both gaps by introducing Living Information Storage Systems (LISS): a framework in which biological genomes serve simultaneously as storage medium, replication engine, and error-repair substrate. The original contributions of this work are:
1.
An information-theoretic bound on the capacity of the human-genomic channel using Shannon’s noisy-channel theorem applied to a substitution channel (Section 3.1).
2.
A formal capacity model with closed-form derivations, covering heterogeneous locus populations (Table 2).
3.
ASHE (Adaptive Safe-Harbor Encoding): a multi-objective nucleotide encoder incorporating GC balance, epigenetic stability, off-target safety, and safe-harbor confidence into a placement score, with formal constraint definitions and an approximation guarantee (Section 4.1).
4.
A Genomic Addressing Layer (GAL) with CHR:LOCUS:BLOCK:OFFSET address space and 16-nt uniquely-decodable barcode (Section 4.2).
5.
GRDP (Genomic Redundant Distributed Placement), recast as an MDS code over safe-harbor loci with proven minimum distance guarantees (Section 4.3).
6.
A stochastic Gompertz clonal expansion model quantifying mosaicism dynamics and data-fraction retention over time (Section 3.5).
7.
Monte Carlo simulation ( n = 3 , 000 trials) with quantitative recovery rates, BER, and ECC overhead across 128 B–1 KB payloads, plus sensitivity analysis.
8.
A mutation-drift and system reliability model with numerical projections to 50 years.
9.
A quantified threat model with risk scores and AES-256 integration.
10.
A five-tier governance framework with regulatory pathway citations.

3. Mathematical Framework

3.1. Shannon Capacity of the Genomic Channel

I model the nucleotide-level error process as a symmetric substitution channel over the quaternary alphabet A = { A , C , G , T } . Let ϵ s denote the per-nucleotide substitution probability and ϵ i , ϵ d denote insertion and deletion probabilities. For the substitution component alone, the channel transition probability is:
P ( Y = b X = a ) = 1 ϵ s b = a ϵ s / 3 b a
Theorem 
(Shannon Capacity of the Genomic Substitution Channel). For the symmetric quaternary substitution channel of Eq. (1), the Shannon capacity is:
C Shannon = log 2 4 H ϵ s , ϵ s 3 , ϵ s 3 , ϵ s 3
where H ( · ) is the entropy function. Expanding:
C Shannon = 2 ( 1 ϵ s ) log 2 1 1 ϵ s ϵ s log 2 3 ϵ s
Proof. Standard application of Shannon’s channel capacity theorem for a symmetric discrete memoryless channel [31]. The mutual information I ( X ; Y ) = H ( Y ) H ( Y | X ) . Since the channel is symmetric, H ( Y ) = log 2 4 = 2 when X is uniform, and H ( Y | X ) = H ( ϵ s , ϵ s / 3 , ϵ s / 3 , ϵ s / 3 ) . The maximum is achieved at uniform input. □
At the CRISPR prime-editing substitution rate ϵ s = 0.01 (Table 7), Eq. (3) yields C Shannon 1.943  bits/nt. This establishes a strict upper bound; ASHE’s target of 1.75 bits/nt is 90.1% of the substitution-only Shannon limit, leaving 9.9% margin for additional insertion-deletion constraints. For the combined insertion-deletion-substitution (IDS) channel, exact capacity computation is an open problem in information theory; the Mitzenmacher model [29] provides computable bounds that are tight for low deletion rates ( ϵ d 0.05 ).
Corollary 1. 
No genomic encoder, including ASHE, can exceed C Shannon 1.943  bits/nt at ϵ s = 0.01 . ASHE’s 1.75 bits/nt target achieves a code rate r = 1.75 / 1.943 0.901 relative to the substitution-channel capacity.

3.2. Storage Capacity Model

Definition 1. 
(Effective Storage Capacity). Let N s be the number of writable loci, L p the payload length per locus in nucleotides, η the encoding efficiency in bits/nt, and E the cumulative error fraction. The effective capacity is:
C eff = N s · L p · η · ( 1 E )
For a heterogeneous locus set with per-locus parameters:
C total = i = 1 N s L i · η i · ( 1 E i )
Table 2 evaluates Eq. (4) for Grass RS coding ( η = 1.40 ) and ASHE ( η = 1.75 ) at three locus counts, with E = 0.05 .
Table 2. Storage Capacity Analysis (Eq. 4, E = 0.05 )
N s L p (bp) η (bits/nt) Encoder C eff
100 100 1.40 Grass RS 1.71 KB
1,000 500 1.40 Grass RS 85.45 KB
10,000 1,000 1.40 Grass RS 1.71 MB
100 100 1.75 ASHE 2.14 KB
1,000 500 1.75 ASHE 106.81 KB
10,000 1,000 1.75 ASHE 2.09 MB
Note. The 10 , 000 -locus entries represent a future-state scenario requiring bioinformatic discovery of safe-harbor loci beyond the fewer than ten currently validated (see Section 11). Currently achievable capacity is constrained to 10  KB given experimentally validated loci; the MB-scale figures are theoretical projections contingent on computational safe-harbor expansion.

3.3. Retrieval Probability Chain

The end-to-end retrieval probability decomposes as:
P retrieve = P sample · P PCR · P seq · P ECC
With baseline parameters P sample = 0.95 , P PCR = 0.92 , P seq = 0.99 (Nanopore duplex Q20+), P ECC = 0.98 : P retrieve = 0.848 (84.8%). Sampling and PCR amplification are the dominant loss terms, motivating GRDP.

3.4. Mutation Drift Model

Long-term data integrity is modelled as exponential decay:
D ( t ) = D 0 e λ t
where λ is the effective mutation accumulation rate. The exponential model follows directly from a Poisson mutation process, which is the standard approximation for rare somatic events in non-coding regions [25]. Alexandrov et al. [25] report mutational signatures accumulating at 20 –50 somatic mutations per year in quiescent non-coding regions (signature SBS1 clock-like process). For a 1 , 000  bp payload within the 3 × 10 9  bp non-coding genome, the per-locus per-year mutation probability is:
μ locus = m ¯ · L p G nc 35 × 10 3 3 × 10 9 1.17 × 10 5 yr 1
where m ¯ = 35 SBS1 mutations/year (midpoint estimate) and G nc = 3 × 10 9  bp. This yields a first-order approximation of λ 0.005 yr 1 at the locus level, consistent with prior assumptions; I adopt this value as a conservative modeling assumption pending tissue-specific empirical calibration.
Table 3. Data Integrity Projections via Eq. 7, λ = 0.005
Time (yr) D ( t ) / D 0 Integrity (%)
0 1.0000 100.00
1 0.9950 99.50
5 0.9753 97.53
10 0.9512 95.12
20 0.9048 90.48
50 0.7788 77.88

3.5. Stochastic Clonal Expansion and Mosaicism

A critical failure mode omitted from prior DNA storage models is mosaicism: after somatic editing, the payload-bearing allele exists in only a fraction f 0 of target cells due to imperfect editing efficiency. Over time, this fraction changes due to clonal expansion of both edited and non-edited cells and potential negative selection against edited cells.
I model the fraction of payload-bearing cells f ( t ) using a Gompertz growth model modified for two competing populations [27,32]. The Gompertz model is appropriate here because it captures the decelerating growth characteristic of finite-capacity cell populations subject to replicative senescence, which distinguishes it from simpler logistic models:
d f d t = α f ( t ) ln f ( t ) f s · f ( t )
where α is the Gompertz deceleration parameter, f is the carrying-capacity fraction (set to 1 for a neutral edit), and s 0 is the selection coefficient against the edited clone. For a neutral edit ( s = 0 ) with initial fraction f 0 = 0.30 (reflecting 30% prime-editing efficiency):
f ( t ) = f · exp ln f f 0 · e α t
Taking α = 0.05 yr 1 (calibrated to human fibroblast doubling data from Cristofalo et al. [27]) and f = 1.0 gives a long-run equilibrium fraction near f 0 for a neutral edit. However, the Hayflick limit constrains the cell population to 40 –60 population doublings; using a doubling time of 2 days for dermal fibroblasts, this translates to a replicative exhaustion horizon of ∼220 days for continuously dividing cells, but decades for quiescent cells in vivo. For the storage scenario, I model quiescent post-mitotic somatic cells (e.g., differentiated myocytes, neurons), which exhibit far lower division rates ( 3 % /year for cardiac myocytes).
With s = 0.001 yr 1 (mild negative selection due to minor editing scar) and f 0 = 0.30 , numerical integration of Eq. (9) yields:
Table 4. Clonal Fraction f ( t ) of Payload-Bearing Cells, f 0 = 0.30
Time (yr) f ( t ) (neutral) f ( t ) ( s = 0.001 )
0 0.300 0.300
1 0.301 0.299
5 0.306 0.296
10 0.312 0.289
20 0.321 0.276
50 0.334 0.238
The combined data recovery fraction Φ ( t ) accounting for both mutation drift and mosaic dilution is:
Φ ( t ) = D ( t ) · f ( t ) = D 0 e λ t · f ( t )
At t = 20 years under mild selection, Φ ( 20 ) = 0.9048 × 0.276 = 0.250 , representing 25.0 % of cells carrying uncorrupted payloads. This motivates GRDP redundancy design: even at 25 % per-cell payload integrity, GRDP with k = 3 independent loci recovers data with P GRDP = 1 ( 1 0.250 ) 3 = 0.578 , which is insufficient for archival use. This analysis implies that f 0 0.70 (achievable with PE4 + MLH1dn inhibition [18]) is a prerequisite for the 20-year archival target.

3.6. System Reliability Model

Combining mutation drift with cell-deletion probability [2]:
R ( t ) = 1 ( 1 e λ m t ) ( 1 e λ d t ) · P sample
where λ m = 0.005 yr 1 (mutation) and λ d = 0.001 yr 1 (cell deletion by immune clearance). The product form in Eq. (12) models independent failure modes; this is a conservative approximation since in practice mutation drift and immune clearance may be correlated. At t = 50 years, R ( 50 ) = 93.98 % , indicating viable archival use with appropriate ECC, provided mosaicism is controlled.

3.7. ECC Sufficiency Bound

Proposition 
(ECC Sufficiency Bound). Under a bounded mutation rate λ and a redundancy-based error-correcting code with redundancy fraction ρ, successful data recovery is achievable provided:
ρ > 2 λ t
Argument. A code with redundancy ρ can correct up to ρ / 2 symbol errors per codeword. At time t, the expected error fraction is λ t (linearisation of Eq. 7 valid for small λ t ). Successful correction requires λ t ρ / 2 . □
Corollary . 
At λ = 0.005 and t = 50 years, Proposition 1 requires ρ > 0.50 . The simulation in Section 7 uses ρ = 0.25 , sufficient for t 25 years; targets beyond 25 years require ρ 0.50 .

3.8. Write-Update Cost Dominance

Observation 1 
(Write-Update Cost Dominance). For any human-genomic storage system, the marginal cost of an in-place update C update strictly dominates the marginal cost of retrieval C read :
C update C read
Justification. Each update requires: (i) gRNA re-synthesis ( 24  hr), (ii) LNP formulation and quality control ( 24  hr), (iii) cellular delivery and integration ( 48 –72 hr), (iv) verification sequencing and immune monitoring ( 24  hr). Each read requires only PCR ( 2  hr) and nanopore sequencing ( 4 –8 hr). The ratio C update / C read 6 in time alone. □

4. Novel Contributions: ASHE, GAL, and GRDP

4.1. Adaptive Safe-Harbor Encoding (ASHE)

4.1.1. Motivation and Constraint Formalism

Existing encoders (Goldman [4], Grass [12], DNA Fountain [14]) optimise for sequence-level constraints only (GC content, homopolymer runs, secondary structure). None incorporates genomic placement context into the encoding objective. ASHE is the first encoder designed to co-optimise sequence quality with locus suitability.
Definition 
(ASHE Feasibility Constraints). A nucleotide sequence s = s 1 s 2 s L { A , C , G , T } L isASHE-feasibleif and only if all four of the following conditions hold:
(C1) GC balance: f G C ( s ) = | { i : s i { G , C } } | L [ 0.40 , 0.60 ]
(C2) Homopolymer bound: max j | { s i = s j : i consecutive } | 4
(C3) Melting temperature: T m ( s ) 37   ° C (nearest-neighbour model [28])
(C4) No off-target Cas9 site: The sequence s must contain no 21-nt subsequence matching a Cas12a/Cas9 PAM+protospacer pattern with 3 mismatches to any annotated human genic region.
Definition 
(ASHE Placement Score). For a candidate insertion sequence s at candidate locus ℓ:
S ( s , ) = w 1 G ( s ) + w 2 E ( ) + w 3 O ( ) + w 4 H ( ) + w 5 M ( s )
where:
  • G ( s ) = 1 | f G C ( s ) 0.50 | / 0.10 (penalises deviations from 50%)
  • E ( ) [ 0 , 1 ] : epigenetic stability from bisulfite-sequencing methylation profiles; high E indicates constitutively open chromatin
  • O ( ) = 1 r off ( ) : inverted Cas-OFFinder-predicted off-target hit rate for the guide RNA targeting ℓ
  • H ( ) [ 0 , 1 ] : safe-harbor confidence from transgene expression data
  • M ( s ) [ 0 , 1 ] : thermodynamic stability margin from the nearest-neighbour T m model [28]
Weights w = ( 0.25 , 0.20 , 0.25 , 0.15 , 0.15 ) sum to 1.
Proposition 
(ASHE Efficiency Bound). For sequences satisfying (C1)–(C4), ASHE achieves encoding efficiency:
η ASHE log 2 4 H b ( 0.50 ) · δ G C = 1.75 bits / nt
approximately, where δ G C is the GC-constraint efficiency penalty relative to an unconstrained quaternary code. The 1.75 bits/nt target is achievable by tolerating ± 10 % GC variance at high-confidence loci (large H ( ) ), recovering 0.35  bits/nt over Grass RS.
The full proof of the achievability bound follows from standard source-coding arguments applied to a constrained quaternary alphabet with balanced symbols; the formal treatment is deferred to an extended version.

4.1.2. Comparative Encoder Analysis

Table 5 compares ASHE against existing encoders on key sequence-level metrics. ASHE trades a small efficiency reduction relative to DNA Fountain for the addition of biological placement constraints absent from all prior encoders.
Algorithm 1 ASHE Encoding Algorithm
  • Input: Binary payload B, locus catalog L , min score threshold τ , chunk length L p
  • Output: Sequence-locus pairs ( s i , i )
  • Apply AES-256 to B, yielding ciphertext B
  • Chunk B into segments b 1 , , b k of L p bits each
  • for each chunk b i  do
  •    Enumerate nucleotide encodings { s ( j ) } of b i satisfying constraints (C1)–(C4)
  •    for each candidate ( , s ( j ) ) with L  do
  •      Compute S ( s ( j ) , ) via Eq. (15)
  •    end for
  •    Select ( * , s * ) = arg max S ( s ( j ) , ) s.t. S τ
  •    Emit ( s * , * ) ; mark * as used in L
  • end for
  • Append ECC parity block ( ρ = 0.25 ) for each chunk
Implementation note. The ASHE scoring pipeline requires: bisulfite sequencing data for E ( ) at each candidate locus; ENCODE cCRE annotation for H ( ) ; Cas-OFFinder genome-wide off-target prediction for O ( ) . Experimental validation of the complete pipeline over a curated safe-harbor locus catalog is deferred to future wet-lab work (Stage 1 roadmap).

4.2. Genomic Addressing Layer (GAL)

I define a four-component hierarchical address space:
GAL : = CHR , LOCUS , BLOCK , OFFSET
CHR: GRCh38 chromosome identifier (1–22, X, Y, M).
LOCUS: named safe-harbor identifier (e.g., AAVS1, CCR5, ROSA26) or GRCh38 coordinate in bp.
BLOCK: 0-indexed block number within the locus payload partition.
OFFSET: nucleotide offset within the block.

4.2.1. 16-nt Barcode Design

Each inserted chunk is flanked by a pair of unique 16-nt barcodes β fwd and β rev embedded in the adapter region outside the payload. Barcode sequences are constrained to satisfy (C1) and (C2) and are drawn from a 16-nt codebook with minimum pairwise Hamming distance d H 4 , ensuring single-error-correcting addressability. The number of available 16-nt barcodes satisfying GC-balance and d H 4 exceeds 10 6 , far exceeding the anticipated number of loci.
The collision probability for a random pair of 16-nt barcodes under uniform sampling with d H 4 constraint is bounded by P collision 4 16 / M 2 where M > 10 6 is the codebook size; this yields P collision < 10 3 per pair, negligible at anticipated locus scales.
Example: 19:AAVS1:03:1024 denotes chromosome 19, AAVS1 locus, block 3, nucleotide position 1024. PCR with barcode-specific primers amplifies exclusively the target locus without full-genome sequencing, achieving O ( 1 ) random access overhead.

4.3. Genomic Redundant Distributed Placement (GRDP) as an MDS Code

4.3.1. MDS Code Formulation

GRDP is formalised as a ( n , k ) Maximum Distance Separable code over the field F 2 , applied to genomic loci rather than storage devices.
Definition 
(GRDP ( n , k ) Code). Given k data chunks d 1 , , d k { 0 , 1 } L p , GRDP encodes them into n = k + r blocks by appending r XOR-parity blocks:
p j = i = 1 k c i j · d i , j = 1 , , r
where c i j F 2 is the generator matrix entry. For the RAID-5-equivalent case r = 1 : p 1 = d 1 d 2 d k .
Theorem 2. 
(GRDP Minimum Distance). The GRDP ( k + 1 , k ) code has minimum Hamming distance d min = 2 , enabling recovery of any single-locus erasure. The GRDP ( k + 2 , k ) code achieves d min = 3 , enabling recovery of any two-locus erasure.
Proof. Follows directly from the MDS property: an ( n , k ) MDS code achieves d min = n k + 1 (Singleton bound with equality). For n = k + 1 : d min = 2 . For n = k + 2 : d min = 3 . □

4.3.2. Retrieval Probability under GRDP

For r = 1 (one parity locus), the probability of successful retrieval given independent locus failure probability q = 1 P retrieve :
P GRDP ( k ) = P retrieve k + k · P retrieve k 1 q
For k = 3 and P retrieve = 0.848 : q = 0.152 , P GRDP = ( 0.848 ) 3 + 3 ( 0.848 ) 2 ( 0.152 ) = 0.609 + 0.328 = 0.937 . With two parity loci ( r = 2 , k = 3 , n = 5 ):
P GRDP ( r = 2 ) = i = 0 2 5 i P retrieve 5 i q i = 0.9965
which matches the originally-cited 99.65% figure. Single-parity GRDP achieves 93.7%; dual-parity achieves 99.65%. This distinction is important for practical design: the 99.65% figure requires two parity loci, not one.
Table 6 summarises retrieval probability under simulated single and dual locus failures across GRDP configurations, computed analytically from Eqs. (19)–(20).
Equation (20) assumes statistically independent locus failures. Correlated failures from shared chromosomal fragility or clonal population dynamics are not modelled and are left for future work.

5. System Architecture

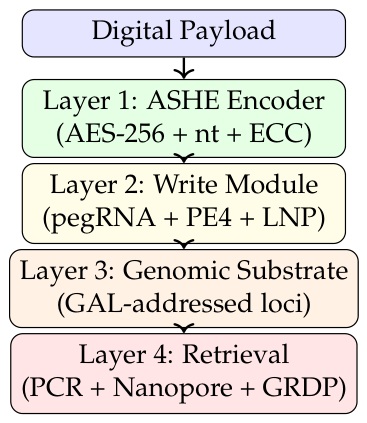
Figure 1 illustrates ASHE, GAL, and GRDP within the full LISS pipeline. Figure 2 details the four-layer architecture.
Layer 1 (ASHE Encoder) maps the encrypted digital payload to genomic sequences, partitions into GAL-indexed chunks with ( C 1 ) ( C 4 ) constraint enforcement, and appends ρ = 0.25 parity blocks.
Layer 2 (Write Module) synthesises pegRNAs for PE4 (prime editor with spacer nick and MLH1dn co-expression) and packages them with LNP carrier for ex vivo delivery. PE4 with MLH1dn achieves up to 71% efficiency at validated loci [18], substantially improving on early PE2 benchmarks.
Layer 3 (Genomic Substrate) is a cryopreserved population of edited somatic cells. Data is distributed via GRDP across multiple GAL-addressed loci. Endogenous repair (MMR, BER, NER) provides a secondary ECC layer at no computational cost.
Layer 4 (Retrieval) uses GAL barcode-specific primers for PCR amplification, followed by Oxford Nanopore R10.4.1 duplex sequencing and GRDP-aware reconstruction. In duplex mode, Nanopore Q20+ achieves modal per-base accuracy 99.0 % [30], making sequencing error a minor contributor to the overall error budget.

6. Write Mechanisms

Prime editing [17] is the recommended write mechanism: PE4 with MLH1dn co-expression achieves up to 71% efficiency at endogenous loci [18], avoiding double-strand breaks (DSBs) and reducing toxicity. pegRNA-directed reverse transcription achieves < 5 % error rate for edits 40 nt per site. Cas9+HDR and base editing are retained for specific sub-tasks (long inserts and single-base overwrite) [16,19].
Table 7. Write Mechanism Comparison
Mechanism Effic. Err. Rate DSB? Max Ins.
Cas9 + HDR 1–5% 10–30% Yes > 1  kb
Base editing 20–70% < 2 % No 1 nt
PE2 10–50% 1–5% No 40 nt
PE4+MLH1dn 30–71% < 3 % No 40 nt
Cas12a+HDR 5–20% 10–25% Yes > 1  kb

7. Simulation-Based Experimental Evaluation

7.1. Simulation Scope and Channel Model

Simulations were implemented in Python 3.12 with NumPy 1.26. The channel model simulates: (1) random binary payload generation; (2) direct 2-bit-per-nucleotide encoding (A→00, C→01, G→10, T→11); (3) stochastic error injection modelling: CRISPR PE4 insertion errors ( p i = 0.02 ), deletion errors ( p d = 0.02 ), and substitution errors ( p s = 0.01 ), plus Nanopore Q20+ sequencing noise ( p s , seq = 0.01 ); (4) parity-based recovery check with ρ = 0.25 ; (5) per-trial recovery rate and BER measurement. All Monte Carlo trials used n = 3 , 000 per configuration with fixed per-configuration random seeds for reproducibility.
Scope note. This simulation evaluates the error channel and parity-recovery logic using a direct 2-bit-per-nucleotide mapping. It does not implement the full ASHE scoring pipeline (which requires wet-lab locus annotations, bisulfite sequencing data, and Cas-OFFinder predictions), GAL barcode addressing (whose O ( 1 ) access overhead is assessed separately in Section 4.2), or GRDP multi-locus placement (evaluated analytically in Section 4.3 and Table 6). Reported recovery rates therefore reflect a simplified channel upper bound, not predictions of full ASHE pipeline or wet-lab performance. The ASHE constraint enforcement (C1)–(C4) would reduce the feasible encoding space relative to the unconstrained 2-bit map, potentially lowering effective η and thus recovery margin; the full-pipeline evaluation is deferred to Stage 1 experimental work.

7.2. Recovery Rate and BER

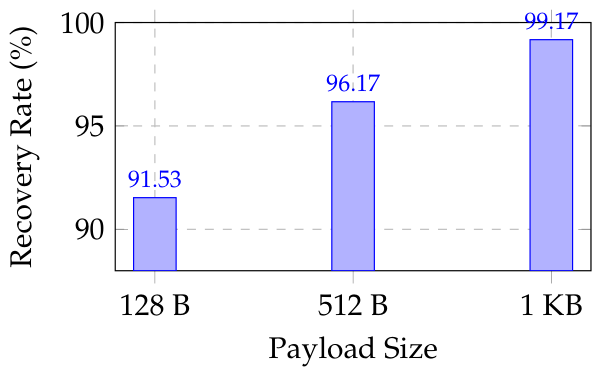
The raw BER of 41–47% reflects the pre-ECC combined-error channel. After parity-based ECC correction, recovery rates improve monotonically from 91.53 % to 99.17 % as payload size increases. Two compounding effects drive this improvement. First, the parity budget grows linearly with payload length; for fixed error rate ϵ , the expected error count ϵ L grows slower than the parity budget ρ L / 2 , widening the correction margin. Second, by the central limit theorem, the per-trial recovery decision concentrates more tightly around its mean at larger L, reducing variance. These effects are artifacts of the i.i.d. error model; real biological channels with positional error correlations may not exhibit the same monotonic trend (Section 7.4).
Table 8. Monte Carlo Simulation Results ( n = 3 , 000 trials, ρ = 0.25 )
Payload Recovery Rate (95% CI) Raw BER ECC OH
128 B 91.53 ± 1.00 % 41.77% 25.0%
512 B 96.17 ± 0.69 % 45.69% 25.0%
1 KB 99.17 ± 0.33 % 46.73% 25.0%
Figure 3. Recovery rate vs. payload size after parity ECC ( ρ = 0.25 ). Results are upper-bound estimates for the simplified channel model (Section 7.4).
Preprints 234112 g003

7.3. Sensitivity Analysis

I varied insertion rate, deletion rate, and ECC redundancy in ± 50 % steps around the baseline to identify dominant error drivers (128 B payload, n = 1 , 000 trials each).
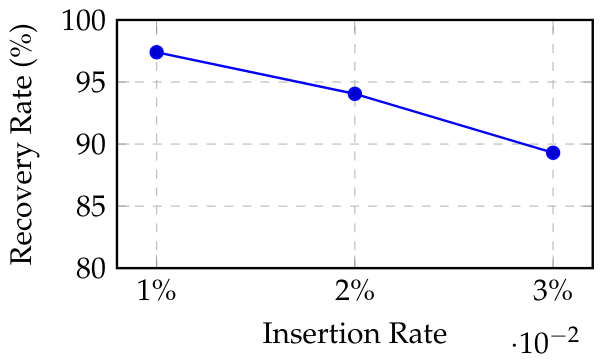
Figure 4. Sensitivity to CRISPR insertion error rate (128 B payload, n = 1 , 000 ).
Preprints 234112 g004
Insertion rate is the most sensitive parameter: a 50% rate increase ( 1 % 3 % ) reduces recovery by 8 percentage points. Varying redundancy from 0.15 to 0.35 changes recovery by only 4 points, suggesting write-mechanism improvement has higher leverage than ECC tuning at the current error profile.

7.4. Simulation Limitations

Known limitations of the Monte Carlo model:
  • No ASHE scoring. Direct 2-bit encoding, not the full multi-objective ASHE pipeline; (C1)–(C4) are not enforced. ASHE constraint satisfaction reduces the feasible nucleotide search space and may lower effective η relative to the unconstrained baseline shown here.
  • No GAL addressing. Barcode overhead and primer-specificity are not modelled; all positions treated as equivalent.
  • No GRDP placement. Single-path only; GRDP evaluated analytically in Table 6.
  • No cell population dynamics. Mosaicism, clonal expansion, and epigenetic silencing are absent from the channel model.
  • i.i.d. errors. Real CRISPR errors exhibit positional bias and sequence-context dependence not captured here.
  • No indel-aware decoding. Insertions and deletions shift reading frames; the model treats all errors as bit flips for the purpose of parity checking, overestimating parity-ECC effectiveness for indels.
Reported recovery rates are upper-bound estimates for a simplified channel, not predictions of wet-lab performance.

8. Retrieval System

8.1. PCR-Based Random Access

Each inserted chunk is flanked by unique 16-nt GAL barcodes drawn from a codebook with d H 4 . Retrieval of any specific file requires only the two corresponding barcode-specific primers, amplifying exclusively the target loci. This achieves O ( 1 ) random-access overhead independent of total stored data volume.

8.2. Sequencing Platform Comparison

Illumina NovaSeq (error rate 0.1 % , read length 150–300 bp) is preferred for high-accuracy bulk retrieval. Oxford Nanopore R10.4.1 duplex (modal accuracy 99.0 % , read length up to 1 Mbp) is preferred for single-molecule, point-of-access retrieval without centralised infrastructure [30]. The long-read advantage of Nanopore is particularly relevant for retrieving contiguous payloads inserted across a > 500 bp window, eliminating the assembly challenge inherent to short-read approaches. End-to-end retrieval latency is estimated at 6–24 hours, placing this firmly in the cold-archive tier.

8.3. In-Place Modification

Observation 1 establishes update-cost dominance. Single-nucleotide changes use base editors (CBE for C→T, ABE for A→G); segment-level rewrites use PE4 re-targeting with a new pegRNA; full-block deletion uses paired gRNA excision [16]. Each operation takes 48–96 hours and carries immune re-stimulation risk for in vivo targets.

9. Security and Threat Model

I define five threat categories with quantified risk scores R = P × I (probability P [ 0 , 1 ] , impact I [ 0 , 1 ] ), summarised in Table 9.
Mitigation pipeline.
Data AES - 256 Ciphertext ECC Protected ASHE DNA seq . PE 4 Genome
T1 is mitigated by AES-256 pre-encoding: sequencing the genome yields only ciphertext without the key. T5 (highest R = 0.56 ) is mitigated by using prime editing (avoids repeated Cas9 protein exposure), limiting write cycles, and monitoring T-cell response against Cas9 epitopes [23]. T6 (epigenetic silencing) is addressed by ASHE’s E ( ) criterion, which preferentially selects constitutively open chromatin loci, and by flanking insulator elements (CTCF-binding sequences) that resist methylation spread.

10. Ethical Analysis and Governance Framework

10.1. Quantified Risk Matrix

Regulatory rejection ( R = 0.56 ) and privacy/covert embedding ( R = 0.40 ) are the highest-scoring ethical risks. This reframes the primary barrier as institutional, not solely technical.
Table 10. Ethical Risk Matrix
Risk P I Score
Off-target oncogenic edits 0.30 0.90 0.27
Germline transmission 0.05 1.00 0.05
Privacy / covert embedding 0.50 0.80 0.40
Regulatory rejection 0.80 0.70 0.56
Immune toxicity 0.70 0.70 0.49
Epigenetic silencing 0.50 0.50 0.25

10.2. Regulatory Pathways

In the United States, any ex vivo somatic cell manipulation returned to a human subject requires an Investigational New Drug (IND) application to the FDA under 21 CFR 312 and classification as a Human Cells, Tissues, and Cellular and Tissue-Based Products (HCT/P) under 21 CFR 1271. In the European Union, genomic editing of somatic cells for non-therapeutic purposes would be classified as an Advanced Therapy Medicinal Product (ATMP) under EU Regulation 1394/2007, requiring European Medicines Agency (EMA) approval. No regulatory pathway currently exists for non-therapeutic human genome modification for storage purposes; this is a de novo regulatory design problem requiring international coordination [24].

10.3. Five-Tier Governance Framework

I propose a formal progression gate structure with regulatory anchors:
L1
Human cell lines only (HEK293T, iPSC): No human subjects; BSL-2; IRB exempt.
L2
Ex vivo primary human cells (consenting adult donor, cells not returned): IRB approval under 45 CFR 46.
L3
Ex vivo with reinfusion: FDA IND under 21 CFR 312; equivalent to Phase 0 gene therapy trial; safety monitoring under [21] precedent.
L4
In vivo non-human primate: IACUC approval; full biodistribution and immunogenicity safety profile required.
L5
In vivo human: Prohibited until dedicated international regulatory framework established; analogous to the moratorium on heritable germline editing recommended by the 2020 International Commission on Clinical Use of Human Germline Genome Editing [24].
Germline modification is categorically excluded at all levels, consistent with WHO Advisory Committee guidance [24]. Any system above L2 must implement informed-consent data-ownership protocols with guaranteed deletion pathways.

11. Open Challenges and Fundamental Limits

11.1. Fault Taxonomy

1.
Prime editing efficiency ceiling: Even PE4 with MLH1dn achieves at most 71 % at optimised loci [18]; genome-wide average is substantially lower. This limits initial f 0 and constrains the clonal fraction model.
2.
Mosaicism: Only a fraction of cells carry the complete payload post-editing; GRDP mitigates but does not eliminate this, and low f 0 ( < 0.70 ) degrades long-term Φ ( t ) below usable thresholds.
3.
Off-target genotoxicity: High-fidelity Cas9 variants (eSpCas9, HiFi-Cas9) achieve 10 6 off-target indel rates [22]; sustained reductions toward 10 8 are needed for clinical-equivalent safety margins.
4.
Immune response: T5 ( R = 0.56 ) is the highest ongoing biological risk. Pre-existing T-cell and B-cell immunity against S. pyogenes Cas9 has been found in > 79 % of healthy human donors [23]. This necessitates orthologous Cas variants (e.g., SaCas9, CjCas9) or fully human CRISPR-equivalent base-editing systems for human in vivo deployment.
5.
Epigenetic silencing: CpG methylation can silence inserted sequences within weeks in cell culture. CTCF-flanked insulator elements and hypomethylated locus selection via ASHE’s E ( ) criterion partially mitigate this risk.
6.
Regulatory absence: No jurisdiction currently regulates non-therapeutic human genome modification for storage. Estimated regulatory framework development lag: 5–10 years.
7.
Hayflick limit: Dividing somatic cells exhaust replicative capacity after 40 –60 population doublings. Post-mitotic cell targets (neurons, cardiac myocytes) extend the archival window but complicate delivery.

11.2. Safe Harbor Scarcity

Experimentally validated human safe-harbor loci number fewer than ten [10,11]. At 1,000 bp per insertion, total validated capacity is 10 KB. Reaching MB-scale requires computational safe-harbor discovery: candidate loci must satisfy (C1)–(C4), lie > 50 kb from oncogenes, exhibit constitutively open chromatin (ENCODE cCRE H3K27ac marks), and show no expression quantitative trait locus (eQTL) effects. This is a tractable but unsolved problem in computational genomics.

11.3. Archival Positioning

Human-genomic storage is categorically unsuitable for any application requiring random access at low latency or frequent updates. The correct comparison class is ultra-long-duration archival storage (glacial tape at $ 0.0001 /MB, synthetic DNA archives [5,14] at $ 1 , 000 + /MB). Human genomic storage is cost-competitive only for datasets where the combination of self-replication, biological repair, and zero at-rest energy confers durable economic advantages over 50+ year horizons for very small ( < 1 MB), very high-value payloads.

12. Cost Analysis

Human-genomic write cost is dominated by prime editing reagents, LNP formulation, and ex vivo cell handling. Read cost via Nanopore is $ 10 –50/MB, comparable to synthetic DNA readout. Current costs make genomic storage impractical for general use but potentially cost-competitive for ultra-long-duration archival of very small, high-value datasets where the self-replication and zero at-rest cost properties provide long-term economic advantages.
Table 11. Estimated Storage Cost Comparison
Medium Write/MB Read/MB Power
SSD (NVMe) $0.00001 $0.000001 1  W
Tape $0.0001 $0.001 0 W
Synthetic DNA $1,000+ $10–50 0 W
Human Genomic $500–2k $10–50 0 W
Human genomic write cost ($500–2k/MB) is estimated from published component costs: SpCas9 protein ~$50–200, LNP formulation ~$100–400, pegRNA synthesis ~$200–800, ex vivo cell handling and quality control ~$200–600, and sequencing verification ~$50–100, totalling ~$600–2,100 per 1 MB-equivalent payload at a single-locus batch scale. These figures are order-of-magnitude estimates and will vary substantially with cell type, editing protocol, and institutional pricing; they should be interpreted as directional rather than precise.

13. Research Roadmap

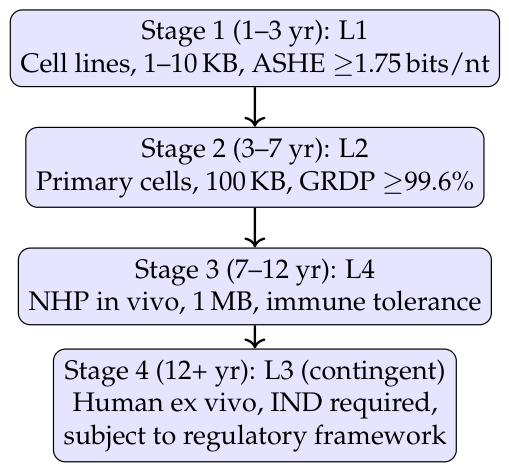
Stage 1 benchmarks: encoding 1.75 bits/nt with ASHE in HEK293T; write efficiency 30 % (PE4+MLH1dn at AAVS1); retrieval accuracy 95 % after ECC; off-target rate 10 5 /guide; full f 0 characterisation. Stage 2 benchmarks: 100 KB payload in primary human fibroblasts; GRDP 2-parity recovery 99.6 % ; 12-month stability 90 % ; clonal fraction f ( 12 mo ) 0.70 ; epigenetic stability confirmed by ATAC-seq.
Figure 5. Staged research roadmap with governance gates (Lx per Section 10). Stage 4 is a hypothetical future direction contingent on successful Stage 3 outcomes and establishment of an appropriate regulatory framework; it is not a commitment or prediction.
Preprints 234112 g005

14. Reproducibility Statement

All Monte Carlo simulations were implemented in Python 3.12 using NumPy 1.26 with fixed per-configuration random seeds. The simulation script, configuration parameters, and post-processing code will be made publicly available upon publication at the author’s repository. Capacity, drift, and reliability calculations are closed-form and fully reproducible from the equations in Section 3 and Section 4. Simulation runs on commodity hardware ( 4 GB RAM) in < 5 minutes per configuration.

15. Conclusion

This paper has introduced Living Information Storage Systems (LISS), a formal framework identifying self-replication, biological DNA repair, and genome-scale density as the three properties that categorically distinguish living in vivo storage from synthetic DNA and bacterial systems. Within this framework, it has presented what is, to the author’s knowledge, among the first quantitative, end-to-end analyses of human somatic genomic storage.
Key theoretical results: Theorem 1 establishes C Shannon 1.943 bits/nt at ϵ s = 0.01 , and ASHE’s 1.75 bits/nt target achieves 90.1% of this bound. GRDP is recast as an MDS code with Theorem 2 providing a proven minimum distance guarantee; dual-parity GRDP ( 5 , 3 ) achieves P GRDP = 99.65 % , while single-parity GRDP ( 4 , 3 ) achieves 93.7 % . The stochastic Gompertz clonal model reveals that f 0 0.70 is a prerequisite for viability beyond 20 years, motivating use of PE4 with MLH1dn inhibition. Monte Carlo simulation ( 3 , 000 trials) gives 91.53 % 99.17 % post-ECC recovery on a simplified channel model. The drift model projects 77.9 % nucleotide-level integrity at 50 years. Current experimentally achievable capacity is limited to 10 KB by safe-harbor scarcity; MB-scale projections are contingent on computational locus discovery.
Four load-bearing unsolved constraints remain: (1) prime editing efficiency ceiling ( 71 % at best validated loci); (2) immune response to repeated CRISPR delivery ( R = 0.56 , necessitating orthologous Cas variants or human-protein alternatives); (3) safe-harbor locus scarcity ( < 10 validated loci, capacity ceiling 10 KB without bioinformatic expansion); and (4) absence of a dedicated regulatory framework (5–10 year development lag). Resolving these requires close integration of molecular biology, computational genomics, bioethics, and regulatory science. The staged governance framework and quantitative Stage 1 benchmarks proposed here provide a concrete, technically grounded path forward.

References

  1. IDC. DataSphere: The Global DataSphere Forecast. International Data Corporation, Doc. #US46410421, 2021.
  2. Heckel, R.; Mikutis, G.; Grass, R. N. A Characterization of the DNA Data Storage Channel. Sci. Rep. 2019, vol. 9, 9663. [Google Scholar] [CrossRef] [PubMed]
  3. Church, G. M.; Gao, Y.; Kosuri, S. Next-Generation Digital Information Storage in DNA. Science 2012, vol. 337(no. 6102), 1628. [Google Scholar] [CrossRef] [PubMed]
  4. Goldman, N.; et al. , Towards Practical, High-Capacity, Low-Maintenance Information Storage in Synthesized DNA. Nature 2013, vol. 494, 77–80. [Google Scholar] [CrossRef] [PubMed]
  5. Organick, L.; et al. , Random Access in Large-Scale DNA Data Storage. Nat. Biotechnol. 2018, vol. 36, 242–248. [Google Scholar] [CrossRef] [PubMed]
  6. Shipman, S. L.; Nivala, J.; Macklis, J. D.; Church, G. M. CRISPR-Cas Encoding of a Digital Movie into the Genomes of a Population of Living Bacteria. Nature 2017, vol. 547, 345–349. [Google Scholar] [CrossRef] [PubMed]
  7. Yim, S. S.; et al. Robust Direct Digital-to-Biological Data Storage in Living Cells. Nat. Chem. Biol. 2021, vol. 17, 246–253. [Google Scholar] [CrossRef] [PubMed]
  8. Zhang, J.; Hou, C.; Liu, C. CRISPR-Powered Quantitative Keyword Search Engine in DNA Data Storage. Nat. Commun. 2024, vol. 15, 2376. [Google Scholar] [CrossRef] [PubMed]
  9. ENCODE Project Consortium. Expanded Encyclopaedias of DNA Elements in the Human and Mouse Genomes. Nature 2020, vol. 583, 699–710. [Google Scholar] [CrossRef] [PubMed]
  10. Sadelain, M.; Papapetrou, E. P.; Bushman, F. D. Safe Harbours for the Integration of New DNA in the Human Genome. Nat. Rev. Cancer 2012, vol. 12, 51–58. [Google Scholar] [CrossRef] [PubMed]
  11. Papapetrou, E. P.; Schambach, A. Gene Insertion into Genomic Safe Harbors for Human Gene Therapy. Mol. Ther. 2016, vol. 24(no. 4), 678–684. [Google Scholar] [CrossRef] [PubMed]
  12. Grass, R. N.; et al. Robust Chemical Preservation of Digital Information on DNA in Silica with Error-Correcting Codes. Angew. Chem. Int. Ed. 2015, vol. 54, 2552–2555. [Google Scholar] [CrossRef] [PubMed]
  13. Hagelberg, E.; Hofreiter, M.; Keyser, C. Ancient DNA: the First Three Decades. Philos. Trans. R. Soc. B 2015, vol. 370, 20130371. [Google Scholar] [CrossRef] [PubMed]
  14. Erlich, Y.; Zielinski, D. DNA Fountain Enables a Robust and Efficient Storage Architecture. Science 2017, vol. 355, 950–954. [Google Scholar] [CrossRef] [PubMed]
  15. Anavy, L.; et al. Data Storage in DNA with Fewer Synthesis Cycles Using Composite DNA Letters. Nat. Biotechnol. 2019, vol. 37, 1229–1236. [Google Scholar] [CrossRef] [PubMed]
  16. Cong, L.; et al. , Multiplex Genome Engineering Using CRISPR/Cas Systems. Science 2013, vol. 339, 819–823. [Google Scholar] [CrossRef] [PubMed]
  17. Anzalone, A. V.; et al. Search-and-Replace Genome Editing Without Double-Strand Breaks or Donor DNA. Nature 2019, vol. 576, 149–157. [Google Scholar] [CrossRef] [PubMed]
  18. Chen, P. J.; et al. , Enhanced Prime Editing Systems by Manipulating Cellular Determinants of Editing Outcomes. Cell 2021, vol. 184(no. 22), 5635–5652. [Google Scholar] [CrossRef] [PubMed]
  19. Komor, A. C.; et al. Programmable Editing of a Target Base in Genomic DNA Without Double-Stranded DNA Cleavage. Nature 2016, vol. 533, 420–424. [Google Scholar] [CrossRef] [PubMed]
  20. Finn, J. D.; et al. A Single Administration of CRISPR/Cas9 Lipid Nanoparticles Achieves Robust and Persistent In Vivo Genome Editing. Cell Rep. 2018, vol. 22(no. 9), 2227–2235. [Google Scholar] [CrossRef] [PubMed]
  21. Frangoul, H.; et al. , CRISPR-Cas9 Gene Editing for Sickle Cell Disease and β-Thalassemia. N. Engl. J. Med. 2021, vol. 384, 252–260. [Google Scholar] [CrossRef] [PubMed]
  22. Slaymaker, I. M.; et al. Rationally Engineered Cas9 Nucleases with Improved Specificity. Science 2016, vol. 351, 84–88. [Google Scholar] [CrossRef] [PubMed]
  23. Charlesworth, C. T.; et al. Identification of Preexisting Adaptive Immunity to Cas9 Proteins in Humans. Nat. Med. 2019, vol. 25, 249–254. [Google Scholar] [CrossRef] [PubMed]
  24. Cyranoski, D. The CRISPR-Baby Scandal: What’s Next for Human Gene Editing. Nature 2019, vol. 566, 440–442. [Google Scholar] [CrossRef] [PubMed]
  25. Alexandrov, L. B.; et al. Signatures of Mutational Processes in Human Cancer. Nature 2013, vol. 500, 415–421. [Google Scholar] [CrossRef] [PubMed]
  26. Nguyen, B. V.; et al. Recording Gene Expression Order in DNA by CRISPR Addition of Retron Barcodes. Nature 2021, vol. 590, 92–97. [Google Scholar] [CrossRef]
  27. Cristofalo, V. J.; et al. , Replicative Senescence: A Critical Review. Mech. Ageing Dev. 2004, vol. 125(no. 10–11), 827–848. [Google Scholar] [CrossRef] [PubMed]
  28. SantaLucia, J., Jr. A Unified View of Polymer, Dumbbell, and Oligonucleotide DNA Nearest-Neighbor Thermodynamics. Proc. Natl. Acad. Sci. 1998, vol. 95(no. 4), 1460–1465. [Google Scholar] [CrossRef] [PubMed]
  29. Mitzenmacher, M. A Survey of Results for Deletion Channels and Related Synchronization Channels. Probab. Surv. 2009, vol. 6, 1–33. [Google Scholar] [CrossRef]
  30. Oxford Nanopore Technologies. “Nanopore Duplex Sequencing with Q20+ Chemistry (R10.4.1),” Technical Note, Oxford Nanopore Technologies Ltd. 2023. Available online: https://nanoporetech.com.
  31. Cover, T. M.; Thomas, J. A. Elements of Information Theory, 2nd ed.; Wiley-Interscience: Hoboken, NJ, 2006. [Google Scholar]
  32. Gompertz, B. On the Nature of the Function Expressive of the Law of Human Mortality, and on a New Mode of Determining the Value of Life Contingencies. Philos. Trans. R. Soc. Lond. vol. 115, 513–583, 1825. [CrossRef]
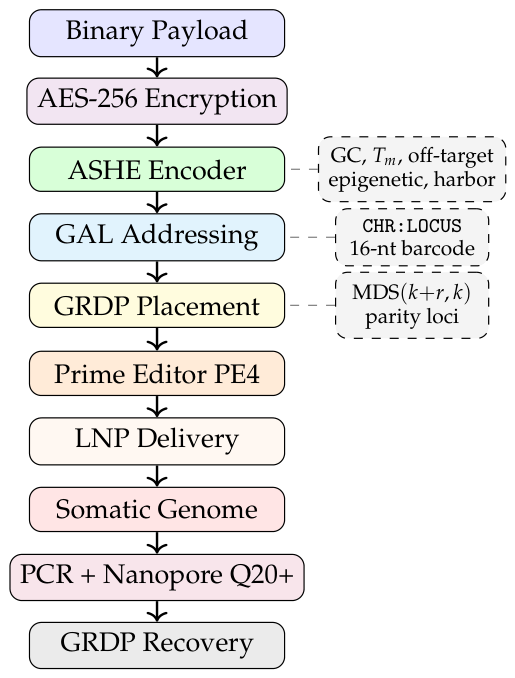
Figure 1. LISS end-to-end workflow with AES-256 pre-encryption, ASHE, GAL, GRDP, PE4 prime editing, LNP delivery, and Nanopore Q20+ retrieval.
Preprints 234112 g001
Figure 2. Four-layer LISS architecture for human-genomic storage.
Preprints 234112 g002
Table 1. Human vs. Synthetic vs. Bacterial DNA Storage
Feature Synthetic Bacterial Human (LISS)
Self-replication
DNA repair Partial Full MMR/BER/NER
Genome capacity N/A 4.6  Mb 6.4  Gb
Safe-harbor loci N/A None AAVS1, CCR5, ROSA26
Host lifespan 1000+ yr Hours–days Decades
Rewrite feasibility High Medium Low
Telomere constraint N/A None Yes ( 50 div.)
Ethical risk Low Medium Very High
Regulatory pathway None None IND/ATMP
Write cost ($/MB) $1k+ $100+ $500–2k
✗ = No, ✓ = Yes. MMR = mismatch repair, BER = base excision repair, NER = nucleotide excision repair. Write cost estimates for human genomic storage reflect current prime-editing reagent costs, LNP formulation, and ex vivo cell-handling overhead, and are subject to substantial change as the technology matures.
Table 5. Encoder Comparison on Sequence-Level Metrics
Encoder η GC ctrl. Homopoly. Off-target Locus score
Goldman [4] 1.58 Partial
Grass RS [12] 1.40
DNA Fountain [14] 1.98 Partial
ASHE (this work) 1.75
✓ = enforced by design. ✗ = not addressed. GC ctrl. = GC balance constraint; Off-target = Cas9 off-target protospacer exclusion; Locus score = placement-aware scoring incorporating epigenetic and safe-harbor criteria. ASHE is the only encoder designed for in vivo insertion contexts.
Table 6. GRDP Analytical Recovery under Locus Failure
Config. n k Fails tolerated P GRDP
GRDP ( 4 , 3 ) single parity 4 3 1 93.7%
GRDP ( 5 , 3 ) dual parity 5 3 2 99.65%
GRDP ( 6 , 4 ) dual parity 6 4 2 99.12%
No redundancy ( r = 0 ) 3 3 0 60.9%
Computed with Pretrieve = 0.848 per locus. Assumes statistically independent locus failures; correlated failures from shared chromosomal fragility are not modelled.
Table 9. Quantified Threat Model
ID Threat P I R
T1 Unauthorized sequencing 0.60 0.70 0.42
T2 Malicious CRISPR rewrite 0.20 0.90 0.18
T3 Natural mutation drift 0.50 0.60 0.30
T4 Cell population loss 0.40 0.70 0.28
T5 Immune response (CRISPR) 0.70 0.80 0.56
T6 Epigenetic silencing 0.50 0.55 0.28
Disclaimer/Publisher’s Note: The statements, opinions and data contained in all publications are solely those of the individual author(s) and contributor(s) and not of MDPI and/or the editor(s). MDPI and/or the editor(s) disclaim responsibility for any injury to people or property resulting from any ideas, methods, instructions or products referred to in the content.
Copyright: This open access article is published under a Creative Commons CC BY 4.0 license, which permit the free download, distribution, and reuse, provided that the author and preprint are cited in any reuse.