

Submitted:
18 September 2026
Posted:
20 September 2026
You are already at the latest version
Abstract
To strengthen and toughen welded joints of marine steel, this study first optimized the welding process parameters. Subsequently the Fe-Mn-Si shape memory alloy (SMA) welding seam with stress-adaptive characteristics was fabricated based on phase transformation strengthening method. Then the mechanical properties of test materials were compared with those of conventional marine steel welded joints with YJ501-1 welding seam, and the former strengthening and toughening mechanism was investigated finally. The results demonstrate that under the optimal process parameters (welding current of 140 A, an arc voltage of 30 V, and a welding speed of 3 mm/s), the prepared Fe-18Mn-4Si-11Cr-6Ni SMA welding seam can effectively reduce the residual stress of the welded joint, while significantly improving its tensile strength, impact toughness and hardness. XRD characterization further reveals that the underlying strengthening mechanism is attributed to the residual stress induced γ↔ε martensitic transformation in the Fe-Mn-Si SMA welding seam.
Keywords:
marine steel welded joint
; process parameter optimization
; Fe-Mn-Si SMA welding seam
; mechanical properties
; strengthening and toughening mechanism
1. Introduction
In recent years, against the background of development and utilization of marine resources, the attention of marine equipment has attracted increasing. Marine steel has therefore become a key material, as its excellent corrosion resistance, low-temperature impact toughness, and processing performance can meet complex marine service requirements [1]. In the manufacturing of large marine steel structure, welding time and welding cost typically account for approximately 30%-40% of the total manufacturing time and 30%-50% of the total manufacturing cost, respectively.
In conclusion, welding parameters exert a direct and decisive influence on weld formation, weld quality, and joint strength. Optimizing these parameters can effectively improve joint reliability and the macroscopic weld morphology. However, residual stress is inevitably induced during welding, which can lead to welding deformation and further degrade the local fracture strength, fatigue performance, as well as the stiffness and load-bearing capacity of compression members. To address the aforementioned issues, the common methods include preheating before welding, post-weld heat treatment, aging treatment, and transformation strengthening. Previous studies on high-strength steel welded joints have demonstrated that post-weld heat treatment can effectively regulate residual stress distribution and improve mechanical performance [2].
Zhou [3] analyzed preheating of EH47 high-strength steel and reported that preheating can effectively reduce the residual stress of thick-plate butt welds; when the preheating temperature reaches 140 °C-160 °C, the maximum residual stress can be reduced by about 10% compared with the non-preheated condition at room temperature (25 °C). Alfredsson [4] applied tempering heat treatment to thin-walled tubular parts after welding and found that the residual-stress distribution inside the parts changed after tempering. Yuan [5] investigated tempering treatments at different temperatures for 700L low-carbon microalloyed high-strength steel and concluded that tempering can eliminate part of the residual stress and further improve mechanical properties while regulating residual stress. Sun et al. [6] measured the residual stress of hot-rolled low-carbon martensitic high-strength steel plates under different tempering processes by the blind-hole method and found that, during tempering at 500 °C and 550 °C, the residual stress in the steel plate became more uniform as tempering time increased. Zhang et al. [7] reported that post-weld heat treatment using solution treatment plus double aging can improve the toughness of IN690 joints with an IN718 interlayer. Zhou [8] produced Fe-17Mn-5Si-10Cr-5Ni by laser welding and showed experimentally that the welded joint of this alloy has a high bending-fatigue life at ε = 5%, indicating good bending-fatigue performance.
With respect to reducing residual stress, post-weld heat treatment is commonly implemented after weld formation, but the treatment temperature varies significantly for different materials systems, which consequently increases the overall process cost. Vibratory stress relief can mitigate the magnitude of welding residual stress, while it will not significantly modify the inherent internal microstructure or degrade the overall mechanical properties under conventional process parameters. The influence of welding residual stress on structural reliability and fatigue behavior has also been widely investigated in welded components [9]. Explosive stress relief treatment can partially eliminate welding residual stress, however, weldment with varying geometric dimensions and structural configurations require corresponding customized explosive charge dosages, which increases the process complexity. In addition, improper explosive dosage control may also pose potential safety hazards to on-site operators. Transformation strengthening improves the fatigue life and crack growth resistance by regulating the microstructure and phase transformation behavior, therefore it has great application prospects. Recent studies on Fe-Mn-Si shape memory alloy welded structures further confirmed the relationship between phase transformation behavior and enhanced mechanical properties [10]. Based on previous research, Fe-Mn-Si alloys possess the characteristic of stress-induced reversible motion of Shockley partial dislocations, which further triggers the forward and reverse γ(fcc) austenite ↔ ε(hcp) martensitic transformation [11].This phase transformation and its accompanying deformation can effectively relax welding residual stress, thereby significantly improving the mechanical properties of the welded joint. [12]
In summary, this study first optimized welding process parameters through single-factor and orthogonal experiments. Subsequently, the Fe-Mn-Si SMA welding seam was fabricated on marine steel. The mechanical properties and microstructure of the resulting welded joints were systematically compared with those generated using conventional J501 welding wire, and the strengthening and toughening mechanism of the Fe-Mn-Si SMA weld metal was clarified. The results provide a theoretical basis and technical reference for the development of high-strength and high-toughness welding joint.
2. Experimental Methods
AH36 high-strength steel was selected as the base metal. The prepared specimens had dimensions of 150 mm x 100 mm x 100 mm (length x width x height). The elemental composition and mass fraction of the base metal were measured, and the chemical composition fell within the specified range, as shown in Table 1.
Test was conducted by multilayer and multi-pass flux-cored wire welding, the processing procedure is shown in Figure 1.
Single-factor experiments were carried out to investigate the influences of welding current, arc voltage and welding speed on the macroscopic morphology, microstructure and tensile strength of the weld. For grain size measurement, the Set Scale function was adopted to calibrate the length unit uniformly by taking the scale bar length in the microstructure image as the known reference distance. Subsequently, the Measure function was used to delineate grain boundaries in different microstructure regions. After the grain boundary delineation was completed, the corresponding statistical data were exported to calculate the average grain size. Meanwhile, tensile tests were performed to characterize the mechanical properties of AH36 marine steel base metal and welded joints. According to Metallic materials — Tensile testing — Part 1: Method of test at room temperature (GB/T 228.1-2021), the base metal tensile specimens were machined. The transverse tensile specimens of the welded joints were sampled and machined perpendicular to the weld axis according to the standard Tensile Test Method for Welded Joints (GB/T 2652-2022), followed by room-temperature tensile testing to obtain the complete mechanical property parameters of the joints. The geometry and dimension of the tensile specimen are shown in Figure 2.
Based on the single-factor experimental results, the tensile strength of the welded joint was taken as the evaluation indicator, and an orthogonal experiment was adopted to optimize the welding process parameters. After the optimal combination of process parameters was determined, the weld zone was sampled by wire electrical discharge machining and processed into rectangular specimens with dimensions of 100 mm × 25 mm × 10 mm (length × width × thickness). The elemental distribution of Fe, Mn and Si in the weld zone was characterized by SEM-EDS. The Fe-Mn-Si shape memory alloy (SMA) welding seam was then subjected to macroscopic and microscopic examination in strict accordance with ISO 17639:2022. After tensile experiment, fracture morphology of the tensile specimens was characterized via scanning electron microscopy (SEM). The microhardness of the welded joint was tested in accordance with GB/T 27552-2021, and the impact test measures the energy absorbed when a specimen fractures and is used to evaluate impact resistance. [13]
To reveal the strengthening and toughening mechanism, the residual stress of the welded joint was strictly measured in accordance with GB/T 31310-2014, Metallic materials — Determination of residual stress — Hole-drilling strain-gauge method. The residual stress was tested along two directions, i.e., perpendicular to and parallel to the weld centerline, as illustrated in Figure 3. Meanwhile, the phase constituents of the weld specimens before and after solution treatment were analyzed via X-ray diffraction (XRD) with a 2θ scanning range of 40° to 120°, to collect the corresponding XRD patterns.
3. Results and Discussion
3.1. Single-Factor Tests
Based on the preliminary exploratory experiments, the selected welding process parameters for the single-factor experiments are listed in Table 2 below, and the corresponding macroscopic morphologies of the weld surfaces are shown in Figure 4.
It can be seen in the Figure 4, the macroscopic observations from the single-factor experiments indicated that, at a welding current of 110 A, the arc heat input was relatively insufficient, leading to shallow penetration depth, narrow weld bead, and uneven width on the weld surface, which eventually induced incomplete penetration defects. At 130 A, both the penetration depth and weld bead width increased, a uniform and dense fish-scale ripple morphology was formed on the weld surface. And the weld bead width became uniform and stable, and only slight spatter was observed. As the welding current further increased beyond this level, the penetration depth and weld width continued to rise, the weld bead became over-wide, and the amount of spatter also increased significantly. At the arc voltage of 24 V, a short arc length and a low wire melting rate were observed. These conditions produced a weld with shallow penetration, excessively high reinforcement, and insufficient base metal melting, culminating in incomplete fusion defects. As the arc voltage increased to 32 V, the weld width rose markedly while the weld reinforcement decreased correspondingly. At the welding speed of 2mm/s, the weld bead exhibited a full, smooth and uniform surface morphology, and the macroscopic cross-sectional profile was well-formed without any obvious welding defects. When the welding speed increased to 4 mm/s, the weld bead width was significantly narrowed, the weld reinforcement further decreased, the weld bead exhibited uneven width, and the originally clear fish-scale ripple morphology became blurred and discontinuous. As the welding speed further increased, both the weld bead width and penetration depth continued to decrease, the amount of welding spatter increased significantly, the fish-scale ripple morphology gradually became blurred and discontinuous, the surface flatness of the weld bead deteriorated, and the width deviation of the weld bead became increasingly prominent.
Microstructural characterization results reveal that the prior austenite grain size within the weld metal increases with the elevation of welding current and arc voltage, whereas increasing welding speed exerts the opposite effect on grain size. This is because a higher heat input raises the molten pool temperature, prolongs the post-weld cooling time, reduces the undercooling degree, and consequently promotes grain growth. In contrast, the welding speed is negatively correlated with the heat input; as the welding speed increases, the molten pool temperature decreases and the time during which the weld metal remains within the crystallization temperature range is shortened, thereby suppressing grain growth. The corresponding variation in grain size is illustrated in Figure 5.
Based on the single-factor experimental scheme, the obtained results demonstrate that the tensile strength of the welded joints first increases and then decreases with the increase of welding current and arc voltage, while the variation of welding speed shows a negligible effect on the tensile properties of the joints. The corresponding tensile strength curves of the tested welded joints are presented in Figure 6. Meanwhile, as the welding current and arc voltage increase within a reasonable range, the microstructure is homogenized and the prior austenite grain size is moderately refined to a certain extent, which increases the number of grain boundaries per unit volume and hinders dislocation motion, thereby improving the tensile strength of the welded joint. When the heat input (i.e., excessive welding current and arc voltage) is too high, or the welding speed is excessively low, the weld metal will stay at a high temperature for a long duration, leading to excessive grain growth and a consequent reduction in tensile strength.
3.2. Orthogonal Experiment
Based on the single-factor test results, the tensile strength of the welded joint was selected as the core evaluation indicator, and a three-factor three-level orthogonal experiment was designed to optimize the welding process parameters and determine the optimal parameter combination. After welding, the tensile strength of the joints obtained from the orthogonal experiment was tested using a universal tensile testing machine. The subsequent range analysis shows that the range values for welding current, arc voltage, and welding speed are R₁ = 28.785, R₂ = 20.458, and R₃ = 141.569, respectively. This result indicates that welding speed has the most significant influence on the tensile strength of the joint, followed by welding current and then arc voltage (i.e., welding speed > welding current > arc voltage). Consequently, the optimal welding process parameter combination is determined as A₃B₂C₃, which corresponds to a welding current of 140 A, an arc voltage of 30 V, and a welding speed of 180 mm/min.
Under the optimal welding parameters, the elemental composition of the Fe-Mn-Si shape memory alloy (SMA) weld seam was determined by spectrometry. The measured mass fractions of the key alloying elements are Mn: 18.61 wt.%, Si: 4.36 wt.%, Cr: 11.31 wt.%, and Ni: 5.78 wt.%. According to the known composition range of Fe-based SMAs in the literature (Mn: 15–20 wt.%, Si: 4–5.5 wt.%, Cr: 9–12 wt.%, and Ni: 5–6 wt.%), the measured composition falls well within the specified ranges
3.3. Results and Analysis of Welded Joint Characteristic
The commercial YJ501-1 is a typical titania-type flux-cored wire with excellent welding processability, and its elemental composition is close to that of the self-developed Fe-Mn-Si SMA weld metal, as listed in Table 3. Therefore, it was selected as the reference filler material for marine steel welding in this study.
3.3.1. Tensile Strength
Tensile specimens were subsequently cut from the weld zones of the Fe-Mn-Si SMA weld metal and the YJ501-1 weld metal, respectively. The tensile strength values of the welded joints were evaluated and compared. The Fe-Mn-Si SMA welded joint (A3) fractured in the base-metal region and exhibited a tensile strength of 585.12 MPa. In contrast, the YJ501-1 welded joint (A2) fractured in the middle of the weld and showed a tensile strength of 519.09 MPa, whereas the tensile strength of the base metal (A1) was 555.66 MPa. These results indicate that the metallurgical bonding of the Fe-Mn-Si SMA welded joint was superior to that of the YJ501-1 welded joint. This is mainly because stress-induced ε-martensitic transformation occurs in the Fe-Mn-Si SMA during tension, and the additional transformation strain accommodates the macroscopic deformation of the material; this stress-adaptive characteristic gives the material better performance [14].
The fracture morphology of the welded joint after tensile testing is shown in Figure 7. Compared with the commercial YJ501-1 weld seam specimen, the fracture surface of the Fe-Mn-Si SMA weld seam exhibits finer and more uniformly distributed equiaxed dimples [15]. Furthermore, backscattered electron (BSE) image analysis reveals the presence of bright white high-Z spherical particles located at the centers or bottoms of the dimples in the YJ501-1 specimen. Consequently, during the tensile deformation process, stress concentration tends to initiate at the interfaces between these hard inclusions and the softer metallic matrix [16]. When the local stress exceeds the interfacial bonding strength, the inclusions either debond from the matrix or undergo cracking themselves, forming microvoids in situ and thereby accelerating the fracture process. [17]
3.3.2. Microstructure
The microstructures of the experimental material (Fe-Mn-Si SMA weld seam) and the contrast material (YJ501-1 weld seam) are presented in Figure 8. It can be observed that the Fe-Mn-Si SMA weld metal is predominantly composed of martensite, along with a small amount of retained austenite and ferrite. The formation of this martensitic microstructure can be attributed to the welding-induced residual stress. During the welding process, residual stress is inevitably generated. Under the action of this stress, the crystal structure within the material undergoes distortion, altering the relative positions of atoms. This distortion promotes a stress-assisted shear transformation from the austenite phase to the martensite phase, ultimately leading to the formation of martensite.
The cross-sectional microstructure of the YJ501-1 weld metal consisted mainly of equiaxed ferrite, polygonal ferrite, and a small amount of pearlite [18]. ImageJ measurements showed that the grain size of the Fe-Mn-Si SMA weld metal was smaller than that of the YJ501-1 weld metal. This is because the Fe-Mn-Si SMA weld metal contains Mn, Si, Cr, and Ni, which may form more heterogeneous nucleation sites during welding and thereby refine the grains. Although the YJ501-1 weld metal contains Ti and Al, the alloying-element contents are low, and its grain-refining effect is less pronounced than that of the Fe-Mn-Si SMA weld metal.
3.3.3. Microhardness
To further analyze the mechanical properties of the welded joint, the hardness distributions of the experimental group and the control group are presented in Figure 9. Similar correlations between microstructure evolution, hardness variation, and residual stress distribution have also been reported in metallic welded joints [19]. It can be observed that the hardness differences among the fusion zone (FZ), base metal (BM), and heat-affected zone (HAZ) increase markedly, and a sharp hardness rise occurs at the weld metal-base metal interface. The Fe-Mn-Si SMA weld specimen exhibits a higher average hardness of 260 HV, while the YJ501-1 weld specimen shows a hardness of 220 HV. This difference is mainly attributed to the γ→ε martensitic transformation induced by welding residual stress in the Fe-Mn-Si SMA weld metal. Since martensite possesses inherently higher hardness, the average hardness of the corresponding weld region is significantly improved [20].
3.3.4. Impact Toughness
Through impact tests, the measured absorbed impact energy is 169.99 J for the Fe-Mn-Si SMA welded joint (A3), 125.87 J for the YJ501-1 welded joint (A2), and 131.42 J for the base metal (A1). The results indicate that the experiment materials exhibits superior impact toughness compared with the two control groups. This can be mainly attributed to the fact that deformation twinning and stress-induced martensitic transformation also act as critical plastic deformation mechanisms. The critical resolved shear stress for twinning follows an inverse relationship with grain size, making deformation twins more prone to nucleation in larger austenite grains. Although a larger grain size is generally detrimental to the impact toughness of metallic materials, deformation twins can be more readily activated in coarser austenite grains, which dynamically partition the original coarse grains and consequently refine the microstructure, thereby significantly improving the alloy toughness..
3.3.5. Residual Stress
Figure 10 presents the residual stress distributions of the AH36 marine steel welded joints with two different filler materials. For the conventional YJ501-1 welded joint, the peak longitudinal residual tensile stress reaches 427 MPa near the fusion line. In sharp contrast, the Fe-Mn-Si SMA welded joint exhibits a maximum longitudinal residual stress of only 189 MPa and a maximum transverse residual stress of 126 MPa, representing a reduction of 55.7% and 59.6% respectively compared with the reference joint. It confirms that the reversible phase transformation effect of the Fe-Mn-Si SMA weld seam can effectively suppress the generation of harmful residual tensile stress in marine steel welded structures. That is, the austenite-to-martensite transformation induced by residual stress relaxes the residual stress itself.
3.3.6. X-ray Diffraction
To further reveal the strengthening and toughening mechanism of the Fe-Mn-Si SMA weld seam, the present work systematically characterizes its phase composition before and after solution treatment via X-ray diffraction (XRD). The corresponding XRD patterns are presented in Figure 11(a) and (b).
It can be seen that before solution treatment, the Fe-Mn-Si SMA weld metal is composed of austenite and martensite phases. Since the martensitic transformation start temperature (Ms) of this alloy system is below 0 °C, the austenite-to-ε-martensite (γ-fcc → ε-hcp) transformation observed in the as-welded microstructure cannot be thermally activated, but is entirely driven by stress. This phase evolution phenomenon originates from the fact that the tensile stress induced by welding thermal contraction triggers partial transformation of the parent austenite in the Fe-Mn-Si SMA weld metal into martensite, consequently retaining a considerable fraction of martensite in the as-welded weld microstructure. In addition, once the heat-treatment temperature reaches the solution-treatment window, full recrystallization is initiated within the weld region, which effectively relaxes the accumulated welding residual stress.
4. Conclusions
(1) The single-factor test results showed that, as the welding current and arc voltage increased, the weld reinforcement enhanced and the grain structure gradually coarsened, whereas welding speed showed the opposite trend. When heat input increased within a certain range, the metallurgical bonding between the base metal and the weld metal improved, leading to higher tensile strength of the welded joint. Meanwhile the tensile fracture location was directly related to the welding process parameters. The optimal welding process parameters obtained by the orthogonal experiment were a welding current of 140 A, an arc voltage of 30 V, and a welding speed of 3 mm/s. Under this process, the tensile strength reached 585.12 MPa, which was higher than all tensile-strength values obtained in the preliminary experiments. Weld composition characterization via spectrometry yielded mass fractions of 18.61 wt.% Mn, 4.36 wt.% Si, 11.31 wt.% Cr and 5.78 wt.% Ni (balance Fe), satisfying the nominal composition requirement for Fe-based SMAs..
(2) The marine steel welded joint of Fe-Mn-Si SMA welding seam exhibits a Vickers hardness of 260 HV, 18% higher than that of JY501 welding seam. Its tensile strength is measured at 585.1 MPa, representing a 12.7% improvement relative to the 519.1 MPa of the reference joint, and the impact toughness is increased by 35% to 170 J. Notably, the residual stress of experimental materials in both the vertical and horizontal directions were markedly lower than those of the contrast materials. These results indicate that the SMA welding seam strengthened marine steel welded joint delivers far superior comprehensive mechanical properties.
(3) Comparative analysis of the weld microstructure demonstrates that the weld microstructure before solution treatment consisted of austenite and martensite, whereas only austenite remained after solution treatment. The experimental analysis indicates that release of residual stress and deformation coordination behavior in the process of stress-induced γ↔ε martensitic transformation of Fe-Mn-Si SMA welding seam are the main reasons for weld strengthening and toughthen.
References
- Kaya, Y.; Kahraman, N.; Durgutlu, A.; et al. Investigation of the Microstructural, Mechanical and Corrosion Properties of Grade A Ship Steel-Duplex Stainless Steel Composites Produced via Explosive Welding. Mater. Res. Express 2019, 6(10), 1065. [Google Scholar]
- Effects of PWHT on the Residual Stress and Microstructure of Bisalloy 80 Steel Welds. Metals 2022, 12(10), 1569. [CrossRef]
- Zhou, W. Numerical simulation of the effect of preheating on residual stress in EH47 high-strength-steel thick plates. Ship Ocean Eng. 2021, 50(06), 31–35, 40. [Google Scholar]
- Alfredsson, K.S.; Josefson, B.L. Harmonic Response of a Spot Welded Box Beam--Influence of Welding Residual Stresses and Deformations. Weld. World 1991, 30(9), 229–235. [Google Scholar]
- Yuan, F. Microstructural evolution during tempering of 700L steel and its effect on residual stress. Thesis, Wuhan University of Science and Technology, 2021.
- Sun, L.; Zhao, Z.Y.; Lin, W.; et al. Effect of tempering process on residual stress of hot-rolled low-carbon martensitic high-strength steel plate. Heat Treat. Met. 2014, 39(3), 45–48. [Google Scholar]
- Zhang, X.Y.; Han, K.; Lei, Y.C.; et al. Effects of post-weld heat treatment on microstructure and properties of Inconel 690 ultrasonic-assisted TIG joints. Transactions of the China Welding Institution.
- Zhou, C.Y. Study on laser welding properties of Fe-Mn-Si shape memory alloy. Thesis, Dalian: Dalian Maritime University, 2015.
- Ahmad, H.W.; Hwang, J.H.; Lee, J.H.; et al. Welding Residual Stress Analysis and Fatigue Strength Assessment of Multi-Pass Dissimilar Material Welded Joint between Alloy 617 and 12Cr Steel. Metals 2018, 8(1), 21. [Google Scholar] [CrossRef]
- Hong, K.; Ji, S.; Kim, D.; Bae, J. Mechanical and Fatigue Properties of Welded Fe-Mn-Si Shape Memory Alloys. Materials 2024, 17(17), 4304. [Google Scholar] [CrossRef] [PubMed]
- Zhao, Y.F.; Song, L.D.; Wang, H.Y.; et al. Effect of WC addition on wear resistance of laser additive-manufactured Fe-Mn-Si-Cr-Ni alloy. Trans. China Weld. Inst. 2025, 46(08), 1–10. [Google Scholar]
- Li, L.P.; Liu, Y.R.; Yang, M.H.; et al. Effect of post-weld heat treatment on microstructure and mechanical properties of Sanicro25/G115 dissimilar-steel joints. Heat Treat. Met. 2024, 49(1). [Google Scholar]
- Li, Y.; Xu, R.T.; Wang, K.X.; et al. Hybrid welding process using CO₂ gas-shielded welding and automatic submerged arc welding for a 400,000 t ore carrier. [PubMed]
- Sawaguchi, T.; Bujoreanu, L.; Kikuchi, T.; et al. Mechanism of reversible transformation-induced plasticity of Fe-Mn-Si shape memory alloys. Scr. Mater. 2008, 59(8). [Google Scholar] [CrossRef]
- Zhang, J.B. Process and mechanical properties of Fe-Mn-Si SMA weld metal produced by laser welding of EH36 steel. Thesis, Dalian Maritime University, 2022.
- Ju, H.; Lin, C.; Tian, Y.; et al. Mechanical Properties Study of Fe-Mn-Si Shape Memory Alloys Welding Seam Formed by Laser Welding with Filler Powder. Materials 2018, 11(8). [Google Scholar] [CrossRef] [PubMed]
- Kong, D.J.; Ye, C.D.; Guo, W. Tensile fracture behavior and fractography of X80 pipeline steel welded joints. J. Build. Mater. 2015, 18(01), 139–144. [Google Scholar]
- Li, J.X. Effect of stress concentration on mechanical behavior of Fe-Mn-Si shape memory alloys. Thesis, Dalian Maritime University, 2023.
- Study of Mechanical Properties, Microstructure, and Residual Stresses of AISI 304/304L Stainless Steel Submerged Arc Weld. Metals 2024, 14(3), 262. [CrossRef]
- Mei, N.B.; Chen, B.Q.; Tang, J.; et al. Low-temperature toughness of YCJ501-1 flux-cored wire. Hot Work. Technol. 2014, 43(7), 215–217. [Google Scholar]
Figure 1.
Schematic diagram of the welding process.
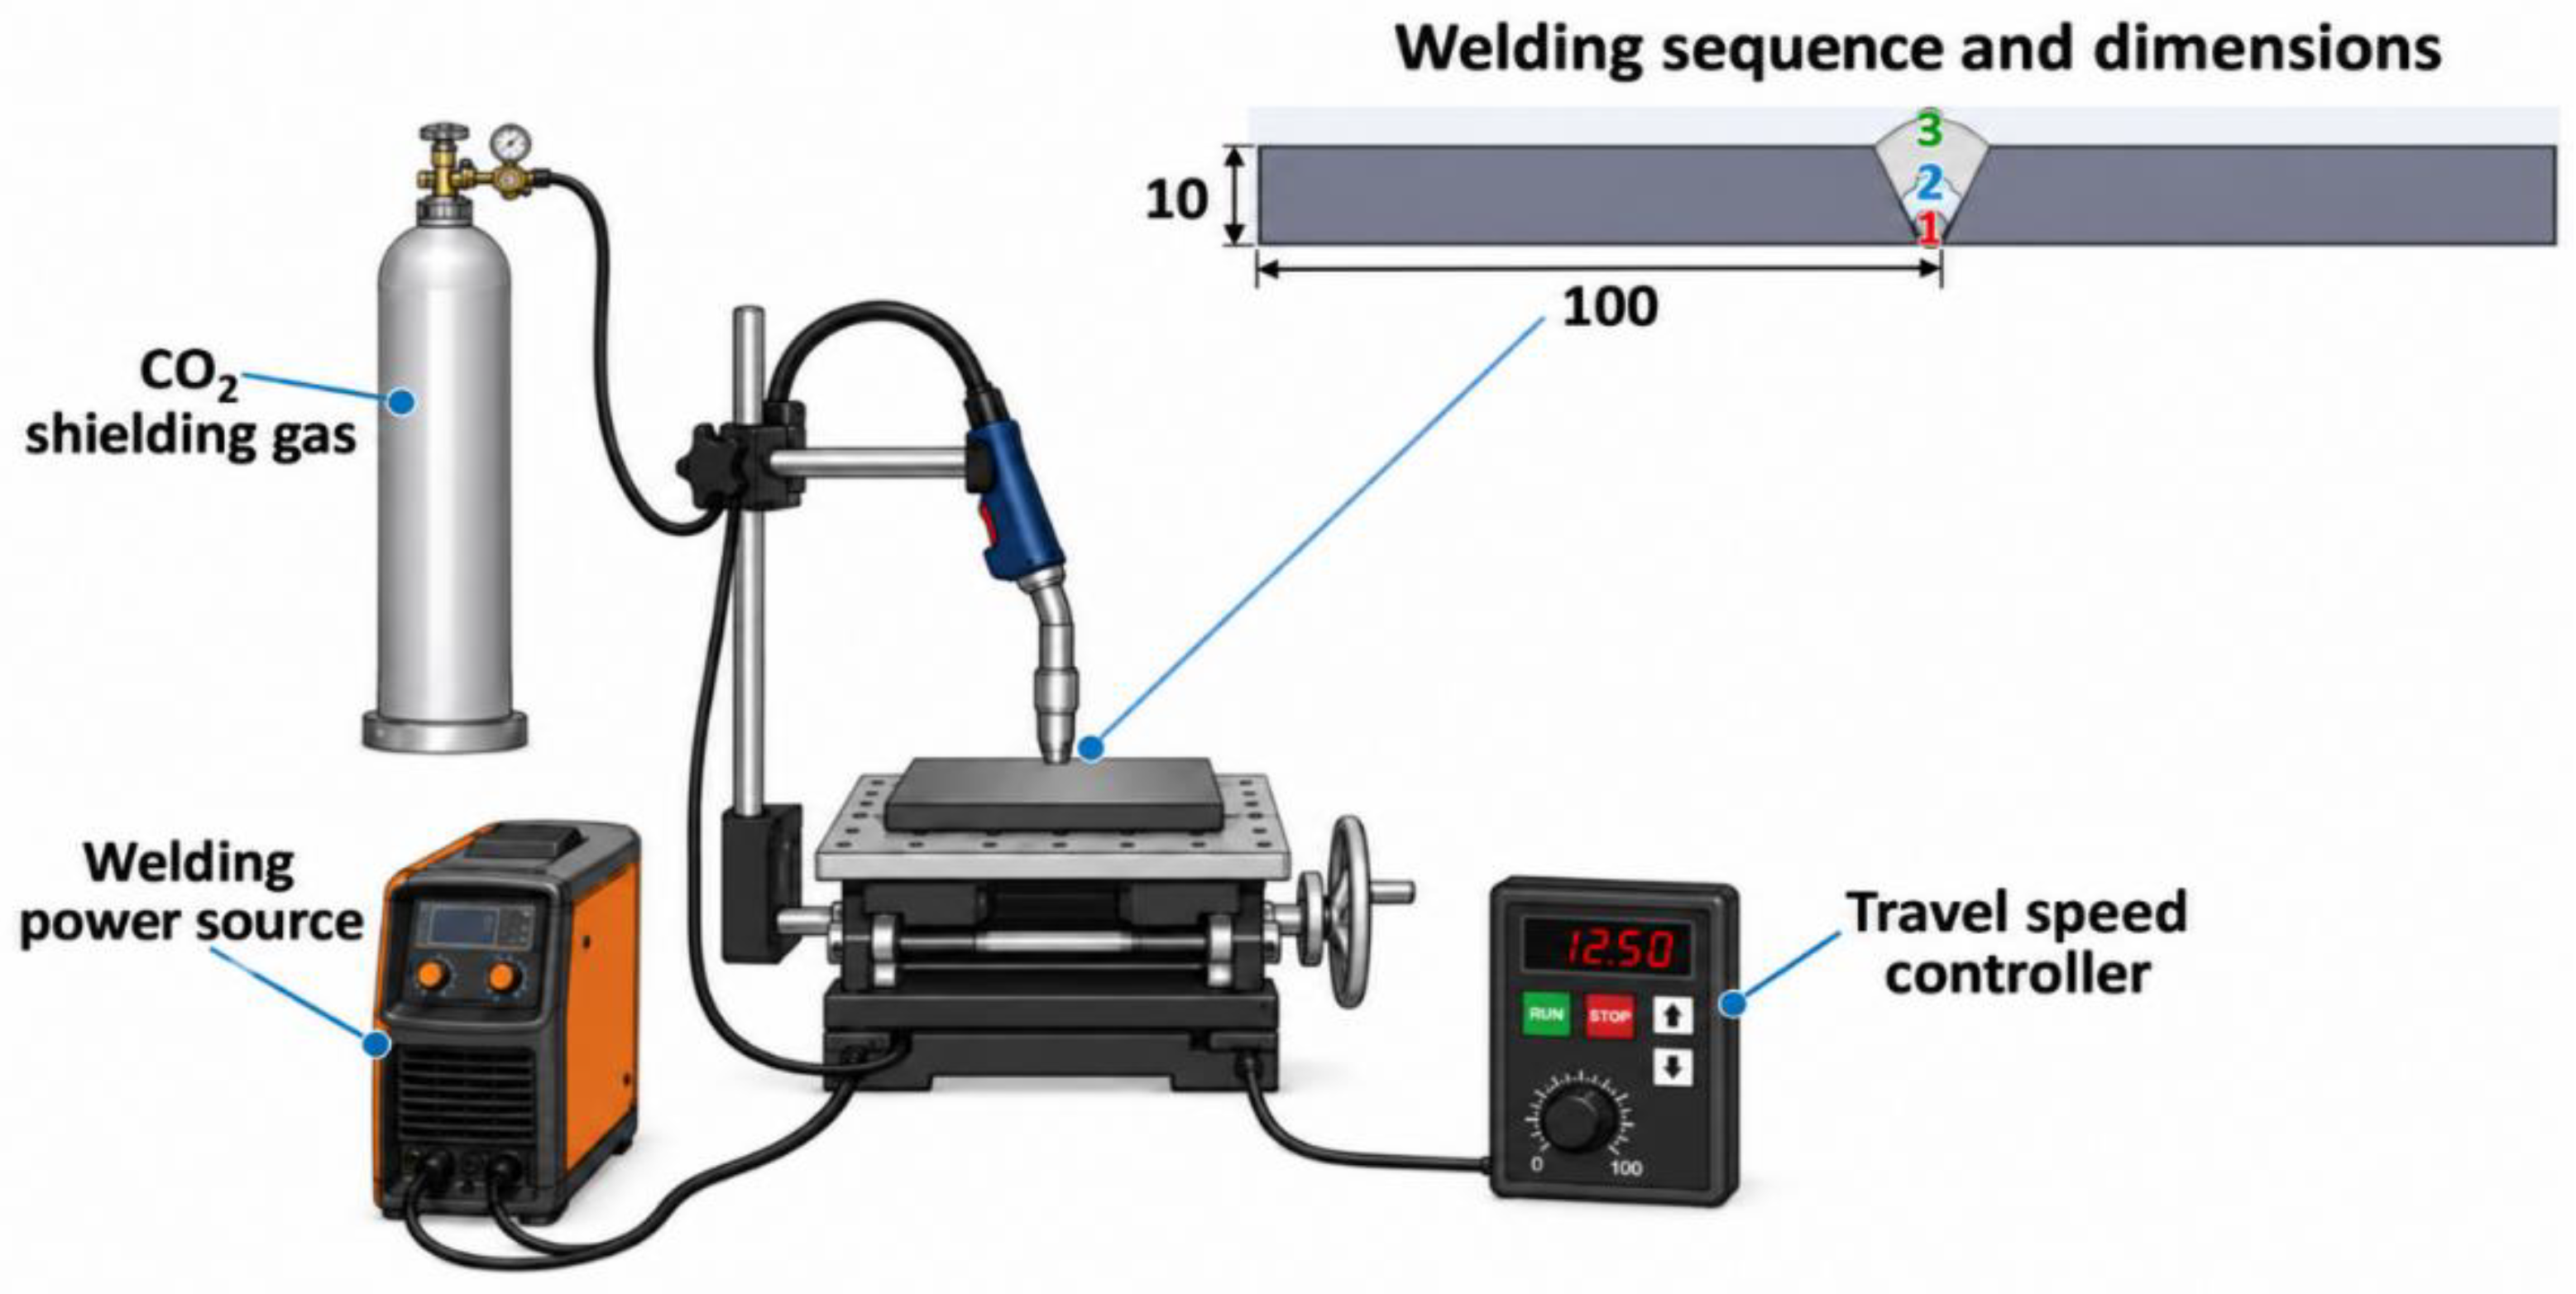
Figure 2.
Dimensions of the tensile specimen (unit: mm).
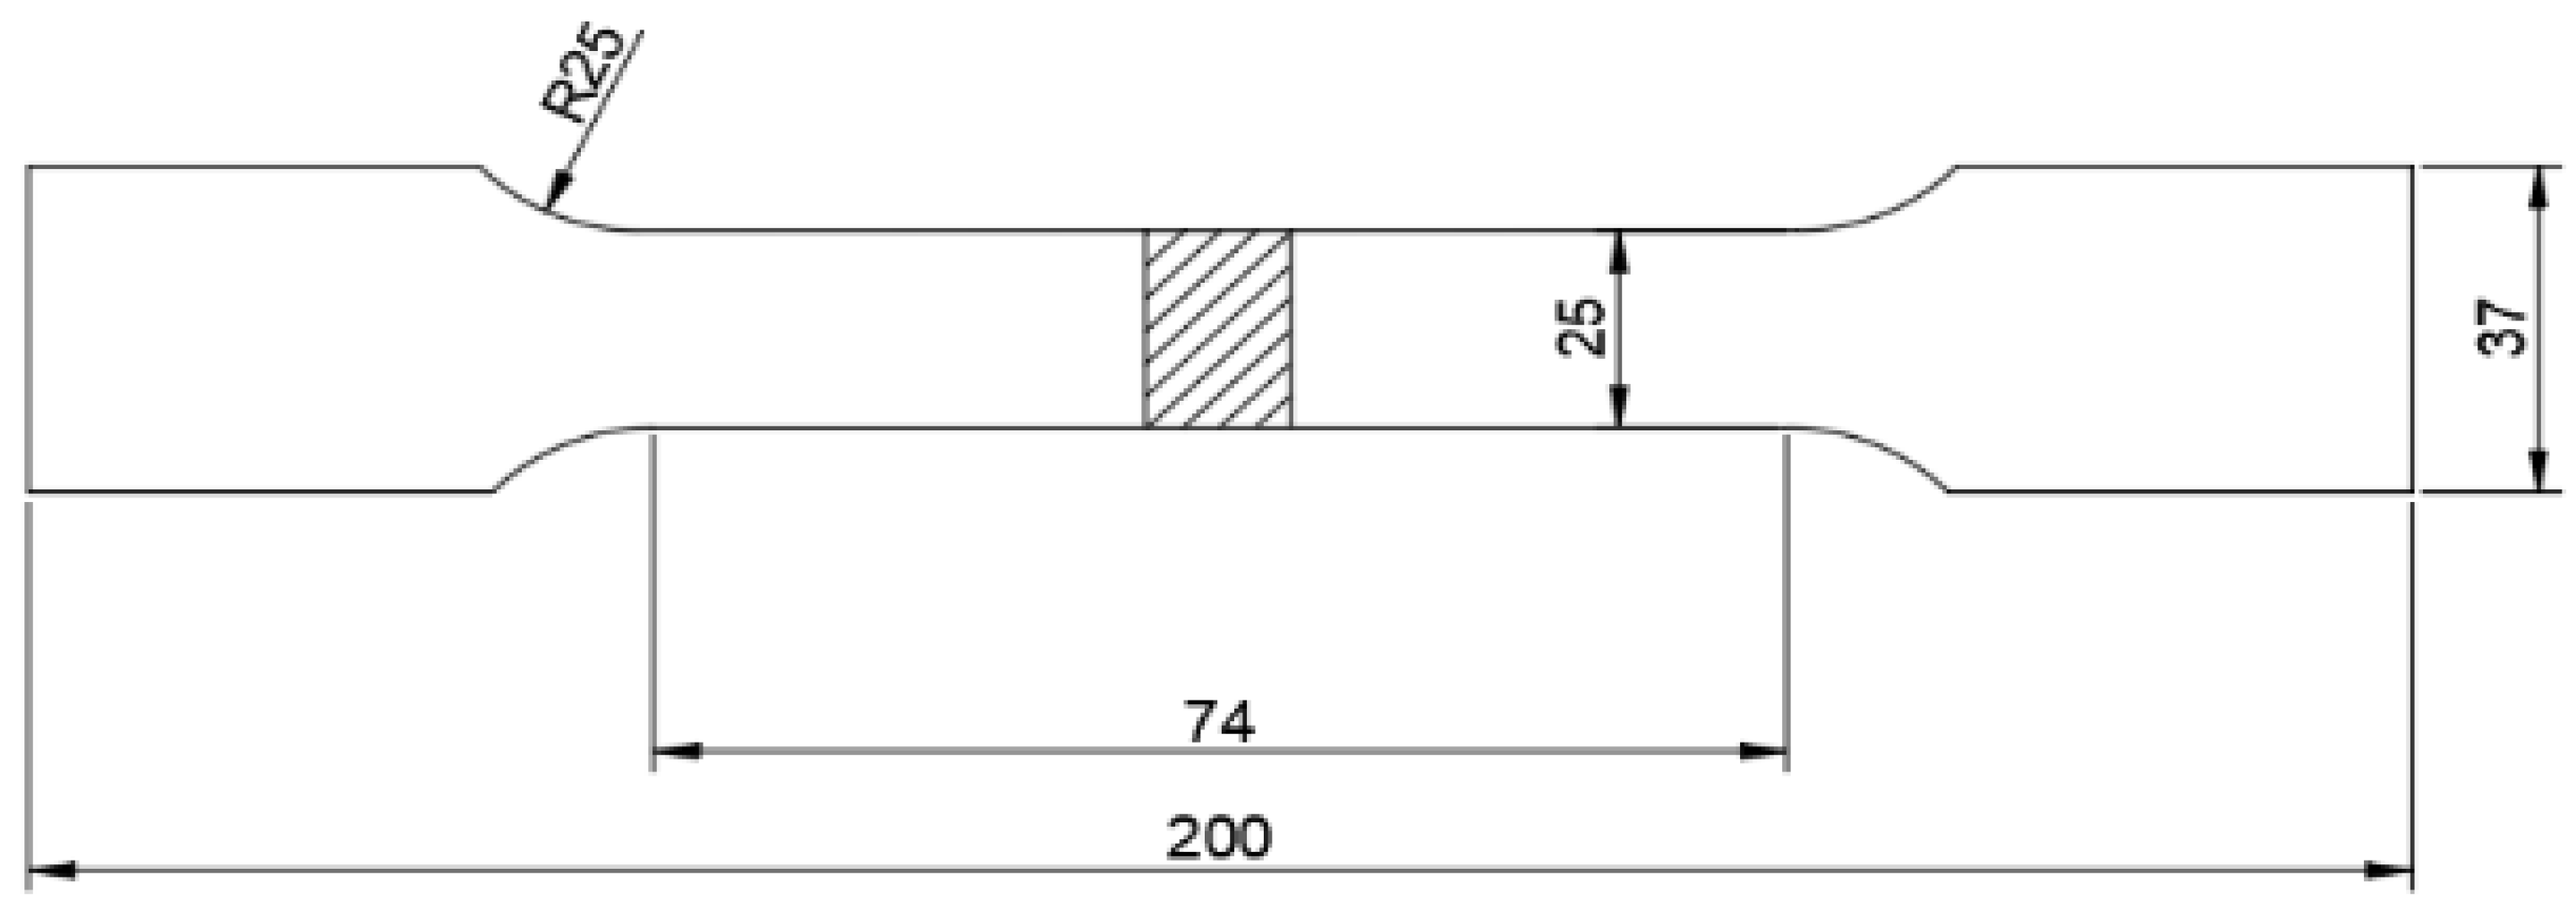
Figure 3.
Schematic diagram of residual-stress measurement
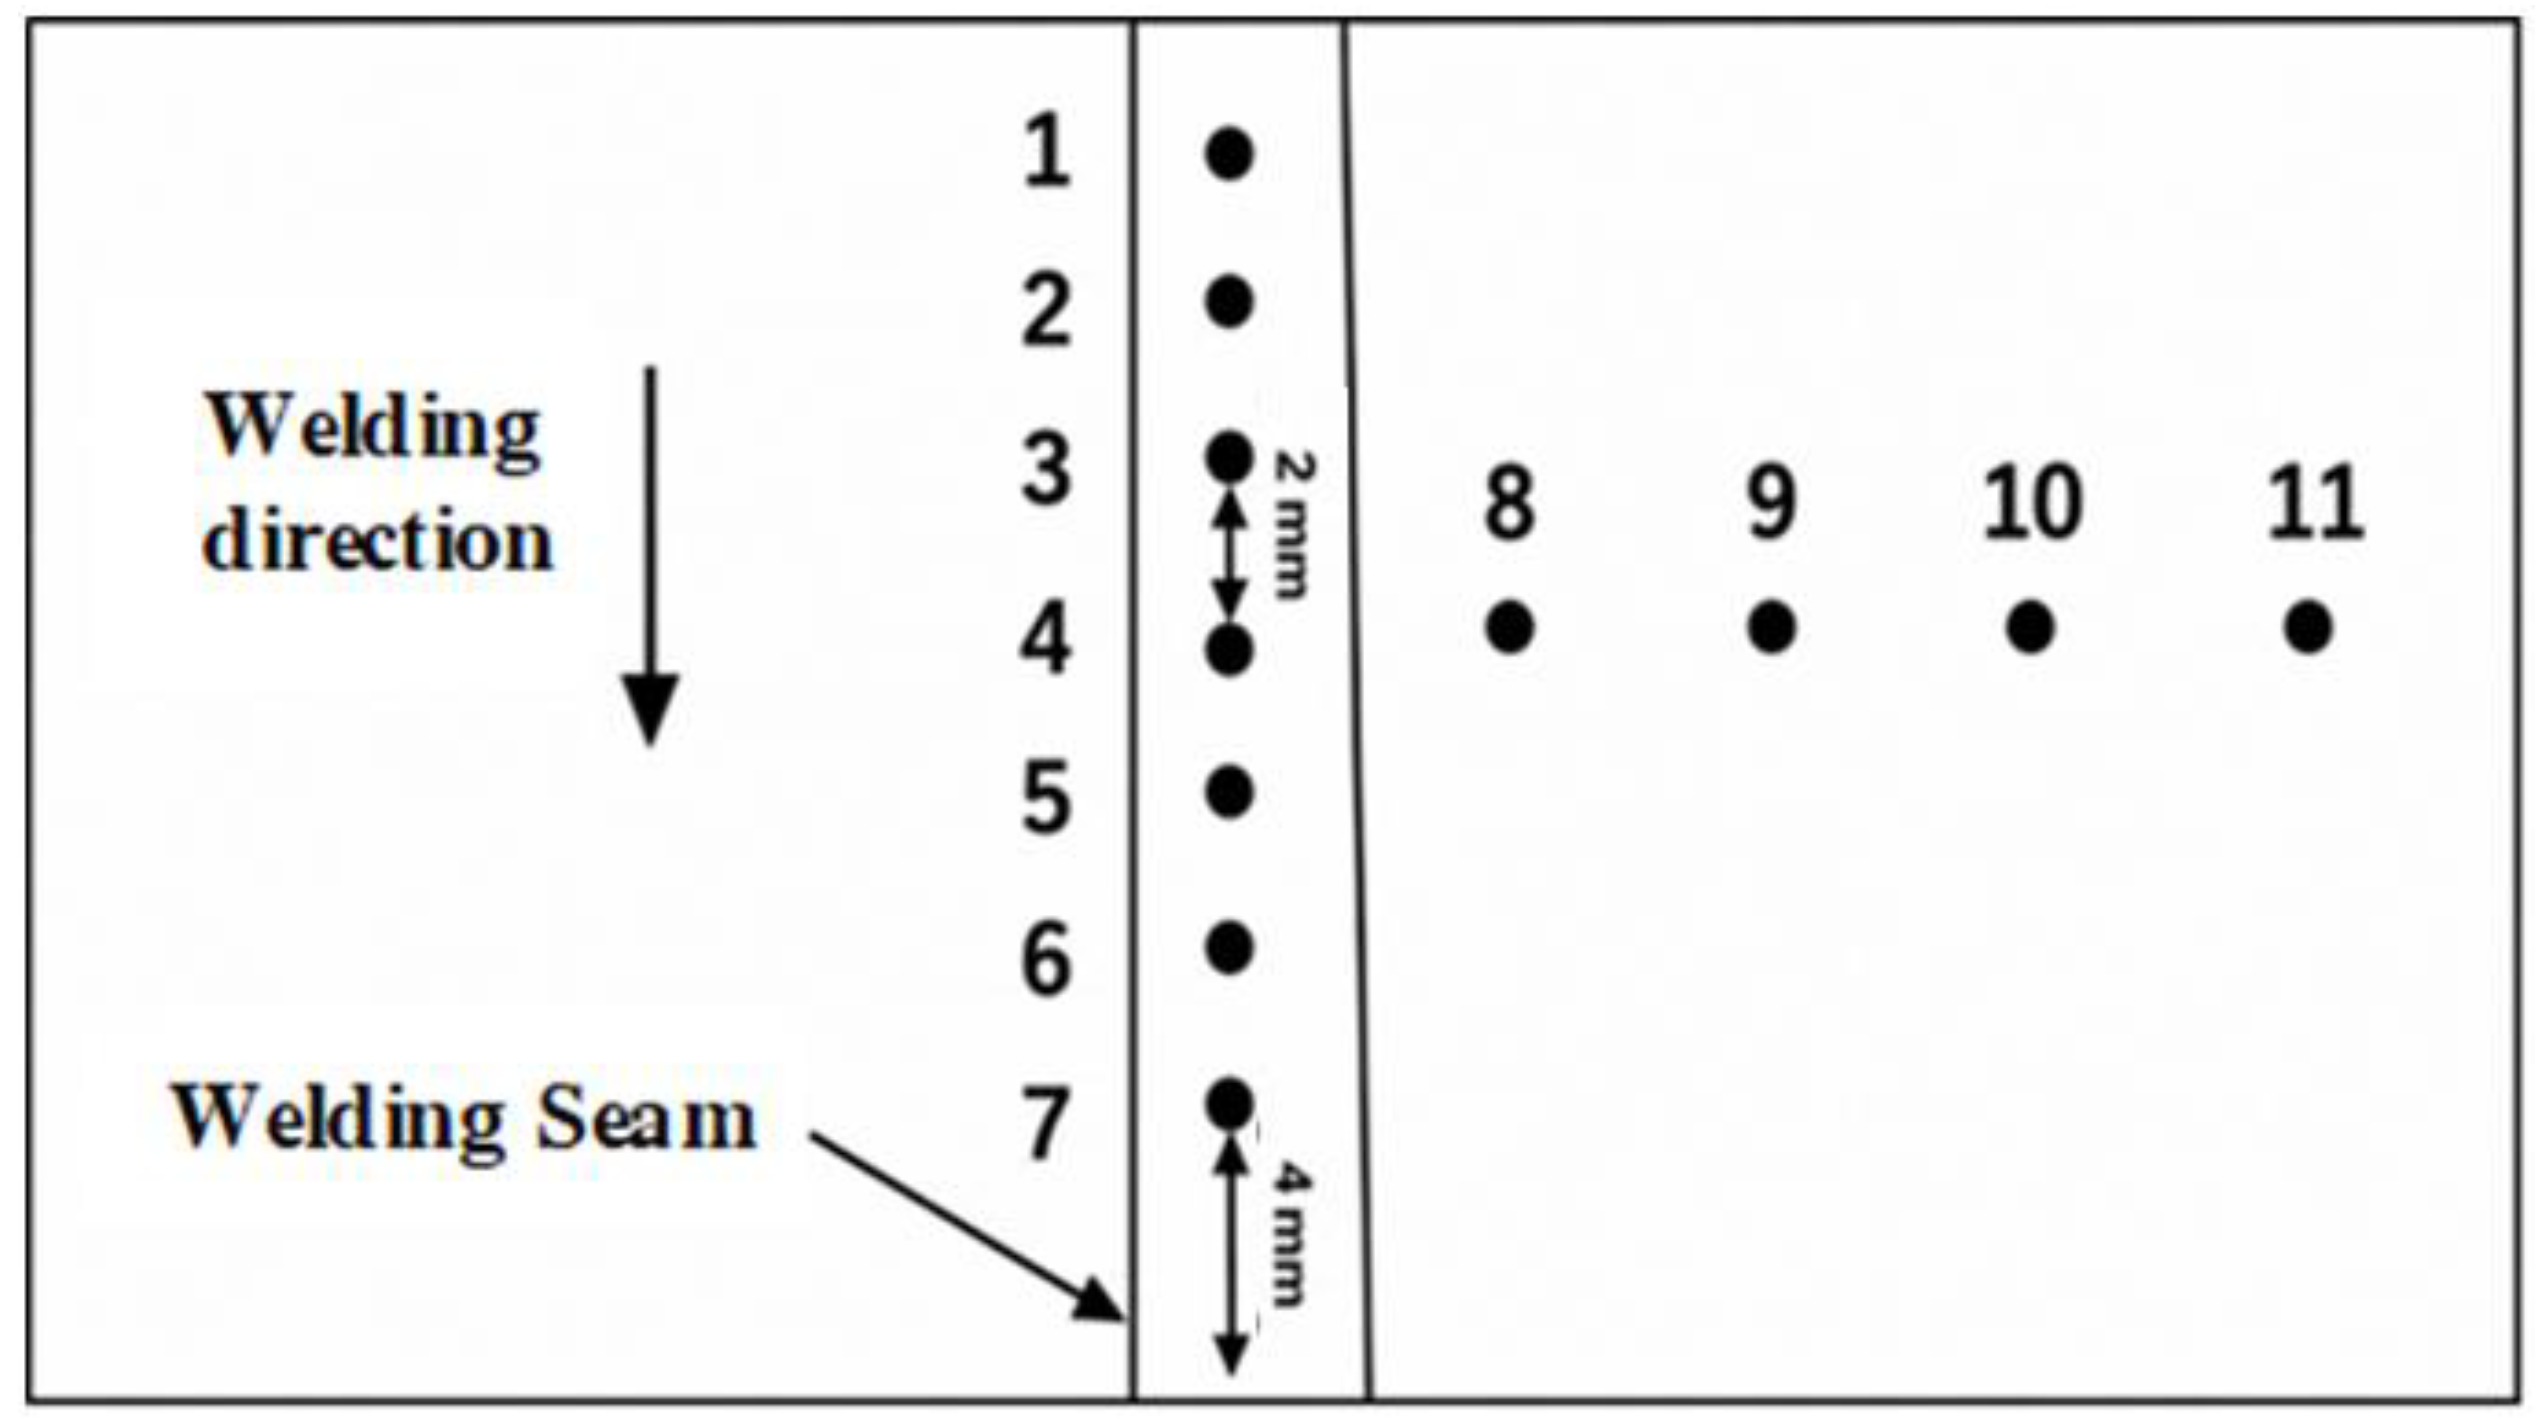
Figure 4.
Macroscopic weld surfaces under different welding parameters. (a) Welding current; (b) Arc voltage; (c) Welding speed.
Figure 4.
Macroscopic weld surfaces under different welding parameters. (a) Welding current; (b) Arc voltage; (c) Welding speed.
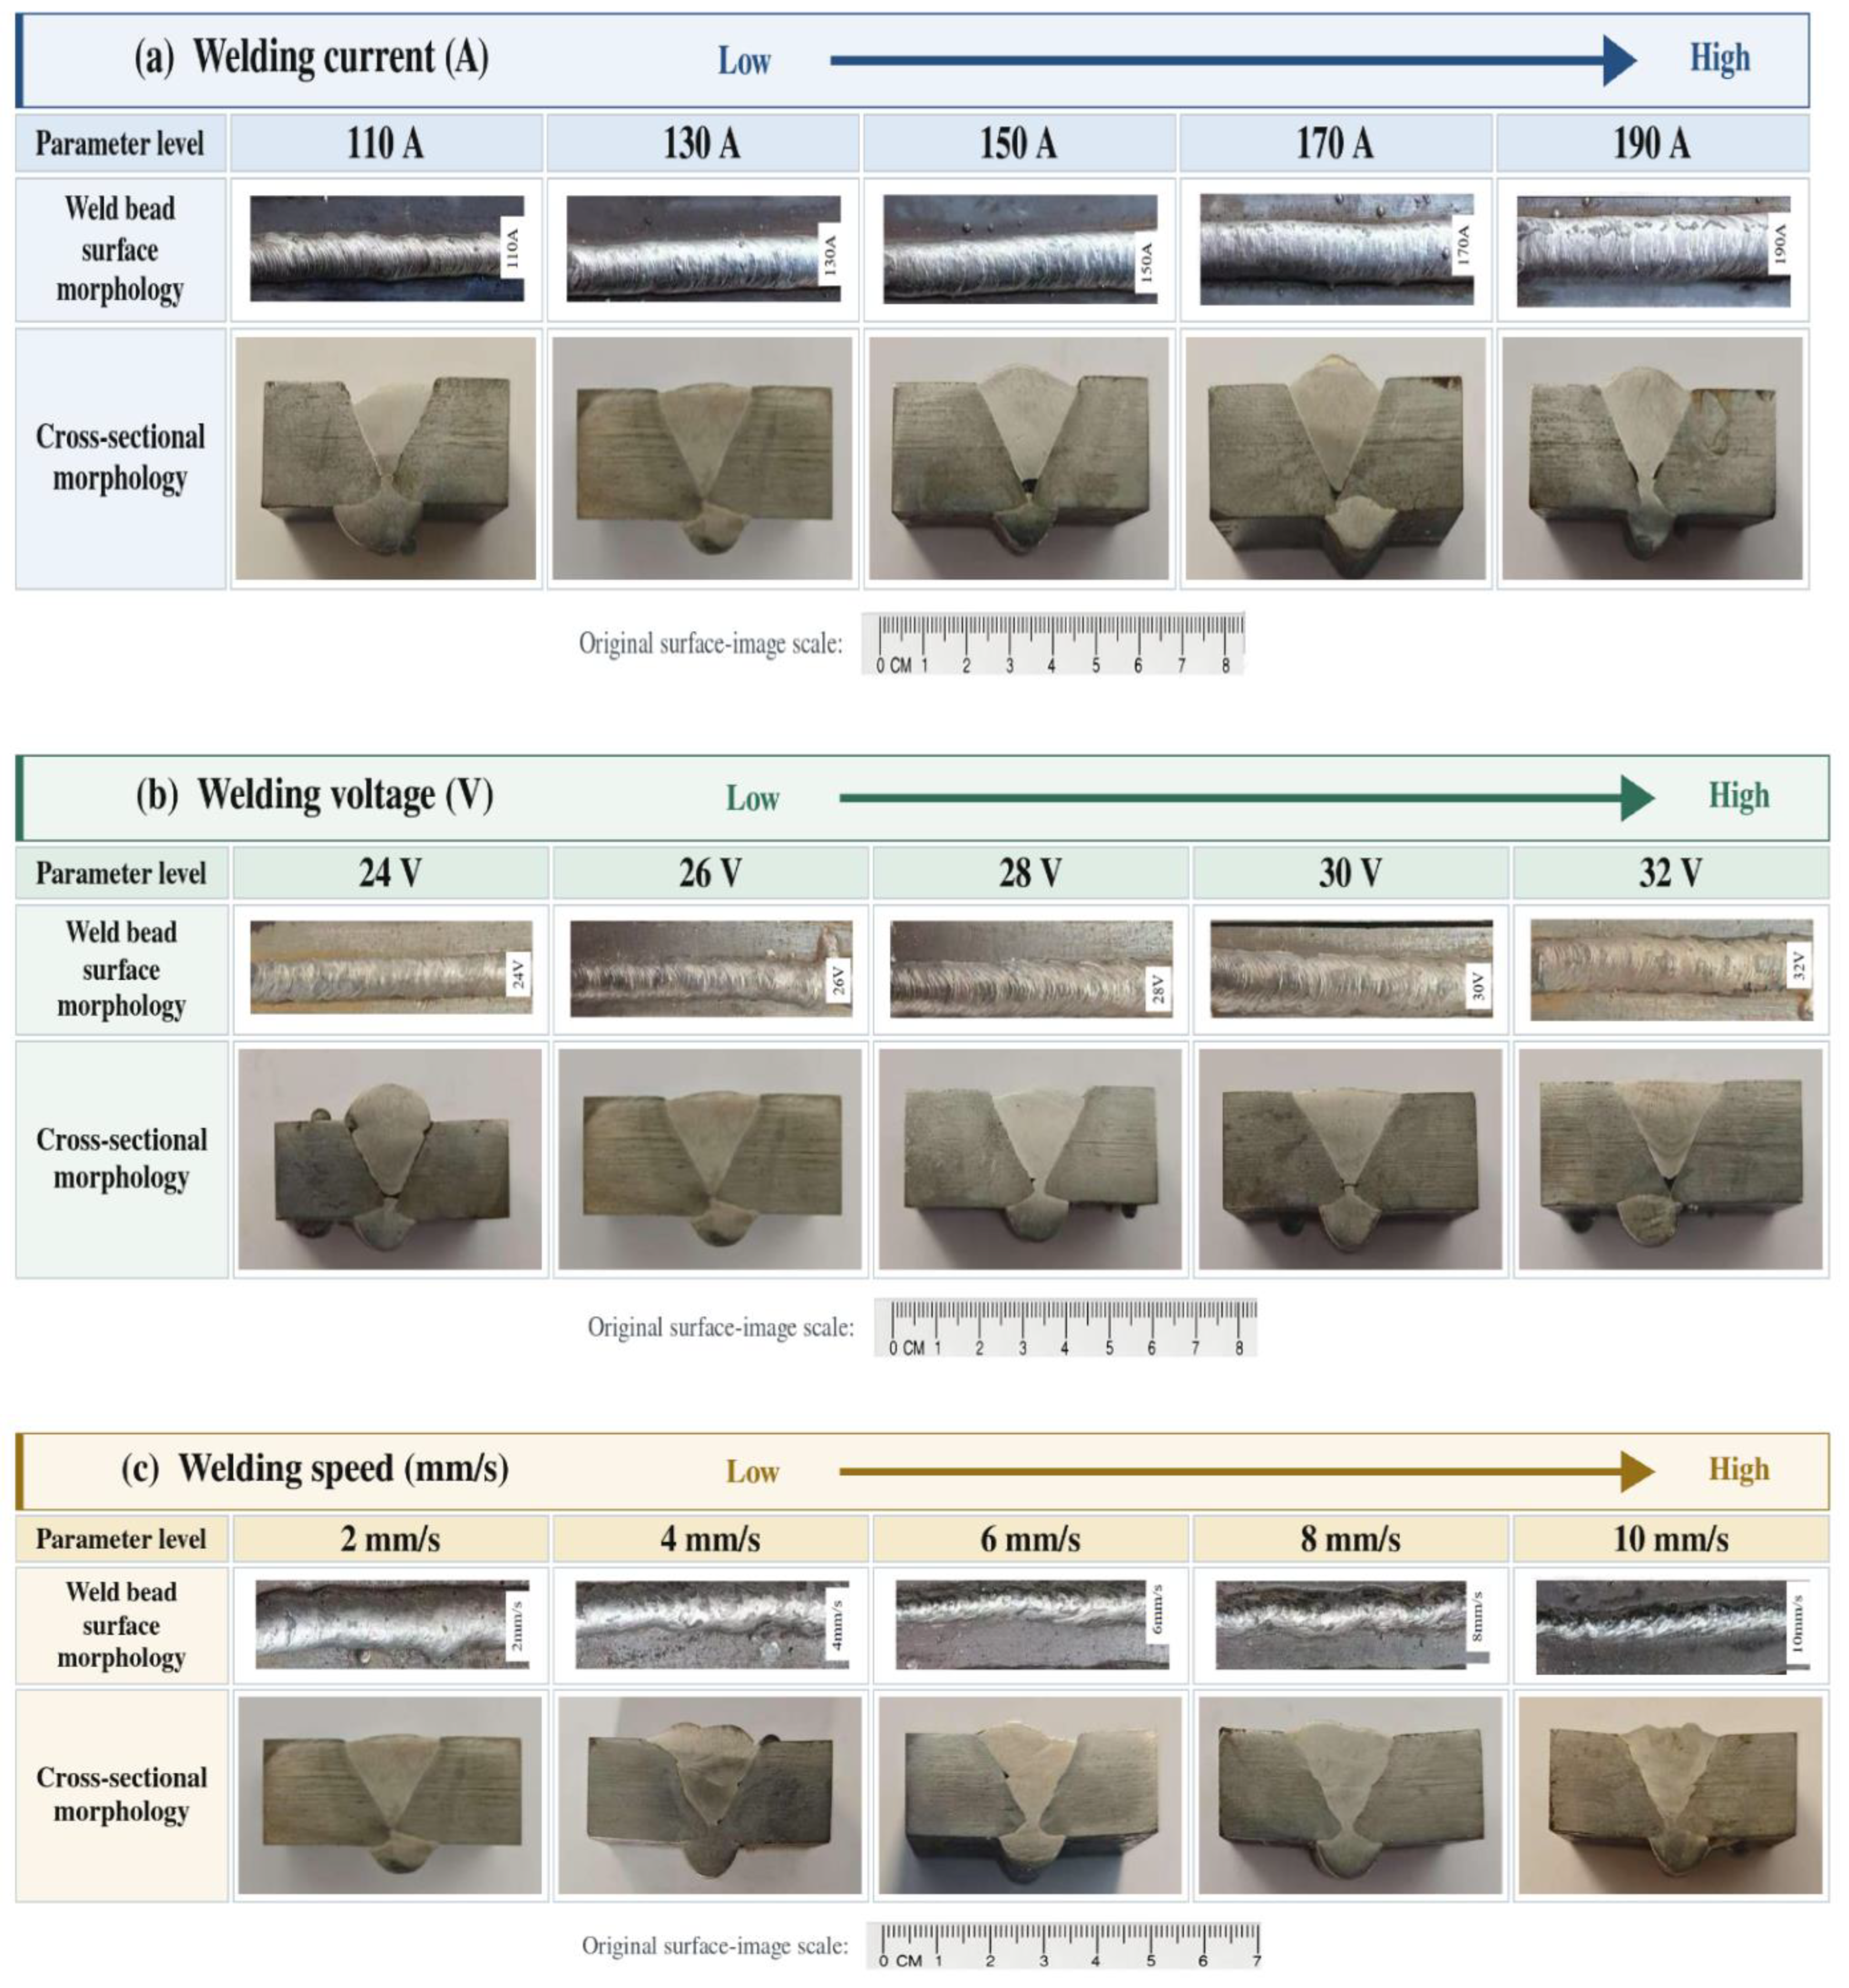
Figure 5.
Grain size under different parameters.
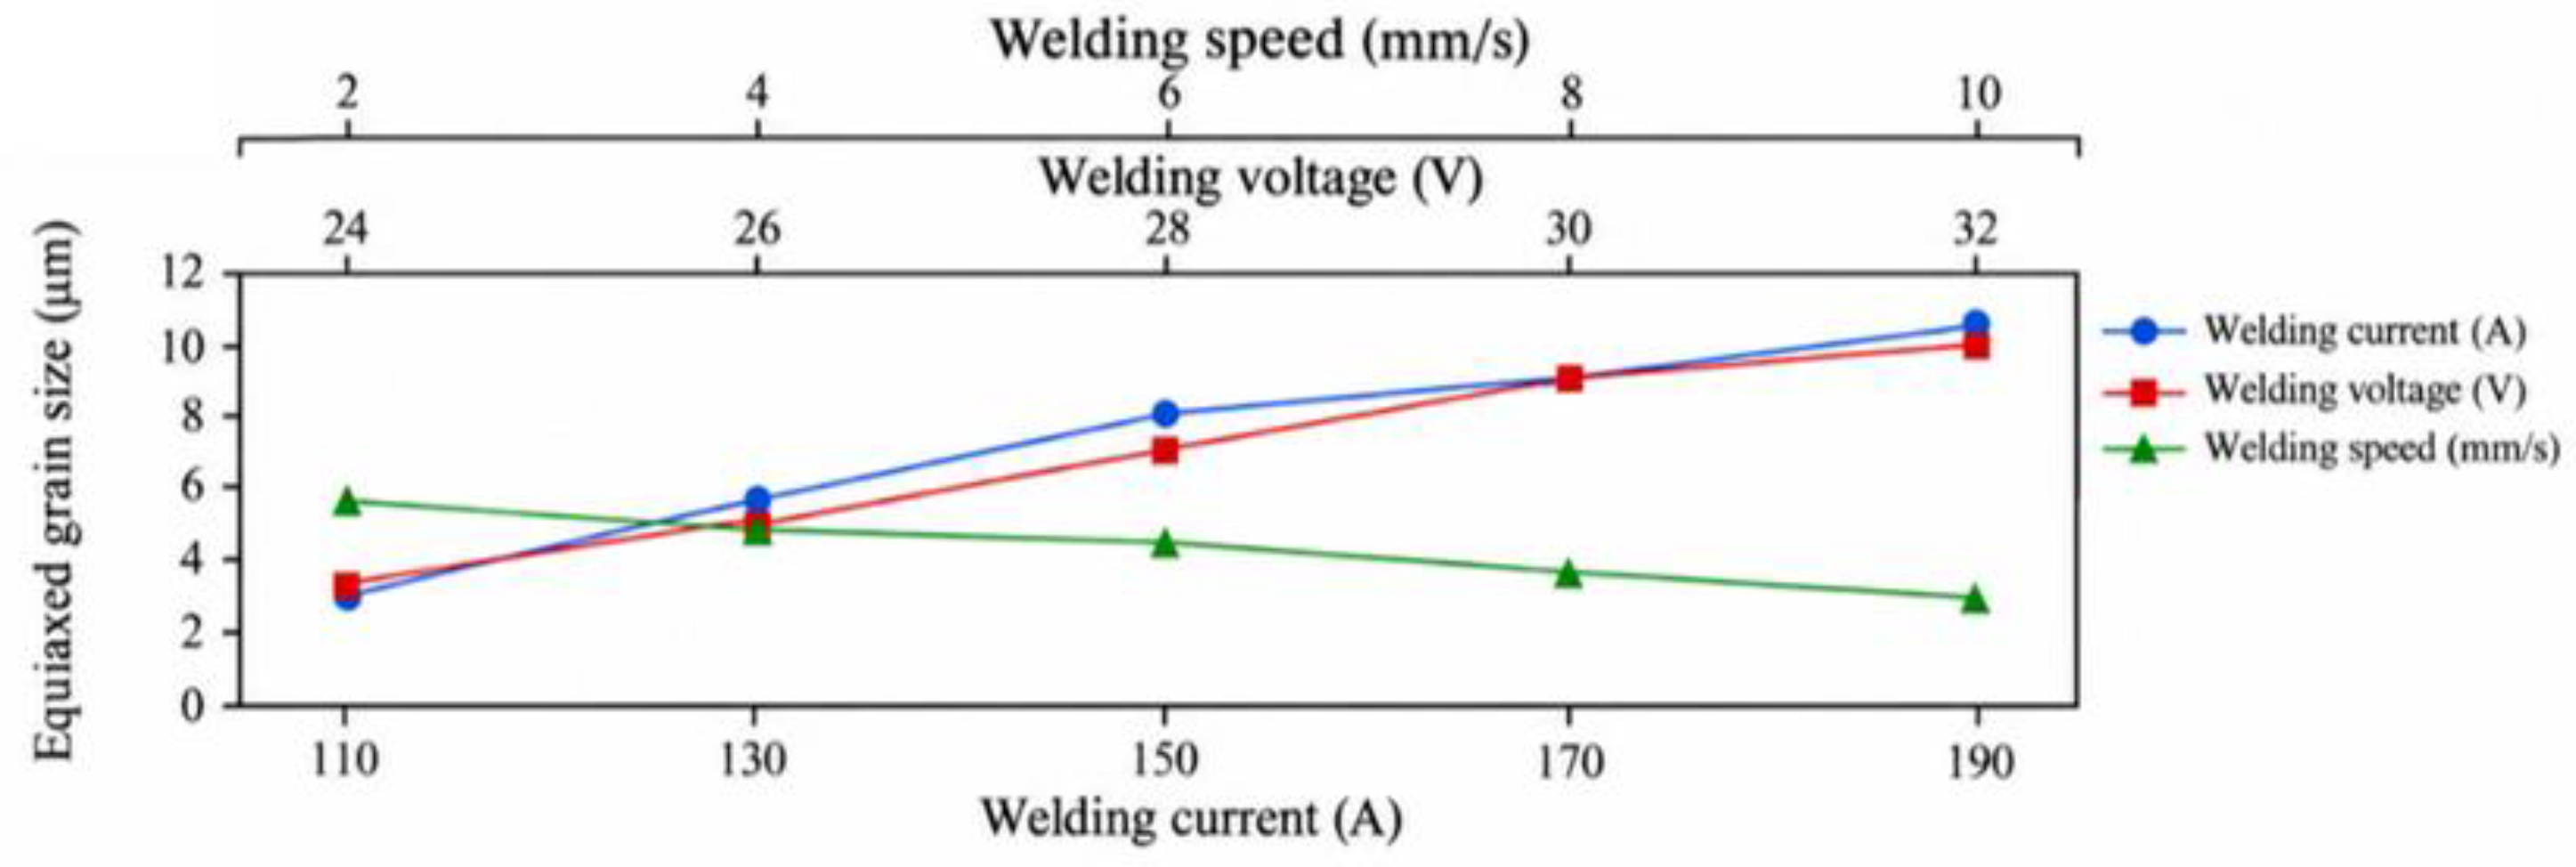
Figure 6.
Tensile-strength under different parameters (current, voltage, and welding speed).
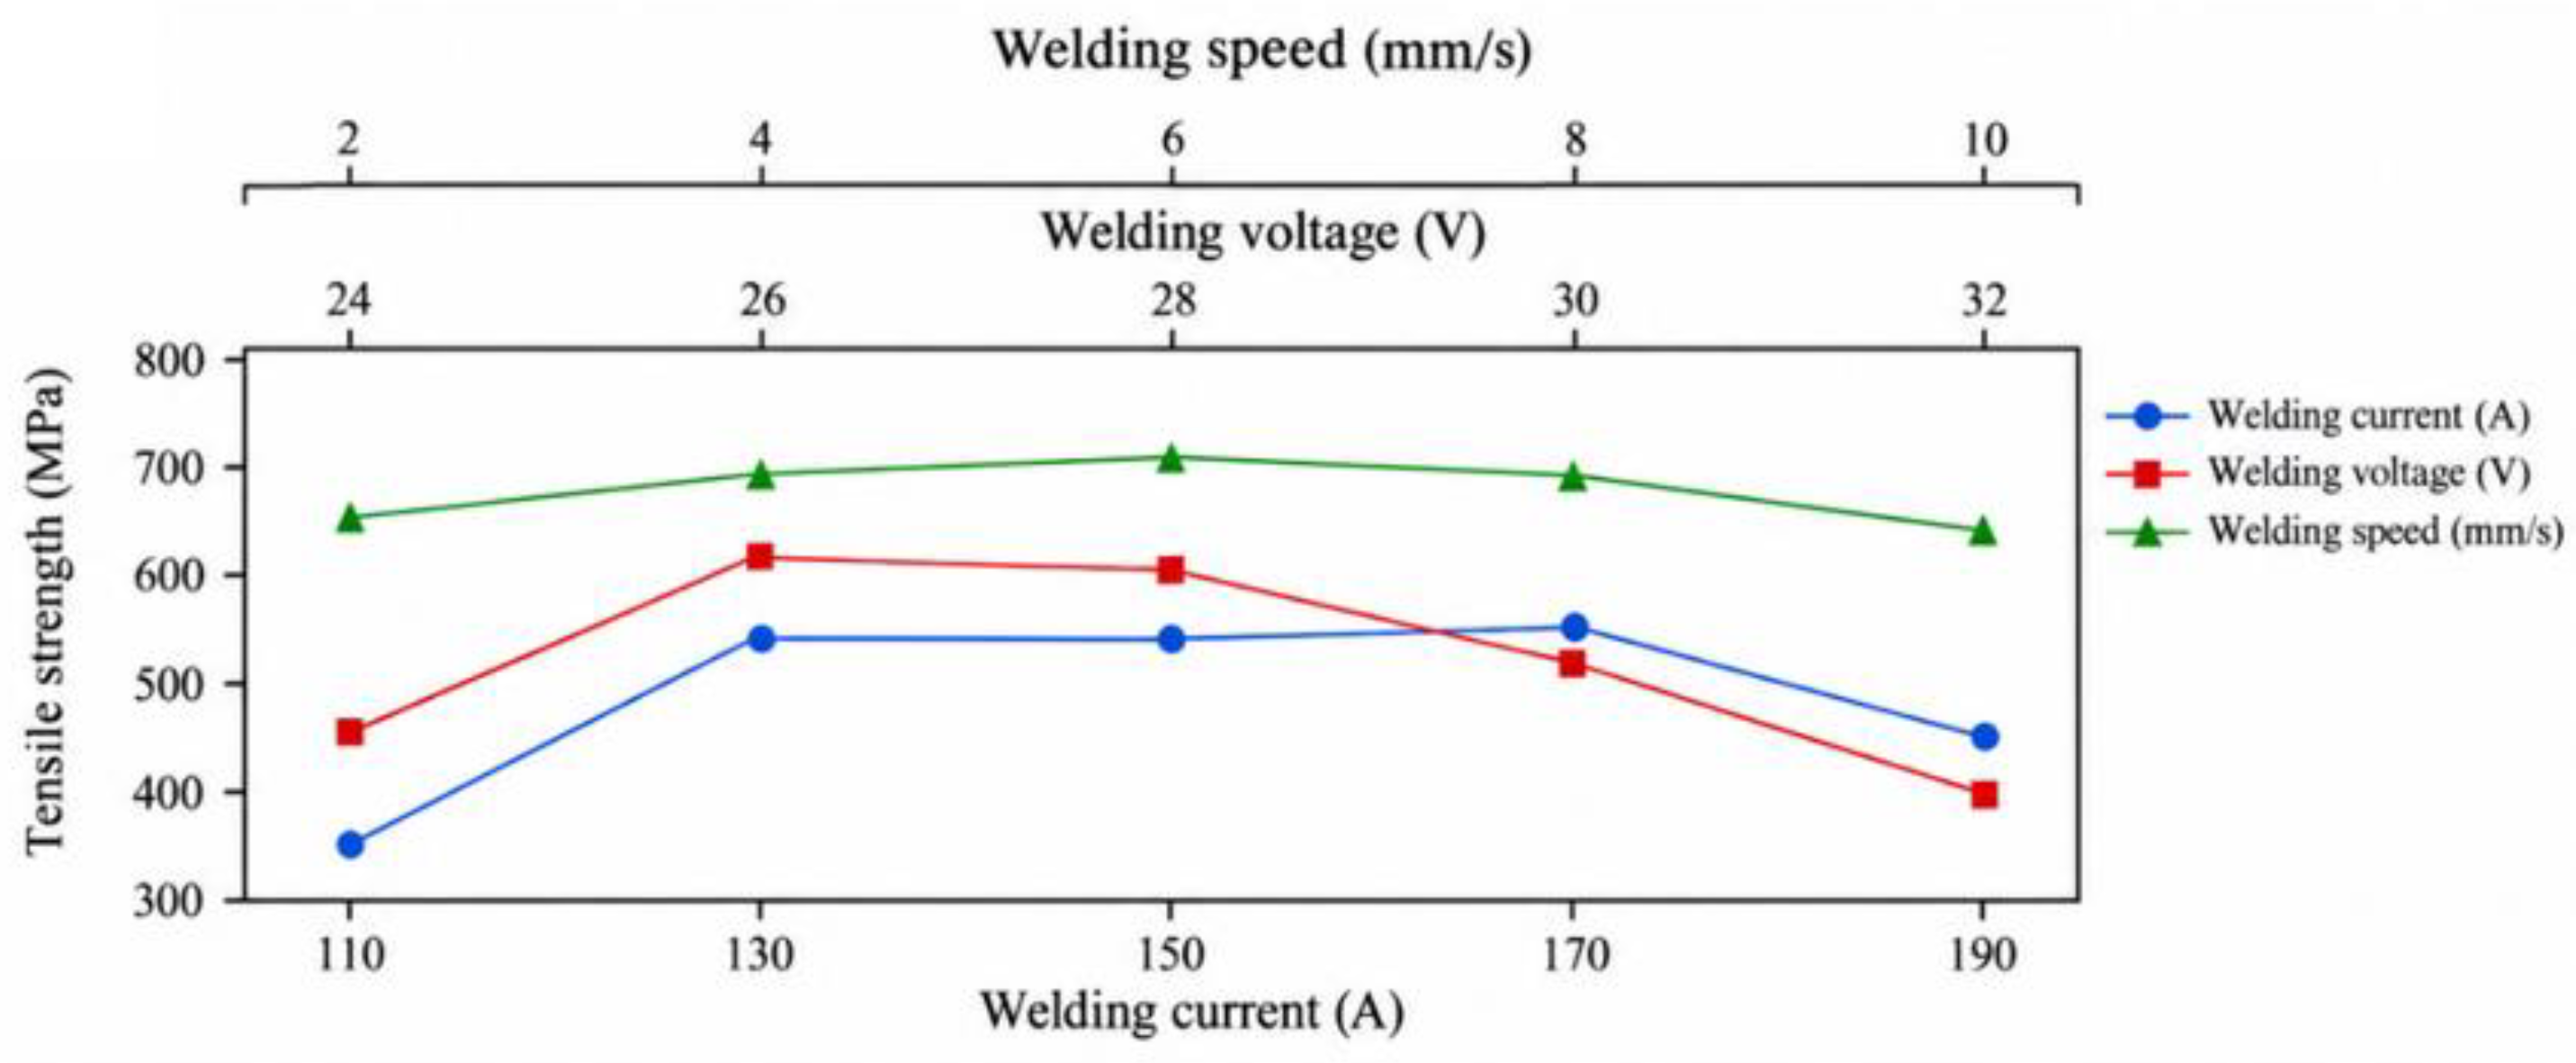
Figure 7.
Fracture morphologies of welded joints after tensile testing: (a–c) Fe-Mn-Si SMA welding seam and (d–f) YJ501-1 welding seam; (a,d) low-magnification SE images; (b,e) high-magnification SE and (c,f) BSE images.
Figure 7.
Fracture morphologies of welded joints after tensile testing: (a–c) Fe-Mn-Si SMA welding seam and (d–f) YJ501-1 welding seam; (a,d) low-magnification SE images; (b,e) high-magnification SE and (c,f) BSE images.
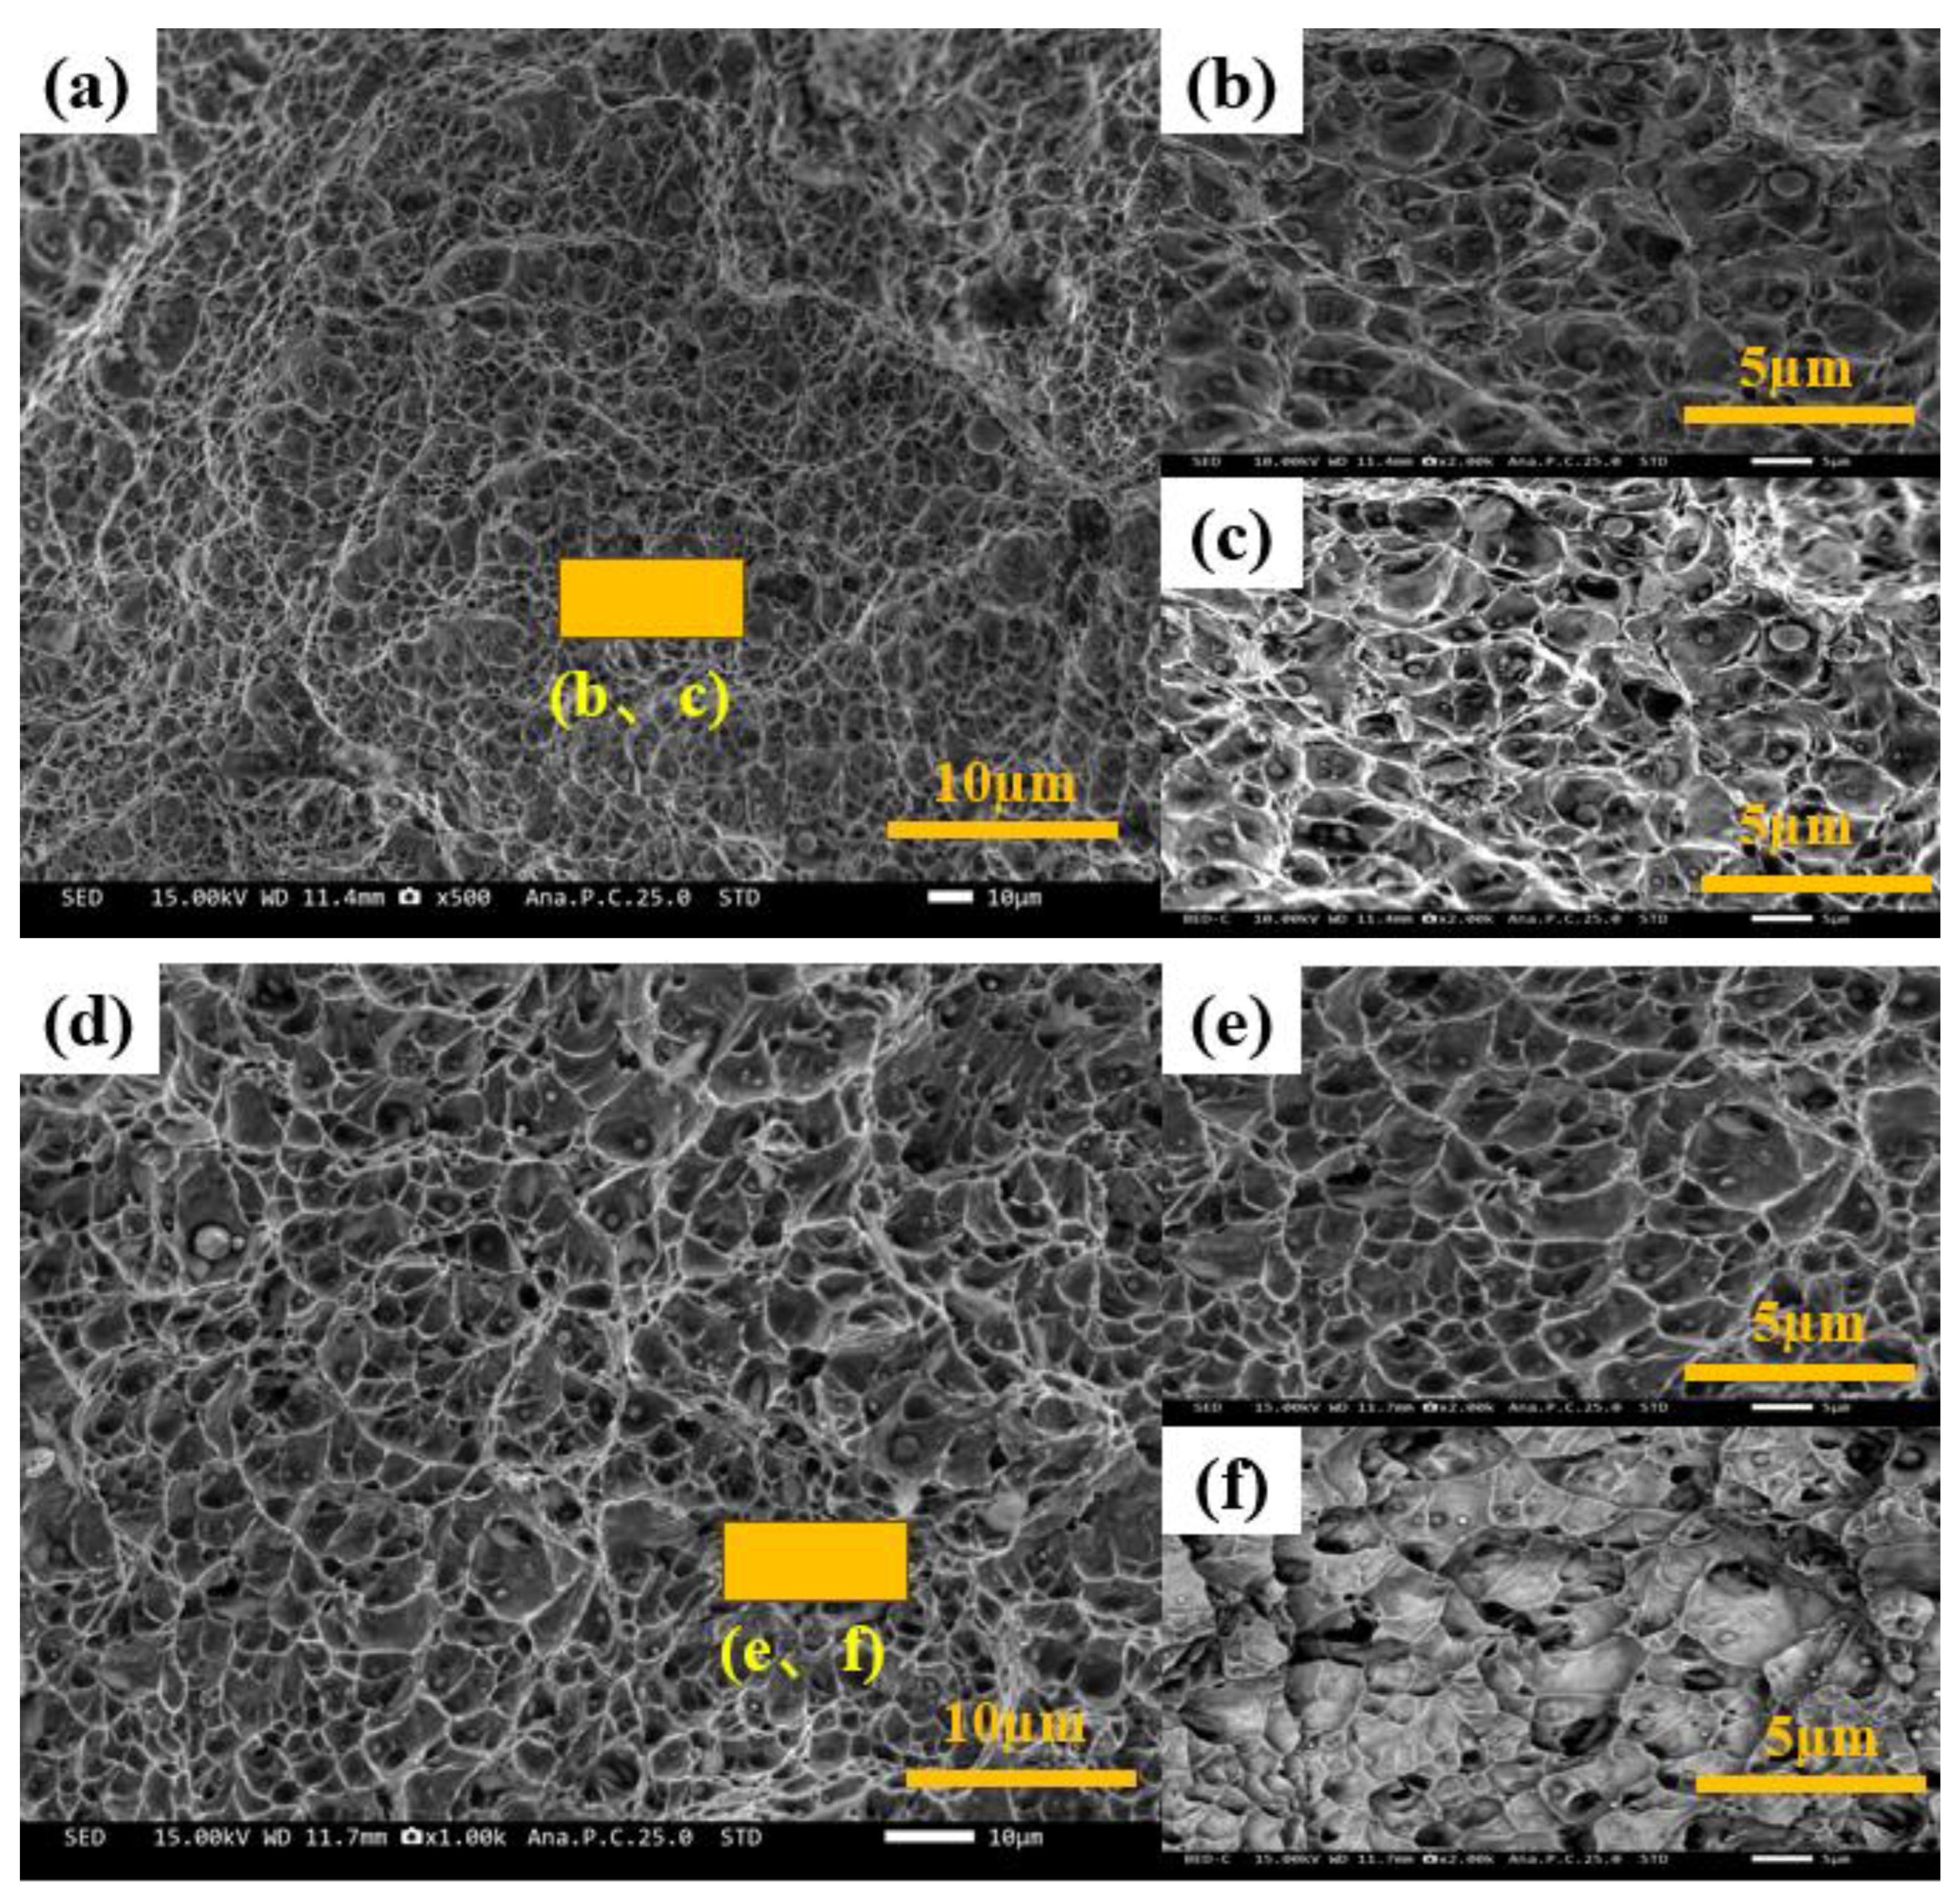
Figure 8.
Microstructure of Fe-Mn-Si SMA and YJ501-1 welding seam
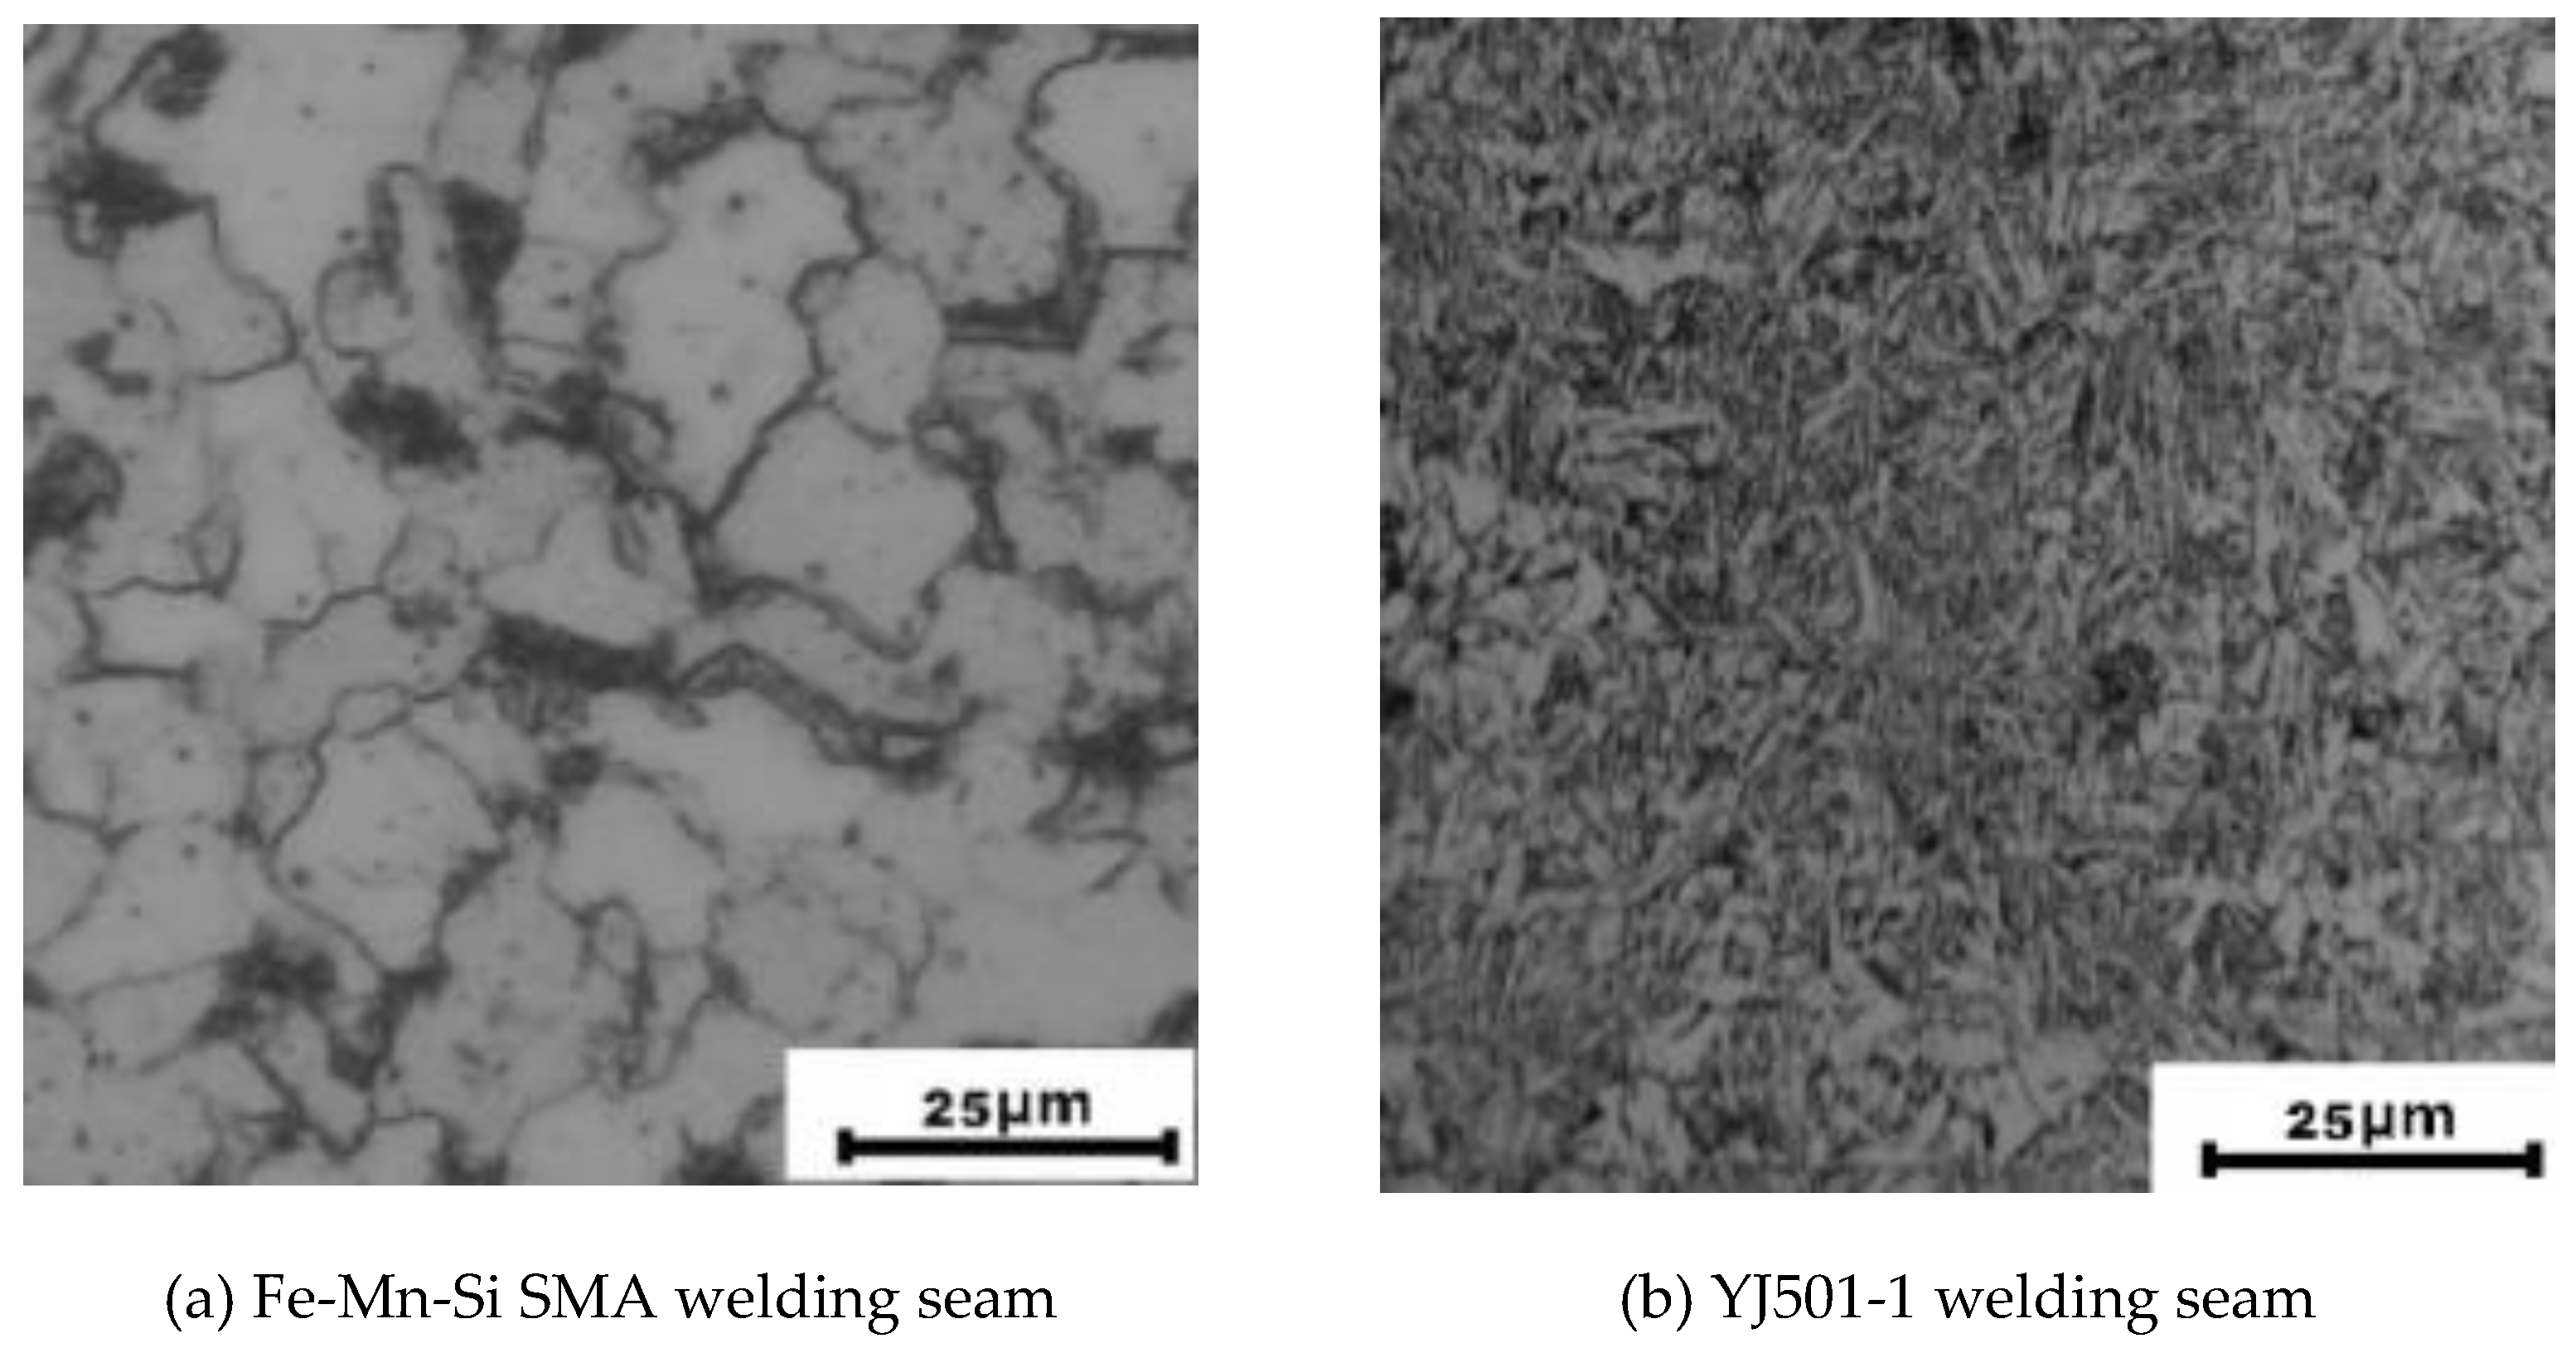
Figure 9.
Cross-sectional hardness distribution of welded joints with Fe-Mn-Si SMA and YJ501-1 welding seam.
Figure 9.
Cross-sectional hardness distribution of welded joints with Fe-Mn-Si SMA and YJ501-1 welding seam.
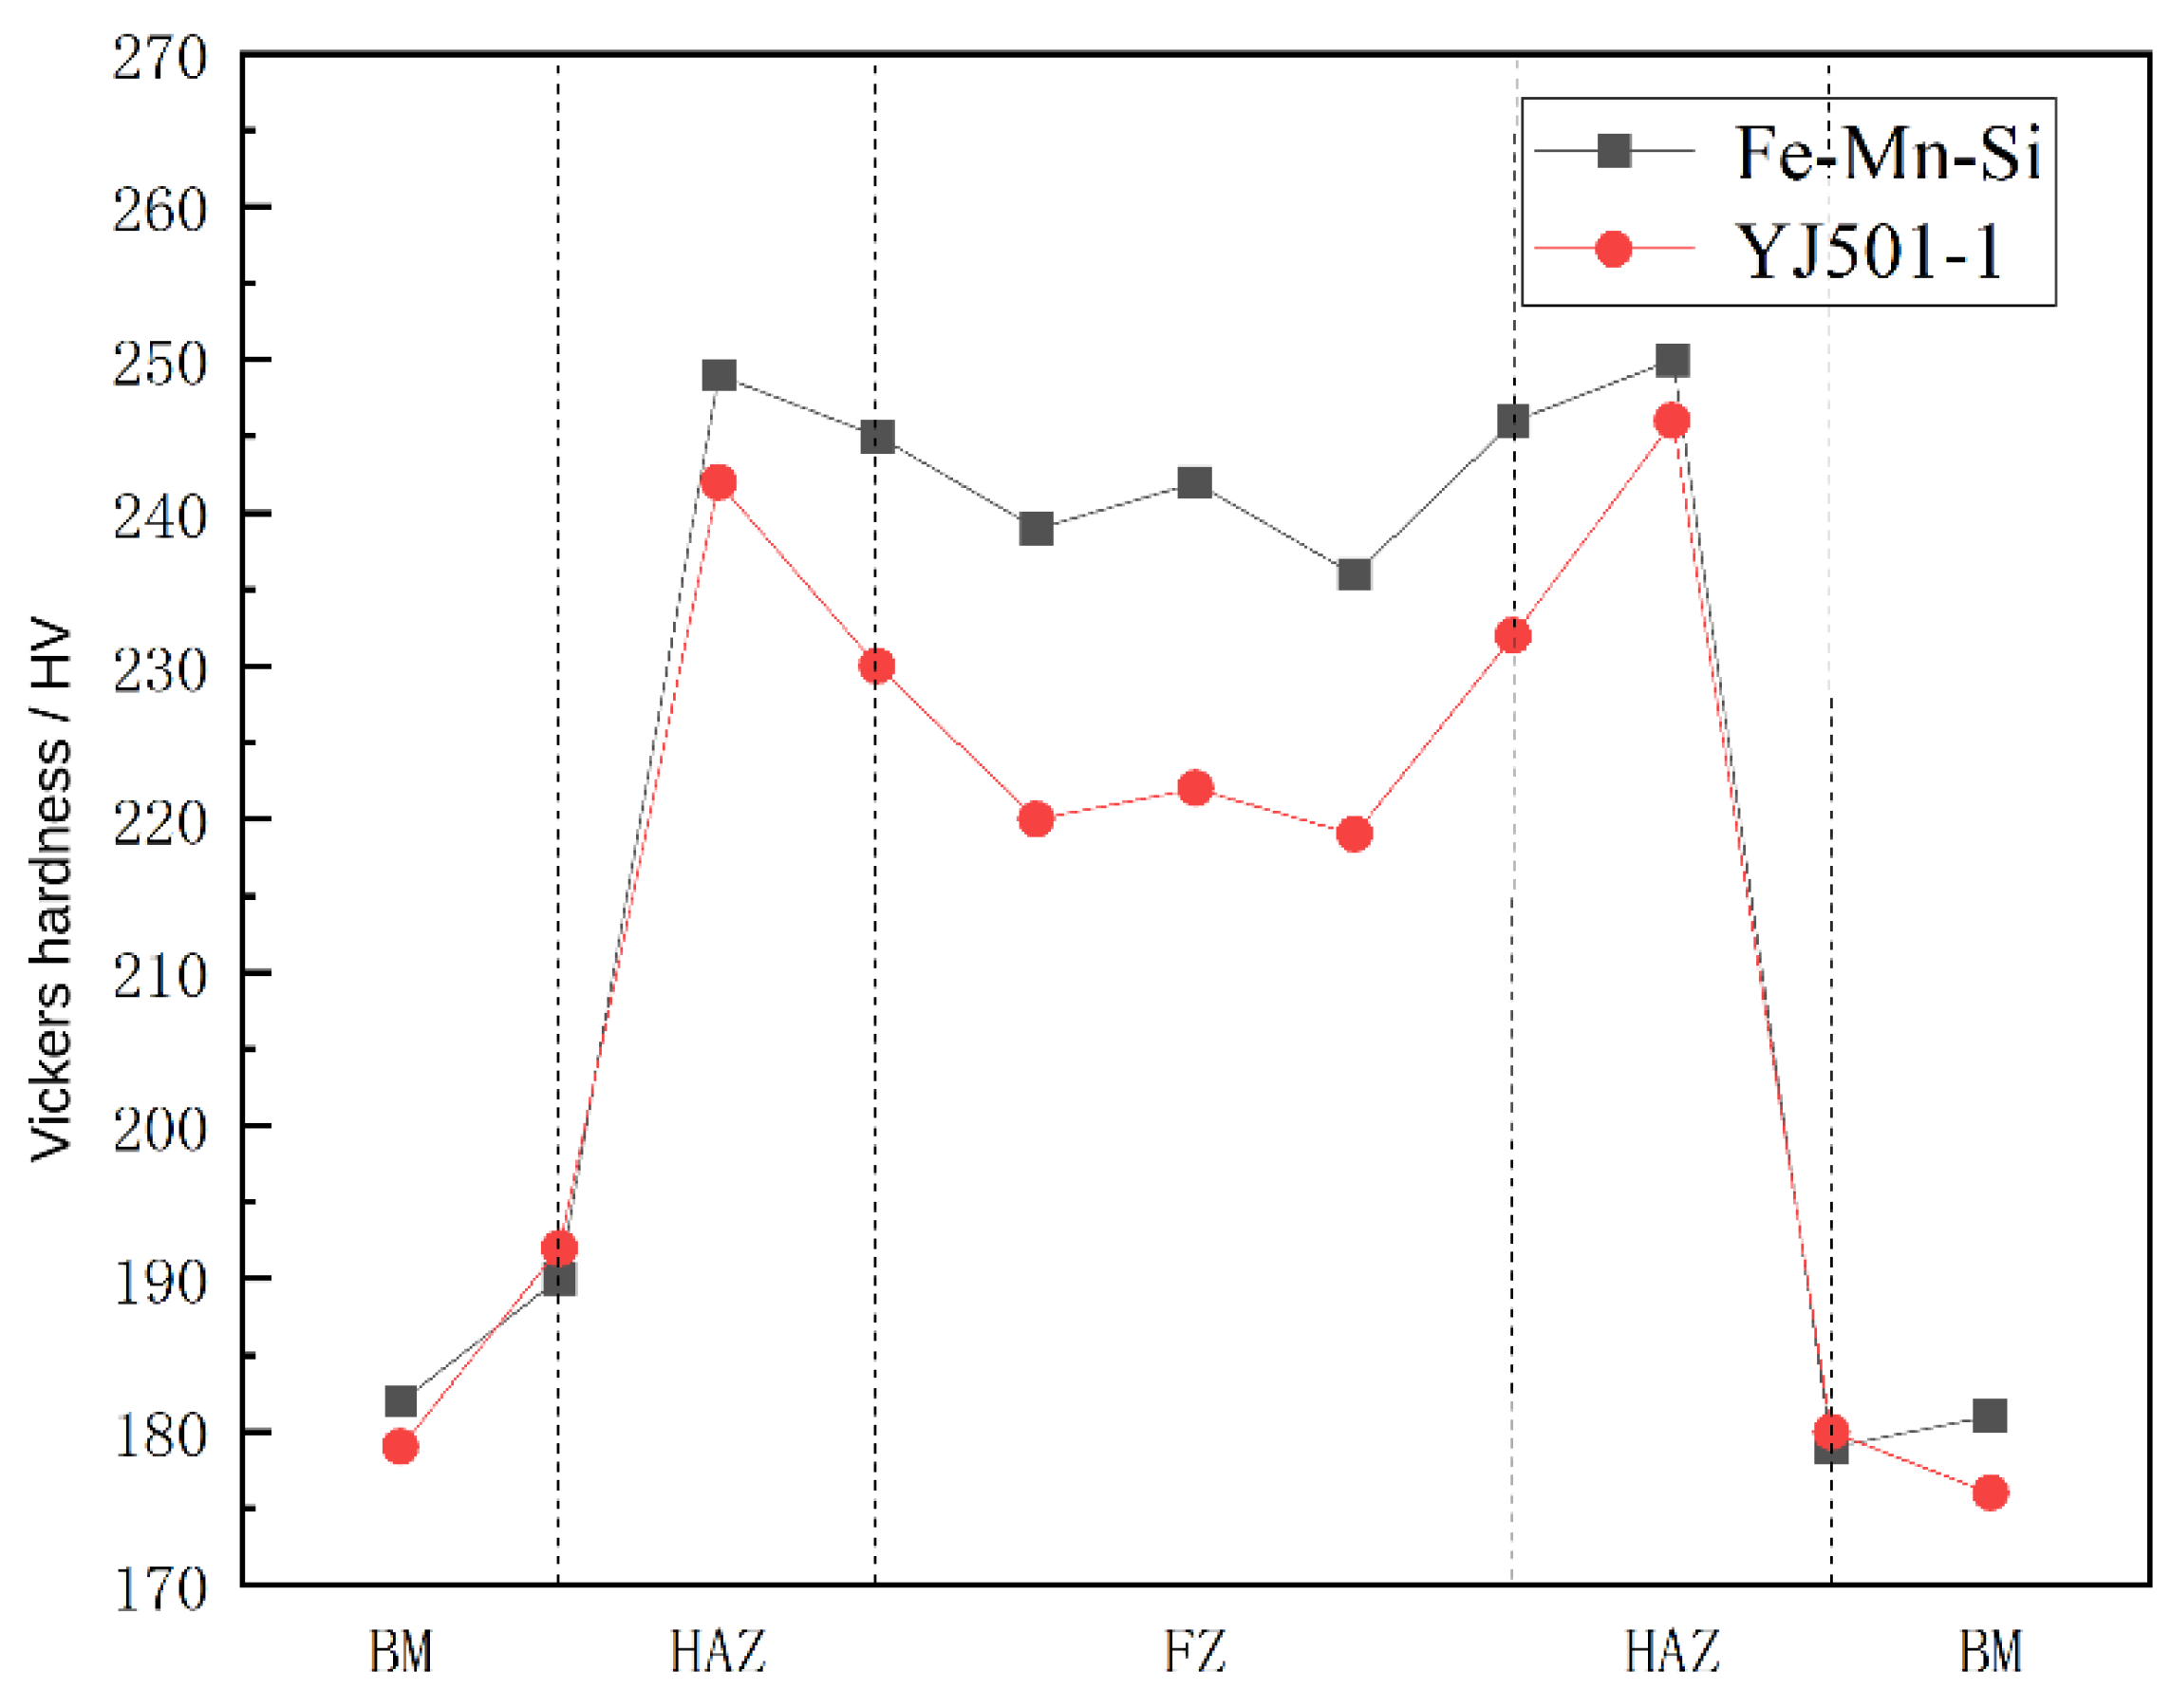
Figure 10.
Schematic diagrams of principal stress in welded joints
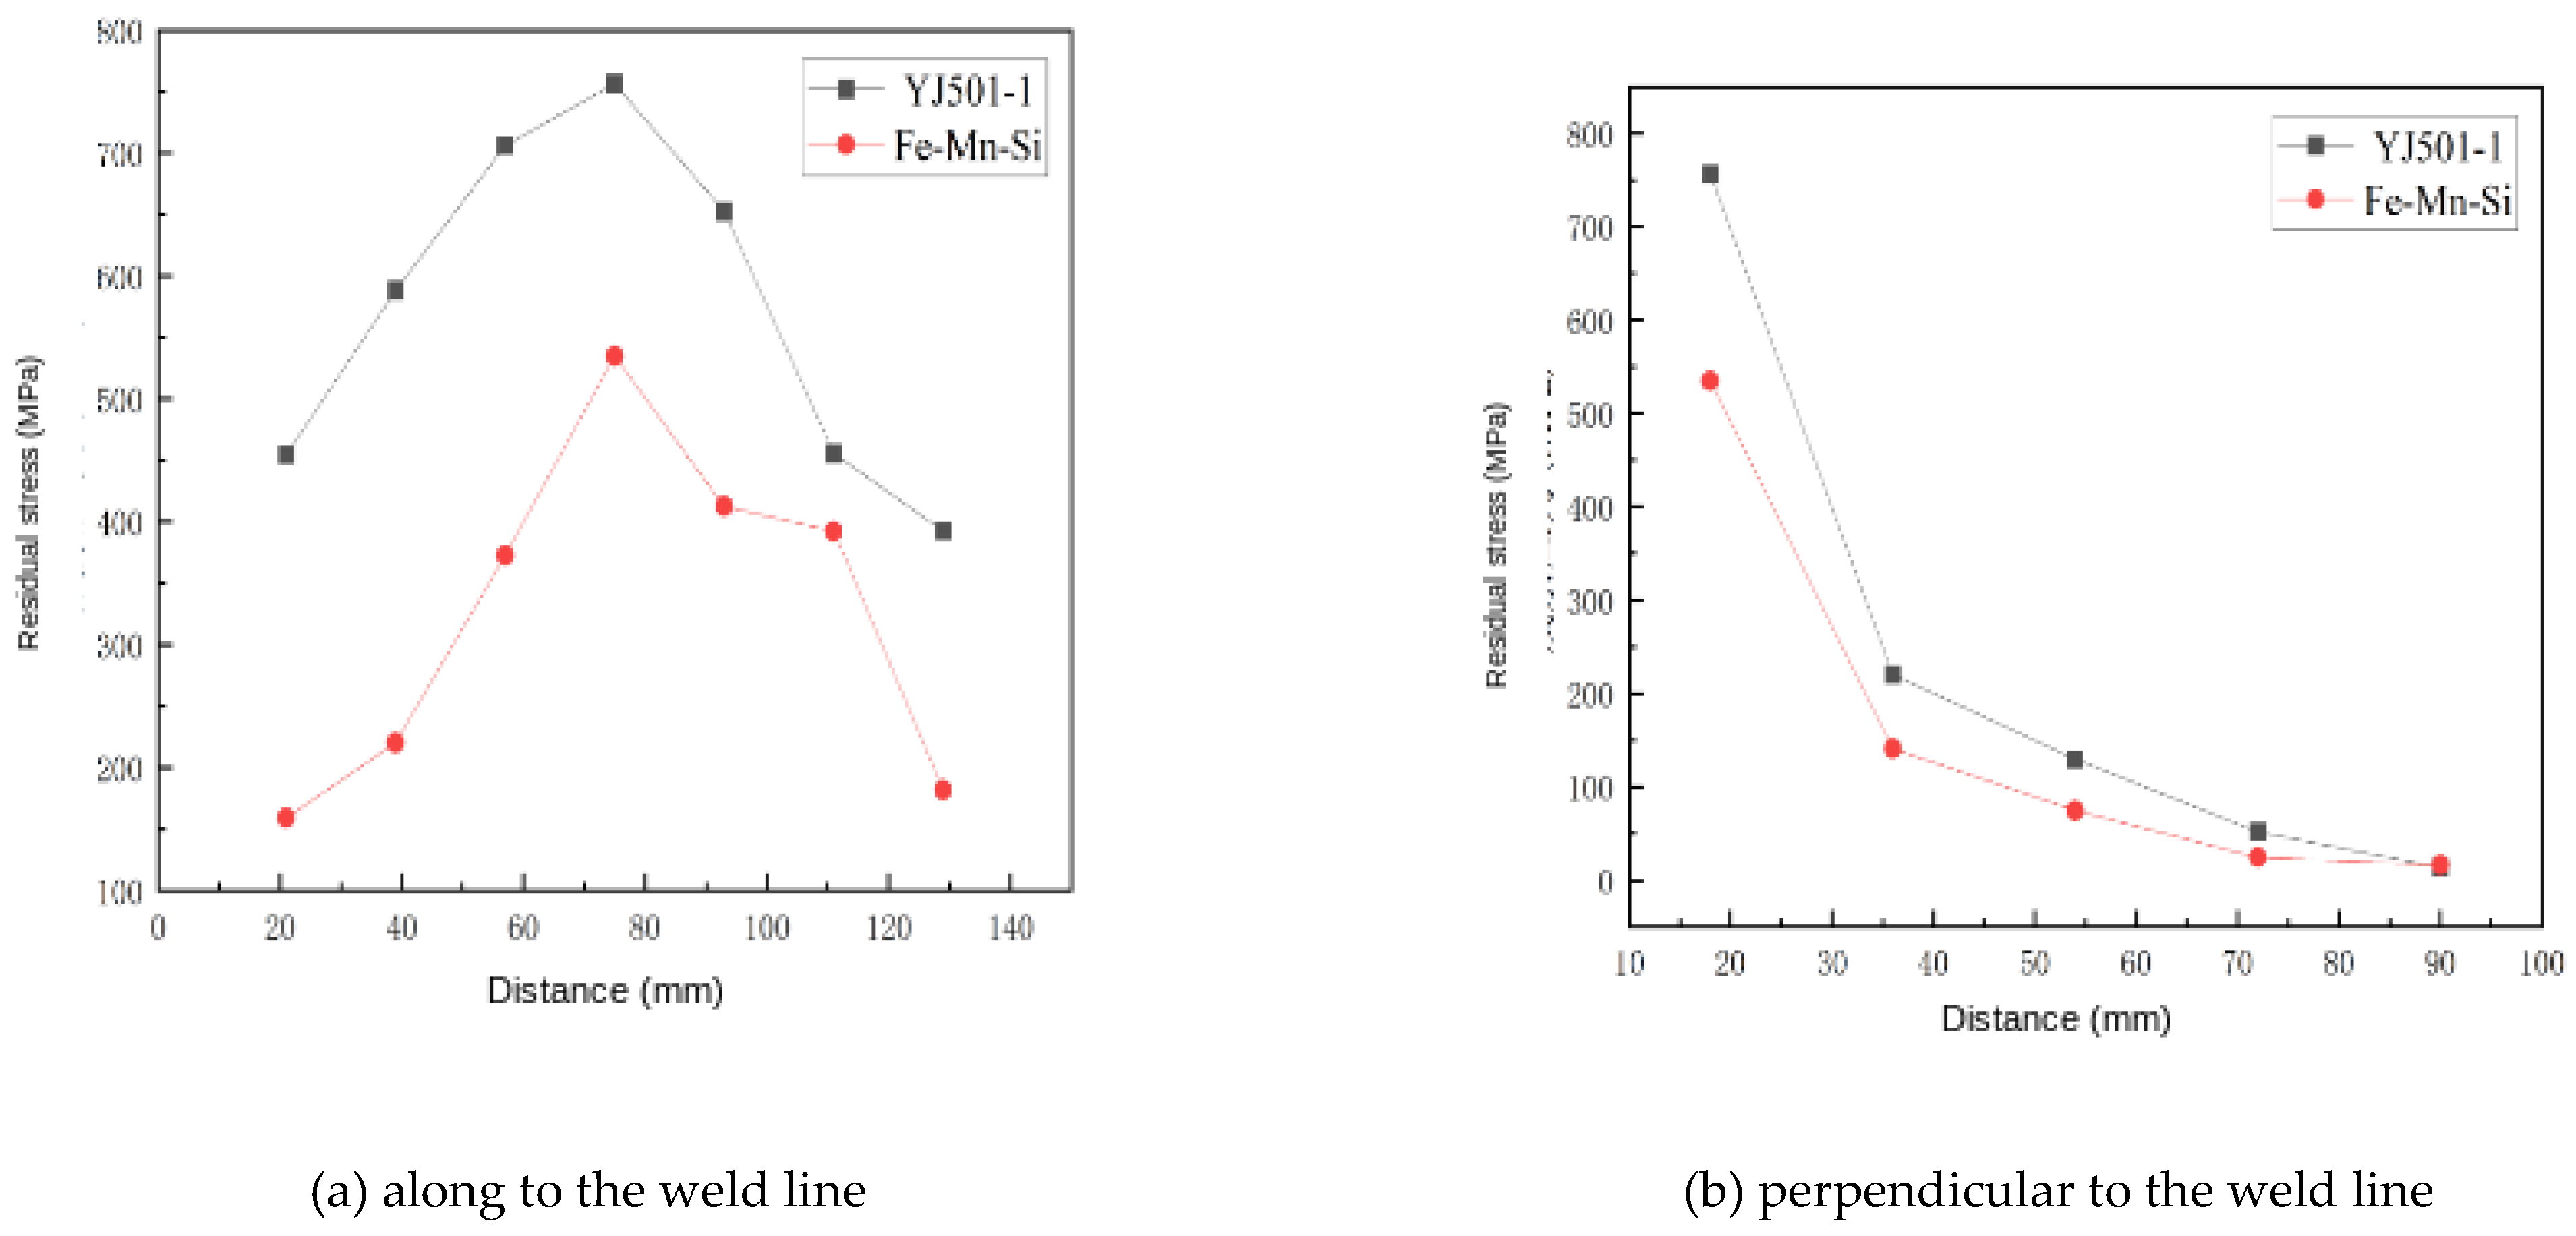
Figure 11.
X-ray Diffraction of Fe-Mn-Si SMA welding seam before and after solution treatment
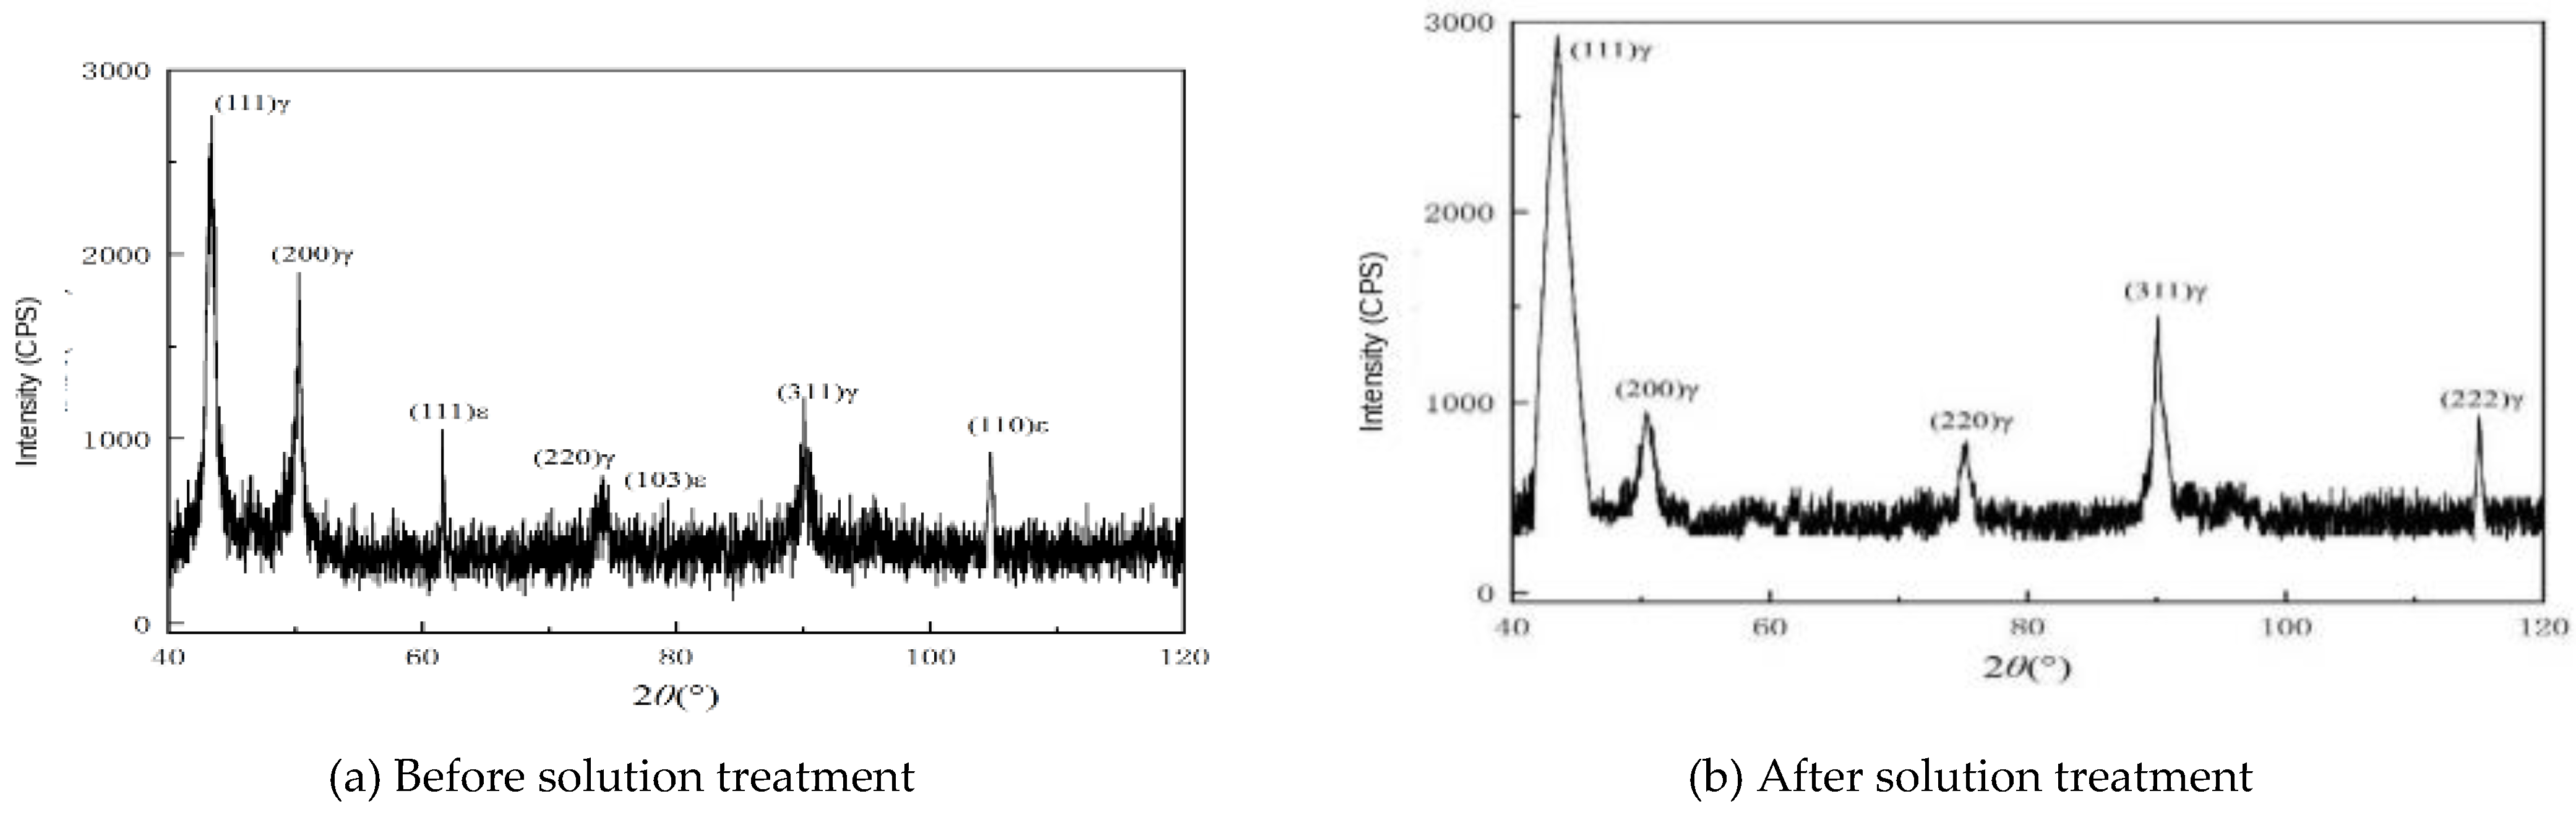

Table 1.
Chemical composition range of AH36 marine steel (wt.%)
| Grade | C | Si | Mn | Cr | Ni | Cu | Ti |
|---|---|---|---|---|---|---|---|
| AH36 | 0.18 | 0.10-0.50 | 0.90-1.60 | 0.20 | 0.40 | 0.35 | 0.08 |
Table 2.
Single-factor process parameters
| No. | Welding current/A | Arc voltage/V | Welding speed/(mm/s) |
|---|---|---|---|
| A1 | 110 | 26 | 2 |
| A2 | 130 | 26 | 2 |
| A3 | 150 | 26 | 2 |
| A4 | 170 | 26 | 2 |
| A5 | 190 | 26 | 2 |
| B1 | 130 | 24 | 2 |
| B2 | 130 | 26 | 2 |
| B3 | 130 | 28 | 2 |
| B4 | 130 | 30 | 2 |
| B5 | 130 | 32 | 2 |
| C1 | 130 | 26 | 2 |
| C2 | 130 | 26 | 4 |
| C3 | 130 | 26 | 6 |
| C4 | 130 | 26 | 8 |
| C5 | 130 | 26 | 10 |
Table 3.
Chemical compositions of the Fe-Mn-Si SMA weld metal and YJ501-1 weld metal (wt.%)
| Material(%) | Si | Mn | Ni | Cr |
|---|---|---|---|---|
| Fe-Mn-Si SMA welding seam | 0.4 | 1.5 | 0.5 | 0.9 |
| YJ501-1 welding seam | 0.37 | 1.37 | 0.94 | 0.06 |
Disclaimer/Publisher’s Note: The statements, opinions and data contained in all publications are solely those of the individual author(s) and contributor(s) and not of MDPI and/or the editor(s). MDPI and/or the editor(s) disclaim responsibility for any injury to people or property resulting from any ideas, methods, instructions or products referred to in the content. |
© 2026 by the authors. Licensee MDPI, Basel, Switzerland. This article is an open access article distributed under the terms and conditions of the Creative Commons Attribution (CC BY) license (http://creativecommons.org/licenses/by/4.0/).
Copyright: This open access article is published under a Creative Commons CC BY 4.0 license, which permit the free download, distribution, and reuse, provided that the author and preprint are cited in any reuse.