

Submitted:
18 September 2026
Posted:
20 September 2026
You are already at the latest version
Abstract
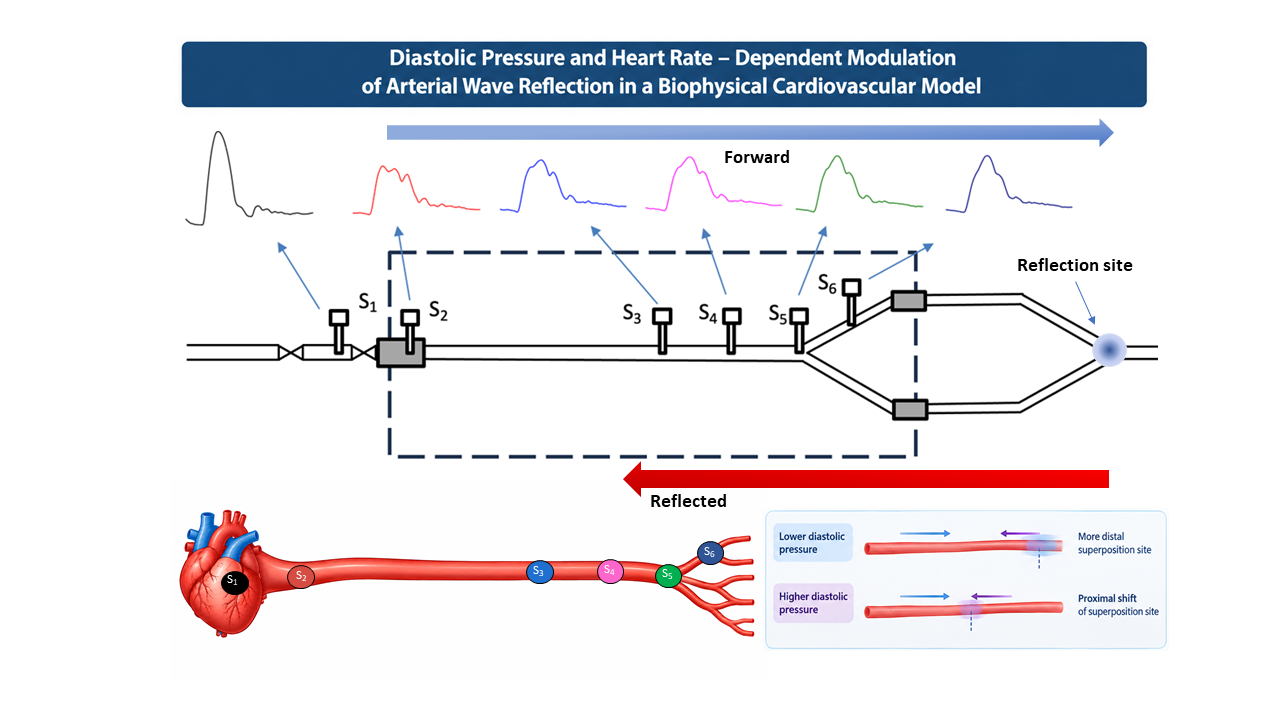
Arterial pressure waveforms are shaped by vascular biomechanics and wave reflection, processes that become increasingly relevant in hypertension and vascular aging. This study aimed to investigate how heart rate (pump frequency) and baseline diastolic pressure modulate pressure waveform morphology and wave reflection in a controlled biophysical cardiovascular model. A biophysical model mimicking the aorta and its major branches was equipped with custom pressure sensors, enabling simultaneous recordings at multiple locations along the system. Measurements were performed at diastolic pressures of 60, 80, 100, and 120 mmHg and pump frequencies ranging from 24 to 120 bpm. The downstream tube length and reflection site configuration were systematically varied to evaluate the effects of distal boundary conditions. Increasing pump frequency resulted in higher pressure amplitudes and a steeper systolic upstroke (increased dp/dt). Peak pressure amplitude increased from approximately 105 mmHg at 24 bpm to 145 mmHg at 120 bpm. At higher frequencies and longer reflection pathways, forward and reflected wave components became more clearly separated, whereas branched distal networks produced complex multi-reflection patterns. Wave reflection in this experimental system is strongly dependent on heart rate, diastolic pressure, and distal tube configuration, providing mechanical insight into central pressure augmentation in hypertensive and aging-related conditions.
Keywords:
wave reflection
; arterial pressure
; diastolic loading
; biophysical model
1. Introduction
During young age, human arterial system is described as an optimally engineered network designed to transform the left ventricle’s pulsatile output into steady, laminar flow distributed through peripheral capillaries [1]. This system develops into a complex, hierarchical vascular tree characterized by progressively decreasing diameter and compliance, extending from large central elastic arteries down to fine arterioles and capillaries [2]. The systemic design incorporates autonomic regulatory processes—encompassing biochemical, cellular, neurovascular and physical mechanisms—which are essential for maintaining blood pressure and flow homeostasis across both the micro- and macrocirculation. While the biochemical, cellular, and neurovascular contributions to the crucial link between macrocirculatory pressure and microcirculatory flow are typically detailed qualitatively in scientific literature [3,4,5], the physical contributions to these linkages are yet to be fully explored quantitatively, mandating the application of fluid dynamics, wave propagation, and impedance matching to vascular flow.
Regarding physical phenomena within the vascular tree, the Central Aortic Pressure Waveform (CAPW) represents an important tool for diagnosing cardiovascular status and predicting cardiovascular diseases [6,7]. As central pressure directly reflects the load on the left ventricle and vital organs, analysis of its waveform offers a more accurate prediction of cardiovascular events and target organ damage compared to peripheral arterial pressure [8,9].
Ventricular contraction generates forward pressure and flow waves which, upon propagation, encounter impedance mismatches (e.g., bifurcations or stiffness changes) and subsequently create reflected (backward) waves that return to the aorta [10]. The observed CAPW is fundamentally the superposition of these forward and backward components. Wave reflection is clinically critical as it profoundly affects left ventricular afterload and coronary perfusion, correlating directly with arteriosclerosis and the prediction of cardiovascular events [11,12]. When the reflected wave returns early during systole, it increases late systolic pressure, raising left ventricular afterload [13]. Quantification of pulse wave reflection relies on Wave Separation Analysis, decomposing the CAPW into forward and backward components to derive metrics like the Reflection Magnitude, Reflection Index and Pulse Transit Time [14,15]. Given the clinical impracticality of invasive flow measurement, non-invasive methods have evolved to estimate the aortic flow waveform required for separation analysis. Initial approaches used a triangular flow approximation [16], widely adopted in commercial systems [17]. More advanced methods include using averaged physiological flow waveforms [18] and, recently, personalized and lognormal flow models [19,20]. Despite these methodological advancements, accurately estimating non-invasive aortic flow remains a key challenge to further refining the precision of CAPW separation analysis.
The study by Afkhami and Johnson [21] addresses the critical role of reflected pressure waves in understanding vascular aging, asserting that traditional metrics like Reflection Time and Augmentation Index (AI) cannot be accurately interpreted as a simple “round trip.” They challenge the conventional model by demonstrating that distal load properties, rather than solely vascular health, are key modulators of these indices, particularly in older populations where Reflection Time plateaus despite increasing Pulse Wave Velocity.
Pulsatile load is an important, yet often underrecognized, determinant of left ventricular (LV) mass in aortic stenosis. Chirinos et al. [22] demonstrated that reflected waves are significantly associated with LV mass, implicating late systolic load as a major contributor to LV hypertrophy in this condition. Extending this understanding, Mitchell [23] examined the pathophysiological consequences of increased pressure pulsatility and aortic stiffness, showing that elevated local pulsatile pressures and strains promote arterial wall damage and inflammation, thereby increasing the likelihood of plaque rupture and subsequent cardiovascular events in individuals with atherosclerotic disease. Similarly, in a 15-year prospective study involving 1,272 participants, Wang et al. reported that greater backward wave amplitudes (Pb) were independently associated with cardiovascular mortality after adjustment for age, height, and heart rate, underscoring the prognostic importance of wave reflections in long-term outcomes [13]. Building on these findings, recent work has introduced reference equations for pulse wave velocity (PWV), augmentation index (AIx), and wave components to enable standardized interpretation across adult populations [24]. Collectively, these advances highlight the clinical relevance of wave reflection and pulsatile load parameters and support their integration into routine cardiovascular risk assessment and management.
The aforementioned methodologies for pulse wave analysis often necessitate prolonged acquisition of waveforms over accessible arteries in clinical settings. These methods are frequently limited by patient cooperation, the skill set of the technicians performing the measurements, and the presence of numerous recording artifacts. This context created a need for constructing a biophysical model upon which waveforms could be generated under strictly controlled laboratory conditions. Waveforms generated using such a biophysical model would be better suited for mathematical analysis, which could then be extrapolated to the living human vascular system. Therefore, the aim of our study was the construction of a cardiovascular system biophysical model—analogous to the human system -and the analysis of its pressure waveforms to investigate the influence of diastolic pressure values and cardiac pump frequency on the occurrence of reflected waves.
2. Materials and Methods
2.1. Biophysical Model
The cardiovascular system model used in this study was based on a previously published biophysical model developed in our laboratory [25,26]. A schematic representation of the experimental setup is shown in Figure 1.
The model comprised a peristaltic pump, silicone tubing, one-way valves (V), a reservoir, a data acquisition system, manometer (M) and pressure sensors (S1-S6) arranged to reproduce the main functional elements of the arterial circulation. During all measurements, the pool the cardiovascular model—designed to mimic the aorta and its major branches—was filled with distilled water, ensuring that all tubing segments were fully submerged in order to maintain thermal stability and mechanical support. Behind the pool, the silicone tubes merged again into one tube, and merging point was the reflection site. Tubes of different lengths to the point of reflection were used (R1-R5).
2.2. Sensors and Data Acquisition
A custom pressure-sensing module was designed and developed in our laboratory. The module was implemented using surface-mount device (SMD) components mounted on a compact printed circuit board (PCB). An SPD-015 pressure transducer was employed for all pressure measurements.
Pressure recordings were obtained at six predefined locations along the aortic model and its branches: proximal to the valve (upstream), distal to the valve (downstream), along the aortic segment at a distance of 10 cm from the valve, at the aortic bifurcation, and within one of the aortic branches. For each measurement site, the tubular port of the pressure sensor was introduced through the wall of the silicone tubing, allowing direct hydraulic coupling between the working fluid and the sensor’s active sensing element.
Analog signals from the sensor module were digitized using a USB-6001 data acquisition (DAQ) device (National Instruments, USA) with a 14-bit resolution. Data acquisition and storage were performed using LabVIEW software (National Instruments, USA). All pressure signals were visualized in real time on a monitoring interface.
2.3. Fluid and Pump
A 40% (v/v) ethyl alcohol solution, with a dynamic viscosity of 2.76 mPas, was used as the working fluid to simulate the hemodynamic behavior of the cardiovascular system within the biophysical model. The experiments were conducted under strictly controlled laboratory conditions, with a constant ambient temperature of 21 °C and relative air humidity below 10%. Under these conditions, the viscosity of the working fluid remained stable throughout the experimental protocol.
The selected ethyl alcohol solution exhibits a viscosity comparable to that of human blood at physiological temperature (37 °C), which is typically reported in the range of 3–4 mPas, thereby supporting its use as a hemodynamically relevant and cost-effective substitute for in vitro flow modeling [27].
Flow through the system was generated using a COBE 043600-001 peristaltic perfusion pump (Lab Precision Blood Pump; flow range 0.3–10+ L/min), which allows independent adjustment of pulse wave amplitude and frequency, enabling controlled modulation of pulsatile flow conditions.
2.4. Measurement Protocol
The target diastolic pressure within the model was established by adjusting the height of Reservoir 1. Measurements were performed at four predefined diastolic pressure levels: 60, 80, 100, and 120 mmHg. A reference manometer was positioned at the same vertical level as the tubing to ensure accurate hydrostatic pressure calibration and to avoid gravitational pressure offsets.
The peristaltic pump was initially set such that the systolic pressure amplitude in the tubing at the lowest operating frequency was approximately 40 mmHg. The pump frequency was then incrementally increased after every 6–7 pulsatile cycles to allow transient stabilization of the flow and pressure waveforms. The operating frequency range spanned from 24 beats per minute (bpm) to 120 bpm, with a uniform step size of 6 bpm between successive measurement points.
Following completion of each measurement series, the downstream branch of the model located after the tank was replaced with an alternative branch of different tubing length to modify the effective arterial pathway. The entire experimental protocol was then repeated under identical pressure and frequency conditions in order to assess the influence of branch length on wave propagation and reflection characteristics.
3. Results
Figure 2 illustrates the pressure waveforms corresponding to a single cardiac cycle, recorded at pump frequencies between 24 and 120 bpm, at the point 40 cm downstream from the location of sensor 5.
Figure 3 demonstrates representative input pressure waveforms obtained at three pump frequencies, demonstrating frequency-dependent alterations in waveform morphology, cycle duration, and amplitude consistency across all sensor channels (S1–S6). Increasing pump frequency resulted in progressive shortening of the cardiac cycle, a steeper systolic upstroke, and enhanced diastolic pressure decay. At higher frequencies, the emergence of secondary waveform features and increased waveform distortion suggests a nonlinear interaction between the peristaltic pump dynamics and the compliance–resistance characteristics of the experimental model.
Figure 4 (A–D) compares pressure waveforms recorded at different pump frequencies for varying downstream tubing lengths measured relative to sensor 5. Panels A, C, and D show waveforms obtained at 24, 60, and 120 bpm for tubing lengths of 40, 100, and 120 cm, respectively, whereas panel B presents measurements at 24, 48, and 120 bpm for a tubing length of 70 cm.
These figures illustrate the combined effects of pump frequency and effective arterial pathway length on waveform morphology, temporal delay, and amplitude modulation. Progressive increases in tubing length resulted in a systematic phase shift and attenuation of the pressure wave, while higher pump frequencies amplified waveform distortion and altered reflection characteristics. Together, these observations highlight the frequency- and distance-dependent nature of wave propagation and reflection phenomena in the biophysical cardiovascular model.
Figure 5 represents pressure waveforms recorded from sensor (S1-S6) at the reference point (RP) downstream from the tank, illustrating waveform modulation and pressure wave reflection induced by distal boundary conditions.
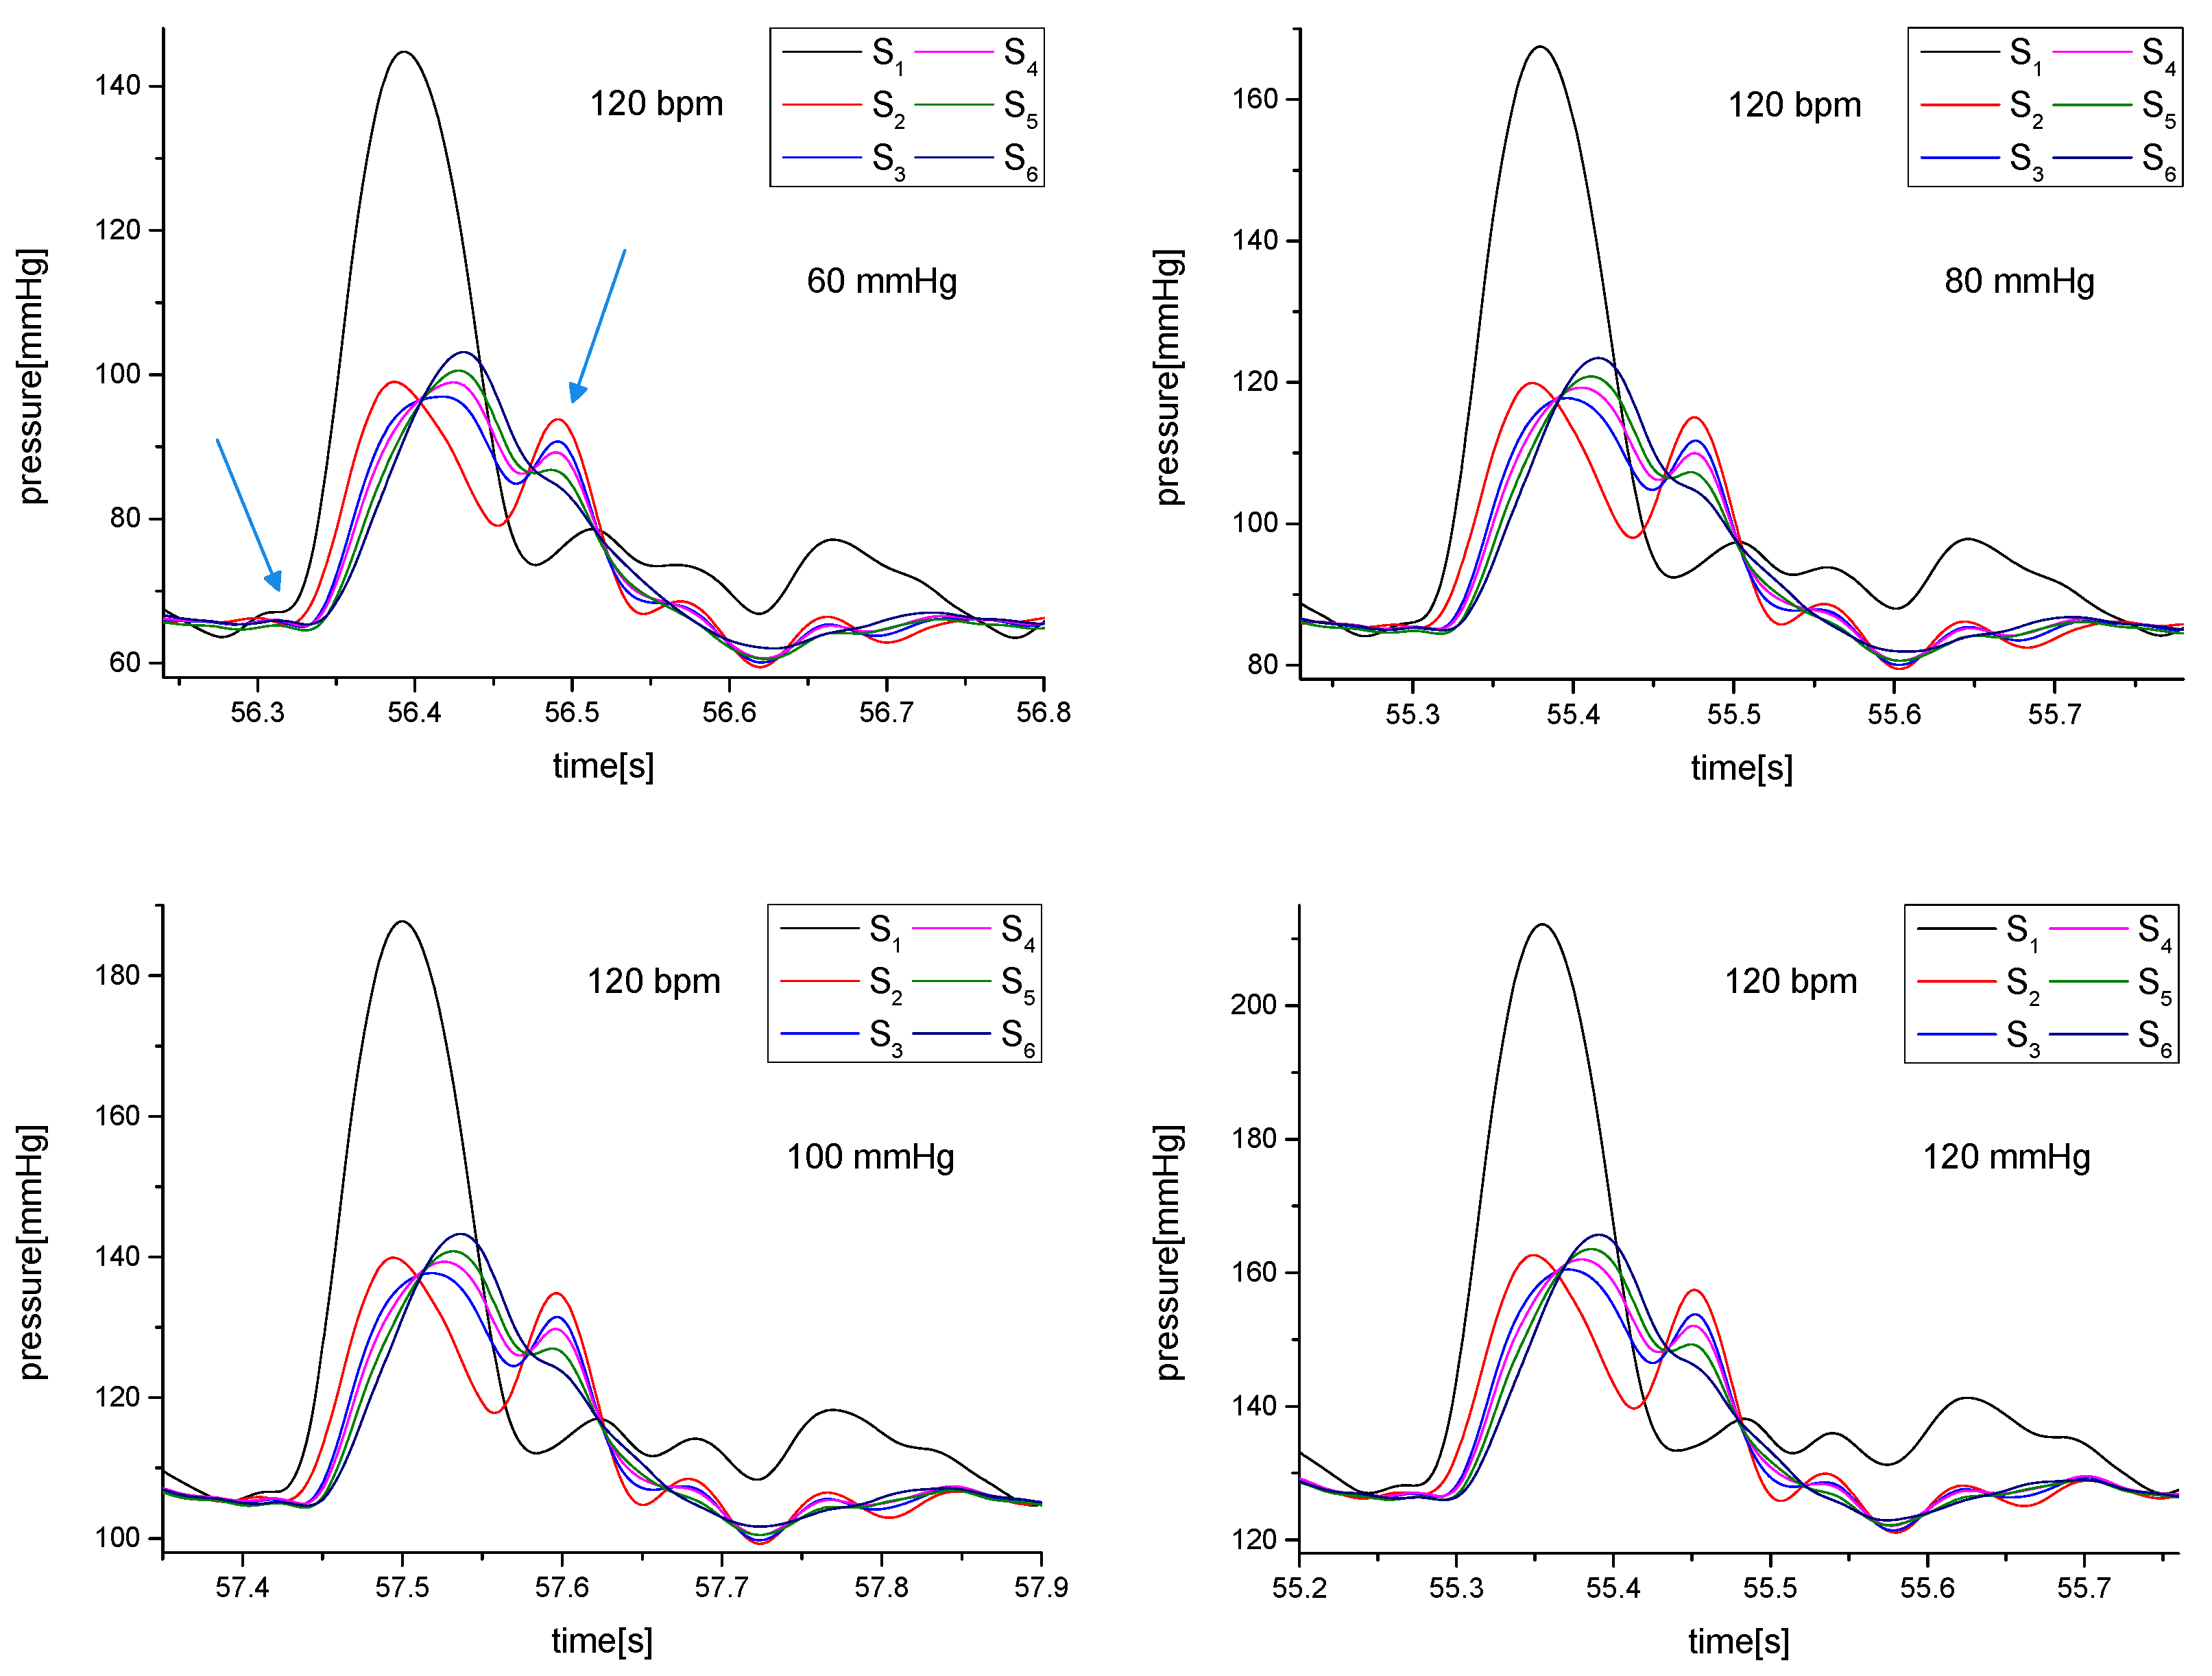
Figure 6 demonstrates that increasing diastolic pressure systematically alters pressure waveform amplitude and morphology, indicating pressure-dependent modulation of wave propagation and reflection dynamics under high-frequency pulsatile flow conditions.
4. Discussion
Tubing lengths of 40 cm and 70 cm measured from the position of sensor 5 to the merge site were selected because they anatomically and physiologically correspond to presumed major sites of wave reflection in the human arterial tree, such as the femoral bifurcation and the peripheral vasculature of the lower limbs. In addition to these physiologically relevant lengths, tubing lengths of 100 cm and 120 cm were also employed. Although these distances do not directly correspond to realistic human arterial path lengths, they proved highly useful for isolating the origin of the reflected wave and for experimentally validating the location of reflection sites within the model. Similar experimental strategies for identifying and validating arterial reflection sites have been reported in recent in vitro and computational studies of arterial wave propagation and impedance mismatching [28,29].
Comparison of the input signals shown in Figure 2 demonstrates that increasing pump frequency results in a shortening of the period of the incident pulsatile wave (signal from S1). The pressure amplitude increases from approximately 105 mmHg at 24 bpm to approximately 145 mmHg at 120 bpm. Figure 3 presents amplitude variations for three pump frequencies over an identical time window of 0.7 s. At low pump frequencies, the rate of pressure change () is relatively small, as the roller of the peristaltic pump rotates more slowly, allowing fluid to be ejected over a longer duration downstream of the valve. With increasing pump frequency, the ejection time is reduced, while the peak fluid pressure increases, resulting in a steeper systolic upstroke and a higher . This frequency-dependent modulation of systolic upstroke dynamics is consistent with contemporary concepts of ventricular–arterial coupling and pulsatile flow generation [30].
At a pump frequency of 24 bpm, pressure signals recorded from the downstream sensors appear nearly superimposed and closely resemble the morphology of the incident wave. As pump frequency increases, the signals progressively change shape and begin to separate temporally, revealing measurable inter-sensor time delays. The waveforms no longer exhibit identical morphology and instead represent a superposition of multiple wave components, indicating the presence of wave reflection phenomena. Additional evidence for wave reflection is provided by the pressure amplitude distribution across sensors. In the absence of reflected waves, pressure amplitudes would be expected to decrease monotonically along the tubing due to viscous losses and pressure gradients. However, as shown in Figure 4 (A–D), pressure amplitudes increase at downstream sensors. For example, in Figure 4A at 60 bpm and 120 bpm, the maximum pressure amplitude at sensor 5 exceeds that at sensor 2, consistent with constructive interference between the incident and reflected waves. This behavior agrees with modern wave separation theory and contemporary arterial hemodynamics frameworks [31,32]. The reflected wave subsequently undergoes secondary reflection at the valve (re-reflection), which is closed during this phase of the cycle. This behavior is clearly visible in Figure 4B (middle panel, 48 bpm), where pressure amplitudes initially decrease from the first sensor toward the last (arrow 1) and then increase from the last sensor toward the first. The re-reflected wave is superimposed on the primary reflected wave (arrow 2), followed by an additional reflection event (arrow 3). These observations provide direct experimental evidence of multi-reflection dynamics within the model, a phenomenon that has also been described in recent distributed arterial network models and impedance-based analyses [29,30].
With increasing pump frequency, the reflected wave becomes progressively more distinct and easier to detect. Similarly, wave reflection becomes more pronounced with increasing tubing length, which effectively shifts the reflection site farther from the source. In Figure 4C at 60 bpm, the reflected wave is temporally separated from the forward wave, whereas at the same frequency in Figure 4D the reflected wave is superimposed with the re-reflected component. At high pump frequencies (120 bpm), the forward wave becomes clearly identifiable without superposition with reflected components, and pressure amplitudes decrease from sensor 2 to sensor 5. Under these conditions, pulse wave velocity (PWV) can be reliably estimated because the waveforms are well separated and their peak timings can be accurately detected, in line with current PWV measurement methodologies [12,33].
When a tubing network with serial and parallel branches was placed downstream of the tank, the system behavior changed markedly (Figure 5). In this configuration, there was no single dominant reflection site; instead, multiple reflection sites were located in close proximity, giving rise to complex multi-reflection phenomena. Reflections began immediately downstream of the tank and were barely discernible at 60 bpm, whereas at 120 bpm it could be inferred that the first systolic peak recorded by the sensors represented a superposition of the forward, reflected, and re-reflected waves. Subsequently, the signal evolved into a new composite superposition of multiple wave components. Under these conditions, it is not possible to decompose the measured signal into its original constituent waves due to the presence of multiple closely spaced reflection sites and overlapping superpositions. Similar complexities have been reported in recent arterial bifurcation models and studies of peripheral impedance mismatching [28,32].
Comparison of results obtained at different diastolic pressures for a fixed pump frequency reveal, at first glance, no major differences in pressure waveform morphology. However, despite the nearly identical waveform shapes, a consistent temporal shift is observed between the onset of the forward wave (foot of the wave) and the peak of the subsequent wave component, as indicated by arrows in Figure 6. As diastolic pressure increases, the time interval between these peaks decreases. This behavior is attributable to an increase in PWV with rising diastolic pressure, a relationship that has been theoretically and experimentally demonstrated previously [34] and is now further confirmed by the present results. This pressure dependence of PWV is consistent with the nonlinear elastic behavior of arterial walls and has been widely reported in both experimental and clinical studies [12,33].
This finding is physiologically important, as diastolic pressure is elevated in hypertension, and an increase in PWV under such conditions would shift the site of wave superposition proximally, toward the heart and the proximal aorta, thereby increasing central systolic pressure. Moreover, with aging, the arterial Young’s modulus increases, leading to a further rise in PWV; consequently, even at lower diastolic pressures, the site of wave superposition is displaced toward the wave source (systole of the heart). These mechanisms are now recognized as key contributors to systolic hypertension and increased cardiovascular risk in older adults [12,33,34].
The reflection coefficient was difficult to quantify accurately because pressure waveforms were not measured downstream of the primary reflection site and because of the inability to separate reflected and re-reflected wave components. Nevertheless, MATLAB-based simulations performed for the present experimental configuration suggest that the reflection coefficient lies in the range of approximately 0.2–0.5. This range is consistent with reported reflection coefficients for peripheral arterial sites in recent experimental and in vivo studies [28,32].
These findings are clinically relevant because the experimental data show that pressure amplitudes at sensors 4 and 5 exceed those at sensor 2 at pump frequencies between 60 and 120 bpm for a tubing length of 40 cm downstream of the tank (Figure 2) and at the downstream reference point (Figure 5). As these configurations most closely approximate physiological arterial geometries, the results indicate that wave reflection is a major contributor to elevated local pressure and may represent a mechanistic factor in the development of vascular pathologies, including arterial hypertension and aneurysm formation. These conclusions agree with contemporary hemodynamic theories linking enhanced wave reflection and arterial stiffening to adverse cardiovascular outcomes [30,31,32,35].
Limitations
The experimental model represents a simplified approximation of the human arterial system and therefore does not fully reproduce realistic arterial geometry, viscoelastic wall behavior, or active vascular regulation. Moreover, the use of a Newtonian working fluid and a peristaltic pump limits physiological realism with respect to blood rheology and ventricular ejection dynamics. Finally, the absence of pressure measurements distal to the primary reflection site precluded direct quantification of the reflection coefficient and hindered complete separation of forward and reflected wave components.
5. Conclusions
The present experiments demonstrate that pressure wave reflection and re-reflection can be reliably detected and systematically analyzed under biophysically controlled conditions that simulate the cardiovascular system. Increasing pump frequency resulted in higher pressure amplitudes, a steeper systolic upstroke (increased dp/dt), and temporal separation of sensor signals, enabling clear identification of reflected wave components and reliable estimation of pulse wave velocity (PWV).
Wave reflection was shown to depend strongly on effective arterial pathway length, downstream configuration, and baseline (diastolic) pressure. Notably, increasing diastolic pressure was associated with a rise in PWV and a proximal shift of the wave superposition site toward the heart, a mechanism with direct clinical relevance for central blood pressure augmentation. These findings support the concept that wave reflection contributes to elevated arterial pressure and may play a role in aneurysm formation, particularly in hypertensive and aging-related states characterized by increased arterial stiffness.
Collectively, the experimental and simulation results identify wave reflection as a key mechanistic determinant of arterial pressure dynamics and central hemodynamic loading. Improved mechanistic understanding of this process provides insight into the pathophysiology of cardiovascular disease and supports the translational relevance of wave-based biomarkers for risk stratification and therapeutic targeting.
Future Directions
Future studies incorporating variable arterial compliance, non-Newtonian blood analogues, and subject-specific geometries could further enhance physiological realism and facilitate translational investigations into hypertension, arterial stiffening, and aneurysm risk.
Author Contributions
Conceptualization, funding acquisition, data curation, formal analysis, project administration, validation and resources. I.Lj., B.S. K.Ž. and D.Ž.: Methodology, investigation, visualization, writing—review and editing, I.Lj., I.J.G., A.M.S., S.P., M.P., B.S., K.Ž. and D.Ž., writing—original draft, and supervision B.S. and D.Ž.
Funding
This work was partially supported by the Ministry of Science, Technological Development and Innovation of Republic of Serbia Grant No 200110.
Institutional Review Board Statement
Not applicable.
Informed Consent Statement
Not applicable.
Data Availability Statement
The data supporting the findings of this study are available from the corresponding author upon request.
Conflicts of Interest
The authors declare no conflicts of interest.
References
- O’Rourke, M.F.; Hashimoto, J. Mechanical factors in arterial aging: A clinical perspective. J. Am. Coll. Cardiol. 2007, 50, 1–13. [Google Scholar] [CrossRef] [PubMed]
- Tucker, T. Physics Linkages Between Arterial Morphology, Pulse Wave Reflection and Peripheral Flow. Artery. Res. 2023, 29, 46–71. [Google Scholar] [CrossRef]
- O’Rourke, M.; Nichols, W.W.; Vlachopoulos, C. McDonald’s Blood Flow in Arteries, 6th ed.; Hodder Arnold: London, UK, 2011. [Google Scholar] [CrossRef]
- Caro, C.G.; Pedley, T.J.; Schroter, R.C.; Seed, W.A. The Mechanics of the Circulation, 2nd ed.; Cambridge University Press, 2012. [Google Scholar] [CrossRef]
- Zamir, M. Hemo-dynamics; Springer International: Switzerland, 2016. [Google Scholar] [CrossRef]
- Sequi-Dominguez, I.; Cavero-Redondo, I.; Alvarez-Bueno, C.; Pozuelo-Carrascosa, D.P.; Nunez de Arenas-Arroyo, S.; Martinez-Vizcaino, V. Accuracy of pulse wave velocity predicting cardiovascular and all-cause mortality. A systematic review and meta-analysis. J. Clin. Med. 2020, 9, 2080. [Google Scholar] [CrossRef] [PubMed]
- Flores Geronimo, J.; Corvera Poire, E.; Chowienczyk, P.; Alastruey, J. Estimating central pulse pressure from blood flow by identifying the main physical determinants of pulse pressure amplification. Front. Physiol. 2021, 90, 608098. [Google Scholar] [CrossRef] [PubMed]
- Roman, M.J.; Devereux, R.B.; Kizer, J.R.; et al. Central pressure more strongly relates to vascular disease and outcome than does brachial pressure: The strong heart study. Hypertension 2007, 50, 197–203. [Google Scholar] [CrossRef] [PubMed]
- Zócalo, Y.; Bia, D. Central pressure waveform-derived indexes obtained from carotid and radial tonometry and brachial oscillometry in healthy subjects (2–84 Y): Age-Height-and sex-related profiles and analysis of indexes agreement. Front. Physiol. 2022, 2530, 774390. [Google Scholar] [CrossRef] [PubMed]
- Westerhof, N.; Sipkema, P.; Bos, G.V.D.; Elzinga, G. Forward and backward waves in the arterial system. Cardiovasc. Res. 1972, 6, 648–656. [Google Scholar] [CrossRef] [PubMed]
- Zamani, P.; Jacobs, D.R., Jr.; Segers, P.; et al. Reflection magnitude as a predictor of mortality: The multi-ethnic study of atherosclerosis. Hypertension 2014, 64, 958–964. [Google Scholar] [CrossRef] [PubMed]
- Laurent, S.; Boutouyrie, P. Arterial stiffness: A new biomarker and therapeutic target in hypertension. Cardiovasc. Res. 2020, 116, 933–945. [Google Scholar] [CrossRef] [PubMed]
- Wang, K.L.; Cheng, H.M.; Sung, S.H.; et al. Wave reflection and arterial stiffness in the prediction of 15-year all-cause and cardiovascular mortalities: A community-based study. Hypertension 2010, 55, 799–805. [Google Scholar] [CrossRef] [PubMed]
- Qasem, A.; Avolio, A. Determination of aortic pulse wave velocity from waveform decomposition of the central aortic pressure pulse. Hypertension 2008, 51, 188–195. [Google Scholar] [CrossRef]
- Townsend, R.R.; Wilkinson, I.B.; Schiffrin, E.L.; et al. Recommendations for improving and standardizing vascular research on arterial stiffness: A scientific statement from the American heart association. Hypertension 2015, 66, 698–722. [Google Scholar] [CrossRef] [PubMed]
- Westerhof, B.E.; Guelen, I.; Westerhof, N.; et al. Quantification of wave reflection in the human aorta from pressure alone: A proof of principle. Hypertension 2006, 48, 595–601. [Google Scholar] [CrossRef] [PubMed]
- Ding, F.H.; Li, Y.; Zhang, R.Y.; et al. Comparison of the SphygmoCor and Omron devices in the estimation of pressure amplification against the invasive catheter measurement. J. Hypertens. 2013, 31, 86–93. [Google Scholar] [CrossRef] [PubMed]
- Kips, J.G.; Rietzschel, E.R.; De Buyzere, M.L.; et al. Evaluation of noninvasive methods to assess wave reflection and pulse transit time from the pressure waveform alone. Hypertension 2009, 53, 142–149. [Google Scholar] [CrossRef] [PubMed]
- Shenouda, N.; Stock, J.M.; Patik, J.C.; et al. Personalized physiologic flow waveforms improve wave reflection estimates compared to triangular flow waveforms in adults. Am. J. Physiol.-Heart Circ. Physiol. 2021, 320, H1802–H1812. [Google Scholar] [CrossRef] [PubMed]
- Hao, L.; Zhang, Q.; Chen, X.; et al. Feasibility of waveform separation of central aortic pressure pulse based on lognormal flow wave approximation. Biomed. Signal Process Control 2022, 77. [Google Scholar] [CrossRef]
- Afkhami, R.; Johnson, S. Wave reflection: More than a round trip. Med. Eng. Phys. 2021, 92, 40–44. [Google Scholar] [CrossRef] [PubMed]
- Chirinos, J.A.; Segers, P.; Hughes, T.; Townsend, R. Large-artery stiffness in health and disease: JACC State-of-the-Art Review. J. Am. Coll. Cardiol. 2019, 74, 1237–1263. [Google Scholar] [CrossRef] [PubMed]
- Mitchell, G.F. Arterial Stiffness and Wave Reflection: Biomarkers of Cardiovascular Risk. Artery. Res. 2009, 3, 56–64. [Google Scholar] [CrossRef]
- Azizzadeh, M.; Karimi, A.; Breyer-Kohansal, R.; et al. Reference equations for pulse wave velocity and augmentation index. Sci. Rep. 2024, 14, 12345. [Google Scholar] [CrossRef] [PubMed]
- Ilić, L.; Žikić, K.; Nestorović, Z.; et al. Development of novel experimental setup for hands-on cardiovascular biophysics education. Eur. Biophys. J. 2025, 54, 521–525. [Google Scholar] [CrossRef] [PubMed]
- Žikić, K.; Žikić, D. Pulse Wave Acceleration—A Novel Biophysical Parameter. Biophysica 2026, 6, 52. [Google Scholar] [CrossRef]
- Baskurt, O.K.; Meiselman, H.J. Blood rheology and hemodynamics. Semin. Thromb. Hemost. 2003, 29, 435–450. [Google Scholar] [CrossRef] [PubMed]
- Mynard, J.P.; Smolich, J.J. One-dimensional haemodynamic modeling and wave dynamics in the entire adult circulation. Ann. Biomed. Eng. 2020, 48, 1–22. [Google Scholar] [CrossRef] [PubMed]
- Alastruey, J.; Khir, A.W.; Matthys, K.S.; et al. Pulse wave propagation in a model human arterial network: Assessment of 1-D numerical simulations against in vitro measurements. J. Biomech. 2021, 114, 110124. [Google Scholar] [CrossRef]
- Chirinos, J.A.; Segers, P.; Hughes, T.; Townsend, R. Large-artery stiffness in health and disease. JACC Cardiovasc. Imaging 2020, 13, 595–607. [Google Scholar] [CrossRef] [PubMed]
- Laurent, S.; Boutouyrie, P.; Cunha, P.G.; et al. Conceptual and methodological issues in the study of arterial stiffness. Hypertension 2020, 76, 701–709. [Google Scholar] [CrossRef] [PubMed]
- Segers, P.; Rietzschel, E.R.; De Buyzere, M.L.; et al. Noninvasive (input) impedance, wave reflection, and pulse pressure amplification. Hypertension 2020, 75, 806–815. [Google Scholar] [CrossRef] [PubMed]
- Vlachopoulos, C.; Terentes-Printzios, D.; Laurent, S.; et al. Association of estimated pulse wave velocity with survival: A secondary analysis of SPRINT. JAMA Netw. Open 2021, 4, e2030039. [Google Scholar] [CrossRef] [PubMed]
- Žikić, D.; Žikić, K. Wave propagation through a viscous fluid-filled elastic tube under initial pressure: Theoretical and biophysical model. Eur. Biophys. J. 2022, 51, 365–374. [Google Scholar] [CrossRef] [PubMed]
- Bruno, R.M.; Duranti, E.; Ippolito, C.; et al. Different impact of essential hypertension on structural and functional age-related vascular changes. Hypertension 2020, 75, 1205–1213. [Google Scholar] [CrossRef] [PubMed]
Figure 1.
Schematic representation of the cardiovascular model: peristaltic pump, reservoir 1 (closed), reservoir 2 (adjustable height), M–manometer, S1–S6—pressure sensors mounted through the wall of the elastic tube, DAQ—data acquisition device, V—one-way valve, R1–R5—different tubing length from the pool, Rp—series and parallel tubes network.
Figure 1.
Schematic representation of the cardiovascular model: peristaltic pump, reservoir 1 (closed), reservoir 2 (adjustable height), M–manometer, S1–S6—pressure sensors mounted through the wall of the elastic tube, DAQ—data acquisition device, V—one-way valve, R1–R5—different tubing length from the pool, Rp—series and parallel tubes network.
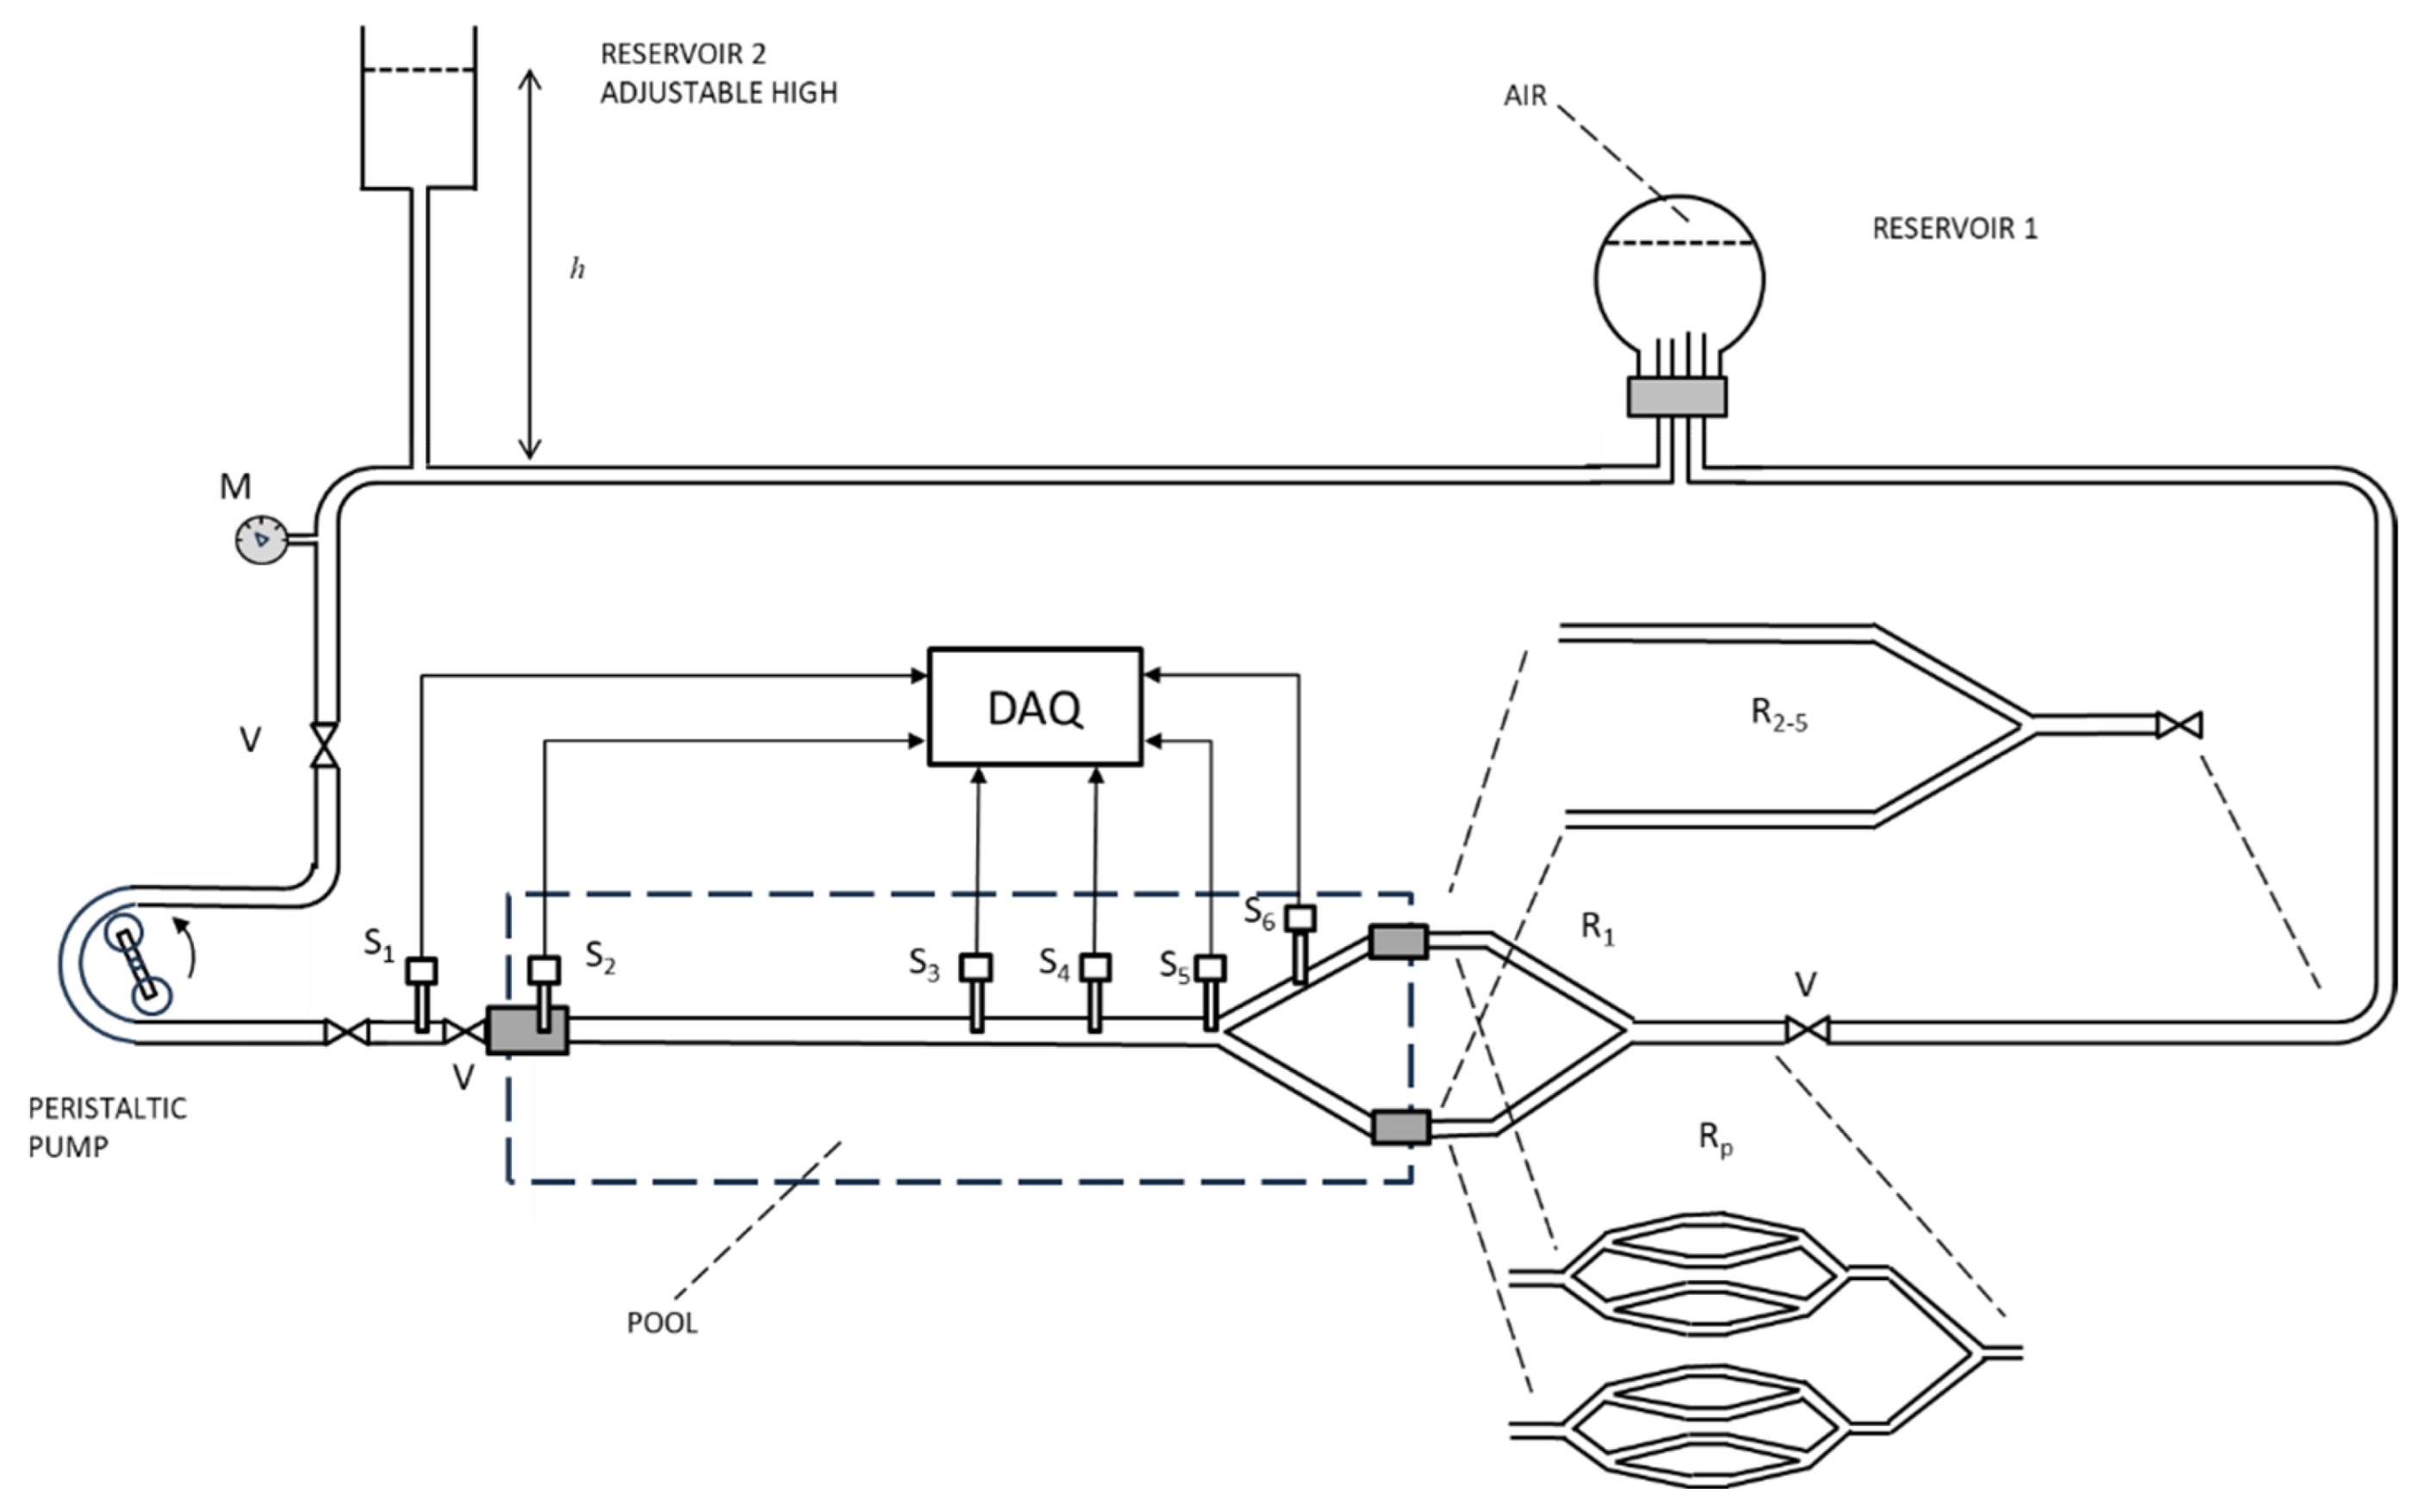
Figure 2.
Single-beat pressure waveforms at 24–120 bpm at the point 40 cm downstream from the sensor 5.
Figure 2.
Single-beat pressure waveforms at 24–120 bpm at the point 40 cm downstream from the sensor 5.
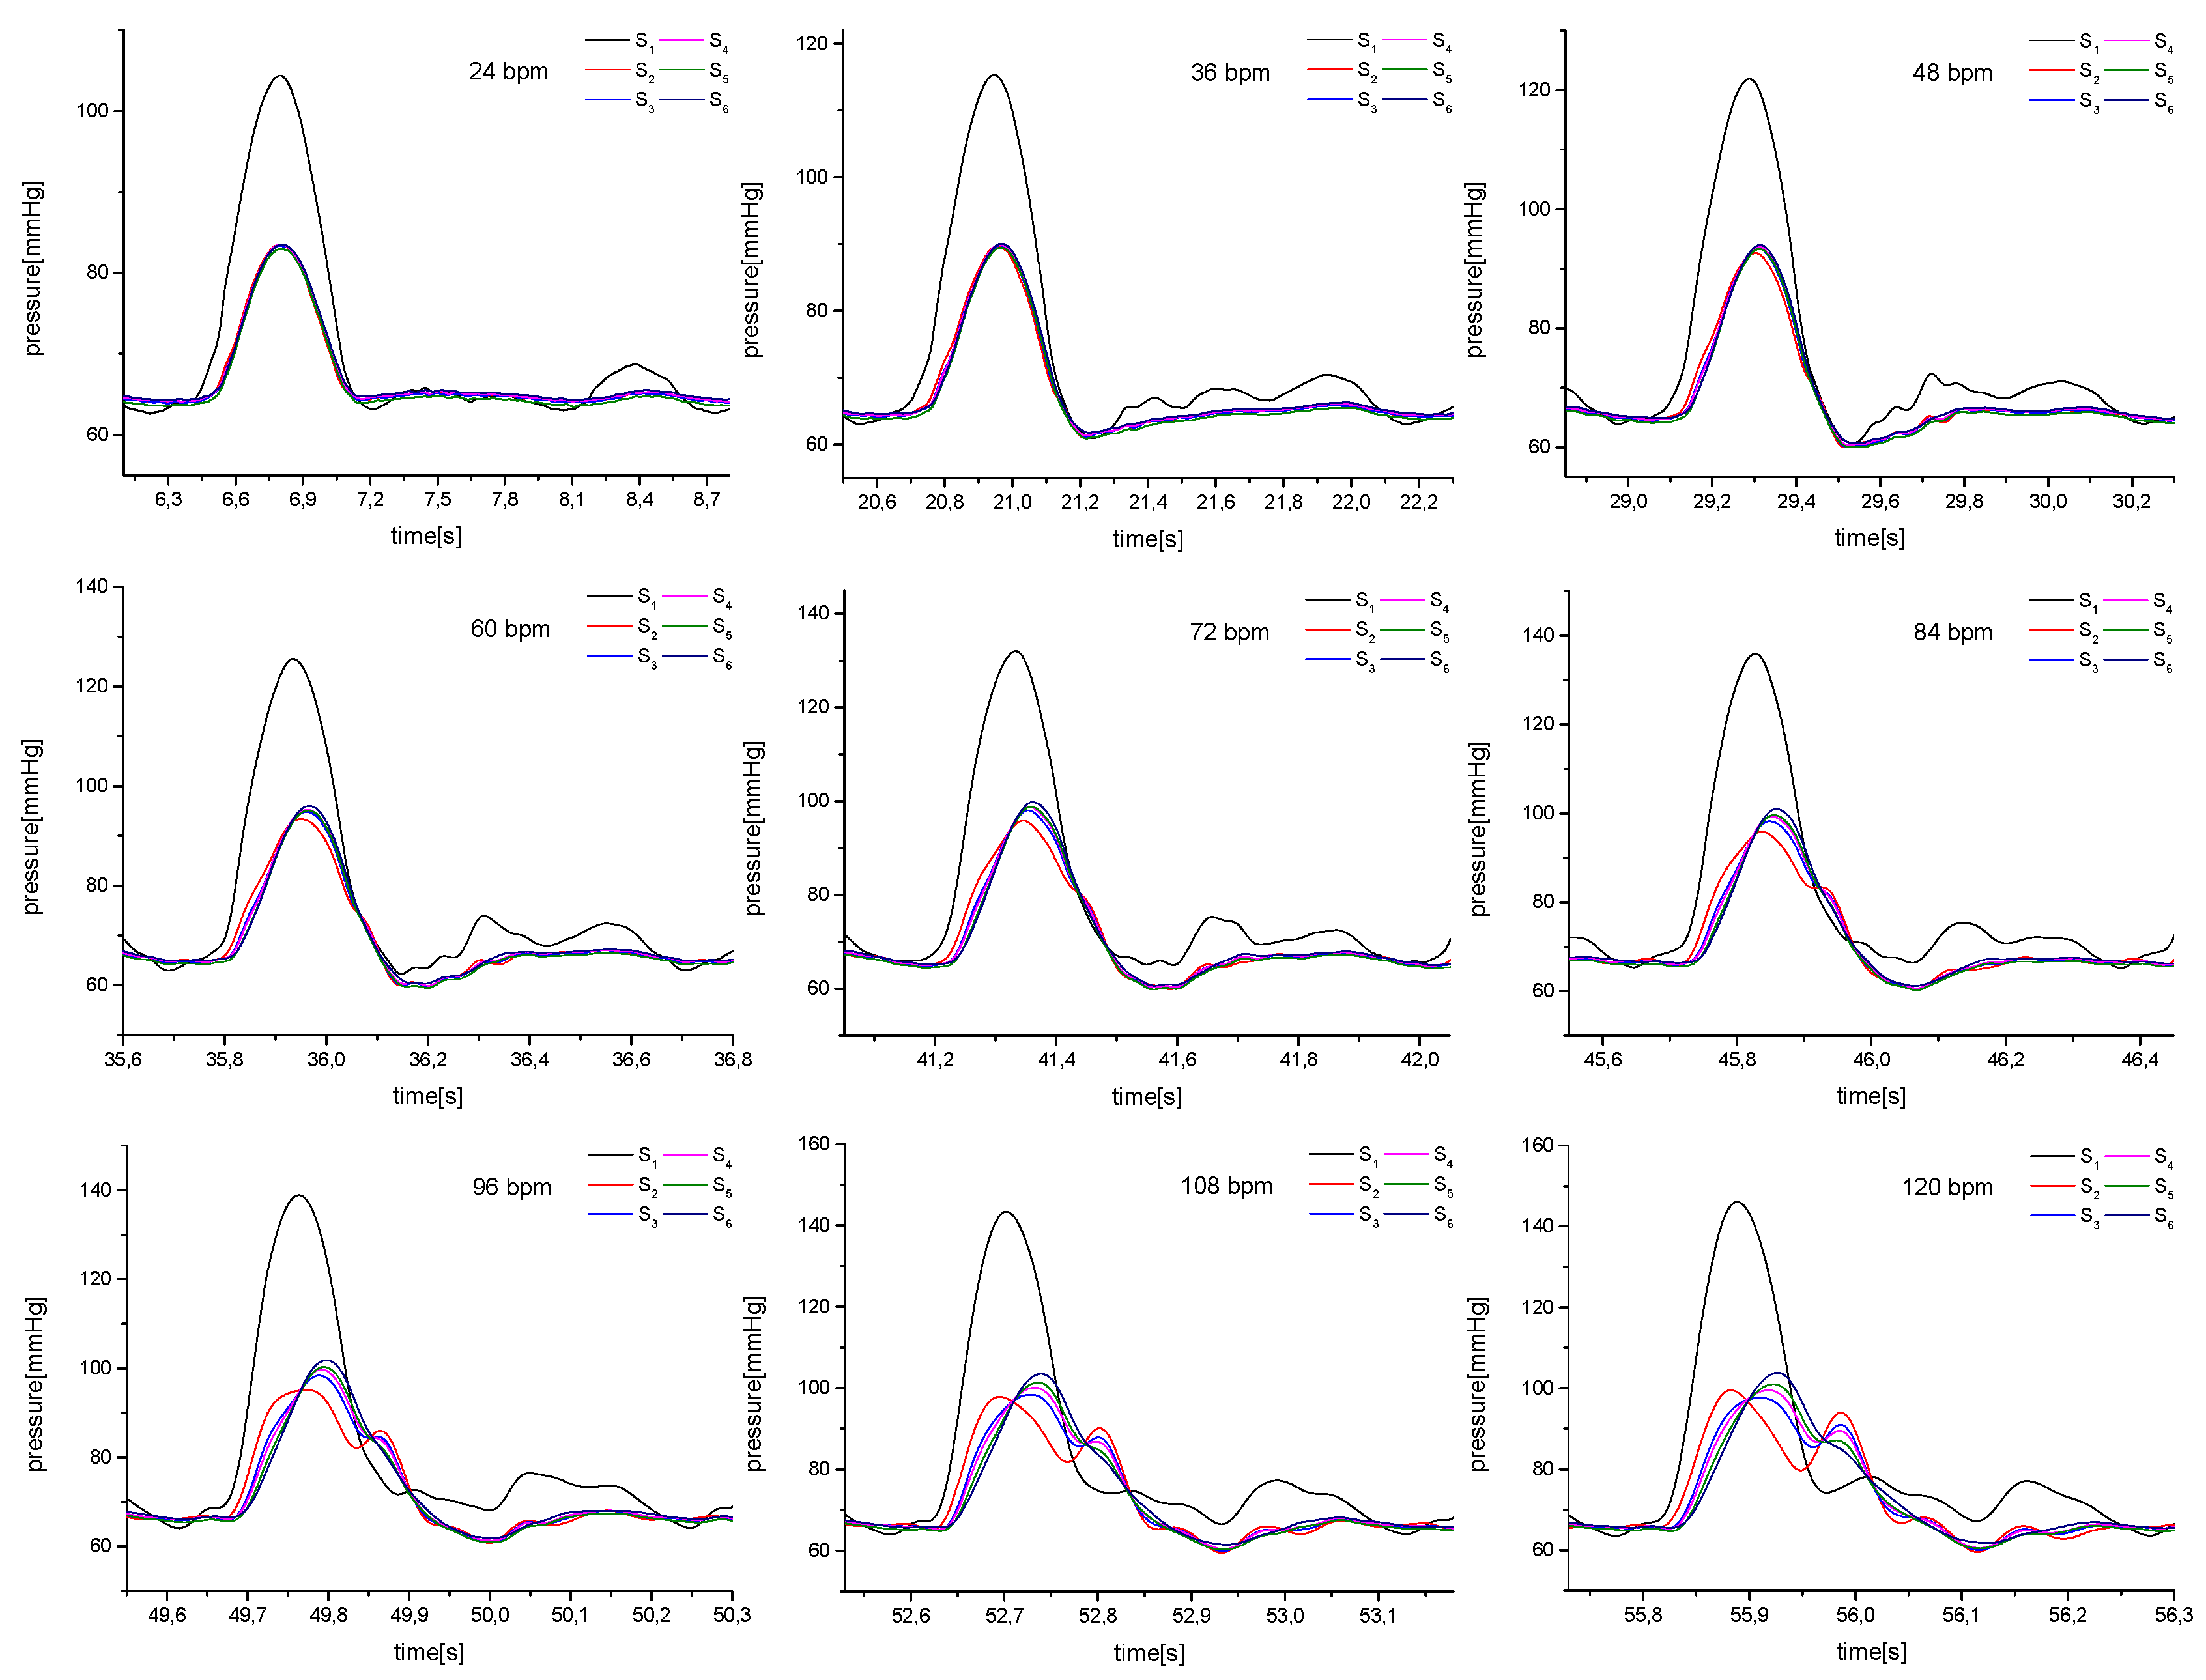
Figure 3.
Input pressure waveforms at different pump frequencies.
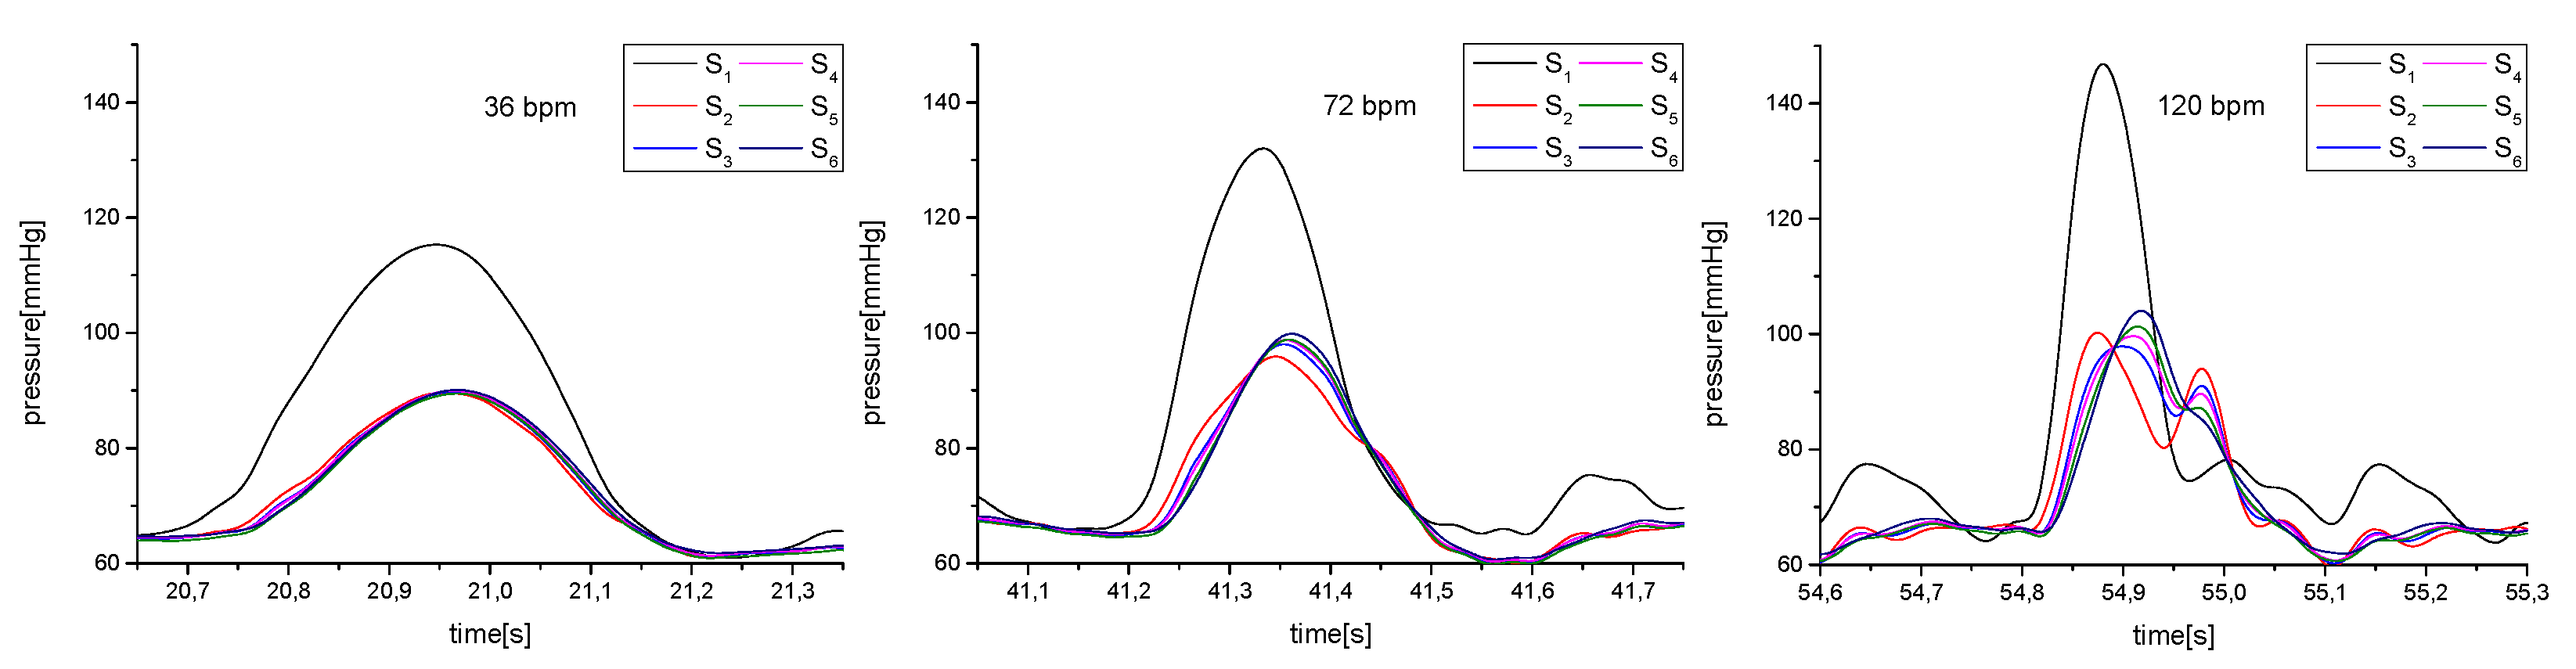
Figure 4.
Comparison of pressure waveforms at A) 24, 60, and 120 bpm for a 40-cm tubing length. B) 24, 48, and 120 bpm for a 70-cm tubing length. C) 24, 60, and 120 bpm for a 100-cm tubing length. D) at 24, 60, and 120 bpm for a 120-cm tubing length.
Figure 5.
Pressure waveforms and wave reflection at the downstream reference point when the tubing network with serial and parallel branches is added.
Figure 5.
Pressure waveforms and wave reflection at the downstream reference point when the tubing network with serial and parallel branches is added.
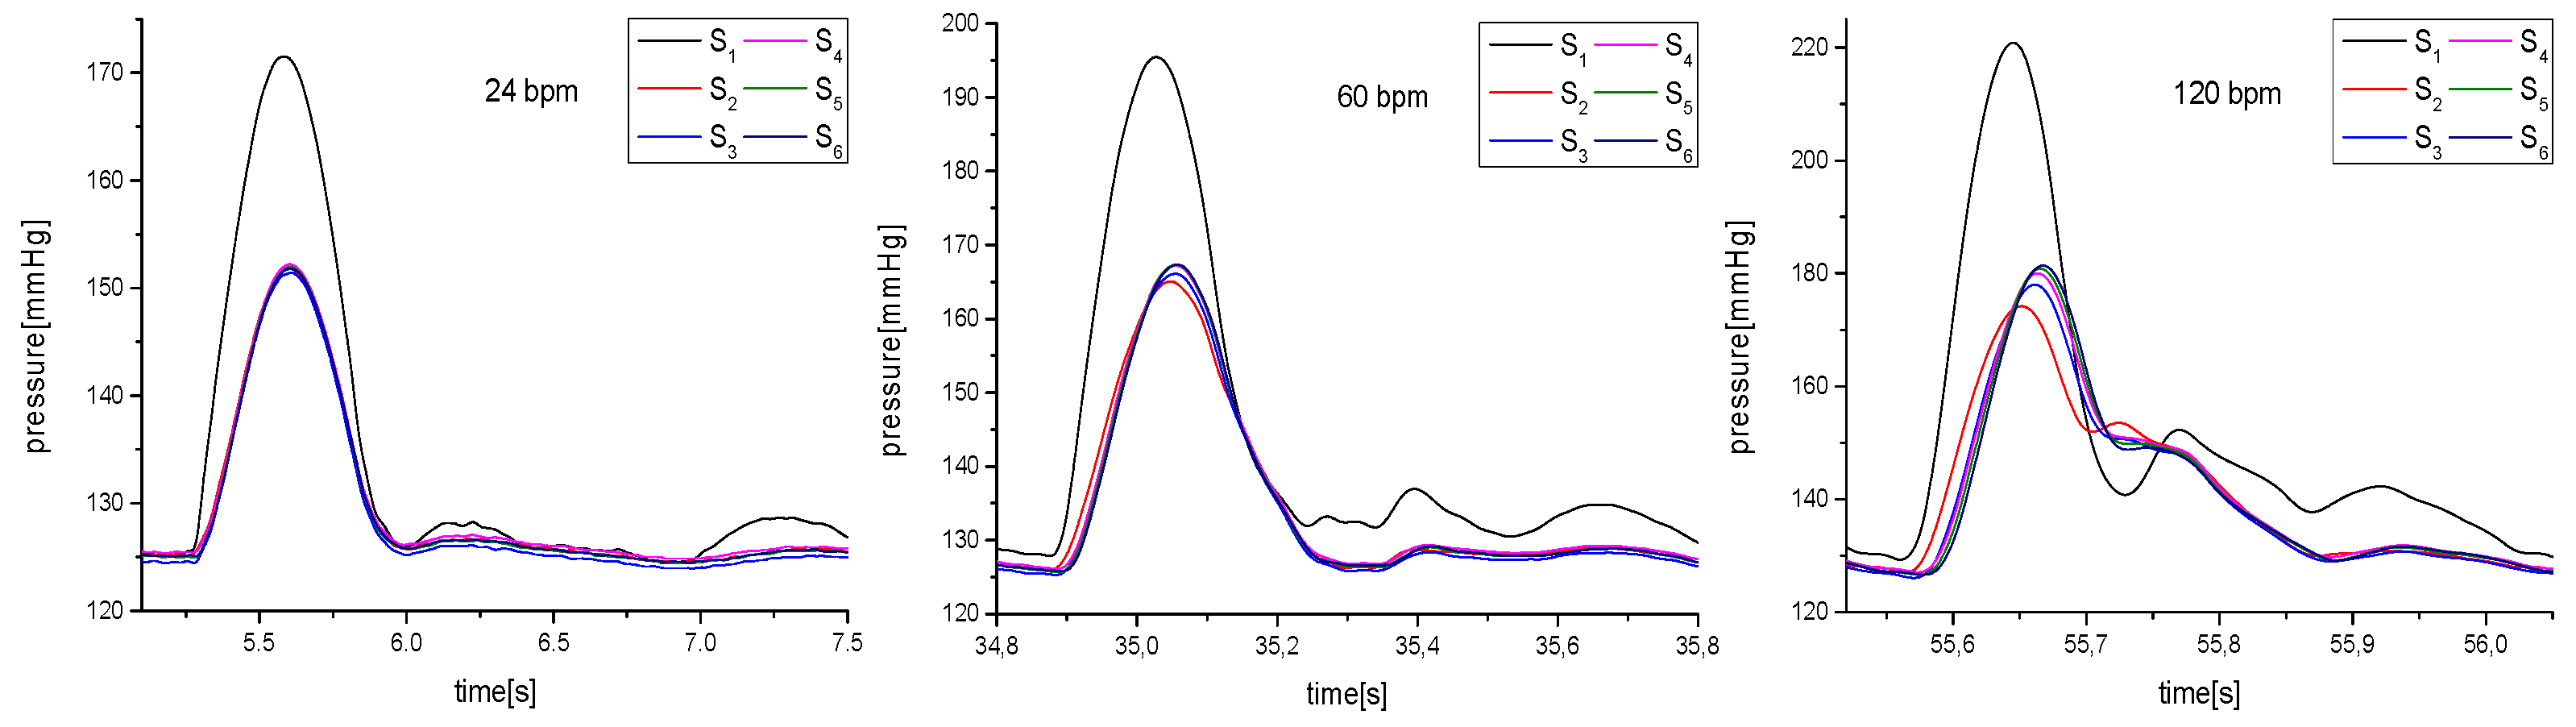
Figure 6.
Pressure waveforms recorded at 120 bpm under different diastolic pressure conditions, 40 cm downstream from sensor 5.
Figure 6.
Pressure waveforms recorded at 120 bpm under different diastolic pressure conditions, 40 cm downstream from sensor 5.
Disclaimer/Publisher’s Note: The statements, opinions and data contained in all publications are solely those of the individual author(s) and contributor(s) and not of MDPI and/or the editor(s). MDPI and/or the editor(s) disclaim responsibility for any injury to people or property resulting from any ideas, methods, instructions or products referred to in the content. |
© 2026 by the authors. Licensee MDPI, Basel, Switzerland. This article is an open access article distributed under the terms and conditions of the Creative Commons Attribution (CC BY) license (http://creativecommons.org/licenses/by/4.0/).
Copyright: This open access article is published under a Creative Commons CC BY 4.0 license, which permit the free download, distribution, and reuse, provided that the author and preprint are cited in any reuse.