

Submitted:
17 September 2026
Posted:
20 September 2026
You are already at the latest version
Abstract
The objective of the right turn on red (RTOR) regulation for cyclists is to legalise the behaviour of many cyclists at junctions. This study investigates how cyclists' behaviour changes over time when the RTOR sign is installed. A pre-post observation with a video camera system was used at two junctions. The first junction was observed continuously over a period of eight months. The second junction, however, was observed in two separate series after the RTOR sign was installed. To assess changes in behaviour, the cyclists were categorised into two main groups: those who complied with the regulations and those who violated the rules. Depending on the behaviour group, it took the cyclists up to six weeks to change their behaviour. After this period, their behaviour stabilised and no further changes were observed with most cyclists being non-compliant with the RTOR regulation. Although the RTOR regulation reduced the use of the pavement by cyclists, the number of cyclists who violate the RTOR regulation is high. It is likely that the regulation was ignored or misinterpreted, despite it being clearly stated on the sign. Therefore, critical interactions with cross traffic are likely to occur, as the cross traffic is unaware of cyclists entering the junction at red.
Keywords:
right-turn-on-red
; red light violation
; long-term observation
; cyclist behaviour
1. Introduction
Red light violation is a typical rule violation among cyclists at intersections [1] and has been already analysed in many studies (e.g. [2,3,4]). The range of red light violations is between 6.9% [4] and 97.8% [5] and is strongly influenced by different factors (e.g. traffic density [4], personnel perceived safety [6], gender [7], age [6], red signal phase duration [8] etc.).
The red light violations can be distinguished between cyclists crossing and those turning to left or right (depending on the country investigated) or using the pavement. However, turning violations are significantly more frequent compared to crossing violations [4,9,10]. The danger posed by the traffic in turning situations is probably perceived much lower, since the road users involved are travelling in the same direction subsequently. Correspondingly riding straight ahead and disregarding red lights is more common at T-junctions [6,8,9]. The risk of a collision is also considered to be lower in this situation, since the vehicles involved are proceeding in the same direction afterwards. Ihlström et al. [11] categorised the reasons for using the pavement into three main configurations: avoid interaction with cars, increase smoothness of riding and unclear infrastructure environment. However, using the pavement increases the risk of conflicts with pedestrians [12].
In general the discussion to allow right turn on red has a long history and started already in the United States in the beginning of the 1930s [13]. In the mid-1940s, cars in California were allowed to turn right at all junctions (unless there was a sign saying otherwise), even when the traffic light was red. In the early 1970s, the National Highway Traffic Safety Administration (NHTSA) recommended that all states should do the same. In the GDR (German Democratic Republic), at the end of the 1970s, turning right at a red light was allowed by special signs [14].
RTOR is an inexpensive and straightforward improvement to bicycle provisions. Meanwhile right turn on red for cyclists is now permitted in some countries (Table 1). The Netherlands was the first country in which right turn on red was allowed for cyclists [15] and in other countries this regulation was applied on their roads later [16,17,18,19]. In some states of the USA, the so-called ‘Idaho Stop Law’ [20] allows cyclists to continue riding without stopping at stop signs. In almost all countries there is no obligation to stop before turning to right, i.e. the cyclists have to give way to other road users. However, in Austria and Germany it is mandatory to stop before turning right or go straight at a T-junction. In the other countries there is no need to stop before turning. However, the cyclists have to take care of the crossing traffic anyway.
The majority of the studies have focused on red light violations at intersections, without specifically addressing right turn on red (RTOR) regulations. However, some studies investigated the effects of the RTOR regulation (Table 2). Almost all of the studies used a pre-post evaluation except Störr et al. [22] who only investigated a post phase.
No significant negative impact on the interaction between cyclists and motor vehicles were identified but critical situations with pedestrians increased [17,22]. Other studies found a shift towards more legal behaviour, i.e. not using the pavement as an alternative route [9,21] or a spillover effect from junctions with RTOR regulation to junctions without this regulation [16]. Schröter et al. [21] investigated a spillover effect between cyclist turning right and cyclists riding straight at red but did not find an effect.
Despite the fact that many cyclists obey the rules, the number of cyclists who violate them is quite high. The purpose of the RTOR regulation is twofold and can be summarised as follows: to adapt applicable law to cyclist behaviour; and to make cyclist traffic flow more smoothly and comfortably. Although some countries have extensive experience with the RTOR regulation, there is a lack of empirical and scientific studies on how the behaviour of cyclists has changed. The effects of the RTOR have been analysed in some studies, but none of these studies analysed the immediate effect, i.e. how quickly cyclists changed their behaviour. No studies were found that analysed the change of the cyclists’ behaviour over time.
The following research question has therefore been formulated: How quickly do cyclists change their behaviour in response to RTOR regulations, and at what point does their behaviour become stable?
2. Materials and Methods
2.1. Observation Sites
The observations took place at two comparable junctions. One was in Graz and the other in Vienna. At the time, Graz had installed RTORs at three junctions. With an area of 127.57 km2, Graz has 0.024 RTOR junctions per square kilometre. Consequently, it is unlikely that many cyclists are aware of this regulation or have used this option. A total of 441 RTOR signs had been installed in Vienna by that time. With an area of 414.83 km2, there were 1,063 RTOR junctions within each square kilometre.
In Graz, it was possible to travel in all directions, i.e. in the same direction as, and in the opposite direction to, the cyclist approaching the junction. Crossing traffic can come from the left or right. The junction had a separate cycle lane in the approaching direction of the cyclist. The cycle lane was not physically separated from lanes for motorised traffic; it was separated only by lane markings. On the right-hand side of the cycle lane were parking spaces for passenger cars, with the pavement for pedestrians next to them. In the leaving direction, there was no cycle lane, so cyclists had to merge with crossing traffic. The speed limit in the approaching direction is 50 km/h, while crossing traffic has a speed limit of 30 km/h. At the stop line, cyclists had a sight distance of approximately 25 metres to the left, from which crossing traffic approaches.
A similar configuration existed at the junction in Vienna. However, there was only oncoming traffic, the cyclist was approaching, i.e. cyclists are travelling against the traffic and no motor vehicles travelling in the same direction. Crossing traffic could only come from the left, i.e. there was no oncoming traffic when leaving the junction. There was a separate cycle lane in the direction from which the cyclist was approaching. This was physically separated from motorised traffic by a ramped kerb. There were no parking spaces for passenger cars next to the cycle lane. However, there was a pavement for pedestrians next to the cycle lane and only separated with lane markings. In the other direction, there was no cycle lane, so cyclists had to merge with the crossing traffic in the leaving direction. The speed limit in the approaching direction is 50 km/h, while the speed limit for crossing traffic is 30 km/h. At the stop line, cyclists have a sight distance of approximately 35 metres to the left, where crossing traffic approaches.
2.2. Observation System
A video camera system with automatic road user trajectory extraction [26] was used. The system consisted of two cameras. One camera obtained the direction from which the cyclist was approaching. The second camera captured the direction in which the cyclist was travelling, i.e. in the leaving direction. The two cameras overlapped in a certain area. The trajectories in Figure 1 explain the travelling direction of the cyclist (coloured in red) and the crossing motorised traffic (coloured in green). The colours indicate that the cyclist had red at this point and the motorised traffic green.
2.3. Field Work
A pre-post evaluation was conducted to analyse the change in cycling behaviour. The pre-evaluation phase occurred before the RTOR sign was installed at the junction. Observation took place during the day, from 06:30 to 20:30.
The Graz junction was designed to enable behaviour to be analysed over time. In Vienna, it was designed so that cyclists had already been travelling at the junction for a longer time and were thus aware of the RTOR regulation and could use it accordingly.
In Graz, observations were conducted from June 2024 to January 2025. The pre-observation period lasted two months. The post-evaluation phase took place after the RTOR sign was installed and lasted six months. No special announcements were made at the junction or in the media to highlight the RTOR possibility at this site specifically. Cyclists should change their behaviour without being influenced. This approach allowed the change in behaviour over time to be analysed, as well as whether behaviour at the junction would stabilise at a certain point.
Two observation series were planned in Vienna. The first took place in September 2024 and the second in January 2025. Both series were planned as post-evaluations, comprising one week of observation each. The junction in Vienna was used as a control junction to determine whether stabilisation of cyclists’ behaviour could be confirmed. The first series took place five month after the RTOR sign was installed, and the second series took place nine months after installation.
2.4. Behaviour Assessment
To capture the motion direction and behaviour of the cyclists, different zones of interest (ZOI) were defined (Figure 2). A cyclist passing ZOI 1 and ZOI 4 was identified as a right turn cyclist. Cyclists passing ZOI 5 and ZOI 4 were labelled as using the pavement (infrastructure) when negotiating the junction. Cyclists passing ZOI 1 and ZOI 3 were labelled as cyclists travelling straight. Road users passing through ZOI 2 and ZOI 4 indicated the crossing traffic.
To analyse the behaviour the subsequent behaviour groups were distinguished (Figure 3):
-
Compliant groups:
- ○
- Compliant Turn Group: Cyclists who stop properly before turning right at a red.
- ○
- Straight At Green: Cyclists travelling straight ahead on green.
- ○
- Green Turn Group: Cyclists turning right on green.
-
Violation Groups
- ○
- Red No-Stop Group: Cyclists turning right on red without stopping.
- ○
- Straight At red: Cyclists travelling straight ahead on red.
- ○
- Infrastructure At Green: Cyclists crossing the pavement when the lights are green.
- ○
- Infrastructure At red: Cyclists crossing the pavement when the lights are red.
- ○
- Stress Group: Cyclists entering the junction when the lights are flashing green or amber.
3. Results
3.1. Behaviour Development Over Time
For the observation of the behaviour over time (observation in Graz) a total of 38,846 observations with cyclists were identified, of which 12,033 occurred in the pre-evaluation period and 26,813 in the post-evaluation period (Table 3). Most of the observations were recorded within the ‘Straight At Green’ and ‘Green Turn’ groups (42.5% each) in the pre-evaluation period. Similar numbers were observed in the post-evaluation period. Within the ‘Straight At Green’ group, 39.1% of cyclists were recorded, compared to 40.3% in the ‘Green Turn Group’. The proportion of cyclists who were compliant with the RTOR rule (‘Compliant Turn Group’) was 0.16% in the pre-evaluation period, compared to 0.91% in the post-evaluation period. In accordance with the RTOR rule, cyclists must stop before turning right or going straight ahead. Together, all three groups accounted for 85.16% in the pre-evaluation period and 80.31% in the post-evaluation period. Therefore, the majority of cyclists were compliant with the rules. Nonetheless, the number of cyclists in the compliant groups decreased from 85.16% to 80.31%. Conversely, the total number of rule violations by cyclists increased from 14.8% to 19.7%; by the end of the post-evaluation phase, rule violations had increased by 4.9%.
Although the number of cyclists making a compliant turn was small in the pre-evaluation period (0.16%), it increased in the first week of the post-evaluation period to 0.54%. Over time, the proportion of cyclists in the ‘Compliant Turn Group’ increased to 0.91%. The number of cyclists using the infrastructure at red decreased from 1.5% to 1.2% and from 1.1% to 1.0% in the ‘Infrastructure At Green Group’. The ‘Stress Group’ remained at a similar level, with cyclists trying to cross or turn when the signal changed from green to red. No change was observed within the ‘Straight At Red’ group. During the pre-evaluation period, 2.98% of cyclists were observed, compared to 2.96% during the post-evaluation period. The biggest change was identified in the group that did not stop (the ‘Red No-Stop Group’), despite the regulation requiring them to do so. On average, there was an increase from 5.2% to 10.4%.
Figure 4 excludes the ‘Straight At Green’ and ‘Green Turn’ behaviour groups to make the changes more visible. After the RTOR signs were installed, cyclists’ behaviour changed immediately. After two weeks, the ‘Red No-Stop Group’ increased from an average of approximately 35% in the pre-evaluation period to around 50%, with some fluctuation. Nonetheless, the numbers became stable from this point onwards. The ‘Compliant Turn Group’ did not change so quickly. It took four weeks for the numbers in this group to stabilise at an average of 4.4%. The number of cyclists in the ‘Stress Group’ stabilised after one week, reaching an average of around 20%. In the ‘Straight At Red Group’, it took six weeks for the numbers to stabilise at an average of approximately 14%. There was no visible decrease in usage for the ‘Infrastructure At Green Group’. However, within four weeks of installing the RTOR sign, the number of cyclists within the ‘Infrastructure At Red Group’ had decreased to an average of around 5%.
3.2. Long-Term RTOR Junction
At the long-term RTOR junction (observation on Vienna) a total of 2,814 observations were identified (Table 4). Of these, 1,763 were recorded in the first observation series and 1,051 in the second. The majority of these were recorded within the ‘Straight at Green’ and ‘Green Turn’ groups. On average, 49.8% of observations were observed in the ‘Straight at Green Group’ (48.6% in the first series and 51.95% in the second series), and 20.2% on average in the ‘Green Turn Group’ (21.3% in the first series and 18.5% in the second series). The number of observations in the ‘Compliant Turn Group’ is rather small (0.82%), with little difference between the first (0.85%) and second (0.76%) series. On average, cyclists violating the RTOR regulation were 18 times more frequent (14.5%) than those who complied with the regulation and did not stop before turning. 14.8% did not stop before turning in the first series, compared to 14.0% in the second. 9.7% of cyclists observed were in the ‘Straight At Red’ group (9.3% in the first series and 10.4% in the second series). On average, 7.85% of cyclists used the infrastructure at red (7.9% in the first series and 7.7% in the second series), and 3.3% used the infrastructure at green (3.6% in the first series and 2.9% in the second series). On average, 1.67% of cyclists were observed in the ‘Stress Group’ (1.7% in the first series and 1.6% in the second series).
To make the behaviour more visible, the ‘Straight At Green’ and ‘Green Turn’ groups are excluded from Figure 5. It appears that the ‘Red No-Stop Group’ is the most frequent. On average, 48.3% of cyclists do not stop at the junction before turning right. The number of cyclists in the ‘Straight at Red’ group is also quite high, at an average of 32.3%. An increase in these numbers was observed between the first (30.6%) and second (35.1%) series. There was only a slight difference between the first and second series for cyclists using the infrastructure at red. A lower number of cyclists using the infrastructure at green were recorded in the second series: 9.7% compared to 12.03% in the first. The number of cyclists in the ‘Stress Group’ remained almost constant. It was 5.6% in the first series, compared to 5.5% in the second. Cyclists in the ‘Compliant Turn Group’ were the least frequent group. On average, only 2.7% of cyclists were compliant with the RTOR regulation (2.8% in the first series and 2.6% in the second).
4. Discussion
The aim of the study was to evaluate the changes of cyclist’s behaviour over time and whether the behaviour becomes stabilised at a certain point after introduction of RTOR signs at junctions. The RTOR sign was installed without any further announcement in the media. Cyclists should adjust their behaviour without being influenced.
Although the junctions in Graz and Vienna were comparable, some differences are obvious. At both junctions there was a separate cycle lane in the approach direction and cyclists needed to merge with crossing traffic when leaving. The main difference was the traffic regulation. In Graz, road users could travel in all directions. In Vienna, motor vehicles had to travel in one direction, i.e. cyclists travelling in the approaching direction could travel against the traffic, but there was no oncoming traffic when leaving. According to the infrastructure in use, there is a significant difference between the junctions. While Graz had parking spaces for passenger cars between the pavement and cycle lane, Vienna’s pedestrian pavement was not physically separated from the cycle lane.
The observation at the Graz junction was designed to analyse changes in behaviour over time. A change in cyclists’ behaviour was observed immediately after the RTOR sign was installed. Cyclists recognised the sign at the junction and began to adjust their behaviour accordingly. After approximately six weeks, almost all behaviour groups had stabilised.
It took some time for the behaviour in the ‘Compliant Turn Group’ to stabilise. After approximately four weeks, 4.4% of cyclists were in the ‘Compliant Turn Group’ (excluding the ‘Straight At Green’ and ‘Green Turn Group’). In Vienna, the proportion of cyclists in the ‘Compliant Turn Group’ is somewhat lower at 2.73%. At both junctions the number in the ‘Compliant Turn Group’ is lower than in the findings of Schröter at al. [21].
The ‘Red No-Stop Group’ showed the fastest change of all the groups (excluding the ‘Straight At Green’ and ‘Green Turn Group’). Cyclists modified their behaviour within two weeks of the RTOR sign being installed. Subsequently, their behaviour stabilised at approximately 50%. By the end of the post-period, the ‘Red No-Stop Group’ increased again. Graz is a university town, so many students travel by bicycle. Therefore, the final two to three weeks of observation were during the Christmas period and at the beginning of the year, and should be treated with caution due to the holiday season, which may have influenced the numbers. Nevertheless, the ‘Red No-Stop Group’ increased to an average of 10.4% in the post-period. The number of cyclists in the ‘Red No-Stop Group’ is lower than at the junction in Vienna (14.5%), where the RTOR signs have been present for nine months and where almost all cyclists are likely to be aware of the specific situation. Similar tendencies of non-compliance with RTOR rules were found in other studies [9], [21,22,23,25]. However, obligation to stop before turning to right is only mandatory in Germany and Austria.
Although the cyclist did not stop as required, this did not necessarily lead to a critical situation. At that time, there may have been no oncoming traffic, so the cyclist decided it was safe to turn right without stopping. The sight distance was sufficient for this decision. Furthermore, turning into the path of oncoming traffic may be another reason why cyclists do not stop before turning. They possibly feel safe because the crossing traffic and the cyclist will travel in the same direction after the cyclist turned to right.
Similar to the findings in literature [4,9] crossing violations are less frequent than right turn violations. The number of cyclists in the ‘Going Straight At Red’ decreased within six weeks after the RTOR sign was installed and became stable onwards at 14.3%. For the junction in Vienna the number of cyclists in the ‘Going Straight At Red’ were more than two times higher (32.3%). The sight distance in Vienna was approximately 35 meters and in Graz 25 meters. Further, the cyclists in Vienna had to take care of the traffic coming from left only i.e. no traffic in the leaving direction. This might explain the higher number of cyclists in the ‘Going Straight At Red’ group for Vienna.
Apparently there is no spillover effect between right turning and going straight at red which is in line with the findings by Schröter et al. [21]. However, it is not possible to draw conclusions about spillover effects at other junctions without first observing junctions where RTOR regulations are not in place. Although a spillover effect between junctions with RTOR regulations and junctions without this regulation were found by Ceunynck et al. [16]. However, Ceunynck used a questionnaire to assess behaviour, i.e. the spillover effect was not evaluated through observation.
No huge effect in the ‘Stress Group’ could be identified after installation of the RTOR sign. The number of cyclists trying to negotiate the junction when the signals change from green to red was almost constant at approximately 20% in Graz. The number did not decrease much after the RTOR sign was installed. However, the number of cyclists in the ‘Stress Group’ in Vienna were quite less frequent (5.6%).
According to Haworth et al. [12] a conflict situation for pedestrians develops if cyclists use the pavement. Therefore, it is beneficial that the use of the infrastructure decreased after the RTOR sign was installed. The number of cyclists using the infrastructure decreased over a period of four weeks (observed in Graz). After this period, the frequency was 5.4%. Cyclists using the infrastructure at green had a frequency of 4.7%. In Vienna, the number of cyclists in the ‘Infrastructure at Red’ group is much higher (26.2%), whereas in the ‘Infrastructure at Green’ group, it is 11.2%. This significant difference between the two observation sites may be due to the different design of the infrastructure. While the pavement in Graz is physically separated from the cycle lane by a parking space for cars, this is not the case in Vienna. Cyclists can use the pavement by simply crossing the lane marking. However, the pre to post analysis showed a decrease of using the pavement. In other studies a similar tendency was observed [18,21,24]. Fewer cyclists used the infrastructure after introducing RTOR at the specific junctions. Nevertheless, cyclists still use the infrastructure at red and green lights. Although the number of cyclists using the pavement when the signals are green is low this is somewhat curious, as there is no apparent reason to do so. One reason for using the pavement was identified as the desire for smooth travel in terms of saving time, keeping up speed or conserving energy [11]. However, the RTOR rule allow cyclists could turn right without losing much time at the junction and travelling is smooth.
5. Limitations
During the pre-evaluation period, the cyclists were categorised as part of the ‘Compliant Turn Group’, although this is not entirely accurate as cyclists are not permitted to turn right on red without a RTOR sign. However, this was a necessary provision for the evaluation of pre-to-post behaviour change.
The results showed that the cyclists’ behaviour changed over time but only one junction was observed. The second junction was used as a benchmark to analyse whether similar findings could be identified. However, the two junctions were not fully comparable due to differences in the infrastructure. At one junction, the pavement was physically separated from the cycle lane, whereas at the other, cyclists could easily cross the lane markings and enter the pavement. Thus, interaction with pedestrians was easier. The different zones of interest were clearly marked, with no tolerances considered; for example, if a cyclist crossed the lane between the cycle lane and the pavement, the observation would be associated with the ‘Infrastructure at Green’ or ‘Infrastructure at Red’ group. This can sometimes happen unintentionally. At the Graz junction, however, the cyclists used the pavement intentionally because they needed to cross the car park.
The group that showed the most change in behaviour was the ‘Red No-Stop Group’. As no personal interviews were conducted with the cyclists, it is not known whether they were aware of the RTOR regulation or disregarding the rule. Without taking into account other variables, such as traffic or traffic volume, it is unclear in which situations the cyclists violated the rule. If there was no traffic, turning right would be much less dangerous than in situations with crossing traffic. However, they still had to stop before turning right at the junction, as this is mandatory.
Although a change in the behaviour of cyclists could be identified in all groups, no conclusion can be drawn about the extent to which this would influence critical situations. It would be particularly interesting to know if rule violations lead to critical situations, especially in groups that violate the rules. Without further details on safety surrogate measures, such as the most commonly used measures, TTC (Time to Collision) [27] and PET (Post-Encroachment Time) [28] or others, it is impossible to assess the severity of these rule violations. Further analysis is required to determine the risk of red light violations and assess the severity of potential conflicts.
6. Conclusions
Although no announcement had been made, cyclists quickly noticed the RTOR sign and changed how they behaved at the junction. Some rule violations increased, while others decreased. At a certain point, this behaviour stabilised. Analysis of the second junction, where the RTOR sign was in place for a longer time, confirmed this behaviour.
The number of cyclists in the ‘Compliant Turn Group’ remained low. Nonetheless, the regulation encouraged cyclists to use it by not waiting for the signal to show green. However, there was a particularly high increase in the ‘Red No-Stop Group’ within the first two weeks after the traffic sign was installed. This was not observed to this extent for the other behaviour groups. Of all the violation groups, the ‘Red No-Stop Group’ was the most frequent. It is likely that there is a lack of communication or knowledge of the regulations, which might explain the high number of violations. Even when there is sufficient visibility to the stopping line of the cyclist, the cross traffic does not see the cyclist approaching. Cyclists are visible to vehicles very late, which could lead to critical situations where crossing traffic might not be able to react in time.
The RTOR regulation is beneficial for pedestrians as fewer cyclists are using the pavement. This reduces the potential number of conflicts with pedestrians.
While cyclists are aware of the RTOR regulation, which is announced by a sign, the crossing traffic is not aware of this special situation. As this regulation is not present at every junction, it is difficult for crossing traffic to know whether cyclists could enter, even when the lights are red. As a significant number of cyclists have violated the RTOR rule, it is necessary to raise awareness of this regulation among crossing traffic. An alternative approach would be to modify the regulation so that it is permitted at all junctions, with only certain critical junctions being subject to restrictions.
Author Contributions
“Conceptualization, E.T.; methodology, E.T.; formal analysis, E.T.; investigation, H.P. and N.K.; data curation, B.S. and H.P. and N.K.; writing—original draft preparation, E.T.; writing—review and editing, B.S., H.P. and N.K.; visualization, E.T.; project administration, E.T.; funding acquisition, E.T. All authors have read and agreed to the published version of the manuscript.”
Funding
This study was funded by the Austrian Federal Ministry for Climate Action, Environment, Energy, Mobility, Innovation and Technology (BMK) by grants (grant number GZ: 2024-0.009.078) of the Austrian Road Safety Fund (VSF). The APC was funded by TU Graz Open Access Publishing Fund. Open Access Funding by the Graz University of Technology.
Institutional Review Board Statement
Not applicable.
Informed Consent Statement
Not applicable.
Conflicts of Interest
The authors declare no conflicts of interest.
Abbreviations
The following abbreviations are used in this manuscript:
| NHTSA | National Highway Traffic Safety Administration |
| PET | Post-Encroachment Time |
| RTOR | right turn on red |
| TTC | Time to Collision |
| ZOI | zones of interest |
References
- Wu, C.; Yao, L.; Zhang, K. The red-light running behavior of electric bike riders and cyclists at urban intersections in China: an observational study. Accid. Anal. Prev. 2012, 49, 186–192. [Google Scholar] [CrossRef] [PubMed]
- Allen, D.; Bygrave, S.; Harper, H. Behaviour at cycle advanced stop lines. 2005. [Google Scholar] [PubMed]
- Bacchieri, G.; Barros, A.J.D.; Dos Santos, J.V.; Gigante, D.P. Cycling to work in Brazil: users profile, risk behaviors, and traffic accident occurrence. Accid. Anal. Prev. 2010, 42, 1025–1030. [Google Scholar] [CrossRef] [PubMed]
- Johnson, M.; Newstead, S.; Charlton, J.; Oxley, J. Riding through red lights: the rate, characteristics and risk factors of non-compliant urban commuter cyclists. Accid. Anal. Prev. 2011, 43, 323–328. [Google Scholar] [CrossRef] [PubMed]
- Richardson, M.; Caulfield, B. Investigating traffic light violations by cyclists in Dublin City Centre. Accid. Anal. Prev. 2015, 84, 65–73. [Google Scholar] [CrossRef] [PubMed]
- Johnson, M.; Charlton, J.; Oxley, J.; Newstead, S. Why do cyclists infringe at red lights? An investigation of Australian cyclists’ reasons for red light infringement. Accid. Anal. Prev. 2013, 50, 840–847. [Google Scholar] [CrossRef] [PubMed]
- Fraboni, F.; Marín Puchades, V.; de Angelis, M.; Pietrantoni, L.; Prati, G. Red-light running behavior of cyclists in Italy: An observational study. Accid. Anal. Prev. 2018, 120, 219–232. [Google Scholar] [CrossRef] [PubMed]
- Pai, C.-W.; Jou, R.-C. Cyclists’ red-light running behaviours: an examination of risk-taking, opportunistic, and law-obeying behaviours. Accid. Anal. Prev. 2014, 62, 191–198. [Google Scholar] [CrossRef] [PubMed]
- Schleinitz, K.; Petzoldt, T.; Kröling, S.; Gehlert, T.; Mach, S. (E-)Cyclists running the red light - The influence of bicycle type and infrastructure characteristics on red light violations. Accid. Anal. Prev. 2019, 122, 99–107. [Google Scholar] [CrossRef] [PubMed]
- Twaddle, H.; Busch, F. Binomial and multinomial regression models for predicting the tactical choices of bicyclists at signalised intersections. Transp. Res. Part F Traffic Psychol. Behav. 2019, 60, 47–57. [Google Scholar] [CrossRef]
- Ihlström, J.; Henriksson, M.; Kircher, K. Immoral and irrational cyclists? Exploring the practice of cycling on the pavement. Mobilities 2021, 16, 388–403. [Google Scholar] [CrossRef]
- Haworth, N.; Schramm, A.; Debnath, A.K. An observational study of conflicts between cyclists and pedestrians in the city centre. J. Australas. Coll. Road Saf. 2014, 25, 31–40. [Google Scholar]
- Mamlouk, M. Right Turn on Red: Utilization and Impact, Indiana, US; 1976. [Google Scholar]
- Maier, R.; Hantschel, S.; J. Ortlepp, P. Butterwegge, Sicherheit von Grünpfeilen; GDV: Berlin, 2015. [Google Scholar]
- Nederlandse overheid. Reglement verkeersregels en verkeerstekens 1990: RVV; 1990.
- de Ceunynck, T.; Daniels, S.; Vanderspikken, B.; Brijs, K.; Hermans, E.; Brijs, T.; Wets, G. Is there a spillover effect of a right turn on red permission for bicyclists? Transp. Res. Part F Traffic Psychol. Behav. 2016, 36, 35–45. [Google Scholar] [CrossRef]
- Knudsen, N.; Møller-Lange, M. Følgeeffekter ved tilladelse af højresving for rødt for cyklister. Annual Transport Conference at Aalborg University 2021, 2021. [Google Scholar]
- CERTU, Cédez-le-passage cycliste au feu rouge. 2012.
- Niestegge, M.; Schüller, H.; Hantschel, S.; Schröter, B.; Gerike, R. Pilotversuch des Rechtsabbiegens von Rad Fahrenden bei Rot; Bergisch Gladbach, 2022. [Google Scholar]
- State of Idaho, Title 49 Motor Vehicles, Chapter 7 Pedestrians and Bicycles: 49 720.
- Schröter, B.; Hantschel, S.; Niestegge, M.; Schüller, H.; Gerike, R. Introducing right turn on red for cyclists—a before-after study on behavioural adaption in Germany. TSR 2024, 7, e000062. [Google Scholar] [CrossRef]
- Störr, M.; Huber, C.; Pöllendorfer, D. Pilotversuch velofreundliche Lichtsignalanlagen – Rechtsabbiegen bei Rot für Velos, Fuss und Veloverkehrsphase; 2017. [Google Scholar]
- BIVV, Proefproject in het Brussels Hoofdstedelijk Gewest met de toelating voor fietsers om rechtsaf door rood te rijden (B22) of om rechtdoor door rood te rijden (B23): Pilotprojekt in der Region Brüssel-Hauptstadt, das es Radfahrern erlaubt, bei roter Ampel rechts abzubiegen (B22) oder geradeaus über eine rote Ampel zu fahren (B23), Brussels, Belgium, 2012.
- Eriksson, A. Evaluering af højresving tilladt for rødt for cykler. 2016. [Google Scholar] [PubMed]
- Egeler, C.; Erzinger, F.; Blumenstein, A.; Kauffmann, V.; Schlag, B.; Schade, J.; Rössger, L. Langsamverkehrsfreundliche Lichtsignalanlagen. 2015. [Google Scholar] [CrossRef]
- Kirillova, N.; Possegger, H.; Bischof, H. A Visual Surveillance System to Observe Realistic Road User Behavior for Improved Pedestrian and Cyclist Safety at Crossroads. In 2022 18th IEEE International Conference on Advanced Video and Signal Based Surveillance (AVSS); IEEE, 2022; pp. 1–8. [Google Scholar]
- Hayward, J.C. Near miss determination through use of a scale of danger, 1972.
- Allen, B.C.; Shin, B.T.; Cooper, P.J. Analysis of traffic conflicts and collisions. Transp. Res. Rec. 1978, 667, 67–74. [Google Scholar]
Figure 1.
Camera capturing area of the approaching and leaving direction of the cyclist.
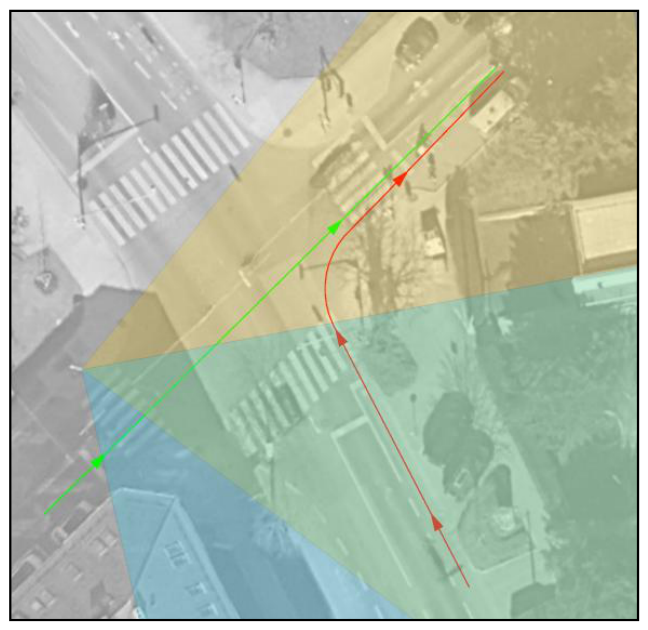
Figure 2.
Zone of Interests are labelled at the observation point.
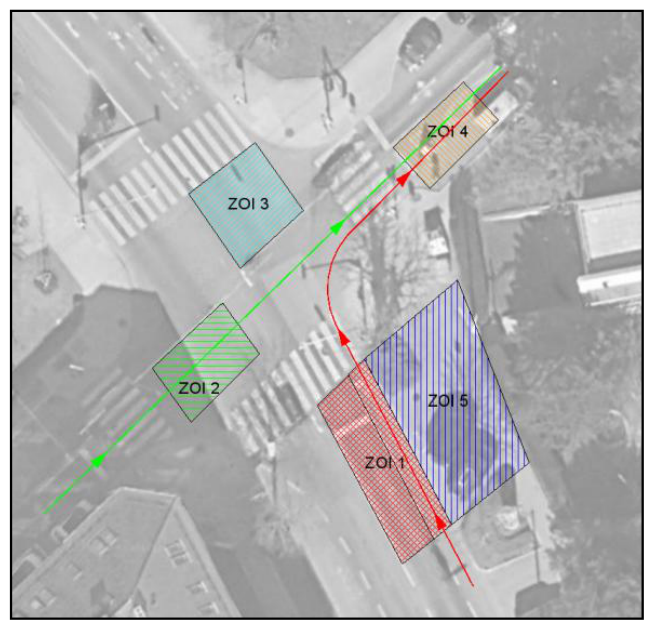
Figure 3.
Cyclist behaviour groups (top line: compliant groups, bottom line: violation groups).
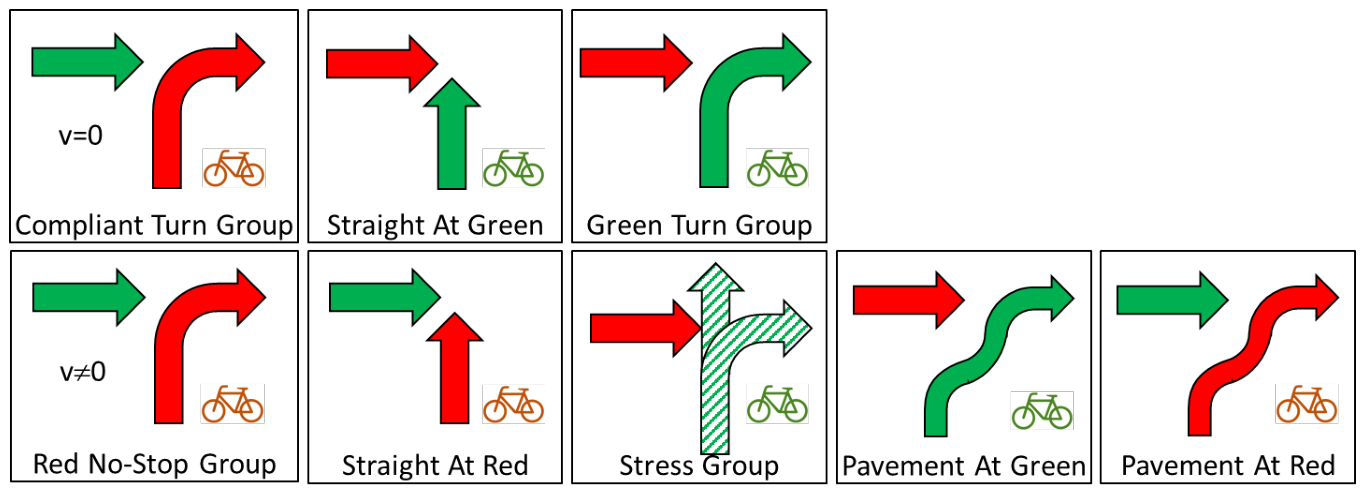
Figure 4.
Change of the behaviour over time in the pre-post evaluation. The black line indicates the installation of ROTR sign at the junction at the beginning of calendar week 32. The ‘Straight At Green Group’ and ‘Green Turn Group’ are excluded.
Figure 4.
Change of the behaviour over time in the pre-post evaluation. The black line indicates the installation of ROTR sign at the junction at the beginning of calendar week 32. The ‘Straight At Green Group’ and ‘Green Turn Group’ are excluded.
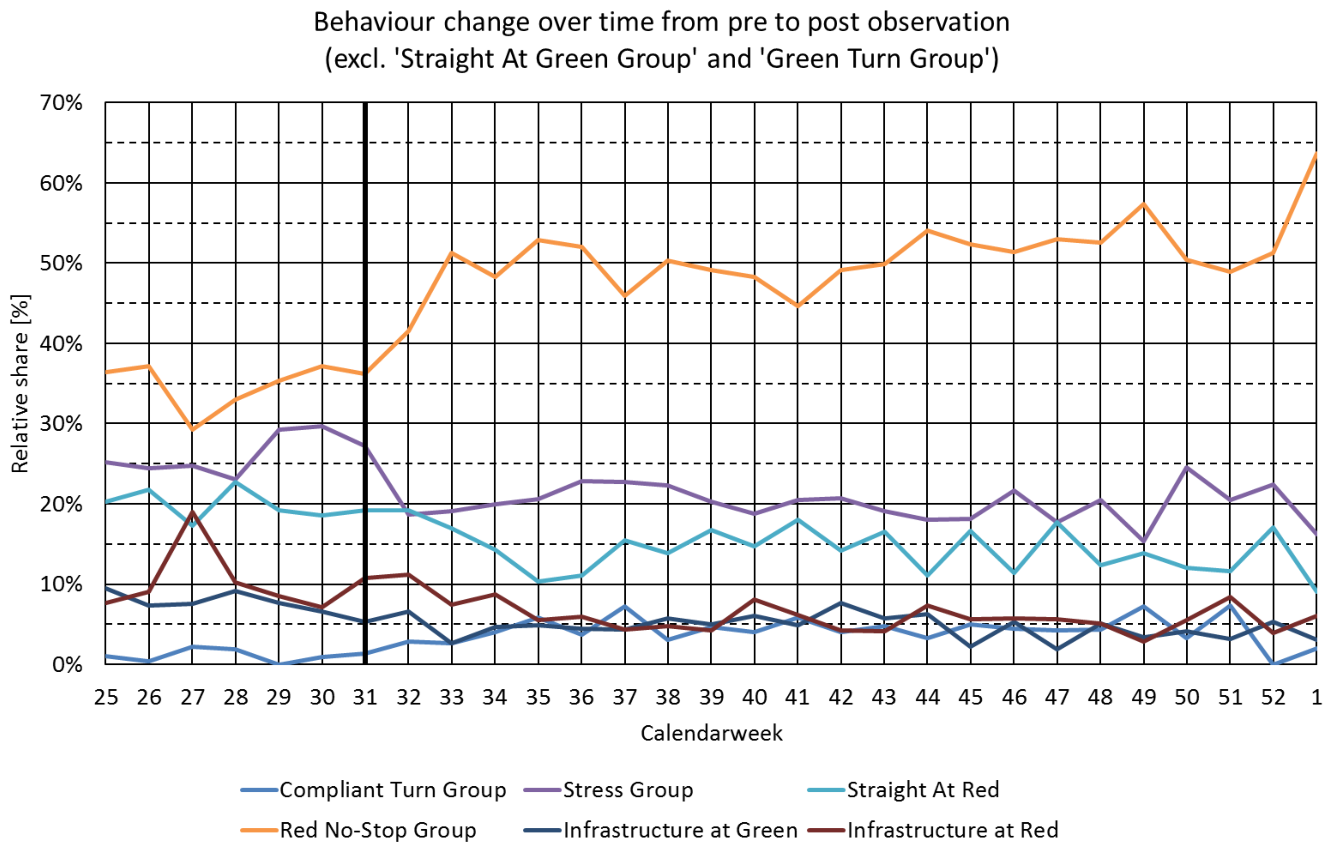
Figure 5.
A long-term view at two different time points after the RTOR sign was installed (excluding the ‘Straight At Green Group’ and ‘Green Turn Group’).
Figure 5.
A long-term view at two different time points after the RTOR sign was installed (excluding the ‘Straight At Green Group’ and ‘Green Turn Group’).
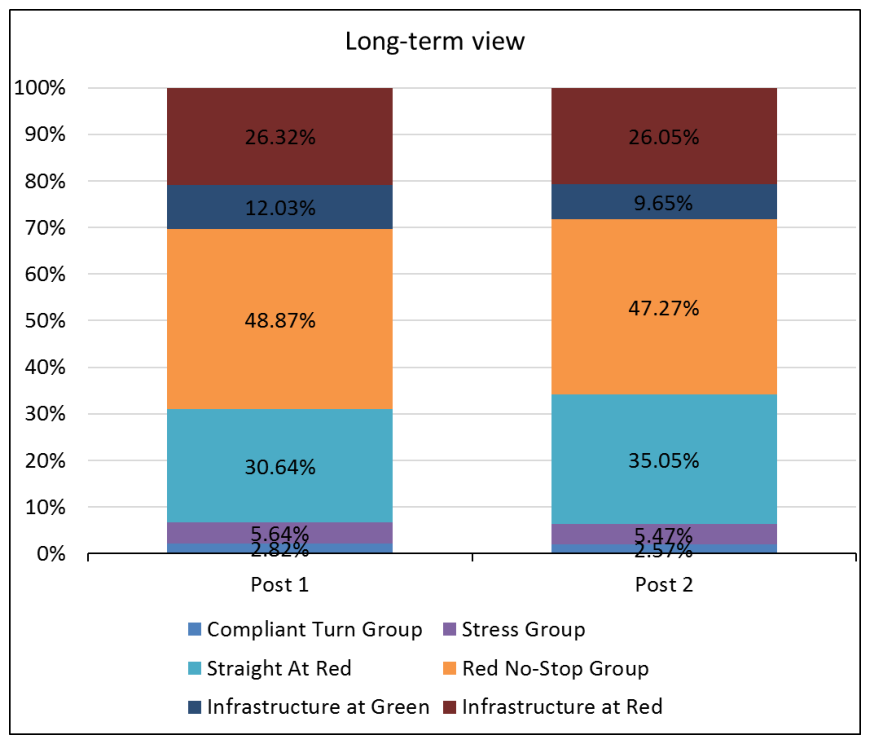

Table 1.
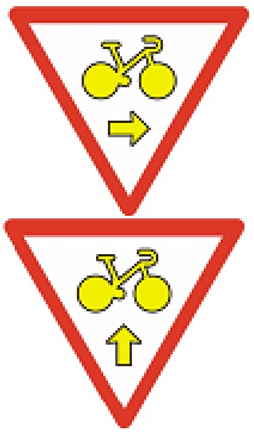
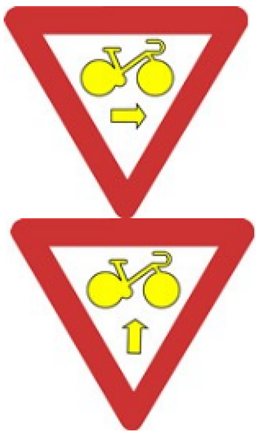
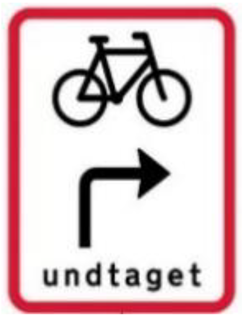
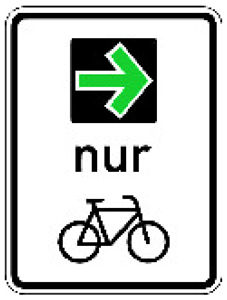
Year of introduction of RTOR and obligation to stop in different European countries [21].
Table 1.
Year of introduction of RTOR and obligation to stop in different European countries [21].
| the Netherlands | France | Belgium | Denmark | Switzerland | Germany | Austria | |
|---|---|---|---|---|---|---|---|
| Year of Introduction | 1990 | 2012 | 2012 | 2018 | 2021 | 2020 | 2022 |
| Obligation to stop | no | no | no | no | no | yes | yes |
| Design | 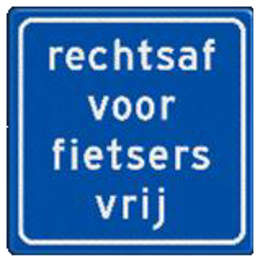 |
 |
 |
 |
 |
 |
 |
Table 2.
Overview of RTOR studies with results in pre-post evaluation.
| Country | Study design | Observation sites | Duration | Collection method | Results |
|---|---|---|---|---|---|
| France [18] | Pre-post study | No information | No information | No information | -No accidents observed -No negative effects on the cyclist behaviour -No use of the pavement to avoid the red light |
| Belgium [23] |
Pre-post study | 8 sites | 4-hours | Video observation | -39%–94% of cyclists turned right on red light before and 60%–81% after RTOR Introduction -No negative effects on road safety -Erratic cycling behaviour avoided -No conflicts with other road users observed |
| Denmark [24] |
Pre-post study | 4 sites | 2 days and 9 hours observation | Video observation | -Increase of cyclists turning at red by 30% -90% of RTOR in the post phase compared to 63%-78% in the pre phase -No increase of the number of conflicts |
| Switzerland [25] |
Pre-post study | 4 sites | 1.75 hours | Manual observation | -Increase of right turning cyclists from 33%-100% (pre-phase) to 68%-100% (post-phase) -Number of conflicts stayed at a low level (12 conflicts in the pre and 9 in the post phase) -No increase of red light running for crossing straight -One year after introduction of RTOR 16% of the cyclists stopped before turning although it is not required -Spillover effect not investigated -No influence on pavement use by cyclists |
| Switzerland [22] |
Post study | 11 sites | 8 days 6 hours observation |
Video observation | |
| Germany [19,21] |
Pre-post study | 43 sites | One day at each site | Video observation | Cyclists turning right: -Arrive at red and wait for green decreased from 20% to 7% -Arrive at red and ride on red after stop almost constant (4% in pre phase and 5% in the post phase) -Arrive at red and ride on red without stop increased from 76% to 87% Cyclists riding straight: -Arrive at red and wait for green changed from 88% to 90% -Arrive at red and ride on red changed from 12% to 10% -No spillover effect between right turning and riding straight |
Table 3.
Cyclist behaviour during the observation phases.
| Compliant Groups | Violation Groups | |||||||||
|---|---|---|---|---|---|---|---|---|---|---|
| Evaluation phase | Calender week | Compliant Turn Group | Green Turn Group | Straight At Green | Stress Group | Straight At Red | Red No-Stop Group | Infrastructure At Green | Infrastructure At Red | Total |
| Pre | 25 | 3 | 730 | 822 | 72 | 58 | 104 | 27 | 22 | 1,838 |
| 26 | 1 | 844 | 823 | 73 | 65 | 111 | 22 | 27 | 1,966 | |
| 27 | 5 | 714 | 673 | 56 | 39 | 66 | 17 | 43 | 1,613 | |
| 28 | 5 | 739 | 741 | 63 | 62 | 90 | 25 | 28 | 1,753 | |
| 29 | 0 | 714 | 692 | 76 | 50 | 92 | 20 | 22 | 1,666 | |
| 30 | 2 | 691 | 718 | 67 | 42 | 84 | 15 | 16 | 1,635 | |
| 31 | 3 | 687 | 651 | 61 | 43 | 81 | 12 | 24 | 1,562 | |
| Post | 32 | 6 | 446 | 450 | 40 | 41 | 89 | 14 | 24 | 1,110 |
| 33 | 6 | 583 | 520 | 44 | 39 | 118 | 6 | 17 | 1,333 | |
| 34 | 13 | 670 | 632 | 64 | 46 | 155 | 15 | 28 | 1,623 | |
| 35 | 18 | 696 | 630 | 64 | 32 | 164 | 15 | 17 | 1,636 | |
| 36 | 10 | 583 | 590 | 62 | 30 | 141 | 12 | 16 | 1,444 | |
| 37 | 15 | 434 | 373 | 47 | 32 | 95 | 9 | 9 | 1,014 | |
| 38 | 9 | 669 | 598 | 66 | 41 | 149 | 17 | 14 | 1,563 | |
| 39 | 13 | 525 | 487 | 57 | 47 | 138 | 14 | 12 | 1,293 | |
| 40 | 12 | 571 | 616 | 56 | 44 | 144 | 18 | 24 | 1,485 | |
| 41 | 19 | 612 | 668 | 67 | 59 | 146 | 16 | 20 | 1,607 | |
| 42 | 14 | 658 | 654 | 73 | 50 | 173 | 27 | 15 | 1,664 | |
| 43 | 15 | 528 | 528 | 60 | 52 | 157 | 18 | 13 | 1,371 | |
| 44 | 9 | 453 | 499 | 49 | 30 | 147 | 17 | 20 | 1,224 | |
| 45 | 16 | 580 | 604 | 58 | 53 | 167 | 7 | 18 | 1,503 | |
| 46 | 11 | 434 | 432 | 53 | 28 | 126 | 13 | 14 | 1,111 | |
| 47 | 9 | 374 | 387 | 38 | 38 | 114 | 4 | 12 | 976 | |
| 48 | 12 | 503 | 421 | 56 | 34 | 144 | 14 | 14 | 1,198 | |
| 49 | 15 | 387 | 365 | 32 | 29 | 120 | 7 | 6 | 961 | |
| 50 | 7 | 365 | 421 | 53 | 26 | 109 | 9 | 12 | 1,002 | |
| 51 | 14 | 421 | 343 | 39 | 22 | 93 | 6 | 16 | 954 | |
| 52 | 0 | 118 | 107 | 17 | 13 | 39 | 4 | 3 | 301 | |
| 1 | 2 | 190 | 151 | 16 | 9 | 63 | 3 | 6 | 440 | |
| Pre | 19 | 5,119 | 5,120 | 468 | 359 | 628 | 138 | 182 | 12,033 | |
| Post | 245 | 10,800 | 10,476 | 1,111 | 795 | 2791 | 265 | 330 | 26,813 | |
Table 4.
Cycling behaviour at long-term RTOR crossing.
| Compliant Groups | Violation Groups | |||||||||
|---|---|---|---|---|---|---|---|---|---|---|
| Evaluation phase | Compliant Turn Group | Green Turn Group | Straight At Green | Stress Group | Straight At Red | Red No-Stop Group | Infrastructure At Green | Infrastructure At Red | Total | |
| Post 1 | 15 | 375 | 856 | 30 | 163 | 260 | 64 | 140 | 1,763 | |
| Post 2 | 8 | 194 | 546 | 17 | 109 | 147 | 30 | 81 | 1,051 | |
| Total | 23 | 569 | 1402 | 47 | 272 | 407 | 94 | 221 | 2,814 | |
Disclaimer/Publisher’s Note: The statements, opinions and data contained in all publications are solely those of the individual author(s) and contributor(s) and not of MDPI and/or the editor(s). MDPI and/or the editor(s) disclaim responsibility for any injury to people or property resulting from any ideas, methods, instructions or products referred to in the content. |
© 2026 by the authors. Licensee MDPI, Basel, Switzerland. This article is an open access article distributed under the terms and conditions of the Creative Commons Attribution (CC BY) license (http://creativecommons.org/licenses/by/4.0/).
Copyright: This open access article is published under a Creative Commons CC BY 4.0 license, which permit the free download, distribution, and reuse, provided that the author and preprint are cited in any reuse.