

Submitted:
17 September 2026
Posted:
18 September 2026
You are already at the latest version
Abstract
Chitosan is an appealing matrix for low-cost separator membranes in water electrolysis, but fillers are normally screened one at a time and judged on mechanical grounds, so the way a filler simultaneously reshapes hydration and ionic transport is rarely mapped across a single consistent series. We cast seven membranes from chitosan extracted in-house from Litopenaeus vannamei shells — pristine chitosan and composites containing graphite (1 wt.%), bamboo cellulose nanocrystals (1 and 3 wt.%), graphene oxide (1 and 3 wt.%) and a ternary 1 wt.% NCC/1 wt.% GO formulation — and characterised all of them by proximate analysis, DSC, electrolyte uptake in 1 wt.% KOH, uniaxial tension, Shore D hardness, a five-cycle ultrasonic ageing protocol and polarisation in a purpose-built two-compartment cell. The two filler families moved hydration and transport in opposite directions. Nanocellulose raised the moisture content from 11.00% to 13.46% while lowering the conductivity of the casting dispersion by 12.5% and 23.2% at 1 and 3 wt.%; graphene oxide cut moisture to 6.42% and raised dispersion conductivity by 18.4% and 25.9%. Across the series the two quantities were inversely correlated (r = −0.761, p = 0.047). Electrolysis onset potential tracked dispersion conductivity (Spearman ρ = −0.857, p = 0.014) but showed no relationship with tensile strength (p = 0.125), so the functional gain from a filler is not predictable from the mechanical data alone. Loadings above 1 wt.% degraded every property measured, and the 3 wt.% GO membrane was the only composite to fail the ageing protocol. Filler selection for these membranes is therefore a compromise, not an optimisation.
Keywords:
chitosan
; cellulose nanocrystals
; graphene oxide
; biocomposite membranes
; water electrolysis
; electrolyte uptake
; proximate analysis
1. Introduction
Water electrolysis driven by renewable electricity is one of the few routes to hydrogen that does not carry a fossil carbon debt, and interest in it has grown accordingly [1,2]. Among the available configurations, cells built around a solid polymer electrolyte are attractive because they tolerate the intermittency of wind and solar supply, operate at moderate temperature and deliver gas of high purity [3,4]. The economics, however, remain awkward. Perfluorosulfonic acid membranes — Nafion being the usual benchmark — account for a disproportionate share of stack cost, their manufacture is chemically demanding, and the environmental persistence of fluorinated compounds has become a liability rather than a footnote [5,6]. Work on alternative membrane chemistries has intensified for both reasons at once.
Chitosan sits near the top of most shortlists of replacements. It is obtained by alkaline deacetylation of chitin, the second most abundant biopolymer on the planet; it forms coherent films from dilute acid solution without specialised equipment; and in coastal regions with an active shrimp industry the feedstock is a waste stream rather than a commodity [7,8,9]. Chitosan membranes have been tested in direct methanol, direct borohydride and hydrogen fuel cells, generally after chemical crosslinking, and their transport behaviour compares reasonably with Nafion at moderate temperature [10,11,12,13]. The recurring problems are equally well documented: unmodified chitosan swells heavily in aqueous electrolyte, and swelling costs it both dimensional stability and mechanical integrity [14,15].
The standard remedy is a nanofiller. Graphene oxide is the most-studied candidate, and the rationale is straightforward — the oxygen functionalities decorating its basal planes and edges provide sites for both Grotthuss hopping and vehicular transport, so conductivity generally rises with GO content [16,17]. Beyond a threshold loading, though, π–π stacking drives the sheets into agglomerates that act as stress concentrators and defeat the purpose [18]. Cellulose nanocrystals have been proposed as a complementary filler on quite different grounds: they are stiff, highly crystalline, thermally stable and form dense hydrogen-bonded networks with polysaccharide matrices, and they hold water [19,20,21,22].
What is less often examined is what these two fillers do to the same matrix side by side, at matched loadings, under the same casting protocol. Reports on chitosan/GO and chitosan/NCC systems are numerous but seldom directly comparable, because matrix source, crosslinking chemistry, film thickness and drying schedule all differ between laboratories. More to the point, the properties that actually govern a separator in service — how much electrolyte it takes up, how fast, how much water it holds intrinsically, and what that does to ionic transport — are usually reported in isolation from one another and from mechanical data. A filler that improves stiffness may or may not improve the cell, and the published literature rarely puts the two measurements on the same axis.
There is a second, smaller gap. Graphite is almost never included as a control. Without it there is no way to tell whether an effect attributed to graphene oxide comes from the oxidation chemistry or simply from adding carbon particles to the matrix, and the distinction matters if the objective is a cheap membrane, since unoxidised graphite is far less expensive than GO.
This study was designed around those two gaps. Seven membranes were cast from a single batch of in-house chitosan by one operator using one protocol: the pristine polymer, three filler chemistries (graphite, bamboo-derived cellulose nanocrystals and graphene oxide), two loadings for each nanofiller, and one ternary formulation. Every membrane was then taken through the same sequence of hydration, thermal, mechanical, ageing and electrochemical measurements, and the resulting matrix was analysed for correlation rather than described sample by sample. The microstructure and continuous-operation behaviour of the ternary formulation are treated separately in a companion paper [23]; here the concern is the comparative behaviour of the series and what it implies for filler selection.
2. Materials and Methods
2.1. Materials
Shrimp (Litopenaeus vannamei) shells were collected from processing facilities in Fortaleza, Ceará, Brazil. Green culms of Bambusa vulgaris approximately four years old were harvested at the Pici Campus of the Universidade Federal do Ceará. Powdered graphite was used both as a filler in its own right and as the precursor for graphene oxide. Sodium hydroxide, sodium hypochlorite, hydrochloric acid, sulfuric acid, sodium nitrate, potassium permanganate, hydrogen peroxide, acetic acid, octanol and potassium hydroxide were of analytical grade and used as received. Demineralised and distilled water were used throughout.
2.2. Extraction of Chitosan from Shrimp Shells
Chitin extraction was carried out at PADETEC (UFC Technological Development Park). Shells were washed to remove viscera and coarse debris, rinsed with demineralised water and dried in a circulating oven at 60 °C for 24 h. The dried exoskeletons were milled under vacuum and sieved through 80 mesh (0.17 mm aperture); material retained above that granulometry was discarded.
Demineralisation was performed with 0.55 mol L−1 HCl at a 1:10 solid-to-liquid mass ratio for 2 h at 40 °C, repeated three times, followed by washing with demineralised water and drying at 60 °C for 24 h. Deproteinisation used the same protocol with 3% NaOH, also repeated three times. Residual pigments were removed with 2% NaClO under constant stirring for 1 h at 60 °C, after which the solid was washed exhaustively.
Deacetylation was carried out by refluxing 15 g of chitin in 600 mL of 50% (w/v) NaOH in a 3 L glass flask lined with glass beads, held at 120 °C for 10 h in a heating mantle. The product was washed with distilled water to neutral pH with concurrent filtration and dried at 60 °C for 24 h.
2.3. Isolation of Cellulose Nanocrystals from Bamboo
Culms were cut on an automatic band saw and separated into nodes and internodes. Long internodal fibres above 150 mm were retained, preference being given to the longitudinal fibres lying within roughly 1–10 mm of the outer culm wall, where cellulose content is highest. The wax-bearing outer skin was removed by longitudinal cuts approximately 2 mm deep. The remaining material was cut into thin longitudinal sections, the fibre-bearing vascular bundles were separated manually, and the resulting fibres were micronised in a vacuum grinder and sieved at 60 mesh; the fraction passing the sieve was discarded. The retained powder was conditioned at 60 °C for at least 24 h.
Mercerisation was carried out in 2% NaOH for 4 h at 80 °C under magnetic stirring at 1 g of fibre per 10 mL of solution. The cycle was repeated six times, until the whiteness of the fibres no longer changed between repetitions, with washing and oven drying between cycles. Bleaching followed in 2% NaClO under the same conditions (4 h, 80 °C, 1 g per 10 mL), repeated three times until the pulp was visibly white, then dried at 60 °C for 24 h.
Acid hydrolysis was performed in 64% aqueous H2SO4 for 15 min at 50 °C, using 12.5 mL of acid per gram of dry pulp, in a volumetric flask immersed in a silicone bath at 60 °C under magnetic stirring. The suspension was centrifuged at 4000 rpm for 30 min, the supernatant discarded and replaced with an equal volume of distilled water, and the redispersed material was sonicated for 40 min. Centrifugation, exchange and sonication were repeated until the suspension reached neutral pH. The product was freeze-dried before use.
2.4. Synthesis of Graphene Oxide
Graphene oxide was prepared from powdered graphite by the Hummers route. Graphite (10 g) was added to 200 mL of 98% H2SO4 under constant stirring until homogeneous; the mixture was cooled to −5 °C and returned to stirring in an ice bath, after which 5 g of NaNO3 was added. Potassium permanganate (35 g) was then introduced gradually over approximately 2 h under constant stirring to avoid a sharp exotherm, and the mixture was subsequently heated on a hot plate at 40 °C for 1 h. Distilled water (400 mL) was added cautiously and the temperature held near 90 °C for 30 min.
The suspension was diluted with distilled water to approximately 1500 mL and 100 mL of hydrogen peroxide was added under constant stirring until the colour change was complete. The graphene oxide was allowed to settle for 24 h and the supernatant discarded. The solid was washed with 5% HCl, decanted, and then washed three times with distilled water until the yellowish tint was lost. A final ultrasonic bath with distilled water to a total volume of 600 mL yielded a paste-like product.
2.5. Membrane Casting
All membranes were produced by solution casting without chemical crosslinking agents, so that whatever structural integrity the films possess derives from physical and hydrogen-bonded interactions alone. Chitosan powder (5 g) was added slowly to 600 mL of 2% aqueous acetic acid under vigorous mechanical stirring — a magnetic stirrer could not cope with the viscosity of the dope — and left stirring for 24 h.
For the composites, the filler was first dispersed separately in 2% acetic acid: the powder was added, stirred vigorously, and then sonicated for 2 h. This dispersion was added dropwise to the chitosan solution, which was stirred for a further 24 h. All dopes, pristine and filled, were then sieved to remove any insoluble particulate and poured into moulds. Cast volumes were calculated from the density of the dope and the mould dimensions to give a dry film thickness of approximately 300 μm. Moulds were dried in a ventilated oven at 45 °C for 96 h.
Demoulding was carried out by flooding the mould with 1% aqueous NaOH; after 6 h the films released readily and were dried again at 50 °C for 24 h. Table 1 lists the seven formulations and the codes used throughout.
2.6. Characterisation
Proximate analysis followed ABNT NBR 8112. Moisture content was determined on 1 g of sample held at 100 °C for 2 h, cooled in a desiccator for 30 min and weighed. Volatile matter was determined on the dried sample by placing the crucible at the open muffle door for 5 min and then inside the muffle at 500 °C for a further 20 min. Ash content was determined at 900 °C for 2 h. Fixed carbon and organic matter were obtained by difference, as TCF = 100 − (TC + MV) and TMO = 100 − TC respectively.
Thermogravimetry, its derivative and differential scanning calorimetry were run simultaneously on approximately 0.5 g of material in a 1 mL sample holder under nitrogen at 50 mL min−1, heating from ambient to 400 °C at 10 °C min−1.
Electrolyte uptake was measured on 50 mm × 50 mm specimens of roughly 0.1 g, dried for 24 h and weighed on an analytical balance before immersion in the cell electrolyte (1 wt.% aqueous KOH). Specimens were removed and weighed after 5, 10, 20, 60 and 120 min, and uptake was calculated as the percentage mass gain relative to the dry weight.
Uniaxial tensile tests were carried out on an EMIC universal testing machine at a crosshead speed of 2 mm min−1 over a 60 mm gauge length. In the absence of a standard written for composite membranes, the specimen geometry prescribed for composites was adapted to the thickness and length available. Between four and five specimens were tested per formulation. Shore D hardness was measured with a Precision Instruments TEC-35540D durometer mounted in a stand applying 10 N, following ASTM D2240/75, at 25 °C and 45% relative humidity; five indentations spaced 5 mm apart were taken on each specimen.
Accelerated ageing was carried out on 20 mm diameter discs of known thickness in a Solidsteel SSBuc 10L ultrasonic bath operating at 40 kHz with a maximum power of 1000 W, using the cell electrolyte as the propagation medium. The bath temperature was set to 50 °C, matching the temperature reached by the electrolyser in operation. Each specimen was irradiated for 60 min once every 24 h over five consecutive days, giving 120 h of elapsed cycle time and 5 h of cumulative ultrasonic exposure. Mass was recorded after every cycle on a BEL balance resolving 0.01 g, thickness with a Mitutoyo 103-137 external micrometer, and the specimens were photographed to record visible cracking.
The conductivity of the casting dispersions was measured in situ at the reticulation stage, before drying, on approximately 250 mL of dope in a 500 mL beaker using an mCA-150 bench conductivity meter. Five readings were taken per formulation over roughly 2 min, the interval after which readings no longer drifted.
Functional testing used a purpose-built two-compartment cell machined from 4 mm polystyrene sheet on a laser cutter, with the membrane clamped between the anode and cathode compartments on a polypropylene mesh support and sealed with gaskets and C-clamps. Platinum electrodes of equal area were used so that current density could be referred to a single geometric area. Both compartments were filled simultaneously with 1 wt.% aqueous KOH to avoid a pressure differential across the film. Voltage was supplied by a bench power supply and current and voltage were read on a bench multimeter; approximately 50 points were collected per polarisation curve. The onset potential was taken as the lowest applied voltage at which electrolysis was observed to proceed, and the reaction rate as the slope of the current density–voltage relation above onset.
2.7. Statistical Analysis
Relationships between properties were assessed across the seven formulations (n = 7) using Pearson product-moment correlation where a linear relation was plausible and Spearman rank correlation where only monotonicity was assumed. Coefficients and two-tailed p-values were computed with SciPy 1.x. Given the sample size, correlations are reported as descriptive of this series and are not extrapolated; p-values below 0.05 are treated as evidence of a relationship worth interpreting, and coefficients are reported in full whether or not that threshold is met.
3. Results
3.1. Hydration and Thermal Behaviour
Proximate analysis separated the two filler families cleanly (Table 2, Figure 1). Pristine chitosan held 11.00% moisture. Both carbonaceous fillers reduced it — to 8.82% with graphite and with 1 wt.% GO, and to 6.42% with 3 wt.% GO, a 42% reduction relative to the pristine film. Nanocellulose at 1 wt.% moved in the opposite direction, raising moisture to 13.46%. The 3 wt.% nanocellulose film broke the trend at 10.58%, marginally below the pristine value, and the ternary membrane landed at the same figure, which is consistent with the two fillers partially cancelling one another.
Volatile matter and fixed carbon behaved as the moisture data would suggest. Graphite raised fixed carbon markedly, from 15.39% to 22.27%, and 1 wt.% GO to 18.41%, while both nanocellulose loadings left it essentially unchanged (15.40% and 14.02%). Volatile content fell for the carbonaceous fillers, most sharply for graphite at 72.50% against 79.40% for chitosan, and rose slightly for the nanocellulose films. Ash content varied between 3.23% and 6.11% without a clear pattern.
Differential scanning calorimetry supported the same reading of the moisture data. Every membrane produced three thermal events. The first, endothermic, corresponds to dehydration, and its enthalpy was largest for pristine chitosan at 248.7 J g−1. All filled membranes released less: 188.7 J g−1 for CH/GR, 189.3 J g−1 for CH/GO1 and 184.4 J g−1 for the ternary film. The second event, exothermic and beginning near 190 °C in all samples, corresponds to decomposition; peak positions shifted further to higher temperature for the carbonaceous fillers than for nanocellulose. The ternary membrane was distinctive in resolving two separate decomposition peaks, at 256.7 °C and 270.4 °C, rather than one. Thermogravimetric data for this series, including the displacement of the water-desorption peak, are reported in the companion paper [23] and are not reproduced here.
3.2. Electrolyte Uptake
Uptake in 1 wt.% KOH reached a plateau within 2 h for every formulation; between 60 and 120 min no sample varied by more than a few percent of its own mass gain, which set the conditioning time used before cell assembly. The equilibrium values differed widely (Table 3, Figure 2). Pristine chitosan gained 55.35% of its dry mass. Graphite was the only filler that increased uptake, to 66.86%. Every other filler reduced it: to 40.59% and 48.40% for 1 and 3 wt.% nanocellulose, to 33.33% and 36.00% for 1 and 3 wt.% graphene oxide, and to 32.22% for the ternary membrane, the lowest of the series and a 42% reduction against the pristine film.
The kinetics differed as well. Pristine chitosan had taken up only 59% of its eventual gain after 5 min, whereas the filled membranes had reached 66–86% of theirs by that point. The filled films therefore both absorb less and approach equilibrium sooner, which for a separator is the more useful combination: dimensional change is smaller and is largely complete before the cell reaches steady operation.
3.3. Conductivity of the Casting Dispersions
Conductivity measured on the dope, before drying, separated the filler families as sharply as the hydration data did but with the signs reversed (Table 4, Figure 3). Pristine chitosan gave 15.58 ± 0.20 mS cm−1. Nanocellulose lowered it to 13.63 ± 1.10 mS cm−1 at 1 wt.% and 11.97 ± 0.70 mS cm−1 at 3 wt.%, losses of 12.5% and 23.2%. Graphene oxide raised it to 18.44 ± 0.90 and 19.62 ± 0.40 mS cm−1, gains of 18.4% and 25.9%. Graphite also raised it, to 18.27 ± 0.20 mS cm−1, a gain of 17.3% and statistically indistinguishable from 1 wt.% GO. The ternary dispersion fell between the two families at 17.66 ± 0.30 mS cm−1.
That graphite performed nearly as well as graphene oxide in this measurement is worth noting, because it indicates that the increase is not specific to the oxygen functionalities of GO. Both loadings of nanocellulose reduced conductivity, and the reduction scaled with loading, which is what a dispersion of insulating crystallites in a conducting medium would be expected to produce.
3.4. Mechanical Properties
Tensile strength fell for every filled membrane (Table 5, Figure 4a). Pristine chitosan reached 13.15 ± 1.85 MPa. Only 1 wt.% nanocellulose came close, at 12.86 ± 2.63 MPa, a difference well within the scatter of the two data sets. All other formulations lost roughly half the strength of the matrix, the weakest being CH/GO3 at 4.80 ± 0.61 MPa. Every membrane failed in a brittle manner, with little or no yielding before rupture.
Young’s modulus told a different and more interesting story (Figure 4b). At 1 wt.%, all three fillers stiffened the matrix: 773 ± 104 MPa for graphite, 965 ± 76 MPa for nanocellulose and 1032 ± 65 MPa for graphene oxide, against 623 ± 67 MPa for chitosan. At 3 wt.% the effect reversed. CH/NCC3 fell to 460 ± 53 MPa, roughly 26% below the pristine matrix, and CH/GO3 to 593 ± 51 MPa. The ternary membrane, despite carrying only 1 wt.% of each filler, gave 489 ± 85 MPa — closer to the 3 wt.% single-filler films than to either 1 wt.% film, so the combined loading appears to behave as a single higher loading in mechanical terms.
Shore D hardness rose for every filled membrane and varied over a narrow range (Figure 4c). Pristine chitosan gave 69.5; the highest values were 77.0 for CH/NCC1 and 76.2 for CH/GO3, gains of 10.8% and 9.6%. The ternary membrane at 74.4 sat closer to CH/GO1 (74.3) than to CH/NCC1, which suggests that surface hardness in these films is governed more by the carbonaceous phase than by the nanocellulose.
3.5. Accelerated Ageing
Two of the seven membranes failed the ageing protocol (Figure 5). Pristine chitosan cracked visibly at the end of the first cycle, after 24 h of elapsed time and 1 h of ultrasonic exposure. CH/GO3 survived to the end of the third cycle and had ruptured by 72 h. The remaining five formulations — graphite, both nanocellulose loadings, 1 wt.% GO and the ternary membrane — completed all five cycles without macroscopic cracking.
Mass and thickness changes were concentrated in the first cycle for every specimen, consistent with the uptake data, and were small thereafter. CH and CH/GO3 were exceptions, showing continued mass variation across the five days; this is most reasonably attributed to material loss at the propagating cracks rather than to bulk degradation. Thickness measurements on those two specimens were necessarily taken away from the failed regions and should be read with that caveat.
3.6. Cell Polarisation
All seven membranes were assembled into the cell and produced polarisation curves with the expected non-linear shape (Table 5). Onset potential spanned 0.74 V across the series. Pristine chitosan required the highest voltage at 2.31 ± 0.12 V. The lowest was CH/GO3 at 1.57 ± 0.23 V, followed by CH/GO1 at 1.71 ± 0.11 V and the ternary membrane at 1.78 ± 0.17 V. Graphite gave 1.93 ± 0.18 V. Both nanocellulose formulations lowered onset relative to pristine chitosan but by the smallest margins in the series, to 1.99 ± 0.20 V at 1 wt.% and 2.09 ± 0.11 V at 3 wt.%.
Reaction rate, taken as the slope above onset, was 0.0012 A cm−2 V−1 for pristine chitosan and rose modestly to 0.0014–0.0015 A cm−2 V−1 for graphite, both GO loadings and the ternary film. CH/NCC3 was the single outlier at 0.0005 A cm−2 V−1, less than half the pristine value, and also had the poorest linear fit (R2 = 0.9734 against 0.9948–0.9988 elsewhere).
3.7. Correlations Across the Series
Treating the seven formulations as a set rather than individually brings out three relationships. First, moisture content and dispersion conductivity are inversely related (Pearson r = −0.761, p = 0.047; Figure 6): the formulations that hold the most water are the ones that conduct least, and vice versa. Second, onset potential falls as dispersion conductivity rises, monotonically and significantly (Spearman ρ = −0.857, p = 0.014; Figure 7a), with a linear slope of −0.063 V per mS cm−1. Third, and in contrast, onset potential shows no significant relationship with tensile strength (r = +0.635, p = 0.125; Figure 7b), Young’s modulus (r = −0.160, p = 0.731) or Shore D hardness (r = −0.536, p = 0.215). Reaction rate correlated with dispersion conductivity more strongly than onset did (r = +0.886, p = 0.008).
A fourth result is negative and worth stating explicitly: moisture content and equilibrium electrolyte uptake were entirely uncorrelated across the series (r = +0.057, p = 0.903). The membranes that bind the most ambient water are not the ones that swell most in electrolyte.
4. Discussion
4.1. An Antagonism Between Hydration and Transport
The central result of this series is that the two filler families do not simply differ in magnitude of effect; they differ in sign, and they do so on the two properties that matter most for a separator. Nanocellulose increases the amount of water the film holds and decreases the conductivity of the medium it is cast from. Graphene oxide does the reverse. Graphite, a cheaper and chemically much simpler material, tracks graphene oxide on conductivity while behaving differently on uptake.
The mechanism is not difficult to rationalise, though the present data constrain it only partly. Cellulose nanocrystals carry a dense surface population of hydroxyl groups and, after sulfuric acid hydrolysis, some sulfate half-ester groups as well; both bind water strongly and both are consistent with the elevated moisture content of CH/NCC1. The crystallites themselves are electrically insulating and mechanically rigid, and dispersing an insulating solid phase through a conducting liquid lowers the bulk conductivity of the mixture, which is what the dope measurements show and what the loading dependence (−12.5% at 1 wt.%, −23.2% at 3 wt.%) reinforces. Graphene oxide, by contrast, carries ionisable carboxyl groups at sheet edges that contribute mobile charge; the fact that unoxidised graphite produced a nearly identical gain (+17.3% against +18.4% for 1 wt.% GO) suggests that in a dispersion the dominant contribution may be percolative rather than chemical, and that the oxygen functionality of GO is not doing most of the work at this stage of processing.
The decoupling of moisture content from electrolyte uptake deserves comment because it is easy to conflate the two. Moisture content as measured here is the water a dried film reacquires and retains against 100 °C for 2 h — water bound to the polymer and to the filler surfaces. Electrolyte uptake is the macroscopic swelling of the film in a basic aqueous medium, which depends on how freely the network can dilate. A rigid, well-dispersed crystalline filler can raise the first while lowering the second, and CH/NCC1 does exactly that: the highest moisture content in the series (13.46%) combined with uptake 27% below the pristine film. Reporting only one of the two, as is common, would have missed this entirely.
4.2. A Ceiling Near 1 wt.%
Across every property measured, 3 wt.% was worse than 1 wt.%. Young’s modulus is the clearest case: at 1 wt.% all three fillers stiffened the matrix, with gains of 24% for graphite, 55% for nanocellulose and 66% for graphene oxide, while at 3 wt.% both nanofillers fell below the pristine value. Tensile strength shows the same reversal, and CH/GO3 was the only composite to fail the ageing protocol. The conventional explanation — that above a dispersion limit the filler agglomerates and the agglomerates act as stress concentrators and defect sites rather than as reinforcement — is consistent with everything observed here, and with the scanning electron microscopy reported for these films in the companion study [23].
The ternary membrane is instructive on this point. It carries 1 wt.% of each filler, and on mechanical measures it behaves like a 3 wt.% single-filler film rather than like either 1 wt.% film: 489 MPa modulus against 965 and 1032 MPa for CH/NCC1 and CH/GO1. Total filler content, not the identity of the individual fillers, appears to set the mechanical ceiling. Its conductivity and onset potential, on the other hand, fell between the two families rather than below both, so the antagonism described above partially cancels while the dispersion penalty accumulates. Anyone combining fillers in this matrix should expect that asymmetry.
4.3. Transport, Not Mechanics, Predicts Cell Behaviour
Onset potential correlated significantly with dispersion conductivity and with nothing mechanical. This is a useful practical result even though the correlation is descriptive and rests on seven points. Membrane development in this area is often driven by tensile and hardness data because those measurements are quick and the specimens are easy to prepare, and the implicit assumption is that a mechanically better membrane will perform better in the cell. In this series that assumption fails: CH/NCC1 was by a wide margin the mechanically best composite, retaining essentially all the tensile strength of the matrix while adding 55% to its modulus and 10.8% to its hardness, and it was among the poorest performers electrochemically, cutting onset by only 0.32 V. CH/GO3, the weakest and least durable film in the series, gave the lowest onset potential of all.
The trade-off this sets up is between performance and survival, and it is not resolvable by choosing a single best formulation. CH/GO3 gives the best onset and fails within three days of accelerated ageing. CH/NCC1 survives comfortably and barely improves the cell. The ternary membrane and CH/GO1 both sit in between, and on the present data CH/GO1 is arguably the better compromise of the two — comparable onset (1.71 V against 1.78 V), higher modulus (1032 against 489 MPa), higher tensile strength, and the same clean pass through the ageing protocol — with the ternary formulation’s advantage lying in its lower electrolyte uptake and in behaviour under continuous operation that is outside the scope of this comparison [23].
4.4. Limitations
Three limitations bear directly on how these results should be used. First, the conductivity reported here is that of the casting dispersion, measured before drying, and not the through-plane ionic or proton conductivity of the finished membrane. It is a property of the dope, and the correlation with cell onset potential — although significant — is empirical. Establishing that filler chemistry alters membrane conductivity itself would require electrochemical impedance spectroscopy on the dried films in a conductivity cell, which was not performed and which we regard as the necessary next step for this system.
Second, the cell was operated with 1 wt.% aqueous KOH. It is therefore an alkaline configuration with a polymer separator and platinum electrodes, not a proton-exchange membrane assembly with catalyst-coated electrodes, and the onset potentials reported here are not directly comparable to figures quoted for PFSA-based PEM electrolysers. They are internally comparable across the seven membranes, which is what the present argument requires, and no claim is made beyond that.
Third, the correlations rest on seven formulations, and with n = 7 the confidence intervals on the coefficients are wide. They are offered as a description of the structure of this data set — a way of seeing that hydration and transport move oppositely and that mechanics does not predict cell behaviour — rather than as a quantitative model. A wider composition grid, with intermediate loadings between 1 and 3 wt.%, would be needed to locate the dispersion ceiling with any precision.
5. Conclusions
Seven chitosan membranes differing only in filler chemistry and loading were cast under a single protocol from biopolymer extracted in-house and characterised as a set. The comparison yields four conclusions.
Carbonaceous and lignocellulosic fillers act in opposite directions on hydration and on ionic transport. Nanocellulose raised moisture content to 13.46% from 11.00% while lowering dispersion conductivity by 12.5–23.2%; graphene oxide lowered moisture to 6.42% while raising conductivity by 18.4–25.9%. Across the series the two properties were inversely correlated (r = −0.761, p = 0.047). Filler selection is consequently a compromise between water management and transport, not a single optimisation.
Intrinsic water retention and macroscopic electrolyte swelling are independent properties and should be measured separately. They were entirely uncorrelated here (r = +0.057, p = 0.903), and the membrane with the highest moisture content, CH/NCC1, also took up 27% less electrolyte than the pristine film.
A loading of 1 wt.% is close to the practical ceiling for this casting route. All three fillers stiffened the matrix at 1 wt.%, by 24–66%, and both nanofillers reduced modulus below the pristine value at 3 wt.%. The ternary membrane, carrying 1 wt.% of each filler, behaved mechanically as a 3 wt.% film, indicating that total loading rather than filler identity governs the mechanical limit.
Cell onset potential tracked dispersion conductivity (Spearman ρ = −0.857, p = 0.014) and was unrelated to any mechanical property measured. Screening membrane formulations on tensile or hardness data alone is therefore unlikely to identify the formulations that improve the cell; in this series the mechanically strongest composite was among the electrochemically weakest, and the reverse held as well.
Confirming that these relationships survive in the dried membrane, by impedance spectroscopy on the films rather than conductimetry on the dopes, is the obvious next step, and the more important one for translating this comparison into a design rule.
Author Contributions
S.L.S.d.M.: conceptualisation, methodology, investigation, formal analysis, data curation, visualisation, writing — original draft. E.P.d.D.: conceptualisation, supervision, resources, funding acquisition, writing — review and editing. All authors have read and agreed to the published version of the manuscript.
Funding
This work was carried out with the support of the Financiadora de Estudos e Projetos (FINEP) and ARGOTECH, which fund the research group. [Authors: insert the FINEP grant/agreement number and, where applicable, the ARGOTECH contract reference here before submission — MDPI requires the funding source followed by the grant number, in that order.] The experimental materials on which this study is based were produced with support from the Fundação Cearense de Apoio ao Desenvolvimento Científico e Tecnológico (FUNCAP). [Authors: keep this sentence only if FUNCAP support applies to the work reported here; delete it otherwise.].
Institutional Review Board Statement
Not applicable.
Informed Consent Statement
Not applicable.
Data Availability Statement
The data presented in this study are available on request from the corresponding author. The underlying experimental work forms part of the doctoral thesis of S.L.S.d.M., openly available in the institutional repository of the Universidade Federal do Ceará.
Acknowledgments
The authors thank FINEP and ARGOTECH for their continued support of the research group, the Departamento de Engenharia Metalúrgica e de Materiais of the Universidade Federal do Ceará for laboratory and academic support, the Central Analítica-UFC for the electron microscopy facilities, and Prof. José Osvaldo Beserra Carioca (PADETEC) for guidance during the chitin extraction work. The authors also thank the LAMEFF team.
References
- Carmo, M.; Fritz, D.L.; Mergel, J.; Stolten, D. A Comprehensive Review on PEM Water Electrolysis. Int. J. Hydrogen Energy 2013, 38, 4901–4934. [Google Scholar] [CrossRef]
- Barbir, F. PEM Electrolysis for Production of Hydrogen from Renewable Energy Sources. Sol. Energy 2005, 78, 661–669. [Google Scholar] [CrossRef]
- Salehmin, M.N.I.; Husaini, T.; Goh, J.; Sulong, A.B. High-Pressure PEM Water Electrolyser: A Review on Challenges and Mitigation Strategies towards Green and Low-Cost Hydrogen Production. Energy Convers. Manag. 2022, 268, 115985. [Google Scholar] [CrossRef]
- Selamet, Ö.F.; Becerikli, F.; Mat, M.D.; Kaplan, Y. Development and Testing of a Highly Efficient Proton Exchange Membrane (PEM) Electrolyzer Stack. Int. J. Hydrogen Energy 2011, 36, 11480–11487. [Google Scholar] [CrossRef]
- Hernández-Flores, G.; Poggi-Varaldo, H.M.; Solorza-Feria, O. Comparison of Alternative Membranes to Replace High Cost Nafion Ones in Microbial Fuel Cells. Int. J. Hydrogen Energy 2016, 41, 23354–23362. [Google Scholar] [CrossRef]
- Rozendal, R.A.; Hamelers, H.V.M.; Buisman, C.J.N. Effects of Membrane Cation Transport on pH and Microbial Fuel Cell Performance. Environ. Sci. Technol. 2006, 40, 5206–5211. [Google Scholar] [CrossRef] [PubMed]
- Hassan, M.E.; Bai, J.; Dou, D.-Q. Biopolymers: Definition, Classification and Applications. Egypt. J. Chem. 2019, 62, 1725–1737. [Google Scholar] [CrossRef]
- Biswas, S.; Pal, A. Application of Biopolymers as a New Age Sustainable Material for Surfactant Adsorption: A Brief Review. Carbohydr. Polym. Technol. Appl. 2021, 2, 100145. [Google Scholar] [CrossRef]
- Pakizeh, M.; Moradi, A.; Ghassemi, T. Chemical Extraction and Modification of Chitin and Chitosan from Shrimp Shells. Eur. Polym. J. 2021, 159, 110709. [Google Scholar] [CrossRef]
- Mukoma, P.; Jooste, B.R.; Vosloo, H.C.M. Synthesis and Characterization of Cross-Linked Chitosan Membranes for Application as Alternative Proton Exchange Membrane Materials in Fuel Cells. J. Power Sources 2004, 136, 16–23. [Google Scholar] [CrossRef]
- Mukoma, P.; Jooste, B.R.; Vosloo, H.C.M. A Comparison of Methanol Permeability in Chitosan and Nafion 117 Membranes at High to Medium Methanol Concentrations. J. Membr. Sci. 2004, 243, 293–299. [Google Scholar] [CrossRef]
- Ma, J.; Sahai, Y.; Buchheit, R.G. A High-Performance Direct Borohydride Fuel Cell Employing Cross-Linked Chitosan Membrane. J. Power Sources 2011, 196, 8257–8264. [Google Scholar] [CrossRef]
- Wu, H.; Zheng, B.; Zheng, X.; Wang, J.; Yuan, W.; Jiang, Z. Surface-Modified Y Zeolite-Filled Chitosan Membrane for Direct Methanol Fuel Cell. J. Power Sources 2007, 173, 842–852. [Google Scholar] [CrossRef]
- Junceda-Mena, I.; García-Junceda, E.; Revuelta, J. From the Problem to the Solution: Chitosan Valorization Cycle. Carbohydr. Polym. 2023, 309, 120674. [Google Scholar] [CrossRef] [PubMed]
- Assis, O.B.G.; Silva, V.L. Caracterização Estrutural e da Capacidade de Absorção de Água em Filmes Finos de Quitosana Processados em Diversas Concentrações. Polímeros 2003, 13, 223–228. [Google Scholar] [CrossRef]
- Shirdast, A.; Sharif, A.; Abdollahi, M. Effect of the Incorporation of Sulfonated Chitosan/Sulfonated Graphene Oxide on the Proton Conductivity of Chitosan Membranes. J. Power Sources 2016, 306, 541–551. [Google Scholar] [CrossRef]
- Tian, L.; Zhang, J.; Wang, S.; Li, H. Dual-Site Supported Graphene Oxide Membrane with Enhanced Permeability and Selectivity. J. Membr. Sci. 2022, 646, 120223. [Google Scholar] [CrossRef]
- Han, Y.; Wang, J.; Zhang, H.; Zhao, S.; Ma, Q.; Wang, Z. Effect of Graphene Oxide Content on the Mechanical and Thermal Properties of Chitosan Composite Films. Carbohydr. Polym. 2016, 153, 110–118. [Google Scholar]
- Tayeb, P.; Tayeb, A.H. Nanocellulose Applications in Sustainable Electrochemical and Piezoelectric Systems: A Review. Carbohydr. Polym. 2019, 224, 115149. [Google Scholar] [CrossRef] [PubMed]
- Luo, H.; Cha, R.; Li, J.; Hao, W.; Zhang, Y.; Zhou, F. Advances in Tissue Engineering of Nanocellulose-Based Scaffolds: A Review. Carbohydr. Polym. 2019, 224, 115144. [Google Scholar] [CrossRef] [PubMed]
- Habibi, M.K.; Lu, Y. Crack Propagation in Bamboo’s Hierarchical Cellular Structure. Sci. Rep. 2014, 4, 5598. [Google Scholar] [CrossRef] [PubMed]
- Youssefian, S.; Rahbar, N. Molecular Origin of Strength and Stiffness in Bamboo Fibrils. Sci. Rep. 2015, 5, 11116. [Google Scholar] [CrossRef] [PubMed]
- COMPANION PAPER — insert full citation and status, e.g., “Melo, S.L.S.; Pontes de Deus, E. Synergistic Effect of Nanocellulose and Graphene Oxide on Sustainable Chitosan-Based Proton Exchange Membranes for PEM Water Electrolysis. Journal name, year, under review.”
- Lee, S.H.; Wang, S. Biodegradable Polymers/Bamboo Fiber Biocomposite with Bio-Based Coupling Agent. Compos. Part A Appl. Sci. Manuf. 2006, 37, 80–91. [Google Scholar] [CrossRef]
- Buson, R.F.; Melo, R.P.; Silva, R.V.; Marques, M.F.V. Physical and Mechanical Characterization of Surface Treated Bamboo Fibers. Sci. Technol. Mater. 2018, 30, 67–73. [Google Scholar] [CrossRef]
- Costa, M.M.E.; Melo, R.P.; Marques, M.F.V. Influence of Physical and Chemical Treatments on the Mechanical Properties of Bamboo Fibers. Procedia Eng. 2017, 200, 457–464. [Google Scholar] [CrossRef]
- Pawcenis, D.; Leśniak, M.; Szumera, M.; Sitarz, M.; Profic-Paczkowska, J. Effect of Hydrolysis Time, pH and Surfactant Type on Stability of Hydrochloric Acid Hydrolyzed Nanocellulose. Int. J. Biol. Macromol. 2022, 222, 1996–2005. [Google Scholar] [CrossRef] [PubMed]
- Thi Thanh Hop, T.; Mai, D.T.; Duy Trinh, N.; Hoang Thai, N. A Comprehensive Study on Preparation of Nanocellulose from Bleached Wood Pulps by TEMPO-Mediated Oxidation. Results Chem. 2022, 4, 100540. [Google Scholar] [CrossRef]
- Yang, T.; Li, X.; Guo, Y.; Peng, S.; Liu, G.; Zhao, J. Preparation of Nanocellulose Crystal from Bleached Pulp with an Engineering Cellulase and Co-Production of Ethanol. Carbohydr. Polym. 2023, 301, 120291. [Google Scholar] [CrossRef] [PubMed]
- Udayakumar, G.P.; Muthusamy, S.; Selvaganesh, B.; Sivarajasekar, N.; Rambabu, K.; Banat, F. Ecofriendly Biopolymers and Composites: Preparation and Their Applications in Water-Treatment. Biotechnol. Adv. 2021, 52, 107815. [Google Scholar] [CrossRef] [PubMed]
- Qiu, Z.; Chen, Y.; Zhang, L.; Wang, J. Enhanced Water Permeability and Rejection of As(III) in Groundwater by Nanochannels and Active Center Formed in Nanofibrillated Celluloses UF Membranes with ZIF-8. J. Membr. Sci. 2022, 646, 120255. [Google Scholar] [CrossRef]
- Lin, J.; Wang, Y.; Chen, H.; Zhang, X. Regulating the Structure of Cellulose-Based Ultrafiltration Membrane to Improve Its Performance for Water Purification. Ind. Crops Prod. 2023, 192, 116082. [Google Scholar] [CrossRef]
- Feng, Q.; Yuan, X.-Z.; Liu, G.; Wei, B.; Zhang, Z.; Li, H.; Wang, H. A Review of Proton Exchange Membrane Water Electrolysis on Degradation Mechanisms and Mitigation Strategies. J. Power Sources 2017, 366, 33–55. [Google Scholar] [CrossRef]
- Zhu, D.; Yang, Y.; Ma, T. High-Precision Identification of Polarization Processes of Distribution of Relaxation Times by Polarization Curve Model for Proton Exchange Membrane Fuel Cell. Energy Convers. Manag. 2022, 268, 115994. [Google Scholar] [CrossRef]
- Qian, X.; Kim, K.; Jung, S. Multiphase, Multidimensional Modeling of Proton Exchange Membrane Water Electrolyzer. Energy Convers. Manag. 2022, 268, 116070. [Google Scholar] [CrossRef]
- do Sacramento, E.M.; Carvalho, P.C.M.; Lima, L.C.; Veziroglu, T.N. A Hydrogen Energy System and Prospects for Reducing Emissions of Fossil Fuels Pollutants in the Ceará State — Brazil. Int. J. Hydrogen Energy 2008, 33, 2132–2137. [Google Scholar] [CrossRef]
Figure 1.
Proximate analysis of the seven membranes: (a) moisture content, with the pristine chitosan value marked; (b) dry-basis composition. Hatched bars denote 3 wt.% loadings.
Figure 1.
Proximate analysis of the seven membranes: (a) moisture content, with the pristine chitosan value marked; (b) dry-basis composition. Hatched bars denote 3 wt.% loadings.
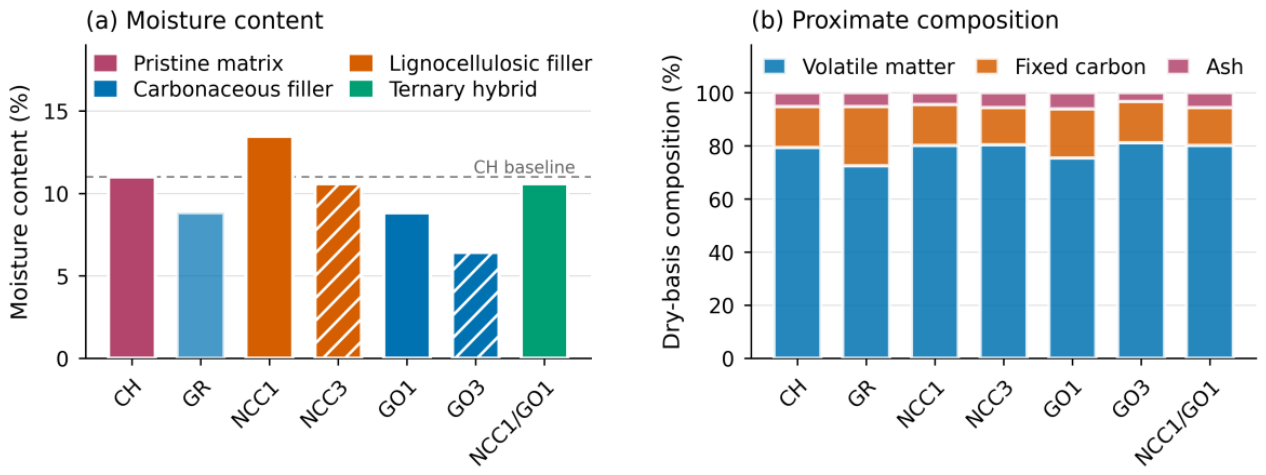
Figure 2.
Electrolyte uptake kinetics in 1 wt.% KOH. Solid lines denote pristine chitosan, graphite and the ternary membrane; dotted and dashed lines denote 1 and 3 wt.% nanofiller loadings respectively. The time axis is logarithmic.
Figure 2.
Electrolyte uptake kinetics in 1 wt.% KOH. Solid lines denote pristine chitosan, graphite and the ternary membrane; dotted and dashed lines denote 1 and 3 wt.% nanofiller loadings respectively. The time axis is logarithmic.
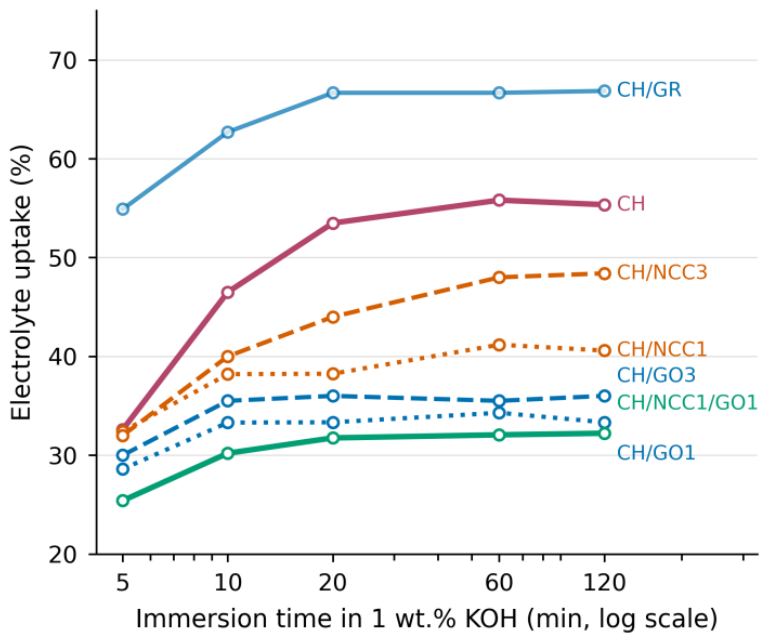
Figure 3.
Conductivity of the casting dispersions measured in situ before drying. Error bars are standard deviations of five readings. Percentages give the change relative to the pristine chitosan dope.
Figure 3.
Conductivity of the casting dispersions measured in situ before drying. Error bars are standard deviations of five readings. Percentages give the change relative to the pristine chitosan dope.
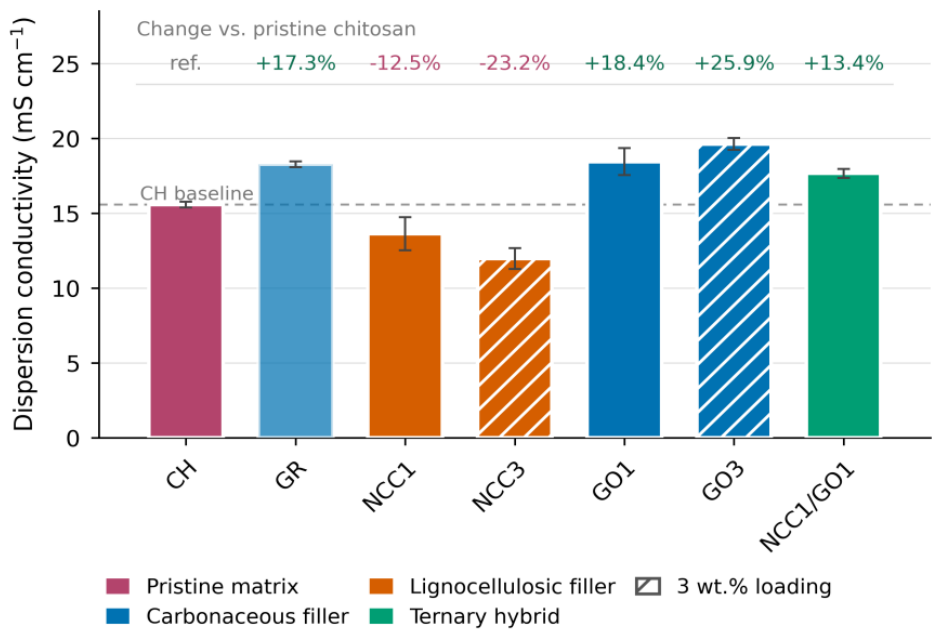
Figure 4.
Mechanical response of the series: (a) tensile strength, (b) Young’s modulus, (c) Shore D hardness. Dashed lines mark the pristine chitosan value. Error bars are standard deviations.
Figure 4.
Mechanical response of the series: (a) tensile strength, (b) Young’s modulus, (c) Shore D hardness. Dashed lines mark the pristine chitosan value. Error bars are standard deviations.
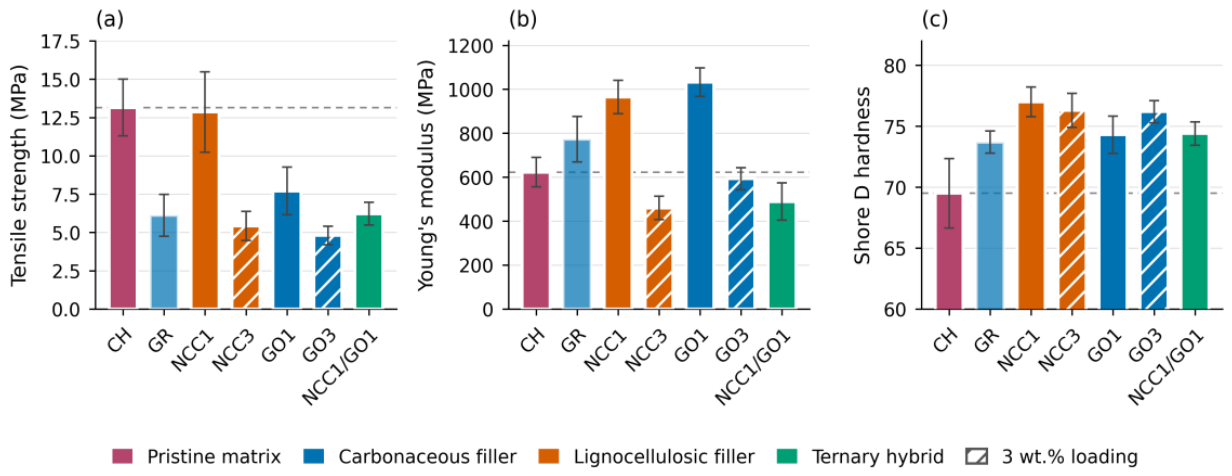
Figure 5.
Survival under the ultrasonic ageing protocol (1 h at 40 kHz and 50 °C in 1 wt.% KOH, once every 24 h for five days). Bars terminate at the cycle in which macroscopic rupture was first observed.
Figure 5.
Survival under the ultrasonic ageing protocol (1 h at 40 kHz and 50 °C in 1 wt.% KOH, once every 24 h for five days). Bars terminate at the cycle in which macroscopic rupture was first observed.
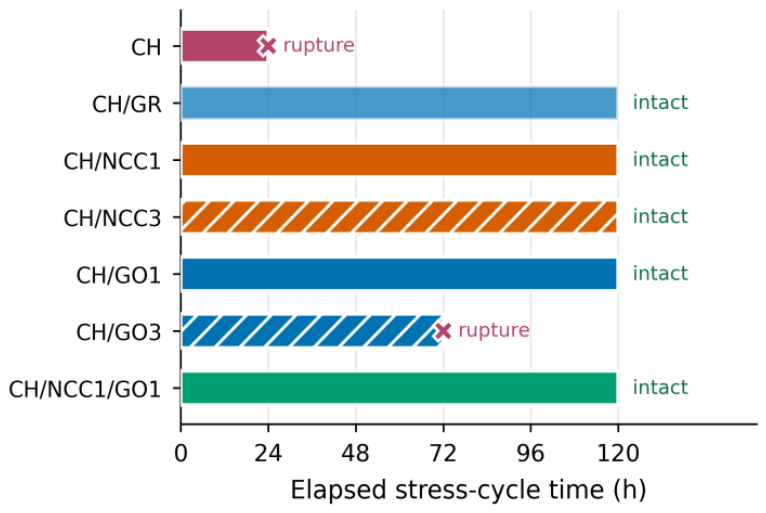
Figure 6.
Moisture content against dispersion conductivity across the seven formulations. The dashed line is a least-squares fit shown to indicate the trend, not as a predictive model.
Figure 6.
Moisture content against dispersion conductivity across the seven formulations. The dashed line is a least-squares fit shown to indicate the trend, not as a predictive model.
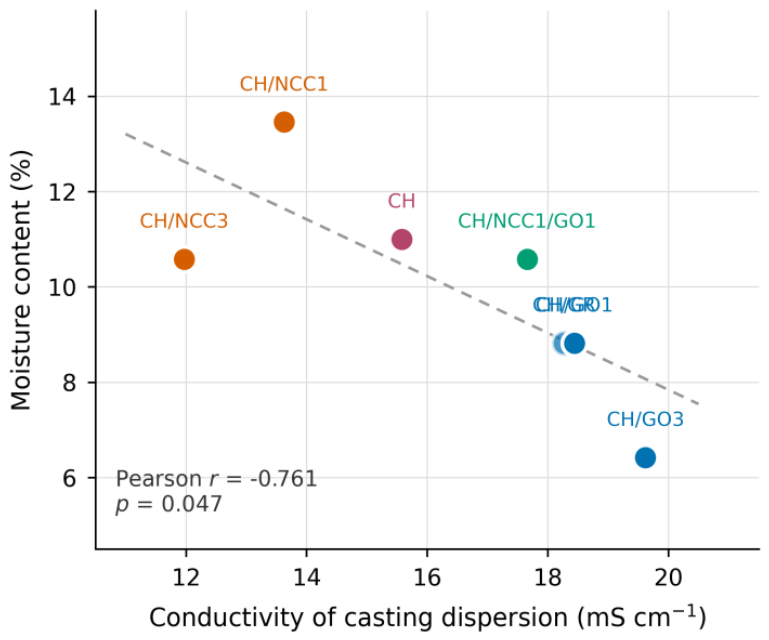
Figure 7.
Electrolysis onset potential against (a) the conductivity of the casting dispersion and (b) tensile strength. Error bars are standard deviations on both axes.
Figure 7.
Electrolysis onset potential against (a) the conductivity of the casting dispersion and (b) tensile strength. Error bars are standard deviations on both axes.
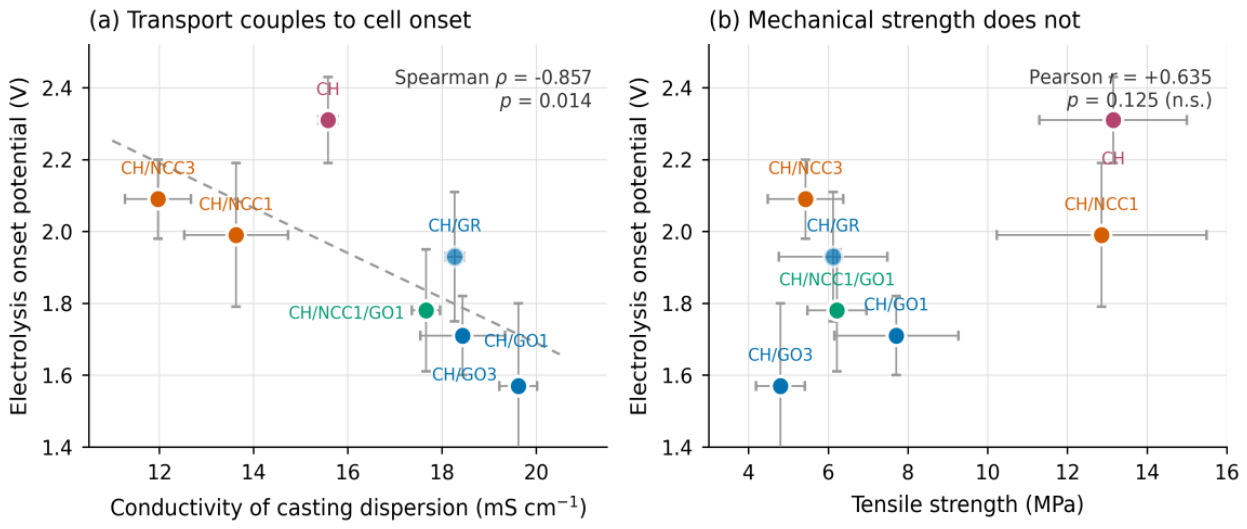

Table 1.
Membrane formulations and sample codes. Filler loadings are given as weight percent relative to chitosan.
Table 1.
Membrane formulations and sample codes. Filler loadings are given as weight percent relative to chitosan.
| Code | Composition | Filler family | Loading (wt.%) |
|---|---|---|---|
| CH | Pristine chitosan | — | — |
| CH/GR | Chitosan + graphite | Carbonaceous | 1 |
| CH/NCC1 | Chitosan + cellulose nanocrystals | Lignocellulosic | 1 |
| CH/NCC3 | Chitosan + cellulose nanocrystals | Lignocellulosic | 3 |
| CH/GO1 | Chitosan + graphene oxide | Carbonaceous | 1 |
| CH/GO3 | Chitosan + graphene oxide | Carbonaceous | 3 |
| CH/NCC1/GO1 | Chitosan + NCC + graphene oxide | Ternary | 1 + 1 |
Table 2.
Proximate analysis of the membranes (ABNT NBR 8112). Fixed carbon and organic matter are obtained by difference.
Table 2.
Proximate analysis of the membranes (ABNT NBR 8112). Fixed carbon and organic matter are obtained by difference.
| Sample | Moisture (%) | Volatiles (%) | Ash (%) | Fixed C (%) | Organic (%) |
|---|---|---|---|---|---|
| CH | 11.00 | 79.40 | 5.21 | 15.39 | 94.79 |
| CH/GR | 8.82 | 72.50 | 5.23 | 22.27 | 94.77 |
| CH/NCC1 | 13.46 | 80.20 | 4.40 | 15.40 | 95.60 |
| CH/NCC3 | 10.58 | 80.37 | 5.61 | 14.02 | 94.39 |
| CH/GO1 | 8.82 | 75.48 | 6.11 | 18.41 | 93.89 |
| CH/GO3 | 6.42 | 81.20 | 3.23 | 15.57 | 96.77 |
| CH/NCC1/GO1 | 10.58 | 80.10 | 5.60 | 14.30 | 94.40 |
Table 3.
Electrolyte uptake (percentage mass gain relative to the dry membrane) in 1 wt.% aqueous KOH.
Table 3.
Electrolyte uptake (percentage mass gain relative to the dry membrane) in 1 wt.% aqueous KOH.
| Sample | 5 min | 10 min | 20 min | 60 min | 120 min |
|---|---|---|---|---|---|
| CH | 32.6 | 46.5 | 53.5 | 55.8 | 55.4 |
| CH/GR | 54.9 | 62.7 | 66.7 | 66.7 | 66.9 |
| CH/NCC1 | 32.4 | 38.2 | 38.2 | 41.2 | 40.6 |
| CH/NCC3 | 32.0 | 40.0 | 44.0 | 48.0 | 48.4 |
| CH/GO1 | 28.6 | 33.3 | 33.3 | 34.3 | 33.3 |
| CH/GO3 | 30.0 | 35.5 | 36.0 | 35.5 | 36.0 |
| CH/NCC1/GO1 | 25.4 | 30.2 | 31.8 | 32.1 | 32.2 |
Table 4.
Mechanical properties and surface hardness. Values are means ± standard deviation of four to five specimens; hardness is the mean of five indentations.
Table 4.
Mechanical properties and surface hardness. Values are means ± standard deviation of four to five specimens; hardness is the mean of five indentations.
| Sample | Tensile strength (MPa) | Young’s modulus (MPa) | Shore D hardness |
|---|---|---|---|
| CH | 13.15 ± 1.85 | 623 ± 67 | 69.5 ± 2.8 |
| CH/GR | 6.12 ± 1.36 | 773 ± 104 | 73.7 ± 0.8 |
| CH/NCC1 | 12.86 ± 2.63 | 965 ± 76 | 77.0 ± 1.2 |
| CH/NCC3 | 5.43 ± 0.95 | 460 ± 53 | 76.3 ± 1.4 |
| CH/GO1 | 7.71 ± 1.56 | 1032 ± 65 | 74.3 ± 1.5 |
| CH/GO3 | 4.80 ± 0.61 | 593 ± 51 | 76.2 ± 0.9 |
| CH/NCC1/GO1 | 6.22 ± 0.74 | 489 ± 85 | 74.4 ± 0.9 |
Table 5.
Dispersion conductivity and electrochemical parameters in the two-compartment cell. Onset potentials are means ± standard deviation; R2 refers to the linear fit of current density against voltage above onset.
Table 5.
Dispersion conductivity and electrochemical parameters in the two-compartment cell. Onset potentials are means ± standard deviation; R2 refers to the linear fit of current density against voltage above onset.
| Sample | Dispersion σ (mS cm−1) | Onset (V) | Rate (A cm−2 V−1) | R2 |
|---|---|---|---|---|
| CH | 15.58 ± 0.20 | 2.31 ± 0.12 | 0.0012 | 0.9984 |
| CH/GR | 18.27 ± 0.20 | 1.93 ± 0.18 | 0.0014 | 0.9962 |
| CH/NCC1 | 13.63 ± 1.10 | 1.99 ± 0.20 | 0.0012 | 0.9980 |
| CH/NCC3 | 11.97 ± 0.70 | 2.09 ± 0.11 | 0.0005 | 0.9734 |
| CH/GO1 | 18.44 ± 0.90 | 1.71 ± 0.11 | 0.0014 | 0.9948 |
| CH/GO3 | 19.62 ± 0.40 | 1.57 ± 0.23 | 0.0015 | 0.9983 |
| CH/NCC1/GO1 | 17.66 ± 0.30 | 1.78 ± 0.17 | 0.0014 | 0.9988 |
Disclaimer/Publisher’s Note: The statements, opinions and data contained in all publications are solely those of the individual author(s) and contributor(s) and not of MDPI and/or the editor(s). MDPI and/or the editor(s) disclaim responsibility for any injury to people or property resulting from any ideas, methods, instructions or products referred to in the content. |
© 2026 by the authors. Licensee MDPI, Basel, Switzerland. This article is an open access article distributed under the terms and conditions of the Creative Commons Attribution (CC BY) license (http://creativecommons.org/licenses/by/4.0/).
Copyright: This open access article is published under a Creative Commons CC BY 4.0 license, which permit the free download, distribution, and reuse, provided that the author and preprint are cited in any reuse.