
Submitted:
17 September 2026
Posted:
18 September 2026
You are already at the latest version
Abstract
Wearable devices, such as the Empatica E4, are increasingly used to assess stress-related electrodermal activity (EDA). The EmbracePlus has replaced the widely used Empatica E4. This study evaluated the validity of the EmbracePlus by comparing wrist-worn EDA measurements with the Shimmer3 GSR+ across signal-, parameter-, and event-level analyses. Healthy volunteers (n=53) completed breathing exercises, a Stroop stress task, and a virtual reality (VR) height stressor while wearing both devices simultaneously on the non-dominant wrist. Signal-level agreement was assessed using cross-correlation, parameter-level agreement using Bland–Altman analyses of mean skin conductance level (SCL), total phasic activity, skin conductance response (SCR) amplitude, and SCR count, and event-level agreement using within-device baseline-to-task comparisons and inter-device difference plots with a priori acceptability boundaries. Signal-level agreement was weak-to-moderate. Shimmer3 yielded systematically higher values across all metrics, indicating limited agreement in absolute EDA values. Shimmer3 detected significant increases across all metrics during both stress tasks. EmbracePlus detected the stronger VR stressor across all metrics, whereas during the milder Stroop task only total phasic activity and mean SCL increased. These findings indicate that EmbracePlus and Shimmer3 are not interchangeable for absolute EDA assessment and that EmbracePlus validity depends on stressor intensity and metric selection.
Keywords:
electrodermal activity
; wearable validation
; EmbracePlus
; Shimmer3 GSR+
; stress
1. Introduction
Stress is a complex phenomenon that plays a major role in both physical and mental health [1]. It is commonly defined as a disruption of homeostasis triggered by internal or external stressors that activate the autonomic nervous system [2]. This activation results in measurable physiological responses, including changes in cardiac activity, skin temperature, and sweat gland activity [3]. Electrodermal activity (EDA), which reflects sweat gland activity under sympathetic control, is widely regarded as a direct and sensitive marker of physiological stress [3,4] and is frequently used to assess stress.
Wearable sensors increasingly facilitate continuous, non-invasive monitoring of EDA, both in controlled laboratory settings and in everyday contexts [5]. This is particularly relevant, as wearables allow stress responses to be captured in real-life situations rather than being restricted to short laboratory sessions [6]. Continuous and ambulatory monitoring of stress has the potential to provide insight into daily fluctuations, support early detection of maladaptive stress responses, and inform personalized interventions in both research and healthcare [5]. At the same time, wearable devices differ substantially in electrode placement, signal quality, data accessibility, and degree of validation [6,7]. Such variability complicates the scientific interpretability and comparability of findings across studies. These challenges are particularly relevant when established devices are replaced by newer ones, as evidence from past validation studies does not necessarily transfer to their successors.
In stress research, the Empatica E4 (Empatica Inc., Milan, Italy) has been widely adopted and is among the most frequently used devices for wearable EDA measurement. It has been applied in both clinical and experimental studies and evaluated in several validation efforts [5,7]. However, the Empatica E4 was discontinued in 2025, and Empatica introduced the EmbracePlus as its successor. The EmbracePlus is CE/MDR certified and, for EDA measurement, uses dry electrodes at the wrist, making it relevant for evaluation in applied and clinical contexts. The EmbracePlus has already been adopted in applied research contexts, for instance to detect agitation in dementia patients [8], to evaluate music-based biofeedback interventions for stress reduction in people with mild intellectual disabilities [9], and to evaluate heart rate accuracy alongside other wearables [10]. Initial comparative work further suggests that the EmbracePlus can capture stress-related EDA responses relative to a medical-grade reference system, although this work has primarily focused on signal fidelity, peak detection, and artifact behavior rather than on a broader validation of derived EDA metrics [11]. More recently, an exploratory comparison with the Empatica E4 [12] found lower absolute EDA values for the EmbracePlus, while relative task-related patterns were broadly comparable between devices. However, this comparison was based on separate participant cohorts rather than simultaneous recordings, limiting conclusions about direct device agreement. Therefore, direct within-participant validation of EmbracePlus EDA against a simultaneously recorded research-grade reference device remains limited.
Validation of wearable measurements is crucial, since the choice of device strongly influences measurement quality, and differences in electrode type, placement, and signal processing can substantially affect reliability [6,7]. In this study, we focus on wrist-worn measurement, and systematically assess the validity of the EmbracePlus. We compare it to the Shimmer3 GSR+ (Shimmer Research, Dublin, Ireland), a research-grade device that also allows EDA to be recorded at the wrist, in a standardized laboratory setting. A multi-level validation framework is applied, i.e., signal-, parameter-, and event-level analyses [7], to evaluate device agreement and the ability of the EmbracePlus to detect stress-related changes.
2. Materials and Methods
2.1. Participants
Healthy volunteers (n=53; 29 males, 24 females; mean age = 30.1 years, SD = 11.8) were included in this study. Participants were recruited via convenience sampling among students, employees, and affiliates of Fontys University of Applied Sciences in Eindhoven, Netherlands. Eligibility criteria included being at least 16 years of age, able to communicate in Dutch or English, and free of conditions or medications that could influence stress reactivity in our study (e.g., beta-blockers, acrophobia, balance problems, or color blindness).
2.2. Ethical Considerations
The study was conducted in accordance with the ethical guidelines of the Declaration of Helsinki. The Fontys Committee of Research’ Ethics approved the study (approval code “peeters-schaap250325”). All participants provided written informed consent. Participation was voluntary, with the right to withdraw at any time. All data were anonymized and handled in accordance with the European General Data Protection Regulation (GDPR).
2.3. Measuring Instruments
2.3.1. Physiological Measurements
EDA was measured wirelessly using two wearable devices: The EmbracePlus (Empatica Inc., Milan, Italy): a CE-marked and MDR Class 2A registered wrist-worn device, using dry electrodes on the ventral side of the wrist. Secondly, the Shimmer3 GSR+ Unit (Shimmer Sensing, Dublin, Ireland) was used: a CE marked and research-grade device using wet Ag/AgCl electrodes. Both devices were worn simultaneously on the non-dominant wrist (see Figure 1). The EmbracePlus was placed in its default wristwatch position, while the Shimmer3 GSR+ electrodes were placed distally on the same wrist, approximately 1 cm apart from the EmbracePlus electrodes to avoid signal interference. Both devices recorded EDA at a sampling rate of 4 Hz throughout the entire session. EDA data from the EmbracePlus were collected using the Care Lab application by Empatica (version 5.56.4), while data from the Shimmer3 GSR+ were acquired using the free version of ConsensysBasic software (Shimmer Sensing, version 1.6.0).
2.3.2. Subjective Perceived Stress
Self-reported perceived stress was assessed after each task (excluding the baseline) using a visual numeric rating scale shown as a stress thermometer (see Figure 2). Participants were asked, “How stressed did you feel during this task?” and instructed to respond with a number from 0 (not at all stressed) to 10 (extremely stressed). Responses were communicated verbally by participants, and written down by the researcher.
2.4. Procedure
All participants were tested individually in a quiet, temperature-controlled lab setting. After informed consent and a short demographic questionnaire (i.e., gender and age), the ventral side of the non-dominant wrist was cleaned with 70% isopropyl alcohol by using Comed Alcomed Pads (Strasbourg, France) and both the EmbracePlus and Shimmer3 GSR+ devices were placed (see Figure 1). Two trained researchers remained in the room while conducting the experiment, observing and logging data. Each session followed a fixed timeline of approximately 35 minutes (see Figure 3) including five phases:
- Start recording session
Participants were seated in a relaxed upright position. The main instruction was: “Please sit still and relax for the next 15 minutes”. During this phase, participants received instructions and/or answers to their questions regarding the experiment. This baseline period served to provide good contact between the electrodes and the skin, especially for the EmbracePlus’ dry electrodes.
- 2.
- Breathing Exercise 1 (3.5 minutes)
The experimenter sat nearby and verbally guided the participant through repetitions of the 4-7-8 breathing technique [14]. The timing of inhalation (4 seconds), holding (7 seconds), and exhalation (8 seconds) was counted aloud, with a short pause before each new repetition. The total duration of the exercise was approximately 3.5 minutes. Participants were informed that they could choose whether to keep their eyes open or closed during the exercise.
- 3.
- Stroop Task (twice; 4 minutes)
A computerized version of the Stroop Color-Word Task [15] was presented on a laptop using a custom-built PowerPoint slideshow in full-screen mode. Each slide requiring a verbal response was displayed for 0.8 seconds. To enhance performance pressure and cognitive stress, participants were encouraged to achieve a high score, and the number of correct and incorrect responses was monitored. The task consisted of four sequential phases. In the first phase, participants were shown 20 slides containing a single color word (e.g., “red”) in black font. They were instructed to read each word aloud. In the second phase, another 20 slides were presented, this time showing only solid background colors without any text. Participants were instructed to name the displayed color aloud. In the third phase, 10 slides were shown in which the color of the text was incongruent with the written word (e.g., “yellow” written in blue ink). Participants were instructed to name the ink color of the word, rather than reading the word itself, and to respond as quickly and accurately as possible. The fourth and final phase included 11 slides that presented a color word in incongruent ink color on a mismatching background color, further increasing the complexity of the task. After approximately 15 seconds, participants were instructed to repeat the Stroop task with the explicit instruction to improve their score compared to the first attempt.
- 4.
- Breathing Exercise 2 (3.5 minutes)
Identical to Breathing Exercise 1.
- 5.
- Stressor 2 – Virtual Reality (3 minutes
Participants wore a Meta Quest 1 VR headset (Meta Platforms Inc.) and engaged with the immersive game Richie’s Plank Experience (Toast VR, Australia). In this scenario, participants were instructed to enter a virtual elevator, ascend to a high floor (80 stories high), and walk out onto a narrow plank suspended above a virtual city. To enhance realism and embodiment, a physical wooden plank (180*14.5 cm) was placed on the laboratory floor and carefully calibrated to match the virtual plank’s dimensions and position. Participants were encouraged to physically walk onto the plank while immersed in the VR environment, inducing a height illusion intended to elicit a stress response. They were given the option to “jump” off the virtual plank if desired. After walking the plank once or jumping, they were asked whether they wanted to take the virtual elevator down (in the case of non-jumping) and repeat the task.
The researcher remained nearby throughout the condition to ensure safety, provide headset support, and verbally guide the participant when needed. The VR experience was simultaneously cast to a tablet, allowing the researcher to monitor the participant’s field of view and offer real-time instructions or reassurance as necessary.
After Breathing Exercise I, the second Stroop, Breathing Exercise II, and VR, participants verbally rated their perceived stress on a 0–10 scale using the stress thermometer (Figure 2).
2.5. Data Synchronization
To ensure alignment between the active conditions and the physiological data, all key protocol events (e.g., the start and end of each condition) were manually time-stamped using the local system time format (hh:mm:ss) in a dedicated observation Excel sheet. A Visual Basic for Applications (VBA) macro button was used to record timestamps in real time. These system time logs were later aligned with the UNIX timestamps embedded in the physiological data files exported from Care Lab (Empatica) and ConsensysBasic (Shimmer), enabling accurate synchronization of the two data streams with the observational timeline.
2.6. Data Processing and Analysis
2.6.1. Perceived Stress
Analysis of perceived stress scores was conducted using IBM SPSS Statistics version 29. To ensure direct comparability with the physiological analyses, perceived stress was analyzed only for the participants retained for physiological signal analysis (n = 41; see Physiological data section for exclusion procedure). To examine whether perceived stress levels differed significantly across the four conditions (Breathing Exercise I, Stroop, Breathing Exercise II, and VR), a non-parametric Friedman test was performed. This test was chosen due to the within-subjects design and the ordinal nature of the stress ratings. Additionally, QQ plots indicated violations of the normality assumption. When the Friedman test revealed a statistically significant main effect, Kendall’s W was calculated as an effect size [16]. Subsequently, post hoc pairwise comparisons were conducted using the Wilcoxon signed-rank test with effect sizes expressed as r [16]. To control for multiple comparisons, a Bonferroni correction was applied, adjusting the significance threshold to α = .0083 (i.e., .05 divided by 6 comparisons).
2.6.2. Physiological Data and Pre-Processing
EDA was recorded in micro siemens at 4 Hz with UNIX timestamps, and either exported as AVRO files from the Empatica CareLab environment (EmbracePlus) or as CSV files from the local Consensys program (Shimmer3 GSR+). Using custom-developed software in python 3.12, both AVRO [17] and CSV files were converted to Excel format with human-readable timestamps. Subsequently, time-stamped experimental events (i.e., 15-minute baseline, breathing exercise I, Stroop I and II, breathing exercise II and VR) were manually added to these Excel files, resulting in labeled EDA datasets.
All raw EDA signals (n=106, as each participant has two signals) were visually inspected by two researchers. Signals with physiologically impossible values or patterns (e.g., sudden drops to 0, EDA values below 0), indicating skin contact issues or issues with the sensor, were excluded from further analysis. Participants 4, 11-12, 15, 27, 34-36, 43, 46, 52-53 were therefore excluded, leading to 41 included participants. Participants 10, 33, 48 and 50 showed values <0.01 µS during a small part of their baseline recordings, these segments were excluded during preprocessing (i.e., their signal between the start of the signal and Breathing Exercise 1 was shortened), while the remaining signal was retained for analysis.
For analysis, EDA signals from the EmbracePlus and Shimmer3 GSR+ devices were compared at three levels of analysis, adapted from an established validation framework developed by van Lier et al. [7].
2.6.3. Signal-Level Agreement
To evaluate the similarity between the raw EDA signals from both devices a lagged Pearson cross-correlation analysis was performed in Python version 3.12, using NumPy (version 2.2.4) and SciPy (version 1.15.2). First, signals were normalized (z-scored) and linearly detrended. For each participant, Pearson correlation coefficients were calculated across lags ranging from −4 to +4 datapoints (i.e., ±2 s) to account for potential temporal misalignments, and the maximum correlation coefficient was retained. In addition to the full-signal analysis, a secondary segment-specific signal-level analysis was performed for the interval from the start of Breathing Exercise I to the end of Breathing Exercise II, as participants remained seated during this period and relatively few movement artifacts were expected.
2.6.4. Parameter-Level Agreement
Raw EDA (µS) was first screened for short artefact spikes using a z-score–based jump–return rule in Python 3.12 using NumPy (version 2.2.4) and SciPy (version 1.15.2). The code can be found in Supplementary File 1. A sample was marked as an artefact onset when:
- 1)
- the instantaneous deviation from a local baseline (mean of the last 4 non-artefact samples) was ≥ 0.75 z (“jump”), and
- 2)
- there was a return within 1.5 s in the opposite direction with magnitude ≥ 0.675 z.
All samples from jump to return were flagged as artefact, as these are physiologically highly unlikely to be Skin conductance response (SCRs; [4]. For every detected artefact, we expanded the mask by ± 1.0 s (to treat the immediate surroundings as unreliable). All flagged samples were then linearly interpolated on the raw µS signal using a left anchor (value of the last clean sample before the artifact block) and the first clean sample after the block as the right anchor; if only one anchor was available, the entire block was filled flat with that anchor value. All corrected signals underwent visual inspection by two researchers.
Subsequently, signals were segmented into contiguous marker-defined segments (i.e., baseline, breathing exercise I, Stroop I and II, breathing exercise II, VR and undefined periods), and processed with NeuroKit2 (version 0.2.10) in python 3.12 [18]. We extracted the phasic component using cvxEDA [19]. SCR peaks were then identified on the phasic signal using NeuroKit’s prominence-based peak detection with a near-zero relative threshold, after which only peaks with an absolute amplitude of at least 0.01 µS (peak minus onset) were retained [4,7,20]. From these processed signals, we derived four participant-level summary metrics for device comparison:
- Total phasic activity (defined as area under the curve (AUC) of the phasic component in µS per minute),
- Mean skin conductance level (SCL; µS) across the analyzed recording,
- SCR amplitude per minute (defined as the total summed SCR amplitude in µS per minute),
- SCR count per minute (number of detected SCRs per minute).
To assess absolute agreement between devices, we performed Bland–Altman analyses [21] on participant-level summary metrics using IBM SPSS Statistics version 29. For each participant, we computed the mean of the two devices (x-axis) and the inter-device difference (Shimmer3 GSR+ minus EmbracePlus; y-axis). Systematic bias was quantified as the mean difference across participants (bias), and random variation as the 95% limits of agreement (LoA), defined as bias ± 1.96SD of the differences. Bland–Altman plots were inspected for patterns consistent with proportional bias (mean-dependent differences) and/or heteroscedasticity (mean-dependent variability of differences) and for isolated extreme observations. Following the validity-assessment framework of Van Lier et al., we adopted a priori acceptable boundaries, reflecting predefined maximum tolerable inter-device differences of ±1.6 µS for SCL, ±0.6 µS for SCR amplitude per minute (total summed SCR amplitude/min), and ±2.5 SCRs/min for SCR count per minute [7]. We did not define a priori acceptable boundaries for the total phasic activity (operationalized as AUC), as no established physiologically or clinically justified a priori acceptability criteria are available for this metric.
2.6.5. Event-Level Agreement
Event-level metrics were derived using the same preprocessing steps as in the parameter-level analyses. For the event-level analyses, only the predefined experimental events were included: Breathing Exercise 1, Stroop I, Stroop II, Breathing Exercise 2, and VR (see Figure 3). Following the event-level step in the validity-assessment framework of Van Lier et al., event-level agreement was assessed by (i) visualizing device responses per event (mean ± SE across participants) and (ii) examining the corresponding inter-device difference scores within each event block (Shimmer3 GSR+ minus EmbracePlus). Differences were summarized descriptively per event type, and we evaluated whether inter-device discrepancies varied across events, consistent with context-dependent performance differences.
To test whether each device could distinguish between experimental conditions at the event level, we conducted non-parametric within-subject tests due to non-normality of the event-level distributions using IBM SPSS Statistics version 29. Specifically, for each outcome (total phasic activity, SCL, summed SCR amplitude/min and SCR count/min), we ran separate Friedman tests (k=3; Breathing exercise 1, Stroop I, Stroop II) for Shimmer3 and for EmbracePlus. For the Breathing exercise 2 – VR contrast (k=2), we used paired-samples Wilcoxon signed-rank tests, again conducted separately for Shimmer3 GSR+ and EmbracePlus. If appropriate, post hoc pairwise comparisons were conducted using Bonferroni correction to control the family-wise error rate at 0.05.
Difference plots were constructed in Microsoft Excel for Microsoft 365 (version 2605). Differences were summarized descriptively per event, and we evaluated whether inter-device discrepancies varied across events, consistent with context-dependent performance differences as described in van Lier al al. [7]. A priori boundaries were set to ±|reference effect|, with the reference effect defined as the average within-subject change from the most recent baseline-to-stressor change (i.e., the true effect) measured by the Shimmer3 GSR+. For the Stroop event, this reference effect was defined as the change from Breathing Exercise 1 to the average of Stroop 1 and Stroop 2. For the VR event, it was defined as the change from Breathing Exercise 2 to VR.
3. Results
3.1. Perceived Stress During Conditions
Friedman’s test revealed a statistically significant difference in stress levels across conditions, χ²(df = 3, N = 41) = 105.041, p < .001, with a large effect size (Kendall’s W = .854).
Post hoc pairwise comparisons (see Figure 4) with Bonferroni correction indicated that the VR condition was perceived as significantly more stressful than the Stroop (p = .005) and Breathing Exercise conditions (p < .0001), and the Stroop condition was significantly more stressful than both breathing exercise 1 and breathing exercise 2 (p < .0001). No significant difference was found between the two breathing exercises (p = 1.000). All significant pairwise differences were associated with large effect sizes (r > .80). These results suggest a clear gradation in perceived stress, increasing from relaxation tasks to cognitive challenge during the Stroop task, and peaking in the immersive VR environment.
3.2. Characteristics EDA Signal
On average, the synchronized signals of the wearables had a total duration of 1963.3 seconds (SD ± 172.5 s). Overall, the average amplitude of the complete EDA signal measured by the Shimmer3 GSR+ device was 2.44 µS (SD ± 1.40), whereas the EmbracePlus on average measured 0.61 µS (SD ± 1.66). See Table 1 for all metrics per event.
3.3. Signal-Level Agreement
On average, the cross-correlation over the entire signal was .30 which could be considered weak-to-moderate [22]. Seven of 41 (17%) participants showed a negative correlation. In 12/41 (29%) of the participants, the correlation was > .60 (see Figure 5). Figure 6 illustrates two signals with a high and low cross correlation during the experiment.
Secondary analysis was done, in which cross correlations were calculated between the start of breathing exercise I and the end of breathing exercise II, as during this timeframe participants sat still and relatively few movement artifacts were expected. This also yielded a weak-to-moderate average cross correlation of 0.35, with 13/41 (32%) of the participants having a cross correlation > .60).
3.4. Parameter-Level Agreement
Figure 7 presents Bland–Altman plots for total phasic activity (AUC per minute in µS), mean SCL (µS), SCR amplitude per minute (total summed SCR amplitude/minute), and SCR count per minute (SCRs/min), with differences defined as Shimmer3 GSR+ minus EmbracePlus. Across all four metrics, the mean difference (bias) was positive, indicating that Shimmer3 GSR+ yielded systematically higher values than EmbracePlus. Of the three metrics with an available a priori acceptable boundary, only a small proportion of observations lay inside those boundaries (SCL: 18/41 (44%), SCR amplitude/min: 10/41 (24%), SCRs/min: 2/41 (5%)), indicating that many participant-level differences exceeded the predefined acceptable error margins.
Visual inspection further suggested that inter-device differences tended to increase with increasing measurement magnitude for several metrics, indicating possible proportional bias and/or changes in variability across levels. Isolated extreme observations were visible at the upper end of the range. Log transformation (LN(x+1)) was explored; however, this did not materially alter the overall interpretation.
3.5. Event-Level Agreement
Within-device results for the Stroop and VR events are summarized in Table 2. For the Stroop stress task, Shimmer3 showed significant event effects for all four EDA metrics, with post hoc comparisons indicating increases from baseline 1 to Stroop 1 and/or Stroop 2. For EmbracePlus, event effects were metric-dependent: total phasic activity and mean SCL showed significant increases from breathing exercise 1 to Stroop 1 and Stroop 2, whereas SCR amplitude/min and SCR count/min did not. For the VR stress task, both devices showed increased EDA metrics from breathing exercise 2 to VR, indicating that both wearables detected the VR-related arousal response. Event-level figures for total phasic activity, mean SCL, SCR amplitude/min, and SCR count/min are provided in Supplementary File 2 for the EmbracePlus and in Supplementary File 3 for the Shimmer3 GSR+.
Regarding inter-device differences, difference plots (Shimmer3 − EmbracePlus; Figure 8) were predominantly positive across metrics, indicating systematically higher values in Shimmer3. During the Stroop stress task (Breathing exercise 1, Stroop 1, Stroop 2), the mean difference remained consistently above zero and was typically at, or above, the upper a priori acceptability boundary, suggesting that the between-device discrepancy was often comparable to, or larger than, the Stroop-related reference effect used to define acceptable error. During the VR stress task (Breathing exercise 2 to VR), mean differences increased from Breathing exercise 2 to VR for multiple outcomes; in several cases the mean difference was already close to the upper boundary at Breathing exercise 2 and exceeded it most clearly during VR, indicating larger between-device discrepancies in the higher-arousal context. Analyses using LN(x+1)-transformed outcomes showed the same directional pattern and did not change the overall acceptability interpretation; however, expressing differences on the log scale (log-units) altered the apparent contrast between devices. Because log-scale differences are not directly interpretable as absolute µS or SCR/min differences, we report primary results on the original scale and include log-transformed visualizations in Supplementary file 4.
4. Discussion
The aim of this study was to evaluate the validity of the EmbracePlus for wrist-worn EDA measurement by comparing it with the Shimmer3 GSR+ across signal-, parameter-, and event-level analyses [7] in a standardized laboratory protocol. Overall, the findings indicate that the EmbracePlus and Shimmer3 GSR+ do not measure EDA interchangeably. Signal-level agreement was weak to moderate, and parameter-level analyses showed systematic positive inter-device bias, with Shimmer3 GSR+ consistently yielding higher values than EmbracePlus. The event-level difference plots also showed that inter-device differences were predominantly positive and frequently approached or exceeded the a priori acceptability boundaries, indicating that the disagreement between devices was often comparable to, or larger than, the reference baseline-to-stress effect itself. When considering stress detection within each device, the Shimmer3 GSR+ showed significant increases across all EDA metrics during both the Stroop and VR tasks relative to baseline. For the EmbracePlus, the ability to detect stress depended on the stressor and the metric: during the stronger VR stressor, all EDA metrics increased significantly relative to baseline, whereas during the milder Stroop task only total phasic activity and mean SCL showed clear increases, while SCR amplitude and SCR count did not. Taken together, these findings suggest that the practical validity of the EmbracePlus depends on the intended purpose, the selected EDA metric, and the intensity of the stressor being assessed.
A likely explanation for this pattern is that the EmbracePlus and Shimmer3 GSR+ differ in their recording characteristics. In the present study, both devices measured EDA on the ventral wrist at 4 Hz, with the Shimmer3 GSR+ using wet Ag/AgCl electrodes, and the EmbracePlus using dry electrodes. The ability of the Shimmer3 to detect stress across all EDA metrics is in line with previous studies using the Shimmer3 for EDA measurements on the fingers with dry electrodes [23,24,25,26,27]. In addition, the predecessor of the EmbracePlus, the Empatica E4, has previously been shown to detect stressful events using dry ventral wrist electrodes. At the same time, average EDA values reported for the Empatica E4, ranging from 1.4 (SD ± 2.0) to 2.2 (SD ± 2.7) µS [28], appear higher than the mean value of 0.61 µS (SD ± 1.66) observed for the EmbracePlus in the present study. Other recent studies also suggest that relatively low EDA values are recorded by the EmbracePlus [9,12,29]. Although such between-study comparisons should be interpreted with caution because measurement protocols and study populations differ, recording characteristics such as such as electrode material and size may contribute to the lower EDA values measured by the EmbracePlus. In particular, the Empatica E4 used 8 mm dry wrist electrodes available in stainless steel SUS316L or silver (AG), whereas the EmbracePlus uses 6 mm ventral dry stainless steel 316L electrodes. Taken together, the present results support the interpretation that the EmbracePlus records lower EDA values than would be expected based on earlier wrist-worn devices and research-grade recordings.
In the present study, the lower values recorded by the EmbracePlus were visible in both the raw and processed EDA signal such as mean SCL, total phasic activity, SCR count, and SCR amplitude. The present findings further suggest that these lower values are not only relevant for absolute signal levels, but also for how sensitively stress-related changes can be captured and how the signal should be processed. This was reflected in the event-level results, where perceived stress was higher during the VR task than during the Stroop task. The EmbracePlus detected this stronger VR stressor across all four metrics, whereas during the milder Stroop task no effects were found for SCR amplitude or SCR count. Both of these metrics depend on a predefined amplitude threshold, meaning that only responses exceeding this threshold are classified as physiologically plausible SCRs. Conventionally, this threshold is set between 0.01 and 0.05 µS [4,20]. The present findings suggest that even the lowest conventional threshold of 0.01 µS may be less suitable for the EmbracePlus in its current wrist-worn dry-electrode configuration, as no Stroop-related differences were detected for these threshold-based SCR metrics. In contrast, stress-related differences during the Stroop task were detected when using total phasic activity and SCL, which do not rely on such thresholds. Recent exploratory work further illustrates the sensitivity of SCR outcomes to the processing approach: despite lower tonic and overall EDA values, the EmbracePlus yielded more detected SCRs than the Empatica E4 [12]. However, these devices were assessed in separate participant cohorts and using a different preprocessing and peak-detection pipeline, limiting direct comparison with the present findings. Together, these results suggest that SCR-based outcomes may be particularly dependent on both device characteristics and processing choice. At present, however, it is not known whether a lower threshold would be suitable for the EmbracePlus, and if so, which threshold would still reflect biologically plausible SCRs measured by this device.
These findings indicate that the performance of the EmbracePlus is context-dependent and metric-dependent, which is in line with the rationale of van Lier et al. (2020), who emphasize that validity should be evaluated in relation to the intended context of use. From a practical perspective, the present findings suggest that the EmbracePlus may be more suitable for detecting stronger stress-related changes and for monitoring within-subject trends over time than for obtaining precise absolute EDA values. In particular, the present results indicate that baseline-relative interpretation may be more informative than interpretation of raw absolute values when using this device. This is relevant because the systematic inter-device bias and the frequent exceedance of the a priori acceptability boundaries indicate that absolute agreement with a reference device was limited. At the same time, the event-level findings show that the device can still capture stronger stress-related changes, especially when using metrics that are less dependent on predefined SCR thresholds, such as total phasic activity and mean SCL. In addition, future work could explore whether less amplitude-dependent approaches, including frequency- or time-frequency-based analyses [30], provide additional value for analyzing lower-amplitude EDA signals.
A methodological strength of the present study is that validity was evaluated across multiple levels of analysis, following the framework of van Lier et al. (2020). This made it possible to distinguish between raw signal similarity, agreement in derived parameters, and the ability to detect stress-related changes at the event level, thereby providing a more nuanced evaluation than a single overall validity estimate would allow. In addition, both devices were worn simultaneously on the same wrist, which reduced between-subject and contextual variation in the comparison. The study design also included a 15-minute wear-in period before the active tasks. This was intended to allow skin contact and signal quality to stabilize. Furthermore, the interpretation of the event-level findings was strengthened by the inclusion of perceived stress ratings, which confirmed that the VR task was experienced as more stressful than the Stroop task. Finally, by examining multiple tonic and phasic EDA metrics, the study was able to show that validity depended on the selected outcome measure and the associated signal-processing approach.
Several limitations should be considered when interpreting these findings. The signal-level agreement showed substantial between-participant variability, as reflected in the range of cross-correlation coefficients. As the present study was not designed to determine which participant- or recording-related factors explained this variability, future research is needed to examine whether it is influenced by factors such as skin characteristics, contact quality, movement, or other person-specific recording conditions. In addition, the study was conducted in a standardized laboratory setting with two specific stress paradigms, namely a cognitive Stroop task and an immersive VR stressor. The present results therefore do not show whether similar patterns would also be observed during ambulatory monitoring, during other types of stressors, or in clinical populations. Although the findings suggest that conventional threshold-based SCR processing may be less suitable for the EmbracePlus in its current wrist-worn dry-electrode configuration, systematically determining an alternative optimal threshold or alternative processing strategy for this device fell outside the scope of the present study. Furthermore, the breathing exercises were used as low-arousal reference conditions, although deep breathing can itself evoke respiration-related EDA fluctuations that resemble SCRs [4]. Because respiration was not recorded, these responses could not be disentangled from the intended relaxation effect. This limits the interpretation of the breathing exercises as pure relaxation conditions. However, because both devices were recorded simultaneously under identical conditions, this limitation applies equally to both devices and primarily affects the interpretation of the experimental condition rather than the direct inter-device comparison. Finally, the comparison was restricted to one specific reference device and one specific placement configuration at the wrist. The extent to which these findings generalize to other wrist-worn EDA devices, preprocessing pipelines, or electrode configurations remains to be established in future research.
5. Conclusion
In conclusion, the present study shows that the EmbracePlus records systematically lower wrist-worn EDA values than the Shimmer3 GSR+, with limited agreement across the signal-, parameter-, and event-level analyses. Although the EmbracePlus was able to detect within-subject baseline-to-stress changes, inter-device discrepancies at the event level were still often large relative to the reference effect. The EmbracePlus therefore appears more suitable for detecting stronger within-subject stress-related changes than for interpreting precise absolute EDA values, particularly when conventional threshold-based SCR metrics are used. Accordingly, lower-amplitude dry-electrode EDA signals may not be optimally processed using absolute SCR thresholds between 0.01 and 0.05 µS, as this may reduce sensitivity to milder stress-related changes. Future research is needed to determine which preprocessing and metric choices are most appropriate for devices such as the EmbracePlus, and whether these findings generalize beyond this specific wrist-worn laboratory setup.
Supplementary Materials
The following supporting information can be downloaded at the website of this paper posted on Preprints.org. Supplementary File 1: Python code used for EDA preprocessing. Supplementary File 2: Figure S2. Event-level within-device plots for the EmbracePlus. Supplementary File 3: Figure S3. Event-level within-device plots for the Shimmer3 GSR+. Supplementary File 4: Figure S4. LN(x+1) scaled inter-device difference plots.
Author Contributions
Conceptualization: MP (lead), PH (support); Data curation: MP (lead), PH (support); Formal analysis: MP (lead), BvB (support); Investigation: BD (lead), SK (equal), MP (support); Methodology: MP (lead), BD (support), SK (support); Project administration: MP (lead), BD (support), SK (support); Supervision: MP; Visualization: MP; Writing – original draft: MP (lead), PH (support), BvB (support), GS (support); Writing – review & editing: MP (lead), PH (support), BvB (support), GS (support).
Funding
This work was supported by Regieorgaan SIA (part of the Dutch Research Council [NWO]) under the RAAK PRO program (project number RAAK.PRO06.015). The funding body had no role in the design of the study, data collection and analysis, decision to publish, or preparation of the manuscript.
Institutional Review Board Statement
The study was conducted in accordance with the Declaration of Helsinki and approved by the Fontys Committee of Research Ethics (protocol code peeters-schaap250325; approval date: march 25, 2025).
Informed Consent Statement
Written informed consent was obtained from all participants involved in the study.
Data Availability Statement
The data underlying the findings of this study cannot be made publicly available because the informed consent obtained from participants did not include permission for unrestricted public sharing of their data. In accordance with the consent provided by the participants, the data may only be shared for research conducted by Fontys University of Applied Sciences and its research partners. The dataset is archived in DataverseNL under DOI: doi.org/10.34894/2HBZVS, with access to the data restricted. Researchers may submit a data access request to Research Data Management, Fontys University of Applied Sciences, rdm@fontys.nl. If a request is approved, an appropriate research partnership with Fontys University of Applied Sciences must be established before access to the data is provided, in accordance with the conditions of the informed consent and applicable institutional procedures.
Acknowledgments
During the preparation of this manuscript, the authors used ChatGPT (GPT-5.4, OpenAI) for language and readability improvements and OpenAI Codex to assist with writing Python code for data processing. The authors reviewed and edited all outputs and take full responsibility for the content of the publication.
Conflicts of Interest
The authors declare no conflict of interest.:
References
- Dhabhar, F.S. The short-term stress response - Mother nature’s mechanism for enhancing protection and performance under conditions of threat, challenge, and opportunity. Front Neuroendocrinol. 2018, 49, 175–192. [Google Scholar] [CrossRef] [PubMed]
- Selye, H. Stress in Health and Disease; Butterworth-Heinemann: Boston-London, 2013. [Google Scholar]
- Schmidt, P.; Reiss, A.; Dürichen, R.; Laerhoven, K.V. Wearable-Based Affect Recognition-A Review. Sensors 2019, 19, 4079. [Google Scholar] [CrossRef] [PubMed]
- Boucsein, W. Electrodermal activity, 2 ed.; Springer: New York, US, 2012; p. 618. [Google Scholar]
- Klimek, A.; Mannheim, I.; Schouten, G.; Wouters, E.J.M.; Peeters, M.W.H. Wearables measuring electrodermal activity to assess perceived stress in care: a scoping review. Acta Neuropsychiatr. 2023, 1–11. [Google Scholar] [CrossRef] [PubMed]
- Schoenmakers, M.; Saygin, M.; Sikora, M.; Vaessen, T.; Noordzij, M.; de Geus, E. Stress in action wearables database: A database of noninvasive wearable monitors with systematic technical, reliability, validity, and usability information. Behav. Res. Methods 2025, 57. [Google Scholar] [CrossRef] [PubMed]
- van Lier, H.G.; Pieterse, M.E.; Garde, A.; Postel, M.G.; de Haan, H.A.; Vollenbroek-Hutten, M.M.R.; Schraagen, J.M.; Noordzij, M.L. A standardized validity assessment protocol for physiological signals from wearable technology: Methodological underpinnings and an application to the E4 biosensor. Behav. Res. Methods 2020, 52, 607–629. [Google Scholar] [CrossRef] [PubMed]
- Badawi, A.; Elmoghazy, S.; Choudhury, S.; Elgazzar, S.; Elgazzar, K.; Burhan, A.M. Multimodal Detection of Agitation in People With Dementia in Clinical Settings: Observational Pilot Study. JMIR Aging 2025, 8, e68156–e68156. [Google Scholar] [CrossRef] [PubMed]
- Van Swieten, M.; De Looff, P.; Vandernagel, J.; Bouwmeester, S.; Didden, R. Listening to music is associated with reduced physiological and subjective stress in people with mild intellectual disabilities: A biofeedback study. Res. Dev. Disabil. 2025, 161, 104976. [Google Scholar] [CrossRef] [PubMed]
- Sinichi, M.; Gevonden, M.J.; Krabbendam, L. Quality in Question: Assessing the Accuracy of Four Heart Rate Wearables and the Implications for Psychophysiological Research. Psychophysiology 2025, 62. [Google Scholar] [CrossRef] [PubMed]
- Žagar, D.; Geršak, G. Performance Comparison of Wired and Wireless Electrodermal Activity Sensors During a Simulated Port Approach Maneuver. Electronics 2025, 14, 862. [Google Scholar] [CrossRef]
- Brandebusemeyer, C.; Georgi, F.; Arnrich, B. Reliability Assessment of Wearable Technologies for Physiological Measurements: An Evaluation of Shimmer3 GSR+, Empatica E4, EmbracePlus, and Pixel Watch 2 Across Cognitive, Affective and Physical Activity Tasks. Sensors 2026, 26, 4376. [Google Scholar] [CrossRef] [PubMed]
- Nixon, J.L.; Cartmill, B.; Turner, J.; Pigott, A.E.; Brown, E.; Wall, L.R.; Ward, E.C.; Porceddu, S.V. Exploring the prevalence and experience of mask anxiety for the person with head and neck cancer undergoing radiotherapy. J. Med. Radiat. Sci. 2018, 65, 282–290. [Google Scholar] [CrossRef] [PubMed]
- Aktaş, G.K.; İlgin, V.E. The Effect of Deep Breathing Exercise and 4–7-8 Breathing Techniques Applied to Patients After Bariatric Surgery on Anxiety and Quality of Life. Obes. Surg. 2023, 33, 920–929. [Google Scholar] [CrossRef] [PubMed]
- Ghosh, R.; Deb, N.; Sengupta, K.; Phukan, A.; Choudhury, N.; Kashyap, S.; Phadikar, S.; Saha, R.; Das, P.; Sinha, N.; et al. SAM 40: Dataset of 40 subject EEG recordings to monitor the induced-stress while performing Stroop color-word test, arithmetic task, and mirror image recognition task. Data Brief. 2022, 40, 107772. [Google Scholar] [CrossRef] [PubMed]
- Fiel Peres, F. Effect sizes for nonparametric tests. Biochem. Medica 2026, 36, 5–16. [Google Scholar] [CrossRef] [PubMed]
- Empatica. How to access Avro files with Python. Available online: https://support.empatica.com/hc/en-us/articles/17405877853981-How-to-access-Avro-files-with-Python (accessed on July 6).
- Makowski, D.; Pham, T.; Lau, Z.J.; Brammer, J.C.; Lespinasse, F.; Pham, H.; Schölzel, C.; Chen, S.H.A. NeuroKit2: A Python toolbox for neurophysiological signal processing. Behav. Res. Methods 2021, 53, 1689–1696. [Google Scholar] [CrossRef] [PubMed]
- Greco, A.; Valenza, G.; Lanata, A.; Scilingo, E.; Citi, L. cvxEDA: a Convex Optimization Approach to Electrodermal Activity Processing. IEEE Trans. Biomed. Eng. 2016, 63, 797–804. [Google Scholar] [CrossRef] [PubMed]
- Dawson, M.E.; Schell, A.M.; Filion, D.L. The electrodermal system. In Handbook of psychophysiology, 3rd ed.; Cambridge University Press: New York, NY, US, 2007; pp. 159–181. [Google Scholar]
- Bland, J.M.; Altman, D.G. Measuring agreement in method comparison studies. Stat. Methods Med. Res. 1999, 8, 135–160. [Google Scholar] [CrossRef] [PubMed]
- Akoglu, H. User’s guide to correlation coefficients. Turk. J. Emerg. Med. 2018, 18, 91–93. [Google Scholar] [CrossRef] [PubMed]
- Wulvik, A.S.; Dybvik, H.; Steinert, M. Investigating the relationship between mental state (workload and affect) and physiology in a control room setting (ship bridge simulator). Cogn. Technol. Work 2020, 22, 95–108. [Google Scholar] [CrossRef]
- Williams, D.; Hodge, V.J.; Wu, C.Y. On the use of AI for Generation of Functional Music to Improve Mental Health. Front Artif. Intell. 2020, 3, 497864. [Google Scholar] [CrossRef] [PubMed]
- Sciaraffa, N.; Di Flumeri, G.; Germano, D.; Giorgi, A.; Di Florio, A.; Borghini, G.; Vozzi, A.; Ronca, V.; Varga, R.; van Gasteren, M.; et al. Validation of a Light EEG-Based Measure for Real-Time Stress Monitoring during Realistic Driving. Brain Sci. 2022, 12. [Google Scholar] [CrossRef] [PubMed]
- Ronca, V.; Martinez-Levy, A.C.; Vozzi, A.; Giorgi, A.; Aricò, P.; Capotorto, R.; Borghini, G.; Babiloni, F.; Di Flumeri, G. Wearable Technologies for Electrodermal and Cardiac Activity Measurements: A Comparison between Fitbit Sense, Empatica E4 and Shimmer GSR3+. Sensors 2023, 23, 5847. [Google Scholar] [CrossRef] [PubMed]
- Giorgi, A.; Ronca, V.; Vozzi, A.; Sciaraffa, N.; di Florio, A.; Tamborra, L.; Simonetti, I.; Aricò, P.; Di Flumeri, G.; Rossi, D.; et al. Wearable Technologies for Mental Workload, Stress, and Emotional State Assessment during Working-Like Tasks: A Comparison with Laboratory Technologies. Sensors 2021, 21. [Google Scholar] [CrossRef] [PubMed]
- Vos, G.; Trinh, K.; Sarnyai, Z.; Rahimi Azghadi, M. Ensemble machine learning model trained on a new synthesized dataset generalizes well for stress prediction using wearable devices. J. Biomed. Inform. 2023, 148, 104556. [Google Scholar] [CrossRef] [PubMed]
- Tomalin, L.E.; Kummer, B.R.; Campbell, M.C.; Erekat, A.N.; Cohen, F.; Robinson-Papp, J.; Mueller, B.R. Can smartwatches predict migraines?Using machine learning (ML) with wearable-derived nocturnal autonomic nervous system (ANS) and sleep metrics for headache prediction. Res. Sq. 2025. [Google Scholar] [CrossRef] [PubMed]
- Lew, R.; Dyre, B.P.; Werner, S.; Wotring, B.; Tran, T. Exploring the Potential of Short-Time Fourier Transforms for Analyzing Skin Conductance and Pupillometry in Real-Time Applications. Proc. Hum. Factors Ergon. Soc. Annu. Meet. 2008, 52, 1536–1540. [Google Scholar] [CrossRef]
Figure 1.
Placement of the wearable devices. The EmbracePlus (wristband) and Shimmer3 GSR+ (sensor with electrode stickers) devices were worn on the non-dominant wrist.
Figure 1.
Placement of the wearable devices. The EmbracePlus (wristband) and Shimmer3 GSR+ (sensor with electrode stickers) devices were worn on the non-dominant wrist.
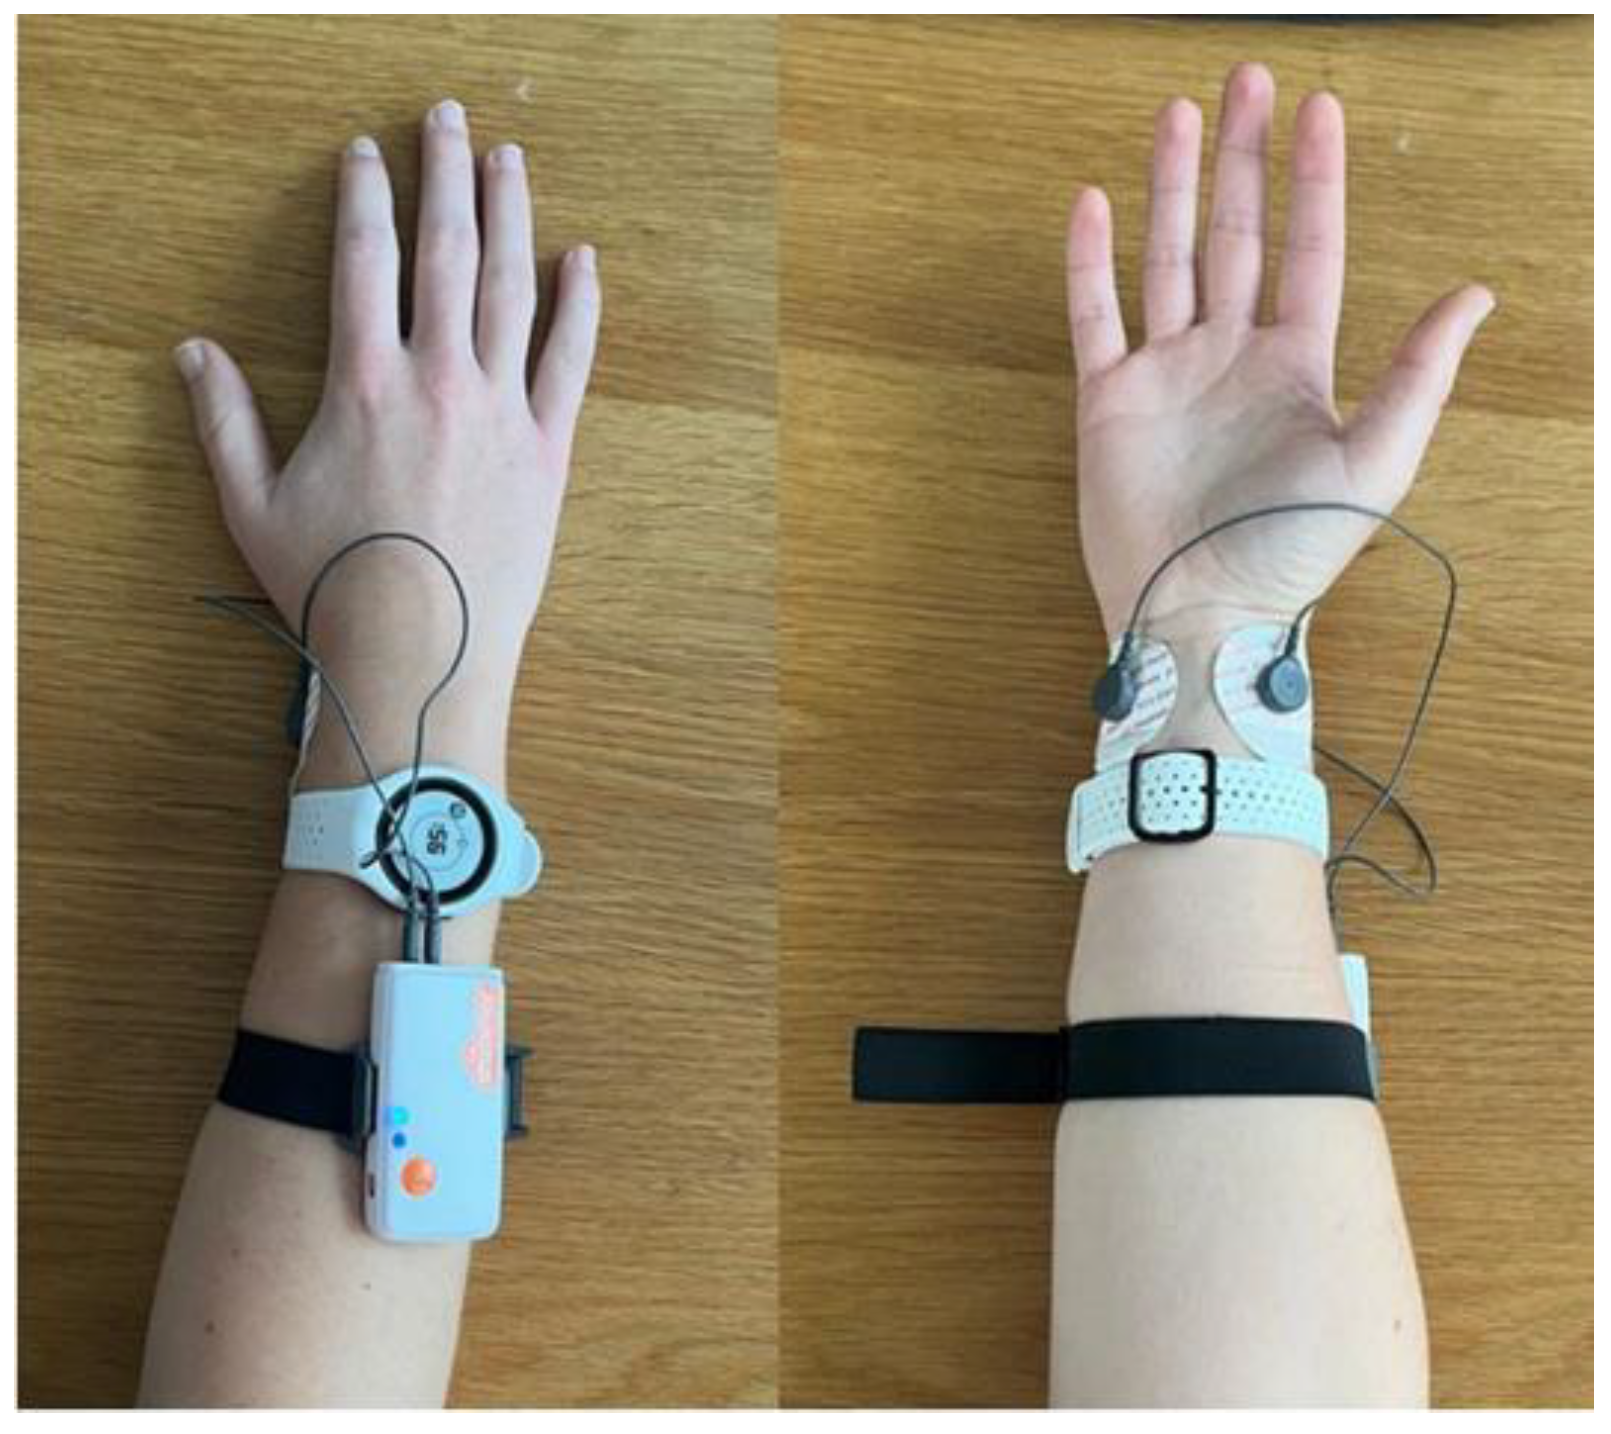
Figure 2.
The stress thermometer used to ask participants how stressful a task was experienced. Adapted from Nixon et al. [13], licensed under CC BY 4.0].
Figure 2.
The stress thermometer used to ask participants how stressful a task was experienced. Adapted from Nixon et al. [13], licensed under CC BY 4.0].
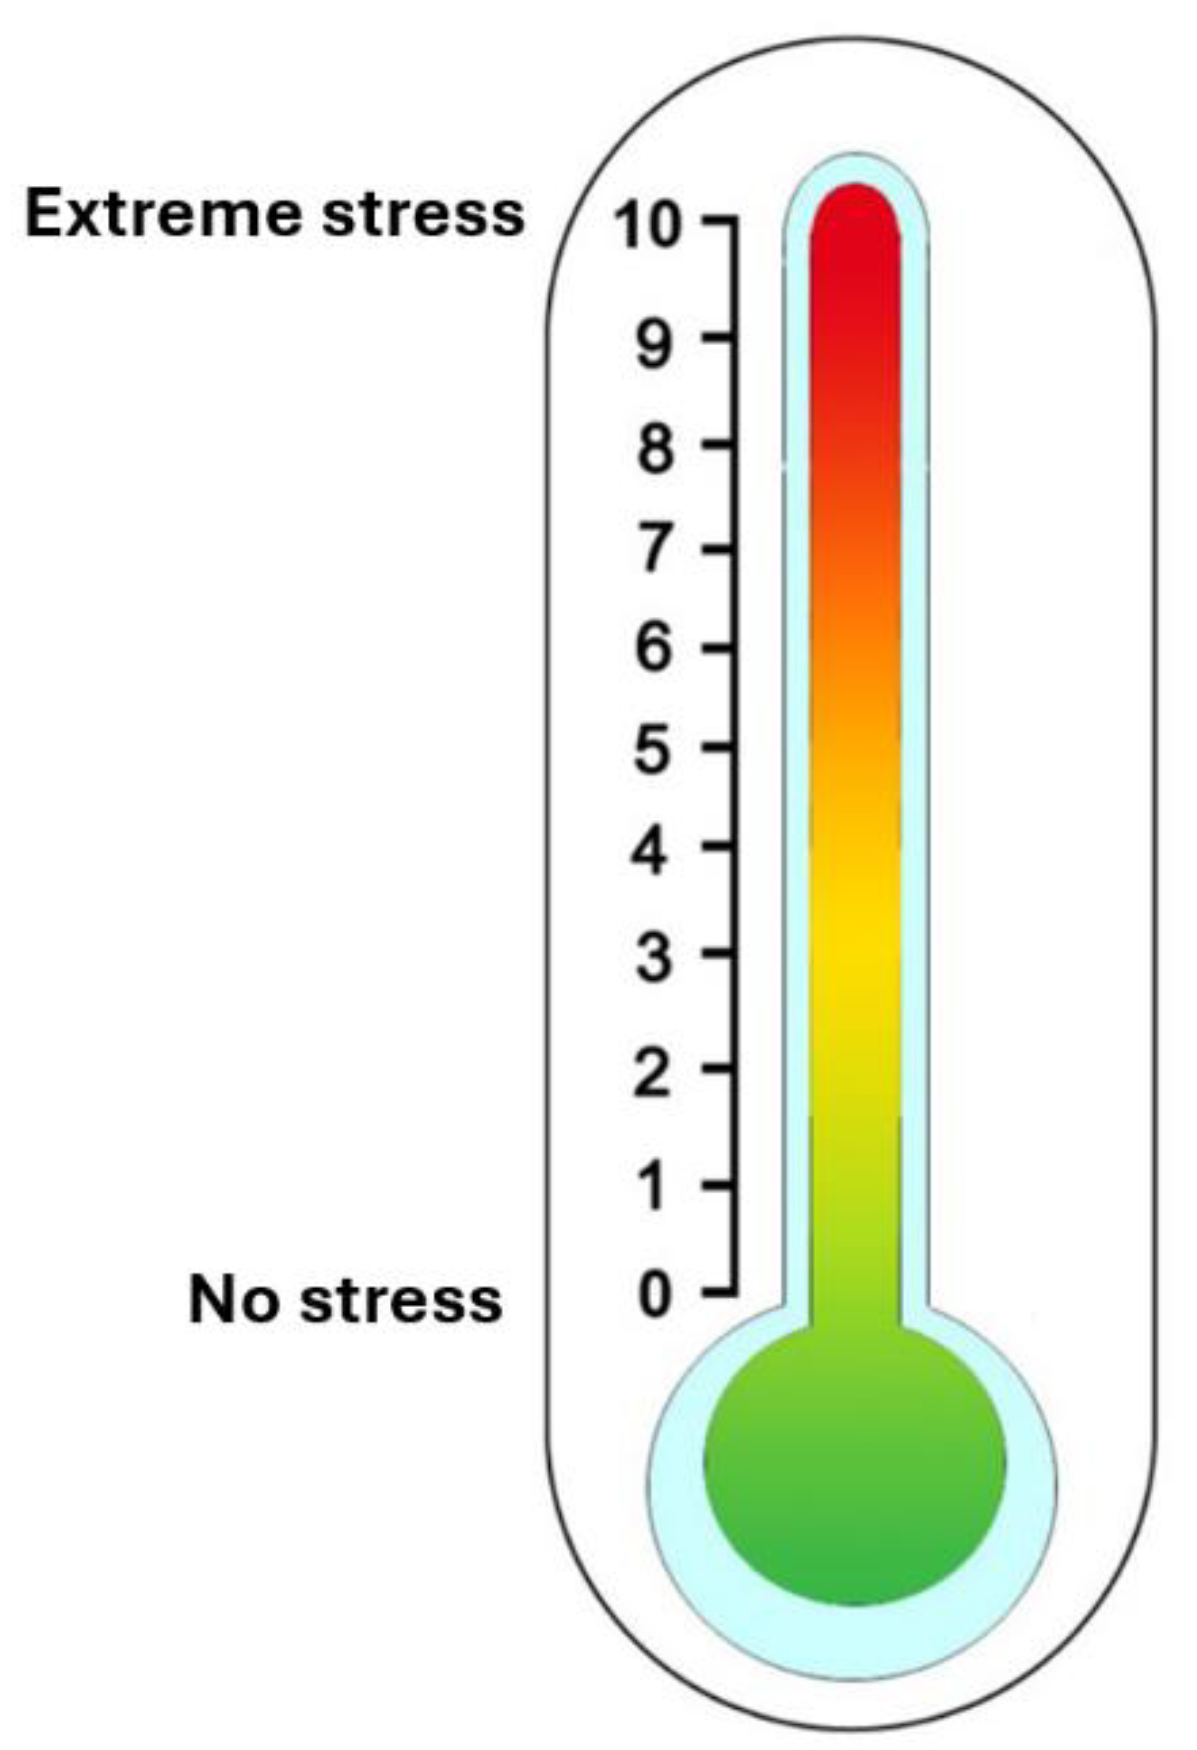
Figure 3.
Timeline of the study. See text for details.
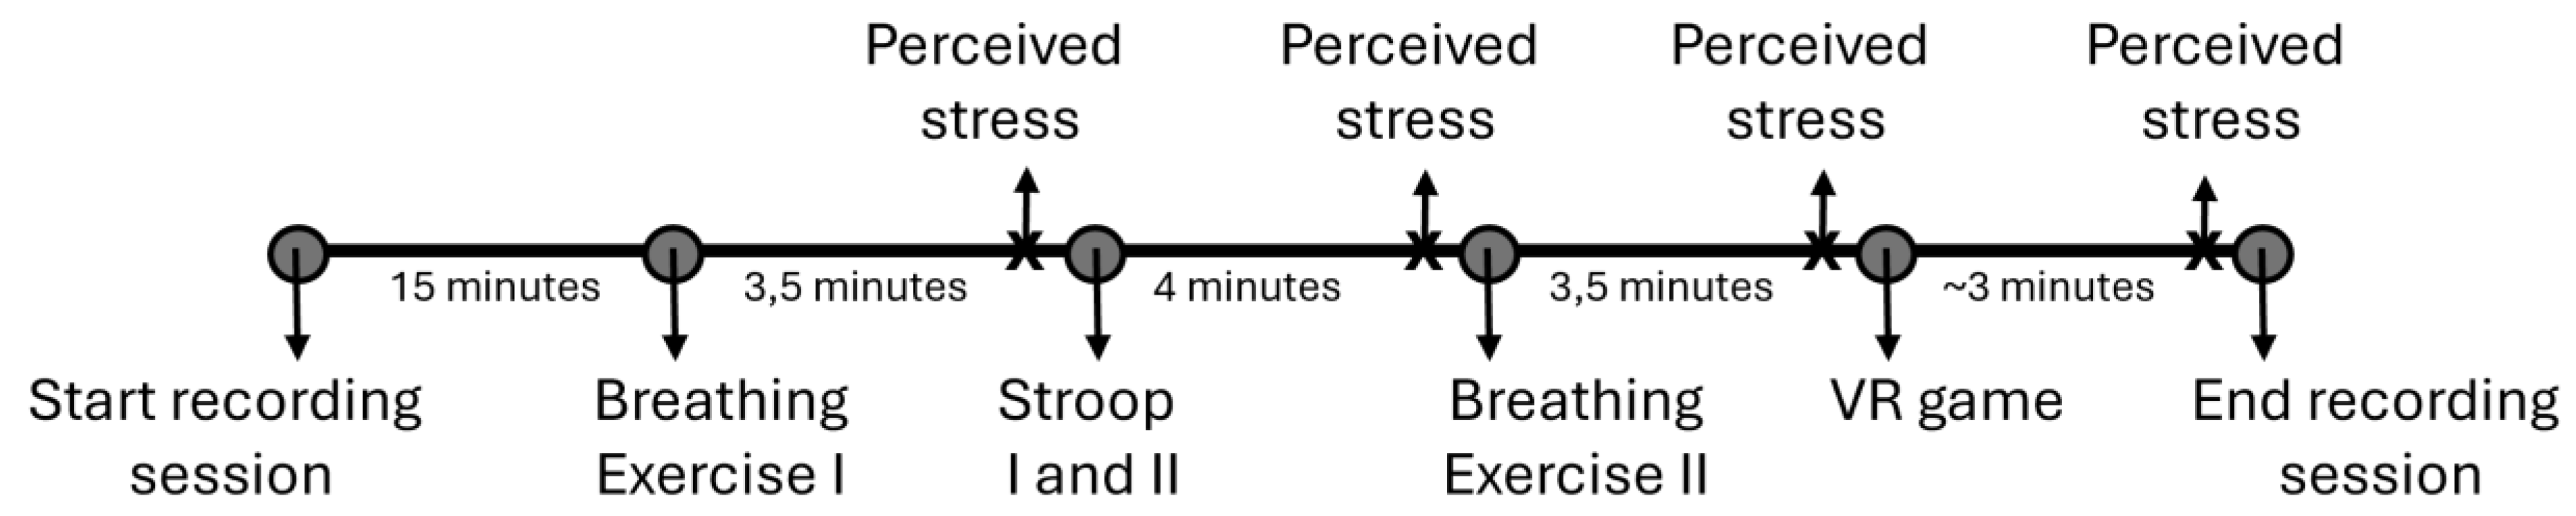
Figure 4.
Perceived stress differed between conditions. Violin plot showing the distribution of perceived stress scores (0–10) across four experimental conditions for the participants retained for physiological signal analysis (n = 41). The width of each violin reflects the distribution of responses, and dots connected by the black line indicate median scores per condition. Horizontal lines with * indicate statistically significant pairwise differences based on Bonferroni-corrected post hoc tests p < .0083).
Figure 4.
Perceived stress differed between conditions. Violin plot showing the distribution of perceived stress scores (0–10) across four experimental conditions for the participants retained for physiological signal analysis (n = 41). The width of each violin reflects the distribution of responses, and dots connected by the black line indicate median scores per condition. Horizontal lines with * indicate statistically significant pairwise differences based on Bonferroni-corrected post hoc tests p < .0083).
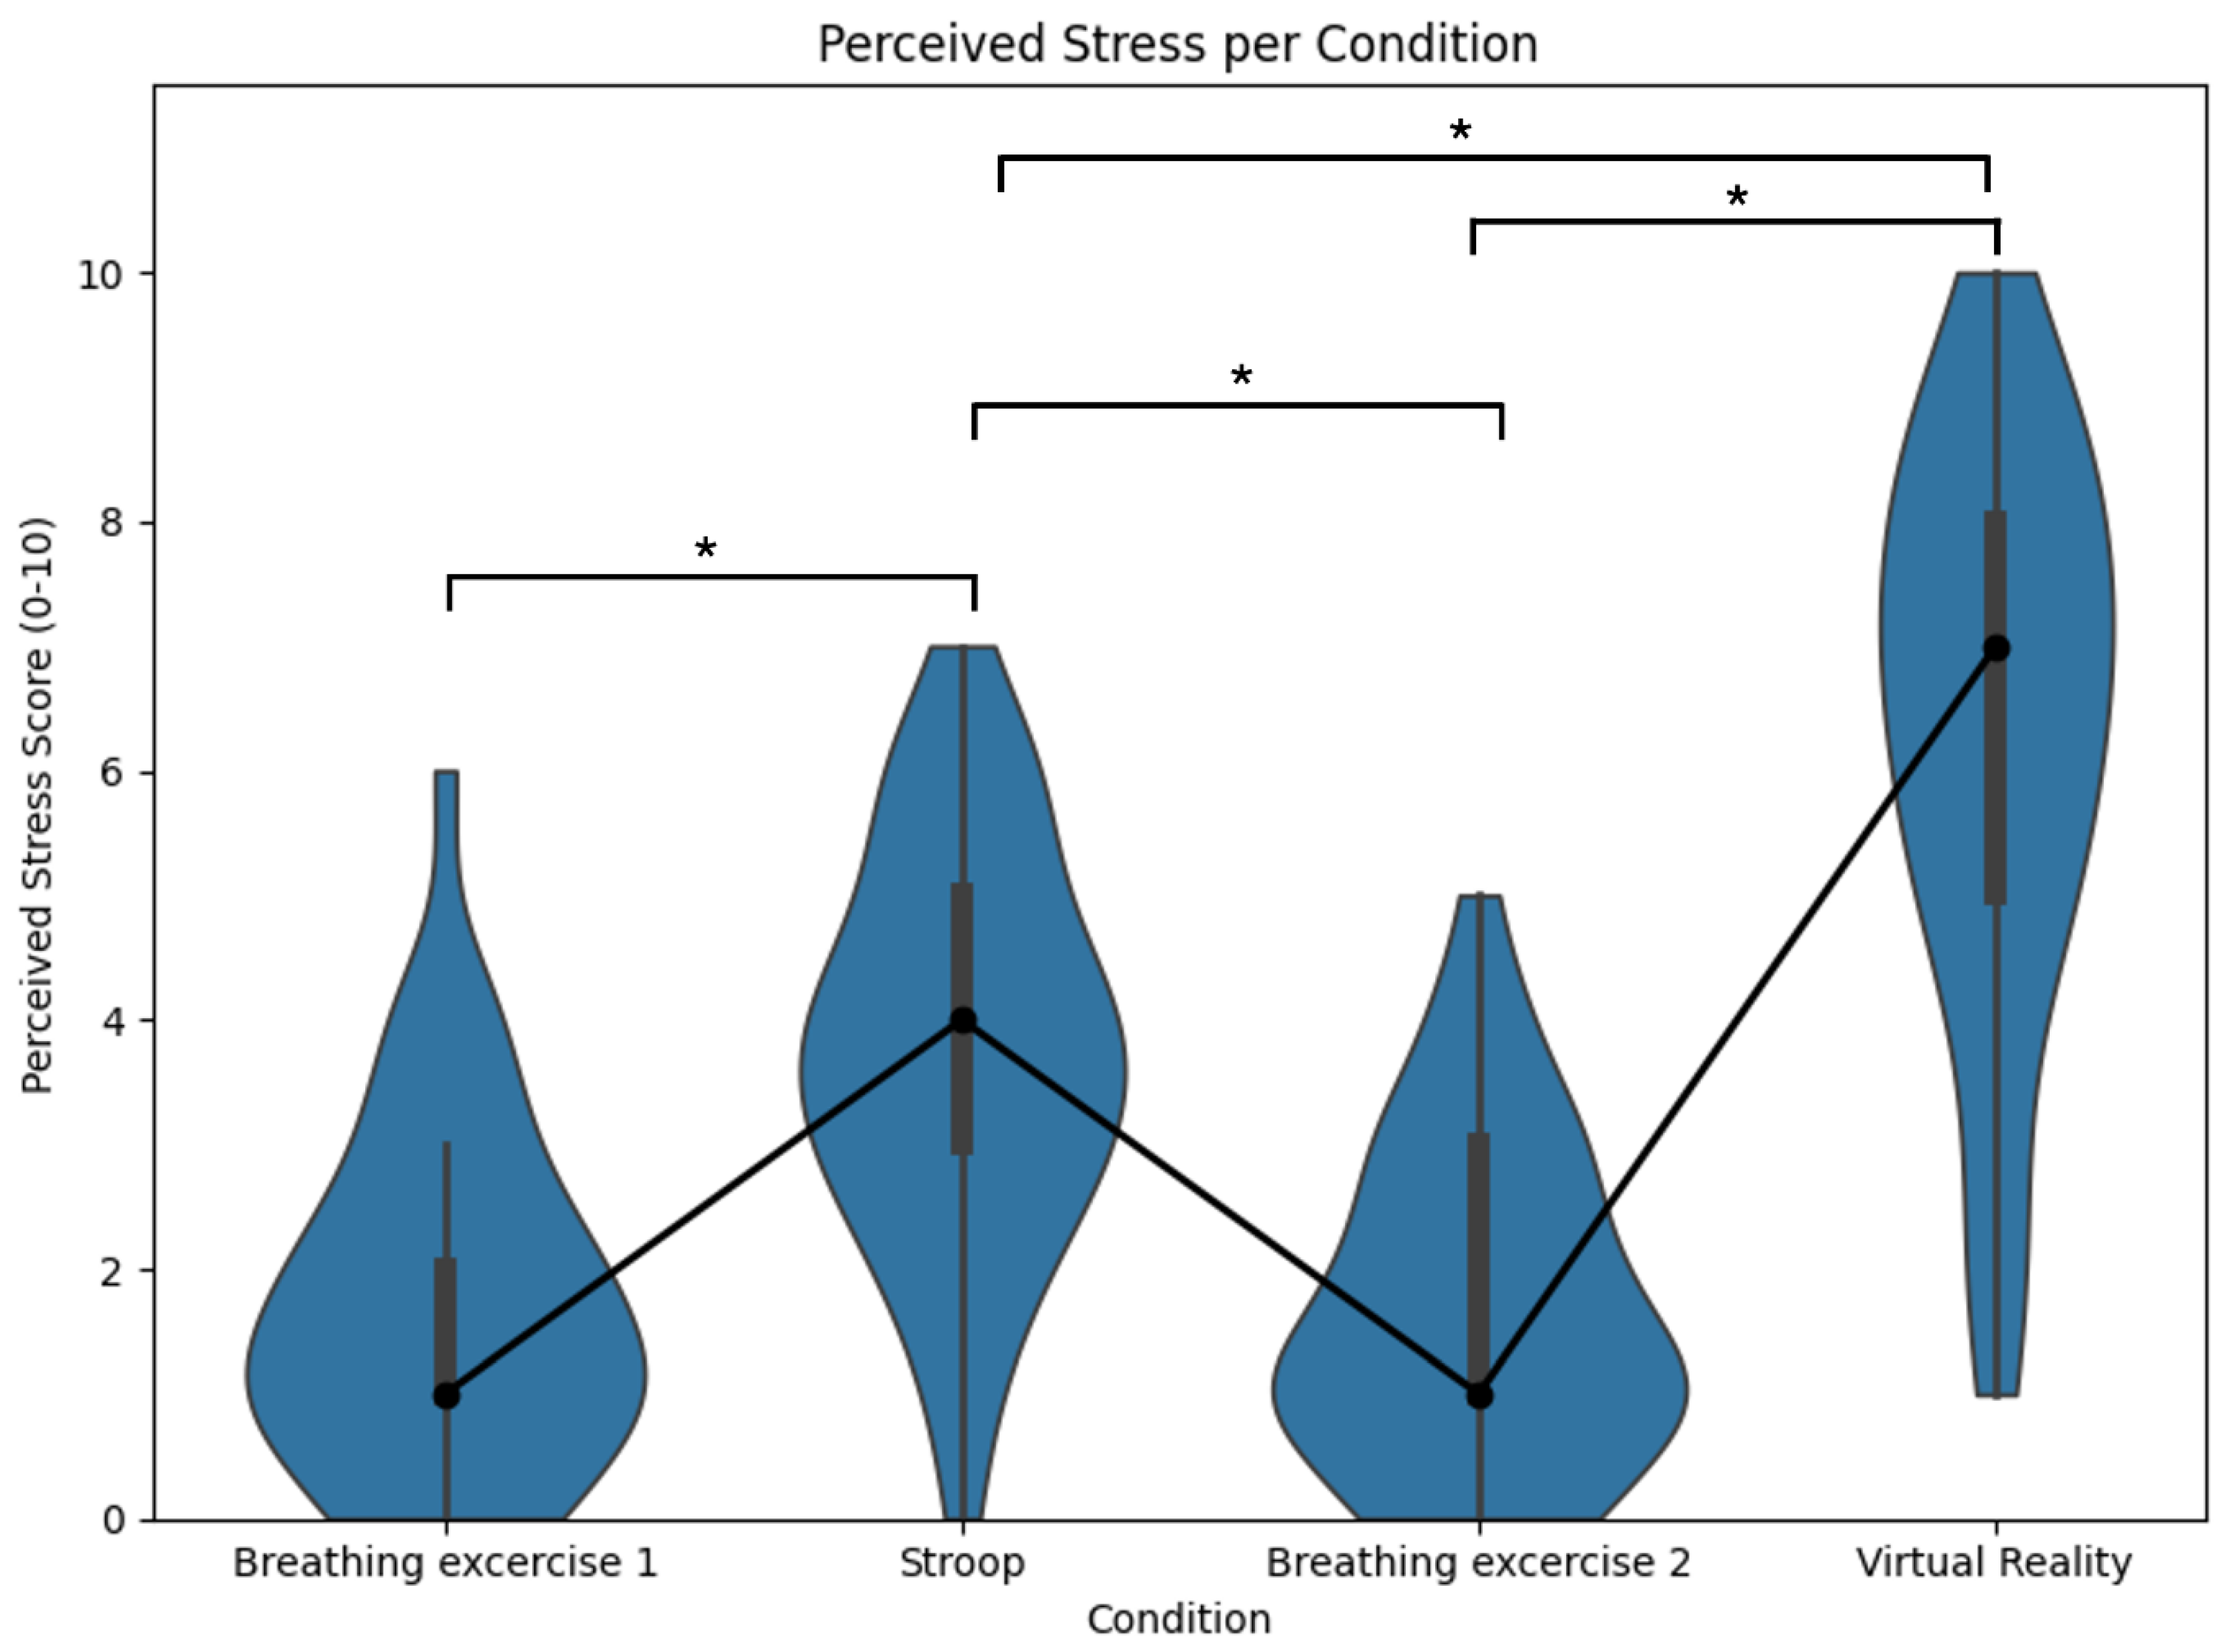
Figure 5.
Histogram of the optimal cross-correlation. Cross-correlations were found for each participant between – 4 and + 4 lags in datapoints (i.e., a 2 second timeframe).
Figure 5.
Histogram of the optimal cross-correlation. Cross-correlations were found for each participant between – 4 and + 4 lags in datapoints (i.e., a 2 second timeframe).
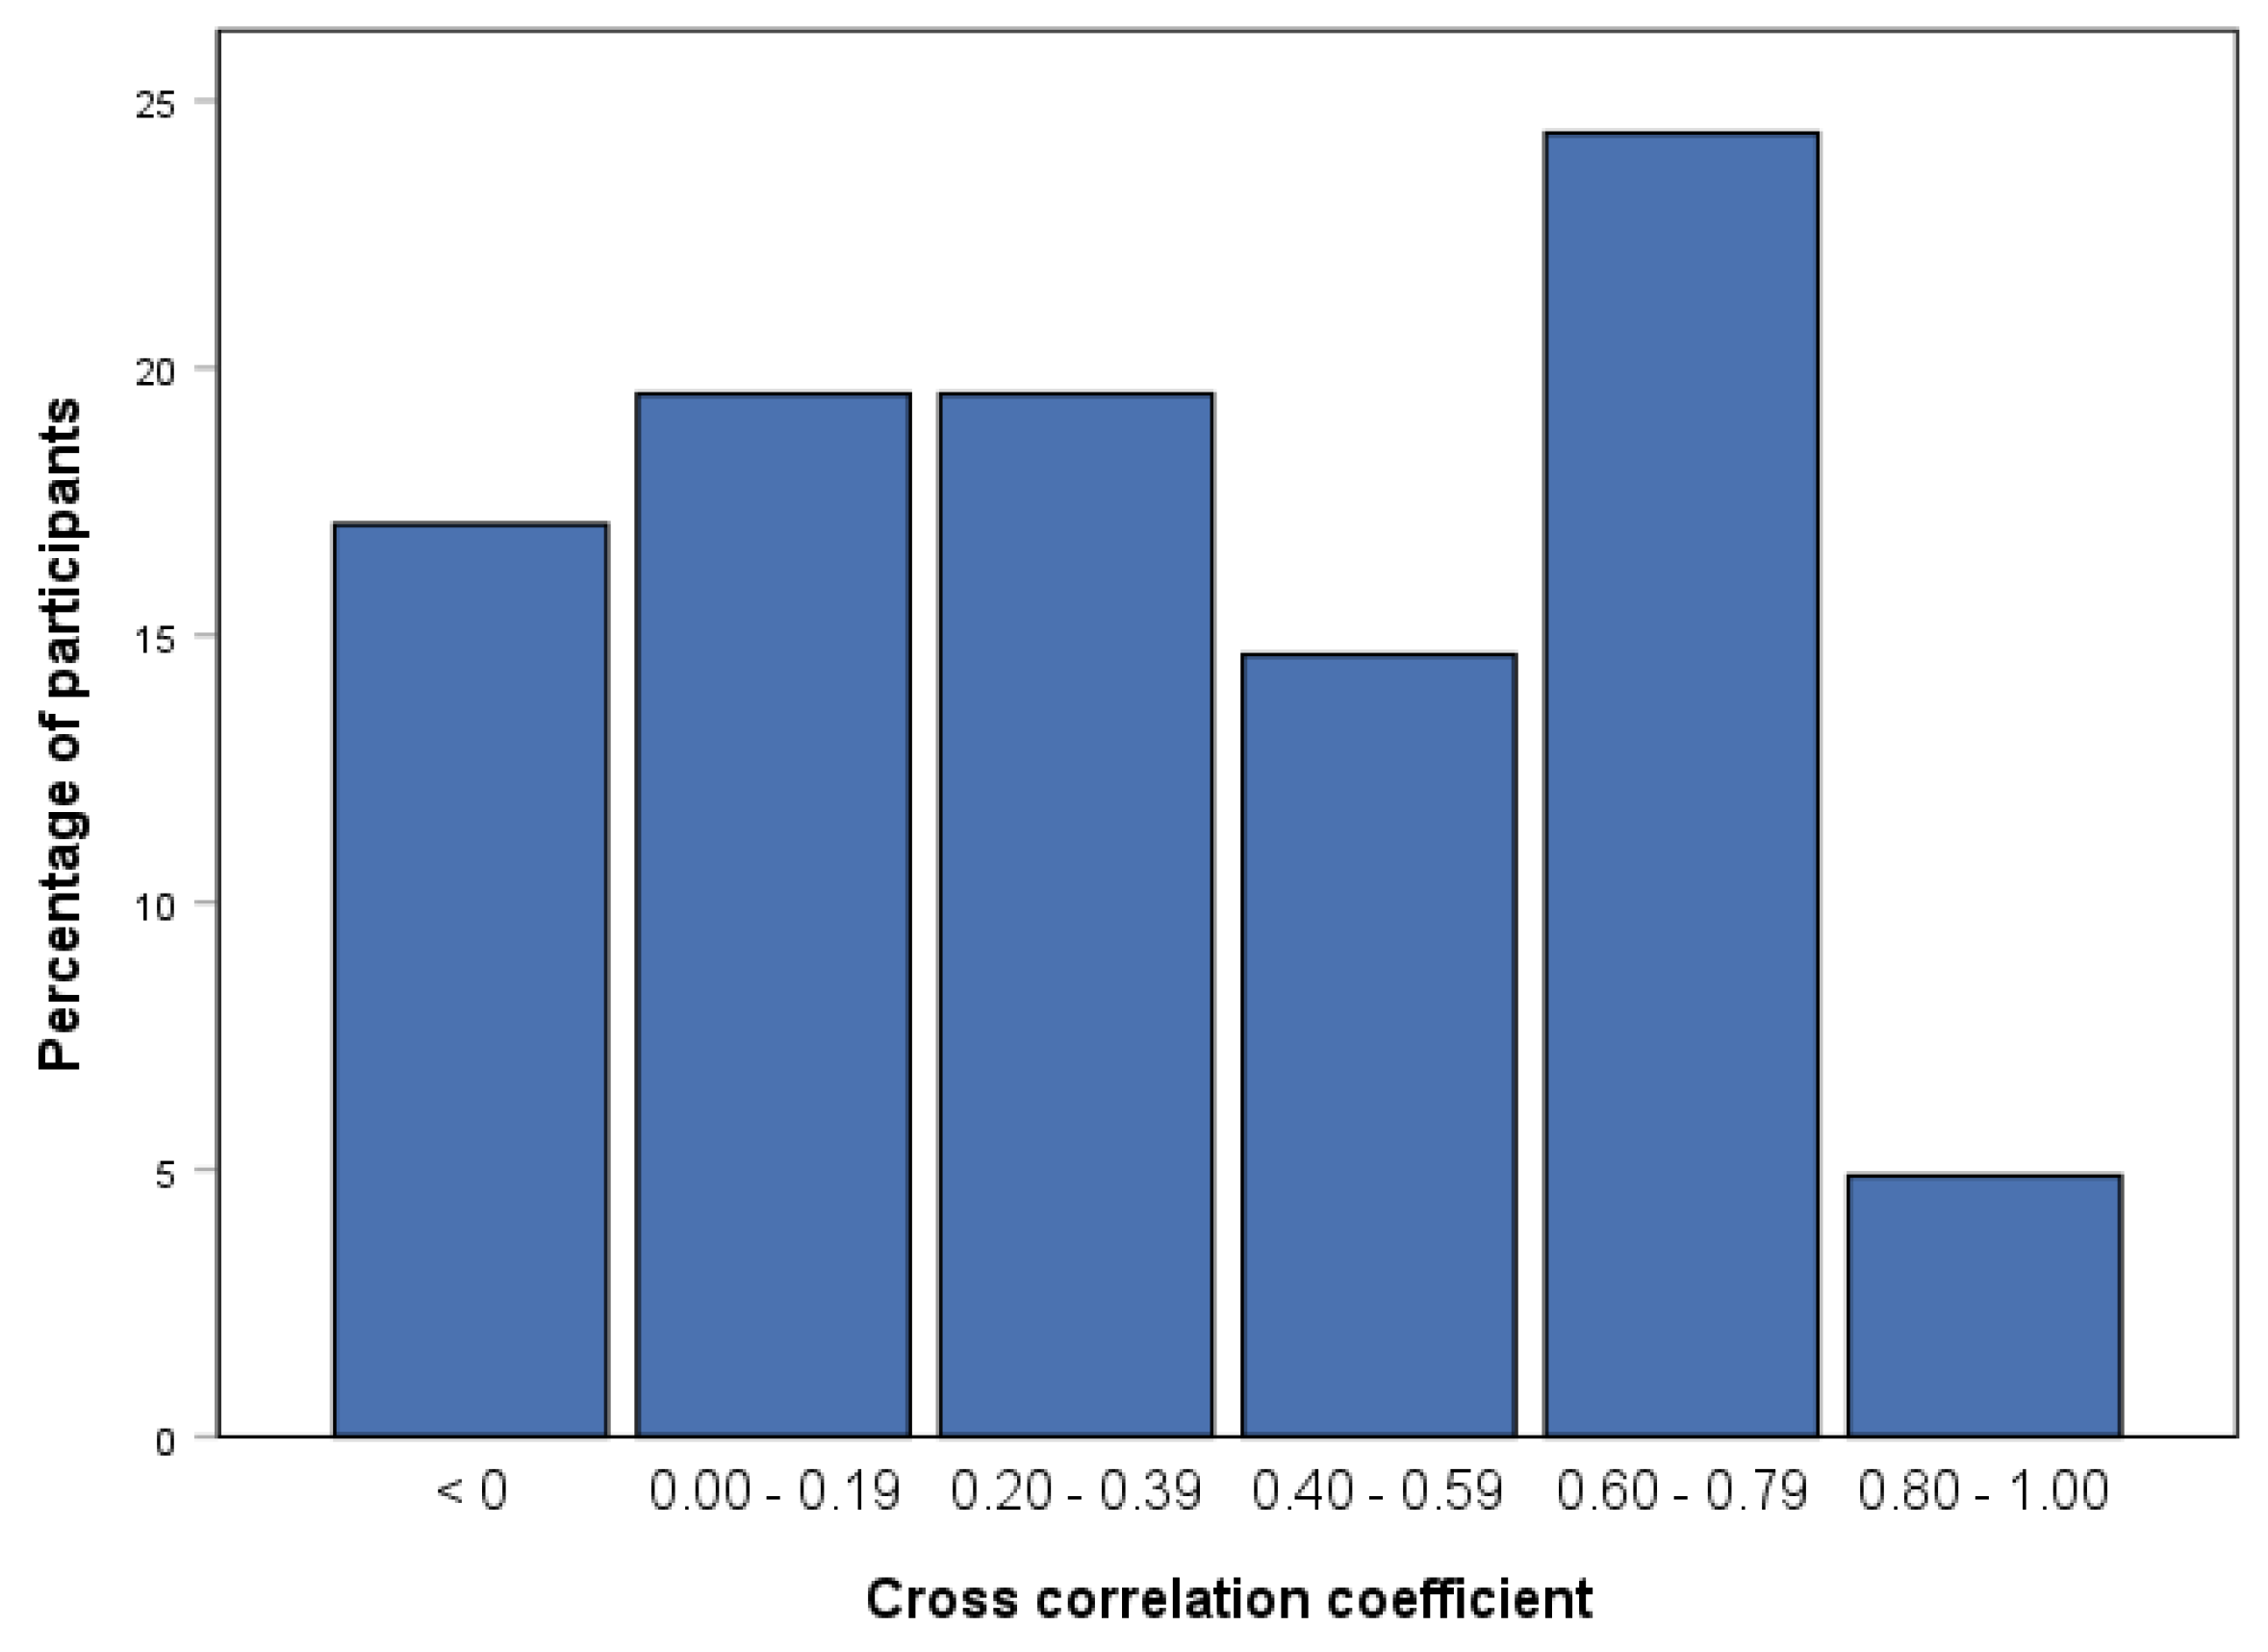
Figure 6.
Examples of high and low signal-level agreement between devices. Normalized and detrended EDA signals are shown for the EmbracePlus (blue line) and Shimmer3 GSR+ (red line) across the full experimental protocol. Panel A shows a participant with high cross-correlation between devices (r = .84; subject 31), whereas Panel B shows a participant with low cross-correlation (r = .00; subject 14).
Figure 6.
Examples of high and low signal-level agreement between devices. Normalized and detrended EDA signals are shown for the EmbracePlus (blue line) and Shimmer3 GSR+ (red line) across the full experimental protocol. Panel A shows a participant with high cross-correlation between devices (r = .84; subject 31), whereas Panel B shows a participant with low cross-correlation (r = .00; subject 14).
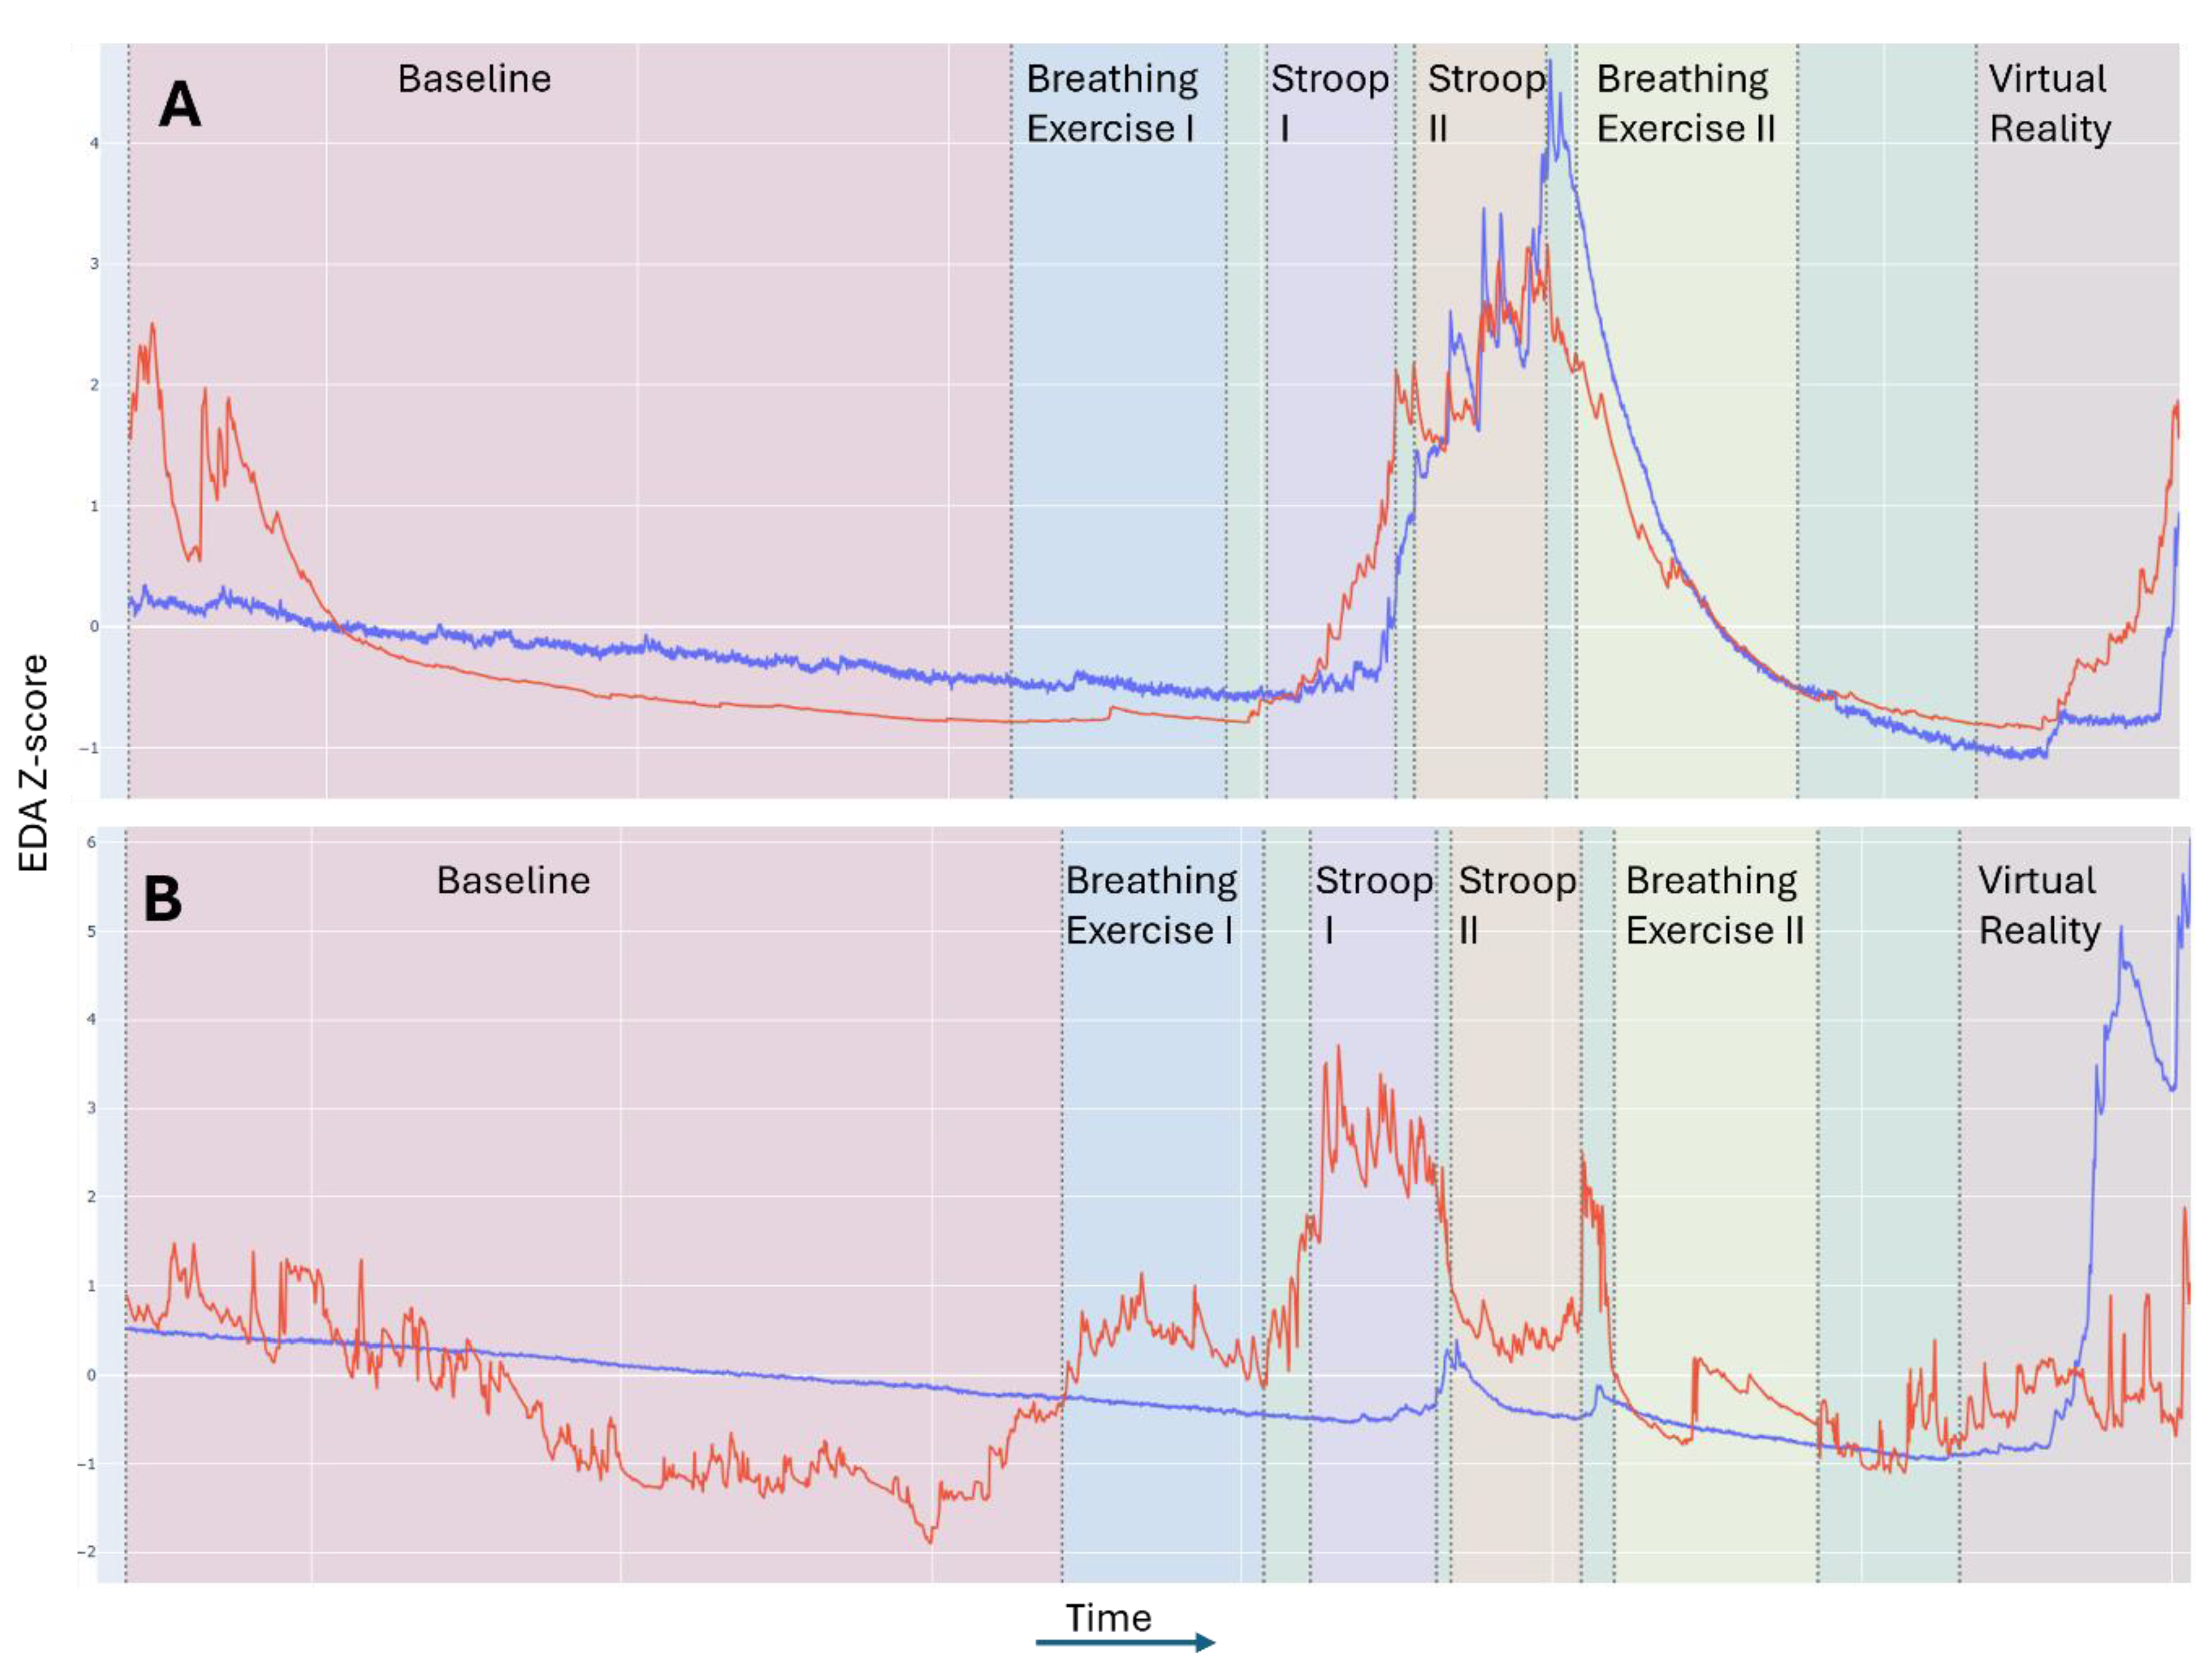
Figure 7.
Bland–Altman plots of parameter-level agreement between devices. Bland–Altman plots are shown for A) total phasic activity per minute (AUC phasic activity/min in µS), B) mean SCL (µS), C) SCR amplitude per minute (total summed SCR amplitude/min in µS), and D) SCR count per minute (SCRs/min). Differences were computed as Shimmer3 GSR+ minus EmbracePlus; the black solid line indicates mean bias, the red dashed lines indicate the 95% limits of agreement (bias ± 1.96*SD) and the green lines indicate the a priori chosen acceptable boundaries. For the total phasic activity, no a priori acceptable boundary was available.
Figure 7.
Bland–Altman plots of parameter-level agreement between devices. Bland–Altman plots are shown for A) total phasic activity per minute (AUC phasic activity/min in µS), B) mean SCL (µS), C) SCR amplitude per minute (total summed SCR amplitude/min in µS), and D) SCR count per minute (SCRs/min). Differences were computed as Shimmer3 GSR+ minus EmbracePlus; the black solid line indicates mean bias, the red dashed lines indicate the 95% limits of agreement (bias ± 1.96*SD) and the green lines indicate the a priori chosen acceptable boundaries. For the total phasic activity, no a priori acceptable boundary was available.
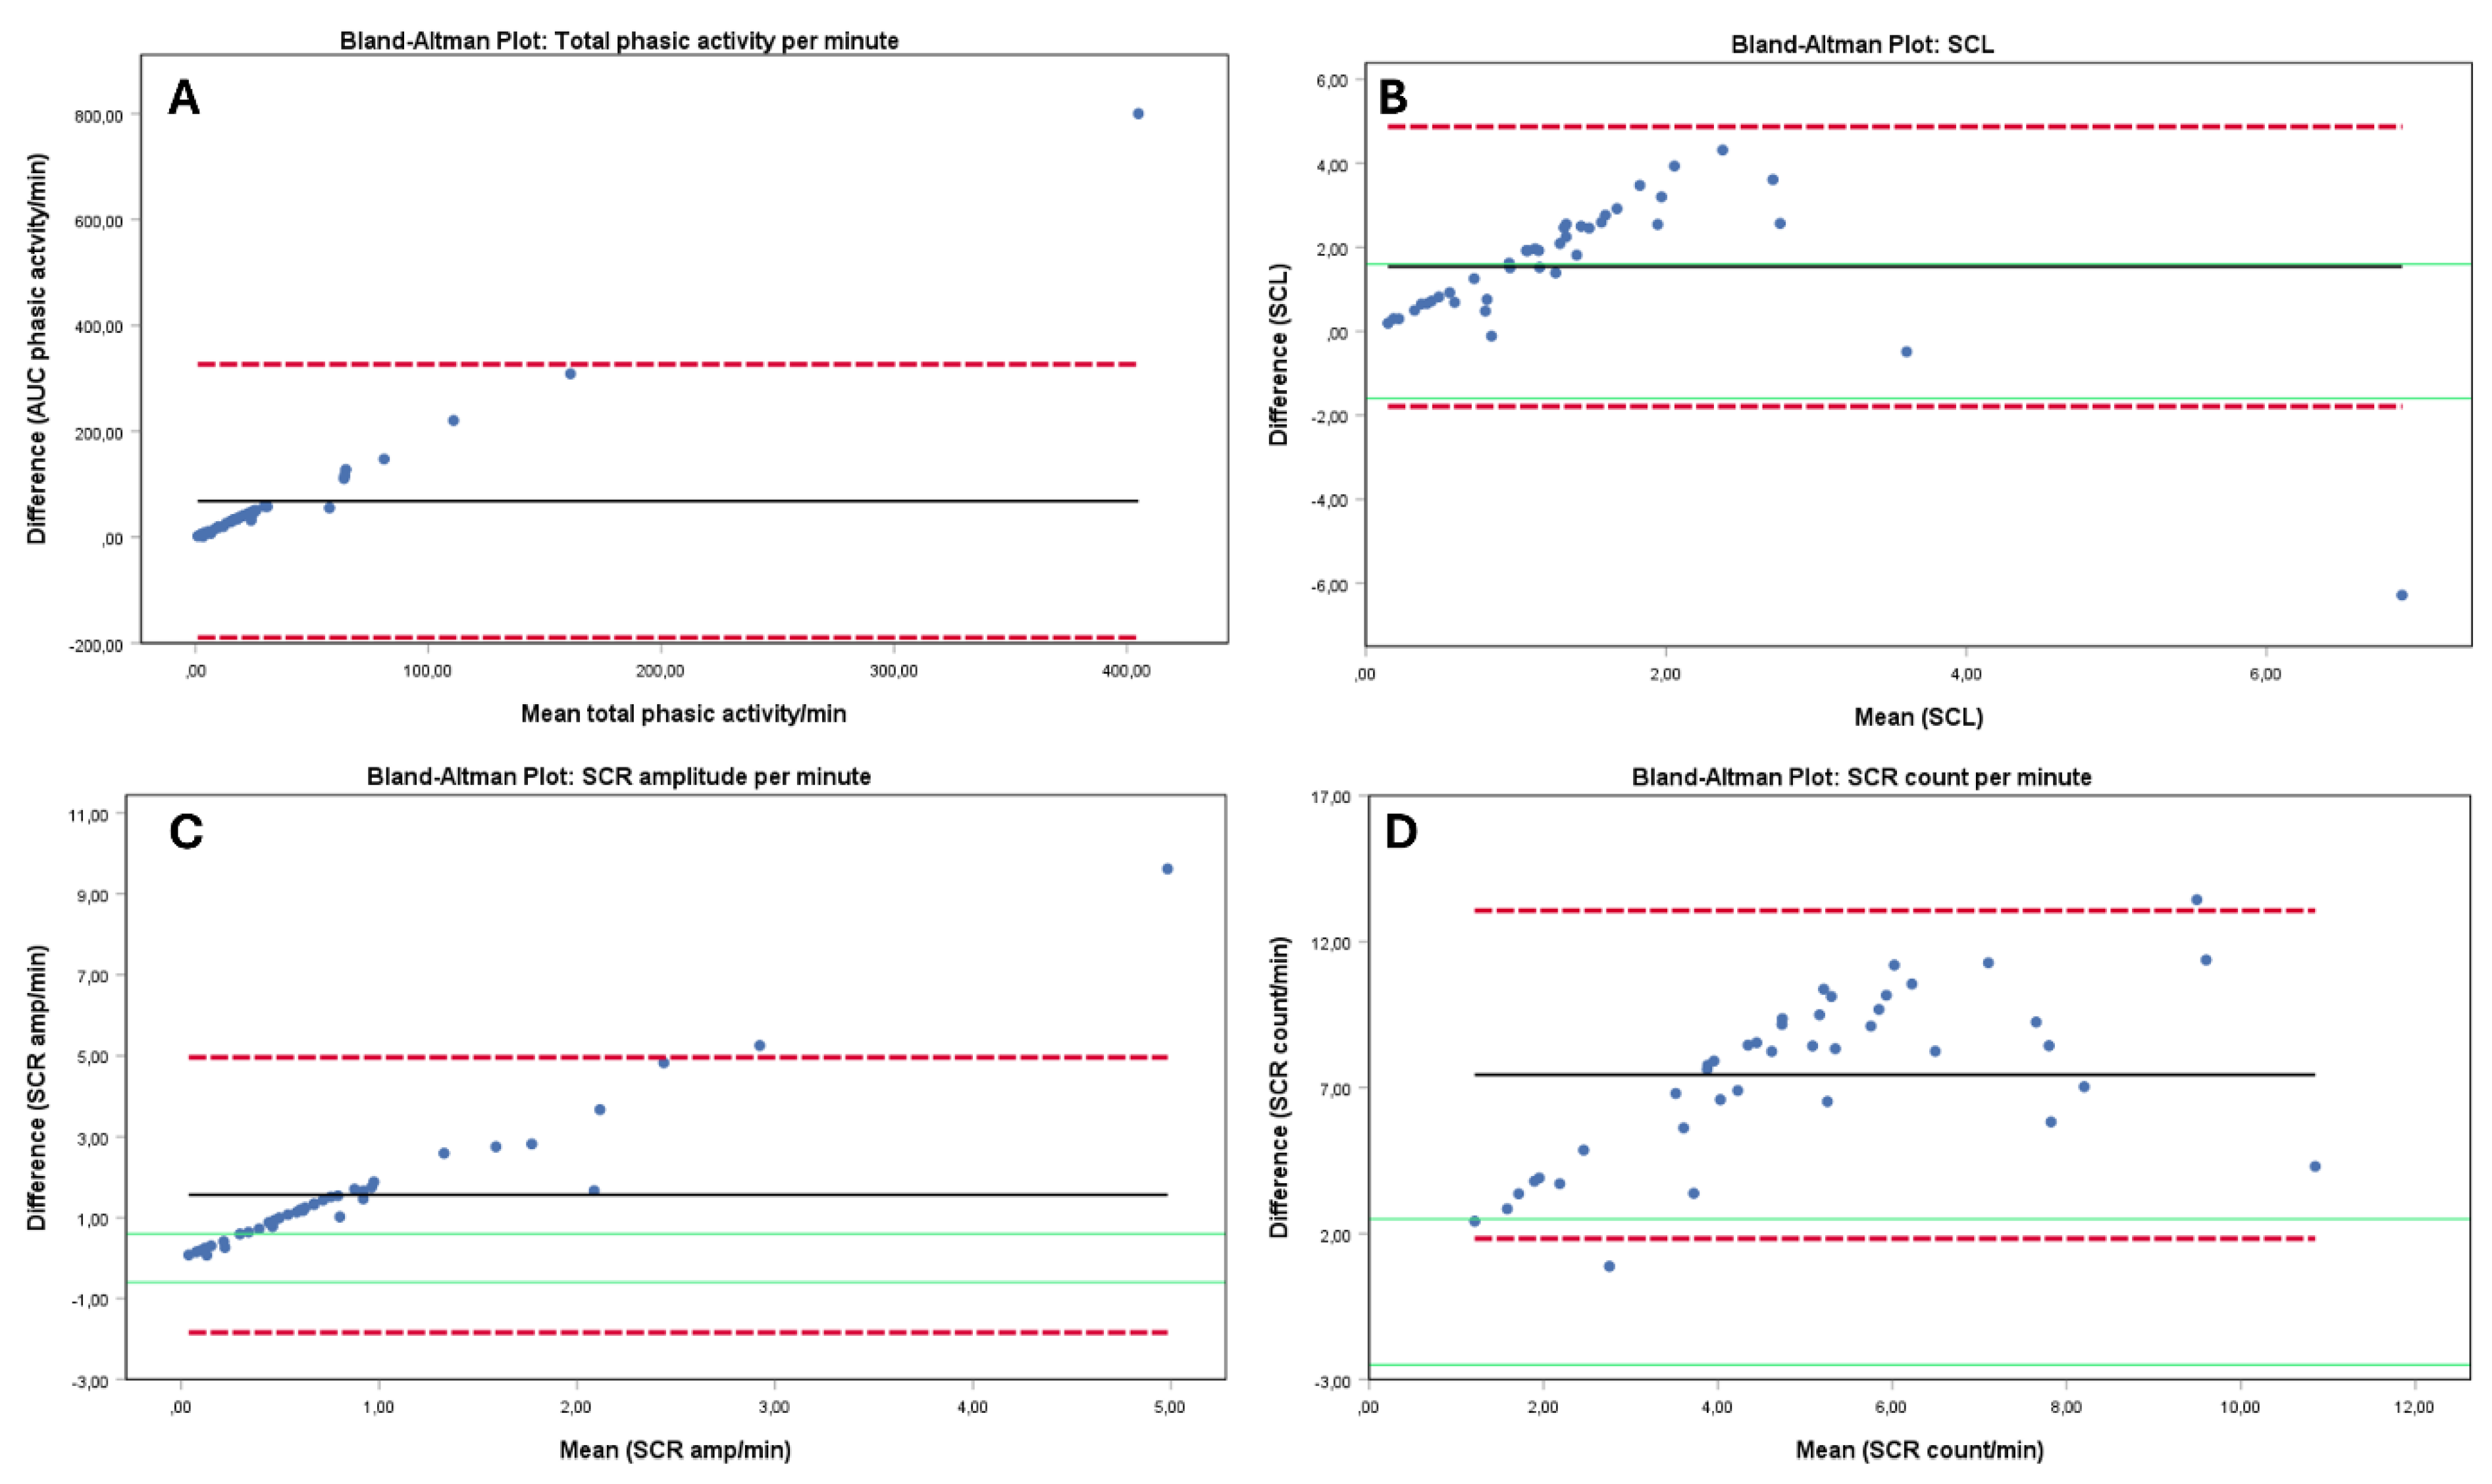
Figure 8.
Inter-device difference plots across the Stroop and VR event sets. Inter-difference plots for (A) total phasic activity per minute, (B) mean SCL, (C) SCR amplitude per minute, and (D) SCR count per minute, computed as Shimmer3 GSR+ minus EmbracePlus. For each metric, the left panel shows the Stroop event set (Breathing Exercise 1 as baseline 1, Stroop 1, Stroop 2) and the right panel shows the VR event set (Breathing Exercise 2 as baseline 2, Virtual Reality). Grey lines represent individual participants, and the red line indicates the group mean ± SE. Green horizontal lines indicate the a priori acceptability boundaries (±|reference effect|), derived from the corresponding Shimmer3 baseline-to-stressor change. For the Stroop event set, the reference effect was defined as the change from Breathing Exercise 1 to the average of Stroop 1 and Stroop 2; for the VR event set, it was defined as the change from Breathing Exercise 2 to Virtual Reality.
Figure 8.
Inter-device difference plots across the Stroop and VR event sets. Inter-difference plots for (A) total phasic activity per minute, (B) mean SCL, (C) SCR amplitude per minute, and (D) SCR count per minute, computed as Shimmer3 GSR+ minus EmbracePlus. For each metric, the left panel shows the Stroop event set (Breathing Exercise 1 as baseline 1, Stroop 1, Stroop 2) and the right panel shows the VR event set (Breathing Exercise 2 as baseline 2, Virtual Reality). Grey lines represent individual participants, and the red line indicates the group mean ± SE. Green horizontal lines indicate the a priori acceptability boundaries (±|reference effect|), derived from the corresponding Shimmer3 baseline-to-stressor change. For the Stroop event set, the reference effect was defined as the change from Breathing Exercise 1 to the average of Stroop 1 and Stroop 2; for the VR event set, it was defined as the change from Breathing Exercise 2 to Virtual Reality.
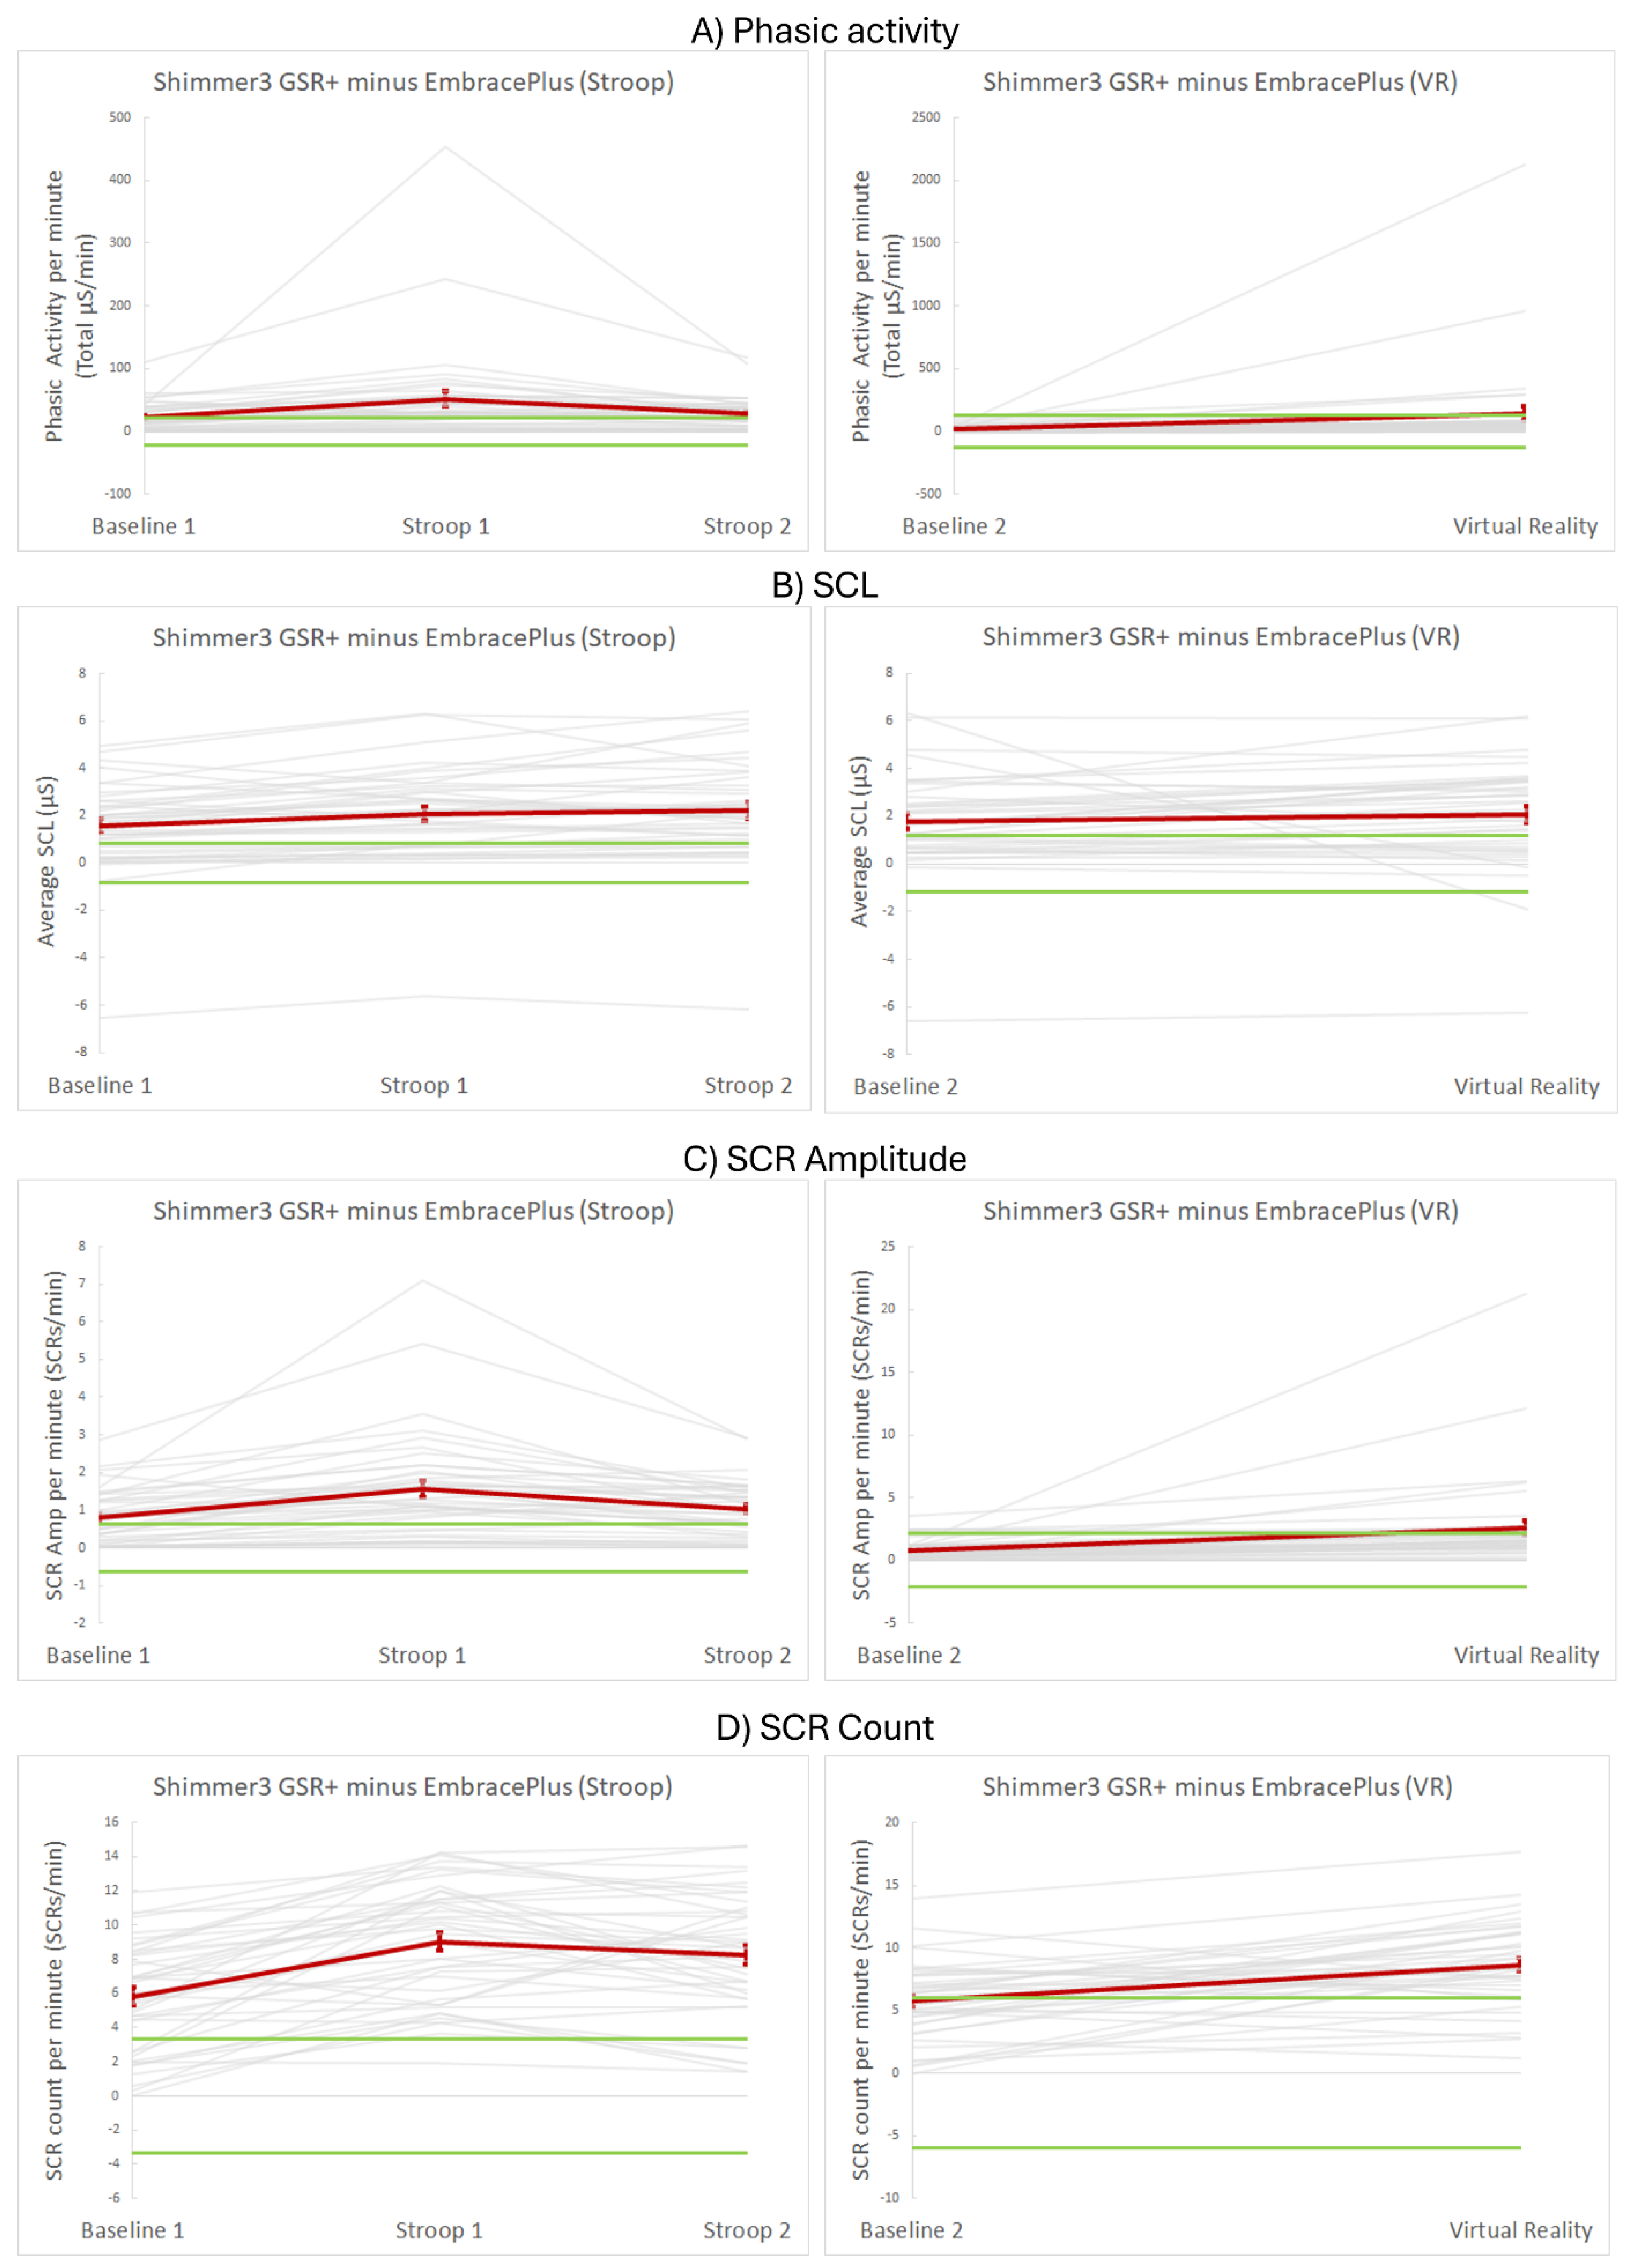

Table 1.
Descriptive values of EDA metrics.
| EmbracePlus | total phasic activity | SCL | SCR amplitude/min | SCR count/min |
| Breathing exercise 1 | 1.55 (± 5.12) | 0.54 (± 1.57) | 0.85 (± 1.83) | 0.07 (± 0.24) |
| Stroop 1 | 2.40 (± 5.92) | 0.56 (± 1.57) | 1.32 (± 2.11) | 0.11 (± 0.27) |
| Stroop 2 | 1.60 (± 3.70) | 0.65 (± 1.63) | 1.19 (± 1.94) | 0.07 (± 0.18) |
| Breathing exercise 2 | 1.22 (± 5.17) | 0.63 (± 1.66) | 0.56 (± 1.46) | 0.05 (± 0.22) |
| Virtual Reality | 8.17 (± 15.54) | 0.85 (± 1.83) | 3.64 (± 3.99) | 0.32 (± 0.58) |
| Shimmer3 GSR+ | total phasic activity | SCL | SCR amplitude/min | SCR count/min |
| Breathing exercise 1 | 24.32 (± 24.84) | 2.09 (± 1.41) | 6.68 (± 3.55) | 0.87 (± 0.81) |
| Stroop 1 | 54.57 (± 77.99) | 2.64 (± 1.69) | 10.35 (± 4.02) | 1.67 (± 1.51) |
| Stroop 2 | 30.96 (± 26.67) | 2.87 (± 1.77) | 9.42 (± 4.17) | 1.11 (± 0.81) |
| Breathing exercise 2 | 24.73 (± 29.46) | 2.41 (± 1.60) | 6.30 (± 3.27) | 0.82 (± 0.84) |
| Virtual Reality | 148.72 (± 358.64) | 2.91 (± 1.75) | 12.29 (± 4.55) | 2.95 (± 3.84) |
For each event, four metrics were analyzed for the EmbracePlus and Shimmer3 GSR+: total phasic activity (µS), SCL (µS), SCR amplitude/min (µS), and SCR count/min (count/min). Values are reported as mean ± SD.
Table 2.
Summary of event-level within-device analyses for EmbracePlus and Shimmer3 GSR+ across EDA metrics and event sets.
Table 2.
Summary of event-level within-device analyses for EmbracePlus and Shimmer3 GSR+ across EDA metrics and event sets.
| Device | EDA metric | Event set | P-value | Effect size | Significant comparisons |
|---|---|---|---|---|---|
| EmbracePlus | Total phasic activity | Stroop | P = 0.002 | W = .15 | B1 < S1, B1 < S2 |
| VR | P < .001 | r = .79 | B2 < VR | ||
| SCL | Stroop | P < .001 | W = .75 | B1 < S1 < S2, B1 < S2 | |
| VR | P < .001 | r = .62 | B2 < VR | ||
| SCR amplitude | Stroop | P = 0.070 | - | - | |
| VR | P < .001 | r = .74 | B2 < VR | ||
| SCR count | Stroop | P = 0.070 | - | - | |
| VR | P < .001 | r = .77 | B2 < VR | ||
| Shimmer3 GSR+ | Total phasic activity | Stroop | P < .001 | W = .48 | B1 < S1 > S2 |
| VR | P < .001 | r = .84 | B2 < VR | ||
| SCL | Stroop | P < .001 | W = .38 | B1 < S1, B1 < S2 | |
| VR | P < .001 | r = .58 | B2 < VR | ||
| SCR amplitude | Stroop | P < .001 | W = .51 | B1 < S1 > S2, B1 < S2 | |
| VR | P < .001 | r = .86 | B2 < VR | ||
| SCR count | Stroop | P < .001 | W = .52 | B1 < S1, B1 < S2 | |
| VR | P < .001 | r = .87 | B2 < VR |
For the Stroop set (Breathing exercise 1, Stroop 1, Stroop 2), differences between conditions were tested using Friedman tests; for the VR set (Breathing exercise 2, VR), differences were tested using Wilcoxon signed-rank tests. Effect sizes are reported as Kendall’s W for Friedman tests and as r for Wilcoxon tests. Significant comparisons are shown only when significant (family-wise error rate = 0.05) and were Bonferroni-corrected where relevant. B1 = Breathing exercise 1, B2 = Breathing exercise 2, S1 = Stroop 1, S2 = Stroop 2, VR = Virtual Reality.
Disclaimer/Publisher’s Note: The statements, opinions and data contained in all publications are solely those of the individual author(s) and contributor(s) and not of MDPI and/or the editor(s). MDPI and/or the editor(s) disclaim responsibility for any injury to people or property resulting from any ideas, methods, instructions or products referred to in the content. |
© 2026 by the authors. Licensee MDPI, Basel, Switzerland. This article is an open access article distributed under the terms and conditions of the Creative Commons Attribution (CC BY) license (http://creativecommons.org/licenses/by/4.0/).
Copyright: This open access article is published under a Creative Commons CC BY 4.0 license, which permit the free download, distribution, and reuse, provided that the author and preprint are cited in any reuse.