

Submitted:
16 September 2026
Posted:
18 September 2026
You are already at the latest version
Abstract
LATTICE is an operational research platform that converts live freeway detector streams into traffic state, prediction, emissions, cost, sensor health, and event-impact intelligence at one-minute resolution. Deployed on the Las Vegas metropolitan freeway network, LATTICE ingests measurements from approximately 1,000 Nevada Department of Transportation FAST detector locations every 60 seconds and processes them through four concurrent engines: a network health and sensor validation engine, an EMFAC-based emissions estimator covering 18 pollutant and energy metrics, a monetized impact engine grounded in the EPA Social Cost of Carbon, BenMAP per-ton health damage values, and USDOT travel-time valuation, and a corridor-specific graph-based spatio-temporal prediction service producing 15-, 30-, 45-, and 60-minute speed forecasts with continuous online MAE and RMSE tracking. All outputs are delivered to a six-view interactive dashboard viaWebSocket, persisted under tiered retention policies, and surfaced through automated daily and event-driven operational reports. By unifying live detector ingestion, environmental impact estimation, economic valuation, multi-horizon forecasting, and operational reporting within an extensible deployed system, LATTICE demonstrates a practical architecture for next-generation intelligent transportation systems in rapidly growing urban environments.
Keywords:
real-time traffic monitoring
; traffic speed prediction
; graph-based spatio-temporal models
; vehicular emissions estimation
; social cost of carbon
; intelligent transportation systems
; operational research platform
1. Introduction
Urban freeway networks are critical infrastructure whose performance directly affects economic productivity, public safety, and environmental quality. The I-15 corridor through Las Vegas is among the most heavily traveled urban freeways in the American Southwest, serving commuter, tourism, freight, and airport demand across the Las Vegas metropolitan area [1]. The region’s combination of commuter movement, tourism flows, freight activity, airport demand, and frequent large-scale planned events requires agencies to do more than passive monitoring: they must anticipate near-term traffic states, quantify the environmental and economic consequences of congestion as events unfold, and translate live detector data into decisions about staffing, ramp metering, traveler information, and after-action review.
Existing operational platforms address parts of this need but do not integrate the full workflow. The California Performance Measurement System (PeMS) [2,3] aggregates and archives statewide loop-detector data and provides performance measures including vehicle miles traveled, delay, and travel time. The Regional Integrated Transportation Information System (RITIS) [4], developed by the University of Maryland CATT Lab, fuses multi-agency data and supports real-time situational awareness, reliability reporting, congestion attribution, and after-action review. Both platforms demonstrate the value of large-scale traffic data infrastructure, yet neither integrates live deep-learning forecasting, per-detector emissions estimation, and monetized externality valuation as continuous engines in the same one-minute loop. In parallel, the traffic prediction literature has produced increasingly capable spatio-temporal models, but most are evaluated offline on curated benchmarks and rarely deployed against noisy, partially observed agency feeds [5]. Emissions tools such as the U.S. EPA’s Motor Vehicle Emission Simulator and the California Air Resources Board’s EMFAC family are widely used for inventories and regulatory analysis, but are typically applied retrospectively rather than as live operational signals [6].
LATTICE addresses this gap. The platform ingests detector data from the Nevada Department of Transportation Freeway and Arterial System of Transportation (FAST) service every 60 seconds and transforms raw lane-level measurements into traffic summaries, detector- and station-level emissions estimates, monetary cost estimates, multi-horizon speed predictions, sensor-health indicators, and operational reports. The deployed platform currently processes live measurements from approximately 1,000 known detector locations and delivers the resulting analytics through an interactive dashboard and reporting interface. By unifying live detector ingestion, environmental impact estimation, economic valuation, multi-horizon forecasting, and operational reporting within an extensible deployed system, LATTICE demonstrates a practical architecture for next-generation intelligent transportation systems in rapidly growing urban environments.
The principal contributions of this work are:
- 1.
- An integrated real-time ITS architecture that operates on a strict 60-second processing cycle over approximately 1,000 NDOT FAST detector locations and has been deployed continuously at the UNLV Transportation Research Center.
- 2.
- A multi-scale analytics pipeline that validates incoming measurements, applies zero-volume speed guards, and lifts lane-level readings up a four-level hierarchy from individual detectors through stations and directional corridors to the full freeway network.
- 3.
- A unified processing pipeline that combines four concurrent engines—network health, EMFAC-based emissions, monetized impact valuation, and graph-based spatio-temporal prediction—within a single live cycle, with all engine outputs merged into a single JSON payload broadcast over WebSocket.
- 4.
- A live multi-horizon prediction service that produces 15-, 30-, 45-, and 60-minute speed forecasts on noisy field data and continuously tracks MAE and RMSE per horizon and per sensor, with color-coded quality tiers surfaced directly on the dashboard.
- 5.
- An operational event-impact analytics workflow that supports before/during/after comparisons of speed, emissions, and dollarized impact for user-defined events and corridors.
2. Related Work
2.1. Spatio-Temporal Traffic Prediction
Traffic-prediction models on networked sensor data have evolved through several generations. Early data-driven approaches relied on classical time-series methods and shallow neural networks applied per detector [7,8]. Later convolutional encoder–decoder models treated traffic as a grid-structured signal to jointly model spatial and temporal correlations [9]. Graph-based architectures then relaxed the grid assumption by representing the roadway as a non-Euclidean graph of detector stations, leading to STGCN [10], DCRNN [11], ASTGCN [12], and Graph WaveNet [13]. Attention-based architectures subsequently replaced fixed convolutional kernels with learned, dynamically adaptive spatial and temporal weights; the Graph Multi-Attention Network (GMAN) [14] is a canonical example and forms the prediction backbone of LATTICE. More recent work has explored Transformer-style and large-language-model-based backbones [15], but these models continue to be evaluated primarily on curated benchmarks rather than live agency feeds.
Prior work in the UNLV group established the trajectory on which LATTICE builds. Guzmán, Morris, and Núñez introduced a cyberphysical system for real-time traffic prediction on the Las Vegas I-15 freeway and provided the data infrastructure and recurrent-network baseline for later studies [1]. Zahid and Morris evaluated GMAN on a 26-sensor I-15 segment and coupled its forecasts with EMFAC-based emissions visualization [16]. Subsequent work expanded benchmarking to 394 sensors across ten Las Vegas corridors and showed that masked-imputation training improves robustness under the noisy and partially missing conditions characteristic of the live NDOT FAST feed [5]. LATTICE operationalizes this progression by placing graph-based prediction within a continuously running, multi-horizon forecasting service with live accuracy monitoring.
2.2. Real-Time Monitoring Platforms
Two operational platforms anchor the comparison space. PeMS is a large-scale performance measurement system built around California loop-detector data; it supports statewide monitoring, archiving, and standard performance metrics such as vehicle miles traveled, delay, travel time, and level of service [2,3]. RITIS fuses and standardizes data from many partner agencies and exposes a mature operational toolkit for real-time situational awareness, NPMRDS-based reliability reporting, probe-data analytics, congestion attribution, and after-action review [4]. Both demonstrate the operational value of large-scale traffic data infrastructure. Neither, however, is designed around continuous detector-level deep-learning inference, per-detector EMFAC emissions, or live monetization of traffic and environmental externalities in a single integrated loop. Commercial probe-data platforms including INRIX IQ [17], HERE Traffic [18], and TomTom MOVE [19] offer broad spatial coverage and AI-assisted speed estimation but are closed, proprietary systems that do not expose per-detector EMFAC emissions, BenMAP health damage costs, or live model accuracy tracking. LATTICE targets the integration gap left by both categories while retaining the practical dashboard and reporting orientation that operations users require.
2.3. Emissions and Monetary Impact Estimation
The dominant U.S. models for on-road mobile-source emissions are the U.S. EPA MOVES family and the California Air Resources Board EMFAC family. EMFAC2021 is the EPA-approved successor to EMFAC2017 for California State Implementation Plan, conformity, and hot-spot analyses and provides emission factors for CO, NOx, hydrocarbons, PM2.5, PM10, SOx, CO2, CH4, and N2O [6,20]. Recent work has shown that traffic forecasts can be coupled with emission-rate models to produce near-future emissions estimates rather than relying on retrospective aggregation [16,21]. For monetary valuation, the U.S. EPA’s BenMAP-CE framework and the benefit-per-ton literature translate per-ton pollutant emissions into health damages [22,23]. The EPA’s Social Cost of Greenhouse Gases provides per-ton GHG damage values [24], and the USDOT Benefit-Cost Analysis Guidance supplies recommended values of travel time and ancillary operating-cost components [25]. To our knowledge, no prior real-time deployment integrates EMFAC2021 lookups, per-detector traffic states, BenMAP per-ton damages, EPA social-cost factors, and USDOT travel-time valuation in a single live operational dashboard.

Table 1.
Positioning of LATTICE relative to existing operational platforms and commercial probe-data services. A filled mark (•) indicates a first-class capability; a half mark (∘) indicates partial support; a dash (–) indicates absent or not publicly documented.
Table 1.
Positioning of LATTICE relative to existing operational platforms and commercial probe-data services. A filled mark (•) indicates a first-class capability; a half mark (∘) indicates partial support; a dash (–) indicates absent or not publicly documented.
| Capability | PeMS | RITIS | INRIX IQ | HERE Traffic | TomTom MOVE | LATTICE |
|---|---|---|---|---|---|---|
| Live detector ingestion | • | • | ∘ | ∘ | ∘ | • |
| Interactive dashboard | • | • | • | • | • | • |
| Performance / reliability metrics | • | • | ∘ | ∘ | ∘ | • |
| Live deep-learning forecasting | – | – | ∘ | ∘ | ∘ | • |
| Per-detector EMFAC emissions | – | – | – | – | – | • |
| Monetized externalities | – | ∘ | – | – | ∘ | • |
| Live model accuracy tracking | – | – | – | – | – | • |
| Event-impact analytics | ∘ | • | ∘ | – | ∘ | • |
| Open / extensible design | ∘ | ∘ | – | – | ∘ | • |
3. System Architecture
LATTICE operates as a continuously running pipeline organized into three layers: an external data source, a processing layer, and a client layer, as illustrated in Figure 1. The processing layer executes a fixed 60-second cycle in which it polls the detector network, processes the raw readings through four concurrent engines, packages all outputs into a single unified payload, and pushes that payload to every connected client via WebSocket. The platform currently ingests data from approximately 1,000 known detector locations spanning the five major freeway corridors of the Las Vegas metropolitan area: I-15, I-515, US-95, CC-215, and I-215, in both directions.
3.1. Data Acquisition
LATTICE acquires traffic data from the NDOT FAST network through an authenticated SOAP-based web service. The Freeway and Arterial System of Transportation (FAST), operated by the Regional Transportation Commission of Southern Nevada on behalf of NDOT, manages the freeway detector infrastructure across the Las Vegas metropolitan area [26]. The platform’s sensor registry covers approximately 1,000 known detector locations (917 defined GPS positions) across the Las Vegas metropolitan freeway network, organized into stations of two to four lane-level detectors at each physical location. The platform issues a polling request every 60 seconds and receives the latest readings from all active detectors. Each detector reports three measurements per polling interval: vehicle speed in km/h, vehicle count, and lane occupancy in percent. Raw speeds are converted to mph using the standard factor , and a zero-count guard forces the reported speed to zero when no vehicles are detected in the interval, eliminating residual sensor noise from being interpreted as moving traffic.
LATTICE organizes detector readings into a four-level hierarchy (Figure 2). Each lane detector corresponds to a single inductive loop and reports raw measurements. Lane detectors sharing the same physical roadway cross-section are grouped into a station. Stations are sequenced along each directional corridor (for example I-15 SB), and corridors together form the full Las Vegas freeway network. This hierarchy is the common index along which all four engines aggregate.
3.2. Processing Pipeline
Within each 60-second cycle, the parsed and validated frame enters four concurrent processing engines. The first computes a network health summary including average speed, total flow, a four-tier speed classification, and a composite health score. The second applies EMFAC2021 emission factors to each detector’s speed and volume to produce pollutant, fuel, and energy estimates at lane, station, corridor, and network levels. The third converts emission masses and congestion delay into dollarized impacts using configurable damage cost factors. The fourth feeds corridor-specific speed histories into a graph-based spatio-temporal prediction model and emits multi-horizon forecasts when sufficient history is available. The engines are defined in detail in Section 4.
After all engines complete, the system assembles the raw detector data, network summary, instantaneous and accumulated emissions, dollarized impacts, predictions, and prediction system status into a single JSON payload. This payload is broadcast to all connected clients as a WebSocket event, ensuring that every dashboard instance receives a synchronized, comprehensive update within seconds of the underlying acquisition.
3.3. Persistence and Delivery
LATTICE employs a push-first delivery model. Each processing cycle concludes with a WebSocket broadcast that delivers the complete payload to all connected browsers without client-side polling. A REST API provides a fallback for initial page bootstrap and for external consumers that require on-demand access. The platform maintains a two-tier storage strategy. An in-memory tier uses fixed-length ring buffers (capped at 1,440 entries, corresponding to 24 hours at one-minute intervals) to provide instantaneous access to recent time-series data for chart rendering. A persistent tier uses four independent stores with automatic time-based pruning: emissions snapshots retained for seven days with writes every 15 minutes, per-sensor lane readings retained for 24 hours, network-aggregated chart history retained for 24 hours, and prediction run logs retained for 24 hours. Cumulative emission totals are restored from the persistent store on system restart so that long-running accumulations are preserved across deployment events.
4. Core Engines
4.1. Network Health and Sensor Validation
The Network Health engine transforms the validated detector frame into intelligence about the state of the freeway and the state of the sensing infrastructure itself.
4.1.1. Validation
Before aggregation, the engine enforces sanity bounds (non-negative flow, occupancy in , speed below a corridor-specific maximum), drops samples that violate these bounds, and applies the zero-volume speed guard described earlier. Detectors with no valid sample in the cycle are flagged as unavailable rather than imputed inline; imputation is left to the prediction engine where the masked-training regime explicitly handles missingness.
4.1.2. Station-Level Aggregation
Lane-level detectors at the same station are combined using volume-weighted averaging,
where and are the speed and flow at lane detector d. Station-level flow is the sum of lane flows; station-level occupancy is the unweighted average across active lanes.
4.1.3. Speed Classification and Network Health
Each station is then assigned to one of four operational tiers based on speed relative to the corridor free-flow value : stopped ( mph), congested (), moderate (), and free flow (). From these tier counts and the underlying availability and speed records, the engine computes three sub-scores. The sensor sub-score captures detector availability. The speed sub-score rewards proximity to free-flow conditions. The congestion sub-score penalizes the fraction of detectors in degraded tiers, with stopped traffic weighted more heavily than merely congested traffic, bounded to . These combine into a composite network health score
The same construction is applied at the network and per-corridor scales, so that the dashboard can surface a single health number together with its decomposition.
4.2. EMFAC-Based Emissions Estimation
LATTICE estimates emissions in real time from each detector using a speed-binned lookup derived from EMFAC2021 for a representative California county whose vehicle mix approximates the Las Vegas metropolitan area [6,16]. The lookup table contains 18 columns across 14 speed bins (5 to 70 mph in 5-mph steps): 11 running exhaust species (CO2, CO, NOx, PM2.5, PM10, SOx, ROG, TOG, CH4, N2O, NH3), 2 brake and tire wear species (PM2.5 and PM10 from mechanical abrasion), fuel consumption, energy consumption, and 3 vehicle-miles-traveled metrics (total, conventional, and electric VMT).
For each detector d and each pollutant p, the per-cycle emission mass is
where returns the emission rate for the speed bin nearest the observed speed . Per-detector emissions are aggregated up the four-level hierarchy and accumulated into daily totals (which reset at local midnight) and cumulative totals (which persist across restarts via the emissions store). The same construction is applied to predicted speed and flow when the Prediction engine is active, yielding a near-future emissions forecast alongside the speed forecast.
4.3. Monetary Impact Valuation
A dedicated engine converts emissions masses and congestion delay into dollarized operational indicators. Greenhouse-gas damages are priced using the U.S. EPA Social Cost of Greenhouse Gases. The default coefficient is the central 2.0% near-term Ramsey discount rate value of approximately $204 per metric ton of CO2, with companion values for CH4 and N2O drawn from the same report [24]. Criteria-pollutant damages are priced using benefit-per-ton estimates derived from EPA’s BenMAP-CE framework [22,23].
Congestion is priced by combining a delay model with the USDOT’s Value of Travel Time and ancillary operating-cost guidance from the 2024 Benefit-Cost Analysis package [25]. For each detector with non-zero flow and observed speed below free flow, the engine computes
where is an effective segment length associated with detector d (calibration of from inter-detector distances is part of the active development roadmap; current outputs use a configurable network-average value). Person-hours of delay follow as at an assumed vehicle occupancy of , and the dollarized congestion cost is
where /person-hr is the USDOT surface-transport default in 2020 USD [25] and is the per-vehicle-hour excess operating cost. The total dollarized impact at detector d is
All damage costs, the value of time, and the occupancy and operating-cost coefficients are configurable; LATTICE records the active coefficient set with each computation for auditability, which is important when published guidance is updated.
4.4. Graph-Based Prediction and Live Monitoring
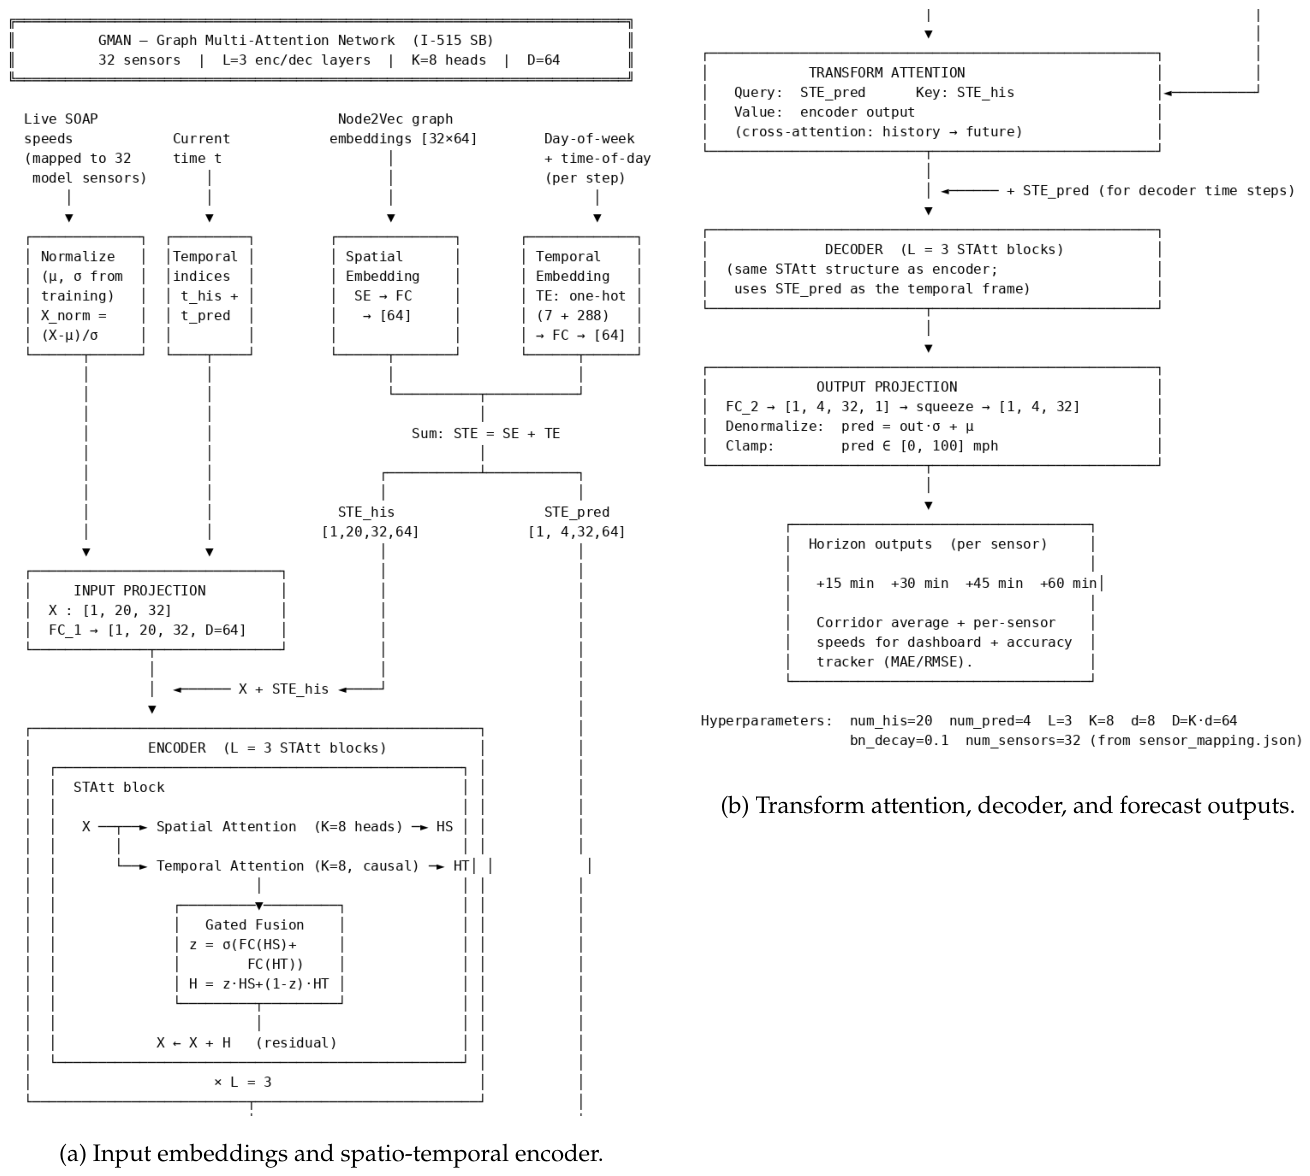
The Prediction engine maintains a sliding window of validated per-sensor speed history for each active corridor. When the buffer fills (20 timesteps for the LV-I15 model configuration), the engine issues an inference call to a graph-based spatio-temporal attention model and publishes forecasts at four horizons: and minutes. The currently deployed model is GMAN [14], trained on Las Vegas corridor data using the masked-imputation regime introduced in our prior work [5]. The choice of model family—a graph encoder with attention-based spatio-temporal blocks—is justified in Section 2 as the current state of the art for networked traffic forecasting; implementation details of GMAN and the masked-training procedure are reported in our prior work [5,16]. Figure 3 summarizes the inference architecture for the 32-sensor I-515 SB configuration; sensor counts and model settings are corridor-specific.
Forecasts are written to the prediction store together with their target timestamps. When a target timestamp passes, the engine retrieves the corresponding observed speed from the live frame and records the prediction error. Over a configurable rolling window (default 60 minutes), the engine computes mean absolute error
and root mean squared error
both per horizon and per sensor. Accuracy is classified into quality tiers based on the current MAE: excellent (≤3 mph), good (≤5 mph), fair (≤8 mph), poor (≤12 mph), and bad (>12 mph), each rendered as a color-coded badge. The Predictions view of the dashboard surfaces these statistics together with the raw forecasts, making live model quality a first-class system output rather than an offline metric.
5. Deployment and Dashboard
5.1. Deployment Environment
LATTICE is deployed continuously at the UNLV Transportation Research Center. The current implementation is a single-server Python application: a background processing thread handles ingestion, engine execution, and persistence, while a Flask web server with Socket.IO serves the dashboard and REST endpoints. End-to-end cycle time—SOAP request, parsing, engine execution, persistence writes, and WebSocket broadcast—comfortably completes within the 60-second window for the currently active corridor population.
The platform is explicitly configuration-driven and modular: all operational parameters—corridor definitions, polling interval, model paths, retention durations, cost factors, prediction horizons, and emissions lookup paths—are declared in a single config.json file, and each processing engine is implemented as an independently replaceable module behind a defined interface. Adding a new prediction model, swapping the emissions lookup table, or adjusting the monetization coefficients requires no code changes. This design also enables plug-and-play experimentation: researchers can substitute alternative prediction architectures, emissions models, or cost frameworks and observe the downstream effect on all dashboard outputs within a single processing cycle.
5.2. Dashboard
The LATTICE dashboard is a single-page web application that presents all system outputs through six navigation tabs: Traffic, Emissions, Predictions, Report, Task, and About. Each tab tailors both the visible data panel and the map’s behavioral mode to a different operational concern.
The Traffic tab presents a Leaflet map of the Las Vegas freeway network with color-coded sensors, a network summary strip along the top, and a corridor filter. Clicking a sensor opens a side panel with per-lane speed, volume, and occupancy together with a 24-hour trend chart. The Emissions tab switches the map to a heatmap layer and adds pollutant selection across the 18 tracked species, with instantaneous, daily, and cumulative totals broken down by corridor. The Predictions tab shows model readiness, buffer fill, the four-horizon forecast cards, a 24-hour actual-versus-predicted chart, and a per-sensor predictions table with delta and live MAE/RMSE. The Report tab auto-generates a printable daily operations summary that aggregates KPIs, emissions, prediction accuracy, and corridor breakdowns from the persistent stores, and exposes CSV exports for downstream analysis. The Task tab provides a self-contained event analysis module in which users define a named task (e.g., a planned special event), select a corridor and before/during/after date windows, and retrieve speed profiles, emissions totals, and dollarized impact comparisons against the user-defined baseline; task data is persisted in an isolated store that is independent of the live system’s retention configuration so that long-horizon comparisons are not affected by the rolling-window pruning applied to operational data. The About tab documents the active configuration, including coefficients, retention windows, and model versions.
5.3. Scope and Limitations
LATTICE is an operational research platform under active development, not a finished commercial system. The current implementation is a single-server deployment and is not yet horizontally scalable; the persistence layer uses lightweight embedded databases sized for the present detector population rather than for statewide expansion. The Prediction engine currently runs against the I-515 SB corridor and a small number of additional active corridors, with model configurations in place for ten corridors. Absolute emission and dollar figures should be interpreted as operational indicators rather than regulatory inventories: EMFAC2021 is calibrated for California, and a Nevada-specific calibration is part of the roadmap. The Prediction model was trained for benchmark conditions and exhibits distribution shift against the live feed; continuous-deployment retraining is an explicit roadmap item. These boundaries frame the platform’s outputs as operational research indicators rather than regulatory assessments.
6. Discussion and Roadmap
6.1. The Case for Integration
The contribution of LATTICE is integration. Forecasting, emissions, cost, and sensor health are computed in the same loop and against the same canonical detector frame; live model performance is itself a system output rather than an offline metric; and event analytics are a first-class workflow rather than a manual, one-off study. Each individual capability has precedent in the literature or in existing platforms, but the combination at one-minute resolution on live agency data is, to our knowledge, novel.
6.2. Lessons from Live Deployment
Three lessons emerged from operating the platform continuously. First, live data are noisier than benchmark data in ways that matter for downstream analytics: detector availability fluctuates, timing drift accumulates, and brief blackouts are common. Robust preprocessing and the masked-imputation prediction regime [5] are not optional. Second, distribution shift between training data and the live feed is real and measurable; surfacing it as a continuous live signal converts retraining from a periodic chore into a triggered, evidence-based action. Third, operational reporting structure matters as much as raw analytics: agencies adopt a system more readily when the daily report and the event report look like documents the agency already produces.
6.3. Development Roadmap
Six tracks define the next phase:
- Production architecture. Migration from the current single-server deployment to a containerized service set with a message bus and a time-series persistence tier, to support statewide expansion.
- Multi-corridor prediction. Activating prediction on all ten configured corridors and stress-testing live inference latency at the full 394-sensor scale [5].
- Automated retraining. Closing the loop between live drift signals and scheduled retraining, including a Nevada-specific training data window.
- Multi-source fusion. Incorporating incident feeds, weather data, and probe-vehicle observations to improve robustness during non-recurrent congestion conditions.
- Emissions calibration. Nevada-specific EMFAC adjustment, VMT calibration with per-detector influence lengths, and a parallel MOVES estimator for cross-validation.
- Smart vehicle and connected infrastructure integration. LATTICE’s open, modular architecture is not tied to any specific sensor technology. As connected vehicles and smart roadside infrastructure become more prevalent, the platform is designed to ingest richer data streams—trajectory data, vehicle-generated speed signals, and connected signal state— without architectural change. In the longer term, LATTICE’s real-time monetized impact engine provides a natural objective function for closed-loop control, where short-horizon forecasts inform pre-emptive ramp-metering, dynamic message sign content, and freeway service patrol positioning before predicted congestion materializes. These are research directions rather than current features, but the architectural foundation to pursue them is already in place.
7. Conclusion
LATTICE demonstrates that traffic state, prediction, emissions, monetized impact, sensor health, and event-impact intelligence can be unified within a single live system operating on real agency detector data. The platform has been deployed continuously at the UNLV Transportation Research Center and exposes its outputs through a six-view dashboard with REST and WebSocket interfaces. We have framed the system as an operational research platform under active development; the integrated architecture and the deployment lessons it has surfaced are themselves part of the contribution. The roadmap is concrete and incremental, and the platform is structured to accept new models, new data sources, and new cost coefficients without architectural change. The modular, configuration-driven design positions LATTICE as a natural integration point for emerging V2X and connected infrastructure data streams, with a longer-term path toward closed-loop operational control grounded in real-time monetized impact estimates. We hope LATTICE serves as a reference design for next-generation ITS platforms in rapidly growing urban regions where the gap between monitoring and decision-grade operational intelligence is most visible.
Acknowledgments
This work was supported by the U.S. Department of Transportation, Office of the Assistant Secretary for Research and Technology, University Transportation Centers Program, through the Research and Education for Promoting Safety (REPS) Tier 1 University Transportation Center (Source Agency: REPS UTC; TRB Accession No. 01931109). The REPS center is led by Howard University in partnership with the University of Maryland, San Jose State University, and the University of Nevada, Las Vegas. The research was conducted at the UNLV Transportation Research Center, Howard R. Hughes College of Engineering, University of Nevada, Las Vegas, under the project “Freeway and Arterial Performance and Safety Analysis with High Resolution Vehicle Trajectory Data” (Start Date: June 2023; Funding: $143,821). The authors also thank the Regional Transportation Commission of Southern Nevada (RTC) and the Nevada Department of Transportation (NDOT) for ongoing access to the FAST freeway detector feed. Disclaimer: The contents of this paper reflect the views of the authors, who are responsible for the facts and accuracy of the information presented herein. This document is disseminated under the sponsorship of the U.S. Department of Transportation’s University Transportation Centers Program, in the interest of information exchange. The U.S. Government assumes no liability for the contents or use thereof.
References
- Guzmán, J.A.; Morris, B.T.; Núñez, F. A Cyberphysical System for Data-Driven Real-Time Traffic Prediction on the Las Vegas I-15 Freeway. IEEE Intell. Transp. Syst. Mag. 2023, 15, 23–35. [Google Scholar] [CrossRef]
- Chen, C.; Petty, K.; Skabardonis, A.; Varaiya, P.; Jia, Z. Freeway Performance Measurement System: Mining Loop Detector Data. Transp. Res. Rec. J. Transp. Res. Board 2001, 96–102. [Google Scholar] [CrossRef]
- Varaiya, P. 2004. Freeway Performance Measurement System (PeMS), Version 4. Technical Report UCB-ITS-PRR-2004-13. California PATH Research Program, University of California Berkeley. [Google Scholar]
- CATT Lab; University of Maryland. Regional Integrated Transportation Information System (RITIS). 2024. Available online: https://www.cattlab.umd.edu/ritis/ (accessed on 2026).
- Zahid, T.B.; Morris, B.T. Benchmarking Limitations of Traffic Prediction with Noisy Field Measurements. In Proceedings of the Proc. IEEE Int. Conf. Vehicular Electronics and Safety (ICVES), 2024. [Google Scholar] [CrossRef]
- California Air Resources Board. EMFAC2021 Volume III Technical Documentation, Version 1.0.1; Technical report; California Air Resources Board, Mobile Source Analysis Branch: Sacramento, CA, 2021. [Google Scholar]
- Wang, J.; Gu, Q.; Wu, J.; Liu, G.; Xiong, Z. Traffic Speed Prediction and Congestion Source Exploration: A Deep Learning Method. In Proceedings of the Proc. IEEE 16th Int. Conf. Data Mining (ICDM), 2016; pp. 499–508. [Google Scholar] [CrossRef]
- Yin, X.; Wu, G.; Wei, J.; Shen, Y.; Qi, H.; Yin, B. Deep Learning on Traffic Prediction: Methods, Analysis, and Future Directions. IEEE Trans. Intell. Transp. Syst. 2022, 23, 4927–4943. [Google Scholar] [CrossRef]
- Yuan, H.; Li, G. A Survey of Traffic Prediction: From Spatio-Temporal Data to Intelligent Transportation. Data Sci. Eng. 2021, 6, 63–85. [Google Scholar] [CrossRef]
- Yu, B.; Yin, H.; Zhu, Z. Spatio-Temporal Graph Convolutional Networks: A Deep Learning Framework for Traffic Forecasting. In Proceedings of the Proc. 27th Int. Joint Conf. Artificial Intelligence (IJCAI), 2018; pp. 3634–3640. [Google Scholar] [CrossRef] [PubMed]
- Li, Y.; Yu, R.; Shahabi, C.; Liu, Y. Diffusion Convolutional Recurrent Neural Network: Data-Driven Traffic Forecasting. In Proceedings of the Proc. Int. Conf. Learning Representations (ICLR), 2018. [Google Scholar]
- Guo, S.; Lin, Y.; Feng, N.; Song, C.; Wan, H. Attention Based Spatial-Temporal Graph Convolutional Networks for Traffic Flow Forecasting. Proc. Proc. AAAI Conf. Artif. Intell. 2019, Vol. 33, 922–929. [Google Scholar] [CrossRef]
- Wu, Z.; Pan, S.; Long, G.; Jiang, J.; Zhang, C. Graph WaveNet for Deep Spatial-Temporal Graph Modeling. In Proceedings of the Proc. 28th Int. Joint Conf. Artificial Intelligence (IJCAI), 2019; pp. 1907–1913. [Google Scholar] [CrossRef] [PubMed]
- Zheng, C.; Fan, X.; Wang, C.; Qi, J. GMAN: A Graph Multi-Attention Network for Traffic Prediction. Proc. Proc. AAAI Conf. Artif. Intell. 2020, Vol. 34, 1234–1241. [Google Scholar] [CrossRef]
- Vaswani, A.; Shazeer, N.; Parmar, N.; Uszkoreit, J.; Jones, L.; Gomez, A.N.; Kaiser; Polosukhin, I. Attention Is All You Need. In Proceedings of the Advances in Neural Information Processing Systems (NeurIPS), 2017; Vol. 30. [Google Scholar]
- Zahid, T.B.; Morris, B.T. Using Deep Traffic Prediction for EMFAC Emission Estimation and Visualization. In Proceedings of the Proc. IEEE 27th Int. Conf. Intelligent Transportation Systems (ITSC), Edmonton, Canada, 2024; pp. 2488–2493. [Google Scholar] [CrossRef]
- INRIX; Inc. INRIX IQ: Location Intelligence and Analytics Platform Includes Mission Control real-time traffic dashboard and AI Traffic deep-learning speed estimation. 2024. Available online: https://inrix.com/products/iq-location-intelligence-solutions/.
- HERE Technologies. HERE Real-Time Traffic and Traffic Analytics Probe-data and sensor-fusion traffic flow and incident API covering 70+ countries. 2024. Available online: https://www.here.com/solutions/real-time-traffic-information.
- TomTom, N.V. TomTom MOVE: Traffic Analytics and Mobility Data Portal. 2024. Available online: https://www.tomtom.com/tomtom-traffic/ Floating-car-data.
- U.S. Environmental Protection Agency. Official Release of EMFAC2021 Motor Vehicle Emission Factor Model for Use in the State of California. Fed. Regist. 2022, vol. 87, 68258–68262. [Google Scholar]
- Morris, B.T.; Tran, C.; Scora, G.; Trivedi, M.M.; Barth, M.J. Real-Time Video-Based Traffic Measurement and Visualization System for Energy/Emissions. IEEE Trans. Intell. Transp. Syst. 2012, 13, 1667–1678. [Google Scholar] [CrossRef]
- Fann, N.; Baker, K.R.; Fulcher, C.M. Characterizing the PM2.5-Related Health Benefits of Emission Reductions for 17 Industrial, Area and Mobile Emission Sectors Across the U.S. Environ. Int. 2012, 49, 141–151. [Google Scholar] [CrossRef] [PubMed]
- U.S. Environmental Protection Agency. Environmental Benefits Mapping and Analysis Program — Community Edition (BenMAP-CE) User’s Manual. Technical report; U.S. EPA, Office of Air Quality Planning and Standards: Research Triangle Park, NC, 2023. [Google Scholar]
- U.S. Environmental Protection Agency. Technical Report EPA-HQ-OAR-2021-0317; Report on the Social Cost of Greenhouse Gases: Estimates Incorporating Recent Scientific Advances. U.S. Environmental Protection Agency: Washington, DC, 2023.
- U.S. Department of Transportation. Benefit-Cost Analysis Guidance for Discretionary Grant Programs. Technical report; U.S. Department of Transportation, Office of the Secretary: Washington, DC, 2024. [Google Scholar]
- Regional Transportation Commission of Southern Nevada. About Traffic Management — Freeway and Arterial System of Transportation (FAST). 2024. Available online: https://www.rtcsnv.com/traffic-cams/about-traffic-management/.
Figure 1.
LATTICE end-to-end system architecture. Raw detector measurements from the NDOT FAST web service flow through four concurrent processing engines—network health, emissions, monetized impact, and graph-based speed prediction—before being assembled into a unified payload and delivered to dashboard clients via WebSocket. Persistent stores retain time-aggregated history under tiered retention policies.
Figure 1.
LATTICE end-to-end system architecture. Raw detector measurements from the NDOT FAST web service flow through four concurrent processing engines—network health, emissions, monetized impact, and graph-based speed prediction—before being assembled into a unified payload and delivered to dashboard clients via WebSocket. Persistent stores retain time-aggregated history under tiered retention policies.
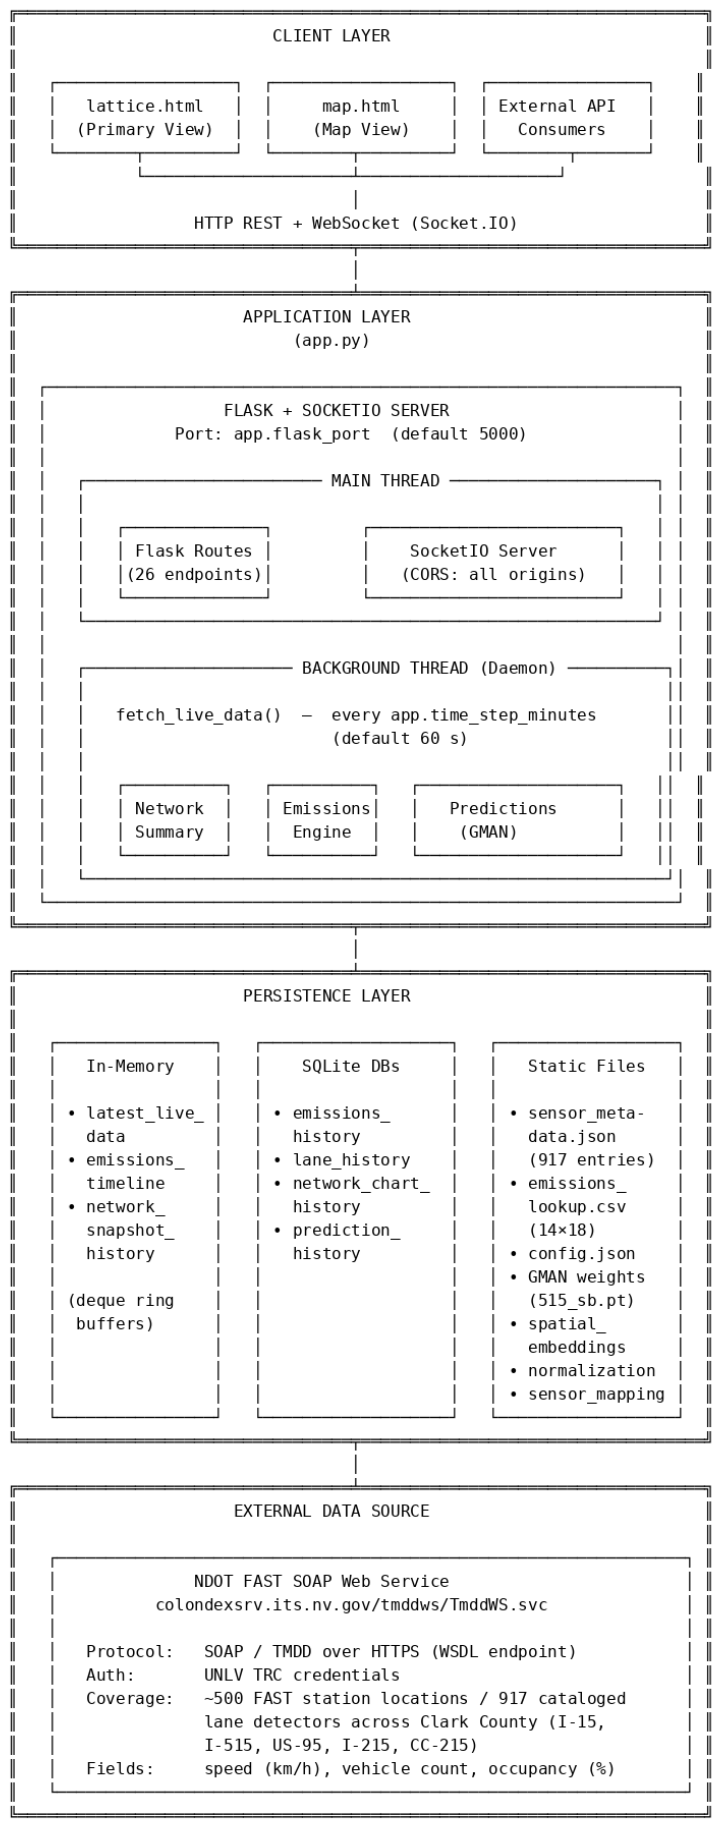
Figure 2.
Four-level detector hierarchy used throughout LATTICE. Lane-level detector measurements are aggregated to stations, then along directional corridors, and finally across the network. All engines compute and persist outputs at each level.
Figure 2.
Four-level detector hierarchy used throughout LATTICE. Lane-level detector measurements are aggregated to stations, then along directional corridors, and finally across the network. All engines compute and persist outputs at each level.
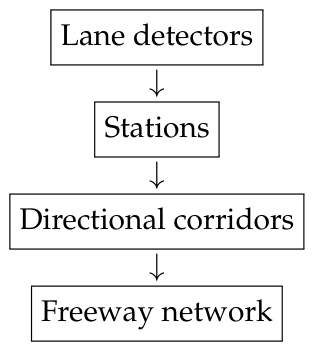
Figure 3.
GMAN inference architecture for the I-515 SB configuration. Panel (a) combines normalized speed history with spatial and temporal embeddings in the encoder. Continuing in panel (b), transform attention links historical representations to future timesteps; the decoder and output projection produce per-sensor speed forecasts at 15-, 30-, 45-, and 60-minute horizons.
Figure 3.
GMAN inference architecture for the I-515 SB configuration. Panel (a) combines normalized speed history with spatial and temporal embeddings in the encoder. Continuing in panel (b), transform attention links historical representations to future timesteps; the decoder and output projection produce per-sensor speed forecasts at 15-, 30-, 45-, and 60-minute horizons.
Disclaimer/Publisher’s Note: The statements, opinions and data contained in all publications are solely those of the individual author(s) and contributor(s) and not of MDPI and/or the editor(s). MDPI and/or the editor(s) disclaim responsibility for any injury to people or property resulting from any ideas, methods, instructions or products referred to in the content. |
© 2026 by the authors. Licensee MDPI, Basel, Switzerland. This article is an open access article distributed under the terms and conditions of the Creative Commons Attribution (CC BY) license (http://creativecommons.org/licenses/by/4.0/).
Copyright: This open access article is published under a Creative Commons CC BY 4.0 license, which permit the free download, distribution, and reuse, provided that the author and preprint are cited in any reuse.