
Submitted:
17 September 2026
Posted:
18 September 2026
You are already at the latest version
Abstract
Background: Prostate cancer is a neoplastic disease that generally remains asymptomatic until its late-stage emergence. Among the techniques approved to date for prostate cancer diagnosis, prostate-specific antigen (PSA) screening is the most established method for its early detection. Currently, centralized clinical laboratories measure serum PSA using costly, time-consuming, multi-step immunoassays that rely heavily on lab technicians and highly sophisticated equipment. To address this issue, we developed a disposable, label-free electrochemical biosensor as a proof of concept for rapid, single-step, user-friendly, cost-effective detection of total PSA (tPSA) and free PSA (fPSA). Methods: The immunosensors were based on HNO3-pretreated pencil graphite electrodes (PGEs) modified with graphene oxide (GO). Antigen concentrations were determined by measuring signals from the [Fe(CN)6]3-/4- redox probe using cyclic voltammetry (CV); the presence of antigen molecules increased electron-transfer resistance at the PGE surface. Results: The 30-minute tPSA biosensor exhibited a linear range and limit of detection (LOD) of 0.01-1000 ng/mL and 0.648 pg/mL, respectively. The 45-minute fPSA immunosensor had a 0.1-1000-ng/mL linear range and a 0.07-pg/mL LOD. Conclusions: The biosensors’ performance, along with selectivity, reproducibility, and stability analyses, and validation tests using commercial enzyme-linked immunosorbent assay (ELISA) kits with real human samples, provided early evidence supporting the potential clinical application of these immunosensors.
Keywords:
prostate cancer
; early detection
; prostate-specific antigen
; tPSA
; fPSA
; electrochemical biosensor
; pencil graphite electrode
; graphene oxide
1. Introduction
Since 2022, prostate cancer, a malignant neoplasia, has been ranked as the second most commonly diagnosed cancer in men and the fifth cause of cancer-associated mortality among them globally [1,2,3,4]. The American Cancer Society estimated that in 2024, 299,010 new prostate cancer cases and 35,250 prostate cancer-related deaths would be identified in the United States [5]. This cancer typically remains asymptomatic until its late-stage emergence. Given this specific feature of prostate cancer and the difficulties in controlling and treating it in advanced stages, detecting early-stage prostate cancer has become of paramount importance [6].
Among the current prostate cancer diagnostic techniques, such as digital rectal examination, imaging strategies including transrectal ultrasonography, magnetic resonance imaging, computed tomography, and positron emission tomography, tissue biopsy, and liquid biopsy, the latter, which exploits the use of prostate-specific antigen (PSA) as a prostate cancer biomarker, is the most established method for the early detection of this cancer [6,7,8,9,10,11,12,13]. As a result of the PSA screening test, the prostate cancer mortality rate has declined by more than 53% in the United States [6,14].
PSA is an androgen-regulated enzyme exclusively produced by prostate epithelial cells [10,15,16,17]. PSA-α1-antichymotrypsin complex (PSA-ACT) and free PSA (fPSA) are the most predominant PSA molecular forms in serum. The combination of these two forms is known as total PSA (tPSA), of which 70-90% is PSA-ACT and the remainder is fPSA [17,18,19]. In general, the clinical PSA screening test measures tPSA and fPSA levels in serum specimens and reports the fPSA-to-tPSA ratio. In prostate cancer patients, the level of tPSA increases while the fPSA level declines. While the underlying mechanism is not yet fully understood, some researchers believe that prostate cancer cells produce higher amounts of ACT, leading to more PSA-ACT complexes and fewer available fPSA molecules, ultimately resulting in higher tPSA levels. Accordingly, a tPSA level below 4 ng/mL often indicates a normal prostate gland, a tPSA concentration in the grey zone (4-10 ng/mL) requires further diagnostic evaluation, and a tPSA value above 10 ng/mL is often associated with prostate cancer. A fPSA-to-tPSA ratio of less than 15% also points to a high likelihood of having prostate cancer [6,17,20,21]. This ratio was introduced to enhance the specificity of PSA measurement for prostate cancer since high tPSA levels can also result from nonmalignant conditions, such as benign prostate hyperplasia, urinary tract infection, and prostatitis [22,23,24].
Moreover, the detection of urinary tPSA in tandem with serum tPSA and fPSA may effectively increase the specificity of the PSA screening test toward prostate cancer, thus reducing the number of falsely diagnosed cases considerably. Bolduc et al. showed that a urinary tPSA level of less than 150 ng/mL and a urinary tPSA-to-serum tPSA ratio of less than 15% are often associated with a high chance of having prostate cancer [10,25]. This preliminary study was backed up in 2023 by Höti and coworkers; they demonstrated that more aggressive, higher-grade prostate cancers result in higher serum tPSA and lower urinary tPSA levels. They showed that serum tPSA alone did not have a high predictive power for aggressive prostate cancer (area under the curve (AUC) = 0.695). This was while urinary tPSA had higher discriminatory power with an AUC of 0.741, and the combination of both exhibited improved discriminatory ability in detecting aggressive prostate cancer (AUC = 0.767) [26]. The decrease in urinary tPSA in prostate cancer may be due to the altered prostate architecture via neovascularization, leading to an increased drainage of tPSA in the bloodstream while reducing its secretion into the prostatic urethra [25].
In recent years, clinical laboratories have shifted from costly, time-consuming, technician-dependent tests to fully automated tPSA and fPSA immunoassay analyzers. Most of these highly sensitive systems are compatible with chemiluminescence immunoassays (CLIAs), including Access Hybritech (Beckman Coulter), Atellica IM (Siemens Healthineers), IMMULITE® 2000 (Siemens Healthineers), and ARCHITECT i2000SR (Abbott). Roche Diagnostics also offers Elecsys® electrochemiluminescence immunoassays (ECLIAs) for use on cobas® e immunoassay analyzers. These analyzers have improved turnaround times by enabling rapid, high-throughput screening, decreased overall operational costs by reducing technician workload, and minimized human operator errors by eliminating manual sample preparation, testing, and data interpretation. Nonetheless, a key concern that fully automated analyzers have yet to address is the significant inter-assay variability. Additionally, these analyzers are expensive, extremely bulky instruments that are suboptimal for point-of-care testing (POCT), particularly in low-resource regions, limiting equal access to disease screening [27,28,29,30,31,32,33,34,35]. The application of electrochemical biosensors in this context may help overcome these drawbacks. These ultrasensitive biosensing platforms are low-cost, rapid, and user-friendly. They operate on small sample volumes and can be easily miniaturized, making them suitable for POCT [36,37,38]. To date, a wide variety of these biosensors have been developed to accurately identify and quantify PSA [39,40,41].
Conventional working electrodes, such as glassy carbon electrodes (GCEs), Au electrodes, and Pt electrodes, are relatively expensive and cannot be single-use. On the contrary, the substantially low cost of pencil graphite electrodes (PGEs) and their abundance render them disposable, and thus, convenient for immunoassay manufacturers, lab technicians, and patients [42,43]. Since PGEs are not as electroconductive as GCEs or Au electrodes, various electrochemical and chemical pretreatment techniques have been reported as means of polishing the PGE surface and generating specific functional groups on it, thereby enhancing the electrode’s electrical conductivity [44,45,46,47]. Among these, the oxidative pretreatment of PGEs with strong oxidizing agents, such as HNO3, is a comparatively simple, low-cost method for notably elevating the conductivity and sensitivity of bare electrodes. This wet, chemical pretreatment process oxidizes the electrode surface, thereby making it hydrophilic. Additionally, sheet-like flakes are formed on this surface, increasing the PGE’s active surface area [44,48].
Recently, nanotechnology has opened new horizons for the development of highly sensitive, rapid biosensing platforms. Among the diverse pool of nanomaterials, graphene oxide (GO) is a promising candidate for modifying the working electrode surface, given its low electrical noise and high chemical adaptability. The latter feature stems from GO’s oxygen-containing functional groups, which provide active sites for functionalizing the sensing surface with organic compounds or biological structures via physical adsorption or covalent bonding. The high affinity of these groups to water molecules also allows for GO’s satisfactory water dispersion. While there is still controversy over GO’s electroactivity and its role in directly boosting the working electrode’s electroconductivity, the enriched surface area of this nanostructure significantly increases the electrode’s surface area-to-volume ratio and facilitates the effective immobilization of more capture probes on the electrode surface, ultimately amplifying the detection sensitivity of the GO-modified biosensor [49,50,51,52,53,54,55,56].
Herein, we develop disposable label-free electrochemical biosensors based on HNO3-pretreated PGEs modified with amino-functionalized GO (GO-NH2) and evaluate their performance in detecting tPSA and fPSA for prostate cancer screening. Cyclic voltammetry (CV), a rapid, easy-to-operate, ultrasensitive, and cost-effective electrochemical readout method, was employed to characterize the working electrodes during step-by-step fabrication based on the signals triggered by the [Fe(CN)6]3-/4- redox probe [57,58]. CV was also used to obtain the calibration curves and detection limits of the tPSA and fPSA biosensors. Moreover, the platforms’ specificity, reproducibility, and stability were investigated. Lastly, the performance of these immunosensors was compared to that of commercial enzyme-linked immunosorbent assay (ELISA) kits for real human serum and urine samples. Ultimately, the aim was to showcase a proof-of-concept rapid, low-cost, disposable PSA screening biosensor with the potential to improve clinical laboratory testing.
2. Materials and Methods
2.1. Chemicals and Reagents
Potassium hexacyanoferrate(III), potassium hexacyanoferrate(II) trihydrate, sodium chloride, potassium chloride, di-sodium hydrogen phosphate anhydrous, potassium dihydrogen phosphate, ethylenediamine (EDA), N,N-dimethylformamide (DMF), N,N'-dicyclohexylcarbodiimide (DCC), 25 wt.% glutaraldehyde aqueous solution, bovine serum albumin (BSA), and human thyroid-stimulating hormone (TSH) were obtained from Merck KGaA (Darmstadt, Hesse, Germany). GO with an approximate length of < 5 µm, a thickness of 0.8-1.6 nm, and 99% purity was purchased from United Nanotech Innovations Pvt. Ltd. (Bengaluru Rural District, Karnataka, India). Human tPSA and fPSA ELISA kits, a PSA-free human urine specimen, and tPSA-containing human serum samples were obtained from Padtan Gostar Isar Co. (PGI, Tehran, Iran). The purchased human urine and serum specimens were de-identified and contained no personal identifiers or links to the original patients. The vendor provided them for research purposes only under a Material Transfer Agreement. Mouse anti-human tPSA (clone 8312) and fPSA (clone 8313) monoclonal antibodies were purchased from Medix Biochemica (Espoo, Finland). Human tPSA and fPSA antigens were obtained from BiosPacific, Inc. (Emeryville, California, United States). All other reagents were of analytical grade and used without further purification. Deionized (DI) water was employed throughout all experimental studies.
2.2. Electrochemical Instrumentation and Measurement
An Autolab PGSTAT302N potentiostat/galvanostat (Metrohm AG, Herisau, Switzerland), controlled by the Autolab NOVA 2.1.4 software (Metrohm AG, Herisau, Switzerland), was utilized to conduct the electrochemical measurements. A conventional three-electrode configuration containing a pencil graphite working electrode, an Ag/AgCl reference electrode (Metrohm AG, Herisau, Switzerland), and a Pt wire counter or auxiliary electrode (Azar Electrode Co., Urmia, Iran) was used for all these assessments. The PGE was an HB-grade pencil lead with a 2-mm diameter (Parsikar, Rasht, Iran). Cyclic voltammograms were recorded in a 10 mM phosphate-buffered saline (PBS, pH 7.4) solution containing 2 mM [Fe(CN)6]3-/4- (1:1) as the redox probe. CV was carried out over a potential range of −0.6 to +0.6 V at a scan rate of 50 mV/s; for each measurement, the second cycle was used as the reproducible voltammogram under steady-state conditions.
2.3. Amino-Functionalization of GO
GO-NH2 nanoparticles were prepared according to the method proposed by Li and colleagues, with minor modifications [59]. Details of this synthesis are available in Appendix A.1.
2.4. Oxidative Pretreatment of Bare PGE
The PGEs were oxidatively pretreated with HNO3 according to the technique reported by Keskin and Ertürk, with slight modifications [44]. Briefly, 2.8 cm-long pencil leads were placed individually in 2-mL microcentrifuge tubes, followed by the addition of HNO3 65%. The leads were oxidized by boiling HNO3 at 115 °C for 90 minutes. Afterward, they were washed several times with DI water until the wastewater reached a pH of 5.5-6. Each HNO3-pretreated lead was inserted into a pipette tip-based electrode holder and dried by purging with nitrogen at room temperature (RT). As shown in Figure 1 and Figure 1.5 cm of each pencil lead protruded from the holder; 0.9 cm of this length interacted with the electrolyte solution during the electrochemical measurements, while the remaining 0.6 cm was coated with a nitrocellulose layer. The oxidatively pretreated PGEs were stored in a desiccator at RT until further use to prevent exposure to moisture.
2.5. Fabrication of the Biosensing Platforms
To modify the oxidatively pretreated PGEs with GO-NH2, a 1 mg/mL dispersion of these nanoparticles in DI water was prepared using an ultrasonic bath for 1 hour at RT. The electrodes were then incubated in the resulting dispersion for 1 hour at RT, followed by drying at RT for 20 minutes [60]. A 2.5% (v/v) glutaraldehyde solution in DI water was used as the crosslinking agent to covalently bind the GO-NH2 nanoparticles present on the surface of the modified PGEs to the anti-PSA antibodies. This crosslinking mechanism involved two Schiff base formation reactions: one between one of the two aldehyde groups of glutaraldehyde and a primary amino group of GO-NH2, and the other between the crosslinker’s other aldehyde group and the antibody’s primary amino group, producing two imine functional groups that ultimately bridged GO-NH2 particles to the antibodies [61,62,63,64,65]. The electrodes were incubated in this solution for 2 hours at RT, then rinsed with DI water and dried at RT. Afterward, the modified PGEs were incubated in a 10 mM PBS (pH 7.4) solution containing 10 µg/mL of mouse anti-human tPSA or fPSA monoclonal antibodies for 30 minutes at 4 °C to assemble the tPSA or fPSA biosensing platforms, respectively. The antibody-immobilized electrodes were then washed 3 times with 10 mM PBS (pH 7.4) to remove any unbound or loosely bound antibodies from the working electrodes’ surface. Subsequently, the biosensors were incubated in 1% (w/v) BSA in 10 mM PBS (pH 7.4) for 1 hour at RT to block the remaining active binding sites [66,67]. After washing the PGEs 3 times with 10 mM PBS (pH 7.4) to remove unbound or loosely bound BSA molecules, they were dried under nitrogen and stored at 4 °C until further use.
2.6. PSA Detection
The tPSA or fPSA biosensors were incubated with 400 µL of various PSA-containing samples at 37 °C for 30 or 45 minutes, respectively. The samples were either standard antigen solutions in 10 mM PBS (pH 7.4) or real human specimens. The electrodes were then washed 3 times with 10 mM PBS (pH 7.4) to remove unbound or loosely bound antigens. Eventually, the immunosensors were dried with nitrogen gas and were ready for CV measurements. The analyte concentration of each sample was quantified using 3 individual biosensors (technical replicates; n = 3). Figure 1 illustrates a schematic overview of the fPSA or tPSA biosensing platform fabrication steps and its application in PSA detection and early prostate cancer diagnosis.
2.7. Statistical Analysis
Statistical analyses were conducted in Python version 3.11.9 using the scipy.stats module. Post-hoc testing was also performed to assess significance at α = 0.05. Python scripts are available upon reasonable request.
3. Results
3.1. Structural Characterization of GO-NH2
The transmittance Fourier transform infrared (FTIR) spectra of GO and GO-NH2 nanoparticles provided valuable information regarding the successful covalent functionalization of GO with amino groups (Figure 2A). Accordingly, we confirmed the presence of the following oxygen-containing groups in GO by identifying their characteristic downward transmittance valleys, which correspond to absorption peaks and represent wave numbers or light frequencies at which bonds of interest absorb IR light [68]. The stretching vibrations of the carboxyl groups’ O–H and C=O were observed at 3423 cm-1 and 1712 cm-1, respectively. The C=C bonds in the aromatic rings showed a peak at 1620 cm-1 due to their stretching vibrations. The carboxyl and hydroxyl groups’ O–H exhibited a peak at 1458 cm-1 corresponding to bending vibrations. The stretching vibrations of C–O in ester and hydroxyl groups, as well as in ether functional groups, were observed at 1263 cm-1 and 1037 cm-1, respectively. Similarly, we corroborated the efficient synthesis of GO-NH2 by observing the following characteristic transmittance valleys/absorption peaks. Interestingly, the newly formed amide groups’ C=O and C–N exhibited peaks at 1654 cm-1 and 1385 cm-1, respectively, corresponding to their stretching vibrations. Additionally, the bending vibrations of the primary amino group’s N–H were identified at 1568 cm-1, further proving the presence of amino groups on GO-NH2. Of note, the stretching vibrations of the carboxyl groups’ O–H at 3423 cm-1 demonstrated lower transmittance resolution compared to those in GO, confirming that GO’s carboxyl functional groups reacted with EDA to generate new amide bonds on the surface of GO.
3.2. Structural and Electrochemical Characterization of the Working Electrodes
Figure 2B demonstrates the FTIR spectra of powders obtained from the surface of a bare PGE and an oxidatively pretreated PGE. The analysis showed that the bare PGE surface contained trace amounts of oxygen-containing functional groups, a feature common in pencil leads [69]. However, the presence of these functional groups was notably higher in the HNO3-pretreated PGE, as its carboxyl and hydroxyl groups’ O–H exhibited higher-intensity stretching vibrations at 3411 cm-1. The observed bending vibrations of this bond at 1417 cm-1, as well as the stretching vibrations of the ketone’s C=O at 1636 cm-1 and the ether’s C–O at 1053 cm-1 in the oxidized PGE, further confirmed the successful oxidative pretreatment of the PGE surface. Additionally, the stretching vibrations of C=C at 1615 cm-1 were significantly stronger in the acid-pretreated PGE due to the oxygenation of the PGE surface and its resulting reduction in sp3-hybridized carbon content. Similarly, the C=C bonds on the oxidized PGE surface exhibited a transmittance valley or an absorption peak at 832 cm-1, due to stronger bending vibrations. The appearance of these transmittance valleys confirmed the enhanced presence of oxygen-containing functional groups on the surface of the HNO3-pretreated PGE.
The morphology of the working electrodes’ surface was investigated using scanning electron microscopy (SEM). The electrode surface was first coated with a < 20 nm layer of platinum to prevent electrical charging. SEM was then performed at an accelerating voltage of 15 kV. Figure 3 displays SEM images of bare PGE, HNO3-pretreated PGE, and GO-NH2/HNO3-pretreated PGE. According to these images, the bare PGE had a smooth, uniform surface even at the 200-nm scale (Figure 3A-3C). In contrast, the oxidatively pretreated PGE surface exhibited higher roughness, likely due to the oxidizing properties of boiling HNO3 (Figure 3D-3F). This enhanced roughness resulted in sheet-like structures, increasing the electrode’s active surface area, which, in turn, enabled the amplified entrapment of GO-NH2 nanoparticles in the newly formed flakes. Figure 3G-3I demonstrate the accumulation of these nanoparticles on the surface of the HNO3-pretreated PGE.
Figure 4 illustrates the cyclic voltammograms obtained during the step-by-step fabrication of the biosensors. As shown in Figure 4A and 4B, the oxidatively pretreated PGE exhibited a mean peak current of 443.65 ± 49.88 µA (n = 5), which was statistically significantly higher than that of bare PGE (99.15 ± 12.12 µA, n = 5, p < 0.001). This increased electrical conductivity may be due to acid-induced oxidation, which formed oxygen-containing groups on the electrode surface, making it hydrophilic. Modifying the bare PGE with GO-NH2 nanoparticles in the absence of HNO3 pretreatment not only failed to yield a notably more electroconductive working electrode but also slightly reduced its conductivity (97.45 ± 4.95, n = 4). This observation provided evidence supporting the hypothesis that GO, by itself, is not a suitable conductive material because its oxygen-containing groups disrupt the sp2 network, rendering GO an electrical insulator rather than a conductor [70]. In contrast, GO-NH2 modification of HNO3-pretreated PGE resulted in the highest peak current (956.60 ± 75.71, n = 5). Although GO-NH2 nanoparticles did not directly increase electroconductivity, combining them with acid pretreatment produced a synergistic effect, resulting in a statistically significant improvement in conductivity and sensitivity compared with bare PGE (p < 0.0001). All values reported are mean ± standard deviation (SD).
As demonstrated in Figure 4C and 4D, the immobilization of anti-tPSA and fPSA antibodies decreased the mean peak current for the tPSA and fPSA immunosensors, respectively. These molecules, which were covalently attached to the electrodes via glutaraldehyde, covered the electrodes’ surface and, hence, restricted the electrolyte diffusion to the surface. Moreover, because most of the activated amino groups of GO-NH2 reacted with antibody amino groups, adding BSA to block the remaining active sites did not significantly change the biosensors’ conductivity. However, in the presence of antigens, the mean peak current for both the tPSA and fPSA immunoassays decreased considerably, which could be attributed to the formation of antibody-antigen complexes on the working electrode surface, subsequently creating a resistive layer that impedes charge transfer to the electrodes.
3.3. Optimization of Experimental Conditions
To determine the optimal antibody immobilization time, the modified PGEs were incubated with antibody solutions for 15, 30, 45, and 60 minutes. For both the tPSA and fPSA biosensors, as the immobilization time increased, the mean peak current from CV assessments decreased until it plateaued at 30 minutes. After this point, there was no statistically significant change in the mean peak currents for both sensors (p > 0.05; Supplementary Figure S1A and S1B). Hence, an optimized antibody immobilization time of 30 minutes was chosen for both the tPSA and fPSA immunosensors. Given the high antibody concentration (10 µg/mL), it was expected that the optimal time would be achieved within the first half of the 1-hour period.
Optimized antibody-antigen reaction times (i.e., sample incubation periods) were determined by incubating the tPSA and fPSA immunoassays with 100 ng/mL of tPSA and 50 ng/mL of fPSA, respectively, for 15, 30, 45, and 60 minutes. According to Supplementary Figure S1C, as the tPSA antibody-antigen recognition time increased, the mean peak current lessened until reaching a plateau at 30 minutes. Incubation beyond this period did not yield a statistically significant decrease in mean peak currents (p > 0.05); therefore, 30 minutes was selected as the sample incubation time for the tPSA platform. For the fPSA biosensor, as the antigen incubation time increased, the mean peak current decreased until reaching a plateau at 45 minutes; there was no statistically significant reduction in peak current at 60 minutes (p > 0.05; Supplementary Figure S1D). While the mean peak current after the 30-minute and 45-minute incubations was statistically comparable, the 45-minute incubation yielded a lower mean peak current, closely resembling that of the 60-minute incubation. Consequently, 45 minutes was determined to be the optimal time for antigen recognition by the fPSA immunosensor.
3.4. Analytical Performance of the Biosensors
The analytical performance of the developed tPSA and fPSA immunoassays was examined under optimized conditions and using the CV electrochemical readout method. The tPSA biosensor’s calibration curve was obtained by incubating it with 0.01, 0.1, 1, 10, 100, and 1000 ng/mL of tPSA standard solutions (Figure 5A and 5B). This immunosensor showed a linear response over the 0.01-1000 ng/mL range, with a coefficient of determination (R2) of 0.9542. Additionally, the calibration curve of the fPSA biosensor was obtained by incubating it with 0.1, 1, 10, 50, 100, and 1000 ng/mL of fPSA standard solutions (Figure 5C and 5D). This immunoassay had a linear range of 0.1-1000 ng/mL with an R2 of 0.9842.
The limit of detection (LOD) of these biosensors was determined according to the method proposed by Armbruster and Pry, based on the Clinical and Laboratory Standards Institute EP17 guideline: Protocols for Determining LODs and Limits of Quantitation (Eq. 1) [71]:
where blank denotes a sample with 0 ng/mL of PSA and low-concentration sample denotes the sample with the lowest PSA concentration.
LOD = mean blank + 1.645 × SD blank + 1.645 × SD low-concentration sample
At a 95% confidence level, the tPSA and fPSA biosensing platforms had LODs of 0.648 pg/mL and 0.07 pg/mL, respectively. The high sensitivity of the immunosensors may be attributed to the chemical pretreatment and the subsequent nanostructure modification of the working electrodes.
3.5. Selectivity, Reproducibility, and Stability of the Immunosensors
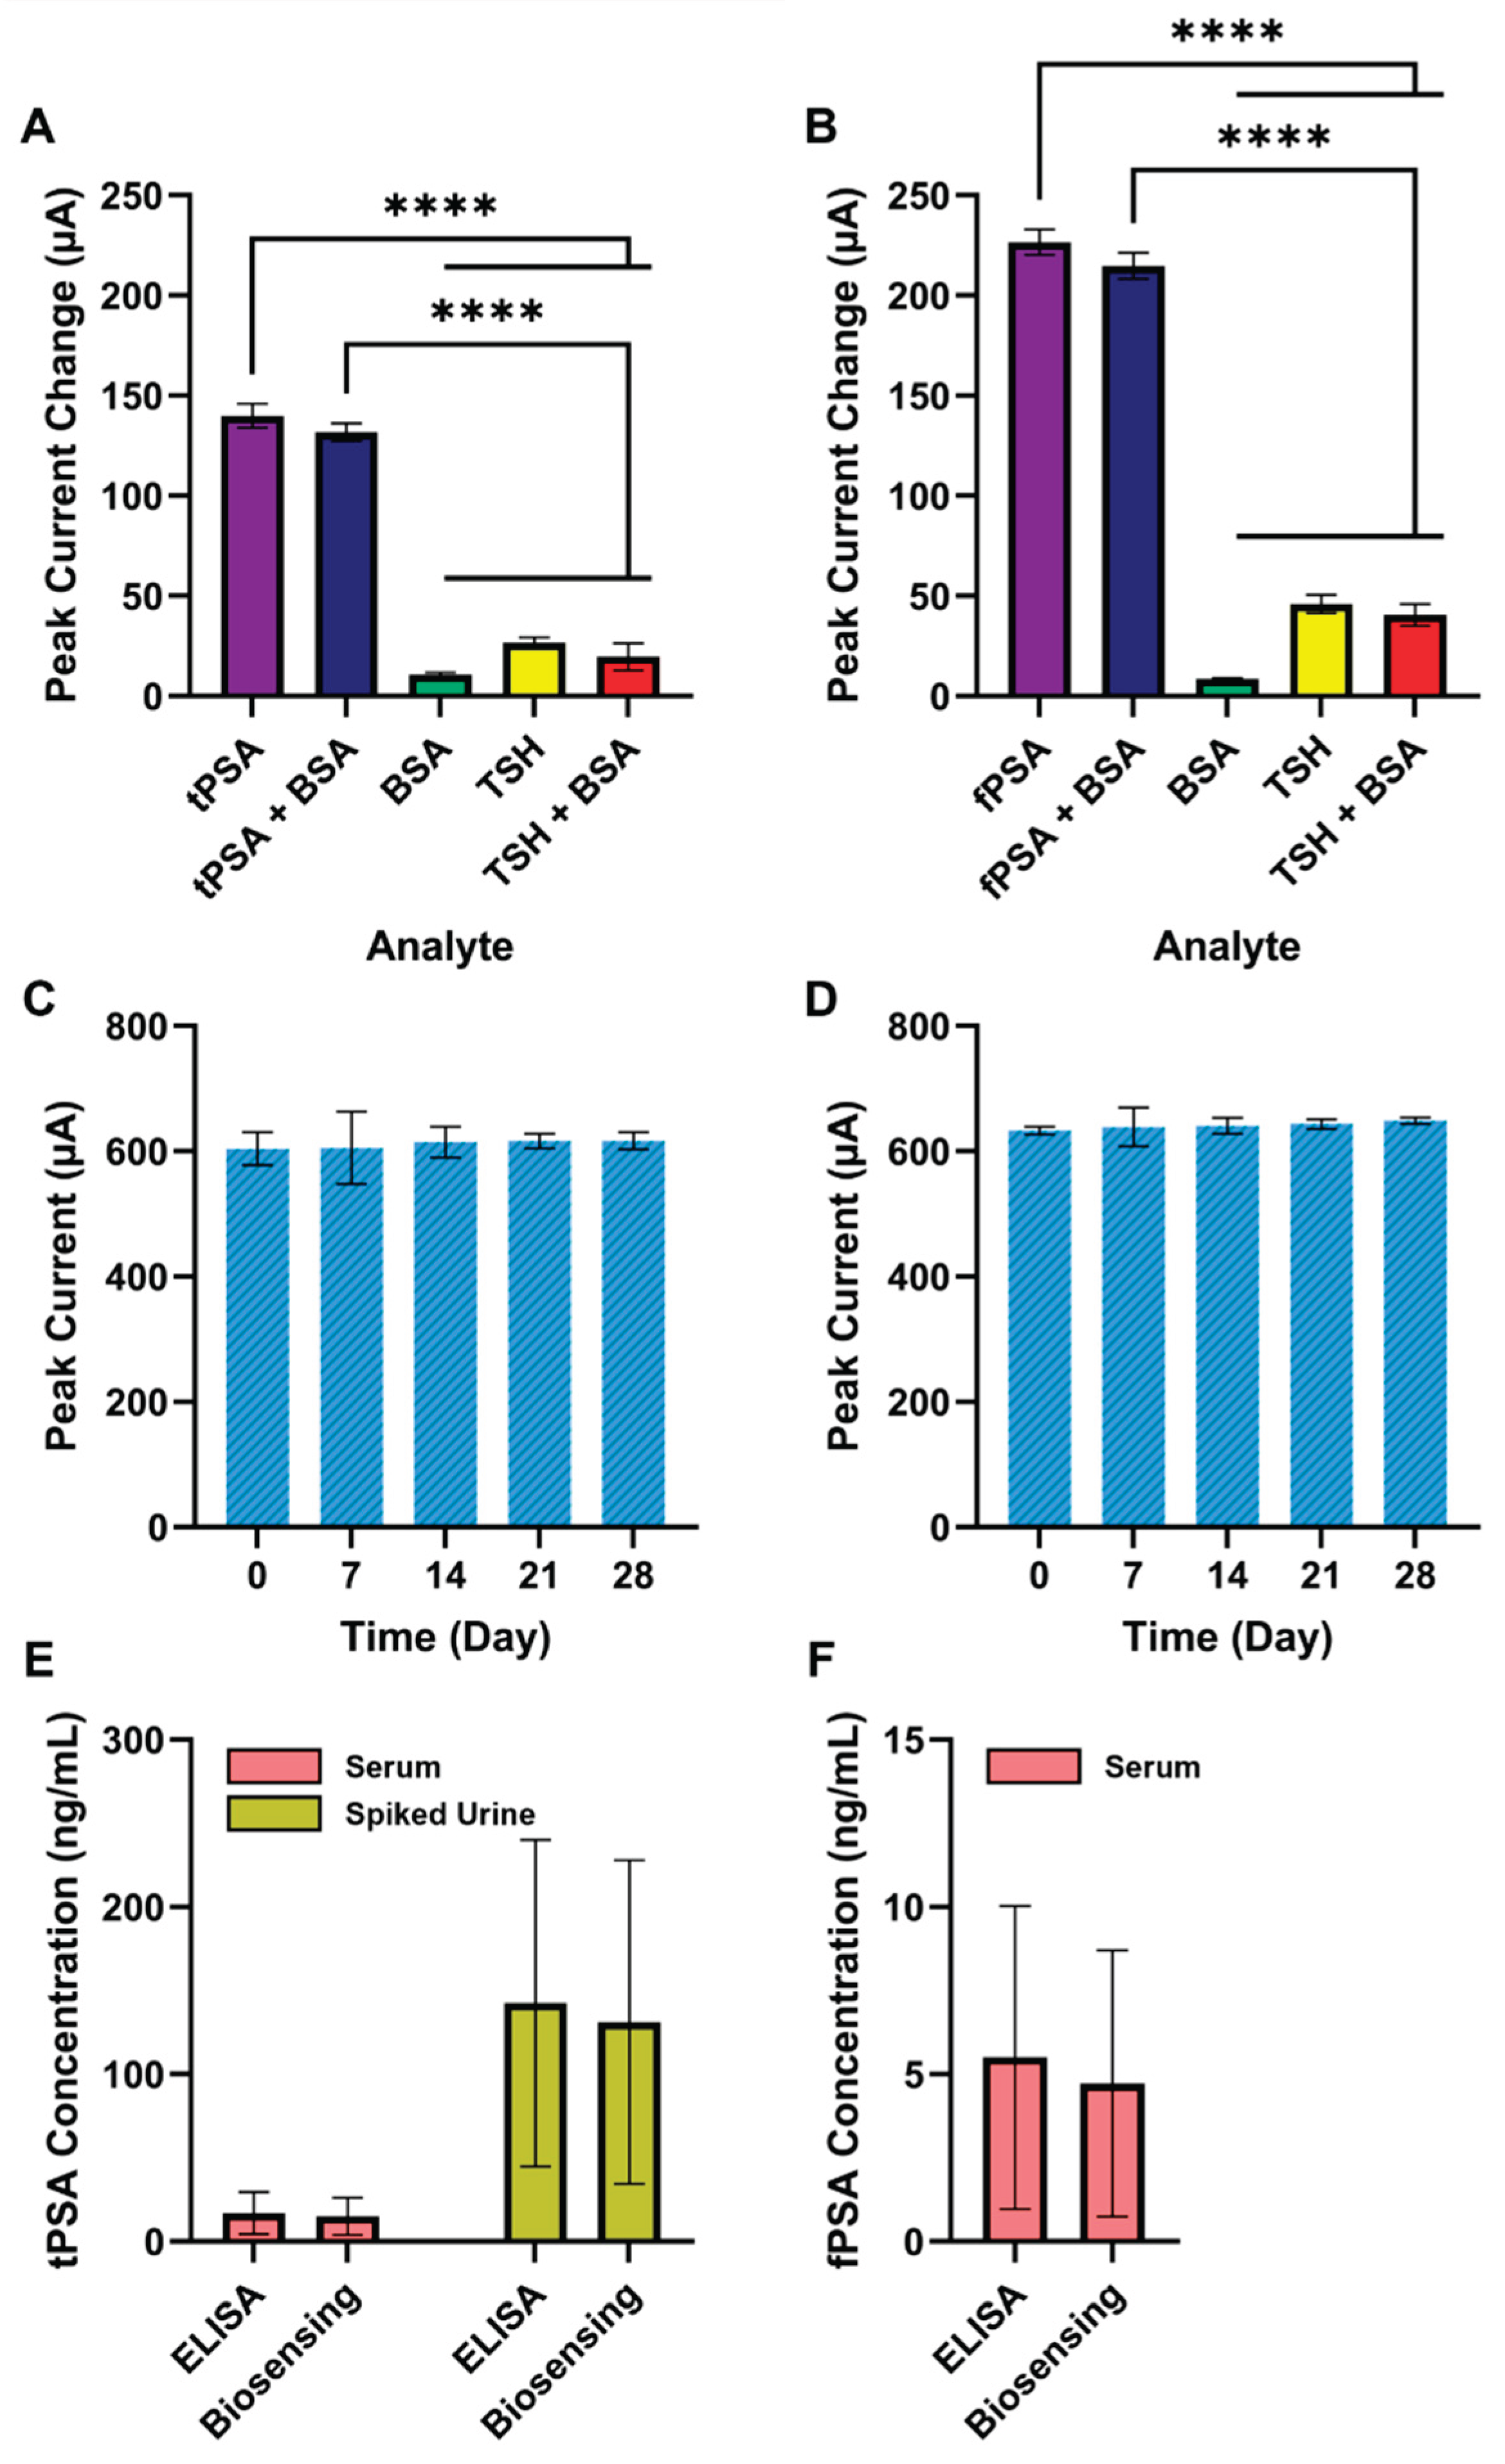
To investigate the specificity of the developed biosensors to PSA, the CV response of the tPSA immunosensor was assessed in the presence of 100 ng/mL tPSA, 50 ng/mL TSH, 2% (w/v) BSA, 100 ng/mL tPSA with 1% BSA, and 10 ng/mL TSH with 1% BSA. Similarly, the selectivity of the fPSA biosensor was assessed by measuring its CV response to 50 ng/mL fPSA, 50 ng/mL TSH, 2% BSA, 50 ng/mL fPSA with 1% BSA, and 10 ng/mL TSH with 1% BSA. As demonstrated in Figure 6A and 6B, in the presence of interfering molecules such as BSA, TSH, or a mixture of both, the mean peak current change was negligible compared with that observed when pure PSA or a PSA + BSA mixture was used as the analyte (p < 0.0001), underscoring the specificity of our biosensors to PSA.
The biosensors’ reproducibility was evaluated using 5 tPSA and 5 fPSA immunosensors prepared under the same conditions. These tPSA and fPSA biosensing platforms were incubated with 100 ng/mL tPSA and 50 ng/mL fPSA solutions, respectively. Supplementary Figure S2 illustrates the peak currents obtained from CV analysis for these immunoassays. The relative standard deviations of the peak currents were ±2.40% and ±1.54% for the tPSA and fPSA biosensors, respectively, demonstrating the immunosensors’ high reproducibility and precision.
The stability of the developed biosensors was assessed by measuring the immunosensors’ CV response at 7-day intervals over 28 days; the platforms were stored at 4 °C until use. For each weekly assessment, the tPSA and fPSA detection assays were incubated with 100 ng/mL tPSA and 50 ng/mL fPSA solutions, respectively. According to Figure 6C and 6D, the tPSA and fPSA assays exhibited only 2.09% and 2.56% changes in mean peak current from day 0 to day 28, respectively, which were not statistically significant (p > 0.05), highlighting the biosensors’ stability over this study period.
3.6. Validation of the Biosensors with Commercial ELISA Kits
The performance accuracy of the designed biosensors was validated using commercial ELISA kits and de-identified, real samples. The commercial kits were sandwich ELISAs; they took roughly 90 minutes to complete and used horseradish peroxidase-labeled detector antibodies, 3,3′,5,5′-tetramethylbenzidine colorimetric substrate, and 1 N sulfuric acid stop solution. Three serum specimens with unknown PSA levels and a urine sample spiked with 40, 150, and 250 ng/mL tPSA were used in this study. Figure 6E and 6F compare PSA levels measured by ELISA and biosensing. As shown in Figure 6E, there were no statistically significant differences in tPSA levels measured by both methods for serum and spiked urine samples (p > 0.05). Similarly, serum fPSA levels quantified by ELISA and biosensing were statistically comparable (p > 0.05; Figure 6F). These validation tests highlighted the agreement between the overall distribution of concentrations measured by the two methods.
4. Discussion
In this work, a proof-of-concept label-free electrochemical immunoassay was developed as a simple, rapid, and inexpensive means for PSA screening and early detection of prostate cancer. The disposable tPSA and fPSA biosensors were based on oxidatively pretreated PGEs modified with amino-functionalized GO. To ensure successful amide bond formation on the surface of GO via reaction with EDA, DCC was used as an activating agent. This coupling agent reacts with the carboxyl groups of GO, creating favorable leaving groups that the amino groups of EDA ultimately replace after nucleophilic attacks, thereby forming amide functional groups (Figure 2A). In the absence of DCC, however, the basic amino groups deprotonate the carboxyl groups, converting them into extremely unreactive carboxylate salts; thus, making the amide bond generation entirely impossible [72].
The oxidative pretreatment of the PGE surface was successfully confirmed by FTIR analysis (Figure 2B), in which we compared the FTIR spectra of powders obtained from the surface of a bare PGE and an HNO3-pretreated PGE. We demonstrated that the latter had more oxygen-containing functional groups, making the working electrode more hydrophilic and, in turn, more electroconductive. We further characterized the structural features of the HNO3-pretreated PGE using SEM and showed that boiling in HNO3 increased PGE surface roughness, forming sheet-like structures that provided better anchoring and immobilization of the GO-NH2 nanoparticles (Figure 3). The oxidation-induced hydrophilicity, the increased active surface area, and the improved GO-NH2 immobilization all contributed to the GO-NH2/HNO3-pretreated PGE having the highest electroconductivity (Figure 4A and 4B).
The developed label-free biosensing platforms operated based on the electrical current induced by the rapid, efficient transfer of electrons lost or gained during the reversible redox reaction involving [Fe(CN)6]3-/4- at the electrode-electrolyte interface. The larger this interface, the lower the resistance to electron transfer, resulting in a higher CV peak current. As anticipated, the greater the accumulation of antibodies and antigens on the electrode surface, the greater the reduction in charge-transfer area and the hindrance to electron transfer, resulting in smaller peak currents (Figure 4C and 4D). Based on this principle, we also optimized the antibody immobilization and antibody-antigen reaction times by identifying the incubation periods that led to antibody and antigen saturation on the electrode surface, respectively (Supplementary Figure S1).
The biosensors measured tPSA levels in serum and urine samples and fPSA levels in serum specimens. These three outputs made the screening test more specific to prostate cancer, providing more reliable results for treatment decision-making [10,25,26]. Under optimized conditions and using the CV electrochemical readout method, the 30-minute tPSA biosensor exhibited a linear range of 0.01-1000 ng/mL and an LOD of 0.648 pg/mL. Also, a linear range of 0.1-1000 ng/mL and an LOD of 0.07 pg/mL were observed for the 45-minute fPSA immunosensor (Figure 5). The biosensors’ wide dynamic ranges eliminate the need to dilute serum samples, often necessary for prostate cancer specimens because of their significantly elevated tPSA levels, thereby reducing errors by lab technicians during this process. Additionally, the immunosensors showed a low tendency to non-specifically bind to other biomolecules, whereas, owing to antibody-antigen recognition events on the working electrodes’ surface, these assays exhibited high selectivity for PSA detection (Figure 6A and 6B). They also demonstrated satisfactory reproducibility (Supplementary Figure S2) and stability over 28 days (Figure 6C and 6D). The latter may be attributed to the covalent crosslinking of capture antibodies to GO-NH2 nanoparticles, to stable physical adsorption of the nanoparticles onto HNO3-pretreated PGEs, and to storage at 4 °C under dry conditions.
We further validated the performance of our tPSA and fPSA biosensors with commercial sandwich ELISAs. The validation tests demonstrated that the biosensors were highly selective for PSA, yielding measurements that matched those of the commercial ELISA kits while being more affordable and rapid (Figure 6E and 6F). These results highlight the proposed biosensors’ high sensitivity and potential for clinical diagnosis, particularly for POCT in high-risk cohorts.
Supplementary Table S1 compares the immunosensors presented in this article with several previously reported electrochemical PSA biosensing platforms. As shown in this Table, most PSA biosensors targeted tPSA; however, in this work, two platforms, one specific to tPSA and the other targeting fPSA, were developed to enhance specificity toward prostate cancer. Furthermore, the majority of the studies used GCEs, Au, or screen-printed electrodes (SPEs) as the working electrodes [73,74,75,76,77,78,79]. Given their high cost, GCEs and Au electrodes cannot be single-use; they require surface polishing to remove adsorbed material for reuse, which adds labor and time and can cause cross-contamination if not cleaned properly. SPEs, although disposable and readily available with similar performance to PGEs, are more costly and time-consuming to prepare, ultimately making PGEs a better-suited candidate for reliable, cost-effective clinical biomarker detection and quantification [42]. Therefore, we selected low-cost, disposable PGEs as the working electrodes of our electrochemical immunoassays.
Moreover, many of these biosensors used complex nanostructures to modify the working electrode surface or create detection labels, making fabrication laborious, costly, and unsuitable for real-world clinical applications [74,75,79,80,81]. Among the reported articles, only Vural et al.’s work involved using PGEs as working electrodes; however, the authors developed a label-based tPSA biosensor with an approximate assay time of 2 hours. Additionally, the working electrode surface was modified with Au nanoparticles and peptide nanotubes, increasing assay cost and complexity and making clinical implementation challenging [81]. On the contrary, our sensors were designed based on inexpensive electrode surface modifications and the label-free detection strategy, significantly reducing the time and cost of fabrication and assay duration. By employing simple methods to enhance electroconductivity and sensitivity, our developed platforms achieved low LODs and exhibited wide linear ranges, even broader than those reported for most sensors in Supplementary Table S1.
Despite the advantages of our biosensors, we acknowledge multiple limitations in our study that warrant further extensive research. First, although PGE surface modification with combined acid pretreatment and GO-NH2 nanoparticles significantly increased the electrode’s conductivity, modification with the particles alone did not perform as initially expected; the particles did not enhance electroconductivity but instead increased charge-transfer resistance (Figure 4A and 4B). Exploring other carbon-based nanomaterials, including carbon nanotubes or reduced GO, and combining them with the pretreatment may significantly improve the sensitivity of the working electrodes, thereby contributing to higher reproducibility and shelf-life stability [70,82,83]. These improvements will substantially benefit biomarkers present at extremely low levels, not solely PSA. This brings us to the second limitation. Due to resource constraints, no electrochemical impedance spectroscopy (EIS) measurements were performed during characterization of the working electrode surface modifications. Future work should include comprehensive EIS studies to better identify promising surface modifiers that enhance charge transfer in PGEs.
Third, a wider range of interfering molecules, such as other serine proteases, should be tested with the developed electrochemical PSA biosensors to ensure their exclusivity for PSA. Fourth, we tested our platforms using a limited number of real human samples. Further clinical testing with a larger sample size is needed to better assess the clinical sensitivity and specificity of our biosensors. Fifth, this study used an expensive benchtop potentiostat for CV measurements. To bring our assays one step closer to true POCT, we will explore portable, miniature potentiostats that deliver performance comparable to benchtop units yet are less bulky and less costly [84]. One last consideration, rather than limitation, is that current fully automated immunoassay analyzers, though rapid, sensitive, and technician-independent, exhibit high inter-assay variability. This means that PSA measurements can differ within a patient based on the manufacturer's assay and analyzer used, highlighting the need to calibrate traditional PSA reference thresholds for each system, a task not currently performed in clinical settings [34,85]. To maintain consistency, La Civita et al. recommended using the same assay-analyzer combination for each patient, along with assay-specific cut-offs. This approach helps accurately track changes over time and prevents measurement system differences from skewing the results [31]. Ferraro and coworkers, together with Kavsak and Hotte, emphasized this strategy to standardize PSA measurements, reduce inconsistencies among clinical immunoassay analyzers, and ensure accurate medical diagnoses [86,87]. Therefore, to make the adoption of electrochemical sensing worthwhile, the working electrodes must be validated against the most common clinical immunoassay analyzers to ensure that their results agree with those of these analyzers.
Future work involves addressing the above-mentioned limitations, including exploring other carbon-based nanomaterials and their combination with the chemical pretreatment technique, conducting extensive EIS studies to better characterize working electrode surface modification, testing a larger number of real human samples for evaluating the assays’ clinical performance, and validating our biosensors with some of the most common fully automated analyzers and assays to ensure that we are minimizing inter-assay variability. Additionally, we will investigate the use of miniature potentiostats for POCT and explore multiplexing our biosensors with more novel prostate cancer-associated biomarkers, such as tPSA in extracellular vesicles and its ratio to serum tPSA or urinary Prostate Cancer Antigen 3 mRNA, to provide an even more sensitive and specific diagnostic platform for early detection of prostate cancer [88,89,90,91].
5. Conclusions
In this work, we developed proof-of-concept, label-free electrochemical immunosensors for rapid and cost-effective detection of tPSA and fPSA using GO-NH2-modified, HNO₃-pretreated PGEs. The combined surface modification enhanced electrode hydrophilicity, roughness, electroconductivity, and biomolecule immobilization, enabling sensitive PSA detection by CV. Under optimized conditions, the tPSA and fPSA biosensors demonstrated wide dynamic ranges, low LODs, high selectivity, satisfactory reproducibility, and stability for up to 28 days, while measurements obtained from human serum and urine samples showed good agreement with commercial ELISAs. The use of inexpensive, disposable PGEs, straightforward surface modification, and a label-free detection strategy further reduced assay complexity, fabrication cost, and sensing turnaround time compared with many previously reported electrochemical PSA sensors. Collectively, these findings provide early evidence supporting the feasibility of this platform as a potential POCT approach for PSA screening. Future studies should focus on large-scale clinical validation, expanded interference testing, comprehensive EIS characterization, evaluation of alternative nanomaterials, integration with portable potentiostats, comparison with commonly used automated clinical immunoassay systems, and multiplexing with additional prostate cancer biomarkers to further improve diagnostic sensitivity, specificity, and clinical utility.
Supplementary Materials
The following supporting information can be downloaded at the website of this paper posted on Preprints.org. The following supporting information is provided in the Supplementary Materials document: Figure S1. Optimization of experimental conditions, Figure S2. Reproducibility of the (A) five tPSA and (B) five fPSA biosensors, and Table S1. Comparison of the developed immunosensors with several previously reported electrochemical PSA biosensing platforms.
Author Contributions
Conceptualization, S.D., E.S., M.J.A., and M.A.S.; Methodology, S.D. and E.S.; Validation, S.D.; Formal Analysis, S.D.; Investigation, S.D.; Resources, S.D., E.S., and M.J.A.; Data Curation, S.D.; Writing—Original Draft Preparation, S.D.; Writing—Review and Editing, S.D., E.S., M.J.A., and M.A.S.; Visualization, S.D.; Supervision, M.J.A.; Project Administration, S.D. and M.J.A. All authors have read and agreed to the version of the manuscript being submitted for publication.
Funding
This research received no external funding.
Institutional Review Board Statement
The de-identified human urine (n = 1) and serum (n = 3) specimens were purchased from PGI under a Material Transfer Agreement for research use only. The samples contained no personal identifiers or links to the original patients. Hence, ethical review and approval were waived for this study.
Informed Consent Statement
The de-identified specimens were purchased from the vendor, PGI, and studied under a Material Transfer Agreement for research purposes only. PGI had already obtained informed consent from non-identifiable participants involved in sample collection. Therefore, this statement is not applicable to the current work.
Data Availability Statement
The raw data supporting the findings of this article will be made available by the authors upon reasonable request.
Conflicts of Interest
The authors declare that they have no known competing financial interests or personal relationships that could have influenced the work reported in this article.
Abbreviations
The following abbreviations are used in this manuscript:
| AUC | Area under the curve |
| BSA | Bovine serum albumin |
| CLIA | Chemiluminescence immunoassay |
| CV | Cyclic voltammetry |
| DCC | N,N'-dicyclohexylcarbodiimide |
| DI | Deionized |
| DMF | N,N-dimethylformamide |
| ECLIA | Electrochemiluminescence immunoassay |
| EDA | Ethylenediamine |
| EIS | Electrochemical impedance spectroscopy |
| ELISA | Enzyme-linked immunosorbent assay |
| fPSA | Free prostate-specific antigen |
| FTIR | Fourier transform infrared |
| GCE | Glassy carbon electrode |
| GO | Graphene oxide |
| GO-NH2 | Amino-functionalized graphene oxide |
| LOD | Limit of detection |
| PBS | Phosphate-buffered saline |
| PGE | Pencil graphite electrode |
| PGI | Padtan Gostar Isar Co. |
| POCT | Point-of-care testing |
| PSA | Prostate-specific antigen |
| PSA-ACT | Prostate-specific antigen-α1-antichymotrypsin complex |
| R2 | Coefficient of determination |
| RT | Room temperature |
| SD | Standard deviation |
| SEM | Scanning electron microscopy |
| SPE | Screen-printed electrode |
| tPSA | Total prostate-specific antigen |
| TSH | Thyroid-stimulating hormone |
Appendix A
Appendix A.1. Detailed Experimental Procedure for Amino-Functionalization of GO
80 mg of GO was dispersed in 16 mL of DMF using an ultrasonic bath for 30 minutes at RT to obtain a homogeneous solution. Subsequently, 16 mL of EDA, 80 mg of DCC, and 20 mL of DMF were added to this dispersion, and the resulting mixture was stirred for 4 days at RT under mild magnetic stirring conditions. The product was then washed several times with DMF and ethanol 96% to remove the excess EDA and DCC, as well as the by-product of DCC [59]. Afterward, the precipitate was dried under vacuum at 55 °C for 24 hours to obtain amino-functionalized GO nanoparticles in powdered form.
References
- Bray, F.; Ferlay, J.; Soerjomataram, I.; Siegel, R.; Torre, L.A.; Jemal, A. Global Cancer Statistics 2018: GLOBOCAN Estimates of Incidence and Mortality Worldwide for 36 Cancers in 185 Countries. CA Cancer J. Clin. 2018, 68, 394–424. [Google Scholar] [CrossRef] [PubMed]
- Culp, M.B.; Soerjomataram, I.; Efstathiou, J.A.; Bray, F.; Jemal, A. Recent Global Patterns in Prostate Cancer Incidence and Mortality Rates. Eur. Urol. 2020, 77, 38–52. [Google Scholar] [CrossRef] [PubMed]
- Rawla, P. Epidemiology of Prostate Cancer. World J. Oncol. 2019, 10, 63–89. [Google Scholar] [CrossRef] [PubMed]
- American Cancer Society Global Cancer Facts & Figures 5th Edition; American Cancer Society: Atlanta, 2024.
- American Cancer Society Cancer Facts & Figures 2024; American Cancer Society: Atlanta, 2024.
- Catalona, W.J. Prostate Cancer Screening. Med. Clin. 2018, 102, 199–214. [Google Scholar] [CrossRef] [PubMed]
- Hoffman, R.M. Screening for Prostate Cancer. N. Engl. J. Med. 2011, 365, 2013–2019. [Google Scholar] [CrossRef] [PubMed]
- Kasivisvanathan, V.; Rannikko, A.S.; Borghi, M.; Panebianco, V.; Mynderse, L.A.; Vaarala, M.H.; Briganti, A.; Budäus, L.; Hellawell, G.; Hindley, R.G.; et al. MRI-Targeted or Standard Biopsy for Prostate-Cancer Diagnosis. N. Engl. J. Med. 2018, 378, 1767–1777. [Google Scholar] [CrossRef] [PubMed]
- Sarkar, S.; Das, S. A Review of Imaging Methods for Prostate Cancer Detection. Biomed. Eng. Comput. Biol. 2016, 7, 1–15. [Google Scholar] [CrossRef]
- Tewari, A. Prostate Cancer: A Comprehensive Perspective; Springer: London, 2013. [Google Scholar]
- de Rubis, G.; Krishnan, S.R.; Bebawy, M. Liquid Biopsies in Cancer Diagnosis, Monitoring, and Prognosis. Trends Pharmacol. Sci. 2019, 40, 172–186. [Google Scholar] [CrossRef] [PubMed]
- Litwin, M.S.; Tan, H.-J. The Diagnosis and Treatment of Prostate Cancer: A Review. JAMA 2017, 317, 2532–2542. [Google Scholar] [CrossRef] [PubMed]
- Okihara, K. Prostate Cancer Diagnosis and Treatment Using Multiparametric Transrectal Ultrasonography. J. Med. Ultrason. 2019, 46, 363–366. [Google Scholar] [CrossRef] [PubMed]
- American Cancer Society Cancer Facts & Figures 2021. In Atlanta: American Cancer Society; 2021.
- Bjartell, A.; Bjork, T.; Matikainen, M.-T.; Abrahamsson, P.-A.; di Sant’Agnese, A.; Lilja, H. Production of Alpha-1-Antichymotrypsin by PSA-Containing Cells of Human Prostate Epithelium. Urology 1993, 42, 502–510. [Google Scholar] [CrossRef] [PubMed]
- Balk, S.P.; Ko, Y.-J.; Bubley, G.J. Biology of Prostate-Specific Antigen. J. Clin. Oncol. 2003, 21, 383–391. [Google Scholar] [CrossRef] [PubMed]
- Brawer, M.K. Prostate Specific Antigen; Marcel Dekker: New York, NY, 2001; ISBN ISBN 0824705556. ISSN ISBN 0824705556. [Google Scholar]
- Jung, K.; Brux, B.; Lein, M.; Rudolph, B.; Kristiansen, G.; Hauptmann, S.; Schnorr, D.; Loening, S.A.; Sinha, P. Molecular Forms of Prostate-Specific Antigen in Malignant and Benign Prostatic Tissue: Biochemical and Diagnostic Implications. Clin. Chem. 2000, 46, 47–54. [Google Scholar] [CrossRef]
- Stephan, C.; Rittenhouse, H.; Hu, X.; Cammann, H.; Jung, K. Prostate-Specific Antigen (PSA) Screening and New Biomarkers for Prostate Cancer (PCa). EJIFCC 2014, 25, 55–78. [Google Scholar] [PubMed]
- Huang, Y.; Li, Z.Z.; Huang, Y.L.; Song, H.J.; Wang, Y.J. Value of Free/Total Prostate-Specific Antigen (f/t PSA) Ratios for Prostate Cancer Detection in Patients with Total Serum Prostate-Specific Antigen between 4 and 10 Ng/ML: A Meta-Analysis. Medicine 2018, 97, e0249. [Google Scholar] [CrossRef] [PubMed]
- Tkac, J.; Gajdosova, V.; Hroncekova, S.; Bertok, T.; Hires, M.; Jane, E.; Lorencova, L.; Kasak, P. Prostate-Specific Antigen Glycoprofiling as Diagnostic and Prognostic Biomarker of Prostate Cancer. Interface Focus 2019, 9, 20180077. [Google Scholar] [CrossRef] [PubMed]
- Zhu, L.; Jäämaa, S.; af Hällström, T.M.; Laiho, M.; Sankila, A.; Nordling, S.; Stenman, U.; Koistinen, H. PSA Forms Complexes With A1-Antichymotrypsin in Prostate. Prostate 2013, 73, 219–226. [Google Scholar] [CrossRef] [PubMed]
- Sindhwani, P.; Wilson, C.M. Prostatitis and Serum Prostate-Specific Antigen. Curr. Urol. Rep. 2005, 6, 307–312. [Google Scholar] [CrossRef] [PubMed]
- Atalay, H.A.; Canat, L.; Alkan, I.; Çakir, S.S.; Altunrende, F. Prostate-Specific Antigen Reduction after Empiric Antibiotic Treatment Does Not Rule out Biopsy in Patients with Lower Urinary Tract Symptoms: Prospective, Controlled, Single-Center Study. Prostate Int. 2017, 5, 59–64. [Google Scholar] [CrossRef] [PubMed]
- Bolduc, S.; Lacombe, L.; Naud, A.; Grégoire, M.; Fradet, Y.; Tremblay, R.R. Urinary PSA: A Potential Useful Marker When Serum PSA Is between 2.5 Ng/ML and 10 Ng/ML. Can. Urol. Assoc. J. 2007, 1, 377–381. [Google Scholar] [CrossRef]
- Höti, N.; Lih, T.S.; Dong, M.; Zhang, Z.; Mangold, L.; Partin, A.W.; Sokoll, L.J.; Kay Li, Q.; Zhang, H. Urinary PSA and Serum PSA for Aggressive Prostate Cancer Detection. Cancers 2023, 15, 960. [Google Scholar] [CrossRef] [PubMed]
- Tothill, I.E. Biosensors for Cancer Markers Diagnosis. Semin. Cell Dev. Biol. 2009, 20, 55–62. [Google Scholar] [CrossRef] [PubMed]
- Healy, D.A.; Hayes, C.J.; Leonard, P.; McKenna, L.; O’Kennedy, R. Biosensor Developments: Application to Prostate-Specific Antigen Detection. Trends Biotechnol. 2007, 25, 125–131. [Google Scholar] [CrossRef] [PubMed]
- Lee, J.H.; Rho, J.-E.R.; Rho, T.-H.D.; Newby, J.G. Advent of Innovative Chemiluminescent Enzyme Immunoassay. Biosens. Bioelectron. 2010, 26, 377–382. [Google Scholar] [CrossRef] [PubMed]
- Boucekkine, N.; Korso, R.; Bellazoug, K.; Ferd, N.; Bouyoucef, S.E.; Boudjemai, S.; Benzaid, A.; Bouhila, Z. Analytical and Clinical Performances of Immunoradiometric Assay of Total and Free PSA Developed Locally. World J. Nucl. Med. 2002, 1, 300–301. [Google Scholar]
- La Civita, E.; Fiorenza, M.; Jannuzzi, G.; Polito, C.; Sirica, R.; Carbone, G.; Sorvillo, D.; Saviano, A.; Ferro, M.; Terracciano, D. Comparison Between a New PSA Assay With the Well-Established Beckman Coulter Immunoassay: A Preliminary Report. Anal. Sci. Adv. 2025, 6, e70017. [Google Scholar] [CrossRef] [PubMed]
- Siemens Healthineers USA Prostate Cancer: A Comprehensive Portfolio of PSA Assays. Available online: https://www.siemens-healthineers.com/en-us/laboratory-diagnostics/assays-by-diseases-conditions/laboratory-diagnostics-in-oncology/prostate-cancer (accessed on 23 June 2026).
- Abbott ARCHITECT Overview | Core Laboratory at Abbott. Available online: https://www.corelaboratory.abbott/us/en/offerings/brands/architect.html (accessed on 23 June 2026).
- Gray, M.A.; Cooke, R.R.; Weinstein, P.; Nacey, J.N. Comparability of Serum Prostate-Specific Antigen Measurement between the Roche Diagnostics Elecsys 2010 and the Abbott Architect I2000. Ann. Clin. Biochem. Int. J. Lab. Med. 2004, 41, 207–212. [Google Scholar] [CrossRef] [PubMed]
- Roche Diagnostics Elecsys® Total PSA. Available online: https://diagnostics.roche.com/us/en/products/lab/elecsys-total-psa-cps-000522 (accessed on 23 June 2026).
- Cui, F.; Zhou, Z.; Zhou, H.S. Review — Measurement and Analysis of Cancer Biomarkers Based on Electrochemical Biosensors. J. Electrochem. Soc. 2020, 167, 037525. [Google Scholar] [CrossRef]
- Cheng, N.; Du, D.; Wang, X.; Liu, D.; Xu, W.; Luo, Y.; Lin, Y. Recent Advances in Biosensors for Detecting Cancer-Derived Exosomes. Trends Biotechnol. 2019, 37, 1236–1254. [Google Scholar] [CrossRef] [PubMed]
- Zhang, L.; Gu, C.; Wen, J.; Liu, G.; Liu, H.; Li, L. Recent Advances in Nanomaterial-Based Biosensors for the Detection of Exosomes. Anal. Bioanal. Chem. 2020. [Google Scholar] [CrossRef] [PubMed]
- Ghorbani, F.; Abbaszadeh, H.; Ezzati Nezhad Dolatabadi, J.; Aghebati-Maleki, L.; Yousefi, M. Application of Various Optical and Electrochemical Aptasensors for Detection of Human Prostate Specific Antigen: A Review. Biosens. Bioelectron. 2019, 142, 111484. [Google Scholar] [CrossRef] [PubMed]
- Dowlatshahi, S.; Abdekhodaie, M.J. Electrochemical Prostate-Specific Antigen Biosensors Based on Electroconductive Nanomaterials and Polymers. Clin. Chim. Acta 2021, 516, 111–135. [Google Scholar] [CrossRef] [PubMed]
- Hatami, A.; Saadatmand, M.; Garshasbi, M. Cell-Free Fetal DNA (CffDNA) Extraction from Whole Blood by Using a Fully Automatic Centrifugal Microfluidic Device Based on Displacement of Magnetic Silica Beads. Talanta 2024, 267, 125245. [Google Scholar] [CrossRef] [PubMed]
- Kawde, A.-N.; Baig, N.; Sajid, M. Graphite Pencil Electrodes as Electrochemical Sensors for Environmental Analysis: A Review of Features, Developments, and Applications. RSC Adv. 2016, 6, 91325–91340. [Google Scholar] [CrossRef]
- Kariuki, J.K. An Electrochemical and Spectroscopic Characterization of Pencil Graphite Electrodes Characterization of Pencil. J. Electrochem. Soc. 2012, 159, H747–H751. [Google Scholar] [CrossRef]
- Keskin, E.; Ertürk, A.S. Electrochemical Determination of Paracetamol in Pharmaceutical Tablet by a Novel Oxidative Pretreated Pencil Graphite Electrode. Ionics 2018, 24, 4043–4054. [Google Scholar] [CrossRef]
- Koyun, O.; Gorduk, S.; Arvas, M.B.; Sahin, Y. Electrochemically Treated Pencil Graphite Electrodes Prepared in One Step for the Electrochemical Determination of Paracetamol. Russ. J. Electrochem. 2018, 54, 796–808. [Google Scholar] [CrossRef]
- Li, N.; Wang, S.; An, J.; Feng, Y. Acid Pretreatment of Three-Dimensional Graphite Cathodes Enhances the Hydrogen Peroxide Synthesis in Bioelectrochemical Systems. Sci. Total Environ. 2018, 630, 308–313. [Google Scholar] [CrossRef] [PubMed]
- Vu, D.L.; Ertek, B.; Dilgin, Y.; Červenka, L. Voltammetric Determination of Tannic Acid in Beverages Using Pencil Graphite Electrode. Czech. J. Food Sci. 2015, 33, 72–76. [Google Scholar] [CrossRef]
- Pittman, C.U., Jr.; He, G.R.; Wu, B.; Gardner, S.D. Chemical Modification of Carbon Fiber Surfaces by Nitric Acid Oxidation Followed by Reaction with Tetraethylenepentamine. Carbon N. Y. 1997, 35, 317–331. [Google Scholar] [CrossRef]
- Ahmadi, M.; Ahour, F. An Electrochemical Biosensor Based on a Graphene Oxide Modified Pencil Graphite Electrode for Direct Detection and Discrimination of Double-Stranded DNA Sequences. Anal. Methods 2020, 12, 4541–4550. [Google Scholar] [CrossRef] [PubMed]
- Zhou, M.; Zhai, Y.; Dong, S. Electrochemical Sensing and Biosensing Platform Based on Chemically Reduced Graphene Oxide. Anal. Chem. 2009, 81, 5603–5613. [Google Scholar] [CrossRef] [PubMed]
- Li, Y.; Li, X.; Dong, C.; Qi, J.; Han, X. A Graphene Oxide-Based Molecularly Imprinted Polymer Platform for Detecting Endocrine Disrupting Chemicals. Carbon N. Y. 2010, 48, 3427–3433. [Google Scholar] [CrossRef]
- Ozkan-Ariksoysal, D. Current Perspectives in Graphene Oxide-Based Electrochemical Biosensors for Cancer Diagnostics. Biosensors 2022, 12, 607. [Google Scholar] [CrossRef] [PubMed]
- AL-Salman, H.N.K.; Hsu, C.-Y.; Nizar Jawad, Z.; Mahmoud, Z.H.; Mohammed, F.; Saud, A.; Al-Mashhadani, Z.I.; Sami Abu Hadal, L.; Kianfar, E. Graphene Oxide-Based Biosensors for Detection of Lung Cancer: A Review. Results Chem. 2024, 7, 101300. [Google Scholar] [CrossRef]
- Golichenari, B.; Nosrati, R.; Farokhi-Fard, A.; Abnous, K.; Vaziri, F.; Behravan, J. Nano-Biosensing Approaches on Tuberculosis: Defy of Aptamers. Biosens. Bioelectron. 2018, 117, 319–331. [Google Scholar] [CrossRef] [PubMed]
- Mokhtarzadeh, A.; Dolatabadi, J.E.N.; Abnous, K.; de la Guardia, M.; Ramezani, M. Nanomaterial-Based Cocaine Aptasensors. Biosens. Bioelectron. 2015, 68, 95–106. [Google Scholar] [CrossRef] [PubMed]
- Lei, J.; Ju, H. Signal Amplification Using Functional Nanomaterials for Biosensing. Chem. Soc. Rev. 2012, 41, 2122–2134. [Google Scholar] [CrossRef] [PubMed]
- Chooto, P. Cyclic Voltammetry and Its Applications. In Voltammetry; IntechOpen, 2019; pp. 1–14. [Google Scholar]
- Elgrishi, N.; Rountree, K.J.; McCarthy, B.D.; Rountree, E.S.; Eisenhart, T.T.; Dempsey, J.L. A Practical Beginner’s Guide to Cyclic Voltammetry. J. Chem. Educ. 2018, 95, 197–206. [Google Scholar] [CrossRef]
- Li, Z.; He, C.; Wang, Z.; Gao, Y.; Dong, Y.; Zhao, C.; Chen, Z.; Wu, Y.; Song, W. An Ethylenediamine-Modified Graphene Oxide Covalently Functionalized with Tetracarboxylic Zn(II) Phthalocyanine Hybrid for Enhanced Nonlinear Optical Properties. Photochem. Photobiol. Sci. 2016, 15, 910–919. [Google Scholar] [CrossRef] [PubMed]
- Yammouri, G.; Mandli, J.; Mohammadi, H.; Amine, A. Development of an Electrochemical Label-Free Biosensor for MicroRNA-125a Detection Using Pencil Graphite Electrode Modified with Different Carbon Nanomaterials. J. Electroanal. Chem. 2017, 806, 75–81. [Google Scholar] [CrossRef]
- Kavosi, B.; Salimi, A.; Hallaj, R.; Moradi, F. Ultrasensitive Electrochemical Immunosensor for PSA Biomarker Detection in Prostate Cancer Cells Using Gold Nanoparticles/PAMAM Dendrimer Loaded with Enzyme Linked Aptamer as Integrated Triple Signal Amplification Strategy. Biosens. Bioelectron. 2015, 74, 915–923. [Google Scholar] [CrossRef] [PubMed]
- Mao, K.; Wu, D.; Li, Y.; Ma, H.; Ni, Z.; Yu, H.; Luo, C.; Wei, Q.; Du, B. Label-Free Electrochemical Immunosensor Based on Graphene/Methylene Blue Nanocomposite. Anal. Biochem. 2012, 422, 22–27. [Google Scholar] [CrossRef] [PubMed]
- Xiao, L.; Chen, X.; Li, X.; Zhang, J.; Wang, Y.; Li, D.; Hong, X.; Shao, Y.; Chen, Y. Enhanced Sensitivity Mach–Zehnder Interferometer-Based Tapered-in-Tapered Fiber-Optic Biosensor for the Immunoassay of C-Reactive Protein. Biosensors 2025, 15, 90. [Google Scholar] [CrossRef] [PubMed]
- Assaifan, A.K.; Almansour, R.A.; Alessa, J.A.; Altinawi, A.; Alhudaithy, S. Impact of Interdigital Electrode Count on Non-Faradaic Electrochemical Biosensor Performance for Detecting Pathogens Associated with Newborn Disabilities. J. Electrochem. Soc. 2025, 172, 057515. [Google Scholar] [CrossRef]
- Farmer, S.; Reusch, W. Reaction with Primary Amines to Form Imines. Available online: https://chem.libretexts.org/@go/page/5825 (accessed on 5 June 2025).
- Jiang, L.; Li, Y.; Gao, Z.; Wang, P.; Li, D.; Dong, Y. Sensitive Detection of Prostate Specific Antigen Based on Copper Ions Doped Ag-Au Nanospheres Labeled Immunosensor. J. Electrochem. Soc. 2019, 166, B1637–B1643. [Google Scholar] [CrossRef]
- Jeong, S.; Barman, S.C.; Yoon, H.; Park, J.Y. A Prostate Cancer Detection Immunosensor Based on Nafion/Reduced Graphene Oxide/Aldehyde Functionalized Methyl Pyridine Composite Electrode. J. Electrochem. Soc. 2019, 166, B920–B926. [Google Scholar] [CrossRef]
- Liu, X. 6.3: IR Spectrum and Characteristic Absorption Bands. In Organic Chemistry I; LibreTexts, 2025; pp. 130–134. [Google Scholar]
- Navratil, R.; Kotzianova, A.; Halouzka, V.; Opletal, T.; Triskova, I.; Trnkova, L.; Hrbac, J. Polymer Lead Pencil Graphite as Electrode Material: Voltammetric, XPS and Raman Study. J. Electroanal. Chem. 2016, 783, 152–160. [Google Scholar] [CrossRef]
- Lim, S.; Park, H.; Yamamoto, G.; Lee, C.; Suk, J.W. Measurements of the Electrical Conductivity of Monolayer Graphene Flakes Using Conductive Atomic Force Microscopy. Nanomaterials 2021, 11, 2575. [Google Scholar] [CrossRef] [PubMed]
- Armbruster, D.A.; Pry, T. Limit of Blank, Limit of Detection and Limit of Quantitation. Clin. Biochem. Rev. 2008, 29, S49–S52. [Google Scholar] [PubMed]
- Iwasawa, T.; Wash, P.; Gibson, C.; Rebek, J., Jr. Reaction of an Introverted Carboxylic Acid with Carbodiimide. Tetrahedron 2007, 63, 6506–6511. [Google Scholar] [CrossRef] [PubMed]
- Ding, L.; You, J.; Kong, R.; Qu, F. Signal Amplification Strategy for Sensitive Immunoassay of Prostate Specific Antigen (PSA) Based on Ferrocene Incorporated Polystyrene Spheres. Anal. Chim. Acta 2013, 793, 19–25. [Google Scholar] [CrossRef] [PubMed]
- Jang, H.D.; Kim, S.K.; Chang, H.; Choi, J.W. 3D Label-Free Prostate Specific Antigen (PSA) Immunosensor Based on Graphene-Gold Composites. Biosens. Bioelectron. 2015, 63, 546–551. [Google Scholar] [CrossRef] [PubMed]
- Tian, L.; Liu, L.; Li, Y.; Wei, Q.; Cao, W. 3D Sandwich-Type Prostate Specific Antigen (PSA) Immunosensor Based on RGO-MWCNT-Pd Nanocomposite. New J. Chem. 2015, 39, 5522–5528. [Google Scholar] [CrossRef]
- Han, L.; Liu, C.-M.; Dong, S.-L.; Du, C.-X.; Zhang, X.-Y.; Li, L.-H.; Wei, Y. Enhanced Conductivity of RGO/Ag NPs Composites for Electrochemical Immunoassay of Prostate-Specific Antigen. Biosens. Bioelectron. 2017, 87, 466–472. [Google Scholar] [CrossRef] [PubMed]
- Pan, L.H.; Kuo, S.H.; Lin, T.Y.; Lin, C.W.; Fang, P.Y.; Yang, H.W. An Electrochemical Biosensor to Simultaneously Detect VEGF and PSA for Early Prostate Cancer Diagnosis Based on Graphene Oxide/SsDNA/PLLA Nanoparticles. Biosens. Bioelectron. 2017, 89, 598–605. [Google Scholar] [CrossRef] [PubMed]
- Karimipour, M.; Heydari-Bafrooei, E.; Sanjari, M.; Johansson, M.B.; Molaei, M. A Glassy Carbon Electrode Modified with TiO2(200)-RGO Hybrid Nanosheets for Aptamer Based Impedimetric Determination of the Prostate Specific Antigen. Microchim. Acta 2018, 186, 33. [Google Scholar] [CrossRef] [PubMed]
- Liu, L.; Zhao, G.; Dong, X.; Li, X.; Wei, Q.; Cao, W. Electrochemical Immunosensor Based on a Multiple Signal Amplification Strategy for Highly Sensitive Detection of Prostate Specific Antigen. Anal. Methods 2018, 10, 4917–4925. [Google Scholar] [CrossRef]
- Kumar, V.; Srivastava, S.; Umrao, S.; Kumar, R.; Nath, G.; Sumana, G.; Saxena, P.S.; Srivastava, A. Nanostructured Palladium-Reduced Graphene Oxide Platform for High Sensitive, Label Free Detection of a Cancer Biomarker. RSC Adv. 2014, 4, 2267–2273. [Google Scholar] [CrossRef]
- Vural, T.; Tugce, Y.; Ozturk, S.; Abaci, S.; Baki, E. Electrochemical Immunoassay for Detection of Prostate Specific Antigen Based on Peptide Nanotube-Gold Nanoparticle-Polyaniline Immobilized Pencil Graphite Electrode. J. Colloid Interface Sci. 2018, 510, 318–326. [Google Scholar] [CrossRef] [PubMed]
- Aboutalebi, S.H.; Chidembo, A.T.; Salari, M.; Konstantinov, K.; Wexler, D.; Liu, H.K.; Dou, S.X. Comparison of GO, GO/MWCNTs Composite and MWCNTs as Potential Electrode Materials for Supercapacitors. Energy Environ. Sci. 2011, 4, 1855–1865. [Google Scholar] [CrossRef]
- Politano, G.G.; Versace, C. Electrical and Optical Characterization of Graphene Oxide and Reduced Graphene Oxide Thin Films. Crystals 2022, 12, 1312. [Google Scholar] [CrossRef]
- Bautista, K.A.; Madsen, E.; Riegle, S.D.; Linnes, J.C. HELPStat: A Handheld, EIS-Enabled, Low-Cost, and Portable Potentiostat. ACS Electrochem. 2025, 1, 386–394. [Google Scholar] [CrossRef]
- Ferraro, S.; Bussetti, M.; Panteghini, M. Serum Prostate-Specific Antigen Testing for Early Detection of Prostate Cancer: Managing the Gap between Clinical and Laboratory Practice. Clin. Chem. 2021, 67, 602–609. [Google Scholar] [CrossRef] [PubMed]
- Ferraro, S.; Bussetti, M.; Rizzardi, S.; Braga, F.; Panteghini, M. Verification of Harmonization of Serum Total and Free Prostate-Specific Antigen (PSA) Measurements and Implications for Medical Decisions. Clin. Chem. 2021, 67, 543–553. [Google Scholar] [CrossRef] [PubMed]
- Kavsak, P.A.; Hotte, S.J. A Large Number of Fresh Samples and a Wide Range of Total Prostate-Specific Antigen (TPSA) Concentrations Is Important to Detect Differences in PSA Methods. Clin. Chem. 2021, 67, 1155–1157. [Google Scholar] [CrossRef] [PubMed]
- Saha, A.; Sharma, K. Electrochemical Biosensor-Based Strategies for Sensitive Detection of Prostate Cancer Biomarkers. Clin. Chim. Acta 2026, 591, 121140. [Google Scholar] [CrossRef] [PubMed]
- Moreno, A.; Sandúa, A.; Ferrer-Costa, R.; Jacobs-Cacha, C.; Varo, N.; Ancizu-Marckert, J.; Robles, J.E.; Pérez Gracia, J.L.; Alegre, E.; González, Á. The Analytical Impact of Extracellular Vesicles PSA on Different Commercial Total PSA Measurement Methods. Biochem. Med. . 2026, 36, 010703. [Google Scholar] [CrossRef] [PubMed]
- Sandúa, A.; Pérez-Gracia, J.L.; Alegre, E.; González, Á. Utility of PSA in Extracellular Vesicles as a Follow-up Biomarker in Prostate Cancer. Adv. Lab. Med. Av. En. Med. De Lab. 2025, 6, 442–449. [Google Scholar] [CrossRef] [PubMed]
- Garrido, M.M.; Bernardino, R.M.; Marta, J.C.; Holdenrieder, S.; Guimarães, J.T. Tumour Markers in Prostate Cancer: The Post-Prostate-Specific Antigen Era. Ann. Clin. Biochem. Int. J. Lab. Med. 2022, 59, 46–58. [Google Scholar] [CrossRef] [PubMed]
Figure 1.
Schematic summary of the prostate-specific antigen (PSA) biosensing platform fabrication steps and its application in early prostate cancer diagnosis. In the presence of PSA-containing serum or urine samples, antibody-antigen recognition events form a resistive layer on the pencil graphite electrode (PGE) surface, thereby hindering electrolyte diffusion to the electrode. The concentration of analytes is then determined by cyclic voltammetry (CV). (BSA: Bovine serum albumin, GO: Graphene oxide, GO-NH2: Amino-functionalized GO, fPSA: Free PSA, PSA-ACT: PSA-α1-antichymotrypsin complex, and tPSA: Total PSA.).
Figure 1.
Schematic summary of the prostate-specific antigen (PSA) biosensing platform fabrication steps and its application in early prostate cancer diagnosis. In the presence of PSA-containing serum or urine samples, antibody-antigen recognition events form a resistive layer on the pencil graphite electrode (PGE) surface, thereby hindering electrolyte diffusion to the electrode. The concentration of analytes is then determined by cyclic voltammetry (CV). (BSA: Bovine serum albumin, GO: Graphene oxide, GO-NH2: Amino-functionalized GO, fPSA: Free PSA, PSA-ACT: PSA-α1-antichymotrypsin complex, and tPSA: Total PSA.).
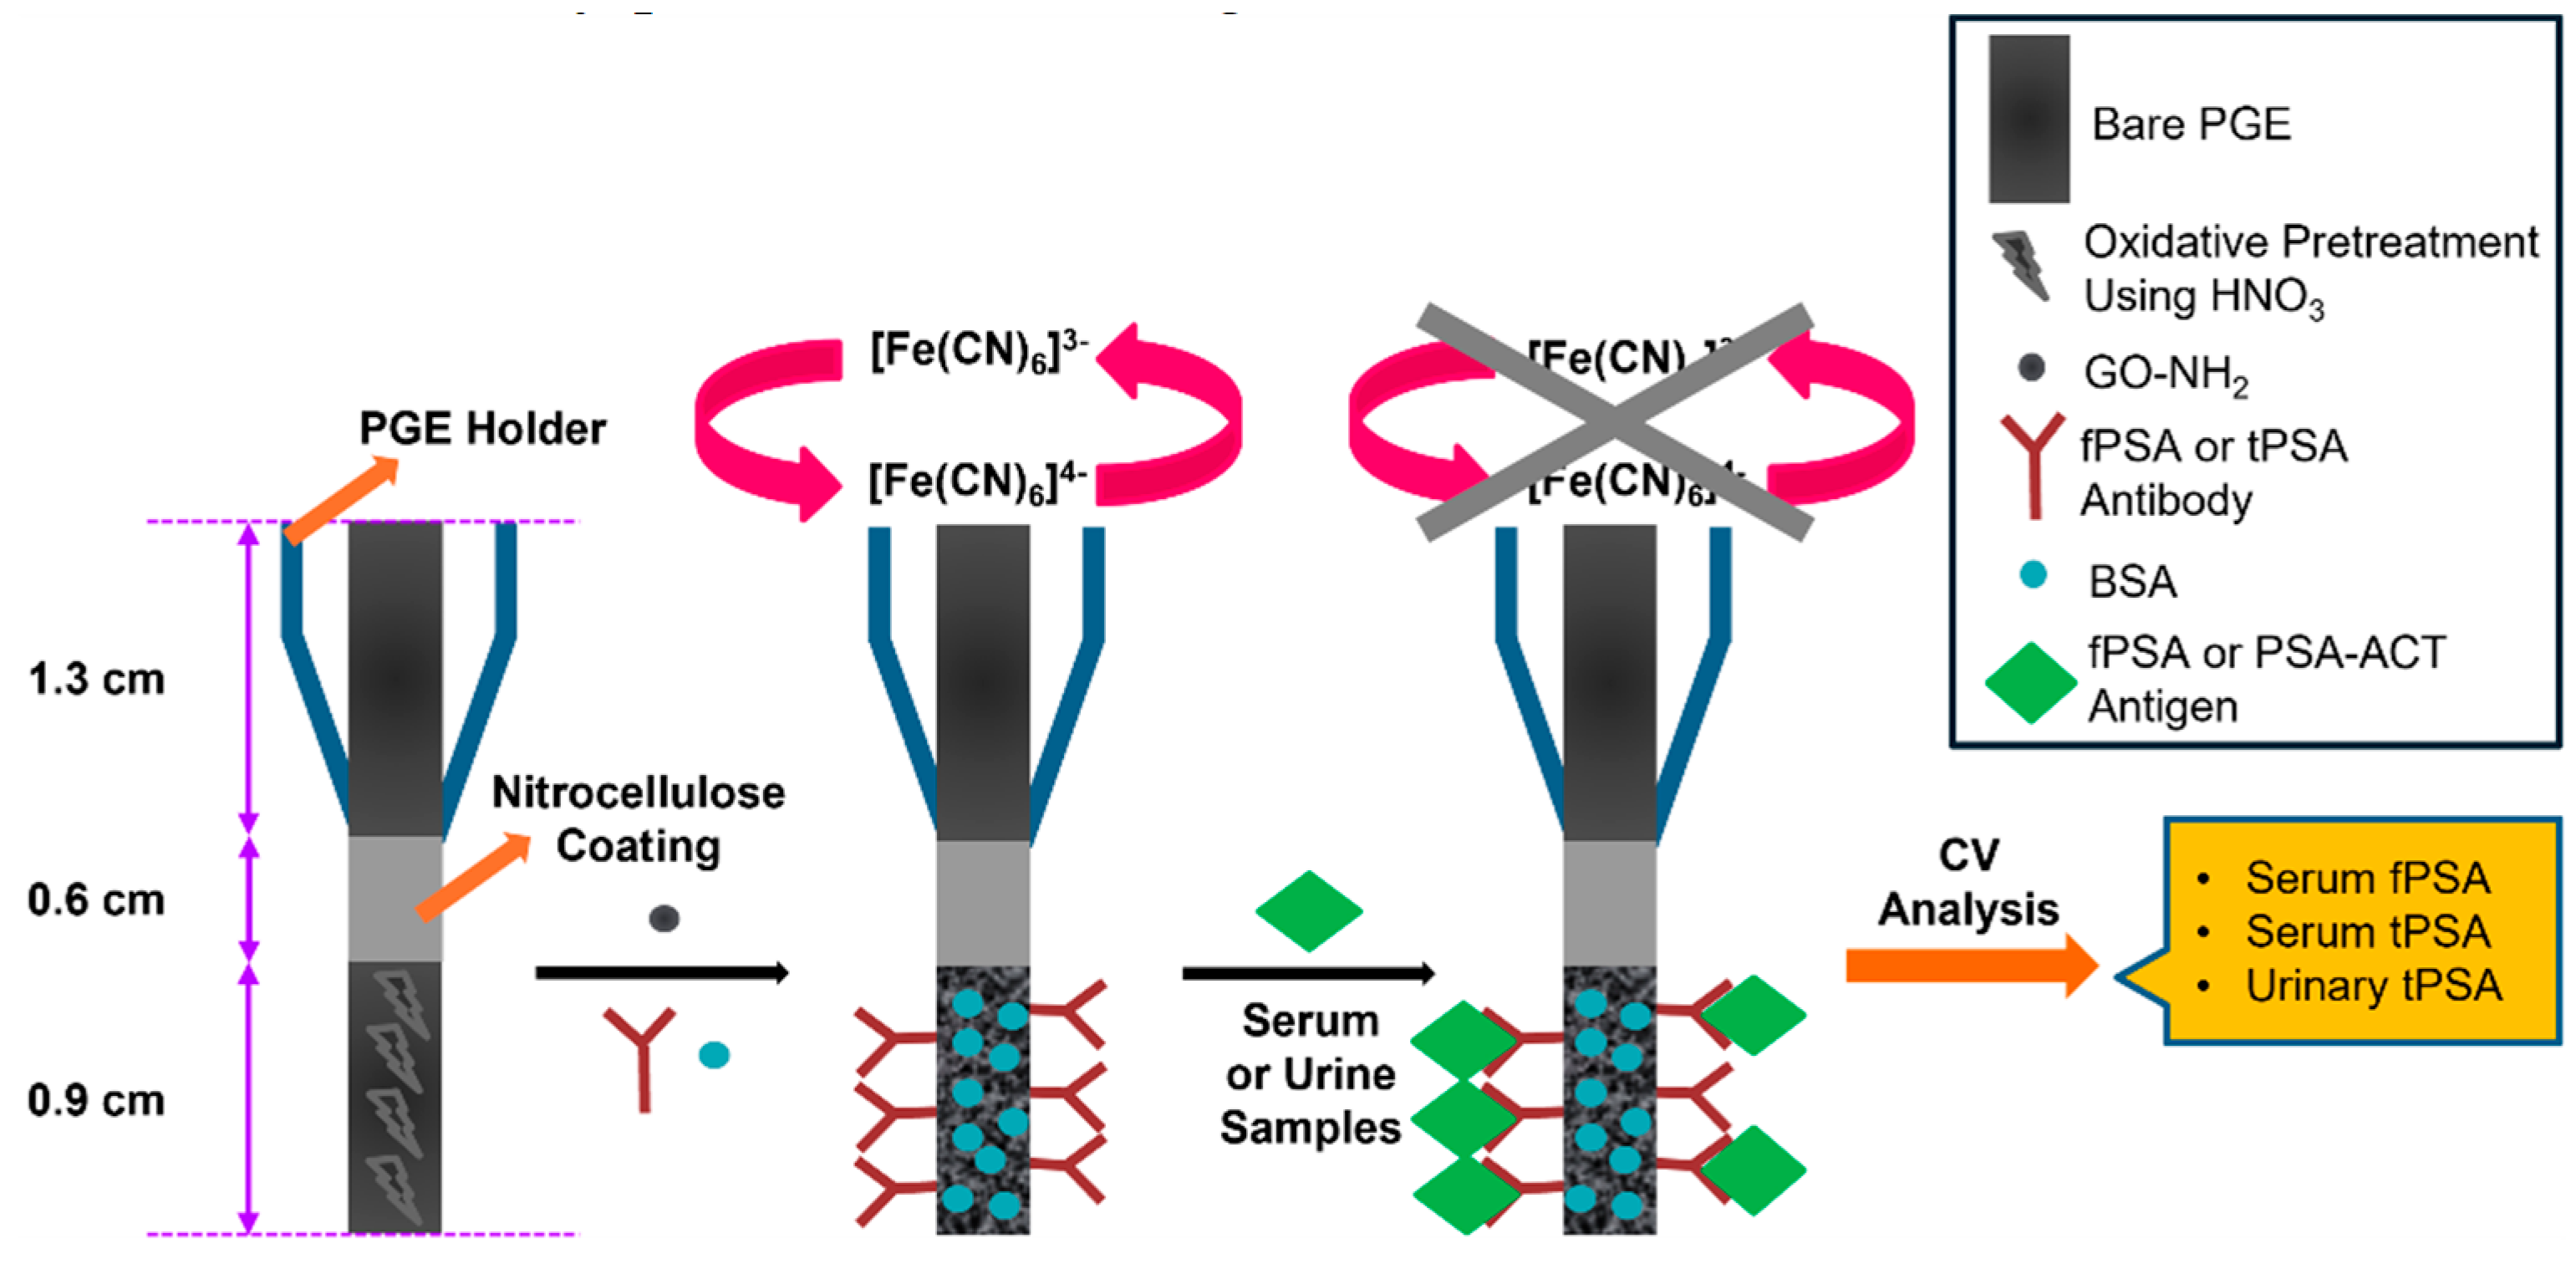
Figure 2.
Structural characterization using Fourier transform infrared (FTIR) analysis. FTIR spectra of (A) GO and GO-NH2 nanoparticles and (B) bare PGE and HNO3-pretreated PGE.
Figure 2.
Structural characterization using Fourier transform infrared (FTIR) analysis. FTIR spectra of (A) GO and GO-NH2 nanoparticles and (B) bare PGE and HNO3-pretreated PGE.
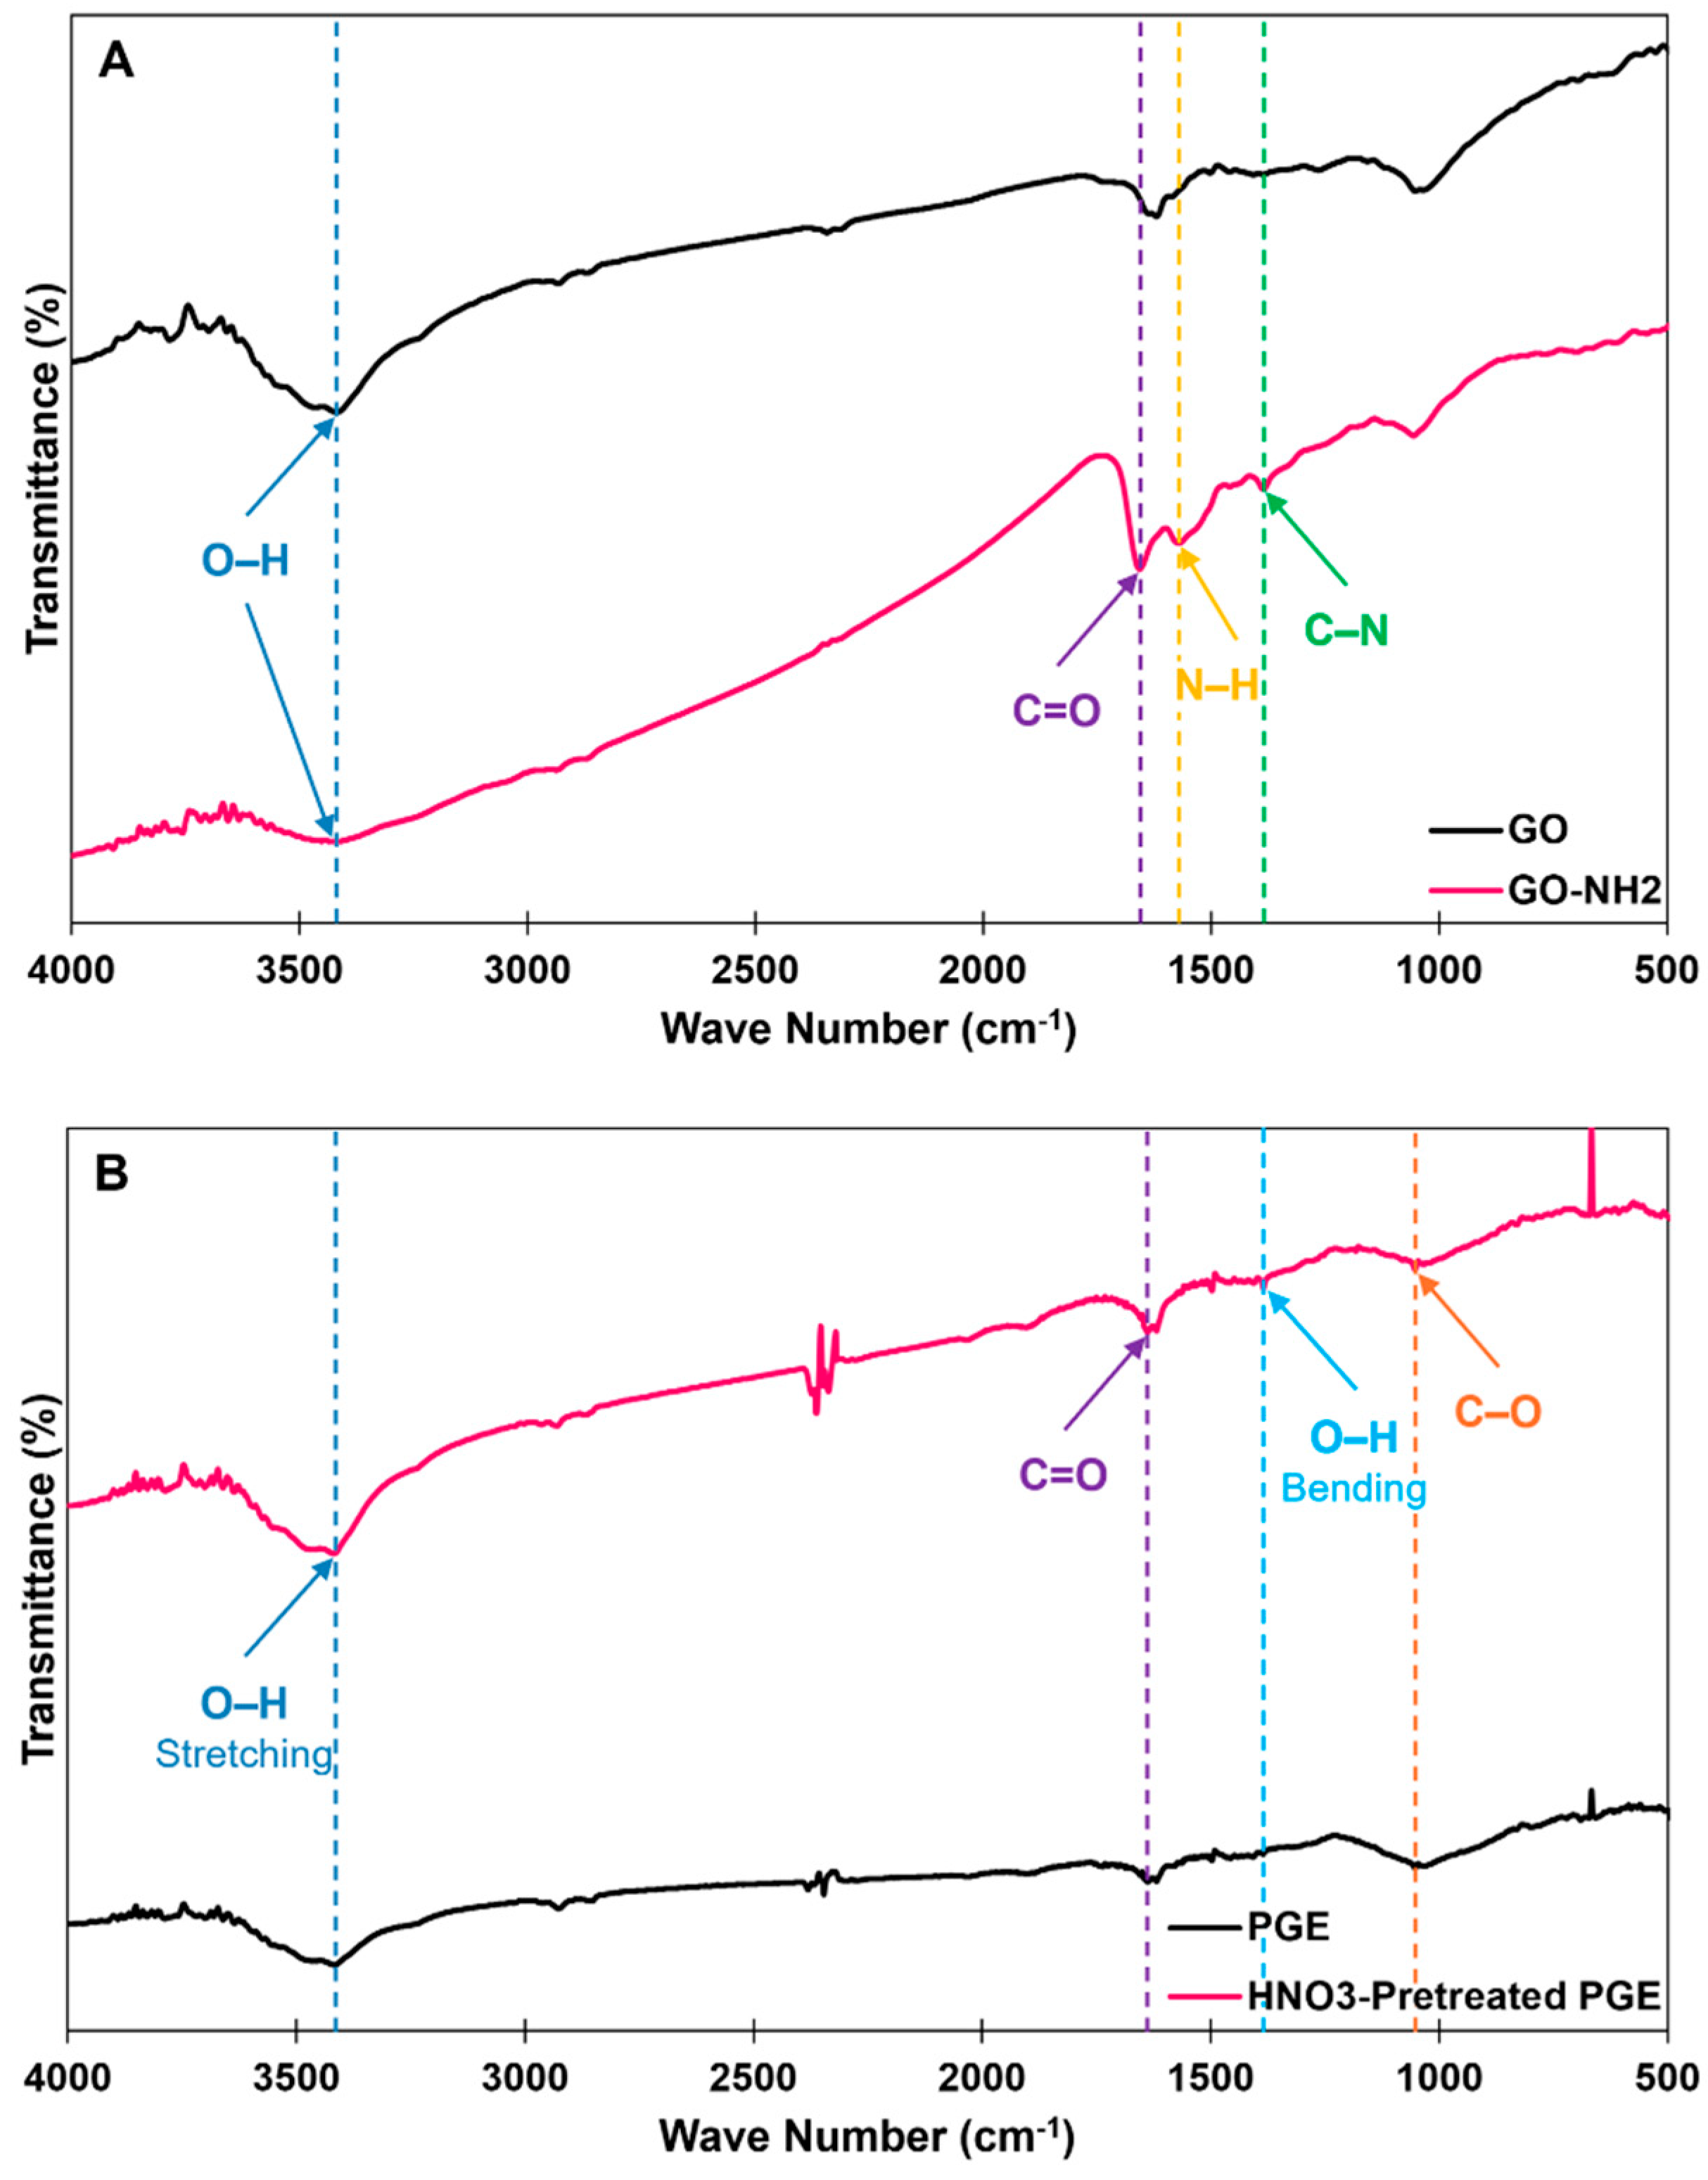
Figure 3.
Structural characterization of PGE working electrodes using scanning electron microscopy (SEM) imaging. Representative SEM images of (A-C) bare PGE, (D-F) HNO3-pretreated PGE, and (G-I) GO-NH2/HNO3-pretreated PGE, at 100 µm (A, D, and G), 2 µm (B, E, and H), and 200 nm (C, F, and I) scales.
Figure 3.
Structural characterization of PGE working electrodes using scanning electron microscopy (SEM) imaging. Representative SEM images of (A-C) bare PGE, (D-F) HNO3-pretreated PGE, and (G-I) GO-NH2/HNO3-pretreated PGE, at 100 µm (A, D, and G), 2 µm (B, E, and H), and 200 nm (C, F, and I) scales.
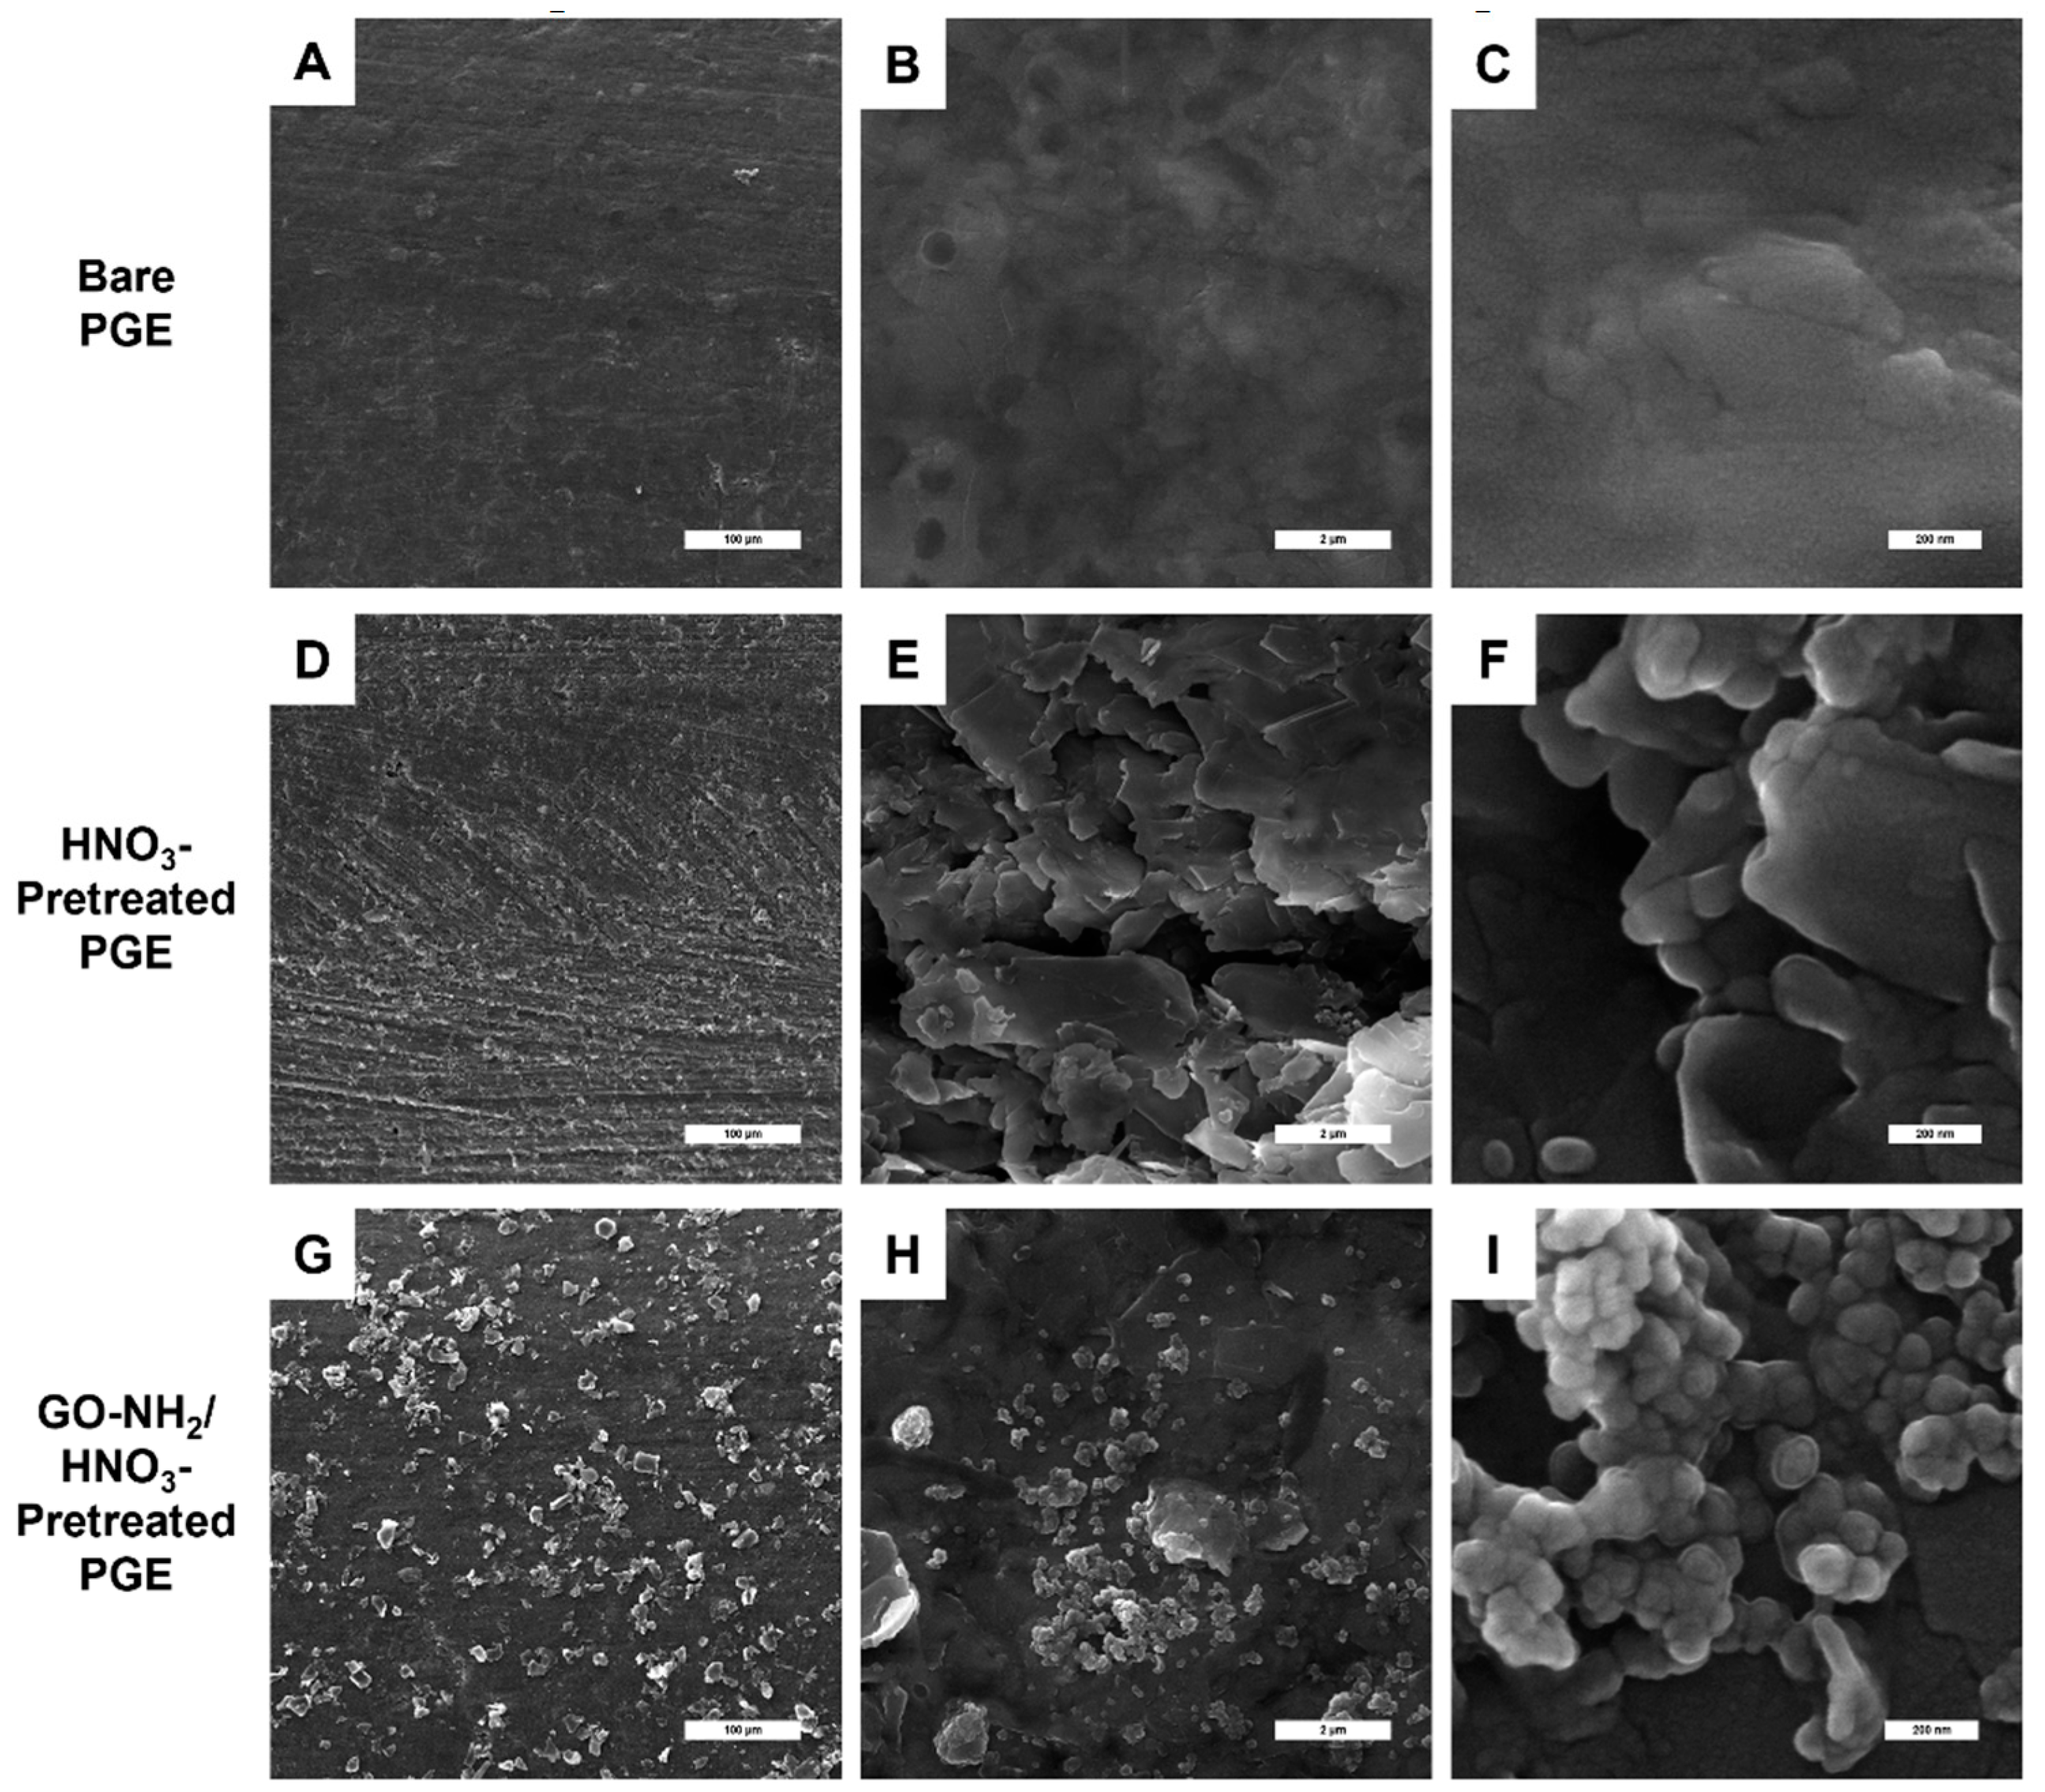
Figure 4.
Electrochemical characterization of the PSA biosensing platforms. (A) Average cyclic voltammograms and (B) mean peak currents of bare PGE, HNO3-pretreated PGE, GO-NH2/PGE, and GO-NH2/HNO3-pretreated PGE. (Dunnett's T3 multiple comparisons test, ***: p < 0.001, ****: p < 0.0001, n = 5 (for all cases except GO-NH2/PGE where n = 4), error bars: standard deviations (SDs).) (C and D) Average cyclic voltammograms obtained during step-by-step fabrication of the tPSA (C) and fPSA (D) biosensing platforms. The tPSA and fPSA antigen (Ag) solutions used in these measurements were 100 ng/mL and 50 ng/mL, respectively. (n = 3, Ab: Antibody.) The CV analyses were performed in a 10 mM phosphate-buffered saline (PBS; pH 7.4) solution containing 2 mM [Fe(CN)6]3-/4- (1:1).
Figure 4.
Electrochemical characterization of the PSA biosensing platforms. (A) Average cyclic voltammograms and (B) mean peak currents of bare PGE, HNO3-pretreated PGE, GO-NH2/PGE, and GO-NH2/HNO3-pretreated PGE. (Dunnett's T3 multiple comparisons test, ***: p < 0.001, ****: p < 0.0001, n = 5 (for all cases except GO-NH2/PGE where n = 4), error bars: standard deviations (SDs).) (C and D) Average cyclic voltammograms obtained during step-by-step fabrication of the tPSA (C) and fPSA (D) biosensing platforms. The tPSA and fPSA antigen (Ag) solutions used in these measurements were 100 ng/mL and 50 ng/mL, respectively. (n = 3, Ab: Antibody.) The CV analyses were performed in a 10 mM phosphate-buffered saline (PBS; pH 7.4) solution containing 2 mM [Fe(CN)6]3-/4- (1:1).
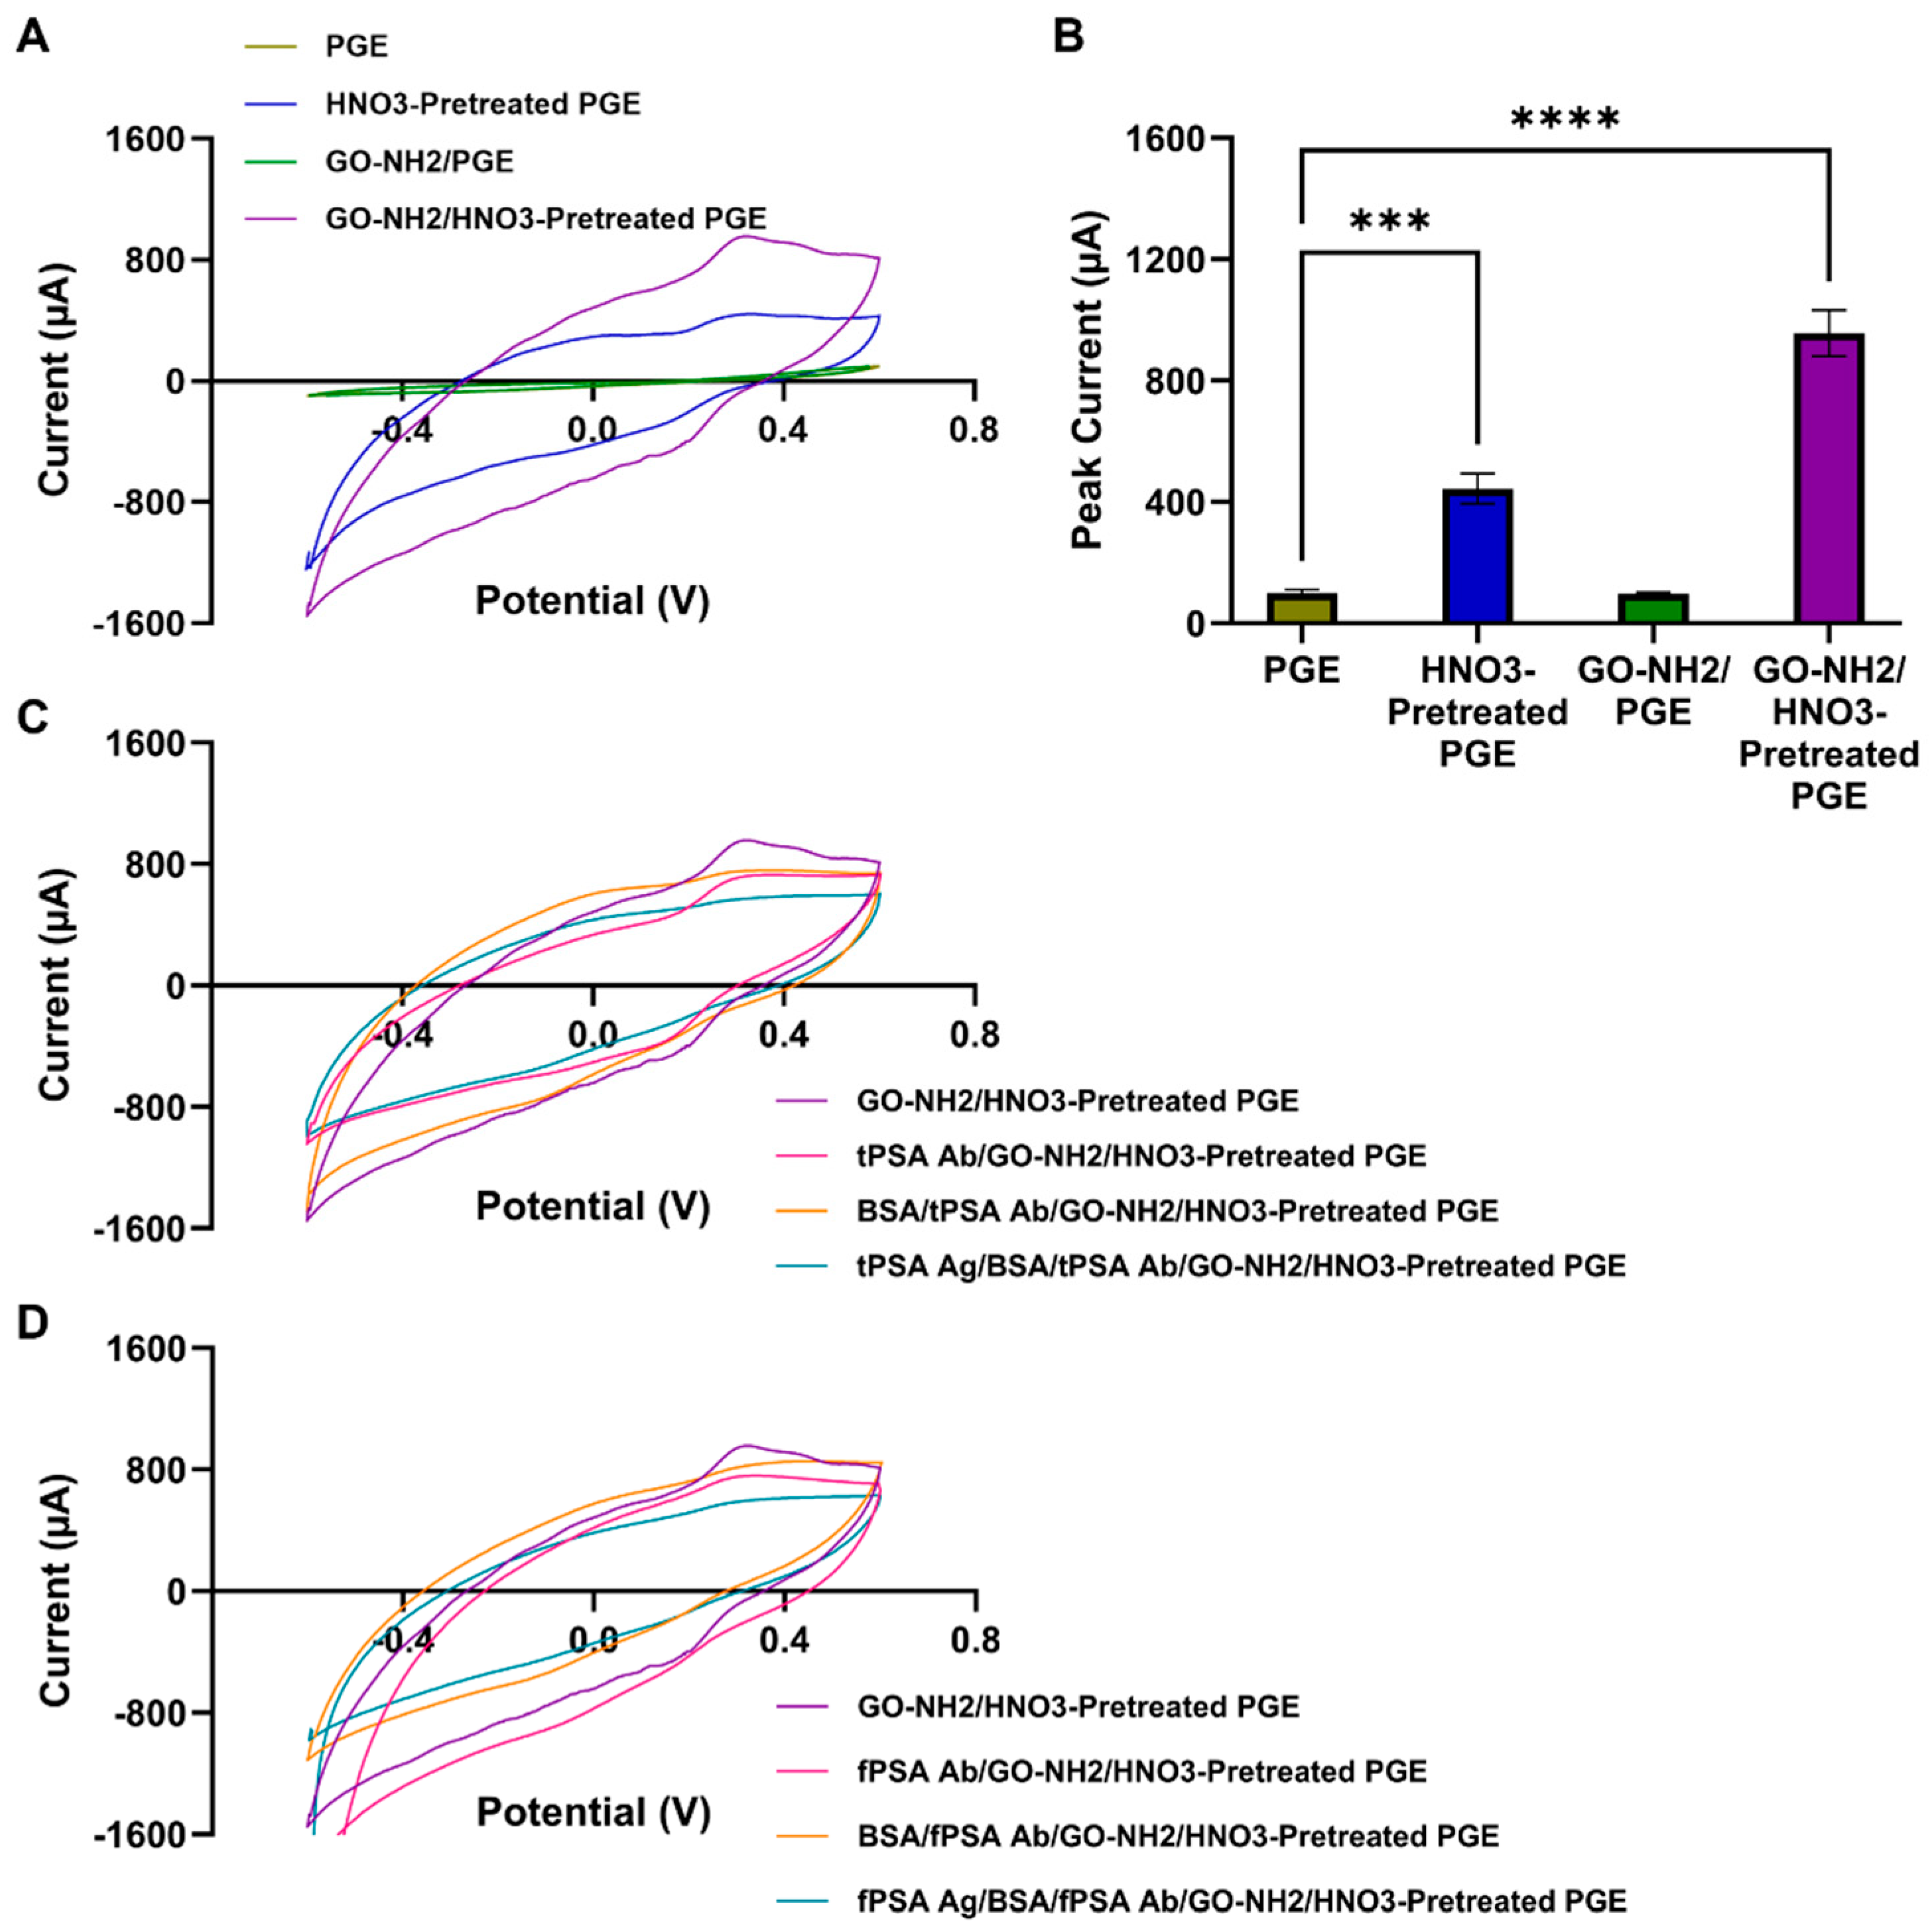
Figure 5.
Analytical performance of the PSA biosensors. (A and C) Average cyclic voltammograms and (B and D) calibration curves of the tPSA (A and B) and fPSA (C and D) biosensors. The CV measurements were obtained in a 10 mM PBS (pH 7.4) solution containing 2 mM [Fe(CN)6]3-/4- (1:1). Each point in the calibration curves represents the mean value of the peak currents (n = 3), and the error bars show SDs. (R2: Coefficient of determination.).
Figure 5.
Analytical performance of the PSA biosensors. (A and C) Average cyclic voltammograms and (B and D) calibration curves of the tPSA (A and B) and fPSA (C and D) biosensors. The CV measurements were obtained in a 10 mM PBS (pH 7.4) solution containing 2 mM [Fe(CN)6]3-/4- (1:1). Each point in the calibration curves represents the mean value of the peak currents (n = 3), and the error bars show SDs. (R2: Coefficient of determination.).
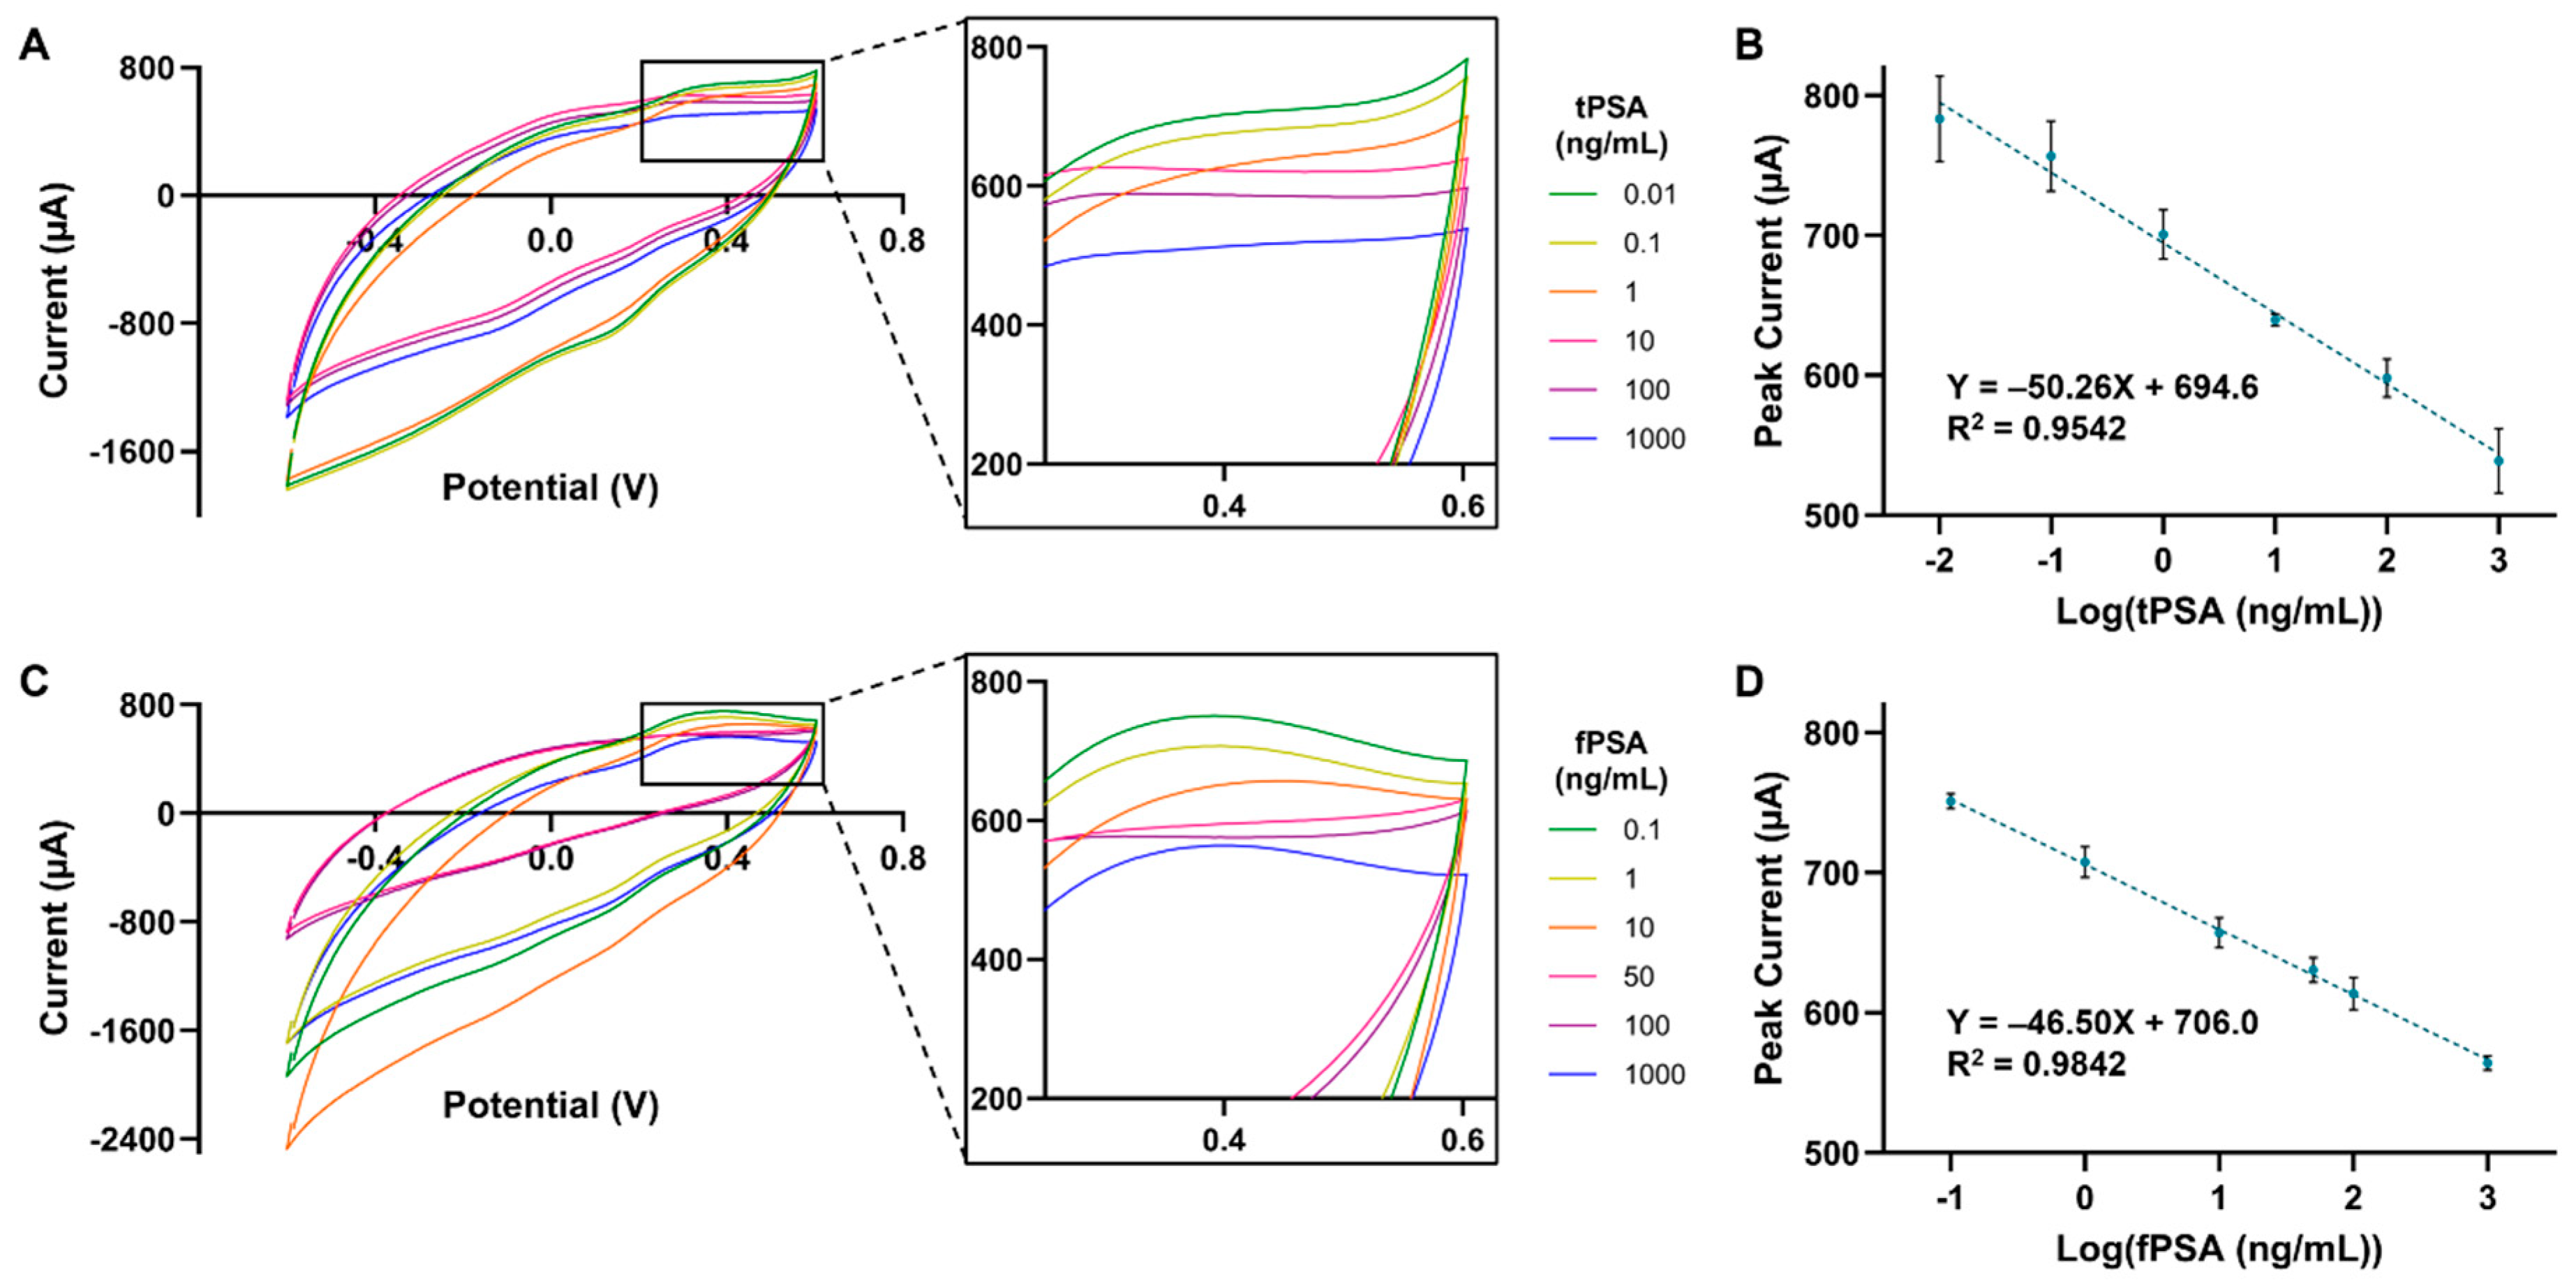
Figure 6.
Selectivity, stability, and performance assessment of the PSA biosensors. (A and B) Selectivity analysis of the tPSA (A) and fPSA (B) biosensors using different biomolecules. For (A): 100 ng/mL tPSA, 50 ng/mL thyroid-stimulating hormone (TSH), 2% BSA, 100 ng/mL tPSA with 1% BSA, and 10 ng/mL TSH with 1% BSA. For (B): 50 ng/mL fPSA, 50 ng/mL TSH, 2% BSA, 50 ng/mL fPSA with 1% BSA, and 10 ng/mL TSH with 1% BSA. (Dunnett's multiple comparisons test with respect to PSA and PSA + BSA cases, ****: p < 0.0001, n = 3, error bars: SDs.) (C and D) Stability of the tPSA (C) and fPSA (D) biosensors over a 28-day period. (Dunnett's multiple comparisons test with respect to the Day 0 case, n = 3, error bars: SDs.) (E and F) Detection of tPSA (E) and fPSA (F) in de-identified samples using the developed electrochemical immunosensors and commercial enzyme-linked immunosorbent assays (ELISAs). (Paired t-tests between the ELISA and Biosensing groups, n = 3, error bars: SDs.) For all electrochemical measurements, CV was performed in a 10 mM PBS (pH 7.4) solution containing 2 mM [Fe(CN)6]3-/4- (1:1).
Figure 6.
Selectivity, stability, and performance assessment of the PSA biosensors. (A and B) Selectivity analysis of the tPSA (A) and fPSA (B) biosensors using different biomolecules. For (A): 100 ng/mL tPSA, 50 ng/mL thyroid-stimulating hormone (TSH), 2% BSA, 100 ng/mL tPSA with 1% BSA, and 10 ng/mL TSH with 1% BSA. For (B): 50 ng/mL fPSA, 50 ng/mL TSH, 2% BSA, 50 ng/mL fPSA with 1% BSA, and 10 ng/mL TSH with 1% BSA. (Dunnett's multiple comparisons test with respect to PSA and PSA + BSA cases, ****: p < 0.0001, n = 3, error bars: SDs.) (C and D) Stability of the tPSA (C) and fPSA (D) biosensors over a 28-day period. (Dunnett's multiple comparisons test with respect to the Day 0 case, n = 3, error bars: SDs.) (E and F) Detection of tPSA (E) and fPSA (F) in de-identified samples using the developed electrochemical immunosensors and commercial enzyme-linked immunosorbent assays (ELISAs). (Paired t-tests between the ELISA and Biosensing groups, n = 3, error bars: SDs.) For all electrochemical measurements, CV was performed in a 10 mM PBS (pH 7.4) solution containing 2 mM [Fe(CN)6]3-/4- (1:1).
Disclaimer/Publisher’s Note: The statements, opinions and data contained in all publications are solely those of the individual author(s) and contributor(s) and not of MDPI and/or the editor(s). MDPI and/or the editor(s) disclaim responsibility for any injury to people or property resulting from any ideas, methods, instructions or products referred to in the content. |
© 2026 by the authors. Licensee MDPI, Basel, Switzerland. This article is an open access article distributed under the terms and conditions of the Creative Commons Attribution (CC BY) license (http://creativecommons.org/licenses/by/4.0/).
Copyright: This open access article is published under a Creative Commons CC BY 4.0 license, which permit the free download, distribution, and reuse, provided that the author and preprint are cited in any reuse.