
Submitted:
17 September 2026
Posted:
18 September 2026
You are already at the latest version
Abstract
Continuous gait monitoring is essential for clinical rehabilitation, yet traditional analysis systems are often confined to a laboratory and costly. This study develops a modular, low cost, multi-channel wearable capacitive sensing band for lower limb monitoring and as potential platform for rehabilitation research. The system utilizes repositionable conductive fabric electrodes on adjustable bands for the shank and thigh, employing an RC timing circuit to detect muscle deformation during walking and measure the capacitance via Wi-Fi for real time monitoring. Sensor characterization demonstrated high stability, with linearity exceeding 0.98, creep under 0.4%, and hysteresis below 3%, regardless of sensor conditions (Pristine, Aged, and Used). Moreover, comparison with OpenCap kinematics during normal walk across different gait phases showed strong to very strong waveform similarities with correlations exceeding 0.999 during terminal stance. Furthermore, the system demonstrated feasibility in identifying simulated hemiplegic, spastic, and Parkinsonian gait against normal walking, with abnormality thresholds reaching 40 % of the gait cycle points exceeding the abnormality threshold of |z|>2. These findings suggest the proposed modular system is an effective tool for identifying muscle deformation in lower limb, which is essential in gait assessment in clinical rehabilitation. Future studies should validate the device with actual patients with musculoskeletal disorders.
Keywords:
gait analysis
; modular
; capacitive sensing
; lower limb
; pathological gait
; OpenCap
1. Introduction
Human gait is a complex and highly individualized motor activity that reflects the coordinated interaction of the musculoskeletal and nervous systems. Although walking is a fundamental human function, gait patterns continuously change with age, physical condition, fatigue, lifestyle, and emotional state. In many cases, subtle changes in walking patterns are not merely expressions of personal style but may represent the earliest signs of underlying musculoskeletal conditions, highlighting the importance of accurate and continuous gait monitoring [1,2,3].
Gait analysis has become an important clinical tool for clinical rehabilitation, sports performance optimization, and health monitoring, with recent advances focusing on wearable sensor technologies for lower limb assessment [3,4,5,6,7,8]. Quantitative assessment of gait parameters enables clinicians to detect subtle impairments that are often difficult to observe visually, thereby improving diagnostic accuracy and treatment planning [9,10,11]. The increasing prevalence of conditions such as stroke, knee injuries, and Parkinson’s disease has further emphasized the need for reliable gait monitoring systems. Stroke alone affects millions of individuals worldwide and frequently results in severe motor impairments that reduce independence and quality of life [11,12,13,14]. Through the analysis of kinematic and kinetic parameters, gait assessment supports the development of individualized rehabilitation strategies that target specific biomechanical deficits [9].
Traditional gait analysis systems, including optical motion capture systems and force plates, remain the gold standard for biomechanical assessment because of their high measurement accuracy. However, these systems are expensive, bulky, and generally confined to specialized laboratories or clinical facilities, limiting their suitability for continuous and real-world gait monitoring [1,2,3,15,16]. Similarly, non-wearable systems such as camera-based motion tracking and thermal imaging technologies require controlled environments and complex systems, restricting their accessibility and long-term usability [17,18].
To overcome these limitations, wearable gait monitoring technologies have been widely investigated, as they allow continuous gait monitoring outside the lab and over longer walking distances [15,16,19,20]. Sensors such as accelerometers, gyroscopes, inertial measurement units (IMUs), and electromyography (EMG) systems provide portable and relatively low-cost alternatives capable of monitoring gait during daily assessment, and personalized healthcare by enabling continuous monitoring of patient recovery and motor performance [3,19,21,22,23]. EMG systems, while capable of capturing muscle activations signals, require precise electrode placement and skin preparation and are susceptible to motion artifacts, electrical noise, and crosstalk from adjacent muscles [24,25,26,27,28]. Furthermore, many existing wearable systems rely on rigid electronics, fixed sensor placements or multiple attachments to different limb segments, reducing user comfort and limiting adaptability for prolonged real world use [29,30,31,32,33,34,35,36,37].
Recent studies have explored capacitive sensing approaches for wearable gait monitoring because of their adaptability to detect soft tissue deformation and muscle movement [3,31,37]. Furthermore, systematic reviews and device studies show that shank/thigh wearable sensors can robustly detect gait events, abnormal patterns, and subtle deviations in both healthy and pathological gait [38,39,40,41,42,43]. Moreover, studies in textile-based and flexible capacitive sensors have been used to monitor knee motion, muscle activity, and locomotion patterns [9,30,31].
However, most existing capacitive sensing systems employ fixed electrode configurations embedded within garments or prosthetic structures, limiting their adaptability to different users and muscle groups [30,31,32,36,44,45,46,47]. In addition, several previously developed systems focus primarily on isolated gait parameters such as joint angles or phases without establishing normative references for comparing healthy and impaired gait patterns [33,34,35,36,37,48]. While effective for targeted joints or body segments, these embedded configurations are not easily reconfigured to different users or to arbitrary muscle groups, motivating the present study for a modular, repositionable capacitive band. These limitations highlight the need for wearable systems that are not only portable and affordable, but also modular and capable of long-term monitoring.
To address these challenges, this study aims to develop a modular, low-cost, multi-channel capacitive sensing band, integrated with OpenCap [49] for high-speed wireless lower limb monitoring, with potential for real-time clinical assessment. The proposed systems utilize repositionable conductive fabric-based electrodes integrated into adjustable wearable bands for the shank and thigh, enabling targeted monitoring of specific muscle groups while accommodating anatomical variations among users.
2. Materials and Methods
2.1. Sensor Design and Fabrication
The wearable device consists of a detachable sensing electrode composed of 2 cm2 conductive fabric glued on a 2.5 cm2 white Velcro. Four sensing electrodes are attached to the band and can be repositioned at a specific muscle in the shank and thigh. A female jumper wire was soldered to the conductive fabric which serves as the electrical connector that links the sensing electrodes to the input pins of the ESP32-S3 microcontroller. This configuration allows flexible signal transmission while maintaining comfort and stability during gait movement (Figure 1).
2.2. Circuit Diagram
Figure 2 illustrates the connection between the ESP32-S3 microcontroller and the wearable capacitive sensing bands used for gait monitoring. The thigh and shank bands each contain four sensing electrodes and one charge electrode for capacitance measurement. The sensing electrodes and charge electrodes were connected to the Analog-to-Digital Converter (ADC) pins, forming an RC timing circuit for capacitance measurement. This configuration enables the microcontroller to detect variations caused by limb movement and muscle deformation during gait, allowing it to monitor and analyze gait motion in wearable applications.
2.3. Sensor Placement
As shown in Figure 3, four sensing electrodes were positioned around the thigh region, with two electrodes placed over the anterior thigh muscles (quadriceps muscle group), and two electrodes placed over the posterior thigh muscle (hamstring muscle group), together with one charge electrode. Similarly, four sensing electrodes were positioned around the shank region, with two electrodes placed over the anterior shank near the tibia region and two electrodes placed over the posterior shank targeting the gastrocnemius muscle, along with one charge electrode. The skin tissue between the electrodes and the body serves as the dielectric medium for the capacitive sensing during gait movement.
Basically, when a body tissue acts as dielectric, the body capacitance is governed by this equation,
where is the body capacitance, relative permittivity of skin/fats/muscles, vacuum permittivity, A is the electrode coupling area, and d is the skin or tissue thickness. It tells that with a change in skin/tissue properties, body capacitance changes.
Unlike a conventional parallel plate capacitor, the proposed wearable sensor employs a body-coupled electrode configuration consisting of a single excitation electrode and four conductive textile sensing electrodes positioned around the limb. In this arrangement, the electric field propagates primarily through internal and fringing electric fields that penetrate the skin, limb tissue, muscle and surrounding environment before coupling back to the sensing electrodes. Consequently, the measured capacitance is not determined solely by the electrode area and separation but by the effective electric field distribution throughout the body-coupled system.
The measured capacitance is,
where is the body-coupled capacitance, is the capacitance due to fringing electric fields, and is the parasitic capacitance.
2.3.1. Material Calibration
To evaluate the effectiveness of the capacitive sensing band, the sensor performance was evaluated through stability, normalization, linearity test, creep test, hysteresis, temperature test, repeatability, and SEM-EDS characterization of the conductive fabric used.
2.4. Data Acquisition, Processing and Analysis
2.4.1. Workflow
Figure 4 shows the system architecture and workflow of the wearable capacitive gait monitoring system per trial with OpenCap. The process begins with capacitive sensing bands placed on the thigh and shank in four muscle regions specifically in the quadriceps muscles and hamstring muscles with the limb tissue as dielectric, and connect the sensing bands to the microcontroller (Step 1).
Next, the sensing bands are connected to the microcontroller to read the thigh and shank’s capacitance (Step 2).
Then baseline calibration is performed while the subject is stationary to obtain reference capacitance values (Step 3). During operation, the microcontroller measures capacitance using an RC timing method, where a dedicated charge electrode excites the sensing electrodes through a 1 MΩ reference resistor, forming a charging path.
The capacitance value was computed from the measured charging time using the following RC timing relationship:
where C represents the capacitance, t is the measured charging time, and R is the reference resistance (1 MΩ). The system operates at a sampling frequency of 60 Hz. Furthermore, normalization was performed to standardized the capacitance signals and reduce variability associated with differences in baseline signal magnitude across measurements. To minimize transient artifacts and high frequency measurement noise, the normalized signals were subsequently processed using sequential Savitzky-Golay and Gaussian smoothing filters, which preserved the gait while attenuating abrupt fluctuations, thereby improving the robustness of gait phase tracking.
When the charge pin is driven HIGH by the microcontroller, the electrode capacitance charges through the resistor, and the system measures the time required for the voltage on the sensing electrode to reach a threshold value using the analog to digital converter (ADC). Capacitance signals were then normalized (Step 4). For this validation study, normalization was performed using stationary baseline (. In order to account for potential dynamic baseline shifts or mechanical drift during prolonged use, future real-time implementations may utilize sliding window normalization to adaptively recalibrate the signal. Simultaneously, the OpenCap system captures markerless motion data (Step 5), and the capacitance data from the wearable sensing bands were recorded via Wi-Fi in a computer (Step 6). The synchronized outputs for each walking trial were then stored as CSV files for further analysis (Step 7).
2.4.2. Walking Gait Experiment
A preliminary test trial was conducted to verify OpenCap accuracy and confirm proper sensor functionality. During the actual experiment, participants performed self-selected natural walking and completed three trials each.
Full gait walking cycle, gait cycle events, and gait cycle segments were then observed, as described in [50]. The gait cycle is divided into six phases, and described as follows: (1) heel strike to foot flat (0–10%), (2) During midstance, foot flat to heel off (10–40%); (3) terminal stance spanning from heel off to double support (40–50%); (4) Pre-swing covering double support to toe off (50–60%); (5) Mid-swing which spans from toe off to peak knee flexion (60–75%); and (6) Terminal swing covering peak knee flexion to heel strike (75–100%), as shown in Figure 5.
2.5. Subject Protocol
A total of 30 participants (19 males and 11 females) were recruited to evaluate the performance of the proposed wearable capacitive sensing system. The primary objective of this study was prototype validation rather than population-level inference. Therefore, the study employed a controlled repeated-measure experimental design in which each participant completed multiple walking trials under standardized laboratory conditions. This design substantially increased the number of observations available for statistical analysis while minimizing within-subject variability, allowing robust evaluation of sensor accuracy, repeatability, and agreement with the OpenCap reference system. Similar sample sizes are commonly adopted in wearable sensing and biomechanical validation studies, where the emphasis is on characterizing device performance under controlled experimental conditions rather than estimating population prevalence.
The participants were aged 18–45 years, with a mean height of 1.606 m and a mean weight of 61.167 kg. Individuals with musculoskeletal conditions or impairments were excluded from the study. Ethical clearance was obtained from the University’s Research Integrity and Compliance Office (RICO). Prior to data collection, the study procedures and consent forms were explained to the participants, and all participants voluntarily signed an informed consent form acknowledging that the collected data would be used for research publication purposes only.
3. Results
3.1. Sensor Performance Characterization
3.1.1. Calibration
The capacitive sensing bands were calibrated and tested in two controlled conditions while the subject remained in a stationary state. First, the level of tightness was varied across three different tightening levels, with three trials conducted for each level. Second, three time durations (15 s, 30 s, 60 s) were applied, with three trials per duration. The results in Figure 6, indicate that the variations in capacitance measurements across different tightness levels and time durations were minimal and practically not significant. Based on these findings, the shortest duration (15 s) and a consistent tightening levels were selected for all subsequent data collection. Parasitic capacitance from the transmission lines was accounted for by baseline subtraction during the initial calibration.
The capacitance readings of both shank and thigh was normalized using , where represents the capacitance in stationary state. Result shows that (a) non normalized signals show consistency and linearity with the (b) normalized signals across repeated trials as shown in Figure 7.
3.1.2. Linearity Test
A pair of capacitive sensors was mounted on a PVC phantom leg to evaluate linearity under incremental hanging masses of 50 g, 150 g, 250 g, and 550 g. The sensors were categorized into three conditions: (1) Pristine, newly opened with no prior mechanical exposure; (2) Aged, opened and stored under ambient conditions for one year without active use; and (3) Used, previously subjected to repeated mechanical loading. One sensor pair was tested for each condition, with three repeated trials per set.
All sensor conditions demonstrated strong linear behavior, with coefficients of determination (R2) exceeding 0.98. The standard deviation across Pristine, Aged and Used sensors was ≤0.03%, indicating negligible variability between sensor states as shown in Figure 8. Notably, the Pristine sensor consistently exhibited slightly higher capacitance values across all loading conditions compared to Aged and Used sensors. Nevertheless, these differences did not affect overall linearity, confirming that all sensor conditions remain reliable for measurement applications.
Furthermore, ANCOVA was performed to compare the regression relationships among Pristine, Aged and Used sensor conditions. The analysis revealed no significant mass x sensor condition interaction (p > 0.05), indicating homogeneity of regression slopes across all sensor groups. This result suggests that the rate of change in capacitance response to increasing applied mass remained statistically consistent regardless of sensor condition. The absence of significant difference demonstrates the robustness of the sensing mechanism and indicates that sensor aging and operational wear did not adversely affect the linearity or sensitivity of capacitance based sensing system within the tested loading range.
3.1.3. Creep Test
A 90-s creep test was conducted on Pristine, Aged, and Used sensor sets under a 250 g applied load, with capacitance measurements recorded at 15, 30, 60, and 90 s time points, as shown in Figure 9. All sensor sets exhibited progressive creep behavior over time. The Pristine sensor started at a creep of at 15 s, increasing to 0.39% at 60 s and slightly decreasing to 0.37% at 90 s, indicating good initial stability with creep under sustained load. The Aged sensor showed an initial creep of 0.24% at 15 s but reached similar levels to Pristine at 60 s (0.36%), suggesting a slightly slower response while maintaining comparable long-term behavior. The initial creep of the Used sensor was initially but increased rapidly to 0.33% at 60 s, indicating that repeated usage reduces initial deformation but the material still undergoes relaxation under sustained load.
The creep test demonstrated that all three sensor conditions (Pristine, Aged, and Used) exhibited the characteristic viscoelastic behavior of polymer based capacitive sensors, with capacitance increasing rapidly during the initial loading period before gradually approaching a stable equilibrium. The linear mixed-effects model showed that loading time significantly influenced the capacitance response, with the logarithm of time having a positive effect on capacitance (, indicating that most creep deformation occurred during the early stage of sustained loading before progressively stabilizing. The model explained a substantial proportion of the observed variability, with a marginal R2 of approximately 0.764, suggesting that sensor condition and loading times together accounted for nearly 76% of the variation in capacitance. In contrast, the interaction between sensor condition and loading time was not statistically significant for either the Pristine ( or Used sensors relative to the Aged sensor, indicating that the temporal evolution of creep was comparable across the three sensor conditions despite differences in their baseline capacitance responses.
The nonlinear exponential creep models further supported these findings by providing excellent fits to the experimental data, with coefficients of determination ranging from R2 = 0.930 to 0.961. The estimated equilibrium capacitance was highest for the Used sensor (, followed by the Pristine (178.717) and Aged (178.655) sensors. Similarly, the Used sensor exhibited the largest estimated creep increase (0.228) and the shortest relaxation half-time (5.00 s), whereas the Pristine sensor showed the lowest relaxation (7.77 s). Nevertheless, bootstrap confidence intervals for the creep-rate constant overlapped considerably among the three conditions, suggesting that the observed differences in creep rate were not sufficiently large to indicate distinct viscoelastic mechanisms. Instead, aging and repeated use primarily influenced the magnitude of the capacitance may be effectively addressed through periodic calibration. Although the mixed-effects analysis provides statistically supported evidence of stable creep behavior, the relatively small numbers of independently fabricated sensors are recommended to further validate these findings.
Although sensor conditions significantly affected the measured capacitance response, the magnitude of creep remained below 0.4% for all sensor sets throughout the test. Therefore, the practical effect of creep was small, indicating that Pristine, Aged, and Used sensors all maintained good mechanical stability under sustained loading.
3.1.4. Hysteresis Test
The hysteresis characteristics of the sensor under Pristine, Aged, and Used conditions are shown in Figure 10 using applied masses of 50 g, 150 g, 250 g, 350 g, and 850 g. FSO hysteresis were measured from the maximum vertical difference between loading and unloading curves relative to the full output range, while area hysteresis measures the total enclosed area between loading and unloading. FSO hysteresis evaluates sensing accuracy, while area hysteresis evaluates the dynamic performance during walking.
The loading and unloading curves exhibited minimal separation across all conditions, indicating good repeatability and reversibility of the sensor response. The Pristine sensor demonstrated the smallest hysteresis, with approximately 1.4% FSO hysteresis and 1.4% area hysteresis. Slight increases were observed in the Aged sensor (1.54% FSO and 2.9% area hysteresis), which may be attributed to prolonged exposure. Meanwhile, the used sensor maintained low hysteresis values (1.49% FSO and 1.7% area hysteresis), indicating that regular usage did not significantly affect sensor stability. Overall, the small deviations in hysteresis values (<3%) confirm the reliability and mechanical stability of the developed capacitive sensor for wearable gait-monitoring applications.
Furthermore, Table 1 presents the mixed-effects model estimates for capacitance response and hysteresis across sensor conditions. The Pristine sensor during loading was used as the reference category. The main-effect estimates compare the capacitance responses of the Aged and Used sensors with that of the Pristine sensor during loading. Hysteresis was assessed from the unloading response relative to loading, while the Pristine unloading effect served as the reference for comparing hysteresis across sensor conditions.
In Table 1, the mixed-effects model showed no statistically significant difference in the capacitance response during loading between Pristine sensor and either the Aged (p = 0.407) or Used (p = 0.156) sensors. The relatively small standard errors indicate reasonably precise estimates, while the low absolute z/t values support the absence of statistically significant difference. Therefore, neither sensor aging nor regular use did not significantly affect sensor output during loading.
Similarly, interaction between the direction (loading & unloading) and the Pristine and Used sensors (p = 0.613) did not differ significantly. The aged sensor also did not show a statistically llsignificant difference in the interaction relative to the Pristine sensor (p = 0.060). However, this value was close to the 0.05 significance threshold and may indicate a tendency toward increased hysteresis after aging.
3.1.5. Temperature Test
To evaluate how environmental conditions, influence the performance and reliability of the capacitive sensors, three sets of sensors; Pristine, Aged and Used were tested across six temperatures: 30 °C, 32 °C, 35 °C, 38 °C, 40 °C and 45 °C, with three trials conducted at each temperature. These temperatures were selected to represent both typical physiological conditions and slightly elevated temperatures that a wearable device might encounter during operation.
An ANCOVA type linear regression model revealed that temperature significantly affected capacitance response In contrast, sensor condition did not significantly influence the overall response . Furthermore, the interaction between temperature and sensor condition was not statistically significant , indicating comparable temperature response behavior among the sensor groups. These findings suggest that the effect of temperature on capacitance response was comparable across the Pristine, Aged, and Used sensor conditions. Also aging and repeated mechanical use did not substantially alter the thermal response characteristics of the sensors. Assumption diagnostics showed normally distributed residuals (Shapiro-Wilk p = 0.297) and homogeneous variances (Levene’s test p = 0.419), confirming the validity of the statistical model. These findings suggest that the sensors maintained stable and consistent thermal response characteristics despite aging and repeated mechanical exposure.
The result further showed that all sensor sets exhibited a consistent temperature dependent capacitance response throughout the tested range. Although capacitance varied with temperature, as reflected by the significant temperature effect, the observed responses remained highly reproducible across all sensor conditions, as shown in Figure 11. Measurement error remained very low (~≤0.21%), demonstrating excellent repeatability and minimal variability between trials.
Overall, the findings indicate that the sensors maintained stable and reliable performance under physiological and moderately elevated thermal conditions. The non-significant influence of sensor condition and the temperature sensor condition interaction suggests that the thermal response remained stable despite environmental aging and repeated mechanical response. Consequently, the Pristine, Aged, and Used sensors demonstrated comparable thermal performance, supporting their suitability for long-term wearable sensing applications requiring reliable and reproducible measurements under varying temperature conditions.
3.1.6. Repeatability Test
To assess the repeatability of the sensors, a single subject performed normal walking for 15 s, twice a week for 4 weeks-once in the morning and once in the afternoon on different days, with three trials per session.
The repeatability of the capacitance sensor was evaluated under Pristine, Aged and Used conditions using repeated walking trials conducted over four weeks. The sensor demonstrated excellent absolute reliability across all conditions, with overall coefficients of variation (CV) ranging from 3.65% to 4.23%, which are below the commonly accepted 5% threshold for excellent repeatability. Similarly, pointwise gait-cycle analysis yielded comparable CV values across conditions, while the standard error of measurement (SEM) and minimal detectable change (MDC95) indicated low measurement error and good measurement precision. Morning-afternoon agreement analysis further revealed minimal systematic bias and narrow limits of agreement, suggesting that sensor measurements remained stable regardless of the time of data collection.

Table 2.
Repeatability and Reliability Metrics of the Sensor Under Different Conditions.
| Sensor Condition | Mean ± SD | CV(%) | SEM | MDC95 | Morning-Afternoon Bias |
|---|---|---|---|---|---|
| Pristine | 99.58 ± 3.69 | 3.71 | 3.88 | 10.76 | −0.05 |
| Aged | 99.74 ± 3.64 | 3.65 | 3.54 | 9.81 | −0.21 |
| Used | 98.89 ± 4.18 | 4.23 | 3.88 | 10.76 | −1.78 |
A linear mixed-effects model was fitted to evaluate the effect of sensor condition (Pristine, Aged, and Used) on the mean capacitance response while accounting for repeated measurements across weeks. The Pristine condition served as the reference category. Results indicated that neither the Aged condition ( nor the Used condition ( differed significantly from the Pristine condition. Furthermore, the estimated variance attributable to week-to-week variation was negligible ( = 0.001), suggesting high temporal stability of the sensor measurements. Overall, the findings indicate that sensor aging and repeated use did not significantly influence the capacitance response.
3.1.7. SEM-EDS
Scanning electron microscopy and energy-dispersive X-ray spectroscopy (SEM-EDS) was performed on the conductive fabric, using a unit from JEOL JSM-6000 series. SEM micrographs in Figure 12I show the woven nature of the conductive material. These micrographs further support the conductive nature of the sample since it can be viewed clearly without the need for extra Au coating.
EDS analysis confirms that the conductive fabric in all conditions is predominantly composed of Cu and Ni, indicating that the metallic network remains structurally intact from Pristine to Aged and Used conditions (Figure 12II). The Pristine sample exhibits strong and sharp Cu and Ni peaks with minimal oxygen, reflecting a clean, compact metallic surface with negligible oxidation. After aging, a noticeable increase in oxygen intensity is observed while Cu and Ni remain dominant, indicating the formation of a superficial oxide layer without significant loss of metallic content. In the Used sample, oxygen increases further, and a Si appears, suggesting combined oxidative degradation and environmental or substrate-related contamination due to mechanical wear.
These compositional changes correlate directly with SEM observations, where the Pristine surface appears smooth and continuous, the Aged sample shows minimal surface degradation suggesting some oxide formation, and the Used sample exhibits more pronounced microstructural irregularities and partial coating degradation. The different behavior of Ni and Cu can be attributed to their oxidation mechanisms: Ni forms a more stable and protective NiO layer that slows further degradation, whereas Cu forms less protective oxides (Cu2O/CuO) that are more susceptible to continued oxidation and surface disruption. Overall, the results indicate progressive surface oxidation from Pristine to Used conditions, but the persistence of strong Cu and Ni peaks demonstrates that degradation is largely superficial and the conductive framework remains fundamentally preserved.
3.2. Normal Walk
3.2.1. Gait Segments
Table 3 summarizes the sensor kinematic combinations that demonstrated strong to very strong waveform similarity across the six gait phases. During the loading phase (0–10%), Sh2, Sh4, Th2 and Th3 consistently exhibited strong to very strong waveform similarity with reference to pelvic rotation, hip flexion and hip adduction kinematics, while Sh3 showed strong waveform similarity with pelvis tilt and Sh2 and Th2 demonstrated strong to very strong waveform similarity with pelvis ty. Conversely, Sh2, Th2 and Th3 also demonstrated very strong inverse waveform similarity with pelvic tilt, pelvic list, pelvic anterior-posterior (tx), knee angle, ankle angle, and subtalar angle (Table S4). Despite the inverse relationship, these variables also exhibited consistently low RMSE and DTW values, indicating that the sensor outputs followed the reference waveforms with high temporal consistency but in opposite directions.
For the midstance phase (10–40%), the strongest waveform similarity was primarily associated with pelvis rotation, hip flexion and knee angle. Sh2 was the sensor most frequently identified among the highest performing locations. Sh3 also demonstrated strong agreement for pelvis tilt, while Sh3 and Th2 demonstrated very strong inverse waveform similarity with pelvis ty with higher RMSE and larger DTW distances, reflecting opposite waveform directions (Table S5).
Furthermore, in terminal stance (40–50%), Sh3 consistently demonstrated strongest agreement with lower limb kinematics, exhibiting very strong waveform similarity criteria. High waveform similarity was observed for pelvis tilt, pelvis list, pelvis tx, knee angle, ankle angle, and subtalar angle, while also showing very strong inverse waveform similarity with pelvic tilt, pelvic rotation, pelvis (ty and tz), hip flexion and hip adduction (Table S3). Similarly, Sh4 and Th2–Th4 demonstrated very strong waveform similarity with ankle angle and subtalar angles, whereas Th1 exhibited very strong waveform similarity with pelvis tz, hip adduction and hip rotation. Positive waveform similarities were associated with low RSME and low DTW distances, in contrast the inverse relationships exhibited higher RMSE values and DTW distances (Table S6), reflecting opposite waveform directions.
In the pre-swing phase (50–60%), strong waveform similarity was concentrated in pelvis rotation, pelvis ty, pelvis tz, hip adduction, hip rotation, ankle angle, and subtalar angle. Sh1, Sh2, Sh4, Th1, Th3 and Th4 were the sensor locations most frequently associated with these kinematic variables. In Table S7, Sh4 shows very strong inverse waveform similarity with pelvic tilt, pelvic list, pelvis tx and knee angle.
Similarly, the mid-swing phase (60–75%) Sh1, Sh2 and Th1 demonstrated strong to very strong waveform similarity for pelvis tilt, pelvis rotation, pelvis translations (tx, ty, and tz), hip flexion, hip adduction, knee angle, ankle angle and subtalar angle. Additionally, Sh4 and Th4 exhibited very strong waveform similarity with hip adduction, ankle angle, and subtalar angle, while also showing very strong inverse waveform similarity with pelvis tilt, pelvis tx and pelvis ty, hip flexion, knee angle and ankle angle (Table S8).
By contrast, terminal swing phase (75–100), was characterized by fewer sensor kinematic combinations meeting the strong and very strong waveform similarity criteria than preceding gait phases. Sh1 consistently demonstrated very strong waveform similarity with pelvis tilt, pelvic list and hip rotation, while Sh4 exhibited very strong waveform similarity with hip adduction and very strong inverse waveform similarity with pelvis tilt, pelvis list, and hip rotation, and knee angle (Table S9). Nevertheless, strong to very strong waveform similarity remained evident for pelvis tilt, pelvis rotation, pelvis tx, pelvis tz, hip flexion, hip adduction, hip rotation, knee angle, ankle angle, and subtalar angle.
Overall, the results indicate that waveform similarity between the wearable sensors and reference kinematic variables varied across gait phases and sensor locations, with terminal stance demonstrating the greatest number of strong to very strong sensor kinematic combinations. The complete waveform plots comparisons between the OpenCap kinematic variables and the shank and thigh capacitive sensing band signals for all gait segments are provided in the Supplementary Materials (Figures S1–S6).
3.2. Simulations of Hemiplegic, Spastic and Parkinson’s Gait
Three healthy participants were instructed to simulate pathological gait patterns, with one participant each mimicking hemiplegic, spastic, and Parkinsonian gait. The simulated gait patterns were then compared with each participant’s own normal walking gait, which served as the baseline reference. To ensure accurate representation of each gait pattern, the participant is a physical therapy assistant who works under the direct supervision of a physical therapist in a local hospital. The participant was instructed to walk along a predetermined distance while wearing the capacitive sensing band and mimic the characteristics movement patterns of hemiplegic, Parkinsonian, and spastic gait based on their clinical presentation. The simulated gait patterns were performed to replicate the characteristic biomechanical features of each pathological gait and were not intended to represent actual patients with the corresponding neurological disorders.
Hemiplegic gait commonly results from stroke or traumatic brain injury and affects one side of the body. It is characterized by muscle weakness, spasticity, and impaired motor control of the affected limb. During the swing phase, the affected leg typically exhibits circumduction to facilitate floor clearance, accompanied by reduced knee and ankle flexion, foot dragging, and often demonstrate forefoot or toe first contact instead of a normal heel strike, reduced stance on the affected limb, and impaired gait symmetry [3,51,52].
Parkinson’s gait is caused by degeneration of dopaminergic neurons and is characterized by bradykinesia, shuffling steps, postural instability, and freezing of gait. Patients demonstrate shortened stride length, increased double support time, reduced joint range of motion at the hip, knee and ankle, and diminished ankle power generation during the stance and pre-swing phases [3,52,53].
Spastic gait is commonly observed in individuals with cerebral palsy and hereditary spastic paraplegia and is characterized by increased muscle tone and lower limb stiffness. Typical features include leg dragging, scissoring gait, crouched posture, toe walking, and limited joint extension. Compared with healthy individuals, spastic gait demonstrates reduced walking speed, cadence, stride length, and lower limb range [52,54,55].
Table 4.
Percentage of abnormality threshold detected by each shank (Sh1–Sh4) and thigh (Th1–Th4) sensor during hemiplegic, spastic and Parkinson’s gait relative to normal walking, together with the corresponding RMSE and MAE values.
Table 4.
Percentage of abnormality threshold detected by each shank (Sh1–Sh4) and thigh (Th1–Th4) sensor during hemiplegic, spastic and Parkinson’s gait relative to normal walking, together with the corresponding RMSE and MAE values.
| Pathological Gait | Sensors | % of Abnormality Threshold | RMSE | MAE |
|---|---|---|---|---|
| Hemiplegic vs. Normal Walk | Sh1 | 5 | 0.097 | 0.071 |
| Sh2 | 23 | 0.134 | 0.118 | |
| Sh3 | 0 | 0.149 | 0.123 | |
| Sh4 | 9 | 0.138 | 0.108 | |
| Th1 | 10 | 0.172 | 0.145 | |
| Th2 | 6 | 0.194 | 0.171 | |
| Th3 | 0 | 0.148 | 0.130 | |
| Th4 | 0 | 0.142 | 0.124 | |
| Spastic Gait vs. Normal Walk | Sh1 | 0 | 0.099 | 0.079 |
| Sh2 | 0 | 0.187 | 0.166 | |
| Sh3 | 14 | 0.181 | 0.141 | |
| Sh4 | 40 | 0.188 | 0.142 | |
| Th1 | 0 | 0.129 | 0.108 | |
| Th2 | 9 | 0.000 | 0.000 | |
| Th3 | 27 | 0.207 | 0.149 | |
| Th4 | 10 | 0.137 | 0.096 | |
| Parkinson’s vs. Normal Walk | Sh1 | 24 | 0.176 | 0.146 |
| Sh2 | 14 | 0.121 | 0.104 | |
| Sh3 | 0 | 0.174 | 0.124 | |
| Sh4 | 0 | 0.101 | 0.085 | |
| Th1 | 0 | 0.114 | 0.091 | |
| Th2 | 8 | 0.145 | 0.113 | |
| Th3 | 0 | 0.163 | 0.144 | |
| Th4 | 0 | 0.152 | 0.125 |
The percentage of abnormality threshold varied across gait conditions and sensor locations. For hemiplegic gait, Sh2 exhibited the highest abnormality threshold (23%), followed by Th1 (10%), Sh4 (9%) and Th2 (6%), whereas Sh3, Th3, and Th4 showed no detected abnormalities. For spastic gait, Sh4 demonstrated the highest abnormality threshold (40%), followed by Th3 (27%), Sh3 (14%), Th4 (10%), and Th2 (9%), while Sh1, Sh2, and Th1 showed no abnormalities. For Parkinsonian gait, Sh1 recorded the highest abnormality threshold (24%), followed by Sh2 (14%) and Th2 (8%), whereas Sh3, Sh4, Th1, Th3, and Th4 exhibited no detected abnormalities. RMSE values ranged from 0 to 0.207, while MAE values ranged from 0.000 to 0.171 across gait conditions and sensor locations. Comparison plots between normal gait and the simulated gait patterns, including hemiplegic, spastic, and Parkinsonian gait, are provided in the Supplementary Materials (Figures S7–S9).
4. Discussion
4.1. Comparison of Capacitive Sensing Band to OpenCap Kinematics in Normal Walking
During the loading phase (0–10% of the gait cycle), the posterior shank (Sh2, tibial region), posterior thigh (Th2, hamstring), anterior shank (Sh4, gastrocnemius region), and posterior thigh (Th3, hamstrings) sensors demonstrated very strong waveform similarity with pelvis and hip kinematics, achieving correlation of r = 0.926 to 0.999 and DTW distances (0.011 to 0.108) (Table 3). These findings agree with previous IMU validation studies, which reported strong to excellent agreement (r > 0.75–0.950) and low RMSE between wearable sensor measurements and reference gait kinematics. Likewise, benchmarking studies and systematic reviews have demonstrated good overall agreement between lower limb wearable sensors and optical motion capture systems [56,57,58,59]. The observed agreement is consistent because weight acceptance requires coordinated activation of the quadriceps, tibialis anterior, hamstrings and gastrocnemius, which stabilize the lower limb and control foot contact during early stance [60]. This helps explain why sensors placed over the anterior tibia and posterior thigh showed the strongest agreement with pelvis and hip kinematics, since these regions are positions over the muscles that are mechanically engaged during early stance [61].
Furthermore, the posterior shank sensor (Sh2, gastrocnemius), consistently demonstrated strong agreement with lower limb kinematics, exhibiting very strong waveform similarity with pelvis rotation, hip flexion and knee angle while shank 3 also showed very strong similarity with pelvic tilt during midstance. This agreement achieved very strong correlation (r = 0.922–0.973), accompanied by low RMSE (0.227–0.389) and low DTW distances (3.234–5.086) (Table 3). A study of clothing and body mounted comparisons also show that lower shank signals preserve very high waveform correlation with coefficients around 0.97–0.98, higher than waist signals [62]. The strong agreement observed in the shank region is expected in this phase because midstance requires the body to be supported by a single limb while gastrocnemius muscle progresses forward. This supports the finding that gastrocnemius muscle (Sh2) is strongly associated with knee, hip and pelvis during the critical mid-to-late stance of the gait cycle [63].
Terminal stance is the phase when the gastrocnemius contributes strongly to push off and forward progression [63]. During this phase, the posterior shank sensor (Sh3, gastrocnemius region) consistently demonstrated the strongest agreement with lower limb kinematics exhibiting waveform similarity with pelvic list, pelvis tx, knee angle, ankle angle and subtalar angle. Similarly, the posterior shank sensor (Sh4, tibial region) and the thigh sensors (Th2–Th4) demonstrated very strong waveform similarity with ankle and subtalar angles, whereas Th1 exhibited very strong waveform similarity with pelvic tz, hip adduction and hip rotation with correlations r = 0.908 to 0.999 associated with low RMSE and low DTW distances. According to Lenhart et.al [64], terminal stance gastrocnemius stimulation also contributes to hip flexion, knee flexion, and posterior pelvic tilt. These findings support the strong waveform agreement observed between a posterior shank sensor over gastrocnemius and pelvic tilt, pelvic rotation, hip flexion, and knee angle [65,66]. This also agrees with some wearable literature showing that shank and thigh placements are among the most informative lower limb sensor locations, while knee and ankle kinematics generally show the strongest agreement with reference motion capture across IMU and OpenCap based studies [59,67,68]. Moreover, different studies observed posterior shank sensors over gastrocnemius and thigh sensors are sites for capturing terminal stance, especially the propulsion related ankle and subtalar pattern and hip, knee, and pelvic behavior [56,63,69,70].
The pre-swing phase is a critical transition between stance and swing, characterized by rapid limb unloading and push off propulsion that require precise lower limb coordination and accurate tracking of joint movement [43,71]. During this phase, sensors positioned at the anterior shank (Sh1, tibial region), posterior shank (Sh2, gastrocnemius region), anterior shank (Sh4), anterior thigh (Th1 and Th4, quadriceps), and posterior thigh (Th3, hamstrings) demonstrated strong to very strong waveform similarity with pelvis rotation, pelvis translations (ty and tz), hip adduction, hip rotation, ankle angle, and subtalar angle. This sensor to kinematic relationships exhibited very strong correlations (r= 0.913–0.999), accompanied by low RMSE values and DTW distances indicating high waveform agreement. These findings are consistent with previous studies that gastrocnemius provides most of the propulsive energy required to initiate swing, while increased hamstring activation during the stance to swing transition supports limb advancement [50,72]. Furthermore, the coordinated actions of the gastrocnemius and hamstrings contribute to knee flexion and swing initiation, providing a biomechanical basis for the strong association between posterior lower limb sensor deformation and pelvic rotation, pelvic translations, and ankle related kinematics during pre-swing [73,74].
During mid-swing phase (60–75%), strong to very strong waveform similarity is identified for pelvis tilt, pelvis rotation, pelvis translations (tx, ty, tz), hip flexion, hip adduction, knee angle and subtalar angle. Anterior shank (Sh1, tibial), posterior shank (Sh2, gastrocnemius muscle), anterior (Th1, quadriceps), posterior thigh (Th3, hamstring) consistently demonstrated strong agreement with multiple kinematic variables during this phase. These findings are consistent with the previous studies reporting that tibialis anterior and gastrocnemius exhibit strong agreement with gait kinematics during mid-swing, with correlations coefficients as high as 0.97 [75]. Moreover, the strong to very strong similarity observed for hip flexion and knee angle is consistent with evidence that sagittal plane kinematics are the most reliable and repeatable measures in clinical gait analysis [56].
In terminal swing (75–100% of the gait cycle), the capacitance sensors demonstrated a very strong to near perfect waveform with lower limb kinematics (r = 0.906–0.994). The strongest associations were observed for Sh1 (anterior shank, tibial region) with pelvis tilt, pelvis list and hip rotation; Sh3 (posterior shank, gastrocnemius) with hip flexion; Sh4 (anterior shank, tibial region) with hip adduction; Th1 (anterior thigh, quadriceps region) with pelvis list; Th2 (posterior thigh, hamstring region) with pelvis tz, and Th3 (posterior thigh, hamstring region) with hip rotation. This agreement is accompanied by consistently low RMSE and DTW values, indicating close agreement between the capacitance sensors and lower limb kinematics. These findings are consistent with previous studies showing that gastrocnemius and thigh muscles exhibit distinct expansion and contraction patterns that correspond closely to the biomechanical events of the gait cycle [3]. Furthermore, the placement of the anterior thigh and the posterior shank (gastrocnemius) in the present study (Th1 and Sh3) is consistent with the sensor locations used in the previous study, further supporting the observed agreement between capacitance sensor outputs and gait kinematics [3].
4.2. Capacitance Sensor Response in Normal Gait and Simulated Pathological Gait
Hemiplegic gait. Compared with normal walking, abnormal sensor responses were primarily observed over the gastrocnemius (posterior shank), tibialis anterior (anterior shank, quadriceps (anterior thigh), and hamstring (posterior thigh) sensor locations, whereas the remaining sensors positions exhibited responses comparable to those observed during normal gait. Hemiplegic gait is characterized by circumduction and foot dragging, which results from muscle weakness and impaired motor control on the affected side. A previous study has reported that although the affected leg exhibits reduced muscle strength, the thigh muscle often demonstrates increased activity as they compensate for foot dragging and facilitate limb advancement during walking. This finding is consistent with the present study, in which quadriceps and hamstrings sensors exhibited greater deviations from normal walking. In addition, weakness of the calf muscles, particularly the gastrocnemius is a common feature of hemiplegic gait and contributes to diminished push off and altered contraction/relaxation patterns during the gait cycle. These neuromuscular impairments likely explain the abnormal responses detected by the gastrocnemius sensor compared with normal walking [3].
Spastic gait. The greatest deviations from normal walking were detected in sensors positioned over the tibialis anterior (anterior shank), hamstring (posterior thigh), gastrocnemius (posterior shank) and quadriceps (anterior thigh) muscles. The significant deviations in the tibialis anterior, gastrocnemius, and thigh muscles is because of the scissoring or crouched gait of a spastic gait [52]. Furthermore, because the thigh muscles (quadriceps/hamstrings) are responsible for knee flexion and extension, the limited joint extension and lower limb stiffness would naturally cause the greatest deviations [3]. A study also confirmed that muscles in the lower limb contract and expand in response to changes in movement and the extreme tension of spasticity would trigger abnormalities in the sensors over these muscle groups [3].
Parkinsonian gait. Unlike hemiplegic and spastic gait, abnormal sensor responses were limited to tibialis anterior (anterior shank), gastrocnemius (posterior shank), and hamstring (posterior thigh) muscles, while the remaining sensors demonstrated responses patterns similar to those observed during normal walking. Unlike in normal walk where muscles alternate between relaxation and tightness, in Parkinsonian gait thigh muscles are constantly tight and demonstrate a consistently positive amount of change or constant expansion. This lack of a normal relaxation phase explains the abnormal sensor responses observed in the hamstrings and shank muscles. Moreover, the concentration of movement at the lower limb segments (shuffling) explains why the abnormalities were limited to the shank and hamstring sensor location rather than affecting the entire thigh [3].
5. Conclusions
The study successfully developed a modular, low cost, multi-channel capacitive sensing band integrated with OpenCap for gait monitoring. The system utilizes repositionable conductive fabric electrodes that detect variations in muscle deformation and skin tissue properties during movement. Extensive characterization including linearity (R2 > 0.98, creep (<0.4%), hysteresis (<3%) and repeatability (CV < 5%) demonstrated that the sensors maintain high stability and reliability regardless of aging or repeated mechanical use.
Furthermore, the comparison of sensing bands to OpenCap kinematics showed strong to very strong waveform similarity using functional correlation across all gait phases, particularly during terminal stance showing near perfect peak correlation (r > 0.999). The device is also capable of identifying simulated pathological gait like hemiplegic, spastic and Parkinsonian with abnormality thresholds reaching 40% of gait cycle points across various muscle groups. While these results demonstrate the system’s sensitivity to biomechanical deviations, such simulations may not fully replicate the complex physiological variables found in actual clinical populations, including involuntary tremors, muscle atrophy or spasticity-induced changes in tissue dielectric properties which remain for future validation.
Future work should focus on validating the system in individuals with neurological and musculoskeletal disorders to establish its clinical stability. In addition, future studies should explore more advanced AI based algorithms capable of providing real time gait analysis. Finally, evaluating the system in a larger and more diverse population with varying ages, body mass indices and physical characteristics would provide further insight into the relationship between capacitance measurements and lower limb kinematics.
6. Patents
A patent application related to the modular low-cost multi-channel capacitive sensing band for gait monitoring in this manuscript has been filed through the Knowledge and Technology Transfer Office (KTTO) of Mindanao State University-Iligan Institute of Technology. The application is currently pending before the relevant intellectual property.
Supplementary Materials
The following supporting information can be downloaded at the website of this paper posted on Preprints.org, Table S1: Technical Specification of Motion Capture System (OpenCap); Table S2: Summary by Anatomical Plane; Table S3: Definition of Selected Kinematic Variables; Table S4: Waveform Similarity during Loading Phase (0–10%); Table S5: Waveform Similarity during Midstance (10–40%); Table S6: Waveform Similarity during Terminal (40–50%); Table S7: Waveform Similarity during Pre-swing Phase (50–60%); Table S8: Waveform Similarity during Mid-swing Phase (60–75%); Table S9: Waveform Similarity during Terminal Swing Phase (75–100%); Figure S1: Waveform Comparison (0–10%); Figure S2: Waveform Comparison (10–40%); Figure S3: Waveform Comparison (40–50%); Figure S4: Waveform Comparison (50–60%); Figure S5: Waveform Comparison (60–75%); Figure S6: Waveform Comparison (75–100%); Figure S7. Normal Gait Vs Simulated Hemiplegic Gait; Figure S8. Normal Gait Vs Simulated Spastic Gait; Figure S9. Normal Gait Vs Simulated Parkinsonian Gait.
Author Contributions
Conceptualization: C.G.G.A. and G.J.P.; methodology: C.G.A., A.C.P.P. and G.J.P.; software: C.G.G.A., S.S.E., A.C.P.P. and G.J.P.; validation: N.T.P., C.J.G.A., N.L.B.S., A.C.P.P. and G.J.P.; formal analysis: C.G.G.A., A.C.P.P., N.T.P. and G.J.P.; investigation: C.G.G.A., S.S.E., N.T.P., C.J.G.A., N.L.B.S., A.C.P.P. and G.J.P.; resources: C.G.G.A., S.S.E., N.T.P., C.J.G.A., N.L.B.S., A.C.P.P. and G.J.P.; data curation: C.G.G.A., S.S.E., A.C.P.P. and G.J.P.; writing—original draft preparation: C.G.G.A., N.T.P., A.C.P.P. and G.J.P.; writing—review and editing: C.G.G.A., S.S.E., N.T.P., C.J.G.A., N.L.B.S., A.C.P.P. and G.J.P.; visualization: C.G.G.A., S.S.E., A.C.P.P. and G.J.P.; supervision: N.T.P., A.C.P.P. and G.J.P.; project administration: S.S.E., N.T.P., C.J.G.A., N.L.B.S. and G.J.P.; funding acquisition: C.G.G.A., N.T.P., C.J.G.A., N.L.B.S. and G.J.P. All authors have read and agreed to the published version of the manuscript.
Funding
This research was funded by the Office of the Vice Chancellor for Research and Enterprise (OVCRE) of Mindanao State University-Iligan Institute of Technology (MSU-IIT) (S.O. No. 00242-IIT S. of 2025 and S.O. No. 00369-IIT S. of 2026).
Institutional Review Board Statement
The study was conducted in accordance with the Declaration of Helsinki, and approved by the Institutional Review Board (or Ethics Committee) of Mindanao State University-Iligan Institute of Technology (MSU-IIT), University Ethics Review Board(UERB) (protocol code UERB-2025-00562 and 01.01.2025).
Informed Consent Statement
Informed consent was obtained from all subjects involved in the study.
Data Availability Statement
Data is contained within the article.
Acknowledgments
Cachey Girly G. Alipala acknowledges the Department of Science and Technology-Accelerated Science and Technology Human Resource Development Program (DOST-ASTHRDP) for the scholarship grant. The authors acknowledge the support of Mindanao State University-Iligan Institute of Technology.
Conflicts of Interest
The authors declare no conflicts of interest.
References
- Saboor, A.; Kask, T.; Kuusik, A.; Alam, M.M.; Le Moullec, Y.; Niazi, I.K.; Zoha, A.; Ahmad, R. Latest Research Trends in Gait Analysis Using Wearable Sensors and Machine Learning: A Systematic Review. IEEE Access 2020, 8, 167830–167864. [Google Scholar] [CrossRef]
- Singh, R.; Chaudhary, H.; Singh, A.K. A NOVEL GAIT-INSPIRED FOUR-BAR LOWER LIMB EXOSKELETON TO GUIDE THE WALKING MOVEMENT. J. Mech. Med. Biol. 2019, 19, 1950020. [Google Scholar] [CrossRef]
- Huang, F.; Zhu, Y.; Shi, L.; Teo, M.Y.; Kandasamy, S.; Aw, K. Capacitive Stretch Sensors for Knee Motion and Muscle Activity Tracking for Gait Analysis. Sens. Actuators A Phys. 2025, 390, 116574. [Google Scholar] [CrossRef]
- Samarentsis, A.; Makris, G.; Spinthaki, S.; Christodoulakis, G.; Tsiknakis, M.; Pantazis, A. A 3D-Printed Capacitive Smart Insole for Plantar Pressure Monitoring. Sensors 2022, 22, 9725. [Google Scholar] [CrossRef] [PubMed]
- Das, P.; Skaf, D.; Rose, L.; Motaghedi, F.; Carmichael, T.; Rondeau-Gagné, S.; Ahamed, M. Gait Pattern Analysis: Integration of a Highly Sensitive Flexible Pressure Sensor on a Wireless Instrumented Insole. Sensors 2024, 24, 2944. [Google Scholar] [CrossRef] [PubMed]
- Aqueveque, P.; Germany, E.; Osorio, R.; Pastene, F. Gait Segmentation Method Using a Plantar Pressure Measurement System with Custom-Made Capacitive Sensors. Sensors 2020, 20, 656. [Google Scholar] [CrossRef] [PubMed]
- Ho, J.; Kim, Y.; Min, S. Customized Textile Capacitive Insole Sensor for Center of Pressure Analysis. Sensors 2022, 22, 9390. [Google Scholar] [CrossRef] [PubMed]
- Jin, H.; Wang, W.; Zhang, G.; Chen, S.; Tong, Y.; Lu, D.; Li, J.; He, L.; Tang, X. Advances in Flexible Wearable Pressure/Strain Sensors for Motion Monitoring in Orthopaedic Sports Medicine. J. Orthop. Transl. 2026, 57, 101084. [Google Scholar] [CrossRef] [PubMed]
- Min, Y.-S.; Jung, T.-D.; Lee, Y.-S.; Kwon, Y.; Kim, H.; Kim, H.; Lee, J.; Park, E. Biomechanical Gait Analysis Using a Smartphone-Based Motion Capture System (OpenCap) in Patients with Neurological Disorders. Bioengineering 2024, 11, 911. [Google Scholar] [CrossRef] [PubMed]
- Mackey, A.H.; Lobb, G.L.; Walt, S.E.; Stott, N.S. Reliability and Validity of the Observational Gait Scale in Children with Spastic Diplegia. Dev. Med. Child Neuro 2003, 45, 4–11. [Google Scholar] [CrossRef]
- Jayaraman, A.; O’Brien, M.K.; Madhavan, S.; Mummidisetty, C.K.; Roth, H.R.; Hohl, K.; Tapp, A.; Brennan, K.; Kocherginsky, M.; Williams, K.J.; et al. Stride Management Assist Exoskeleton vs. Functional Gait Training in Stroke: A Randomized Trial. Neurology 2019, 92, e263–e273. [Google Scholar] [CrossRef] [PubMed]
- Van Lith, B.J.H.; Kerstens, H.C.J.W.; Van Den Bemd, L.A.C.; Der Sanden, M.W.G.N.; Weerdesteyn, V.; Smeets, R.J.E.M.; Fheodoroff, K.; Van De Warrenburg, B.P.C.; Geurts, A.C.H. Experienced Complaints, Activity Limitations and Loss of Motor Capacities in Patients with Pure Hereditary Spastic Paraplegia: A Web-Based Survey in the Netherlands. Orphanet J. Rare Dis. 2020, 15, 64. [Google Scholar] [CrossRef] [PubMed]
- Feigin, V.L.; Abajobir, A.A.; Abate, K.H.; Abd-Allah, F.; Abdulle, A.M.; Abera, S.F.; Abyu, G.Y.; Ahmed, M.B.; Aichour, A.N.; Aichour, I.; et al. Global, Regional, and National Burden of Neurological Disorders during 1990–2015: A Systematic Analysis for the Global Burden of Disease Study 2015. Lancet Neurol. 2017, 16, 877–897. [Google Scholar] [CrossRef] [PubMed]
- Chau, T.; Young, S.; Redekop, S. Managing Variability in the Summary and Comparison of Gait Data. J. Neuroeng. Rehabil. 2005, 2, 22. [Google Scholar] [CrossRef] [PubMed]
- Hulleck, A.A.; Menoth Mohan, D.; Abdallah, N.; El Rich, M.; Khalaf, K. Present and Future of Gait Assessment in Clinical Practice: Towards the Application of Novel Trends and Technologies. Front. Med. Technol. 2022, 4, 901331. [Google Scholar] [CrossRef] [PubMed]
- Salchow-Hömmen, C.; Skrobot, M.; Jochner, M.C.E.; Schauer, T.; Kühn, A.A.; Wenger, N. Review—Emerging Portable Technologies for Gait Analysis in Neurological Disorders. Front. Hum. Neurosci. 2022, 16, 768575. [Google Scholar] [CrossRef] [PubMed]
- De Miguel, K.; Brunete, A.; Hernando, M.; Gambao, E. Home Camera-Based Fall Detection System for the Elderly. Sensors 2017, 17, 2864. [Google Scholar] [CrossRef] [PubMed]
- Wade, L.; Needham, L.; McGuigan, P.; Bilzon, J. Applications and Limitations of Current Markerless Motion Capture Methods for Clinical Gait Biomechanics. PeerJ 2022, 10, e12995. [Google Scholar] [CrossRef] [PubMed]
- Wang, X.; Yu, H.; Kold, S.; Rahbek, O.; Bai, S. Wearable Sensors for Activity Monitoring and Motion Control: A Review. Biomim. Intell. Robot. 2023, 3, 100089. [Google Scholar] [CrossRef]
- Hutabarat, Y.; Owaki, D.; Hayashibe, M. Recent Advances in Quantitative Gait Analysis Using Wearable Sensors: A Review. IEEE Sens. J. 2021, 21, 26470–26487. [Google Scholar] [CrossRef]
- Derawi, M.O.; Bours, P.; Holien, K. Improved Cycle Detection for Accelerometer Based Gait Authentication. In Proceedings of the 2010 Sixth International Conference on Intelligent Information Hiding and Multimedia Signal Processing; IEEE: Darmstadt, Germany, 2010; pp. 312–317. [Google Scholar]
- Dias, D.; Paulo Silva Cunha, J. Wearable Health Devices—Vital Sign Monitoring, Systems and Technologies. Sensors 2018, 18, 2414. [Google Scholar] [CrossRef] [PubMed]
- Dobkin, B.H.; Martinez, C. Wearable Sensors to Monitor, Enable Feedback, and Measure Outcomes of Activity and Practice. Curr. Neurol. Neurosci. Rep. 2018, 18, 87. [Google Scholar] [CrossRef] [PubMed]
- De Luca, C.J.; Kuznetsov, M.; Gilmore, L.D.; Roy, S.H. Inter-Electrode Spacing of Surface EMG Sensors: Reduction of Crosstalk Contamination during Voluntary Contractions. J. Biomech. 2012, 45, 555–561. [Google Scholar] [CrossRef] [PubMed]
- Rescio, G.; Sciurti, E.; Giampetruzzi, L.; Carluccio, A.M.; Francioso, L.; Leone, A. Preliminary Study on Wearable Smart Socks with Hydrogel Electrodes for Surface Electromyography-Based Muscle Activity Assessment. Sensors 2025, 25, 1618. [Google Scholar] [CrossRef] [PubMed]
- Boyer, M.; Bouyer, L.; Roy, J.-S.; Campeau-Lecours, A. Reducing Noise, Artifacts and Interference in Single-Channel EMG Signals: A Review. Sensors 2023, 23, 2927. [Google Scholar] [CrossRef] [PubMed]
- Varghese, R.J.; Pizzi, M.; Kundu, A.; Grison, A.; Burdet, E.; Farina, D. Design, Fabrication and Evaluation of a Stretchable High-Density Electromyography Array. Sensors 2024, 24, 1810. [Google Scholar] [CrossRef] [PubMed]
- Campanini, I.; Merlo, A.; Disselhorst-Klug, C.; Mesin, L.; Muceli, S.; Merletti, R. Fundamental Concepts of Bipolar and High-Density Surface EMG Understanding and Teaching for Clinical, Occupational, and Sport Applications: Origin, Detection, and Main Errors. Sensors 2022, 22, 4150. [Google Scholar] [CrossRef] [PubMed]
- Kataoka, Y.; Saito, Y.; Takeda, R.; Ishida, T.; Tadano, S.; Suzuki, T.; Nakamura, K.; Nakata, A.; Osuka, S.; Yamada, S.; et al. Evaluation of Lower-Limb Kinematics during Timed Up and Go (TUG) Test in Subjects with Locomotive Syndrome (LS) Using Wearable Gait Sensors (H-Gait System). Sensors 2023, 23, 687. [Google Scholar] [CrossRef] [PubMed]
- Galli, V.; Ahmadizadeh, C.; Kunz, R.; Menon, C. Textile-Based Body Capacitive Sensing for Knee Angle Monitoring. Sensors 2023, 23, 9657. [Google Scholar] [CrossRef] [PubMed]
- Zheng, E.; Chen, B.; Wei, K.; Wang, Q. Lower Limb Wearable Capacitive Sensing and Its Applications to Recognizing Human Gaits. Sensors 2013, 13, 13334–13355. [Google Scholar] [CrossRef] [PubMed]
- Chowdhury, R.; Reaz, M.; Ali, M.; Bakar, A.; Chellappan, K.; Chang, T. Surface Electromyography Signal Processing and Classification Techniques. Sensors 2013, 13, 12431–12466. [Google Scholar] [CrossRef] [PubMed]
- Zheng, E.; Wang, L.; Wei, K.; Wang, Q. A Noncontact Capacitive Sensing System for Recognizing Locomotion Modes of Transtibial Amputees. IEEE Trans. Biomed. Eng. 2014, 61, 2911–2920. [Google Scholar] [CrossRef] [PubMed]
- Hsu, W.-C.; Sugiarto, T.; Lin, Y.-J.; Yang, F.-C.; Lin, Z.-Y.; Sun, C.-T.; Hsu, C.-L.; Chou, K.-N. Multiple-Wearable-Sensor-Based Gait Classification and Analysis in Patients with Neurological Disorders. Sensors 2018, 18, 3397. [Google Scholar] [CrossRef] [PubMed]
- Carcreff, L.; Gerber, C.; Paraschiv-Ionescu, A.; De Coulon, G.; Newman, C.; Armand, S.; Aminian, K. What Is the Best Configuration of Wearable Sensors to Measure Spatiotemporal Gait Parameters in Children with Cerebral Palsy? Sensors 2018, 18, 394. [Google Scholar] [CrossRef] [PubMed]
- Chheng, C.; Wilson, D. Abnormal Gait Detection Using Wearable Hall-Effect Sensors. Sensors 2021, 21, 1206. [Google Scholar] [CrossRef] [PubMed]
- Xu, D.; Zhang, Z.; Crea, S.; Vitiello, N.; Wang, Q. Adaptive Estimation of Continuous Gait Phase Based on Capacitive Sensors. Wearable Technol. 2022, 3, e11. [Google Scholar] [CrossRef] [PubMed]
- Madhiha, Z.A.; Mazumder, A.; Hiam, S.M. A Cost-Effective, Stand-Alone, and Real-Time TinyML-Based Gait Diagnosis Unit Aimed at Lower-Limb Robotic Prostheses and Exoskeletons. arXiv 2024, arXiv:2411.08474. [Google Scholar] [CrossRef]
- Prasanth, H.; Caban, M.; Keller, U.; Courtine, G.; Ijspeert, A.; Vallery, H.; Zitzewitz, J. Wearable Sensor-Based Real-Time Gait Detection: A Systematic Review. Sensors 2021, 21, 2727. [Google Scholar] [CrossRef] [PubMed]
- Souri, H.; Banerjee, H.; Jusufi, A.; Radacsi, N.; Stokes, A.; Park, I.; Sitti, M.; Amjadi, M. Wearable and Stretchable Strain Sensors: Materials, Sensing Mechanisms, and Applications. Adv. Intell. Syst. 2020, 2, 2000039. [Google Scholar] [CrossRef]
- Brasiliano, P.; Mascia, G.; Di Feo, P.; Di Stanislao, E.; Alvini, M.; Vannozzi, G.; Camomilla, V. Impact of Gait Events Identification through Wearable Inertial Sensors on Clinical Gait Analysis of Children with Idiopathic Toe Walking. Micromachines 2023, 14, 277. [Google Scholar] [CrossRef] [PubMed]
- Shakya, S.; Taparugssanagorn, A.; Silpasuwanchai, C. Convolutional Neural Network-Based Low-Powered Wearable Smart Device for Gait Abnormality Detection. IoT 2023, 4, 4. [Google Scholar] [CrossRef]
- Salis, F.; Bertuletti, S.; Bonci, T.; Caruso, M.; Scott, K.; Alcock, L.; Buckley, E.; Gazit, E.; Hansen, C.; Schwickert, L.; et al. A Multi-Sensor Wearable System for the Assessment of Diseased Gait in Real-World Conditions. Front. Bioeng. Biotechnol. 2023, 11, 1143248. [Google Scholar] [CrossRef] [PubMed]
- Geissler, D.; Zhou, B.; Bello, H.; Sorysz, J.; Ray, L.; Javaheri, H.; Rüb, M.; Herbst, J.; Zahn, E.; Woop, E.; et al. Embedding Textile Capacitive Sensing into Smart Wearables as a Versatile Solution for Human Motion Capturing. Sci. Rep. 2024, 14, 15797. [Google Scholar] [CrossRef] [PubMed]
- Chen, L.; Lu, M.; Yang, H.; Avila, J.S.; Shi, B.; Ren, L.; Wei, G.; Liu, X.; Yin, W. Textile Based Capacitive Sensor for Physical Rehabilitation via Surface Topological Modification. ACS Nano 2020. [Google Scholar] [CrossRef] [PubMed]
- Fazio, R.; Mastronardi, V.; Vittorio, M.; Visconti, P. Wearable Sensors and Smart Devices to Monitor Rehabilitation Parameters and Sports Performance: An Overview. Sensors 2023, 23, 1856. [Google Scholar] [CrossRef] [PubMed]
- Cheng, A.; Wu, L.; Sha, Z.; Chang, W.-S.; Chu, D.; Wang, C.; Peng, S. Recent Advances of Capacitive Sensors: Materials, Microstructure Designs, Applications, and Opportunities. Adv. Mater. Technol. 2023, 8, 2201959. [Google Scholar] [CrossRef]
- Oubre, B.; Daneault, J.-F.; Boyer, K.; Kim, J.H.; Jasim, M.; Bonato, P.; Lee, S.I. A Simple Low-Cost Wearable Sensor for Long-Term Ambulatory Monitoring of Knee Joint Kinematics. IEEE Trans. Biomed. Eng. 2020, 67, 3483–3490. [Google Scholar] [CrossRef] [PubMed]
- Uhlrich, S.D.; Falisse, A.; Kidziński, Ł.; Muccini, J.; Ko, M.; Chaudhari, A.S.; Hicks, J.L.; Delp, S.L. OpenCap: Human Movement Dynamics from Smartphone Videos. PLoS Comput. Biol. 2023, 19, e1011462. [Google Scholar] [CrossRef] [PubMed]
- Uchida, T.K.; Delp, S.; Delp, D.B. Biomechanics of Movement: The Science of Sports, Robotics, and Rehabilitation; The MIT Press: Cambridge, MA, USA, 2020; ISBN 978-0-262-04420-2. [Google Scholar]
- Ma, H.; Liao, W.-H. Human Gait Modeling and Analysis Using a Semi-Markov Process With Ground Reaction Forces. IEEE Trans. Neural Syst. Rehabil. Eng. 2017, 25, 597–607. [Google Scholar] [CrossRef] [PubMed]
- Zhao, Y.; Li, J.; Wang, X.; Liu, F.; Shan, P.; Li, L.; Fu, Q. A Lightweight Pose Sensing Scheme for Contactless Abnormal Gait Behavior Measurement. Sensors 2022, 22, 4070. [Google Scholar] [CrossRef] [PubMed]
- Russo, M.; Amboni, M.; Pisani, N.; Volzone, A.; Calderone, D.; Barone, P.; Amato, F.; Ricciardi, C.; Romano, M. Biomechanics Parameters of Gait Analysis to Characterize Parkinson’s Disease: A Scoping Review. Sensors 2025, 25, 338. [Google Scholar] [CrossRef] [PubMed]
- Kavya, Y.; Reka, S.S. Phase Wise Classification of Abnormal Gait in Children With Cerebral Palsy Using Hybrid Neural TEMPODE Deep Learning Techniques. IEEE Access 2025, 13, 67112–67126. [Google Scholar] [CrossRef]
- Martindale, C.F.; Roth, N.; Gassner, H.; List, J.; Regensburger, M.; Eskofier, B.M.; Kohl, Z. Technical Validation of an Automated Mobile Gait Analysis System for Hereditary Spastic Paraplegia Patients. IEEE J. Biomed. Health Inform. 2020, 24, 1490–1499. [Google Scholar] [CrossRef] [PubMed]
- Blanco-Coloma, L.; García-González, L.; Sinovas-Alonso, I.; Torio-Álvarez, S.; Martos-Hernández, P.; González-Expósito, S.; Gil-Agudo, Á.; Herrera-Valenzuela, D. Validation of Inertial Measurement Units Based on Waveform Similarity Assessment against a Photogrammetry System for Gait Kinematic Analysis. Front. Bioeng. Biotechnol. 2024, 12, 1449698. [Google Scholar] [CrossRef] [PubMed]
- Nüesch, C.; Roos, E.; Pagenstert, G.; Mündermann, A. Measuring Joint Kinematics of Treadmill Walking and Running: Comparison between an Inertial Sensor Based System and a Camera-Based System. J. Biomech. 2017, 57, 32–38. [Google Scholar] [CrossRef] [PubMed]
- Figueiredo, J.; Carvalho, S.P.; Vilas-Boas, J.P.; Gonçalves, L.M.; Moreno, J.C.; Santos, C.P. Wearable Inertial Sensor System towards Daily Human Kinematic Gait Analysis: Benchmarking Analysis to MVN BIOMECH. Sensors 2020, 20, 2185. [Google Scholar] [CrossRef] [PubMed]
- Prisco, G.; Pirozzi, M.A.; Santone, A.; Esposito, F.; Cesarelli, M.; Amato, F.; Donisi, L. Validity of Wearable Inertial Sensors for Gait Analysis: A Systematic Review. Diagnostics 2024, 15, 36. [Google Scholar] [CrossRef] [PubMed]
- Ghazwan, A.; Wilson, C.; Holt, C.A.; Whatling, G.M. Knee Osteoarthritis Alters Peri-Articular Knee Muscle Strategies during Gait. PLoS ONE 2022, 17, e0262798. [Google Scholar] [CrossRef] [PubMed]
- MacLean, M.K.; Ferris, D.P. Human Muscle Activity and Lower Limb Biomechanics of Overground Walking at Varying Levels of Simulated Reduced Gravity and Gait Speeds. PLoS ONE 2021, 16, e0253467. [Google Scholar] [CrossRef] [PubMed]
- Jayasinghe, U.; Hwang, F.; Harwin, W.S. Comparing Loose Clothing-Mounted Sensors with Body-Mounted Sensors in the Analysis of Walking. Sensors 2022, 22, 6605. [Google Scholar] [CrossRef] [PubMed]
- Clark, W.H.; Pimentel, R.E.; Franz, J.R. Imaging and Simulation of Inter-Muscular Differences in Triceps Surae Contributions to Forward Propulsion During Walking. Ann. BioMed Eng. 2021, 49, 703–715. [Google Scholar] [CrossRef] [PubMed]
- Lenhart, R.L.; Francis, C.A.; Lenz, A.L.; Thelen, D.G. Empirical Evaluation of Gastrocnemius and Soleus Function during Walking. J. Biomech. 2014, 47, 2969–2974. [Google Scholar] [CrossRef] [PubMed]
- Adlou, B.; Wilburn, C.; Weimar, W. Motion Capture Technologies for Athletic Performance Enhancement and Injury Risk Assessment: A Review for Multi-Sport Organizations. Sensors 2025, 25, 4384. [Google Scholar] [CrossRef] [PubMed]
- Martiš, P.; Košutzká, Z.; Kranzl, A. A Step Forward Understanding Directional Limitations in Markerless Smartphone-Based Gait Analysis: A Pilot Study. Sensors 2024, 24, 3091. [Google Scholar] [CrossRef] [PubMed]
- Edwards, N.A.; Caccese, J.B.; Tracy, R.E.; Hagen, J.; Quatman-Yates, C.C.; OñATE, J. The Validity and Usability of Markerless Motion Capture and Inertial Measurement Units for Quantifying Dynamic Movements. Med. Sci. Sports Exerc. 2025, 57, 641–655. [Google Scholar] [CrossRef] [PubMed]
- Çabuk, S.; Ulupınar, S.; İnce, İ.; Özbay, S. Can OpenCap Deliver Valid and Reliable Kinematic Data for Motion Analysis? A Systematic Review and Three-Level Meta-Analysis. Biol. Sport 2026, 43, 555–573. [Google Scholar] [CrossRef] [PubMed]
- Iosa, M.; Cereatti, A.; Merlo, A.; Campanini, I.; Paolucci, S.; Cappozzo, A. Assessment of Waveform Similarity in Clinical Gait Data: The Linear Fit Method. BioMed Res. Int. 2014, 2014, 214156. [Google Scholar] [CrossRef] [PubMed]
- Bissenov, A.; Zhubi, E.; Engh, M.A.; Gresits, O.; Tóth, R.; Terebessy, T. Concurrent Validity of Wearable IMUs for Sagittal Plane Lower-Limb Range of Motion during Walking and Estimated Ground Reaction Forces: A Systematic Review and Meta-Analysis. J. Orthop. Surg. Res. 2025, 20, 891. [Google Scholar] [CrossRef] [PubMed]
- Kobsar, D.; Charlton, J.M.; Tse, C.T.F.; Esculier, J.-F.; Graffos, A.; Krowchuk, N.M.; Thatcher, D.; Hunt, M.A. Validity and Reliability of Wearable Inertial Sensors in Healthy Adult Walking: A Systematic Review and Meta-Analysis. J. Neuroeng. Rehabil. 2020, 17, 62. [Google Scholar] [CrossRef] [PubMed]
- Neptune, R.R.; Kautz, S.A.; Zajac, F.E. Contributions of the Individual Ankle Plantar Flexors to Support, Forward Progression and Swing Initiation during Walking. J. Biomech. 2001, 34, 1387–1398. [Google Scholar] [CrossRef] [PubMed]
- Horsak, B.; Eichmann, A.; Lauer, K.; Prock, K.; Krondorfer, P.; Siragy, T.; Dumphart, B. Concurrent Validity of Smartphone-Based Markerless Motion Capturing to Quantify Lower-Limb Joint Kinematics in Healthy and Pathological Gait. J. Biomech. 2023, 159, 111801. [Google Scholar] [CrossRef] [PubMed]
- Svetek, A.; Morgan, K.; Burland, J.; Glaviano, N.R. Validation of OpenCap on Lower Extremity Kinematics during Functional Tasks. J. Biomech. 2025, 183, 112602. [Google Scholar] [CrossRef] [PubMed]
- Gkrekidis, A.; Giarmatzis, G.; Menychtas, D.; Karakasis, E.; Gourgoulis, V.; Michalopoulou, M.; Smilios, I.; Douda, H.T.; Sirakoulis, G.C.; Aggelousis, N. Clinical Validation of Estimated Muscle Activations during Phases of Elderly Gait. Biomechanics 2023, 3, 552–560. [Google Scholar] [CrossRef]
Figure 1.
Design, assembly, and implementation of the wearable capacitive sensing system. (a) ESP32-S3 mounted in a power bank, sensing band for the (b) thigh and shank, and (c) shows the actual placement of the sensing band on the thigh and shank region of the right leg.
Figure 1.
Design, assembly, and implementation of the wearable capacitive sensing system. (a) ESP32-S3 mounted in a power bank, sensing band for the (b) thigh and shank, and (c) shows the actual placement of the sensing band on the thigh and shank region of the right leg.
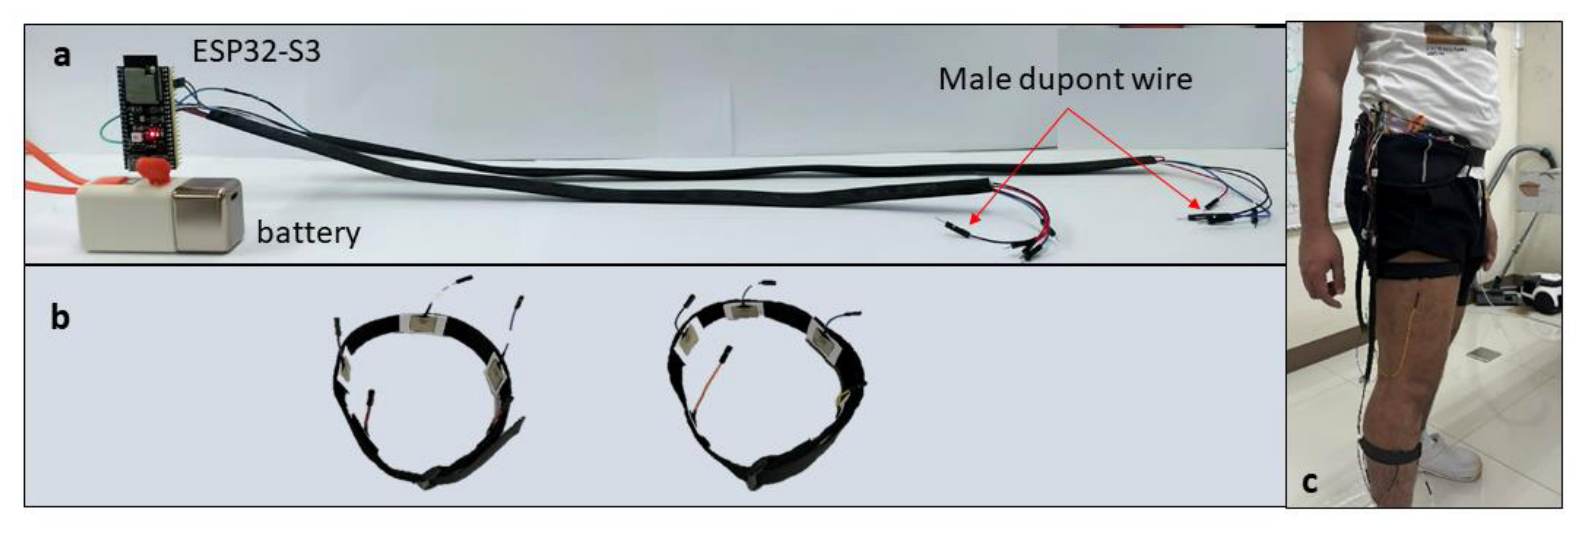
Figure 2.
Schematic circuit diagram of the ESP32-S3 wearable capacitive sensing for gait monitoring. It shows the interfacing of the thigh and shank sensing bands with the sensing electrodes, charge electrodes, and ESP32-S3 GPIO channels.
Figure 2.
Schematic circuit diagram of the ESP32-S3 wearable capacitive sensing for gait monitoring. It shows the interfacing of the thigh and shank sensing bands with the sensing electrodes, charge electrodes, and ESP32-S3 GPIO channels.
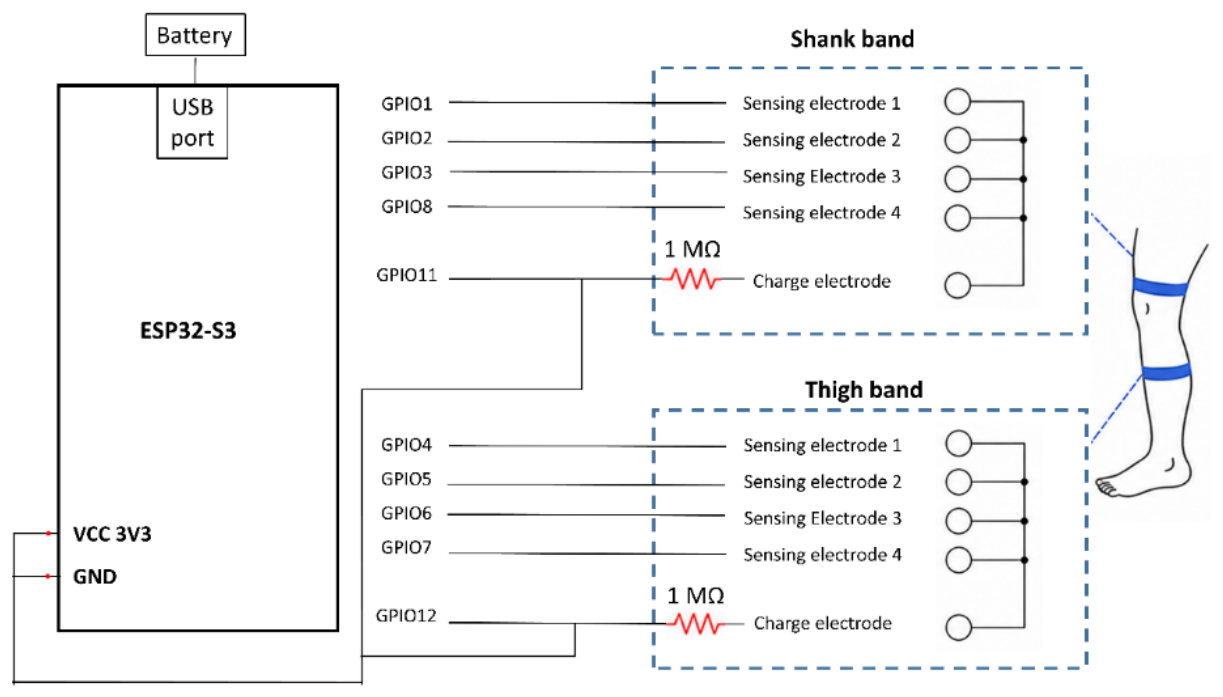
Figure 3.
Placement of sensing electrodes on the thigh and shank for wearable capacitive gait monitoring during gait movement. It shows the anterior and posterior placement on the quadriceps, hamstring, tibia and gastrocnemius regions. The cross-sectional view illustrates the capacitive sensing principle using skin tissue as the dielectric.
Figure 3.
Placement of sensing electrodes on the thigh and shank for wearable capacitive gait monitoring during gait movement. It shows the anterior and posterior placement on the quadriceps, hamstring, tibia and gastrocnemius regions. The cross-sectional view illustrates the capacitive sensing principle using skin tissue as the dielectric.
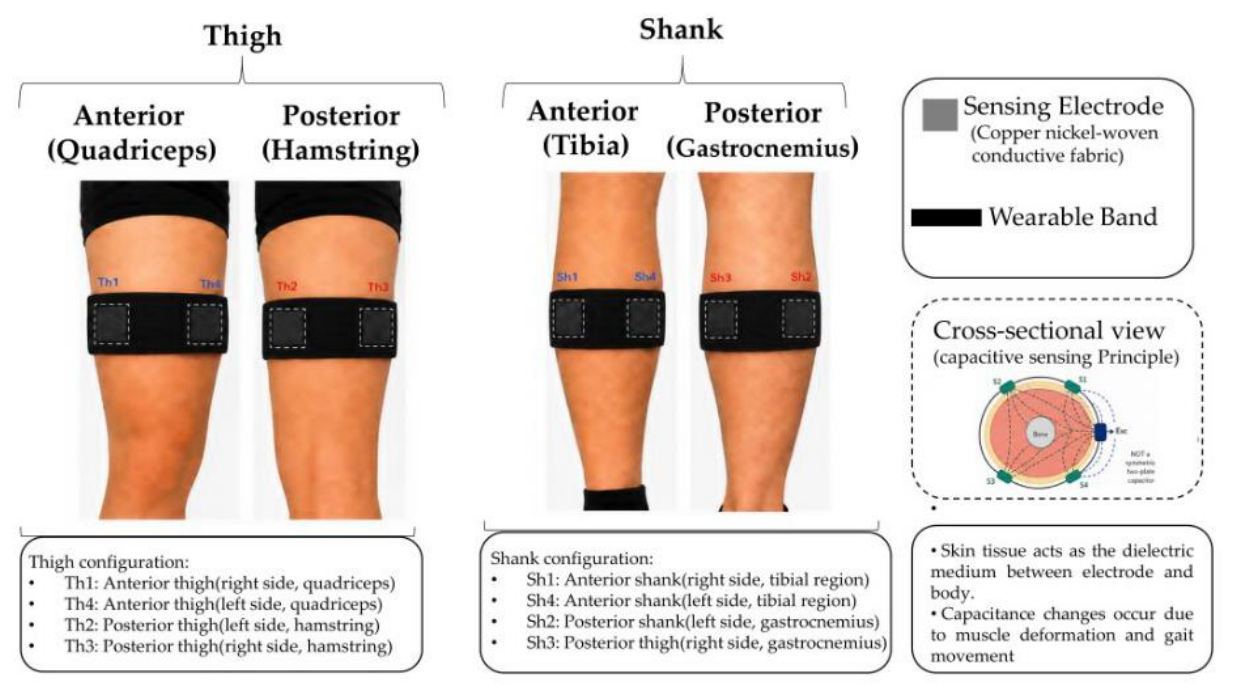
Figure 4.
Workflow of the wearable capacitive sensing band gait monitoring system. Each trial begins with calibration of the capacitive bands to establish the baseline capacitance. During walking, gait kinematics data from OpenCap were synchronized with the normalized capacitance signals obtained from the sensing bands. The synchronized data were then analyzed to identify the gait events, gait segments, and to evaluate the correlation between capacitance signals and lower limb kinematics. The complete OpenCap protocol, technical specifications, summary by anatomical plane, and definitions of selected kinematic variables are provided in Supplementary Materials (Tables S1–S3).
Figure 4.
Workflow of the wearable capacitive sensing band gait monitoring system. Each trial begins with calibration of the capacitive bands to establish the baseline capacitance. During walking, gait kinematics data from OpenCap were synchronized with the normalized capacitance signals obtained from the sensing bands. The synchronized data were then analyzed to identify the gait events, gait segments, and to evaluate the correlation between capacitance signals and lower limb kinematics. The complete OpenCap protocol, technical specifications, summary by anatomical plane, and definitions of selected kinematic variables are provided in Supplementary Materials (Tables S1–S3).
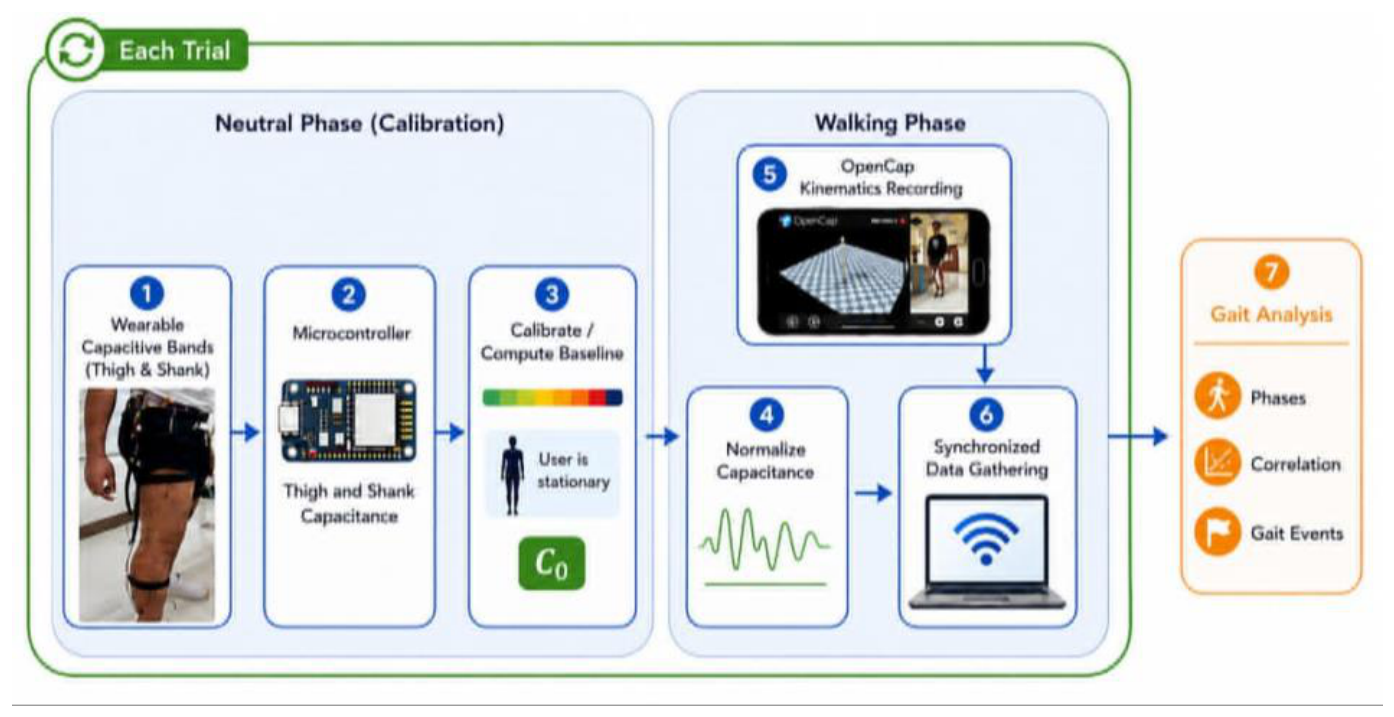
Figure 5.
Full walking gait cycle and gait phases in normal walking gait cycle. Walking gait phases were described as loading phase, midstance, terminal stance, pre-swing phase, mid-swing phase, and terminal swing phase.
Figure 5.
Full walking gait cycle and gait phases in normal walking gait cycle. Walking gait phases were described as loading phase, midstance, terminal stance, pre-swing phase, mid-swing phase, and terminal swing phase.
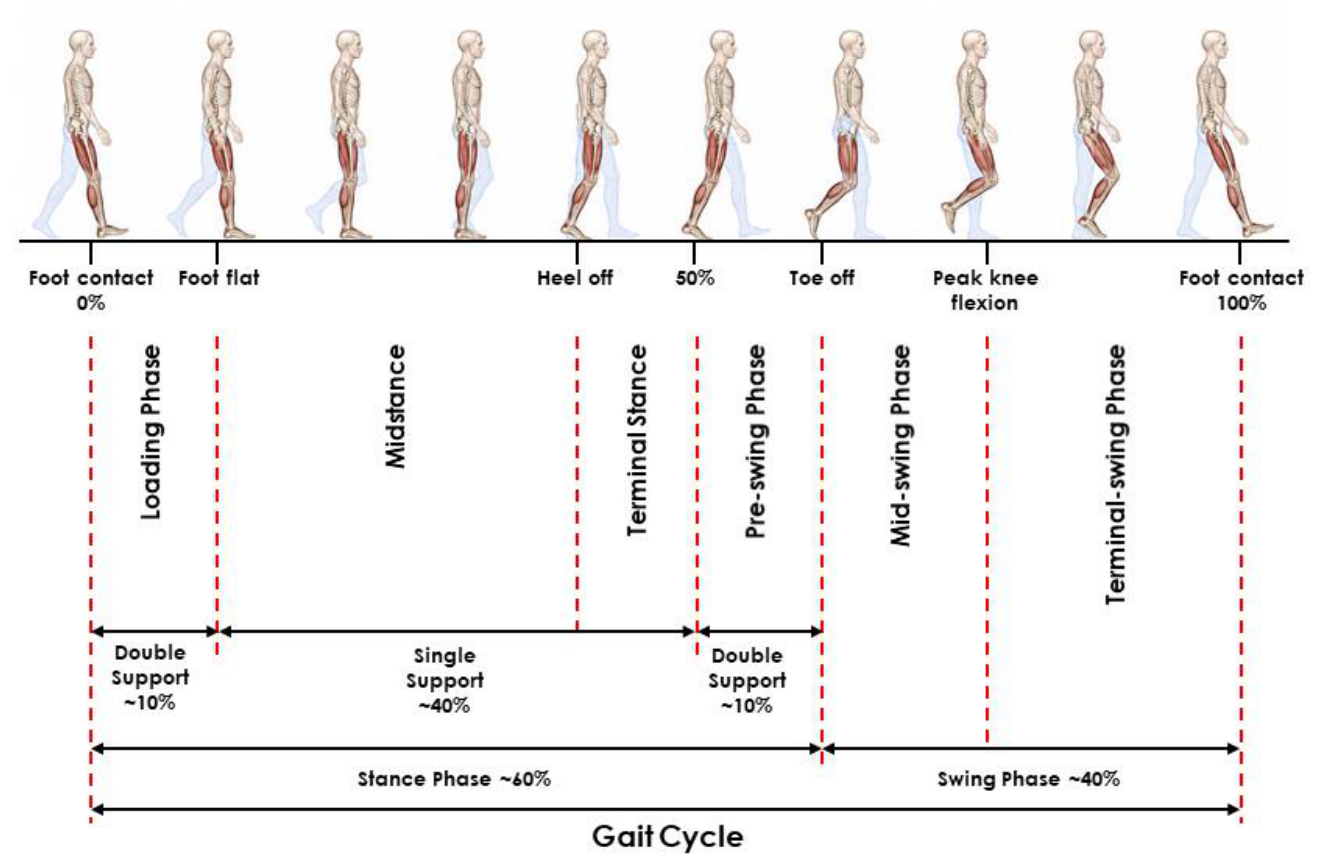
Figure 6.
Calibration of shank (blue) and thigh (red) sensing bands in stationary state with different levels of tightness and time duration. The results indicate that variations in capacitance across different tightening levels and durations were negligible.
Figure 6.
Calibration of shank (blue) and thigh (red) sensing bands in stationary state with different levels of tightness and time duration. The results indicate that variations in capacitance across different tightening levels and durations were negligible.
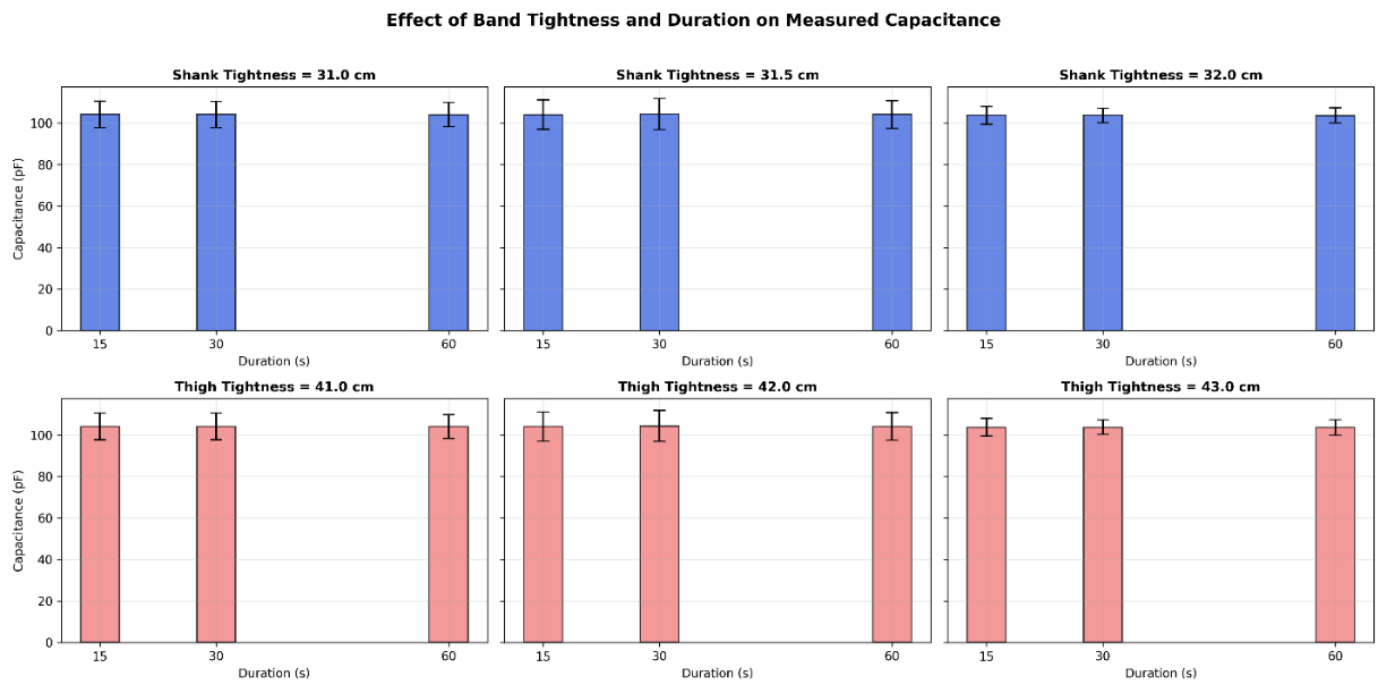
Figure 7.
Normalization Test. (a) not normalized and (b) normalized capacitance reading across 3 trials.
Figure 7.
Normalization Test. (a) not normalized and (b) normalized capacitance reading across 3 trials.
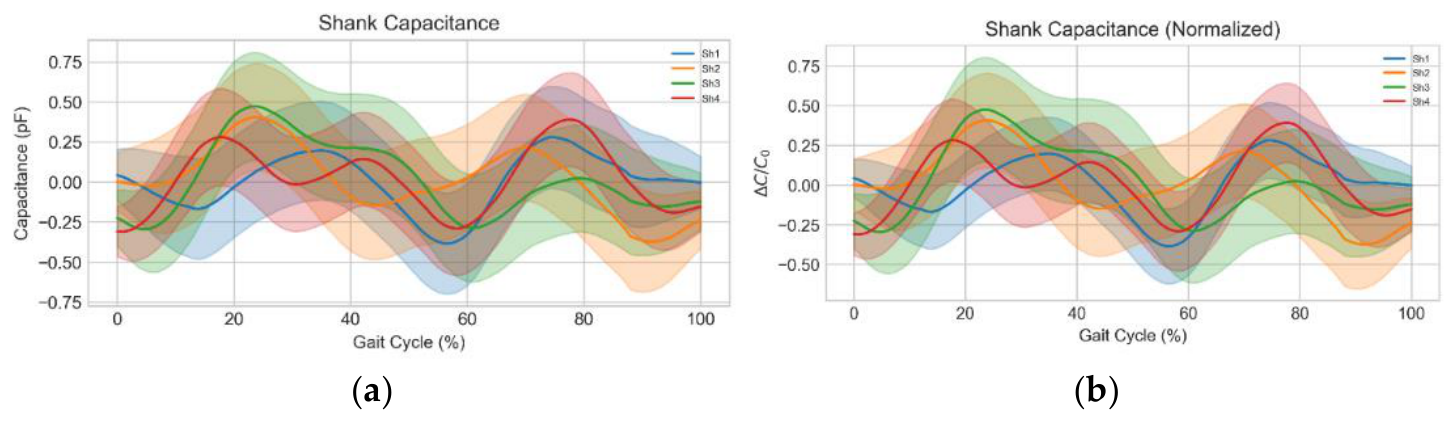
Figure 8.
Linearity response of Pristine, Aged and Used capacitive sensors. The linearity across all tested conditions demonstrated strong linear behavior, with R2 exceeding 0.98 and a negligible variation of ≤0.03%.
Figure 8.
Linearity response of Pristine, Aged and Used capacitive sensors. The linearity across all tested conditions demonstrated strong linear behavior, with R2 exceeding 0.98 and a negligible variation of ≤0.03%.
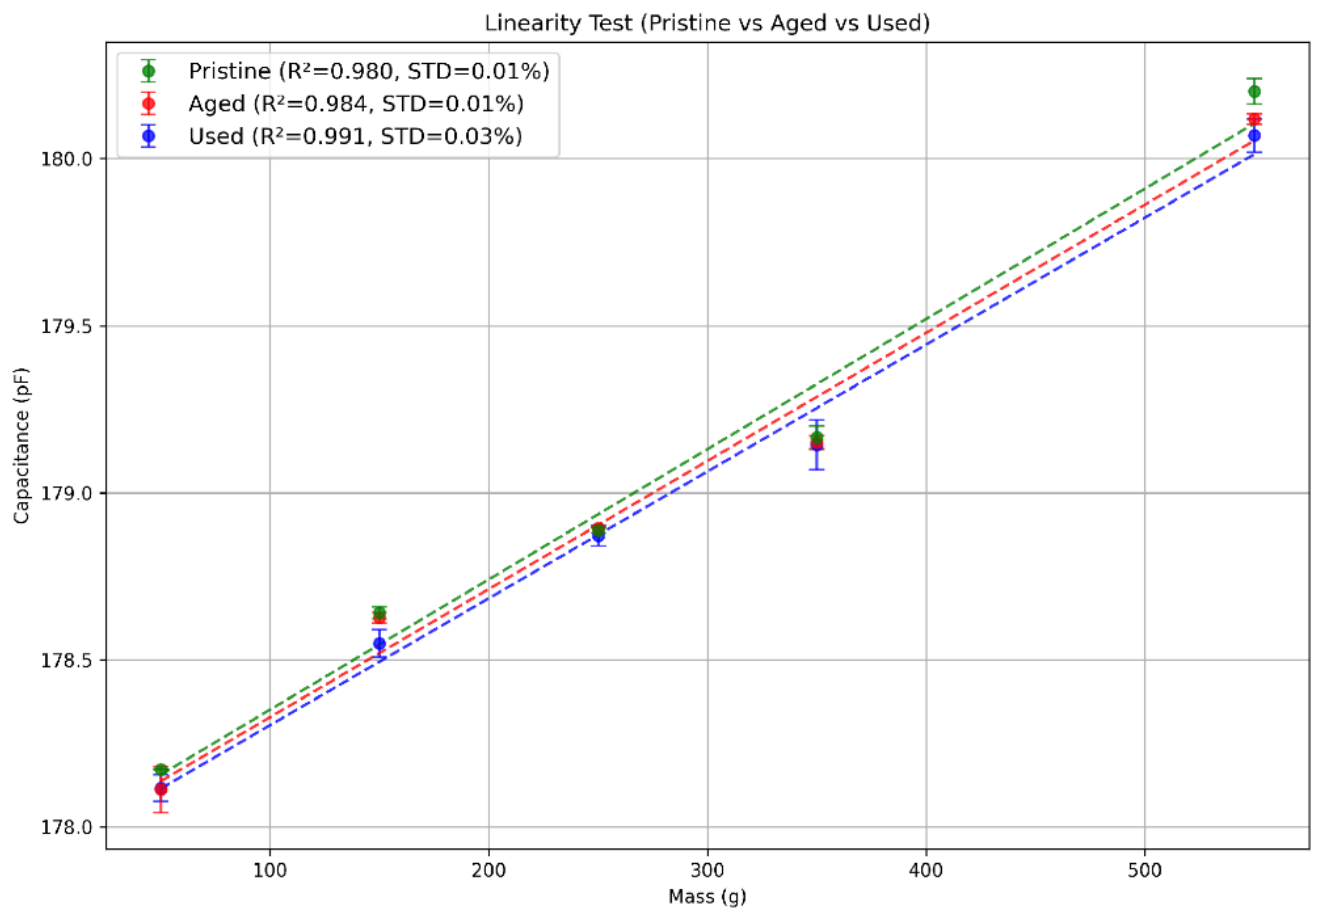
Figure 9.
Creep behavior of Pristine, Aged and Used sensors. Results shows progressive deformation with a variation of ≤0.4% under 250 g load over 90 s and maintain its stability across continuous loading. Minor discrepancies in creep behavior are attributed to the sensor’s respective aging and usage histories. However, these differences did not significantly compromise mechanical stability under sustained loading.
Figure 9.
Creep behavior of Pristine, Aged and Used sensors. Results shows progressive deformation with a variation of ≤0.4% under 250 g load over 90 s and maintain its stability across continuous loading. Minor discrepancies in creep behavior are attributed to the sensor’s respective aging and usage histories. However, these differences did not significantly compromise mechanical stability under sustained loading.
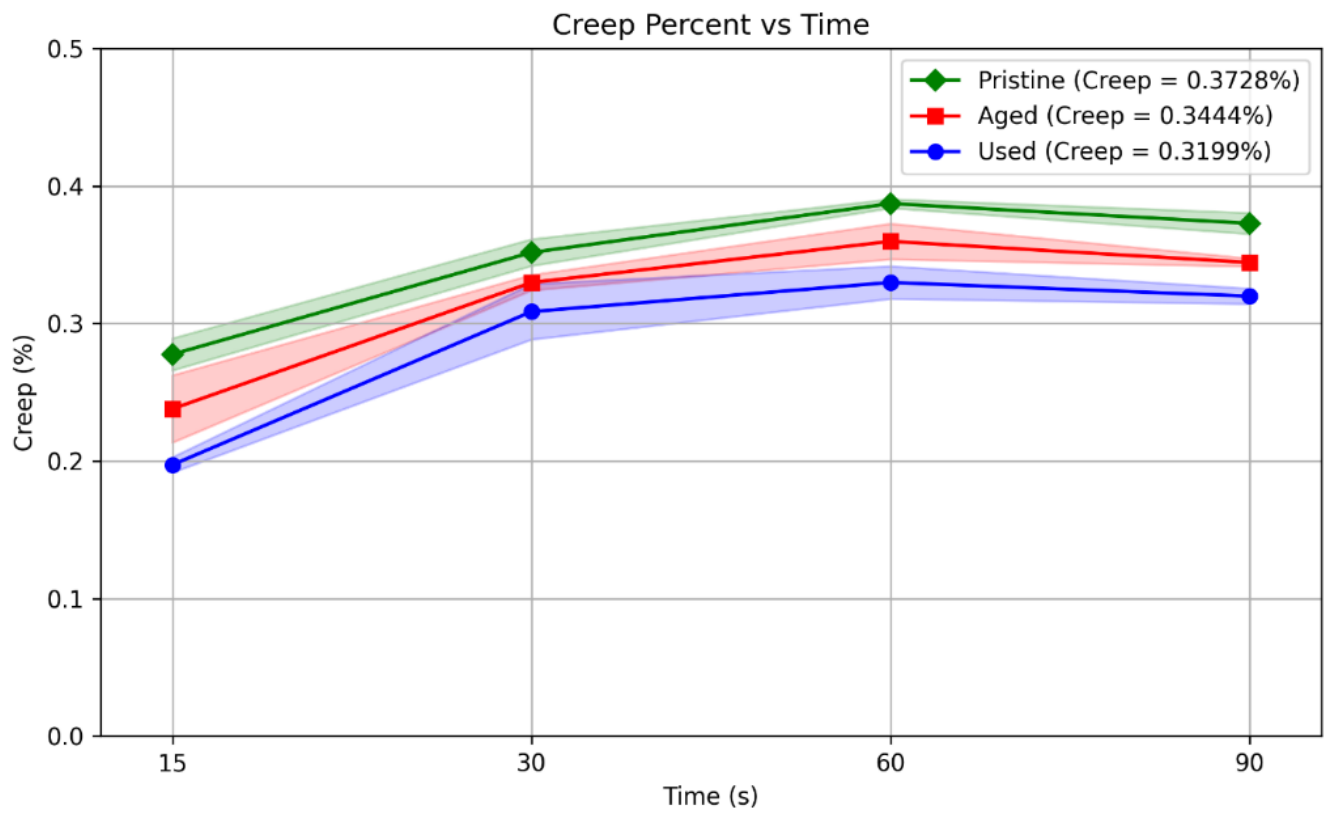
Figure 10.
FSO (Full Scale Output) hysteresis and area hysteresis behavior of Pristine, Aged, and Used capacitive sensors. FSO hysteresis and area hysteresis increases from Pristine to Used, and Aged conditions, including sensor degradation, while the deviations (<3%) of hysteresis values confirm stable and reliable performance under long term mechanical stress.
Figure 10.
FSO (Full Scale Output) hysteresis and area hysteresis behavior of Pristine, Aged, and Used capacitive sensors. FSO hysteresis and area hysteresis increases from Pristine to Used, and Aged conditions, including sensor degradation, while the deviations (<3%) of hysteresis values confirm stable and reliable performance under long term mechanical stress.
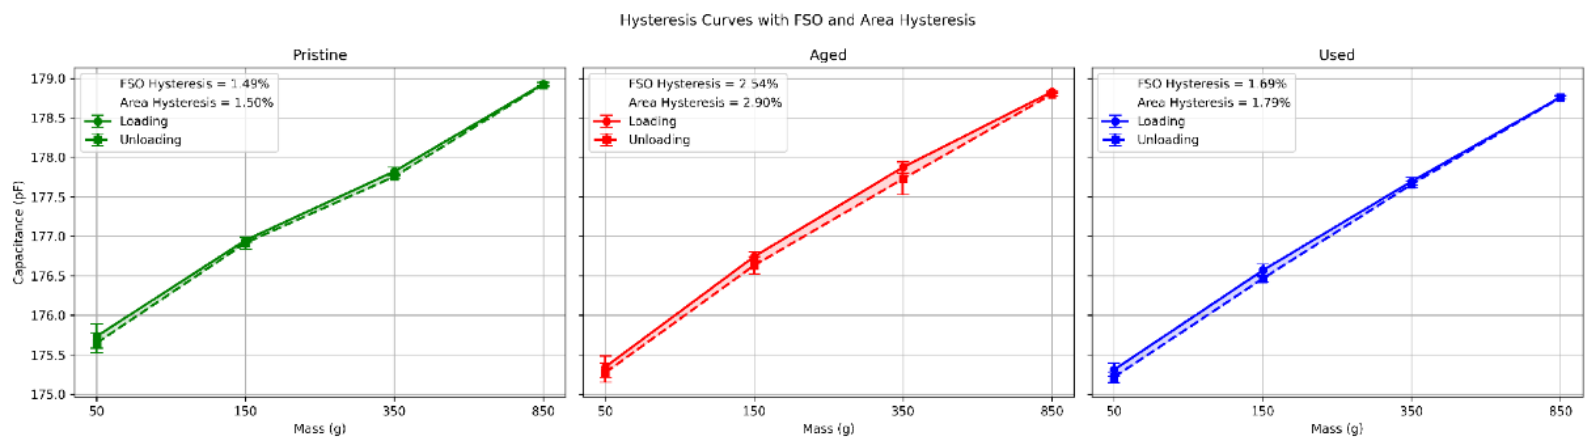
Figure 11.
Temperature stability of Pristine, Aged, and Used capacitive sensor sets evaluated at 30–45 °C with three trials per temperature. All sensors exhibited minimal variation ( demonstrating highly consistent performance for all sensor conditions.
Figure 11.
Temperature stability of Pristine, Aged, and Used capacitive sensor sets evaluated at 30–45 °C with three trials per temperature. All sensors exhibited minimal variation ( demonstrating highly consistent performance for all sensor conditions.
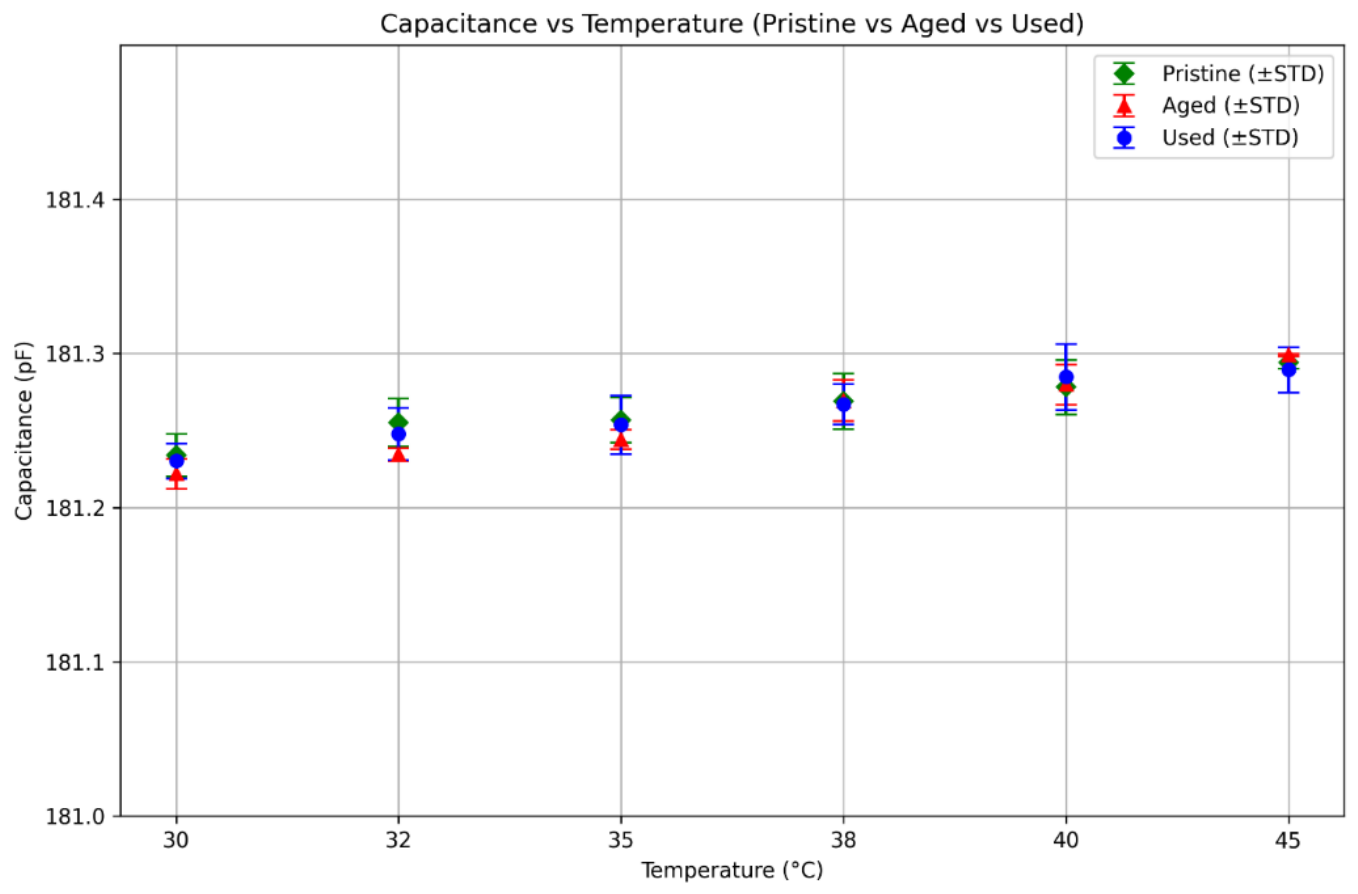
Figure 12.
SEM-EDS analysis. (I) SEM micrographs (200×) of (a) Pristine, (b) Aged, and (c) Used sensor surfaces showing progressive morphological changes. (II) EDS spectra of the conductive fabric in (a) Pristine, (b) Aged, and (c) Used conditions. (III) Bar graph comparing the elemental composition of Pristine (green), Aged (red), and Used (blue) samples. Cu and Ni remain dominant across all states, while oxygen progressively increases and Si appears in the Used sample, indicating surface oxidation.
Figure 12.
SEM-EDS analysis. (I) SEM micrographs (200×) of (a) Pristine, (b) Aged, and (c) Used sensor surfaces showing progressive morphological changes. (II) EDS spectra of the conductive fabric in (a) Pristine, (b) Aged, and (c) Used conditions. (III) Bar graph comparing the elemental composition of Pristine (green), Aged (red), and Used (blue) samples. Cu and Ni remain dominant across all states, while oxygen progressively increases and Si appears in the Used sample, indicating surface oxidation.
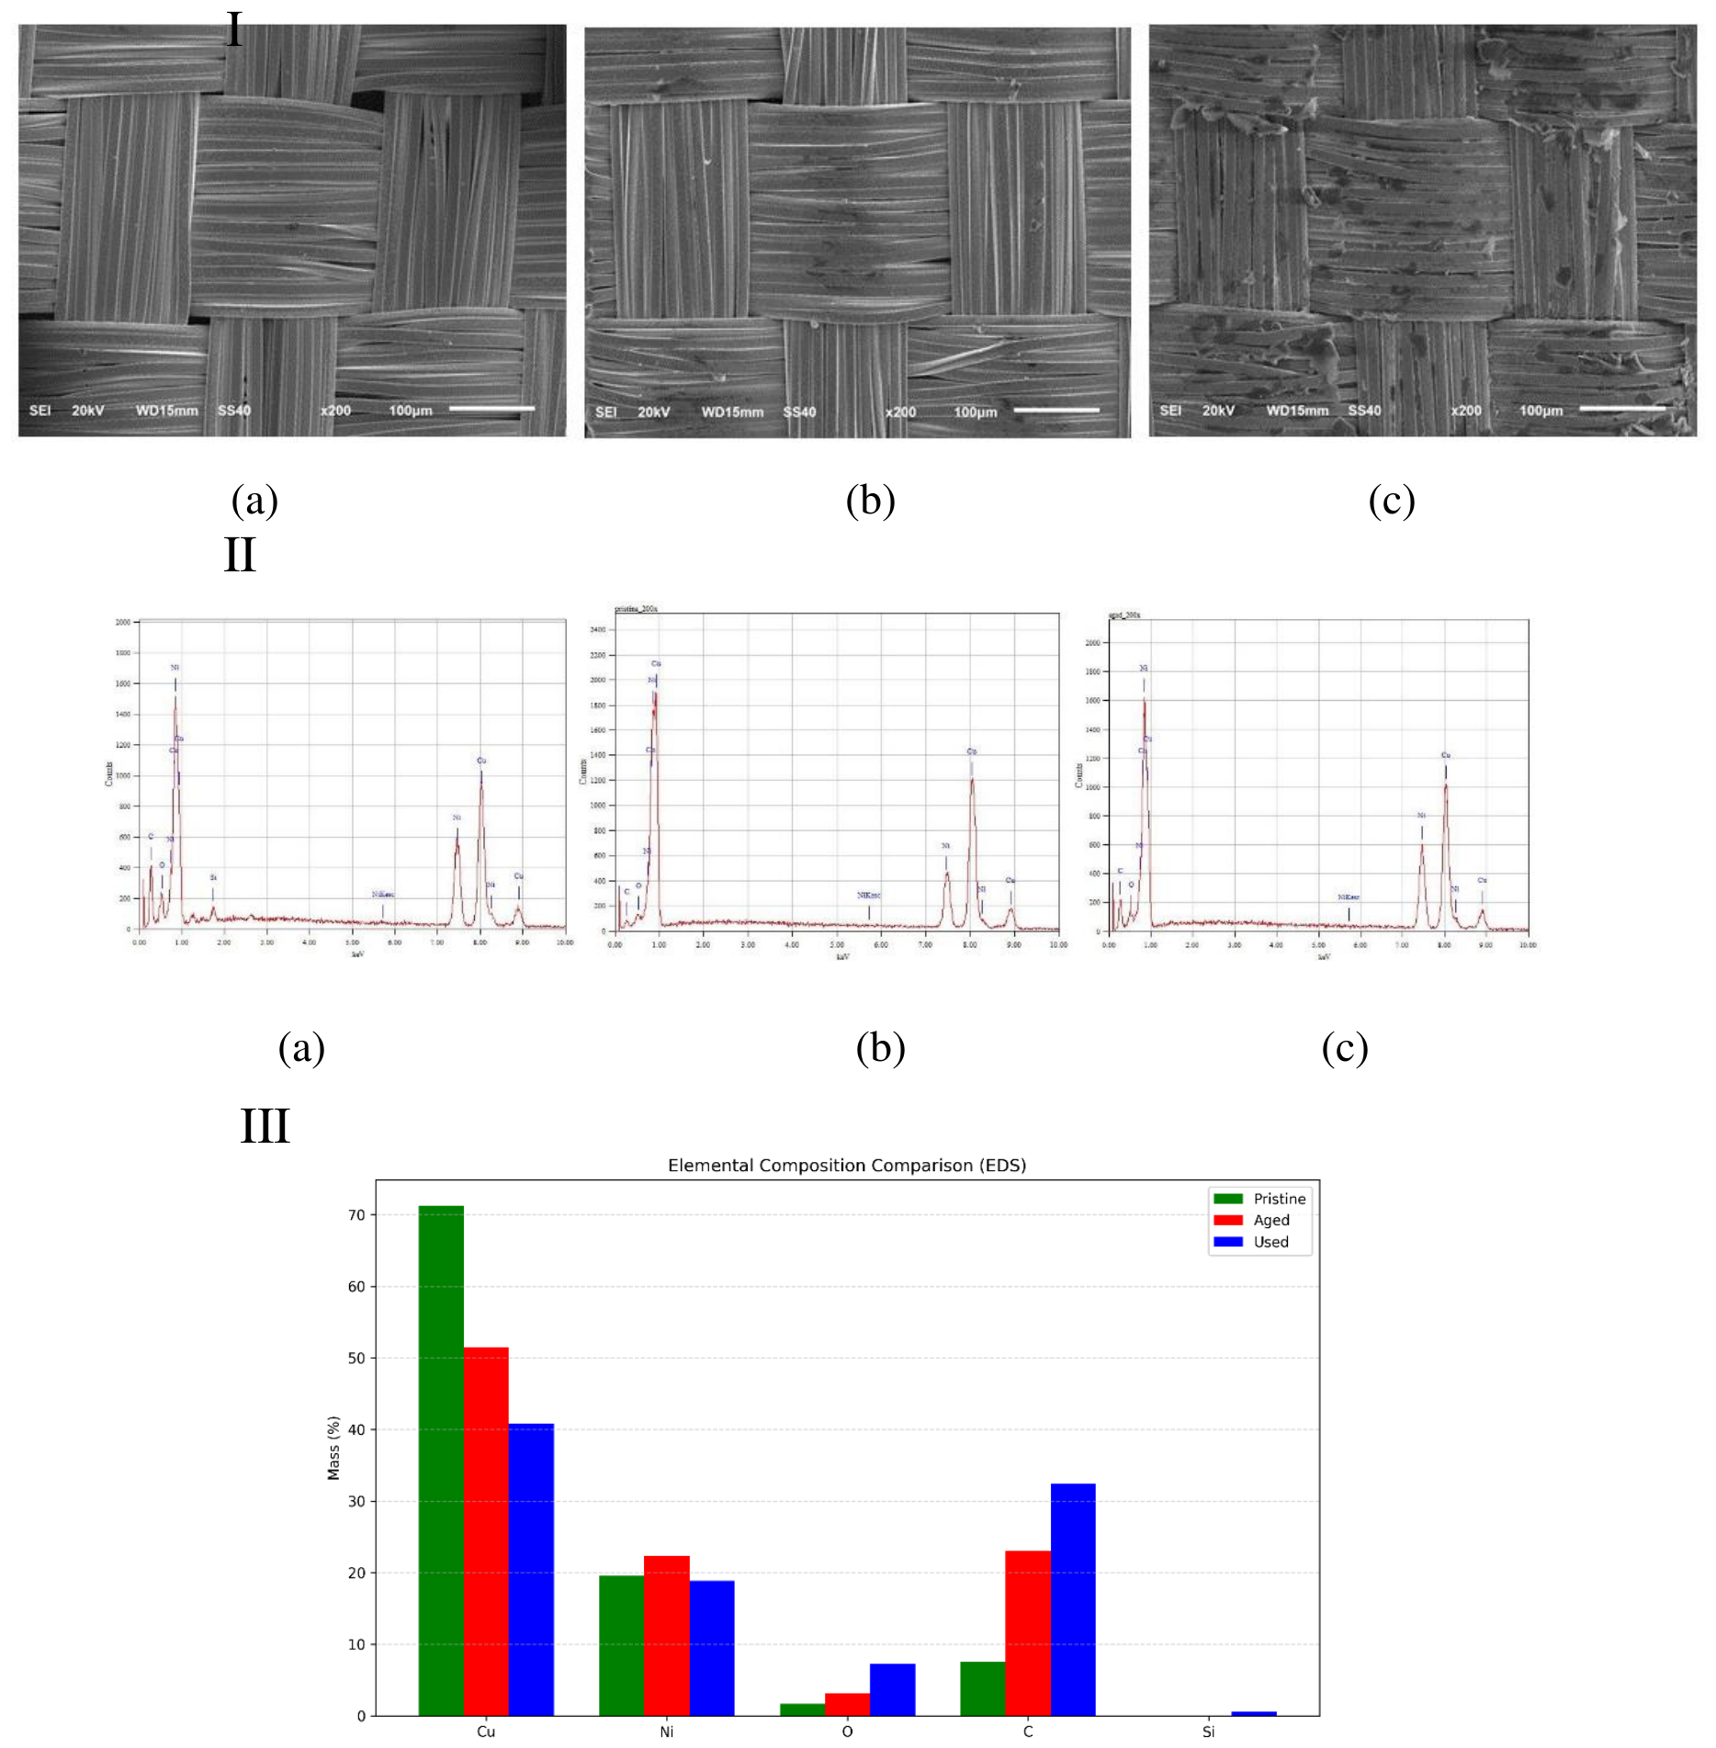
Table 1.
Mixed-Effects Model Estimates of Capacitance Response and Interaction Between Directions (loading & unloading) and Sensor Conditions. This table presents the estimated difference in capacitance response between the Aged and Used sensors relative to the Pristine sensor during loading, as well as the interaction between directions and sensor conditions.
Table 1.
Mixed-Effects Model Estimates of Capacitance Response and Interaction Between Directions (loading & unloading) and Sensor Conditions. This table presents the estimated difference in capacitance response between the Aged and Used sensors relative to the Pristine sensor during loading, as well as the interaction between directions and sensor conditions.
| Model Effect | Sensor Condition/Comparison | Estimated Difference | SE | z/t Value | p-Value |
|---|---|---|---|---|---|
| Main effect of sensor condition during loading | Aged | −0.161 | 0.195 | −0.830 | 0.407 |
| Used | −0.275 | 0.194 | −1.419 | 0.156 | |
| Interaction between direction and sensor conditions | Aged | −0.041 | 0.022 | −1.881 | 0.060 |
| Used | −0.011 | 0.022 | −0.506 | 0.613 |
Note: The Pristine sensor during loading was the reference category. Statistical significance was evaluated at p < 0.05; p-values below 0.05 indicate statistically significant effects.
Table 3.
Wave Form Similarity. It summarizes the strong and very strong similarity sensors for each OpenCap-derived kinematic variable across the six gait cycle phases. Waveform similarity was evaluated using functional correlation (r) with its 95% confidence interval (C.I.), root mean square error (RMSE), and dynamic time warping (DTW) distance.
Table 3.
Wave Form Similarity. It summarizes the strong and very strong similarity sensors for each OpenCap-derived kinematic variable across the six gait cycle phases. Waveform similarity was evaluated using functional correlation (r) with its 95% confidence interval (C.I.), root mean square error (RMSE), and dynamic time warping (DTW) distance.
| Gait Segments | Sensors | Kinematics | r (95% C.I.) | RMSE | DTW |
|---|---|---|---|---|---|
| 0–10% | Sh3 | Pelvis tilt | 0.875(0.546, 0.971) | 0.475 | 0.133 |
| Sh2 | Pelvis rotation | 0.984(0.931, 0.996) | 0.171 | 0.075 | |
| Sh4 | 0.951(0.800, 0.989) | 0.298 | 0.093 | ||
| Th2 | 0.992(0.965, 0.998) | 0.121 | 0.050 | ||
| Th3 | 0.948(0.790, 0.988) | 0.306 | 0.095 | ||
| Sh2 | Pelvis ty | 0.969(0.871, 0.993) | 0.235 | 0.082 | |
| Th2 | 0.855(0.488, 0.965) | 0.511 | 0.161 | ||
| Sh2 | Hip flexion | 0.957(0.825, 0.990) | 0.277 | 0.092 | |
| Sh4 | 0.980(0.914, 0.995) | 0.191 | 0.075 | ||
| Th2 | 0.999(0.998, 0.999) | 0.025 | 0.011 | ||
| Th3 | 0.978(0.906, 0.995) | 0.200 | 0.082 | ||
| Sh2 | Hip adduction | 0.997(0.997, 0.999) | 0.078 | 0.034 | |
| Sh4 | 0.839(0.443, 0.961) | 0.539 | 0.165 | ||
| Th2 | 0.926(0.712, 0.983) | 0.364 | 0.108 | ||
| Th3 | 0.834(0.430, 0.959) | 0.547 | 0.162 | ||
| 10–40% | Sh2 | Pelvis tilt | 0.879(0.758, 0.941) | 0.485 | 5.207 |
| Sh3 | 0.922(0.840, 0.962) | 0.389 | 5.086 | ||
| Sh4 | 0.820(0.652, 0.911) | 0.590 | 8.169 | ||
| Th2 | 0.845(0.697, 0.924) | 0.548 | 8.544 | ||
| Sh2 | Pelvis rotation | 0.932(0.861, 0.968) | 0.362 | 4.465 | |
| Sh2 | Hip flexion | 0.969(0.934, 0.985) | 0.246 | 3.234 | |
| Sh3 | 0.813(0.640, 0.907) | 0.602 | 8.634 | ||
| Sh2 | Knee angle | 0.973(0.944, 0.987) | 0.227 | 3.316 | |
| 40–50% | Th1 | Pelvis tilt | 0.857(0.493, 0.965) | 0.396 | 0.300 |
| Sh3 | Pelvis list | 0.962(0.844, 0.991) | 0.261 | 1.424 | |
| Sh4 | 0.874(0.543, 0.970) | 0.477 | 2.663 | ||
| Th2 | 0.971(0.879, 0.993) | 0.227 | 1.264 | ||
| Th3 | 0.854(0.484, 0.965) | 0.513 | 2.864 | ||
| Th4 | 0.909(0.612, 0.978) | 0.406 | 2.278 | ||
| Th1 | Pelvis rotation | 0.826(0.410, 0.958) | 0.559 | 0.300 | |
| Sh3 | Pelvis tx | 0.998(0.993, 0.999) | 0.053 | 0.339 | |
| Sh4 | 0.962(0.844, 0.991) | 0.261 | 1.439 | ||
| Th2 | 0.998(0.989, 0.999) | 0.066 | 0.518 | ||
| Th3 | 0.951(0.799, 0.989) | 0.298 | 1.641 | ||
| Th4 | 0.980(0.916, 0.995) | 0.188 | 1.054 | ||
| Th1 | Pelvis ty | 0.881(0.563, 0.972) | 0.464 | 2.493 | |
| Th1 | Pelvis tz | 0.985(0.935, 0.997) | 0.165 | 0.876 | |
| Th1 | Hip flexion | 0.837(0.438, 0.960) | 0.542 | 2.938 | |
| Th1 | Hip adduction | 0.930(0.726, 0.984) | 0.353 | 1.860 | |
| Th1 | Hip rotation | 0.982(0.924, 0.996) | 0.179 | 0.850 | |
| Sh3 | Knee angle | 0.965(0.854, 0.992) | 0.252 | 1.382 | |
| Sh4 | 0.877(0.553, 0.970) | 0.470 | 2.622 | ||
| Th2 | 0.974(0.890, 0.994) | 0.217 | 1.213 | ||
| Th3 | 0.858(0.496, 0.966) | 0.506 | 2.823 | ||
| Th4 | 0.912(0.662, 0.979) | 0.399 | 2.237 | ||
| Sh3 | Ankle angle | 0.941(0.764, 0.986) | 0.326 | 1.777 | |
| Sh4 | 0.994(0.975, 0.999) | 0.101 | 0.515 | ||
| Th2 | 0.924(0.703, 0.982) | 0.371 | 2.041 | ||
| Th3 | 0.997(0.989, 0.999) | 0.067 | 0.381 | ||
| Th4 | 0.983(0.927, 0.996) | 0.175 | 0.934 | ||
| Sh3 | Subtalar angle | 0.989(0.954, 0.998) | 0.139 | 0.758 | |
| Sh4 | 0.995(0.995, 0.999) | 0.096 | 0.527 | ||
| Th2 | 0.980(0.916, 0.995) | 0.188 | 1.023 | ||
| Th3 | 0.989(0.955, 0.998) | 0.137 | 0.728 | ||
| Th4 | 0.999(0.997, 0.999) | 0.035 | 0.231 | ||
| 50–60% | Sh1 | Pelvis rotation | 0.994(0.973, 0.999) | 0.105 | 0.668 |
| Sh2 | 0.973(0.887, 0.994) | 0.219 | 1.248 | ||
| Sh4 | 0.866(0.519, 0.968) | 0.491 | 2.710 | ||
| Th1 | 0.996(0.981, 0.999) | 0.089 | 0.478 | ||
| Th3 | 0.933(0.735, 0.984) | 0.347 | 1.916 | ||
| Th4 | 0.856(0.491, 0.965) | 0.509 | 2.810 | ||
| Sh1 | Pelvis ty | 0.991(0.962, 0.998) | 0.125 | 0.803 | |
| Sh2 | 0.995(0.979, 0.998) | 0.092 | 0.533 | ||
| Sh4 | 0.931(0.729, 0.984) | 0.352 | 1.944 | ||
| Th1 | 0.972(0.881, 0.993) | 0.266 | 1.181 | ||
| Th3 | 0.975(0.895, 0.994) | 0.212 | 1.174 | ||
| Th4 | 0.924(0.703, 0.982) | 0.371 | 2.044 | ||
| Sh1 | Pelvis tz | 0.913(0.668, 0.980) | 0.395 | 2.190 | |
| Sh2 | 0.968(0.864, 0.993) | 0.242 | 1.400 | ||
| Sh4 | 0.998(0.990, 0.999) | 0.064 | 0.344 | ||
| Th1 | 0.851(0.476, 0.964) | 0.518 | 2.824 | ||
| Th3 | 0.990(0.957, 0.998) | 0.134 | 0.792 | ||
| Th4 | 0.996(0.982, 0.999) | 0.087 | 0.498 | ||
| Sh1 | Hip adduction | 0.942(0.768, 0.987) | 0.323 | 1.779 | |
| Sh2 | 0.984(0.931, 0.996) | 0.170 | 0.990 | ||
| Sh4 | 0.991(0.961, 0.998) | 0.128 | 0.690 | ||
| Th1 | 0.889(0.589, 0.974) | 0.447 | 2.413 | ||
| Th3 | 0.996(0.984, 0.999) | 0.081 | 0.615 | ||
| Th4 | 0.988(0.947, 0.997) | 0.148 | 0.790 | ||
| Sh1 | Hip rotation | 0.993(0.969, 0.998) | 0.114 | 0.626 | |
| Sh2 | 0.998(0.990, 0.999) | 0.063 | 0.401 | ||
| Sh4 | 0.937(0.749, 0.985) | 0.337 | 1.856 | ||
| Th1 | 0.969(0.871, 0.993) | 0.235 | 1.226 | ||
| Th3 | 0.980(0.916, 0.995) | 0.189 | 1.046 | ||
| Th4 | 0.930(0.725, 0.984) | 0.355 | 1.950 | ||
| Sh1 | Ankle angle | 0.882(0.568, 0.972) | 0.460 | 2.576 | |
| Sh2 | 0.947(0.787, 0.988) | 0.308 | 1.786 | ||
| Sh4 | 0.999(0.997, 0.999) | 0.034 | 0.242 | ||
| Th1 | 0.810(0.367, 0.953) | 0.586 | 3.210 | ||
| Th3 | 0.980(0.915, 0.995) | 0.190 | 1.037 | ||
| Th4 | 0.999(0.996, 0.999) | 0.043 | 0.333 | ||
| Sh2 | Subtalar angle | 0.856(0.490, 0.965) | 0.510 | 2.912 | |
| Sh3 | 0.818(0.389, 0.956) | 0.572 | 2.735 | ||
| Sh4 | 0.970(0.876, 0.993) | 0.231 | 1.254 | ||
| Th3 | 0.915(0.674, 0.980) | 0.391 | 2.146 | ||
| Th4 | 0.973(0.888, 0.994) | 0.219 | 1.203 | ||
| 60–75% | Sh1 | Pelvis tilt | 0.996(0.988, 0.999) | 0.084 | 0.496 |
| Sh2 | 0.994(0.981, 0.998) | 0.107 | 0.633 | ||
| Th1 | 0.999(0.999, 0.999) | 0.018 | 0.172 | ||
| Th3 | 0.981(0.941, 0.994) | 0.191 | 1.378 | ||
| Sh1 | Pelvis rotation | 0.977(0.931, 0.993) | 0.207 | 1.193 | |
| Sh2 | 0.977(0.930, 0.993) | 0.207 | 1.193 | ||
| Sh3 | 0.871(0.648, 0.957) | 0.871 | 2.690 | ||
| Th1 | 0.955(0.868, 0.985) | 0.289 | 1.653 | ||
| Th3 | 0.900(0.719, 0.967) | 0.432 | 2.495 | ||
| Sh1 | Pelvis tx | 0.997(0.992, 0.999) | 0.070 | 0.527 | |
| Sh2 | 0.994(0.981, 0.998) | 0.106 | 0.826 | ||
| Th1 | 0.998(0.993, 0.999) | 0.067 | 0.458 | ||
| Th3 | 0.965(0.895, 0.989) | 0.256 | 1.814 | ||
| Sh1 | Pelvis ty | 0.991(0.973, 0.997) | 0.127 | 0.738 | |
| Sh2 | 0.992(0.975, 0.997) | 0.122 | 0.706 | ||
| Sh3 | 0.831(0.555, 0.942) | 0.562 | 3.154 | ||
| Th1 | 0.975(0.924, 0.992) | 0.217 | 1.281 | ||
| Th3 | 0.935(0.812, 0.979) | 0.348 | 1.997 | ||
| Sh4 | Pelvis tz | 0.899(0.717, 0.966) | 0.434 | 2.503 | |
| Th4 | 0.961(0.833, 0.987) | 0.271 | 1.592 | ||
| Sh1 | Hip flexion | 0.995(0.984, 0.998) | 0.098 | 0.560 | |
| Sh2 | 0.994(0.981, 0.998) | 0.107 | 0.721 | ||
| Sh3 | 0.810(0.509, 0.935) | 0.595 | 3.340 | ||
| Th1 | 0.983(0.948, 0.994) | 0.179 | 1.031 | ||
| Th3 | 0.941(0.828, 0.981) | 0.332 | 1.986 | ||
| Sh4 | Hip adduction | 0.912(0.751, 0.971) | 0.405 | 1.958 | |
| Th4 | 0.829(0.551, 0.942) | 0.565 | 2.851 | ||
| Sh1 | Knee angle | 0.993(0.979, 0.998) | 0.112 | 0.653 | |
| Sh2 | 0.990(0.969, 0.997) | 0.136 | 0.805 | ||
| Th1 | 0.999(0.998, 0.999) | 0.025 | 0.211 | ||
| Th3 | 0.981(0.942, 0.994) | 0.189 | 1.456 | ||
| Sh4 | Ankle angle | 0.989(0.966, 0.996) | 0.144 | 0.802 | |
| Th4 | 0.999(0.995, 0.999) | 0.053 | 0.356 | ||
| Sh4 | Subtalar angle | 0.869(0.644, 0.956) | 0.494 | 2.866 | |
| Th4 | 0.941(0.827, 0.981) | 0.332 | 1.955 | ||
| 75–100% | Sh1 | Pelvis tilt | 0.914(0.813, 0.962) | 0.405 | 2.392 |
| Sh1 | Pelvis list | 0.938(0.863, 0.973) | 0.345 | 3.071 | |
| Th1 | 0.906(0.795, 0.958) | 0.426 | 3.261 | ||
| Th3 | 0.894(0.772, 0.953) | 0.450 | 2.968 | ||
| Sh3 | Pelvis rotation | 0.852(0.688, 0.933) | 0.534 | 3.587 | |
| Sh4 | 0.894(0.772, 0.953) | 0.450 | 2.648 | ||
| Sh3 | Pelvis tx | 0.837(0.661, 0.926) | 0.559 | 4.673 | |
| Th2 | Pelvis tz | 0.936(0.936, 0.972) | 0.349 | 2.073 | |
| Sh3 | Hip flexion | 0.945(0.878, 0.976) | 0.324 | 2.549 | |
| Sh4 | Hip adduction | 0.991(0.979, 0.996) | 0.130 | 1.027 | |
| Sh1 | Hip rotation | 0.994(0.986, 0.997) | 0.107 | 1.131 | |
| Sh2 | 0.829(0.646, 0.922) | 0.572 | 2.844 | ||
| Th1 | 0.936(0.859, 0.972) | 0.350 | 1.993 | ||
| Th3 | 0.915(0.815, 0.962) | 0.403 | 1.998 | ||
| Th4 | 0.864(0.711, 0.938) | 0.512 | 3.899 | ||
| Sh1 | Knee angle | 0.885(0.753, 0.948) | 0.470 | 2.734 | |
| Sh3 | Ankle angle | 0.891(0.766, 0.951) | 0.457 | 3.526 | |
| Sh4 | 0.857(0.697, 0.935) | 0.525 | 2.895 | ||
| Sh4 | Subtalar angle | 0.835(0.656, 0.925) | 0.563 | 3.301 |
Note: All functional correlation, r, are significant with p values < 0.05.
Disclaimer/Publisher’s Note: The statements, opinions and data contained in all publications are solely those of the individual author(s) and contributor(s) and not of MDPI and/or the editor(s). MDPI and/or the editor(s) disclaim responsibility for any injury to people or property resulting from any ideas, methods, instructions or products referred to in the content. |
© 2026 by the authors. Licensee MDPI, Basel, Switzerland. This article is an open access article distributed under the terms and conditions of the Creative Commons Attribution (CC BY) license (http://creativecommons.org/licenses/by/4.0/).
Copyright: This open access article is published under a Creative Commons CC BY 4.0 license, which permit the free download, distribution, and reuse, provided that the author and preprint are cited in any reuse.