

Submitted:
16 September 2026
Posted:
17 September 2026
You are already at the latest version
Abstract
Progressive gait impairments remain a major challenge for children with cerebral palsy (CP), often limiting independence and quality of life. While neuromuscular electrical stimulation (NMES) shows promise for improving gait, prior studies in this population have largely targeted only a single muscle. To address this gap, we examined multi-muscle versus single-muscle NMES during treadmill walking in six children with CP, comparing seven protocols, including an individualized physical-therapist-derived (PT-derived) protocol against a no-stimulation baseline and typically developing controls. Gait quality was assessed using the Gait Deviation Index (GDI) as the primary outcome, alongside the Coefficient of Variation (CV) and targeted kinematic measures. Results were mixed: group-level GDI differences were not significant, though CV analyses showed multi-muscle conditions produced more consistently favorable gait patterns than single-muscle stimulation. Stimulation condition significantly affected maximum knee extension and Dynamic Time Warping during ankle loading response and hip pre-swing; however, after correction for multiple comparisons, no protocol differed significantly from baseline. The PT-derived condition showed favorable directional trends across several outcomes, though not consistently significant. These preliminary findings suggest multi-muscle, individualized NMES strategies may produce phase- and joint-specific biomechanical effects, but larger studies with better gait-phase detection and longer exposure are needed before drawing clinical conclusions.
Keywords:
cerebral palsy (CP)
; neuromuscular electrical stimulation (NMES)
; gait analysis
; gait deviation index (GDI)
; coefficient of variation (CV)
; dynamic time warping (DTW)
1. Introduction
Cerebral Palsy (CP) is the most prevalent childhood neuromotor diagnosis, with between 550,000 and 764,000 current cases in the US [1]. The estimated lifetime economic costs to care for a person with CP exceed those of the average individual by $921,000 (2003 dollars) [2]. The normal progression of CP is for a progressive loss of walking function, which negatively impacts all three components of the WHO ICF model of disability: body function and structure, activity and participation, and, ultimately, quality of life. Walking function in individuals with CP declines through adolescence and into adulthood [2,3]. Children with CP have improper muscle timing and duration compared to the muscle activity of typically developing (TD) children [4] and diminished extension during walking (also known as crouch). This results in a shorter stride length and slower walking speed [5] and is associated with expending two to three times more metabolic energy while walking than their TD peers [6]. Thus, interventions to improve lower limb muscle contractions to maintain an upright posture during gait are crucial in CP.
Common orthopedic interventions to improve function and health in children with CP include surgical procedures such as tendon lengthening to address contractures and selective dorsal rhizotomy to reduce spasticity. However, these procedures exacerbate mobility loss by putting muscles at unfavorable lengths for generating force and by unmasking underlying muscle weakness [7,8,9,10]. Additionally, recovery of pre-surgical function is lengthy (1-2 years), and improvements in function are generally equivocal or modest at best, even when skeletal alignment is improved [11,12,13].
Current non-invasive motor rehabilitation interventions for children with CP are insufficient to reverse the loss of walking function. A widely used intervention in the 1940s was Neurodevelopmental Treatment (NDT), which involves task-specific movements in which the therapist assists the patient to move using key points of control [14]. However, its results became disconcerting to many therapists, as mentioned by Damiano DL [15]. Alternative interventions have also yielded limited results. For instance, progressive resistance training (PRT), which is a method of exercise where the resistance is gradually increased over time, has been shown to improve lower limb muscle strength. However, it does not lead to significant improvements in standing balance, gait kinematics, or overall functional mobility among individuals with CP [16,17]. Additionally, a systematic review by Esther et al. evaluating the efficacy of aerobic exercise in the CP population found no substantial benefits for gait parameters [18]. These modest outcomes from traditional motor rehabilitation approaches point to the need for novel strategies that better address the complex neuromuscular deficits underlying gait impairments in children with CP.
In recent years, increased emphasis has been placed on the dynamic systems approach for training locomotor skills in CP. That is, to learn to walk, walking practice is necessary [19]. In this regard, two general approaches have been advocated for repetitive task-specific training to enhance neuroplasticity and improve gait function: body weight supported treadmill training (BWSTT) and robotic-driven gait orthosis training (RGO, e.g., Lokomat). In the case of BWSTT, one or two therapists manually guide foot and leg movements, whereas for the RGO technique, a robotic-driven orthosis provides prosthesis-like support and advances the limbs. A significant limitation of both techniques is that corrective actions are imposed externally, potentially making the participant a passive recipient of movement. Rather than actively engaging their own muscles to correct inefficient patterns, individuals experience the sensation of a more typical gait without the necessary motor control activation. Although some evidence supports the efficacy of BWSTT and RGOs for the CP population, systematic reviews and meta-analyses have noted their limitations and the variable or modest changes in spatiotemporal or functional measures of gait following training [20,21,22].
Research on neuroplasticity suggests that children with CP benefit the most from active participation in training [21,22,23,24,25,26,27]. A recently developed RGO, such as Biomotum SPARK (Biomotum Inc., Portland, Oregon), focused on actively engaging the participants by providing resistance, instead of assistance, during walking and demonstrated positive functional outcomes in cohorts of children with CP, such as improved walking distance [28,29,30]. However, such devices target a single joint, which might not sufficiently address the complexities of the gait of CP; adopting a more holistic multi-joint approach through Neuromuscular electrical stimulation (NMES) may be more effective stand-alone and could potentially augment the effectiveness of RGOs in hybrid designs [31].
NMES is a physiologically based intervention that promotes the active use of participants' residual neuromotor capacity, enhancing both the timing and strength of muscle contractions as participants engage in the training process [32]. As an assistive technology, NMES applies electrical stimulation to the skin’s surface to augment muscle contractions during active movement. By providing appropriately timed and powered muscle contractions, NMES can help compensate for deficits in selective motor control in individuals with neurological disorders, leading to more efficient gait mechanics. Additionally, NMES activates Golgi tendon organs and muscle spindles, offering rich sensory feedback via afferent neural pathways. This stimulation engages multiple motor control components, impacts cortical excitability, and may promote motor learning [33]. The foundation of our intervention was to use NMES to improve gait in children with CP.
A recent meta-analysis demonstrated a large effect size in improving gross motor function when NMES was used in the motor rehabilitation of children with CP [34]. Emerging NMES efforts for children with CP suggest improvements to spatiotemporal parameters [35,36,37,38], kinematics [35,39,40,41], and kinetics [39] during walking. Previous research, however, focused on individual joints despite the multi-joint nature of gait deviations in CP [33]. Studies reported that kinematic improvements occurred based on the muscle groups targeted: stimulation to the triceps surae (TS) [42], dorsiflexors [35,39,40,41,43,44], or gastrocnemius and Tibialis Anterior (TA) combined [42,45] promoted changes at the ankle; stimulation to the quadriceps [39,46] improved knee flexion angle, and continuous low-level stimulation of the gluteus medius [47] improved hip abduction. However, targeting multiple muscle groups has an additive effect on gait improvements [33]. For example, stimulation of both rectus femoris (RF) and vastus lateralis was more effective in improving posture than stimulation of each muscle alone during walking in one child with CP [31]. To investigate this additive behavior, we developed a multi-muscle system capable of stimulating up to five muscle groups on each leg during gait [48,49,50,51]. We evaluated the acute (neuroprosthetic) effects [50] and therapeutic (neurotherapeutic) effects [52] of this NMES system. In a 12-week gait training protocol on two children with CP, we demonstrated alterations toward typical gait in hip and ankle angles, which lasted without NMES for four weeks post-training [52,53]. Rose et al. employed a multichannel approach and reported similar acute results in three children with CP [54]. However, evidence of multi-muscle NMES effectiveness is still limited [33].
As multi-muscle NMES-assisted walking interventions for children with CP are still in their early stages of development, identifying optimal muscle combinations for stimulation is essential to designing an effective intervention. Previous studies have typically applied a fixed stimulation protocol across participants. This standardization, given the heterogeneity of gait deviations in the CP population, may reduce potential effectiveness and, in turn, our comprehensive understanding of the intervention. The contribution of this study is twofold: (1) it provides a systematic comparison of multiple multi-muscle and single-muscle NMES protocols, and (2) it contrasts an individualized, physical therapist (PT)-derived protocol with uniform approaches. The PT-derived protocol is a subject-specific, multi-channel protocol designed by PTs to target all three lower limb joints based on the individual’s gait deviations, representing a key distinguishing feature of this work. All stimulation protocols (NMES conditions) were compared to walking without stimulation and the gait pattern of typically developing (TD) individuals to identify the condition that most closely replicated typical gait kinematics.
Based on prior research, we hypothesized that (1) a multi-joint NMES protocol would be more effective than a single-joint protocol, and (2) an individualized PT-derived multi-muscle NMES protocol would yield greater improvements than a standardized one-size-fits-all approach. Overall, our goal was to identify the stimulation protocol that most effectively promotes gait patterns resembling those of TD children. This paper presents the study design, including details of the stimulation protocols, the NMES-assisted walking system, and the outcome measures employed. These outcomes encompass both global measures, such as the Gait Deviation Index (GDI), our primary outcome measure, and targeted outcome measures, such as Dynamic Time Warping (DTW).
2. Materials and Methods
2.1. Participants
Children were eligible to participate in this study if they were diagnosed with spastic diplegic CP, aged between 7 and 18 years old, and had Gross Motor Function Classification System (GMFCS) levels II or III. After advertising Institutional Review Board (IRB) approved recruitment flyers through outpatient CP clinics and local referral channels, we recruited six children with the characteristics detailed in Table 1. Prior to participation, parental consent and child assent were obtained from all volunteer participants. Subsequently, their height and weight were measured.
2.2. Study Design
2.2.1. Setup
To determine the most effective muscle combination in improving gait kinematics toward the typical, this study comprised a single session in which each participant was exposed to seven distinct stimulation protocols while walking on a treadmill, hereinafter referred to as NEMS conditions, and a no-stimulation condition as the baseline. Each condition lasted approximately 1 minute and was repeated three times (a total of 24 trials), with a 5-minute rest interval between conditions and a 30-second rest between trials (Figure 1). Participants who were unable to complete all trials of the conditions in a single session returned the following day. The NMES conditions were as follows:
- Baseline: Participants walked on the treadmill without NMES. As there was no electrical stimulation, we called this condition “NoStim”.
- Literature-derived: Participants walked on the treadmill while receiving NMES assistance based on typical muscle activation patterns during walking. These patterns were derived from typical lower limb Electromyography (EMG) data during gait reported in existing literature [55]. The targeted muscle groups included TA, RF, Gluteus Maximus (Gmax), and Hamstring (Ham). All participants received NMES using a uniform protocol, which we referred to as the "All" condition.
- PT-derived: Muscle combinations and phase timing were prescribed via consensus among three experienced pediatric PTs. After reviewing standardized gait videos, the therapists identified primary kinematic sagittal-plane deviations and selected specific muscles to target those deficits across the stance and swing phases. Details of this method can be found in our previous work [50].
- TRG: Participants walked on the treadmill while receiving NMES assistance to the prominent lower limb extensor muscles: TS, RF, and Gmax muscles.
- TA: Participants walked on the treadmill, receiving NMES assistance solely for the TA muscle.
- RF: Participants walked on the treadmill while NMES was solely applied to the RF muscle.
- Gmax: Participants walked on the treadmill while NMES was solely applied to the Gmax muscle.
- TS: Participants walked on the treadmill while NMES was solely applied to the TS muscle.
The first three stimulation conditions involved stimulating various combinations of lower limb muscles across multiple joints, constituting the multi-muscle NMES protocols (All, PT-derived, and TRG). Conversely, the remaining four conditions (TA, RF, Gmax, and TS) isolated assistance to a single muscle each, comprising the single-muscle protocols. All participants underwent the baseline “NoStim” condition first and then completed the remaining seven conditions in a randomized order (Figure 1). During all conditions, subjects walked at their self-selected walking speed (SSWS) on the treadmill with handrails on each side for participants to use. The SSWS was initially derived from the 10-meter walk test (10MWT) overground. A comfortable treadmill speed was then established based on participant feedback; if the overground speed felt too fast on the treadmill, it was adjusted to a more comfortable pace. A non-weight-bearing harness was utilized to mitigate the risk of stumbles or falls.
2.2.2. Data Collection
An eight-camera motion capture system (Motion Analysis Corporation, Santa Rosa, CA, USA) with a sampling rate of 128 Hz was utilized to capture gait kinematics. Kinetics were obtained using two force plates (Bertec, Columbus, OH, USA) with a sampling rate of 3200 Hz. To ensure full-body movement capture, 33 reflective markers were placed on anatomical landmarks, including the shoulders, trunk, pelvis, legs, and feet.
To identify the more affected side, each subject’s ankle, knee, and hip joints were assessed, with the side showing the lowest active and passive range of motion designated as the more affected side.
2.3. System
2.3.1. Neuromuscular Electrical Stimulation
In this study, the core technology we employed was our previously customized multi-musclejoint NMES-assisted gait training system with the capability of targeting up to 10 muscle groups bilaterally during each phase of gait: left and right TA, RF, Gmax, Ham, and TS. [48,49,50,51]. The system setup consisted of two inertial measurement units (IMUs) (OpalTM, APDM, Portland, OR, USA) placed on the shank, two stimulators (RehaStim, Hasomed Inc., Magdeburg, Germany), and a custom gait phase detection (GPD) algorithm [49] implemented in LabVIEW (National Instruments, Austin, TX, USA). The GPD algorithm identified gait phases by analyzing wireless inputs of left and right shank angular velocities, enabling finite-state control of stimulation timing. Using predefined rules derived from angular velocity profile features, the algorithm distinguished the seven phases of gait: loading response (LR), mid-stance (MSt), terminal stance (TSt), pre-swing (PSw), initial swing (ISw), mid-swing (MSw), and terminal swing (TSw) [49]. Validation in children with CP demonstrated accurate performance, with root mean square errors for phase onset detection ranging from 63 ms (LR and PSw) to 127 ms (MSw) when compared with motion capture.
By incorporating the GPD system, designed specifically for the CP population, this system could independently modulate the stimulation intensity over each gait phase for each muscle, resulting in increased customization flexibility. A customized LabVIEW-based application programming interface (API) was employed to enable real-time updates to the stimulation parameters. This included adjustments to stimulation delivery timing, stimulation intensity (current and pulse duration), and the selection of target muscles for stimulation (stimulation channels), all while subjects walked on a treadmill. The system delivered a biphasic stimulation waveform. To compensate for the inherent system delay in applying the stimulation, we incorporated a compensation strategy to account for the time delays [48]. For each gait phase, stimulation was triggered once 75% of the duration of the preceding gait phase was reached. The 75% threshold was fixed across all of the phases and was empirically determined to compensate for processing and hardware communication delays, including the time between IMU-based measurement of shank angular velocity and the moment the stimulator delivers the pulse to the skin [48].
2.3.2. Adjusting Stimulation Intensity
We precisely determined the subject-specific functional stimulation intensity for each of the five bilateral lower limb muscle groups, resulting in a total of 10 intensities. This process, known as thresholding, involved two key steps for each muscle: (1) determining the motor threshold (MT) and (2) identifying the functional intensity level. The setup for stimulation delivery involved placing electrodes according to the Robinson and Snyder-Mackler protocol [56] on muscles targeted by each stimulation program. To ensure accurate electrode placement and stimulation thresholding, a preliminary low-level stimulation was administered.
To determine the MT of a muscle, the subject stood or sat to relax the target muscle. The stimulation current was initially set at 30 mA. The pulse duration was then gradually increased from zero in 5 µs increments until a strong muscle twitch, indicating MT, was observed. If no muscle twitch occurred by the time the pulse duration reached 250 µs, the current was increased by 10 mA, and the pulse duration was again incrementally increased from zero. The stimulation frequency was set at 40 Hz. To identify the functional stimulation level of the muscle, the stimulation train duration for each phase was set to match the duration of the target gait phase (typically 50-300 ms), measured during the “NoStim” condition. The subject then assumed the position corresponding to the target phase, and the pulse width and current were increased incrementally from the MT intensity, in a manner similar to MT identification, until either the functional goals specific to the phase and muscle were achieved or the subject’s maximum tolerance was reached.
For instance, to adjust the functional level of stimulation for the TS muscles, the participants stood and positioned their lower limbs as they would during the PSw phase. The stimulation intensity was increased above the MT until the muscle contraction could lift the heel off the ground, representing the TS's phase-specific functional role. The detailed thresholding procedure is published as supplementary material [50].
If stimulation thresholding occurred the day prior to gait analysis, markings were made on the legs to indicate the corners of each electrode. These markings served as reference points for electrode placement the following day, when stimulation intensities were reassessed.
2.4. Outcome Measures
The primary goal of this study was to evaluate the overall influence of NMES on gait performance, rather than to correct isolated moments within the gait cycle. Although NMES was delivered at specific gait phases, our intent was to determine whether these localized interventions translated into global improvements in walking patterns. Accordingly, our primary outcome measure, the GDI, was selected for its ability to capture overall gait quality. A limited set of targeted outcome measures was also included, not to shift the focus toward single-muscle corrections, but to examine whether improvements at targeted joints or phases meaningfully translate into broader, global gait improvements. Notably, based on our prior work [50], the effects of NMES on targeted outcomes vary considerably across individuals, which can dilute their influence on whole-gait performance; thus, GDI provides a more stable metric for comparing NMES conditions.
2.4.1. Global Summary Outcome Measures
2.4.1.1. Gait Deviation Index
The primary outcome measure in this study was the GDI of the more affected side (left for subjects 1,2,5,6, and right for subjects 3 and 4). GDI is a reliable and comprehensive index of gait pathology based on 15 different kinematic measures (bilaterally) or nine unilaterally, including:
|
|
|
|
|
|
|
|
|
The similarity of our participants' gait (CP; the intervention group) to that of the control group, TD individuals in this study, was measured by the scaled distance of the kinematic measures from those of TDs [57]. This index has been proven to be effective in capturing overall gait kinematic changes in children with CP [54,58].
The GDI score ranges between 0 and 100, where 100 represents the TDs’ GDI score. An increase of ten GDI units corresponds to one standard deviation (SD) increase in gait similarity between CP subjects and those of controls [57]. An increase of 5.0 points is considered a clinically meaningful difference (CMD) in GDI [54]. The direction of kinematic improvements was defined as getting closer to those measured for TDs, a GDI of 100.
2.4.1.2 Coefficient of Variation
The coefficient of variation (CV) shows how much a set of numbers varies relative to their average, without being affected by the unit of measurement. By dividing the SD by the mean, the CV allows for the comparison of variability across different datasets, even if they use different units. A higher CV indicates greater dispersion around the mean. In this study, we used CV as one of the summary outcome measures to evaluate the effect of NMES on the lower limb joint angle variability in the sagittal plane. However, the conventional statistical CV is unsuitable for analyzing cyclical biomechanical data, such as joint angles, where the arithmetic mean over a full gait cycle can be at or near zero. This renders the standard CV calculation undefined or artificially inflated. Therefore, we employed the adapted CV proposed by D.A. Winter [59], which is a standard method in gait analysis. This 'variability-to-signal ratio' resolves this issue by replacing the problematic denominator with the mean of the absolute values of the signal, representing the average signal magnitude. This provides a stable, non-zero normalization factor, while the numerator represents the root mean square of the ensemble SD across the cycle [60]. To conduct this calculation, we first obtained the average mean and SD for each joint angle across all conditions using Visual 3D (V3D) software. Subsequently, we individually inserted the values for each joint under each condition into the following equation to derive the CV values for individual joints:
where N is the number of intervals over the stride, is the mean value of the variable at the interval, and σ is the standard deviation of variable X about.
To improve interpretability, GDI scores and the CV for each joint across all conditions were averaged for each participant, resulting in a composite metric denoted as and , respectively (Figure 2 and Figure 3). The mean and standard deviation of from the TD cohort were used to represent normative values on the graphs To better emphasize the changes from the baseline, we also subtracted the GDI from the “NoStim” condition in Table 2 and CV results from the “TD” results in Table 3.
2.4.2. Targeted Outcome Measures
Since global metrics such as GDI and CV average performance across the entire gait cycle, they may mask phase-specific or joint-level adaptations induced by NMES. Therefore, while standardized global indices were used to ensure consistent comparisons across stimulation protocols, we complemented them with targeted biomechanical measures to better capture the mechanisms directly influenced by stimulation. These included time-series analyses of ankle, knee, and hip kinematics using phase-specific DTW, maximum knee extension, and stride length. Particular emphasis was placed on the knee joint due to its central biomechanical role in gait efficiency, limb clearance, and stance stability. Reduced knee extension has been directly associated with increased metabolic cost in adolescents with CP [61], and longitudinal evidence indicates that knee contractures often develop earlier than hip or ankle contractures [62,63], underscoring the importance of early knee-focused intervention. By combining global indices with joint-level and temporal analyses, we aimed to determine whether localized improvements, especially at the knee, translated into broader functional gains.
2.4.2.1 Phase-by-Phase Evaluation: Dynamic Time Warping; Time Series Analysis of the Ankle, Knee, and Hip Joints in the Sagittal Plane
To quantify joint-specific and phase-specific adaptations, we performed DTW analysis on sagittal-plane ankle, knee, and hip kinematics. DTW is a time-series technique that measures similarity between two waveforms by allowing non-linear temporal alignment. Unlike traditional point-by-point comparisons, DTW stretches or compresses segments of a waveform to achieve optimal alignment, minimizing cumulative distance between signals. This makes it particularly suitable for gait analysis, where variations in stride duration or phase timing may occur even when overall movement patterns are similar.
Heel-strike (HS) and toe-off (TO) events of the more affected limb were identified using vertical ground reaction force (vGRF) thresholds (initial contact defined as vGRF > 20 N; TO defined as vGRF < 20 N). Gait cycles were defined from HS to subsequent HS and segmented into four phases: Loading Response (LR: HS to contralateral TO), Single Support Stance (SSt: contralateral TO to contralateral HS), Pre-Swing (PS: contralateral HS to ipsilateral TO), and Single Support Swing (SSw: ipsilateral TO to subsequent ipsilateral HS). All cycles were time-normalized to 100% using a custom MATLAB script to ensure consistent phase boundaries across subjects and conditions.
Sagittal plane joint angle waveforms were extracted from V3D for both CP and TD participants. For each joint and gait phase, CP waveforms were compared against the TD reference waveform, which served as the normative template of typical kinematics. DTW distance was calculated as the cumulative alignment cost between the two waveforms. Smaller DTW values indicated closer similarity to TD joint mechanics, whereas larger values reflected greater deviation. This phase-specific approach allowed us to determine how closely each stimulation condition approximated typical joint behavior while accounting for natural timing differences in gait.
2.4.2.2 Maximum Knee Extension and Stride Length
To investigate phase-specific effects, maximum knee extension and its variability across conditions, along with the stride length, were also quantified. Maximum knee extension angles were computed in V3D as the mean of the lowest knee angles, time-normalized to 100 % of the gait cycle, measured across all gait cycles for each subject under each condition. Stride length was determined by calculating the mean distance from HS to the subsequent HS of the more affected leg, considering the treadmill SSWS of each subject, across all gait cycles for every condition. We considered the mean maximum knee extension (°) and mean stride length (m) across all gait cycles.
Our focus on the knee joint stems from its crucial role in influencing crouch gait and facilitating stance-to-swing transitions in children with CP. As shown in this study and in our previous work [50,52], NMES configurations can produce selective improvements at individual joints or phases without uniformly affecting global metrics, underscoring the value of integrating both global and targeted measures to more fully characterize the mechanisms and effectiveness of multi-muscle and individualized NMES interventions.
Research manuscripts reporting large datasets that are deposited in a publicly available database should specify where the data have been deposited and provide the relevant accession numbers. If the accession numbers have not yet been obtained at the time of submission, please state that they will be provided during review. They must be provided prior to publication.
2.4.3. Statistical Analysis
Statistical analysis was performed on all the targeted outcome measures using MATLAB R2023b (MathWorks, Inc., Natick, MA). Given the small sample size and repeated-measures design, the non-parametric Friedman test was used to assess differences among stimulation conditions. Significant Friedman tests were followed by pairwise comparisons using two-sided exact Wilcoxon signed-rank tests, contrasting each active condition against the “NoStim” baseline. To control for Type I error across multiple comparisons, the False Discovery Rate (FDR) was controlled using the Benjamini-Hochberg procedure. A p-value of < 0.05 was considered statistically significant for the Friedman tests, and an FDR-adjusted p-value of < 0.05 was considered statistically significant for pairwise comparisons. Kendall’s coefficient of concordance (W) was reported as the effect size for Friedman tests, and matched-pairs rank-biserial correlation (rrb) was reported for pairwise comparisons. For pairwise comparisons in the DTW outcome measure, the change was calculated as the active-condition DTW minus the NoStim DTW; therefore, negative values indicated greater similarity to the TD reference waveform under stimulation.
The “Gmax” condition was omitted for CP05 due to the muscle's heightened sensitivity and the subject's reluctance to use NMES there. Consequently, this condition was excluded from the omnibus statistical analysis. This decision was made to avoid the potential instability of mixed-effects modeling in small sample sizes (N=6) and to facilitate a standard repeated measures analysis. Excluding the incomplete condition satisfied the requirement for complete datasets while retaining the full sample size for the remaining conditions, thereby preserving statistical power.
For the global outcome measures, we assessed normality using the Shapiro-Wilk test. To evaluate our first hypothesis, we calculated the mean ± SD of the multi-muscle and single-muscle values. We then conducted either a paired t-test for normally distributed data or a Wilcoxon signed-rank test for non-normally distributed data. For the CV, we first calculated the absolute difference between each subject’s joint CV in each condition and the corresponding TDs’ joint CV, effectively using the TD values as a baseline for our analysis (Table 3). Next, for each subject, we averaged these absolute distances from the TD across conditions, dividing them into two groups: multi-muscle and single-muscle . We followed the same statistical procedures as used for the to evaluate which group’s was significantly closer to the TD values in each individual joint. Additionally, to better understand the overall effect of multi-muscle versus single-muscle conditions, we calculated the composite Euclidean distance from the TD across all three joints for every condition and then averaged those Euclidean distances within the two respective groups.
3. Results
3.1. GDI
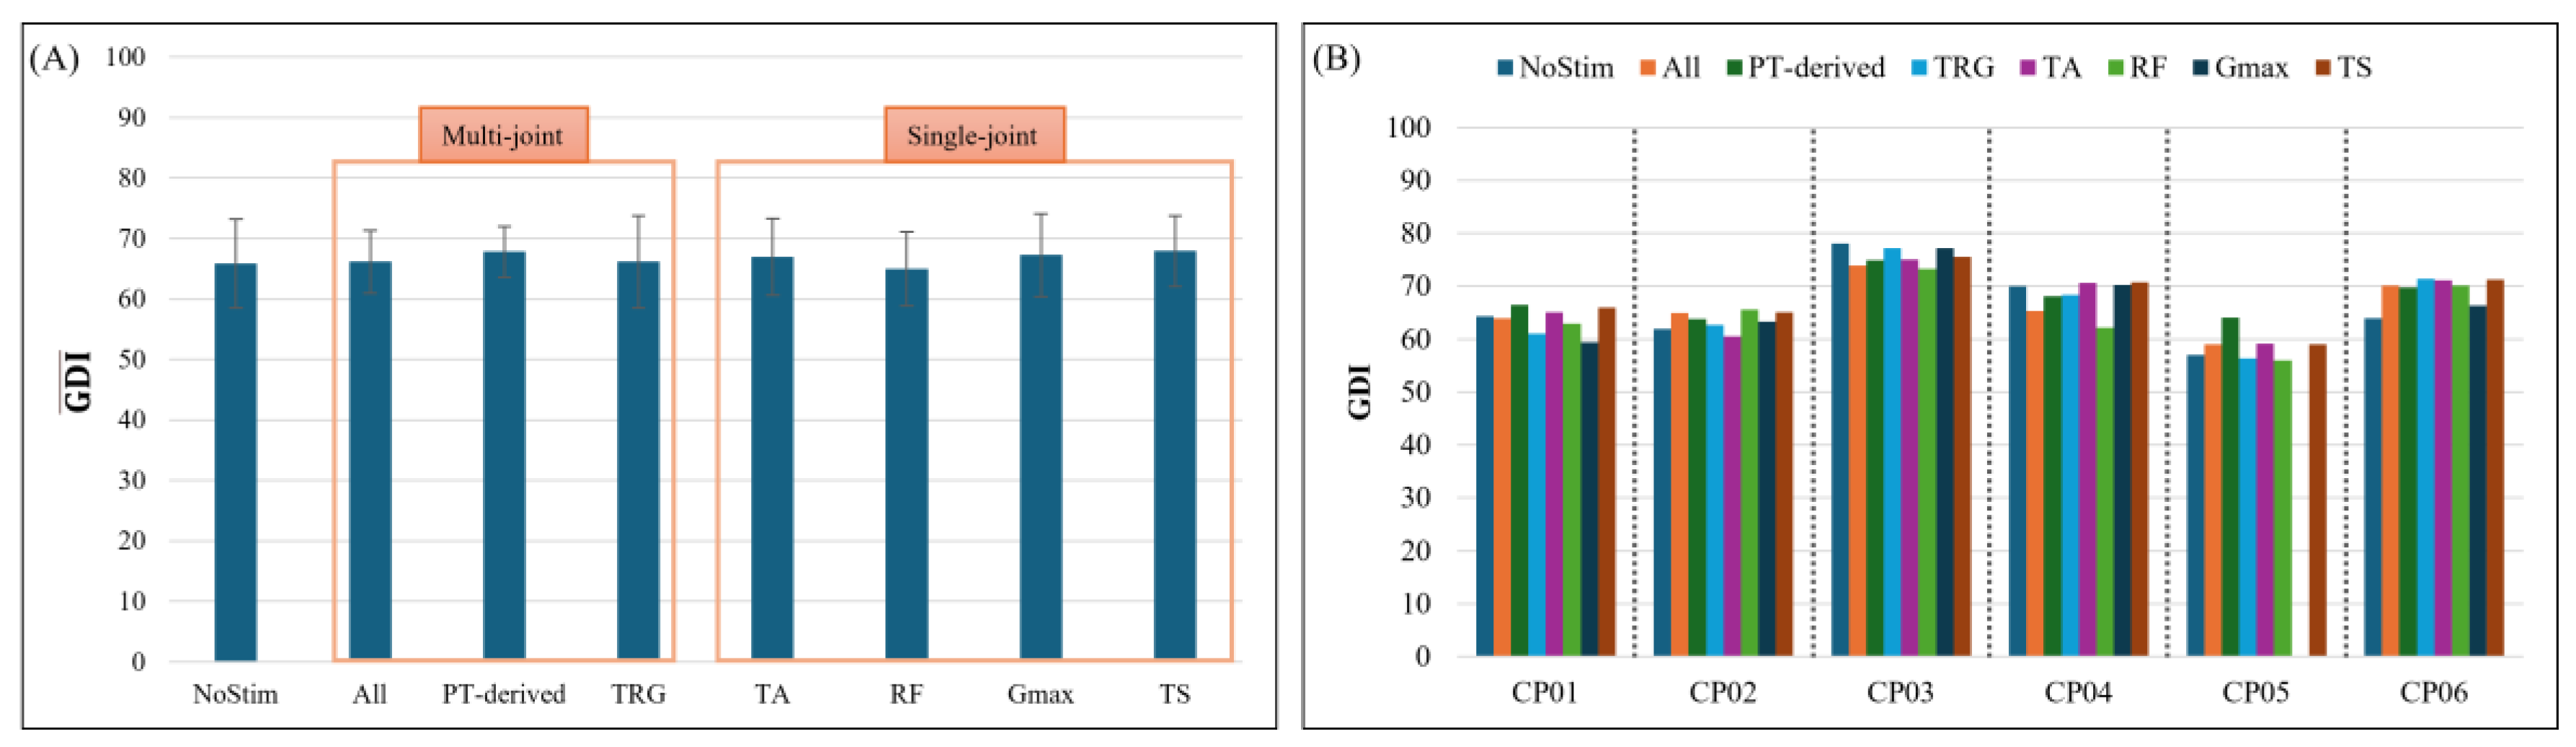
In CP01-04, none of the conditions had a GDI score that surpassed the CMD threshold (Table 2, Figure 2B). However, CP05 showed a clinically meaningful improvement in the GDI score for the “PT-derived” condition, with a 7.121-point increase from the “NoStim” baseline (Table 2, Figure 2B). In CP06, all conditions exceeded the CMD threshold except for the “Gmax” condition (Table 2, Figure 2B). Figure 2A also shows that none of the conditions’ scores surpassed the CMD threshold.
Figure 1.
(A) represents the mean Gait Deviation Index (GDI) for each condition across all subjects, with highlighted multi-joint and single-joint NMES protocols. (B) Shows GDI values for each condition for each participant. Each color corresponds to a different condition. NoStim = without any stimulation, All = typical muscle activation patterns, PT-derived = physical therapists’ chosen muscles, TRG = combined activation of Triceps Surae, Rectus Femoris, and Gluteus Maximus, TA = Tibialis Anterior, RF = Rectus Femoris, Gmax = Gluteus Maximus, and TS = Triceps Surae. Bars closer to GDI = 100 indicate more typical kinematics; GDI = 100 represents typically developing (TD) children.
Figure 1.
(A) represents the mean Gait Deviation Index (GDI) for each condition across all subjects, with highlighted multi-joint and single-joint NMES protocols. (B) Shows GDI values for each condition for each participant. Each color corresponds to a different condition. NoStim = without any stimulation, All = typical muscle activation patterns, PT-derived = physical therapists’ chosen muscles, TRG = combined activation of Triceps Surae, Rectus Femoris, and Gluteus Maximus, TA = Tibialis Anterior, RF = Rectus Femoris, Gmax = Gluteus Maximus, and TS = Triceps Surae. Bars closer to GDI = 100 indicate more typical kinematics; GDI = 100 represents typically developing (TD) children.
3.2. CV
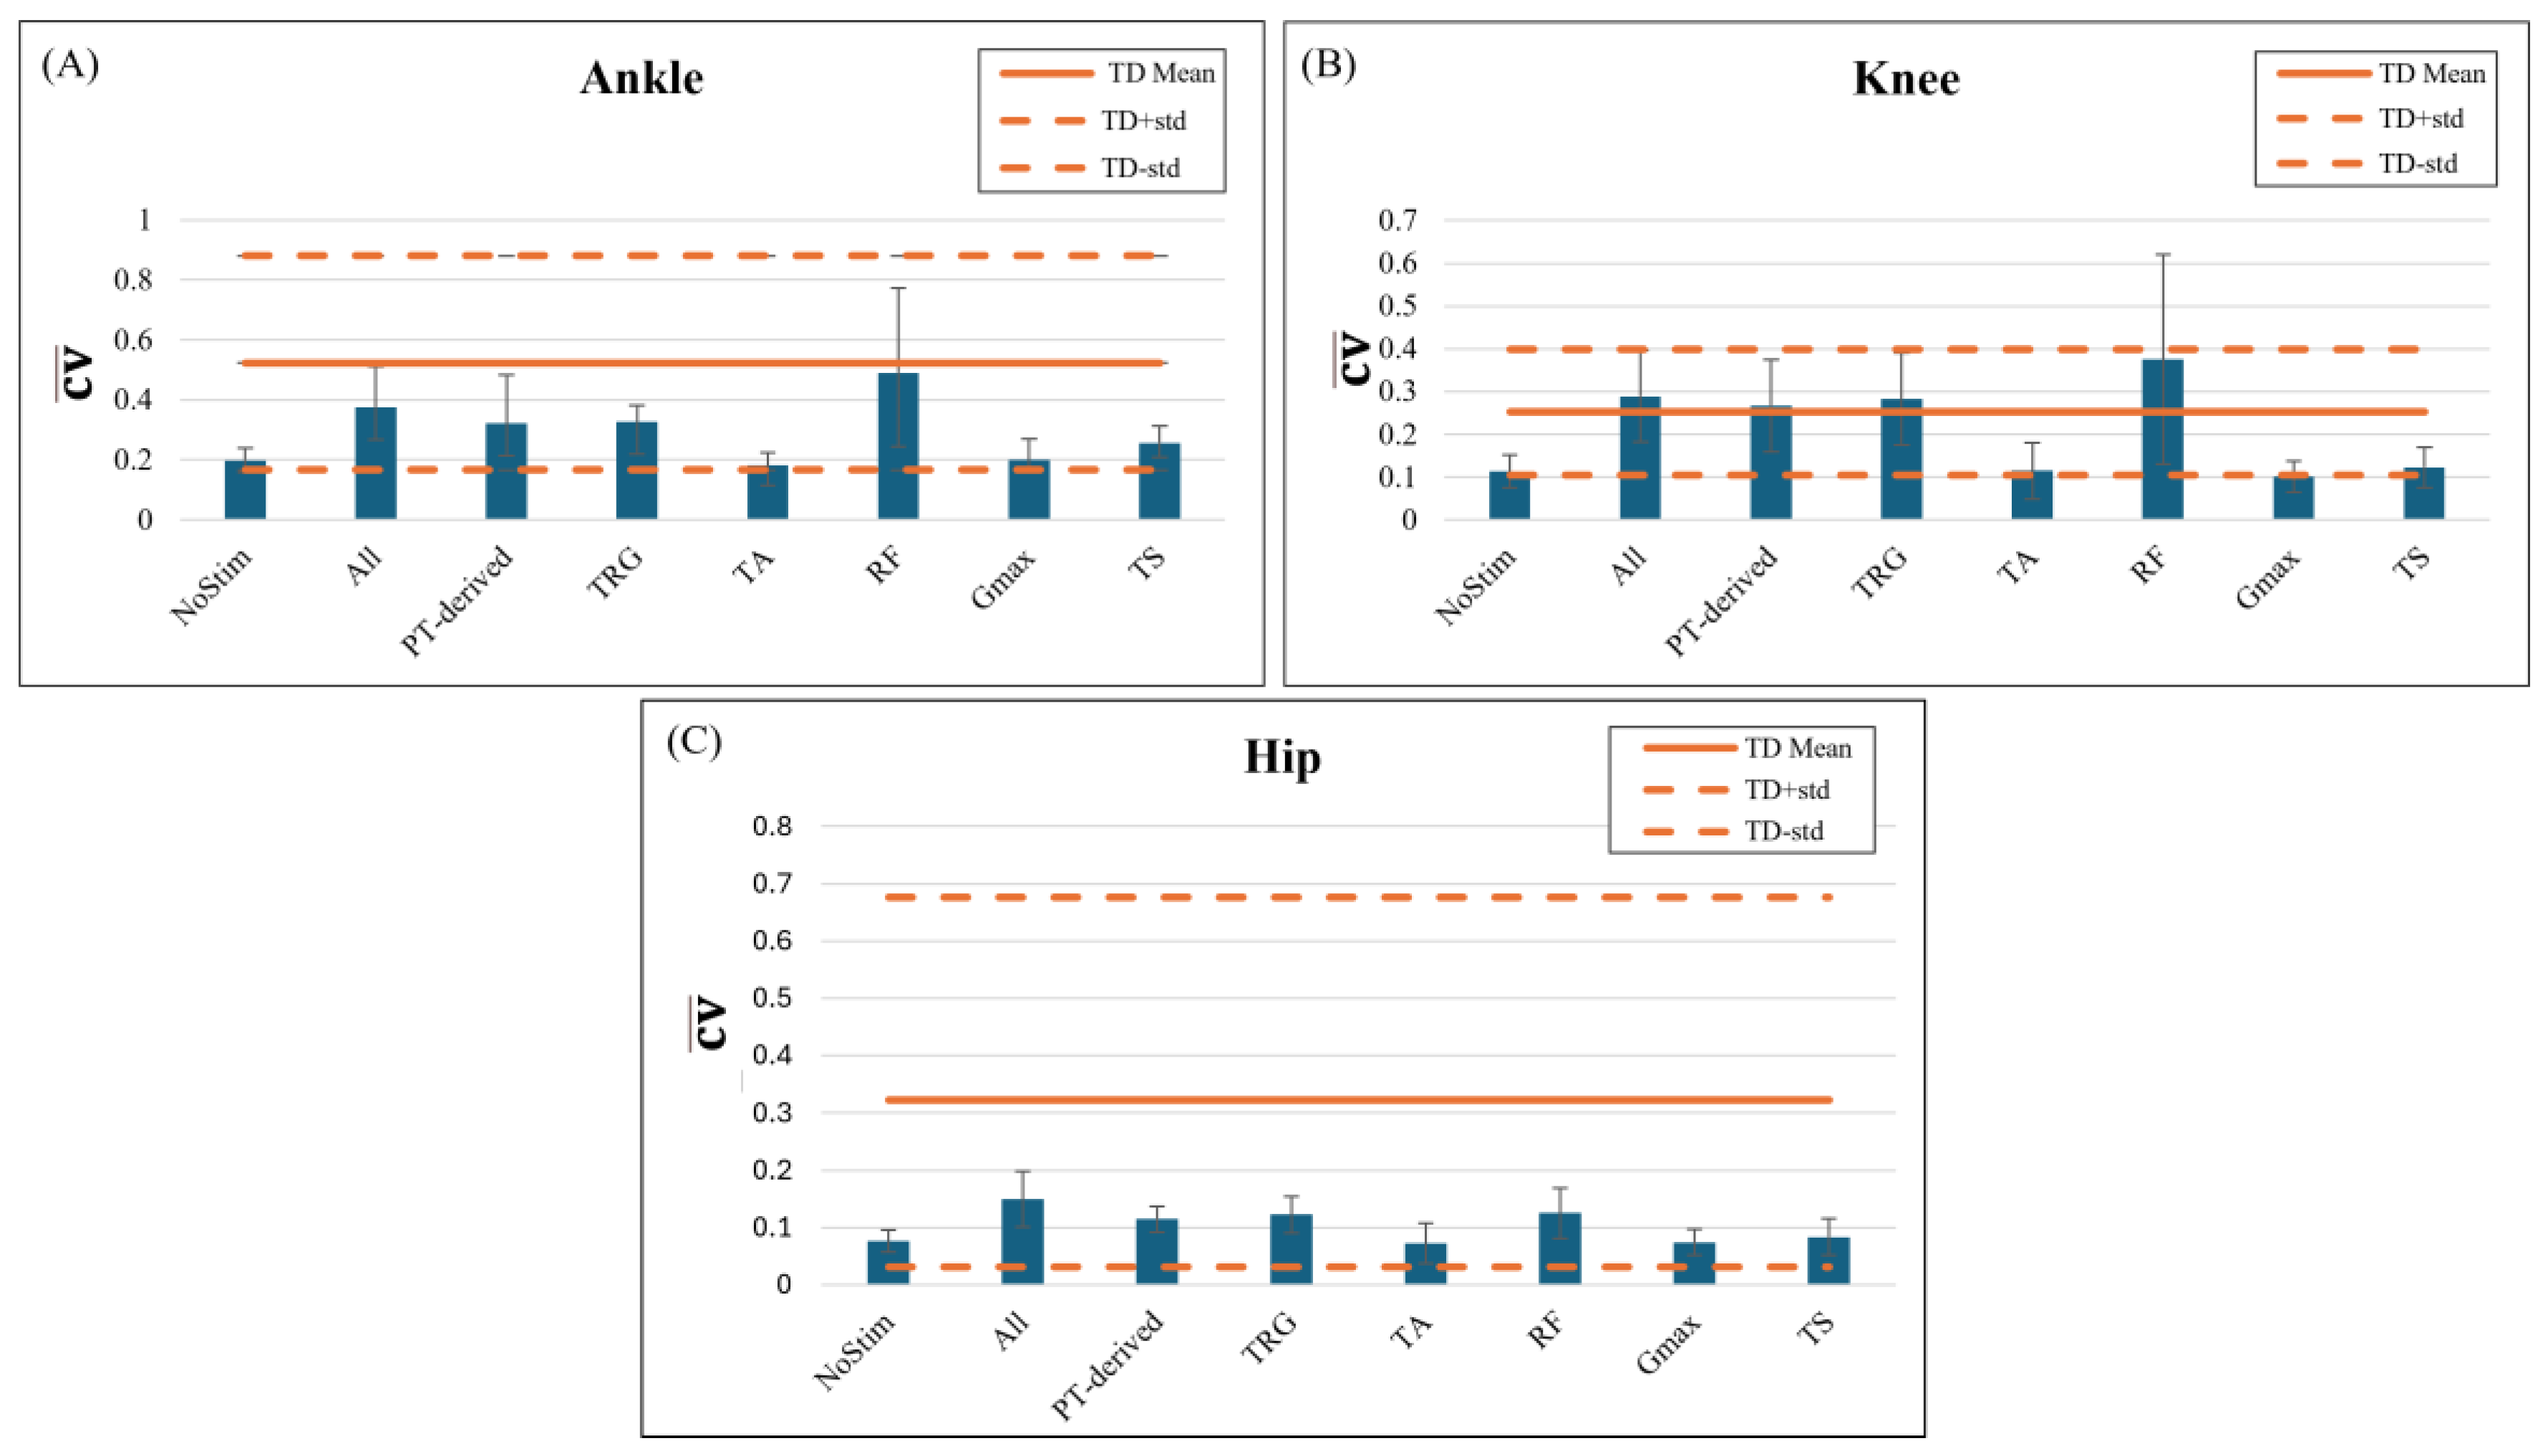
As illustrated in Figure 3, the TD group exhibited a higher for all the lower limb joints (ankle, knee, and hip) compared to the CP group (Table 3). At the ankle joint (Figure 3A), values for all conditions remained within the TD standard deviation range, with the “RF” condition exhibiting the highest value. Similarly, at the knee (Figure 3B), the “RF” condition displayed the highest , surpassing all other conditions and exceeding the TD mean. The “All”, “PT-derived”, and “TRG” conditions (the multi-muscle conditions) also demonstrated comparable values. In contrast, the hip joint s (Figure 3C) were consistently lower across all conditions, with no condition exceeding the TD mean.
Overall, the results indicate that “RF” stimulation produced the highest at the ankle (closest to the TD mean) and knee, while all three multi-muscle conditions showed the closest value to the TD mean for the knee and hip joints.
Figure 2.
Averaged Coefficient of Variation () for each condition across all subjects for (A) Ankle joint, (B) Knee joint, (C) Hip joint. Higher values indicate getting closer to the typically developing (TD) children (control group).
Figure 2.
Averaged Coefficient of Variation () for each condition across all subjects for (A) Ankle joint, (B) Knee joint, (C) Hip joint. Higher values indicate getting closer to the typically developing (TD) children (control group).
3.3. Dynamic Time Warping Per Gait Phase
3.3.1. Ankle Joint
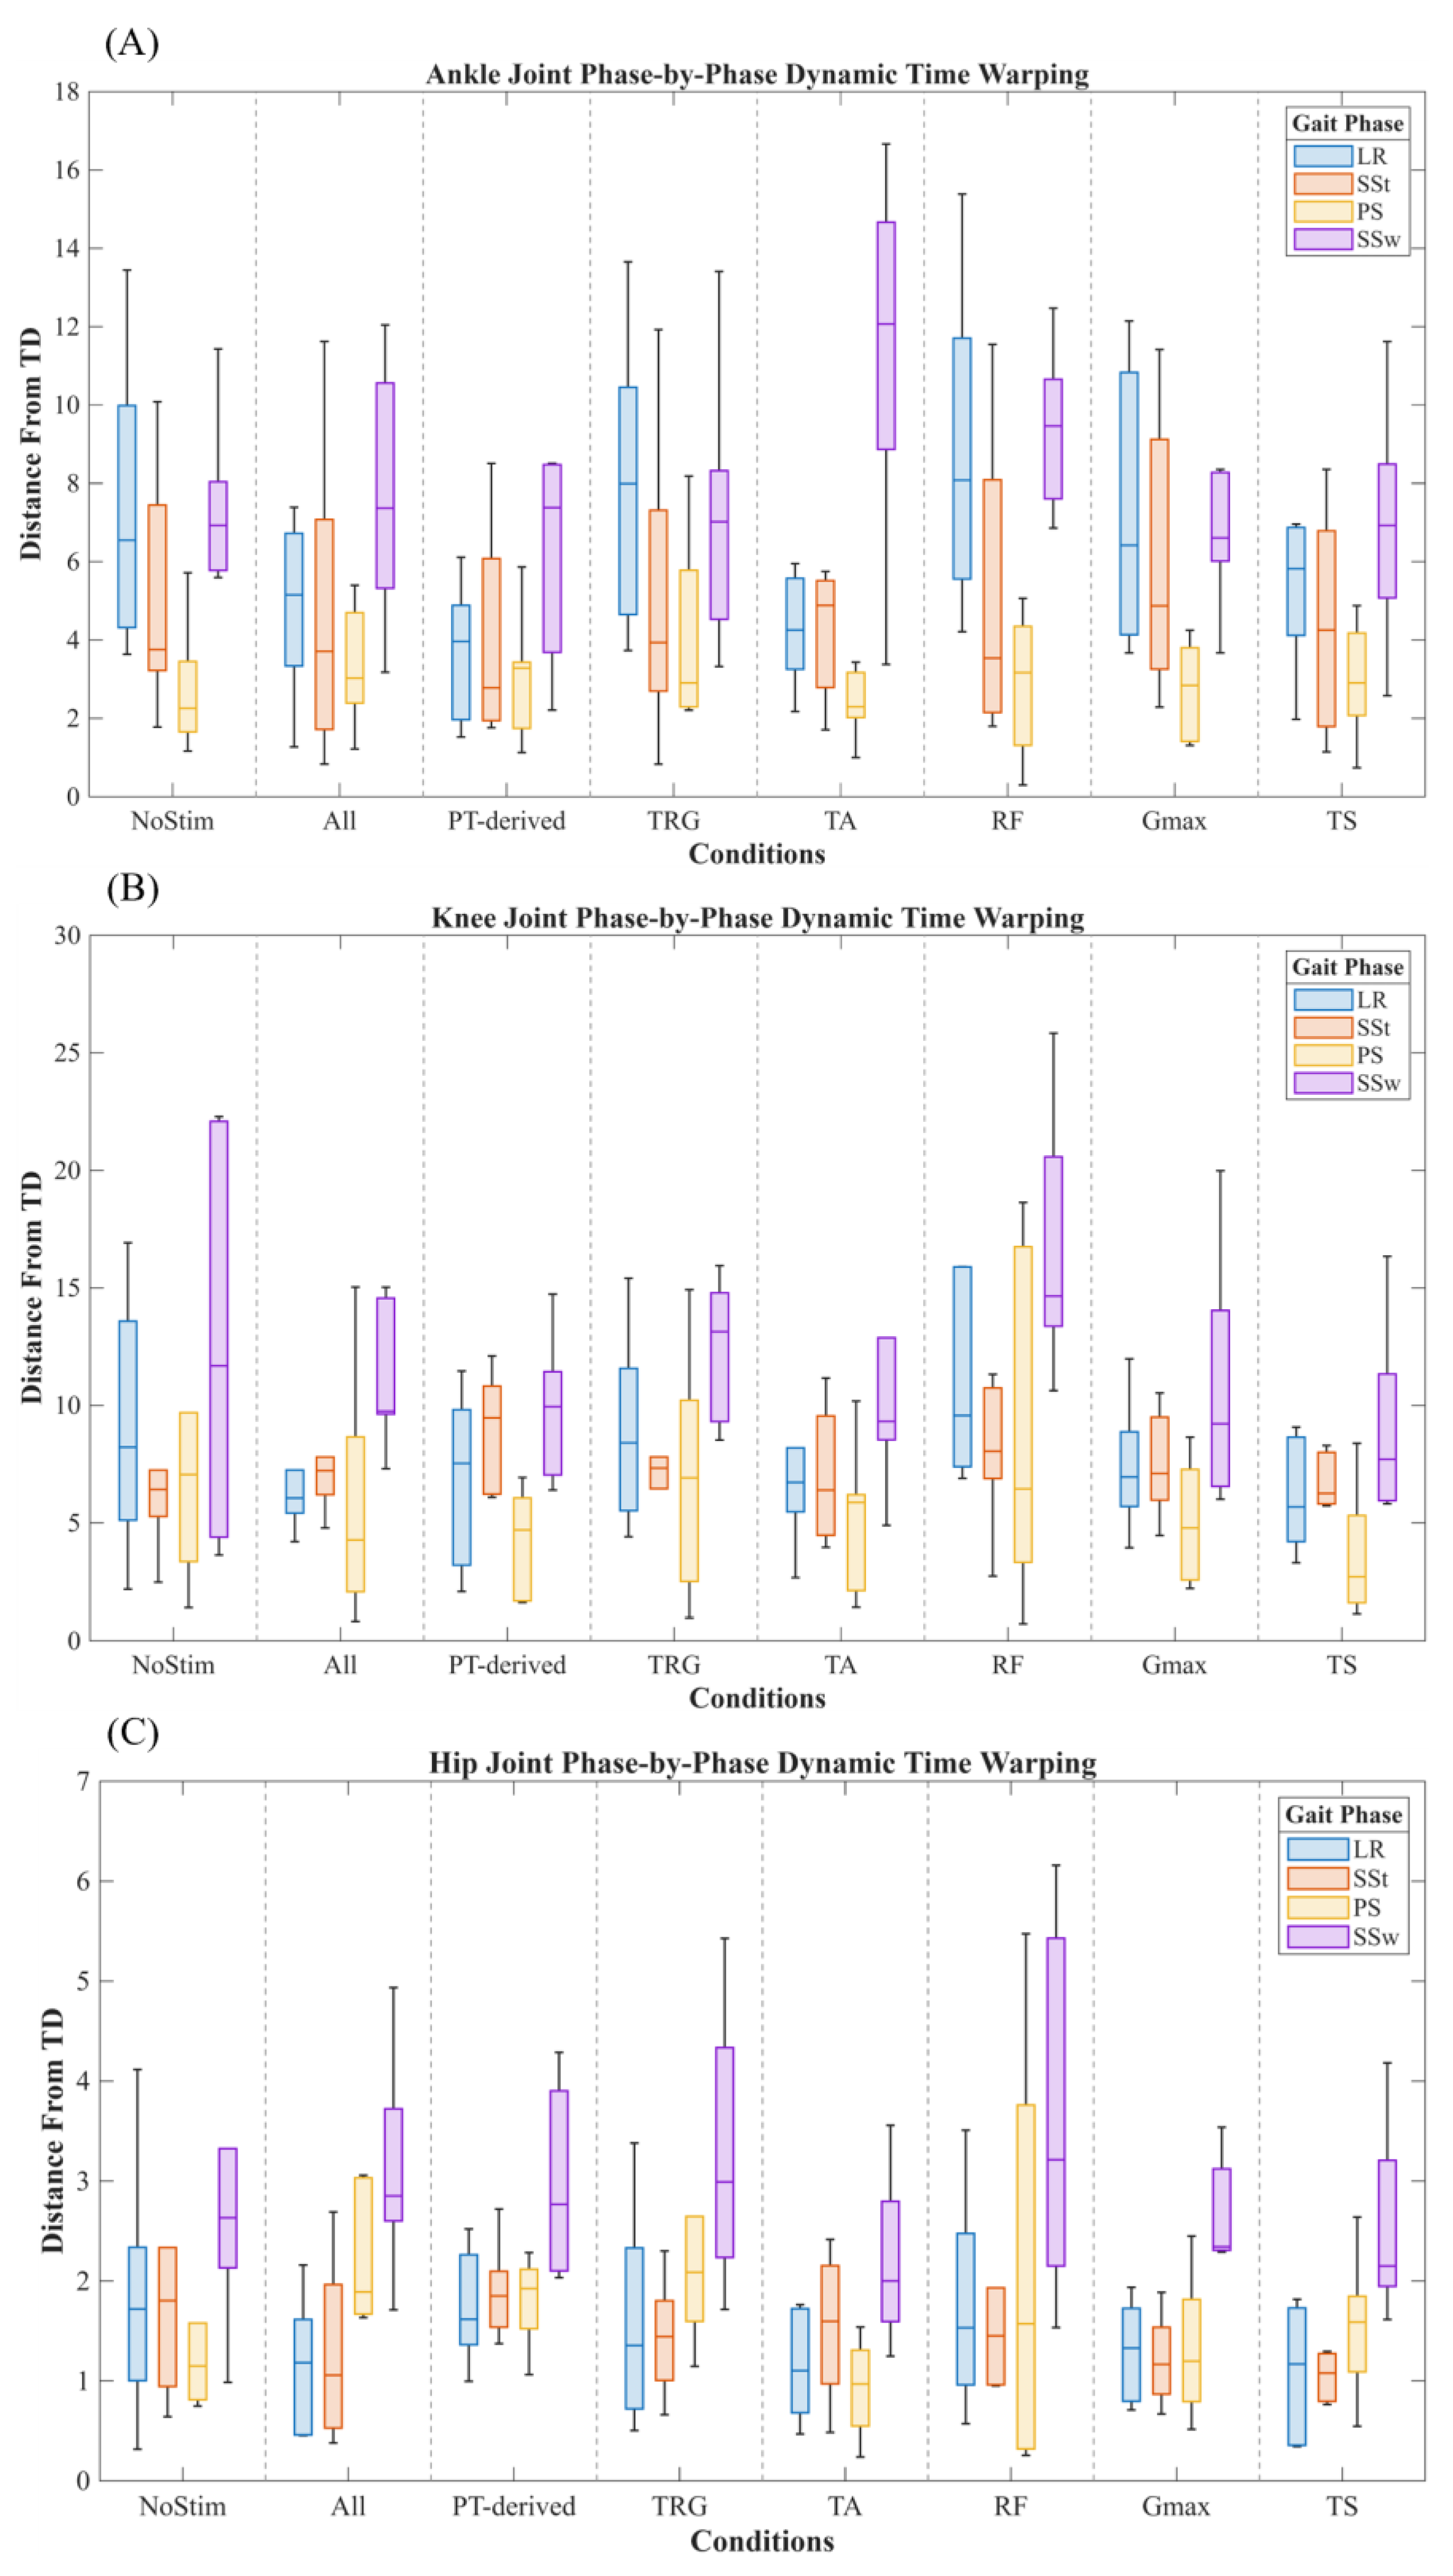
Phase-specific analysis of ankle joint DTW distances revealed a significant overall effect of stimulation condition during Loading Response (LR; Friedman χ²(6) = 17.64, P = 0.007, Kendall’s W = 0.49; Figure 4A). In contrast, no significant overall effects were observed during Single Support Stance (SSt; χ²(6) = 2.14, P = 0.906, W = 0.06), Pre-Swing (PS; χ²(6) = 4.64, P = 0.590, W = 0.13), or Single Support Swing (SSw; χ²(6) = 10.86, P = 0.093, W = 0.30).
During LR, the median DTW distance was lower for all active conditions except TRG and RF compared with NoStim. The largest reduction in median DTW was observed for the PT-derived condition (median ΔDTW = −4.57), followed by TA (ΔDTW = −1.96) and TS (ΔDTW = −1.44). The strongest pairwise effect was observed for TA (rrb = −0.90) and PT-derived (rrb = −0.71). However, none of the individual comparisons with NoStim remained statistically significant after Benjamini–Hochberg FDR correction.
3.3.2. Knee Joint
No significant overall effect of stimulation condition was observed for knee joint DTW distances during any of the four gait phases (Figure 4B). Friedman tests were nonsignificant during LR (χ²(6) = 9.07, P = 0.170, Kendall’s W = 0.25), SSt (χ²(6) = 9.86, P = 0.131, W = 0.27), PS (χ²(6) = 6.93, P = 0.328, W = 0.19), and SSw (χ²(6) = 9.43, P = 0.151, W = 0.26).
3.3.3. Hip Joint
Hip joint DTW distances demonstrated a significant overall effect of stimulation condition during Pre-Swing (PS; Friedman χ²(6) = 14.57, P = 0.024, Kendall’s W = 0.40; Figure 4C). No significant overall effects were observed during LR (χ²(6) = 8.07, P = 0.233, W = 0.22), SSt (χ²(6) = 6.14, P = 0.407, W = 0.17), or SSw (χ²(6) = 4.21, P = 0.648, W = 0.12).
During PS, the TRG condition showed the largest increase in DTW relative to NoStim (median ΔDTW = 0.79; rrb = 1.00). The All and PT-derived conditions also showed increased DTW relative to NoStim, whereas TA showed a small reduction (median ΔDTW = −0.10; rrb = −0.62). Despite the significant omnibus effect during PS, none of the individual stimulation conditions differed significantly from NoStim after FDR correction.
Figure 3.
Phase-by-phase Dynamic Time Warping (DTW) distance between individuals with cerebral palsy (CP) and typically developing (TD) peers. Gait cycles were segmented into four distinct phases: Loading Response (LR), Single Support Stance (SSt), Pre-Swing (PS), and Single Support Swing (SSw). The DTW distances were calculated for the (A) Ankle joint, (B) Knee joint, and (C) Hip joint, compared to the TD reference group, averaged across all subjects for each experimental condition. Lower DTW values denote a smaller deviation from the TD group, indicating a higher degree of similarity in joint kinematic patterns. Although statistical analysis (α = 0.05) showed significant main effects in ankle and hip joints, pairwise post-hoc analysis did not confirm any significance between stimulation conditions and the “NoStim” baseline.
Figure 3.
Phase-by-phase Dynamic Time Warping (DTW) distance between individuals with cerebral palsy (CP) and typically developing (TD) peers. Gait cycles were segmented into four distinct phases: Loading Response (LR), Single Support Stance (SSt), Pre-Swing (PS), and Single Support Swing (SSw). The DTW distances were calculated for the (A) Ankle joint, (B) Knee joint, and (C) Hip joint, compared to the TD reference group, averaged across all subjects for each experimental condition. Lower DTW values denote a smaller deviation from the TD group, indicating a higher degree of similarity in joint kinematic patterns. Although statistical analysis (α = 0.05) showed significant main effects in ankle and hip joints, pairwise post-hoc analysis did not confirm any significance between stimulation conditions and the “NoStim” baseline.
3.4. Maximum Knee Extension
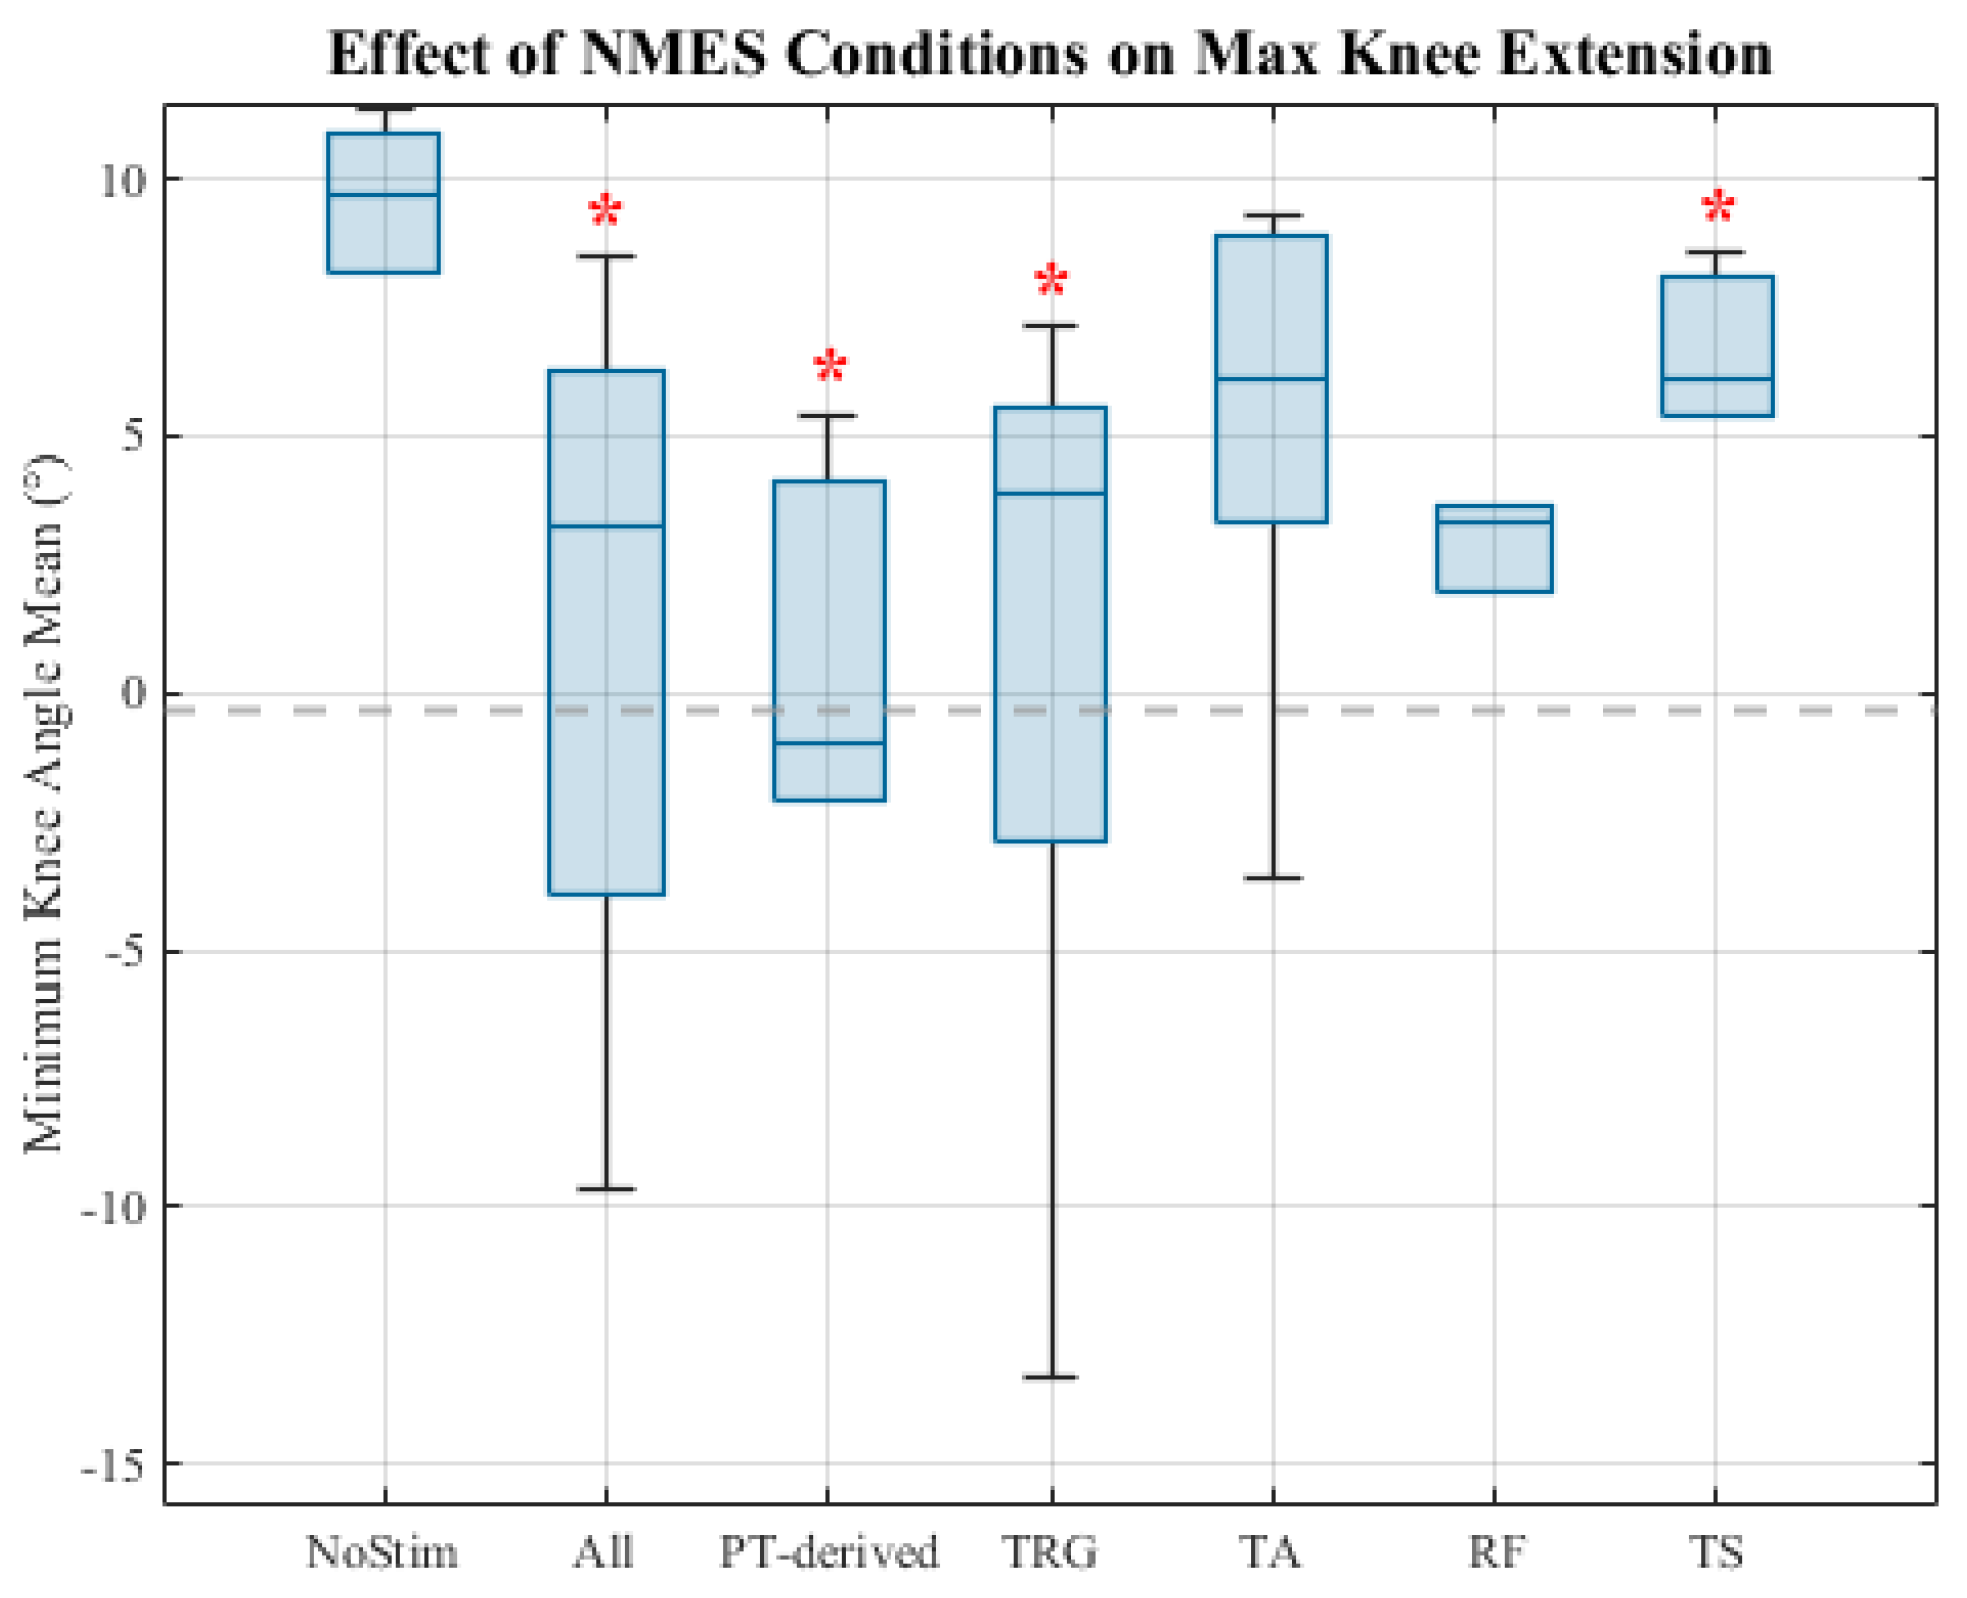
The Friedman test result revealed a significant main effect of stimulation conditions on maximum knee extension (X 2(6) = 19.43, P = 0.0035) with a large main effect (Kendall’s W = 0.54). Post-hoc analysis with FDR correction indicated that the following conditions resulted in significantly greater knee extension (i.e., lowering the flexion angle degree) compared to the “NoStim” baseline, with all of the significant conditions showing a very large effect (Figure 5): “All” (P = 0.047, r = -0.9), “PT-derived” (P = 0.047, r = -0.9), “TRG” (P = 0.047, r = -0.9), and “TS” (P = 0.047, r = -0.9). In contrast, the “TA” (P = 0.219) and “RF” (P = 0.075) conditions were not significantly different from the baseline.
To better differentiate the effectiveness of the significant NMES conditions (i.e., All, PT-derived, TRG, and TS) and compare them with the TD group's minimum knee angle, we calculated and compared their Median values. This measurement revealed that the lowest Median value is related to the “PT-derived” condition (Med = -1.004), while the medians of “All” (Med = 3.26), “TRG” (Med = 3.9), and “TS” (Med = 6.125) conditions were higher by at least 4.24 points. Notably, the “PT-derived” condition showed a result closer to the median of the minimum knee angle of the TD group, which achieved a median of -2.303.
Figure 4.
Mean values of the maximum knee extension angle (⁰) (corresponding to minimum knee angle) across all gait cycles and participants for each condition. The dashed gray line represents the mean maximum knee extension angle of typically developing (TD) children, serving as the control group. Positive values indicate knee flexion, while negative values indicate hyperextension. “All”, “PT-derived”, “TRG”, and “TS” conditions showed a statistically significant improvement (α = 0.05), reflected by a decrease in the flexion angle from the baseline (NoStim), and are marked with red asterisks.
Figure 4.
Mean values of the maximum knee extension angle (⁰) (corresponding to minimum knee angle) across all gait cycles and participants for each condition. The dashed gray line represents the mean maximum knee extension angle of typically developing (TD) children, serving as the control group. Positive values indicate knee flexion, while negative values indicate hyperextension. “All”, “PT-derived”, “TRG”, and “TS” conditions showed a statistically significant improvement (α = 0.05), reflected by a decrease in the flexion angle from the baseline (NoStim), and are marked with red asterisks.
3.5. Stride Length
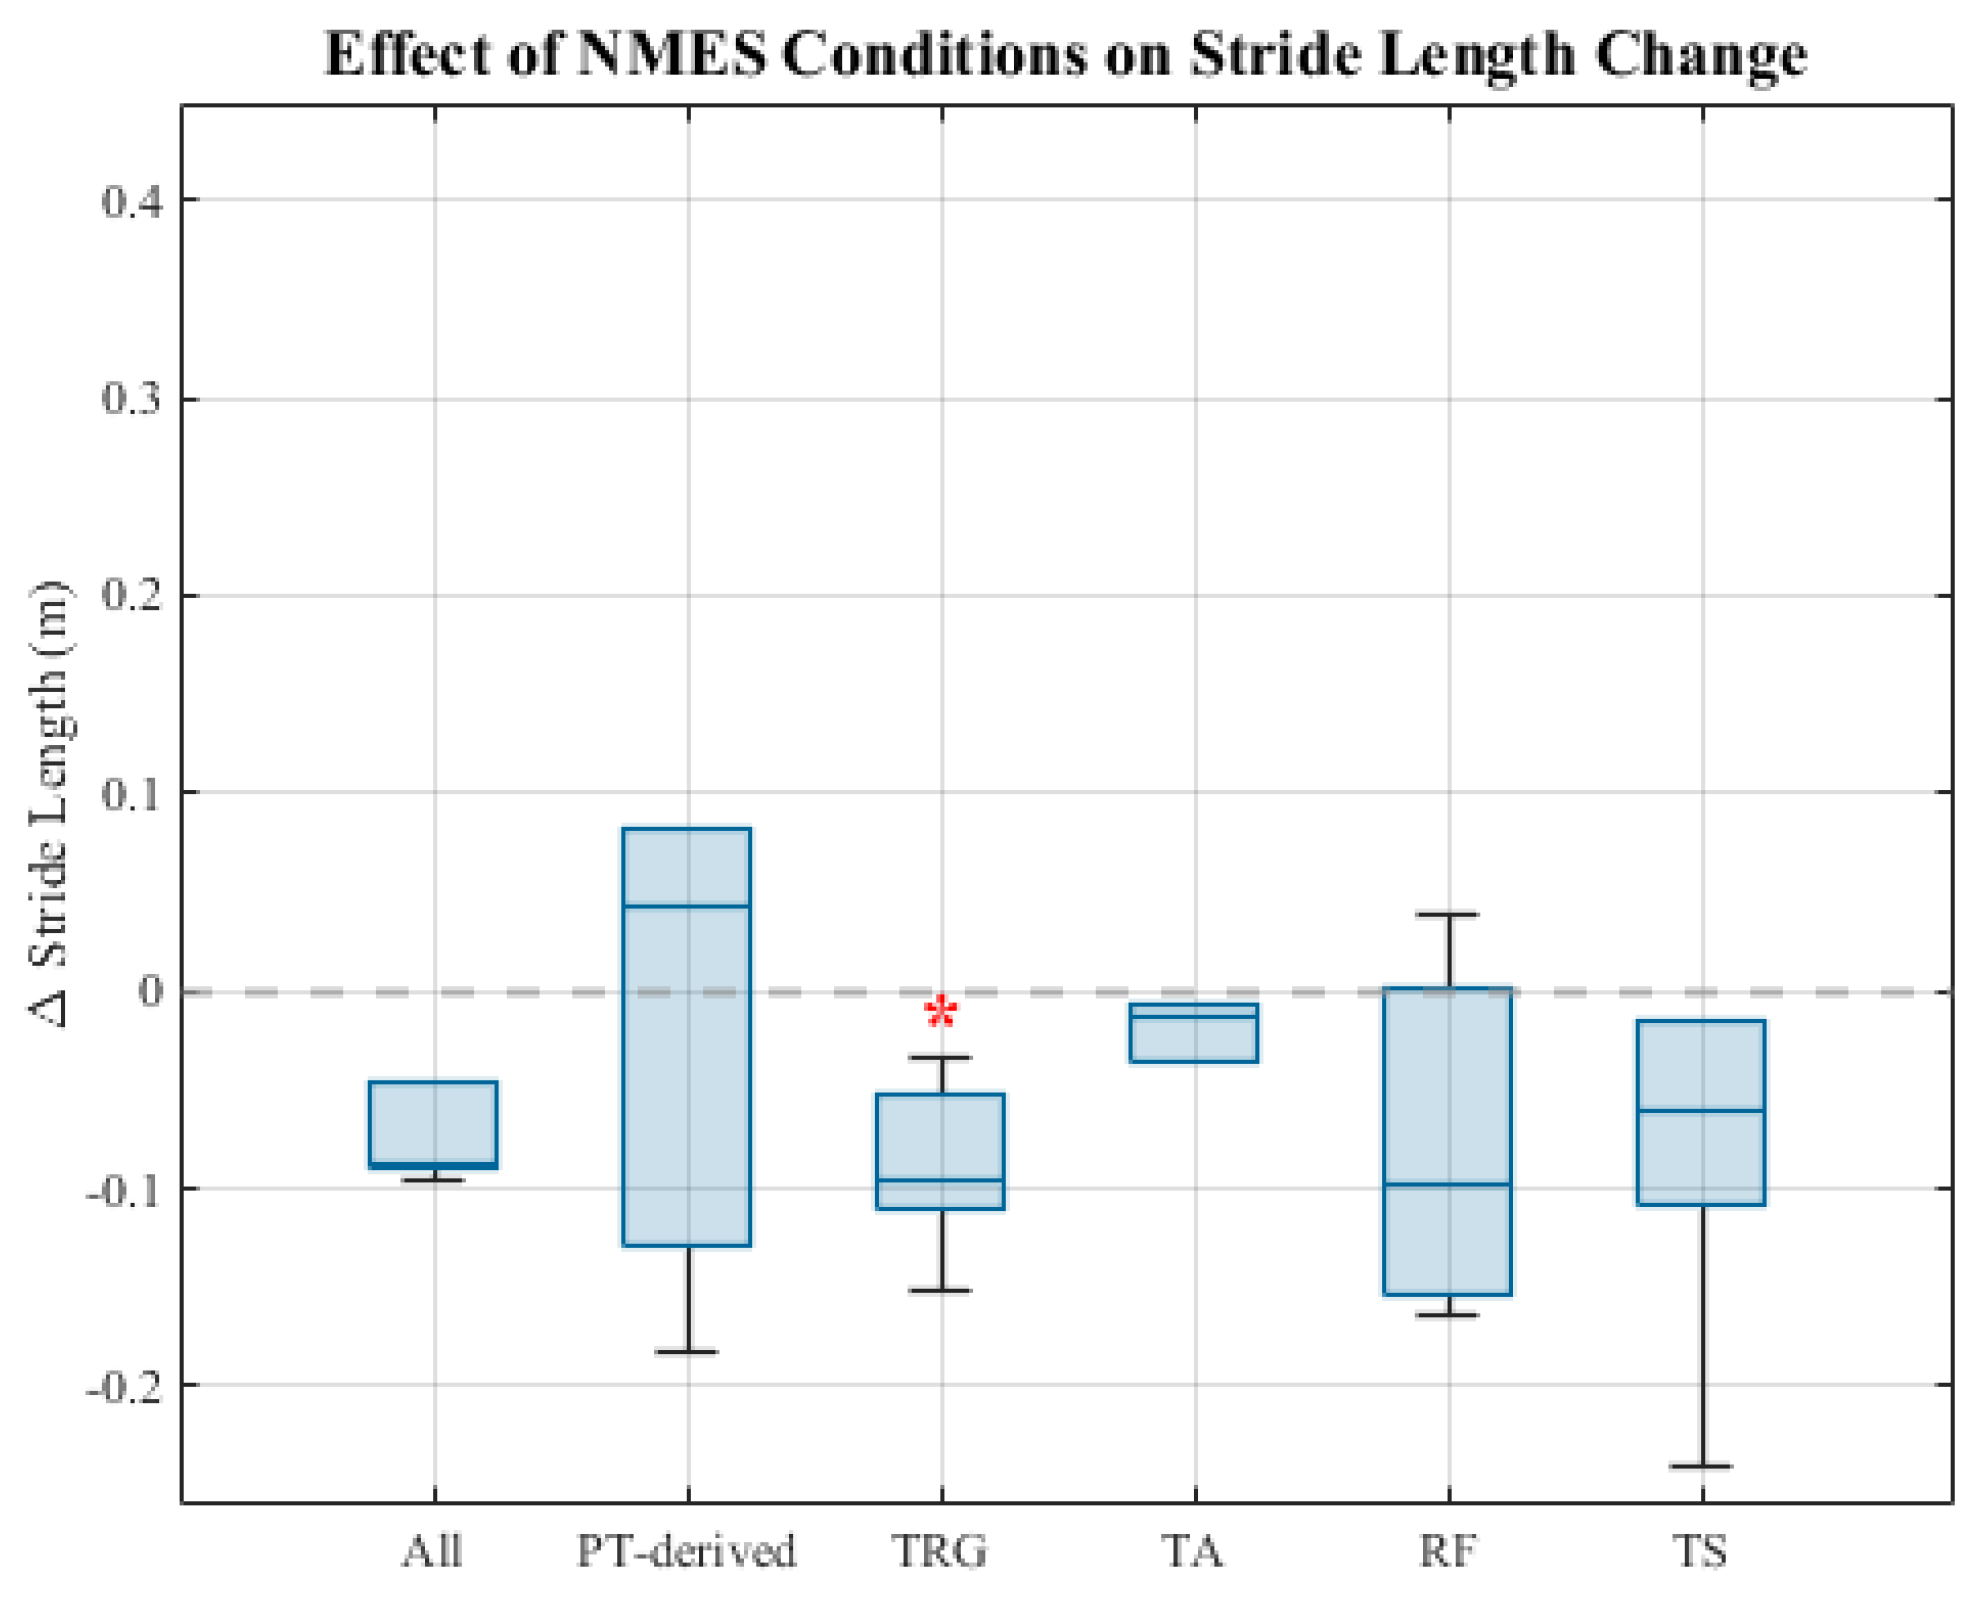
Statistical analysis of the stride length data showed a significant main effect of NMES conditions (X 2(6) = 13.09, P = 0.042) with a medium main effect (Kendall’s W = 0.36). Post-hoc analysis indicated that this effect was driven by the “TRG” condition (P = 0.0312, r = -0.9). As shown in Figure 6, and by considering the negative value of its effect size, this notable difference reflected a decrease in stride length rather than an improvement. Among all the conditions assessed, the only condition that resulted in a positive effect size was “PT-derived” (r = 0.13), although not significant (P = 0.84).
Figure 5.
Changes in stride length (m) from the baseline (NoStim) across all gait cycles and participants for each condition. The gray dashed line represents the baseline of zero, which helps to visualize the direction of change from this baseline. Negative values indicate a decrease in stride length, while positive values represent an increase. “TRG” condition, which showed a statistically significant (α = 0.05) difference from the baseline, is highlighted with a red asterisk, although this difference was not in the direction of improvement.
Figure 5.
Changes in stride length (m) from the baseline (NoStim) across all gait cycles and participants for each condition. The gray dashed line represents the baseline of zero, which helps to visualize the direction of change from this baseline. Negative values indicate a decrease in stride length, while positive values represent an increase. “TRG” condition, which showed a statistically significant (α = 0.05) difference from the baseline, is highlighted with a red asterisk, although this difference was not in the direction of improvement.
3.6. Multi-Muscle Vs. Single-Muscle
Paired t-test analysis on the mean ± SD of the scores of multi-muscle ( scores averaged over “All”, “PT-derived”, and “TRG”) (66.72 ± 5.541) and single-muscle (66.402 ± 6.019) conditions did not reveal any significant difference (P = 0.458) (Figure 7). However, the calculation of Cohen’s d (d = 0.328) indicated a small effect size favoring the multi-muscle group.
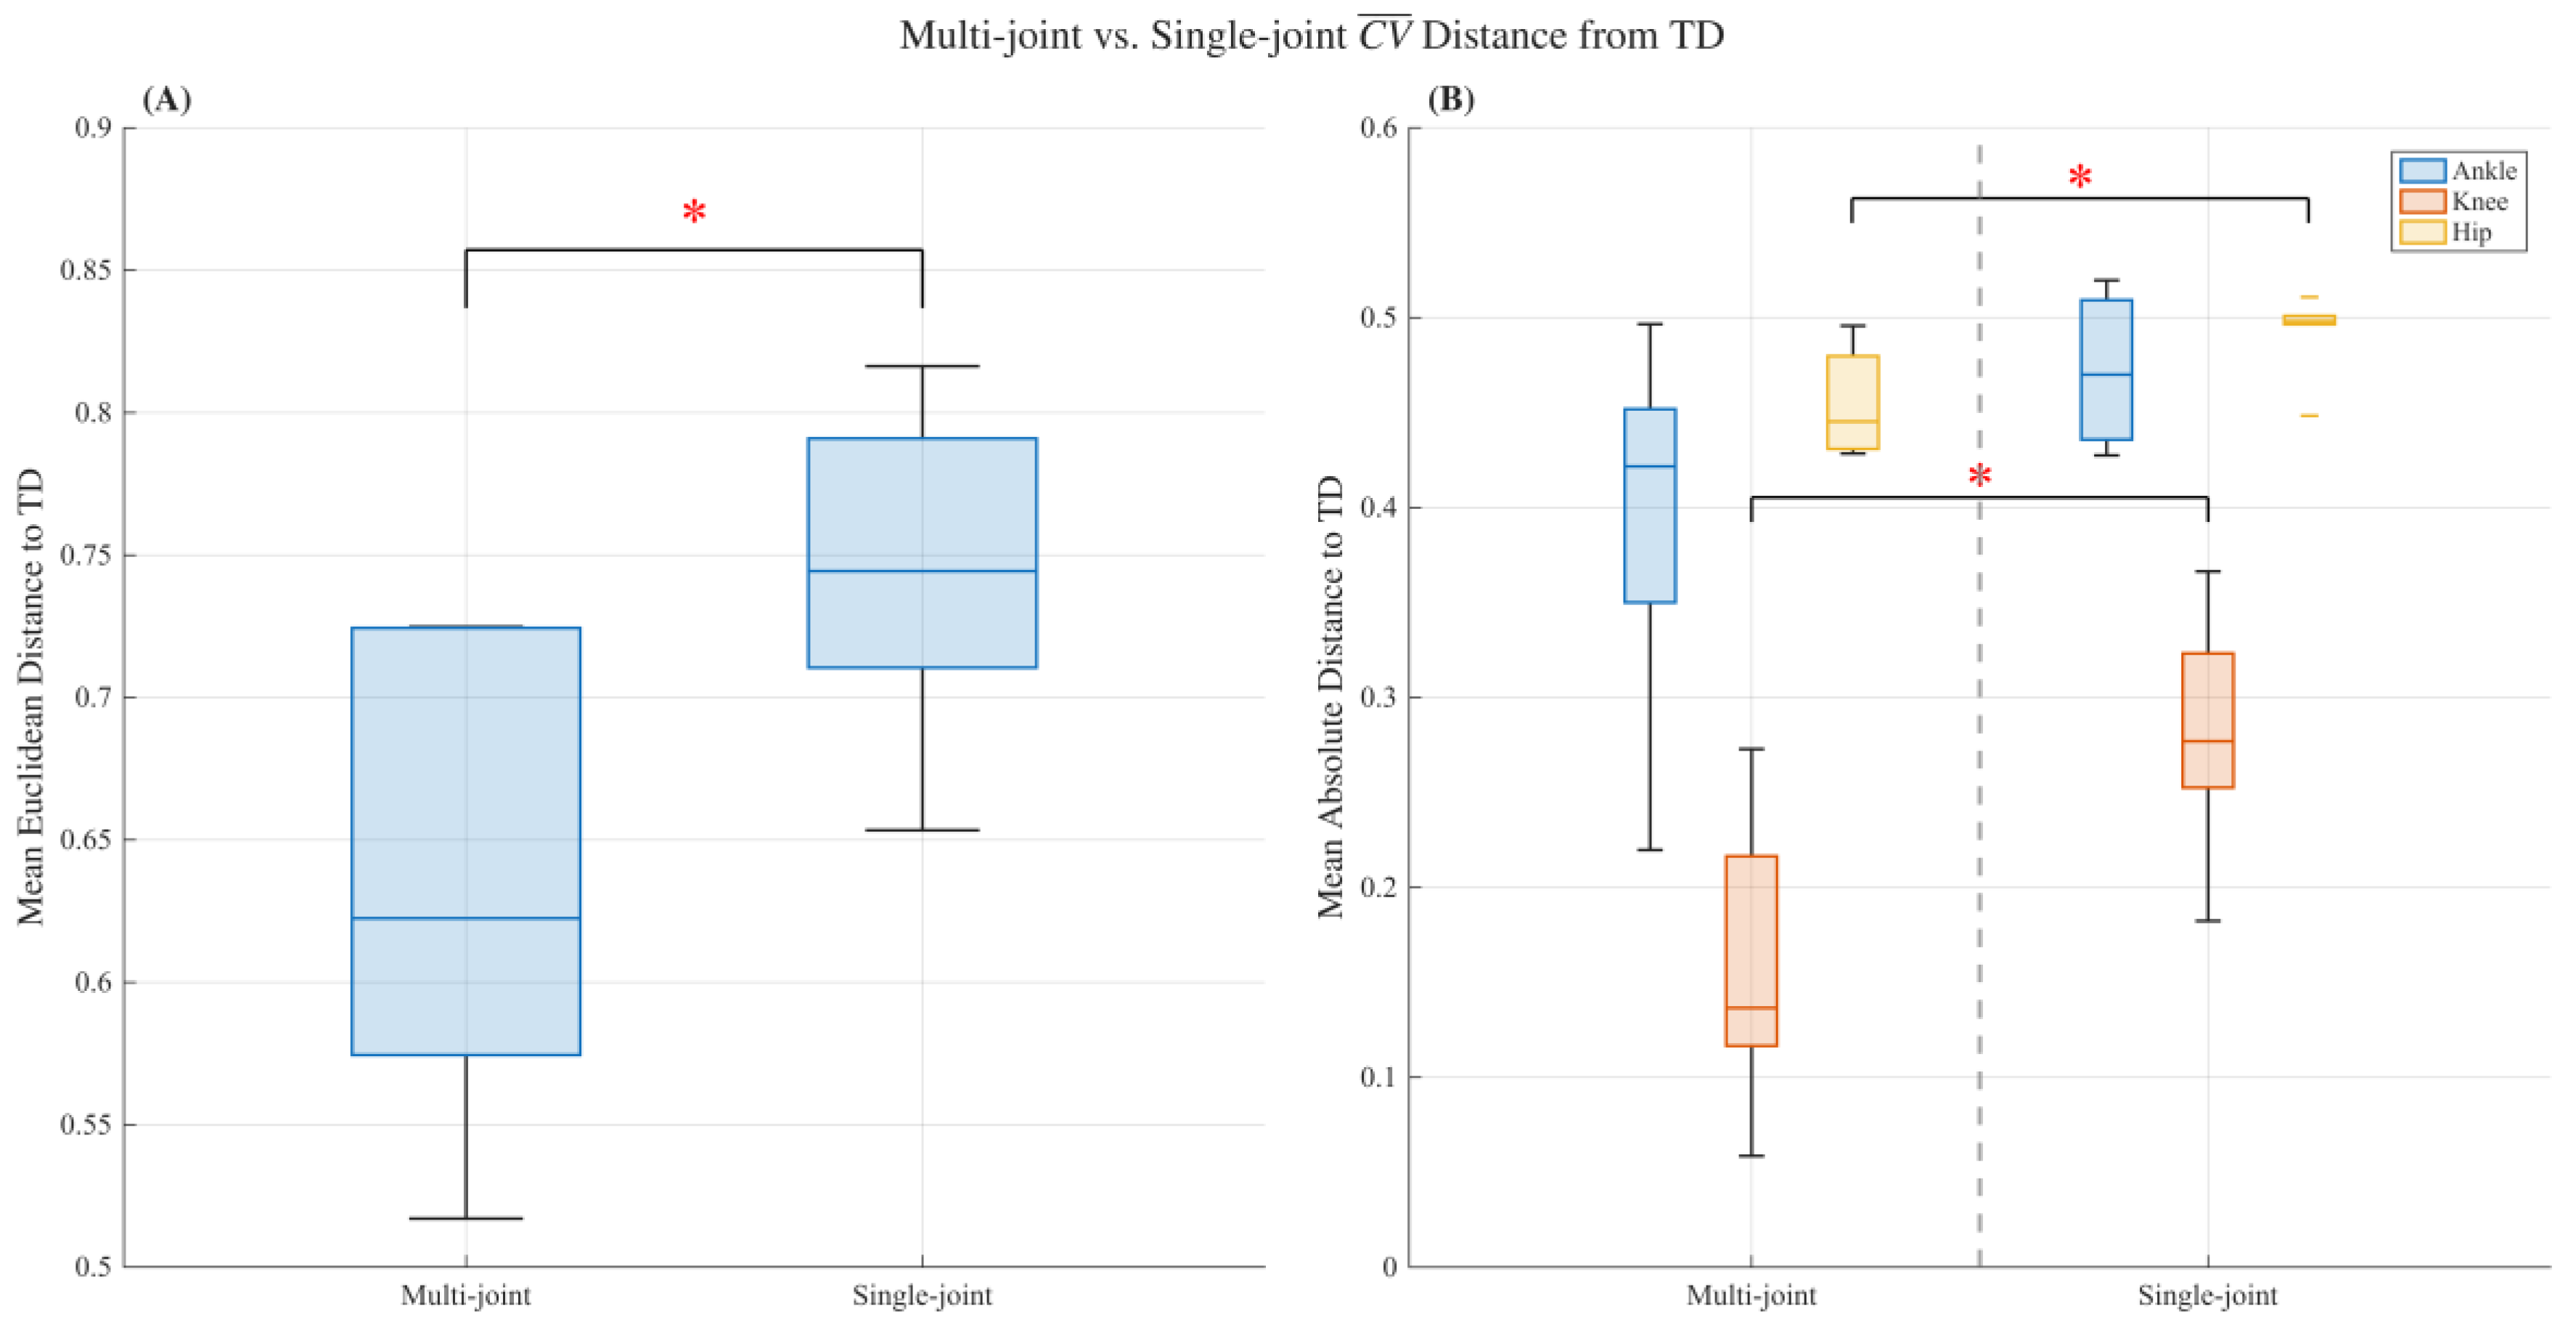
In contrast, statistical analysis of joints’ demonstrated significant differences between conditions (Figure 8B). The multi-muscle condition exhibited significantly lower variability than the single-muscle condition in both the knee (P = 0.017, d = -1.38) and hip (P = 0.013, d = -1.07) joints, with both comparisons showing large effect sizes (Figure 8B). Although the difference in ankle did not reach statistical significance (P = 0.093), a medium effect size (d = -0.55) was observed. To better visualize the results, the Euclidean distance is calculated across the ankle, knee, and hip CV metrics for each subject and condition, then averaged per group and analyzed. Statistical analysis confirmed that the mean Euclidean distance to TD was significantly lower in the multi-muscle group (Figure 8A).
Figure 6.
Distribution of the mean Gait Deviation Index scores across multi-joint and single-joint stimulation protocols. Higher values represent a gait pattern closer to that of typically developing (TD) peers. Statistical analysis revealed no significant difference between the two groups (P = 0.458), though a small effect size (d = 0.328) favored the multi-joint conditions.
Figure 6.
Distribution of the mean Gait Deviation Index scores across multi-joint and single-joint stimulation protocols. Higher values represent a gait pattern closer to that of typically developing (TD) peers. Statistical analysis revealed no significant difference between the two groups (P = 0.458), though a small effect size (d = 0.328) favored the multi-joint conditions.
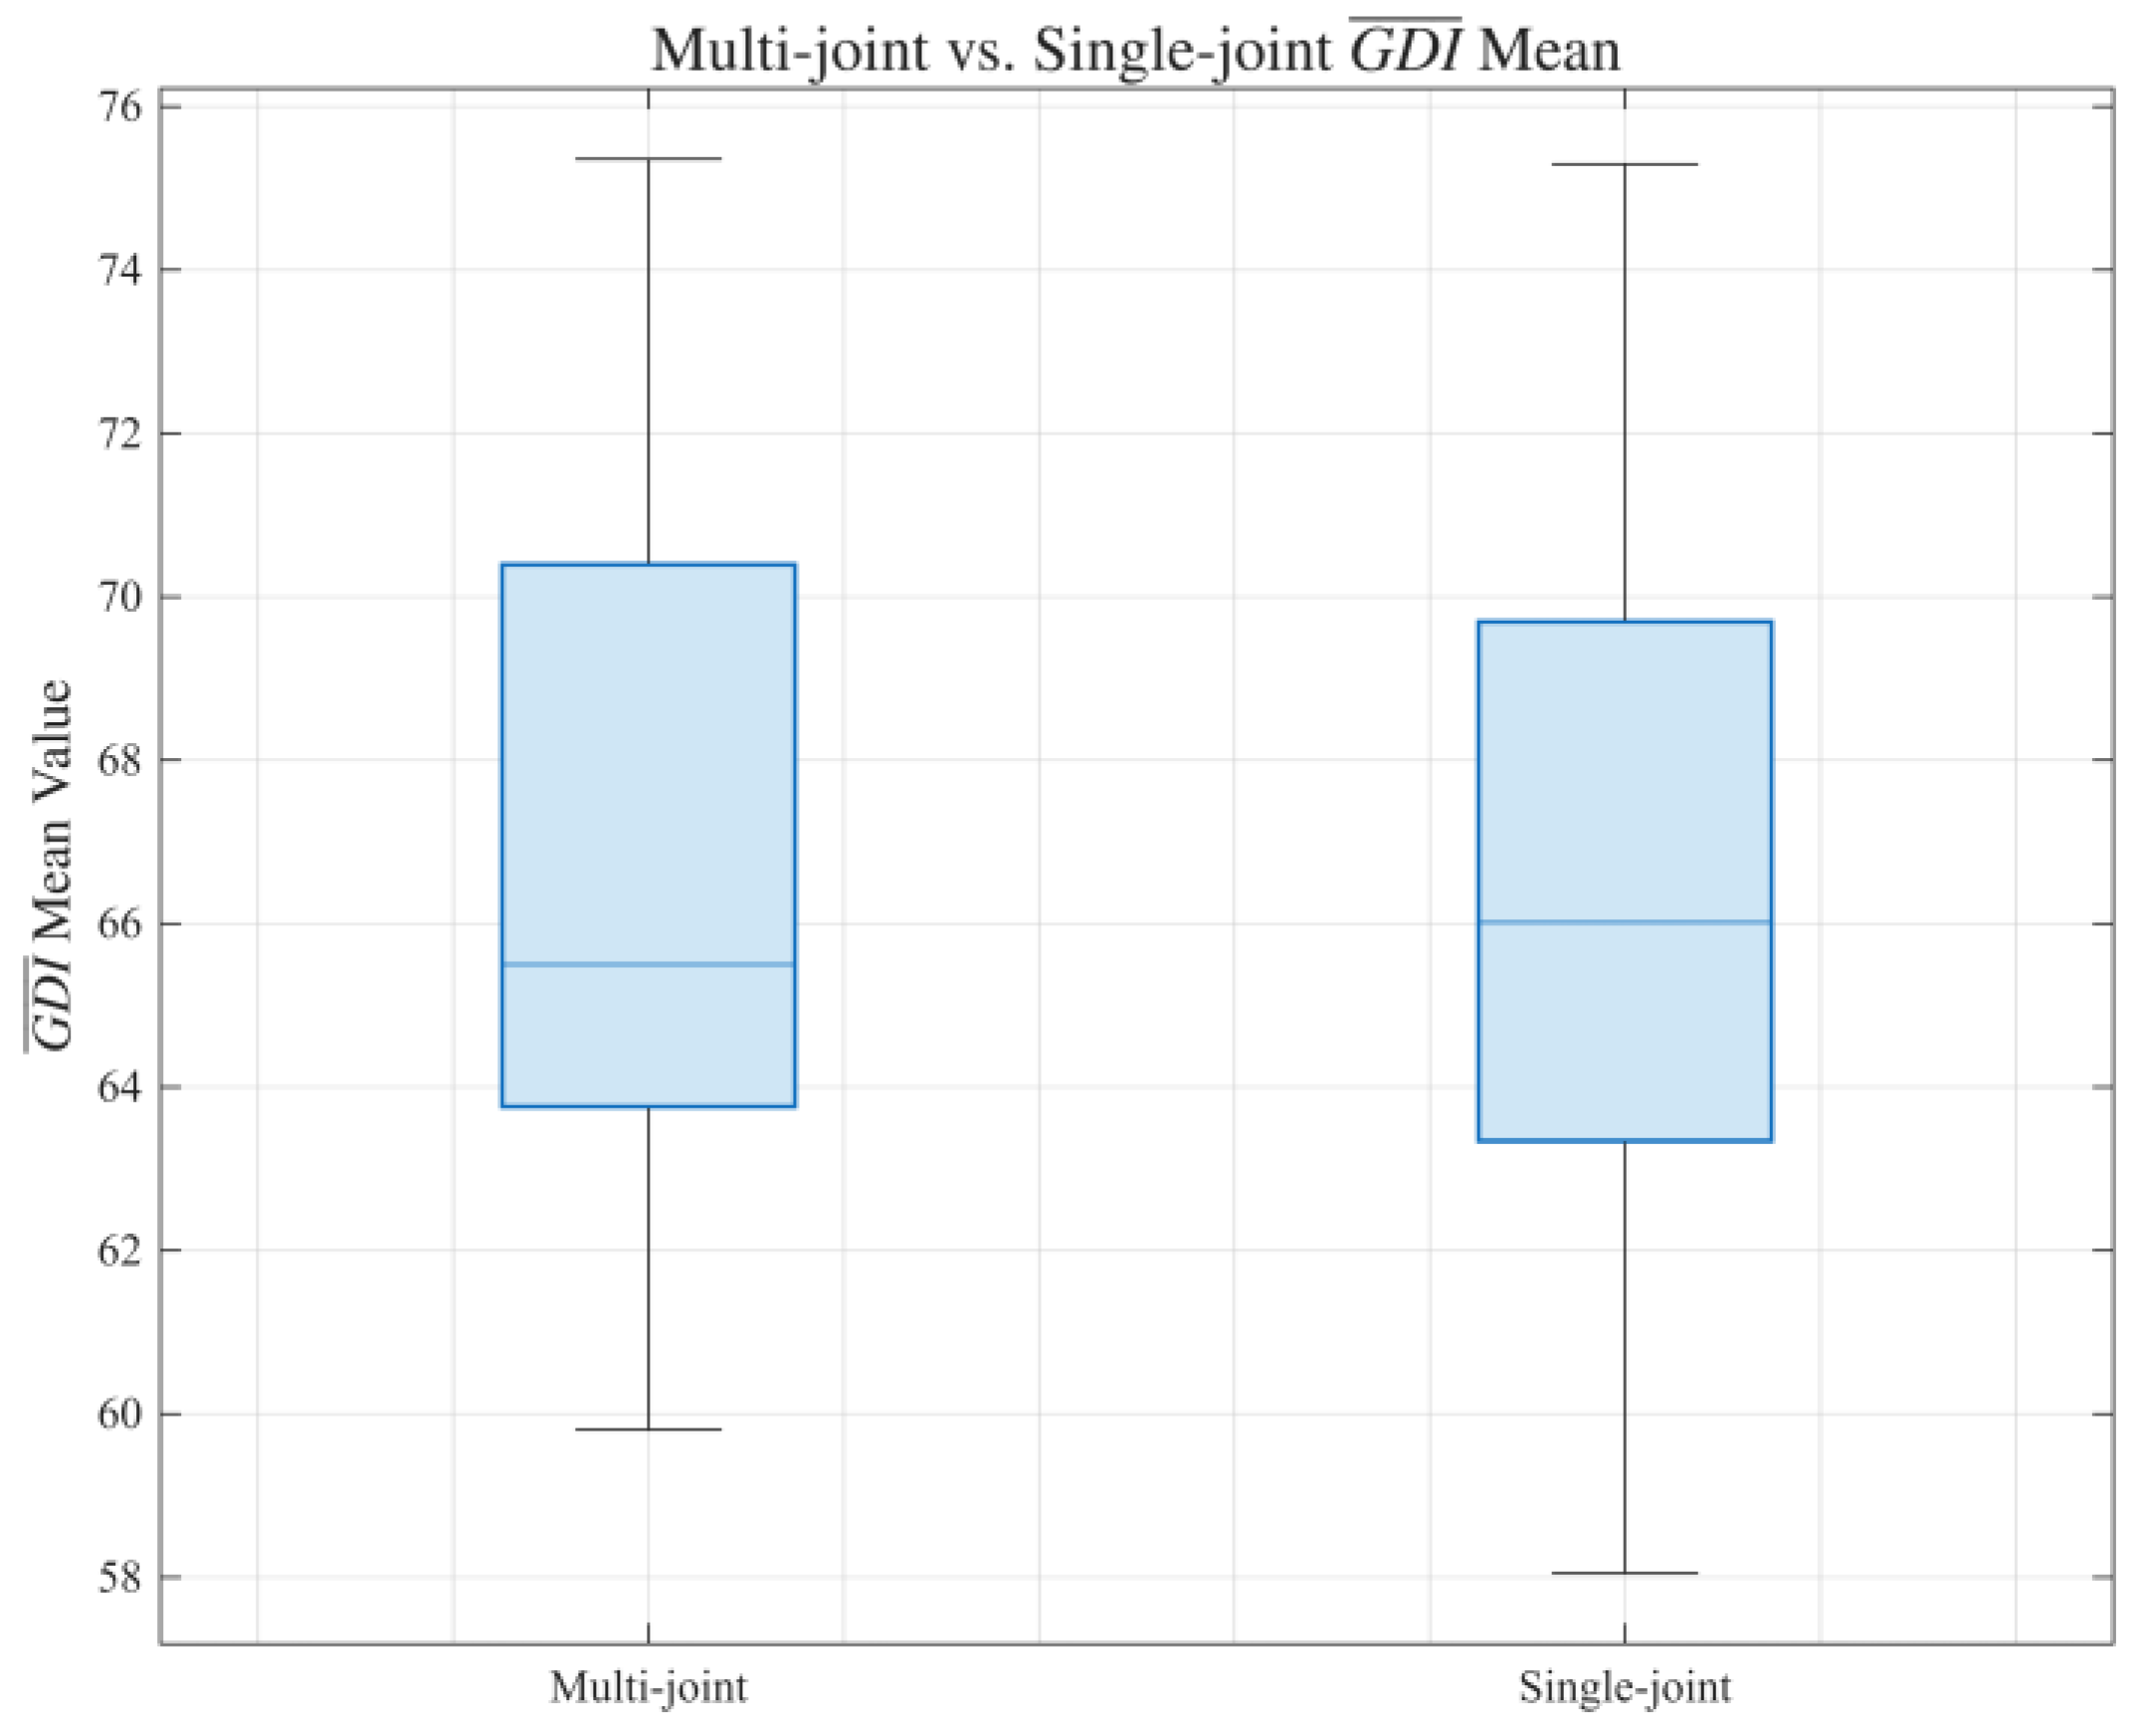
Figure 7.
Comparison of movement variability patterns between multi-joint and single-joint conditions. (A) Mean Euclidean distance of the subjects-averaged Coefficient of Variation () from typically developing (TD) reference values for multi-joint and single-joint stimulation conditions across ankle, knee, and hip joints. Statistical significance was determined by paired comparison (α = 0.05) and was in favor of multi-joint conditions. Lower distances indicate values closer to TD individuals. (B) Mean absolute distance of from TD values analyzed separately for the ankle, knee, and hip joints. Red asterisks indicate statistically significant reductions in variability distance in the multi-joint conditions’ knee and hip joints compared to single-joint conditions.
Figure 7.
Comparison of movement variability patterns between multi-joint and single-joint conditions. (A) Mean Euclidean distance of the subjects-averaged Coefficient of Variation () from typically developing (TD) reference values for multi-joint and single-joint stimulation conditions across ankle, knee, and hip joints. Statistical significance was determined by paired comparison (α = 0.05) and was in favor of multi-joint conditions. Lower distances indicate values closer to TD individuals. (B) Mean absolute distance of from TD values analyzed separately for the ankle, knee, and hip joints. Red asterisks indicate statistically significant reductions in variability distance in the multi-joint conditions’ knee and hip joints compared to single-joint conditions.
4. Discussion
To investigate the effects of multi-muscle and individualized NMES protocols on gait kinematics in children with CP and identify the most effective stimulation approach, we designed a study with six children with CP undergoing seven distinct NMES conditions. Three conditions targeted different combinations of lower limb muscles across multiple joints, thus creating the multi-muscle NMES protocols (All, PT-derived, TRG). The other four conditions (TA, RF, Gmax, and TS) focused on assisting only one muscle per condition, forming the single-muscle protocols.
4.1. Hypothesis 1: Multi-Muscle Vs. Single-Muscle NMES
Our first hypothesis proposed that multi-muscle NMES would produce greater improvements in gait kinematics than single-muscle stimulation. The findings provide partial support for this hypothesis. Multi-muscle stimulation demonstrated more favorable and consistent effects in movement variability, particularly as measured by CV, whereas the GDI, which provides a more comprehensive assessment of gait kinematics, did not show a significant group-level improvement.
The rationale for a multi-muscle approach is supported by the inherently multi-segmental nature of gait in children with CP. The primary purpose of this approach was to determine whether addressing the inherently multi-segmental nature of gait deviations in CP through synchronized, cross-joint NMES assistance would produce a more integrated biomechanical response and shift gait mechanics toward a pattern more closely resembling that of TD individuals.
4.1.1.
Comparison of multi-muscle and the mean Euclidean across all the joints in multi-muscle conditions, versus that of single-muscle conditions, demonstrated a statistically significant trend for multi-muscle stimulation. When the of “All”, “PT-derived”, and “TRG” (i.e, multi-muscle conditions) were subtracted from that of TD (absolute distance from TD) and averaged together for each joint, this difference reached statistical significance in two of the three joints (Knee: P = 0.017; Hip: P = 0.013).
All three multi-muscle conditions (All, PT-derived, and TRG) consistently demonstrated values closer to the TD group than the “NoStim” condition, particularly at the knee joint. These findings suggest that multi-muscle NMES may produce a more coordinated modification of movement variability across joints. However, CV does not necessarily represent a direct restoration of physiological variability, and the observed changes should therefore be interpreted as increased similarity to the TD reference rather than definitive normalization of motor control.
Among the single-muscle conditions, “RF” showed some favorable effects, as its was closer to the TD value than “NoStim” and was the closest to the TD mean at the ankle across all conditions. However, at the knee, RF tended to overcorrect variability toward the upper bound, resulting in exaggerated variability. In contrast, multi-muscle conditions produced a more balanced normalization across joints, indicating a potentially more consistent cross-joint response.
It is noteworthy that the TD group demonstrated greater movement variability across all lower-limb joints compared to the CP group. This suggests that typical gait is characterized by an optimal degree of variability, reflecting a flexible and adaptable motor control system capable of adjusting to internal and external perturbations. In contrast, the reduced variability observed in the CP group may indicate a more constrained and rigid motor strategy, potentially reflecting impaired neuromuscular coordination and diminished adaptability during walking.
4.1.2.
Although the difference between the multi-muscle mean and that of the single-muscle did not reach statistical significance, a similar directional trend as was observed, with multi-muscle conditions yielding higher mean scores than single-muscle conditions with a small effect size favoring the multi-muscle approach (d = 0.328). In detailed comparisons of clinically meaningful changes (∆GDI ≥ 5; CMD threshold), multi-muscle conditions more frequently exceeded the CMD. Specifically, in CP06, “All,” “PT-derived,” and “TRG” exceeded CMD, and in CP05, “PT-derived” exceeded CMD. In contrast, single-muscle stimulation demonstrated fewer meaningful improvements (CP06: “TS” > CMD) and was occasionally detrimental.
Despite these directional findings, the lack of a statistically significant group-level difference in GDI indicates that multi-muscle stimulation cannot be considered superior to single-muscle stimulation based on this global gait index in the present sample. These results suggest that targeted neuromuscular assistance may refine specific biomechanical deficits without immediately altering global gait pathology as quantified by GDI.
Changes in the GDI following NMES intervention in children with CP have been variable across studies and appear to depend, in part, on both participant characteristics and stimulation strategy. Bailes et al. [64] stimulated the TA muscles of 11 children with hemiplegic CP (GMFCS I–II) primarily to assist their ankle dorsiflexion. Although improvements were observed in dorsiflexion at initial contact and walking performance after a 16-week intervention, GDI did not change significantly [64]. Rose et al. [54] investigated a small cohort of children with CP using a multichannel NMES system targeting combinations of muscles, including TA, TS, RF, and Ham, and reported improvements in selected kinematic parameters; however, GDI exceeded the CMD threshold in only one of three participants [54]. In contrast, Danino et al. [44] studied children with hemiplegic CP using peroneal nerve stimulation of the TA and reported modest improvements in composite gait indices in some participants, with responses influenced by baseline gait impairment [44]. Consistent with this body of literature, our findings suggest that while stimulation, whether single-muscle dorsiflexor assistance or broader multichannel approaches, may induce joint- or phase-specific kinematic adaptations, these changes do not necessarily translate into substantial modification of overall gait pathology as quantified by GDI. This pattern underscores the possibility that targeted neuromuscular assistance may refine specific biomechanical deficits without immediately altering the multi-segment coordination reflected in global gait metrics.
4.1.3. Targeted Metric
All the multi-muscle NMES conditions, including “All”, “TRG”, and the “PT-derived” and the “TS” from the single-muscle protocol, produced significant improvements in maximum knee extension with large effect sizes, indicating enhanced sagittal-plane knee control during gait. Although the “PT-derived” condition resulted in slight hyperextension on average, its values remained the closest to the TD reference compared to other conditions.
Evidence regarding the effects of NMES/Functional Electrical Stimulation (FES)-assisted walking on knee extension in children with CP suggests that the most direct improvements are observed when stimulation targets the quadriceps and is timed to stance [31,46,65]. Case-based and single-participant experimental studies have reported acute increases in knee extension during MSt and reductions in crouch posture when quadriceps stimulation is synchronized with gait events [31,46]. In contrast, the majority of pediatric FES studies have focused on peroneal or TA stimulation for foot drop, where improvements are primarily observed at the ankle, and consistent changes in knee extension are not typically reported [65].
In contrast, the observed differences in stride length were significant but occurred in an unfavorable direction, resulting in shorter strides. This finding is somewhat unexpected, as improved knee extension during stance would theoretically contribute to increased limb advancement and longer stride length.
Our findings indicate that multi-muscle NMES protocols generally yield broader improvements in overall gait patterns compared to single-muscle stimulation, despite mixed results across individual outcome measures. This trend of improvement in multi-muscle NMES is similar to previous single-joint (Knee joint) multi-muscle NMES walking studies in children with CP, including the work of Shideler et al., which explores the acute benefits of stimulating RF and vastus lateralis over stimulating RF alone [31]. Similarly, Pierce et al. applied percutaneous intramuscular FES to the TA, gastrocnemius, and their combination, finding that simultaneous stimulation of both muscles significantly improved ankle dorsiflexion during the swing phase [45]. In a larger feasibility study, Orlin et al. showed that coordinated, phase-specific stimulation of both muscles produced more consistent and statistically supported improvements than single-muscle stimulation, highlighting the potential advantage of synchronized agonist–antagonist activation over single-muscle stimulation [66].
A strictly cumulative or additive improvement across all metrics was not observed in the present acute study. This distinction likely reflects the inherently non-linear and multi-segmental nature of gait deviations in CP. Pathological gait patterns are heterogeneous and interdependent across joints [67], and improvements at one segment may alter inter-joint coordination or redistribute mechanical contributions rather than summate proportionally in global indices such as GDI or CV. Moreover, prior NMES investigations have documented considerable inter-individual variability in response to stimulation [40,68], suggesting that synchronized multi-joint activation does not guarantee uniform additive gains, particularly during short-term exposure.
Importantly, our previous longitudinal training work indicates that dosage may substantially influence functional integration [52,53]. In that study, some kinematic improvements toward TD emerged progressively over 36 sessions and were maintained at four-week follow-up, suggesting that broader additive effects may require motor adaptation over time. Additionally, the delay-compensation strategy used in the present study, triggering stimulation at 75% of the preceding phase duration, may have introduced timing inaccuracies that attenuated optimal cross-joint synchronization [48]. Together, these factors suggest that while multi-muscle NMES may provide a more comprehensive biomechanical correction pattern, the translation of this coordination into cumulative global gains may depend on more accurate timing and sufficient training exposure.
4.2. Hypothesis 2: Individualized PT-Derived Protocol
Our second hypothesis proposed that an individualized “PT-derived” NMES protocol would outperform standardized multi-muscle conditions (All and TRG), was not statistically confirmed. However, several trends may support the value of further investigating individualized stimulation protocols.
First, the “PT-derived” condition was the only protocol that exceeded the CMD threshold in CP05 and was among the CMD-exceeding conditions in CP06. Furthermore, this individualized condition demonstrated: 1) the closest median knee extension angle to TD values; 2) the largest reduction in ankle DTW during LR (though non-significant after FDR correction); 3) the only positive (though non-significant) stride length effect. These findings suggest that tailoring stimulation timing and muscle selection to subject-specific gait deviations may enhance biomechanical targeting.
However, the lack of statistically significant superiority over other multi-muscle protocols across the full cohort likely reflects: 1) small sample size (N = 6); 2) heterogeneity in GMFCS levels; 3) variability in muscle responsiveness to stimulation; 4) phase-triggering limitations (75% prior-phase activation rule).
Notably, the “PT-derived” protocol’s benefits were more apparent in targeted joint-level measures than in global indices. This suggests that individualized NMES may lead to localized biomechanical corrections, which may require longer training sessions to achieve significant overall gait improvements, as seen in our case study involving two CP subjects who underwent a 12-week training program using the “PT-derived” protocol [52].
Our phase-specific DTW analysis showed a significant overall effect of stimulation conditions on ankle kinematics during LR and on hip kinematics during PS. However, follow-up comparisons did not identify any individual stimulation condition that was statistically different from “NoStim” after FDR correction. During ankle LR, the PT-derived condition demonstrated the largest reduction in median DTW relative to NoStim, although this difference was not statistically significant after correction. Similarly, during hip PS, the PT-derived condition did not show a significant improvement relative to NoStim. These findings suggest that the individualized PT-derived protocol may influence specific aspects of joint-level kinematics, but the present data do not provide sufficient evidence that it consistently improves similarity to TD gait compared with the NoStim condition.
Thus, while the individualized PT-derived protocol did not statistically dominate standardized one-size-fits-all multi-muscle conditions, its directional effects on selected joint-level measures and participant-specific responses suggest that further investigation of individualized stimulation strategies is warranted.
Several limitations should be considered when interpreting these findings. First, the small sample size (N = 6) limits statistical power and generalizability. The present dataset will be used to conduct a formal power analysis to guide future prospective investigations. The heterogeneity in motor impairment levels may have contributed to variability in responsiveness to stimulation. Second, the study examined only acute effects within one session. As most global outcomes remained below CMD thresholds, longer-term intervention studies are needed to determine whether repeated exposure leads to cumulative neurotherapeutic benefits.
Additionally, the observed reduction in stride length despite improved knee extension suggests that distal propulsion or inter-joint coordination may constrain global performance. Future work should investigate kinetic parameters, ankle push-off mechanics, and energy cost to better understand these interactions.
Finally, the muscle selection in the individualized “PT-derived” protocol was identified by our PTs based on the standardized gait videos of each participant, focusing on sagittal plane improvement. It is important that future studies incorporate more objective and reproducible frameworks, such as instrumented gait analysis metrics and surface EMG recordings, to guide stimulation prescription and improve standardization. Also, this protocol showed promising trends but did not consistently outperform standardized multi-muscle conditions. Larger trials are needed to determine whether subject-specific stimulation timing and muscle selection yield superior long-term outcomes.
Future research should focus on: 1) increasing the sample size based on power analysis, 2) longitudinal training studies to assess retention and neuroplastic effects; 3) optimization of multi-muscle stimulation timing and amplitude; 4) integration of adaptive or closed-loop control strategies; 5) evaluation of metabolic cost and functional mobility outcomes. By advancing toward individualized, multi-channel neuromodulation strategies, future work may enhance both biomechanical correction and functional independence in children with CP.
5. Conclusions
This study examined the acute effects of different NMES strategies during treadmill walking in children with CP, comparing multi-muscle, single-muscle, and individualized stimulation approaches. Overall, multi-muscle stimulation demonstrated more consistent trends toward improving joint-level kinematics and movement variability compared to single-muscle conditions, suggesting that addressing gait impairments through coordinated activation of multiple muscle groups may better reflect the multi-segmental nature of pathological gait in CP.
Contrary to our initial hypothesis, the individualized PT-derived protocol did not consistently outperform the standardized multi-muscle conditions. Although it demonstrated targeted joint-level effects in some participants, its overall performance was not superior across global or phase-specific outcomes. This finding suggests that individualized muscle selection and timing alone may not be sufficient to produce broader gait improvements in the acute setting and that additional factors, such as stimulation intensity, coordination across joints, or longer exposure, may play an important role.
Phase-specific waveform analyses provided further insight into localized adaptations that were not always captured by global gait indices. While certain stimulation strategies influenced specific joint mechanics, these changes did not uniformly translate into improvements in overall gait performance. These findings suggest that NMES may influence specific portions of the gait cycle, but the present data do not establish a clear improvement associated with any individual stimulation strategy. This may indicate that short-term neuromodulation first affects localized control before broader functional changes emerge.
Taken together, these findings suggest that multi-muscle NMES may offer advantages over isolated muscle stimulation in modulating gait mechanics in children with CP. However, research is needed to determine whether optimized or longitudinal stimulation approaches can yield sustained and clinically meaningful functional improvements.
Author Contributions
Conceptualization, N.Z. and S.L.; methodology, N.Z.; software, N.Z. and A.B.; validation, N.Z., A.B., and S.L.; formal analysis, M.M.; investigation, N.Z. and A.B.; resources, S.L. and A.B.; data curation, N.Z., K.V. and M.M.; writing—original draft preparation, M.M.; writing—review and editing, A.B., K.V. and N.Z.; visualization, M.M.; supervision, A.B.; project administration, N.Z., A.B. and S.L.; funding acquisition, S.L. and A.B. All authors have read and agreed to the published version of the manuscript.
Funding
This research was funded by Shriners Hospitals for Children–Philadelphia, grant number 71011-PHI, and the Foundation for the National Institutes of Health, grant number P30 GM103333. APC was funded by Shriners Hospitals for Children.
Institutional Review Board Statement
The study was conducted in accordance with the Declaration of Helsinki and approved by the Shriners Hospitals for Children-Philadelphia, Western Institutional Review Board (protocol code #2059, approved 2017) for studies involving humans.
Informed Consent Statement
Informed consent was obtained from all subjects involved in the study.:
Data Availability Statement
The data presented in this study are available on request from the corresponding author. The data are not publicly available due to privacy and ethical restrictions involving minor participants.
Conflicts of Interest
The authors declare no conflicts of interest.
References
- Bax, M.; Goldstein, M.; Rosenbaum, P.; Leviton, A.; Paneth, N.; Dan, B.; et al. Proposed definition and classification of cerebral palsy, April 2005. Dev. Med. Child Neurol. 2005, 47(8), 571–6. [Google Scholar] [CrossRef] [PubMed]
- Shih, S.T.F.; Tonmukayakul, U.; Imms, C.; Reddihough, D.; Graham, H.K.; Cox, L.; et al. Economic evaluation and cost of interventions for cerebral palsy: a systematic review. Dev. Med. Child Neurol. 2018, 60(6), 543–58. [Google Scholar] [CrossRef] [PubMed]
- Bell, K.J.; Õunpuu, S.; DeLuca, P.A.; Romness, M.J. Natural Progression of Gait in Children With Cerebral Palsy. J. Pediatr. Orthop. 2002, 22(5), 677–82. [Google Scholar] [CrossRef]
- Prosser, L.A.; Lee, S.C.K.; VanSant, A.F.; Barbe, M.F.; Lauer, R.T. Trunk and Hip Muscle Activation Patterns Are Different During Walking in Young Children With and Without Cerebral Palsy. Phys. Ther. 2010, 90(7), 986–97. [Google Scholar] [CrossRef] [PubMed]
- Chakraborty, S.; Nandy, A.; Kesar, T.M. Gait deficits and dynamic stability in children and adolescents with cerebral palsy: A systematic review and meta-analysis. Clin. Biomech. 2020, 71, 11–23. [Google Scholar] [CrossRef] [PubMed]
- Rose, J.; Gamble, J.G.; Burgos, A.; Medeiros, J.; Haskell, W.L. Energy Expenditure Index of Walking for Normal Children and for Children with Cerebral Palsy. Dev. Med. Child Neurol. 1990, 32(4), 333–40. [Google Scholar] [CrossRef] [PubMed]
- Giuliani, C.A. Dorsal Rhizotomy for Children with Cerebral Palsy: Support for Concepts of Motor Control. Phys. Ther. 1991, 71(3), 248–59. [Google Scholar] [CrossRef] [PubMed]
- McLaughlin, J.F.; Bjornson, K.F.; Astley, S.J.; Hays, R.M.; Heffinger, S.A.; Armantrout, E.A.; et al. THE ROLE OF SELECTIVE DORSAL RHIZOTOMY IN cérébral PALSY: CRITICAL EVALUATION OF A PROSPECTIVE CLINICAL SERIES. Dev. Med. Child Neurol. 1994, 36(9), 755–69. [Google Scholar] [CrossRef] [PubMed]
- Hof, A.L. Changes in Muscles and Tendons Due to Neural Motor Disorders:Implications for Therapeutic Intervention. Neural Plast. 2001, 8(1–2), 71–81. [Google Scholar] [CrossRef] [PubMed]
- Hoffer, M.M. Management of the hip in cerebral palsy. J. Bone Jt. Surg. Am. 1986, 68(4), 629–31. [Google Scholar] [CrossRef] [PubMed]
- Joseph, B.; Reddy, K.; Varghese, R.A.; Shah, H.; Doddabasappa, S.N. Management of Severe Crouch Gait in Children and Adolescents With Cerebral Palsy. J. Pediatr. Orthop. 2010, 30(8), 832–9. [Google Scholar] [CrossRef] [PubMed]
- Hoffinger, S.A.; Rab, G.T.; Abou-Ghaida, H. Hamstrings in Cerebral Palsy Crouch Gait: J Pediatr Orthop. 1993, 13(6), 722–6. [Google Scholar] [CrossRef] [PubMed]
- McNee, A.E.; Shortland, A.P.; Eve, L.C.; Robinson, R.O.; Gough, M. Lower limb extensor moments in children with spastic diplegic cerebral palsy. Gait Posture 2004, 20(2), 171–6. [Google Scholar] [CrossRef] [PubMed]
- Zanon MA, Porfírio GJ, Riera R, Martimbianco ALC. Neurodevelopmental treatment approaches for children with cerebral palsy. Cochrane Developmental, Psychosocial and Learning Problems Group, editor. Cochrane Database Syst Rev. 2015 Nov 5. [CrossRef]
- Damiano, D.L. Rehabilitative Therapies in Cerebral Palsy: The Good, the Not As Good, and the Possible. J. Child Neurol. 2009, 24(9), 1200–4. [Google Scholar] [CrossRef] [PubMed]
- Bandholm, T.; Jensen, B.R.; Nielsen, L.M.; Rasmussen, H.; Bencke, J.; Curtis, D.; et al. Neurorehabilitation with versus without resistance training after botulinum toxin treatment in children with cerebral palsy: A randomized pilot study. NeuroRehabilitation 2012, 30(4), 277–86. [Google Scholar] [CrossRef] [PubMed]
- Taylor, N.F.; Dodd, K.J.; Baker, R.J.; Willoughby, K.; Thomason, P.; Graham, H.K. Progressive resistance training and mobility-related function in young people with cerebral palsy: a randomized controlled trial. Dev. Med. Child Neurol. 2013, 55(9), 806–12. [Google Scholar] [CrossRef] [PubMed]
- Soares, E.G.; Gusmão, C.H.V.; Souto, D.O. Efficacy of aerobic exercise on the functioning and quality of life of children and adolescents with cerebral palsy: A systematic review and meta-analysis. Dev. Med. Child Neurol. 2023, 65(10), 1292–307. [Google Scholar] [CrossRef] [PubMed]
- Day, J.A.; Fox, E.J.; Lowe, J.; Swales, H.B.; Behrman, A.L. Locomotor Training with Partial Body Weight Support on a Treadmill in a Nonambulatory Child with Spastic Tetraplegic Cerebral Palsy: A Case Report. Pediatr. Phys. Ther. 2004, 16(2), 106–13. [Google Scholar] [CrossRef] [PubMed]
- Mutlu, A.; Krosschell, K.; Spira, D.G. Treadmill training with partial body-weight support in children with cerebral palsy: a systematic review. Dev. Med. Child Neurol. 2009, 51(4), 268–75. [Google Scholar] [CrossRef] [PubMed]
- Carvalho, I.; Pinto, S.M.; Chagas, D.D.V.; Praxedes Dos Santos, J.L.; De Sousa Oliveira, T.; Batista, L.A. Robotic Gait Training for Individuals With Cerebral Palsy: A Systematic Review and Meta-Analysis. Arch. Phys. Med. Rehabil. 2017, 98(11), 2332–44. [Google Scholar] [CrossRef] [PubMed]
- Conner, B.C.; Remec, N.M.; Lerner, Z.F. Is robotic gait training effective for individuals with cerebral palsy? A systematic review and meta-analysis of randomized controlled trials. Clin. Rehabil. 2022, 36(7), 873–82. [Google Scholar] [CrossRef] [PubMed]
- Barbeau, H. Locomotor Training in Neurorehabilitation: Emerging Rehabilitation Concepts. Neurorehabil Neural Repair 2003, 17(1), 3–11. [Google Scholar] [CrossRef] [PubMed]
- Pool, D.; Valentine, J.; Taylor, N.F.; Bear, N.; Elliott, C. Locomotor and robotic assistive gait training for children with cerebral palsy. Dev. Med. Child Neurol. 2021, 63(3), 328–35. [Google Scholar] [CrossRef] [PubMed]
- Mattern-Baxter, K.; Bellamy, S.; Mansoor, J.K. Effects of Intensive Locomotor Treadmill Training on Young Children with Cerebral Palsy. Pediatr. Phys. Ther. 2009, 21(4), 308–18. [Google Scholar] [CrossRef] [PubMed]
- Mattern-Baxter, K. Effects of Partial Body Weight Supported Treadmill Training on Children with Cerebral Palsy. Pediatr. Phys. Ther. 2009, 21(1), 12–22. [Google Scholar] [CrossRef] [PubMed]
- Hadders-Algra, M. Early Brain Damage and the Development of Motor Behaviorin Children: Clues for Therapeutic Intervention? Neural Plast. 2001, 8(1–2), 31–49. [Google Scholar] [CrossRef] [PubMed]
- Conner, B.C.; Remec, N.M.; Orum, E.K.; Frank, E.M.; Lerner, Z.F. Wearable Adaptive Resistance Training Improves Ankle Strength, Walking Efficiency and Mobility in Cerebral Palsy: A Pilot Clinical Trial. IEEE Open J. Eng. Med. Biol. 2020, 1, 282–9. [Google Scholar] [CrossRef] [PubMed]
- Conner, B.C.; Schwartz, M.H.; Lerner, Z.F. Pilot evaluation of changes in motor control after wearable robotic resistance training in children with cerebral palsy. J. Biomech. 2021, 126, 110601. [Google Scholar] [CrossRef] [PubMed]
- Conner, B.; Orekhov, G.; Lerner, Z. Ankle Exoskeleton Assistance Increases Six-Minute Walk Test Performance in Cerebral Palsy. IEEE Open J. Eng. Med. Biol. 2021, 2, 320–3. [Google Scholar] [CrossRef] [PubMed]
- Shideler, B.L.; Bulea, T.C.; Chen, J.; Stanley, C.J.; Gravunder, A.J.; Damiano, D.L. Toward a hybrid exoskeleton for crouch gait in children with cerebral palsy: neuromuscular electrical stimulation for improved knee extension. J. Neuroeng. Rehabil. 2020, 17(1), 121. [Google Scholar] [CrossRef] [PubMed]
- Lee, S.C.K.; Behboodi, A.; Alesi, J.F.; Wright, H. Functional Electrical Stimulation Interventions for Children and Youth with Cerebral Palsy. In Cerebral Palsy [Internet]; Miller, F., Bachrach, S., Lennon, N., O’Neil, M., Eds.; Springer International Publishing: Cham, 2019; pp. 1–27. Available online: http://link.springer.com/10.1007/978-3-319-50592-3_166-1.
- Mooney, J.A.; Rose, J. A Scoping Review of Neuromuscular Electrical Stimulation to Improve Gait in Cerebral Palsy: The Arc of Progress and Future Strategies. Front Neurol. 2019, 10, 887. [Google Scholar] [CrossRef] [PubMed]
- Chen, Y.P.; Kang, L.J.; Chuang, T.Y.; Doong, J.L.; Lee, S.J.; Tsai, M.W.; et al. Use of Virtual Reality to Improve Upper-Extremity Control in Children With Cerebral Palsy: A Single-Subject Design. Phys. Ther. 2007, 87(11), 1441–57. [Google Scholar] [CrossRef] [PubMed]
- Prosser, L.A.; Curatalo, L.A.; Alter, K.E.; Damiano, D.L. Acceptability and potential effectiveness of a foot drop stimulator in children and adolescents with cerebral palsy. Dev. Med. Child Neurol. 2012, 54(11), 1044–9. [Google Scholar] [CrossRef] [PubMed]
- Damiano, D.L.; Prosser, L.A.; Curatalo, L.A.; Alter, K.E. Muscle Plasticity and Ankle Control After Repetitive Use of a Functional Electrical Stimulation Device for Foot Drop in Cerebral Palsy. Neurorehabil Neural Repair 2013, 27(3), 200–7. [Google Scholar] [CrossRef] [PubMed]
- Durham, S.; Eve, L.; Stevens, C.; Ewins, D. Effect of Functional Electrical Stimulation on asymmetries in gait of children with hemiplegic cerebral palsy. Physiotherapy 2004, 90(2), 82–90. [Google Scholar] [CrossRef]
- Johnston, T.E.; Finson, R.L.; McCarthy, J.J.; Smith, B.T.; Betz, R.R.; Mulcahey, M.J. Use of Functional Electrical Stimulation to Augment Traditional Orthopaedic Surgery in Children With Cerebral Palsy. J. Pediatr. Orthop. 2004, 24(3), 283–91. [Google Scholar] [CrossRef]
- Van Der Linden, M.L.; Hazlewood, M.E.; Hillman, S.J.; Robb, J.E. Functional Electrical Stimulation to the Dorsiflexors and Quadriceps in Children with Cerebral Palsy. Pediatr. Phys. Ther. 2008, 20(1), 23–9. [Google Scholar] [CrossRef] [PubMed]
- Postans, N.J.; Granat, M.H. Effect of functional electrical stimulation, applied during walking, on gait in spastic cerebral palsy. Dev. Med. Child Neurol. 2005, 47(01). [Google Scholar] [CrossRef] [PubMed]
- Pierce, S.R.; Orlin, M.N.; Lauer, R.T.; Johnston, T.E.; Smith, B.T.; McCarthy, J.J. Comparison of Percutaneous and Surface Functional Electrical Stimulation During Gait in a Child with Hemiplegic Cerebral Palsy: Am J Phys Med Rehabil. 2004, 83(10), 798–805. [Google Scholar] [CrossRef] [PubMed]
- Pa, C.; Ra, M.; Nd, P.; Mo, R. Effect of Neuromuscular Electrical Stimulation During Gait in Children with Cerebral Palsy. Pediatr. Phys. Ther. 1996, 8(4), 175. [Google Scholar] [CrossRef]
- Pool, D.; Valentine, J.; Bear, N.; Donnelly, C.J.; Elliott, C.; Stannage, K. The orthotic and therapeutic effects following daily community applied functional electrical stimulation in children with unilateral spastic cerebral palsy: a randomised controlled trial. BMC Pediatr. 2015, 15(1), 154. [Google Scholar] [CrossRef] [PubMed]
- Danino, B.; Khamis, S.; Hemo, Y.; Batt, R.; Snir, E.; Wientroub, S.; et al. The efficacy of neuroprosthesis in young hemiplegic patients, measured by three different gait indices: Early results. J. Child Orthop. 2013, 7(6), 537–42. [Google Scholar] [CrossRef] [PubMed]
- Pierce, S.R.; Laughton, C.A.; Smith, B.T.; Orlin, M.N.; Johnston, T.E.; McCarthy, J.J. Direct effect of percutaneous electric stimulation during gait in children with hemiplegic cerebral palsy: a report of 2 cases. Arch. Phys. Med. Rehabil. 2004, 85(2), 339–43. [Google Scholar] [CrossRef] [PubMed]
- Khamis, S.; Martikaro, R.; Wientroub, S.; Hemo, Y.; Hayek, S. A functional electrical stimulation system improves knee control in crouch gait. J. Child Orthop. 2015, 9(2), 137–43. [Google Scholar] [CrossRef] [PubMed]
- AlAbdulwahab, S.S. Electrical stimulation improves gait in children with spastic diplegic cerebral palsy. NeuroRehabilitation 2011, 29(1), 37–43. [Google Scholar] [CrossRef] [PubMed]
- Zahradka, N.; Behboodi, A.; Wright, H.; Bodt, B.; Lee, S. Evaluation of Gait Phase Detection Delay Compensation Strategies to Control a Gyroscope-Controlled Functional Electrical Stimulation System During Walking. Sensors 2019, 19(11), 2471. [Google Scholar] [CrossRef] [PubMed]
- Behboodi, A.; Zahradka, N.; Wright, H.; Alesi, J.; Lee, SamuelCK. Real-Time Detection of Seven Phases of Gait in Children with Cerebral Palsy Using Two Gyroscopes. Sensors 2019, 19(11), 2517. [Google Scholar] [CrossRef] [PubMed]
- Zahradka, N.; Behboodi, A.; Sansare, A.; Lee, S.C.K. Evaluation of Individualized Functional Electrical Stimulation-Induced Acute Changes during Walking: A Case Series in Children with Cerebral Palsy. Sensors 2021, 21(13), 4452. [Google Scholar] [CrossRef] [PubMed]
- Behboodi, A.; Wright, H.; Zahradka, N.; Lee, S.C.K. Seven phases of gait detected in real-time using shank attached gyroscopes. In 2015 37th Annual International Conference of the IEEE Engineering in Medicine and Biology Society (EMBC) [Internet]; IEEE: Milan, 2015; pp. 5529–32. Available online: https://ieeexplore.ieee.org/document/7319644/.
- Behboodi, A.; Zahradka, N.; Alesi, J.; Wright, H.; Lee, S.C.K. Use of a Novel Functional Electrical Stimulation Gait Training System in 2 Adolescents With Cerebral Palsy: A Case Series Exploring Neurotherapeutic Changes. Phys. Ther. 2019, 99(6), 739–47. [Google Scholar] [CrossRef] [PubMed]
- Behboodi, A.; Sansare, A.; Zahradka, N.; Lee, S.C.K. Case report: The gait deviation index may predict neurotherapeutic effects of FES-assisted gait training in children with cerebral palsy. Front Rehabil. Sci. 2023, 4, 1002222. [Google Scholar] [CrossRef] [PubMed]
- Rose, J.; Cahill-Rowley, K.; Butler, E.E. Artificial Walking Technologies to Improve Gait in Cerebral Palsy: Multichannel Neuromuscular Stimulation. Artif. Organs 2017, 41(11). [Google Scholar] [CrossRef] [PubMed]
- Whittle, M. Whittle’s gait analysis; Elsevier, 2012; p. 192 p. [Google Scholar]
- Robinson, A.J.; Snyder-Mackler, L. Clinical electrophysiology: electrotherapy and electrophysiologic testing, 3rd ed.; Wolters Kluwer Health/Lippincott Williams & Wilkins: Philadelphia, 2008; p. 555 p. [Google Scholar]
- Schwartz, M.H.; Rozumalski, A. The gait deviation index: A new comprehensive index of gait pathology. Gait Posture 2008, 28(3), 351–7. [Google Scholar] [CrossRef] [PubMed]
- Ito, T.; Noritake, K.; Sugiura, H.; Kamiya, Y.; Tomita, H.; Ito, Y.; et al. Association between Gait Deviation Index and Physical Function in Children with Bilateral Spastic Cerebral Palsy: A Cross-Sectional Study. J. Clin. Med. 2019, 9(1), 28. [Google Scholar] [CrossRef] [PubMed]
- Winter, D.A. The biomechanics and motor control of human gait [Internet]; University of Waterloo Press: Waterloo, Ont., 1991; p. 160 p. Available online: http://archive.org/details/biomechanicsmoto0000wint_g1d1.
- Winter, D.A. Kinematic and kinetic patterns in human gait: Variability and compensating effects. Hum. Mov. Sci. 1984, 3(1–2), 51–76. [Google Scholar] [CrossRef]
- Noorkoiv, M.; Lavelle, G.; Theis, N.; Korff, T.; Kilbride, C.; Baltzopoulos, V.; et al. Predictors of Walking Efficiency in Children With Cerebral Palsy: Lower-Body Joint Angles, Moments, and Power. Phys Ther. 2019, 99(6), 711–20. [Google Scholar] [CrossRef] [PubMed] [PubMed Central]
- Cloodt, E.; Wagner, P.; Lauge-Pedersen, H.; Rodby-Bousquet, E. Knee and foot contracture occur earliest in children with cerebral palsy: a longitudinal analysis of 2,693 children. Acta Orthop. 2021, 92(2), 222–7. [Google Scholar] [CrossRef] [PubMed] [PubMed Central]
- Bartonek, Å.; Lidbeck, C. Knee Flexion While Walking Exceeds Knee Flexion Contracture in Children with Spastic Cerebral Palsy. Children 2023, 10(12), 1867. [Google Scholar] [CrossRef] [PubMed]
- Bailes, A.F.; Caldwell, C.; Clay, M.; Tremper, M.; Dunning, K.; Long, J. Participation and community-based walking activity after neuroprosthesis use in children with hemiplegic cerebral palsy: A pilot study1. J. Pediatr. Rehabil. Med. 2017, 10(2), 71–9. [Google Scholar] [CrossRef] [PubMed]
- Moll, I.; Marcellis, R.G.J.; Fleuren, S.M.; Coenen, M.L.P.; Senden, R.H.J.; Willems, P.J.B.; et al. Functional electrical stimulation during walking in children with unilateral spastic cerebral palsy: A randomized cross-over trial. Dev. Med. Child Neurol. 2024, 66(5), 598–609. [Google Scholar] [CrossRef] [PubMed]
- Orlin, M.N.; Pierce, S.R.; Stackhouse, C.L.; Smith, B.T.; Johnston, T.; Shewokis, P.A.; et al. Immediate effect of percutaneous intramuscular stimulation during gait in children with cerebral palsy: a feasibility study. Dev. Med. Child Neurol. 2005, 47(10), 684. [Google Scholar] [CrossRef] [PubMed]
- Dobson, F.; Morris, M.E.; Baker, R.; Graham, H.K. Gait classification in children with cerebral palsy: A systematic review. Gait Posture 2007, 25(1), 140–52. [Google Scholar] [CrossRef] [PubMed]
- van der Linden, M.L.; Hazlewood, M.E.; Hillman, S.J.; Robb, J.E. Functional electrical stimulation to the dorsiflexors and quadriceps in children with cerebral palsy. Pediatr. Phys. Ther. Off. Publ. Sect. Pediatr. Am. Phys. Ther. Assoc. 2008, 20(1), 23–9. [Google Scholar] [CrossRef]
Figure 1.
Block diagram of study design. The study included eight conditions, seven conditions included stimulation applied to different muscle combinations: All = typical muscle activation patterns, PT-derived = physical therapists’ chosen muscles, TRG = combined activation of Triceps Surae, Rectus Femoris and Gluteus Maximus (i.e., prominent lower limb extensor muscle groups), TA = Tibialis Anterior, RF = Rectus Femoris, Gmax = Gluteus Maximus, and TS = Triceps Surae. The session started with the NoStim (without any stimulation) condition, while the order of stimulation conditions was randomized between participants, with each condition repeated three times.
Figure 1.
Block diagram of study design. The study included eight conditions, seven conditions included stimulation applied to different muscle combinations: All = typical muscle activation patterns, PT-derived = physical therapists’ chosen muscles, TRG = combined activation of Triceps Surae, Rectus Femoris and Gluteus Maximus (i.e., prominent lower limb extensor muscle groups), TA = Tibialis Anterior, RF = Rectus Femoris, Gmax = Gluteus Maximus, and TS = Triceps Surae. The session started with the NoStim (without any stimulation) condition, while the order of stimulation conditions was randomized between participants, with each condition repeated three times.
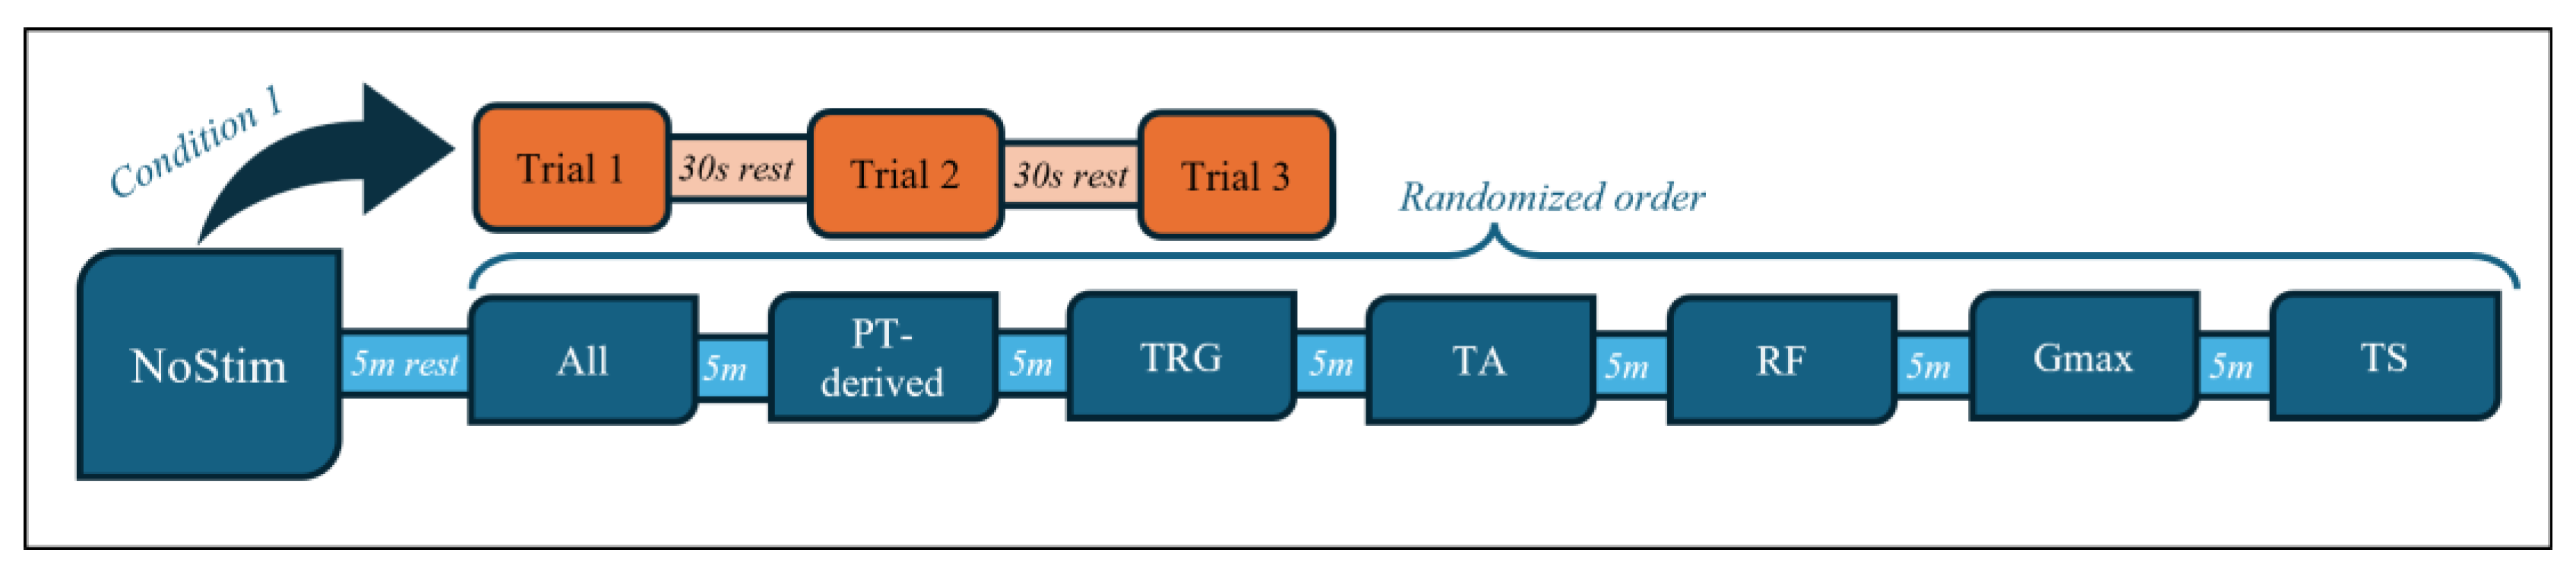

Table 1.
Detailed information on participant age, gender, height, weight, Gross Motor Function Classification System (GMFCS), self-selected walking speed (SSWS), and affected side.
Table 1.
Detailed information on participant age, gender, height, weight, Gross Motor Function Classification System (GMFCS), self-selected walking speed (SSWS), and affected side.
| Subjects | Age (yrs) | Gender | Height (m) | Weight (kg) | GMFCS | SSWS (m/s) | Affected Side |
|---|---|---|---|---|---|---|---|
| CP01 | 15 | M | 1.67 | 32.13 | III | 0.60 | L |
| CP02 | 16 | M | 1.70 | 60.06 | III | 0.80 | L |
| CP03 | 18 | M | 1.70 | 61.97 | II | 0.90 | R |
| CP04 | 12 | M | 1.52 | 41.50 | II | 0.75 | R |
| CP05 | 13 | F | 1.31 | 32.13 | III | 0.45 | L |
| CP06 | 13 | F | 1.44 | 42.53 | II | 0.80 | L |
Table 2.
Gait Deviation Index (GDI) results across all conditions and their difference from the baseline. The ∆ symbol indicates the results are after subtracting NoStim. NoStim = Without any stimulation, All = Typical muscle activation patterns, PT-derived = Physical therapists’ chosen muscles, TA = Tibialis Anterior, RF = Rectus Femoris, Gmax = Gluteus Maximus, TRG = Combined activation of Triceps Surae, Rectus Femoris, and Gluteus Maximus. * Indicates exceeding the clinically relevant difference threshold (CMD≥5).
Table 2.
Gait Deviation Index (GDI) results across all conditions and their difference from the baseline. The ∆ symbol indicates the results are after subtracting NoStim. NoStim = Without any stimulation, All = Typical muscle activation patterns, PT-derived = Physical therapists’ chosen muscles, TA = Tibialis Anterior, RF = Rectus Femoris, Gmax = Gluteus Maximus, TRG = Combined activation of Triceps Surae, Rectus Femoris, and Gluteus Maximus. * Indicates exceeding the clinically relevant difference threshold (CMD≥5).
| Subjects | Score | NoStim | All | PT-derived | TRG | TA | RF | Gmax | TS |
|---|---|---|---|---|---|---|---|---|---|
| CP01 | GDI | 64.317 | 63.874 | 66.429 | 60.979 | 65.125 | 62.952 | 59.398 | 65.89 |
| ∆ | - | -0.443 | 2.112 | -3.338 | 0.807 | -1.366 | -4.919 | 1.573 | |
| CP02 | GDI | 61.879 | 64.883 | 63.747 | 62.723 | 60.575 | 65.520 | 63.242 | 65.03 |
| ∆ | - | 3.004 | 1.869 | 0.845 | -1.304 | 3.642 | 1.363 | 3.151 | |
| CP03 | GDI | 78.116 | 73.878 | 74.970 | 77.224 | 75.073 | 73.295 | 77.232 | 75.59 |
| ∆ | - | -4.238 | -3.146 | -0.892 | -3.043 | -4.821 | -0.884 | -2.526 | |
| CP04 | GDI | 69.966 | 65.265 | 68.077 | 68.310 | 70.636 | 62.122 | 70.209 | 70.79 |
| ∆ | - | -4.701 | -1.889 | -1.656 | 0.670 | -7.844 | 0.243 | 0.824 | |
| CP05 | GDI | 56.942 | 58.979 | 64.062 | 56.379 | 59.133 | 55.999 | - | 59.02 |
| ∆ | - | 2.037 | 7.121* | -0.562 | 2.192 | -0.942 | - | 2.078 | |
| CP06 | GDI | 63.989 | 70.054 | 69.740 | 71.392 | 71.114 | 70.075 | 66.325 | 71.27 |
| ∆ | - | 6.065* | 5.750* | 7.402* | 7.124* | 6.085* | 2.335 | 7.281* |
Table 3.
Results of the Coefficient of Variation (CV) in ankle, knee, and hip joints across all participants and conditions. The ∆ symbol indicates the results are after subtracting from TD. NoStim = Without any stimulation, All = Typical muscle activation patterns, PT-derived = Physical therapists’ chosen muscles, TRG = Combined activation of Triceps Surae, Rectus Femoris and Gluteus Maximus, TA = Tibialis Anterior, RF = Rectus Femoris, Gmax = Gluteus Maximus, and TS=Triceps Surae. TD = typically developing children (control group).
Table 3.
Results of the Coefficient of Variation (CV) in ankle, knee, and hip joints across all participants and conditions. The ∆ symbol indicates the results are after subtracting from TD. NoStim = Without any stimulation, All = Typical muscle activation patterns, PT-derived = Physical therapists’ chosen muscles, TRG = Combined activation of Triceps Surae, Rectus Femoris and Gluteus Maximus, TA = Tibialis Anterior, RF = Rectus Femoris, Gmax = Gluteus Maximus, and TS=Triceps Surae. TD = typically developing children (control group).
| Subjects | Joints’ CV | NoStim | All | PT-derived | TRG | TA | RF | Gmax | TS | |
|---|---|---|---|---|---|---|---|---|---|---|
| CP01 | Ankle | 0.231 | 0.553 | 0.591 | 0.398 | 0.137 | 0.498 | 0.261 | 0.330 | |
| ∆ | - | 0.180 | 0.143 | 0.336 | 0.597 | 0.236 | 0.473 | 0.404 | ||
| Knee | 0.108 | 0.323 | 0.467 | 0.459 | 0.1 | 0.303 | 0.158 | 0.137 | ||
| ∆ | - | 0.104 | 0.040 | 0.032 | 0.327 | 0.124 | 0.269 | 0.290 | ||
| Hip | 0.072 | 0.110 | 0.126 | 0.144 | 0.064 | 0.095 | 0.098 | 0.090 | ||
| ∆ | - | 0.473 | 0.457 | 0.439 | 0.519 | 0.488 | 0.485 | 0.493 | ||
| CP02 | Ankle | 0.208 | 0.272 | 0.167 | 0.274 | 0.208 | 0.395 | 0.253 | 0.250 | |
| ∆ | - | 0.462 | 0.567 | 0.461 | 0.527 | 0.339 | 0.481 | 0.484 | ||
| Knee | 0.103 | 0.243 | 0.217 | 0.174 | 0.096 | 0.243 | 0.092 | 0.089 | ||
| ∆ | - | 0.185 | 0.211 | 0.254 | 0.332 | 0.185 | 0.336 | 0.339 | ||
| Hip | 0.077 | 0.134 | 0.089 | 0.087 | 0.066 | 0.118 | 0.089 | 0.064 | ||
| ∆ | - | 0.449 | 0.494 | 0.496 | 0.518 | 0.465 | 0.494 | 0.519 | ||
| CP03 | Ankle | 0.117 | 0.492 | 0.275 | 0.386 | 0.131 | 1.019 | 0.086 | 0.191 | |
| ∆ | - | 0.242 | 0.460 | 0.349 | 0.603 | 0.285 | 0.648 | 0.543 | ||
| Knee | 0.069 | 0.395 | 0.249 | 0.290 | 0.066 | 0.823 | 0.063 | 0.084 | ||
| ∆ | - | 0.033 | 0.179 | 0.138 | 0.362 | 0.396 | 0.365 | 0.343 | ||
| Hip | 0.057 | 0.198 | 0.138 | 0.111 | 0.049 | 0.177 | 0.045 | 0.059 | ||
| ∆ | - | 0.385 | 0.445 | 0.472 | 0.535 | 0.406 | 0.539 | 0.524 | ||
| CP04 | Ankle | 0.208 | 0.421 | 0.188 | 0.313 | 0.160 | 0.478 | 0.181 | 0.188 | |
| ∆ | - | 0.313 | 0.546 | 0.422 | 0.574 | 0.256 | 0.553 | 0.546 | ||
| Knee | 0.120 | 0.412 | 0.215 | 0.293 | 0.098 | 0.469 | 0.111 | 0.091 | ||
| ∆ | - | 0.015 | 0.213 | 0.135 | 0.330 | 0.041 | 0.317 | 0.337 | ||
| Hip | 0.059 | 0.204 | 0.106 | 0.155 | 0.060 | 0.172 | 0.057 | 0.055 | ||
| ∆ | - | 0.380 | 0.478 | 0.428 | 0.524 | 0.411 | 0.526 | 0.528 | ||
| CP05 | Ankle | 0.229 | 0.199 | 0.432 | 0.323 | 0.228 | 0.366 | - | 0.301 | |
| ∆ | - | 0.535 | 0.303 | 0.411 | 0.506 | 0.368 | - | 0.433 | ||
| Knee | 0.183 | 0.218 | 0.295 | 0.315 | 0.247 | 0.280 | - | 0.209 | ||
| ∆ | - | 0.210 | 0.133 | 0.113 | 0.181 | 0.148 | - | 0.218 | ||
| Hip | 0.111 | 0.167 | 0.140 | 0.151 | 0.143 | 0.123 | - | 0.140 | ||
| ∆ | - | 0.417 | 0.444 | 0.432 | 0.441 | 0.460 | - | 0.444 | ||
| CP06 | Ankle | 0.191 | 0.306 | 0.275 | 0.265 | 0.221 | 0.187 | 0.215 | 0.277 | |
| ∆ | - | 0.428 | 0.459 | 0.469 | 0.513 | 0.547 | 0.520 | 0.458 | ||
| Knee | 0.095 | 0.139 | 0.160 | 0.165 | 0.080 | 0.132 | 0.081 | 0.125 | ||
| ∆ | - | 0.288 | 0.268 | 0.262 | 0.348 | 0.295 | 0.347 | 0.303 | ||
| Hip | 0.083 | 0.084 | 0.092 | 0.086 | 0.051 | 0.065 | 0.081 | 0.093 | ||
| ∆ | - | 0.499 | 0.491 | 0.497 | 0.532 | 0.519 | 0.502 | 0.491 | ||
| TD | Ankle | 0.734 | ||||||||
| Knee | 0.428 | |||||||||
| Hip | 0.583 | |||||||||
Disclaimer/Publisher’s Note: The statements, opinions and data contained in all publications are solely those of the individual author(s) and contributor(s) and not of MDPI and/or the editor(s). MDPI and/or the editor(s) disclaim responsibility for any injury to people or property resulting from any ideas, methods, instructions or products referred to in the content. |
© 2026 by the authors. Licensee MDPI, Basel, Switzerland. This article is an open access article distributed under the terms and conditions of the Creative Commons Attribution (CC BY) license (http://creativecommons.org/licenses/by/4.0/).
Copyright: This open access article is published under a Creative Commons CC BY 4.0 license, which permit the free download, distribution, and reuse, provided that the author and preprint are cited in any reuse.