

Submitted:
16 September 2026
Posted:
17 September 2026
You are already at the latest version
Abstract
Public health emergency risk assessments commonly summarize likelihood and impact, but categorical risk matrices may not fully represent the population-exposure burden created by multi-hazard portfolios. This nationwide ecological study analyzed municipality-level summaries from 161 Serbian local administrative units assessed with the World Health Organization Strategic Toolkit for Assessing Risks (WHO STAR) in 2024. In addition to the supplied ordinal STAR measures, we derived an analytical probability-impact product (PIP), cumulative hazard-exposure burden (CHEB = hazard count × exposure), portfolio risk burden (PRB = PIP × CHEB), and a sample-relative 0–100 Integrated Portfolio Disaster Risk Index (IPDRI). Geographic Information Systems (GIS)-based thematic mapping was used to integrate the analytical dataset with local administrative boundaries and to visualize the spatial distribution of the original STAR indicators and derived burden measures. Primary inference combined rank-based methods with Pearson correlations, Welch tests, robust analysis of variance, non-circular sensitivity models, and exploratory cluster analysis. The supplied STAR risk distribution was predominantly moderate (83.2%), with 11.2% low and 5.6% high. Risk was most strongly associated with probability (Spearman’s ρ = 0.534, 95% bootstrap CI [0.357, 0.683], p < 0.001) and frequency (ρ = 0.360, p < 0.001), and differed substantially across 25 districts, H(24) = 81.95, p < 0.001, ε² = 0.426. Applying STAR matrix thresholds to aggregate PIP reproduced the supplied risk category in 75.8% of units (quadratic weighted κ = 0.484), indicating only moderate aggregate concordance. IPDRI averaged 43.64 (SD = 21.45) and was strongly associated with CHEB (r = 0.889, 95% CI [0.852, 0.918], p < 0.001), but not significantly associated with the supplied STAR risk category (r = 0.117, p = 0.138). IPDRI differed across macroregions, Welch F(2, 53.15) = 10.11, p < 0.001, and districts, Welch F(24, 38.79) = 14.12, p < 0.001. A three-cluster solution (silhouette = 0.549) identified distinct local risk profiles and differed on external STAR risk, F(2, 158) = 12.72, p < 0.001, η² = 0.139. The findings indicate that STAR risk intensity and exposure-weighted portfolio burden capture complementary dimensions of local public health emergency risk and should be interpreted jointly in preparedness planning.
Keywords:
public health emergency
; WHO STAR
; disaster risk assessment
; exposure burden
; GIS
; local government
; preparedness
; risk typology
; Serbia
1. Introduction
Public health emergencies are increasingly understood as manifestations of interacting hazards, exposed populations, pre-existing vulnerability, institutional conditions, and the capacities available to anticipate, absorb, respond to, and recover from disruption. This interpretation is consistent with the broader evolution of disaster-risk science from hazard-centred models toward relational and systems-oriented conceptions of risk, in which adverse outcomes depend on where hazards occur, who and what is exposed, how vulnerability is produced, and which protective capacities are available (Adger, 2006; Cutter, Boruff, & Shirley, 2003; Flanagan, Gregory, Hallisey, Heitgerd, & Lewis, 2011; Keim, 2008, 2018; Marin, Modica, Paleari, & Zoboli, 2021). For public health, the implication is especially important: an identical hazard can generate very different consequences across territories because surveillance, health-service continuity, infrastructure, social protection, risk communication, institutional coordination, and community resources are unevenly distributed.
The all-hazards perspective has therefore become central to preparedness and health security. Public health emergency preparedness is not simply the possession of plans or emergency stockpiles; it is a complex adaptive capability involving governance, leadership, information systems, workforce, partnerships, communication, equity, learning, and the ability to reorganize under stress (Khan et al., 2018; Khatri et al., 2023; Gooding, Bertone, Loffreda, & Witter, 2022; Sasie et al., 2026; El-Jardali et al., 2025). Health-system resilience similarly requires continuity of essential functions, adaptive reconfiguration, and institutional learning before, during, and after shocks (Kruk, Myers, Varpilah, & Dahn, 2015; Kandel & Chungong, 2022; Plough et al., 2013; Peterson, Baggett, Evans, & Sullivan, 2024). These capacities become particularly consequential when multiple hazards coexist or interact, because preparedness decisions must account not only for the intensity of a single event but also for cumulative exposure, interdependence, and the possibility of cascading consequences.
Contemporary multi-hazard research reinforces this concern. Aggregate, compound, cascading, and systemic risk perspectives show that the total burden of multiple hazards cannot always be inferred from single-hazard assessments considered independently (Drakes & Tate, 2022; Pescaroli & Alexander, 2018; Gill & Malamud, 2016; de Ruiter & van Loon, 2022; van den Hurk et al., 2023). Global disaster-record analyses indicate that multi-hazard events account for a disproportionate share of damages and affected populations, while recent frameworks increasingly emphasize interactions among hazards, infrastructure, governance, and social vulnerability (Lee et al., 2024; Jäger, de Ruiter, Tiggeloven, & Ward, 2025; Tiggeloven et al., 2026; Liu & Renn, 2025; Leone et al., 2025). This shift has direct implications for local public health planning, where several moderate hazards may collectively generate substantial operational burden even when no single hazard dominates the risk matrix.
Subnational analysis is consequently indispensable. Local governments and local health systems translate national policy into surveillance, warning, emergency logistics, public communication, service continuity, protection of vulnerable groups, and coordination with civil protection, social services, utilities, civil society, and community organizations. Evidence from different governance settings shows that preparedness and resilience depend strongly on cross-sector collaboration, clarity of mandates, sustained financing, regional coordination, professional networks, and meaningful stakeholder participation (Stoto, 2008; Wolf-Fordham, 2020; Lee, 2019; Dai & Azhar, 2024; Djalante & Lassa, 2019; Okunola, 2025a, 2025b). Sendai Framework implementation has similarly highlighted persistent difficulties in translating national commitments into locally integrated, data-informed, and accountable disaster-risk governance (Mizutori, 2020; Surianto, Alim, Nindrea, & Trisnantoro, 2019; Nekoei-Moghadam, Moradi, & Tavan, 2024; Cabral-Ramírez, Niño-Barrero, & DiBella, 2025).
The World Health Organization (WHO) Strategic Toolkit for Assessing Risks (STAR) operationalizes an all-hazards, whole-of-society approach to strategic public health risk assessment. STAR structures the assessment around hazard identification, probability, impact, vulnerability, coping capacity, data confidence, risk prioritization, and translating findings into preparedness action. Recent applications demonstrate the value of STAR for participatory prioritization and multisector preparedness in different contexts, including Niger State in Nigeria, the WHO Eastern Mediterranean Region, West and Central Africa, and Serbia (Awoyale et al., 2026; Elhakim et al., 2024; Yota, Massidi, Talisuna, & Tchikamgoua, 2026; Tomašević et al., 2024). At the same time, recent evidence also shows that STAR is a strategic assessment tool rather than a statistical forecasting model; its usefulness depends on the quality and timeliness of input data, geographic resolution, expert consensus, and repeated updating (Yota et al., 2026).
Serbia provides a particularly relevant setting for examining these issues. Previous studies have documented substantial spatial differences in disaster preparedness, resilience, institutional capacity, risk perception, and communication across Serbian municipalities and regions (Cvetković et al., 2021; Cvetković, 2023; Cvetković et al., 2026a, 2026b; Nikolić, Cvetković, Renner, Cvijović, & Gačić, 2025). Research following major floods and other hazards has also identified persistent problems related to local preparedness, planning, institutional coordination, public participation, and the uneven translation of policy into practice (Cvetković, Roder, Öcal, Tarolli, & Dragićević, 2018; Cvetković et al., 2019; Trgovčević, Stupar, Ivanović, & Susman, 2020; Beli, Renner, Cvetković, Ivanov, & Gačić, 2025). The national STAR implementation therefore provides an unusual opportunity to examine public-health risk profiles across essentially the full territorial assessment frame rather than a small convenience sample of municipalities.
1.1. Research Gap, Methodological Problem, and Study Contribution
Despite rapid growth in indicator-based disaster-risk and resilience assessment, three gaps remain relevant to the present study. First, composite and ordinal indicators can obscure the distinction between risk intensity and cumulative exposure burden. Composite-index research repeatedly shows that different normalization, weighting, aggregation, and spatial-unit decisions can change rankings and policy interpretation (Beccari, 2016; Marzi et al., 2019; Sibilia et al., 2024; Painter et al., 2024; Mah, Penwarden, Pott, Theou, & Andrew, 2023). Second, formative assessment systems such as STAR contain explicit structural dependencies among variables. In STAR, probability and impact determine the hazard-specific risk category, while impact derives from severity, vulnerability, and coping capacity. Treating these construction components as statistically independent causal predictors of the final score therefore creates part-whole coupling. Third, aggregated municipality-level summaries can create an aggregation-order problem: multiplying an aggregated probability score by an aggregated impact score need not reproduce a risk score first calculated at the hazard level and then aggregated.
The present study addresses these gaps through a nationwide ecological secondary analysis of the Serbian STAR assessments. In addition to the supplied STAR risk category and component scores, the analysis distinguishes probability-impact intensity from exposure-weighted portfolio burden by constructing transparent exploratory measures: the probability-impact product (PIP), cumulative hazard-exposure burden (CHEB), exposure-weighted PIP, portfolio risk burden (PRB), and a sample-relative Integrated Portfolio Disaster Risk Index (IPDRI). These measures are not proposed as replacements for WHO STAR or as validated expected-loss models. Their purpose is analytical: to test whether a local unit's cumulative portfolio/exposure burden contains information that is not represented by the categorical probability-impact risk matrix.
To support territorial interpretation of these complementary risk dimensions, the municipality-level analytical data were additionally integrated with administrative spatial units in a GIS environment and visualized through a harmonized set of thematic maps.
Accordingly, the study addresses five questions: (RQ1) What is the national distribution of STAR risk and its component scores across Serbian local administrative units? (RQ2) How are the component scores associated with the ordinal STAR risk level, while recognizing the formative structure of the instrument? (RQ3) How strongly do risk, vulnerability, exposure, coping capacity, data confidence, and the derived burden measures vary spatially across local administrative units, districts, and broader territorial groups? (RQ4) Are the conclusions robust across parametric, robust, ordinal, and nonparametric analyses? (RQ5) Does an exposure-weighted portfolio perspective reveal a complementary dimension of local disaster-related public health burden and empirically distinct local risk profiles?
2. Literature Review and Conceptual Framework
2.1. Disaster Risk as an Interaction of Hazard, Exposure, Vulnerability, and Capacity
Disaster-risk theory has increasingly moved away from explanations that attribute disaster consequences to hazard magnitude alone. Vulnerability scholarship emphasizes that losses arise from the interaction of environmental threats with social, economic, demographic, institutional, and infrastructural conditions (Adger, 2006; Cutter et al., 2003; Flanagan et al., 2011). In public-health settings, Keim (2018) similarly argues that disaster-related health risk requires attention to probability and impact together with the determinants that make populations susceptible or protected. Spatial risk research reinforces this position: fine-resolution analyses in Japan, Romania, Italy, Spain, and China demonstrate that exposure and vulnerability vary substantially within countries and that such differences can change the location and magnitude of identified risk (Raduszynski & Numada, 2023; Chelariu, Minea, & Iatu, 2024; Galderisi & Limongi, 2021; Tascón-González, Ferrer-Juliá, Ruiz, & García-Meléndez, 2020; Zhou & Zhai, 2023).
Capacity is not simply the conceptual opposite of vulnerability. Empirical and theoretical work has shown that resilience, coping capacity, adaptive capacity, and vulnerability overlap only partially and can produce different territorial rankings (Derakhshan, Emrich, & Cutter, 2022; Norris, Stevens, Pfefferbaum, Wyche, & Pfefferbaum, 2008; Sherrieb, Norris, & Galea, 2010). A vulnerable community may possess strong social networks or institutional resources, while a less socially vulnerable community may still be poorly prepared for a particular hazard. This distinction is central to public-health emergency management because response depends simultaneously on health-system resources, community networks, information flows, governance, and the ability to mobilize those assets under time pressure (Pfefferbaum, Pfefferbaum, & Van Horn, 2015; Pfefferbaum, Van Horn, & Pfefferbaum, 2017; Plough et al., 2013).
For this reason, disaster-risk assessment increasingly uses multidimensional frameworks rather than a single hazard score. Marin et al. (2021) integrate natural and socioeconomic dimensions; Orencio and Fujii (2013) develop a localized resilience index; Mavhura, Manyangadze, and Aryal (2021) adapt the Disaster Resilience of Place approach; and Azzimonti, Colleoni, De Amicis, and Frigerio (2020) combine hazard, vulnerability, and resilience for seismic-risk planning. These studies support a conceptual distinction adopted in the present analysis: risk intensity, population exposure, structural susceptibility, and response capacity are related but not interchangeable dimensions and should be interpreted jointly rather than collapsed without qualification.
2.2. From Multi-Hazard Assessment to Compound, Cascading, and Systemic Risk
The multi-hazard literature shows that the phrase 'multi-hazard' covers several analytically different situations. It may denote the aggregation of several independent hazards, compound hazards that occur jointly or sequentially, cascading processes in which one event triggers another, or systemic risks that propagate through interdependent social and technological systems (Drakes & Tate, 2022; Pescaroli & Alexander, 2018; Gill & Malamud, 2016). These distinctions matter because aggregate risk rankings can miss interactions, temporal sequences, and feedback mechanisms that alter vulnerability and consequences during a crisis (de Ruiter & van Loon, 2022; van den Hurk et al., 2023).
Recent empirical evidence illustrates the magnitude of this problem. Reclassifying historical disasters suggests that multi-hazard events account for a substantial share of disaster losses (Lee et al., 2024), while analyses of global disaster records found that multi-hazard events were associated with disproportionate shares of total damages, affected populations, and mortality (Jäger et al., 2025). At the modeling level, dynamic Bayesian networks, event-tree approaches, and multi-hazard asset frameworks increasingly attempt to represent cross-sector dependencies and cascading failures rather than simply summing single-hazard scores (Bakhtiari, Najafi, Goda, & Peerhossaini, 2025; Leone et al., 2025).
This evolution has also shifted the policy debate toward systemic risk governance. Liu and Renn (2025) connect systemic-risk and polycrisis scholarship to assessment, governance, and communication; Triyanti et al. (2023) show the institutional difficulties of governing cascading risk at the local level; and Tiggeloven et al. (2026) identify multiscale coordination, data governance, emerging technologies, and inclusive engagement as priorities for the post-Sendai risk landscape. Adaptive pathway approaches similarly argue that multi-risk management must account for interactions, uncertainty, and changing conditions through time (Schlumberger, Haasnoot, Aerts, & de Ruiter, 2022).
National-scale applications also demonstrate the practical importance of harmonizing heterogeneous hazard, exposure, and vulnerability information. Delves et al. (2026), for example, developed a multi-hazard assessment for Burundi under severe data constraints, emphasizing transparent harmonization and identifying areas where additional data and risk-reduction effort are most needed. Such work supports the present study's emphasis on portfolio burden and data confidence: in a local public-health context, the number of hazards and the share of the population exposed may represent an operational burden not fully captured by the highest or average categorical risk intensity.
Recent evidence published in the International Journal of Disaster Risk Management (IJDRM) further supports the need to distinguish uniform risk labels from differentiated, context-sensitive risk profiles. Canete and Biñas (2025) conceptualize differential risk as a function of unequal vulnerability and resilience capacity among elements exposed to the same hazard, while Pradhan, Kumar, and Nayak (2025) show how integrated governance, preparedness, and community participation can shift disaster-prone settings from vulnerability toward resilience. Public-health consequences add another layer to this differentiation: Koech (2026) links recurrent urban flooding to mortality, displacement, infectious disease, and governance failures, showing how environmental exposure can become a sustained health emergency. A similarly holistic interpretation of risk, in which causes, consequences, institutional capacity, and resilience are treated as an interconnected system, has been advanced for technological and industrial hazards (Cvetković, Renner, & Jakovljević, 2024).
2.3. Composite Indicators, Spatial Heterogeneity, and the Problem of Aggregation
Composite indicators are widely used because they translate multiple dimensions into interpretable rankings, maps, and priority classes. However, their apparent simplicity masks important methodological choices. Beccari's (2016) review of 106 disaster-risk, vulnerability, and resilience methodologies found extensive variation in indicator selection, weighting, aggregation, and sensitivity analysis. More recent reviews confirm persistent issues related to context specificity, validation, transferability, and policy use (Painter et al., 2024; Mah et al., 2023; Laurien, Martin, & Mehryar, 2022).
Empirical index studies repeatedly demonstrate that methodological choices influence spatial results. Marzi et al. (2019) showed that normalization and aggregation affect resilience rankings in Italy; Bucherie et al. (2022) found that expert-driven and principal-component approaches can produce different social-vulnerability patterns; and Sibilia et al. (2024) demonstrated the value of a multi-level European vulnerability indicator for analysing change across space and time. These findings caution against interpreting any single composite score as a direct physical quantity.
Spatial resolution further shapes interpretation. Raduszynski and Numada (2023) found pronounced submunicipal heterogeneity in Japanese vulnerability and exposure; Chelariu et al. (2024) combined geophysical and social vulnerability at the local administrative unit level in Romania; and Galderisi and Limongi (2021) emphasized the importance of comprehensive exposure and vulnerability knowledge for risk-informed urban planning. Tascón-González et al. (2020) likewise showed how fine-scale vulnerability mapping can support local flood management. Geographic information systems (GIS) provide a complementary framework for translating indicator-based risk assessments into spatially interpretable patterns. By linking harmonized statistical attributes with administrative spatial units, GIS-based thematic mapping enables direct comparison of hazard, exposure, vulnerability, capacity, and composite risk indicators across local areas and helps identify spatial convergence and divergence among related risk dimensions. Such spatially explicit approaches are particularly useful when nationally aggregated indicators conceal substantial local heterogeneity (Sabljić et al., 2025; Sabljić et al., 2026).
These concerns are directly relevant to aggregated STAR data. If probability, impact, and risk are calculated for individual hazards and then separately summarized across the local hazard portfolio, the summary values are not algebraically guaranteed to preserve the original hazard-level scoring relation. The present study therefore treats PIP–STAR disagreement as an aggregation-order diagnostic rather than as proof of error. This approach follows the broader composite-indicator literature in distinguishing a measurement model from the physical or social phenomenon it seeks to represent (Marzi et al., 2019; Beccari, 2016; Derakhshan et al., 2022).
2.4. Public Health Emergency Preparedness, Health-System Resilience, and Strategic Risk Assessment
Public health emergency preparedness has developed from a checklist-oriented concept toward a systems perspective. Nelson, Lurie, Wasserman, and Zakowski (2007) emphasized the need for an explicit preparedness construct, while later work conceptualized preparedness as a resilient complex adaptive system of interdependent capacities (Khan et al., 2018). Indicator-development research has subsequently operationalized preparedness through measurable capabilities and performance dimensions (Savoia et al., 2009; Khan et al., 2019; Sasie et al., 2025).
Health-system resilience scholarship reaches a similar conclusion. Kruk et al. (2015) define resilience as preparation, effective response, maintenance of core functions, and reorganization when required. Khatri et al. (2023) identify surveillance, integrated services, multisector coordination, digital tools, and resilient system planning as recurring preparedness priorities. In contrast, Gooding et al. (2022) show that coordination is enabled by inclusive structures, clear mandates, organizational capacity, and political leadership. Recent assessment instruments further broaden preparedness to include financing, governance, information systems, health-service resources, socioeconomic context, spatial design, and community services (El-Jardali et al., 2025; Wen, Ismail, & Abdul Nasir, 2025).
Preparedness measurement must also be dynamic. Kandel and Chungong (2022) argue for metrics that can change with emerging threats and inform action rather than merely document static capacity. Exercise-based research demonstrates the value of testing communication, information sharing, and organizational roles under simulated pressure (Hunter, Yang, Petrie, & Aragón, 2012), while evidence-based preparedness strategies stress emergency procurement, workforce surge, equity, community partnerships, and the routine use of vulnerability data (Peterson et al., 2024).
WHO STAR fits within this broader risk-based preparedness architecture. It is designed to support systematic hazard prioritization and action planning rather than to produce a purely actuarial prediction. Awoyale et al. (2026) showed that a STAR-based multi-hazard assessment can generate actionable state-level preparedness priorities; Elhakim et al. (2024) positioned STAR within a wider preparedness ecosystem that includes the International Health Regulations monitoring framework, exercises, emergency operations centers, One Health, and risk communication; and Goode et al. (2021) demonstrated the value of structured rapid risk and impact tools for defensible decision-making in environmental emergencies.
Evidence from Serbia and West/Central Africa is especially pertinent. Tomašević et al. (2024) described the Serbian local-government STAR process as a capacity-building and harmonization initiative. In contrast, Yota et al. (2026) found that STAR's correspondence with observed emergencies varied by hazard and context. Their analysis reinforces a central point for the present study: STAR should be interpreted as a strategic prioritization framework whose performance depends on input data, hazard dynamics, preventive actions, and geographic resolution, not as a fixed statistical forecast.
The strategic-risk approach is also embedded in the international normative architecture for health security and disaster-risk reduction. The International Health Regulations establish obligations for core public-health capacities and notification (World Health Organization [WHO], 2016); the WHO emergency risk communication guideline places timely, trusted, and coordinated communication within preparedness and response (WHO, 2017); the Health Emergency and Disaster Risk Management Framework integrates prevention, preparedness, response, and recovery across health and other sectors (WHO, 2019); and the COVID-19 Strategic Preparedness and Response Plan illustrated the need to operationalize these capacities during a global emergency (WHO, 2020). STAR provides a structured all-hazards risk-assessment mechanism within this wider architecture (WHO, 2021), while the Sendai Framework establishes the broader disaster-risk governance mandate to understand risk, strengthen governance, invest in resilience, and enhance preparedness (United Nations Office for Disaster Risk Reduction [UNDRR], 2015).
The IJDRM literature also provides directly relevant evidence on the public-health and regional dimensions of risk-informed preparedness. Spatial analysis of notifiable diseases can strengthen the territorial identification of health risk and support geographically differentiated surveillance and intervention (Djebari & Bestandji, 2025). In Southeast Europe, Ivanov (2024) identifies coordination gaps, institutional inefficiencies, and resource constraints as ongoing obstacles to implementing disaster risk reduction, while Cvetković (2025) emphasizes uneven preparedness among first-responder sectors in the Western Balkans and the importance of capacity building, interoperability, and cross-border cooperation. Together, these studies reinforce the rationale for analyzing Serbian STAR results at subnational level rather than treating national preparedness as spatially uniform.
2.5. Local Governance, Community Resilience, Risk Communication, and Trust
Preparedness is enacted through governance networks rather than by health agencies in isolation. Regionalization can improve resource use, planning, exercises, and professional networks when leadership and trust support it (Stoto, 2008). Conversely, organizational silos between public health, emergency management, local government, and other sectors can weaken preparedness and response (Wolf-Fordham, 2020). Cross-national governance research similarly identifies collaboration, accountability, multilevel coordination, and locally meaningful participation as recurring determinants of effective disaster-risk governance (Dai & Azhar, 2024; Djalante & Lassa, 2019; Okunola, 2025a, 2025b).
Sendai implementation research shows that formal policy adoption is insufficient when local capacity, resources, participation, or institutional learning are weak. Mizutori (2020) emphasized the importance of disaggregated data, risk-informed investment, and monitoring; Surianto et al. (2019) identified persistent gaps in coordination and assessment capacity; Nekoei-Moghadam et al. (2024) highlighted the need for context-specific implementation strategies; and Cabral-Ramírez et al. (2025) stressed multi-stakeholder co-production. Tiernan et al. (2019) similarly observed the growing importance of shared responsibility, public-private partnerships, and adaptive resilience.
At the community level, resilience depends on adaptive capacities, including economic resources, social capital, information and communication, and community competence (Norris et al., 2008). Quantitative operationalization of these capacities has shown that resilience can be assessed with population-level indicators, although contextual interpretation remains essential (Sherrieb et al., 2010). Community interventions are more likely to strengthen resilience when they are multi-hazard, participatory, locally grounded, asset-aware, and oriented toward skill development and social connections (Pfefferbaum et al., 2015; Pfefferbaum et al., 2017; Räsänen, Lein, Bird, & Setten, 2020).
Risk communication is central to this governance architecture. Systematic reviews show that preparedness is enhanced by sustained community engagement, two-way communication, trust, local tailoring, and inclusion rather than by one-way information provision alone (Ryan, Johnston, Taylor, & McAndrew, 2020; Vandrevala et al., 2024; Hinata, Rohde, & Templeton, 2024). Community engagement in early warning remains uneven, particularly across risk knowledge, monitoring, communication, and response capability (Sufri, Dwirahmadi, Phung, & Rutherford, 2020).
Public-health emergency communication research reaches the same conclusion. WHO-informed evidence syntheses identify local stakeholder engagement, interorganizational networks, exercises, and leadership structures as essential for integrating emergency risk communication into preparedness systems (Jha et al., 2018; Toppenberg-Pejcic et al., 2019; Novak et al., 2019). COVID-19 further demonstrated how information gaps, infodemics, and insufficient community participation can create additional risk (Khan et al., 2022; Tambo, Djuikoue, Tazemda, Fotsing, & Zhou, 2021). Recent scholarship consequently frames disaster communication as a continuum from dissemination to dialogue and participation (Stewart, 2024; Fathollahzadeh et al., 2023; Agyepong & Liang, 2023).
Trust links many of these domains. Reviews show that institutional and community trust influence preparedness, warning interpretation, cooperation, and resilience, although effects remain context-dependent (Bonfanti et al., 2024; Nicholas, Donovan, Oppenheimer, Bell, & Van Wyk de Vries, 2026). This is particularly relevant when risk assessment depends on expert judgment and uneven-quality data: confidence in the evidence base, transparency about uncertainty, and institutional credibility become part of the practical effectiveness of risk governance.
A substantial body of IJDRM research converges on the importance of local and multilevel governance. Earlier work linked legal-institutional arrangements to community resilience (Goyal, 2019), while more recent studies show that decentralization alone does not guarantee municipal-level operational capacity (Mokhele, 2024). Policy evaluations in Puntland similarly identify institutional preparedness, community engagement, and implementation capacity as decisive for effective disaster-risk governance (Mohamed Kalakaan, 2025). Good-governance reviews further highlight accountability, participation, coordination, and institutional readiness (Dalangin, 2025), while grassroots evidence shows that weak resources and limited participation can widen the gap between national disaster policy and local practice (Salam, Hemel, Roni, Pandith, & Nabilah Ma-ee-sha, 2025). Comparable findings appear in fragile-state contexts, where local governance capacity, insecurity, and community resilience interact strongly (Unaam, 2026), and in coastal Bangladesh, where institutional and community perspectives on disaster-management committees do not always align (Tamim, Faisal, Saha, Boiddho, & Cvetković, 2026).
Communication-oriented IJDRM studies complement this governance evidence. Flood early-warning systems can be constrained by institutional, technological, and community-level barriers even when warning infrastructure exists (Sukhwani, Gyamfi, Zhang, AlHinai, & Shaw, 2019), while school-community collaboration illustrates how locally embedded knowledge and preparedness relationships can strengthen resilience (Rico, 2019). A recent systematic review emphasizes that the timeliness and clarity of safety announcements shape public understanding and trust during disasters (Sacyaten, 2025), and research on digital communication shows that social media and mobile technologies can extend warning and coordination functions when they are institutionally integrated rather than used ad hoc (Yamah & Folorunsho, 2026). The inclusion dimension is equally important: technology and policy innovation are most useful when they explicitly address the needs of marginalized groups and connect risk reduction with participatory governance (Karmaker & Cvetković, 2026).
2.6. Serbia and the Southeast European Evidence Gap
Research in Serbia has documented many of the same structural challenges identified internationally. A national study of local self-government capacity found that effective disaster-risk management required continued development of strategic, operational, financial, partnership, and communication capacity (Cvetković et al., 2021). Household and flood-preparedness research identified low or uneven preparedness and meaningful demographic differences in risk perception and response behavior (Cvetković et al., 2019; Cvetković et al., 2018). Policy analysis of the 2014 flood experience highlighted weaknesses in planning, implementation, infrastructure, and risk assessment (Trgovčević et al., 2020).
More recent Serbian research has moved toward composite resilience and governance analysis. The BRIC–DROP study reported substantial subnational variation and identified risk communication, early warning, evacuation/shelter readiness, and financing as persistent weaknesses (Cvetković et al., 2026a). Qualitative research on the evolution of resilience measurement emphasized fragmentation, central dependence, and the limitations of purely indicator-based approaches (Cvetković et al., 2026b). The MODERSI framework similarly argues for integrating social identity and community dimensions into resilience assessment (Cvetković, 2023).
Environmental-risk research in Serbia also shows the importance of trust, transparency, and place-specific governance. Nikolić et al. (2025) found that environmental information and institutional transparency were associated with trust and perceived resilience near the Duboko landfill. A wider Southeast European comparison identified limited local capacity, fragmented coordination, and inadequate public awareness as recurring regional challenges despite formal legal and strategic frameworks (Beli et al., 2025). These findings make a nationwide local-level public-health risk assessment particularly valuable: it can connect the disaster-resilience literature with the operational risk profiles used for preparedness planning.
The 2024 Serbian STAR implementation provides that opportunity. The national project generated local risk profiles through a standardized participatory methodology across 144 local self-government units and 17 municipalities of the City of Belgrade (Tomašević et al., 2024). The present study extends this operational assessment into a scientific secondary analysis by examining distributional patterns, geographic heterogeneity, scale direction, aggregation effects, and the distinction between probability-impact intensity and cumulative exposure-weighted portfolio burden.
The Serbian and regional literature has also become more explicit about resilience's multidimensionality and measurement limits. Milenković and Cvetković (2025) frame disaster resilience as a dynamic construct spanning physical, social, institutional, and economic dimensions and emphasize the role of multiple actors across levels. Extending this line of work, Milenković et al. (2026) identify limitations of the original BRIC approach and argue for adapting resilience indicators to the local context. Inclusion-oriented research in Serbia likewise shows that vulnerability and resilience cannot be interpreted without considering disability, access, institutional support, and participation (Jevtić, Cvetković, Gačić, & Raonić, 2025). At the critical-infrastructure level, advanced risk management and financial analysis further show that resilience assessment must connect hazard exposure with organizational capacity and investment priorities (Vidović, Cvetković, & Beriša, 2024). These strands of evidence support the present study's use of complementary STAR components and derived portfolio-burden measures rather than reliance on a single composite category.
3. Methods
3.1. Study Design and Setting
This study used a quantitative, cross-sectional, nationwide ecological design based on secondary analysis of aggregated WHO STAR assessments. The unit of analysis was the local administrative unit. The supplied dataset contained 161 units: 144 local self-government units across Serbia and 17 municipalities of the City of Belgrade. The underlying STAR assessment was implemented from 1 April to 30 September 2024. The official report describes a participatory, evidence-informed assessment process involving public health institutes, local governments, health services, emergency-management structures, and other relevant actors (Tomašević et al., 2024).
3.2. STAR Measures and Coding
The analysis used nine municipality-level variables: number of identified hazards, exposure, frequency, probability, impact, coping-capacity score, vulnerability, data-confidence level, and overall risk level. Exposure was represented as a proportion of the local population exposed across the identified hazards. Frequency, probability, impact, coping capacity, vulnerability, confidence, and risk were ordinal STAR-derived scores. In the official STAR capacity coding, 1 indicates very high coping capacity and 5 very low coping capacity; thus, higher numeric capacity scores represent weaker capacity. In the supplied data, the observed capacity range was 2–4. Vulnerability ranged from 2–3, confidence from 2–3, impact from 2–3, and risk from 2–4.
STAR impact is a derived score based on severity, vulnerability, and coping capacity, while the hazard-specific risk level is generated through a 5 × 5 risk matrix based on probability × impact. The supplied research spreadsheet contained one aggregate score per local administrative unit. Municipality-level STAR profiles were operationalized using the component scores and overall risk categories available for each local assessment. These measures were analyzed as the primary indicators of the local risk profile, while additional composite indices developed in this study were calculated independently to capture complementary dimensions of risk. The derived measures were therefore interpreted as analytical extensions of the STAR framework rather than as direct reproductions of the original risk-classification procedure.
3.3. Data Quality Control
The spreadsheet was checked programmatically before analysis. All 161 local administrative units were unique, and no duplicate district-unit combinations were found. One exposure entry for Golubac was stored as the text string “23.80%”; it was normalized to the numeric proportion 0.238. After this correction, all nine analytic variables had N = 161. Four columns intended to represent managerial, health-sector, non-health-sector, and community subcapacities contained only zeros and therefore had no variance; they were excluded from inferential analysis. The complete analysis-ready municipality-level dataset, including the original STAR indicators, derived portfolio-burden measures, risk classifications, and exploratory cluster assignments for all 161 local administrative units, is provided in Supplementary Table S5 and Table S6.
3.4. Statistical Analysis
The primary analysis respected the ordinal nature and restricted range of the STAR scores. We reported frequencies and percentages for categorical/ordinal variables; we retained means and standard deviations as descriptive summaries to facilitate comparison, but used medians and interquartile ranges for ordinal interpretation. Spearman rank correlations were calculated between risk and the other variables, with 3,000 nonparametric bootstrap resamples for 95% confidence intervals. Kendall’s tau-b was calculated as a sensitivity measure for tied ordinal data. Holm adjustment was applied across the complete set of pairwise correlations.
Regional heterogeneity was assessed across 25 districts/territorial groups using Kruskal–Wallis tests for each analytic variable. Epsilon-squared (ε²) quantified effect size, and Holm correction was applied across the nine omnibus regional tests. Where the omnibus test for risk was significant, Dunn pairwise comparisons with Holm correction were used. The association between district and the three observed risk categories (low, moderate, high) was also examined with a Pearson chi-square statistic; because 65 expected cells were below 5, statistical significance was evaluated with 5,000 label permutations, and a bias-corrected Cramér’s V quantified association strength.
The original model-based analyses were treated as sensitivity/decomposition analyses rather than causal models. First, the hierarchical ordinary least-squares models from were re-estimated after correcting the exposure value and using heteroskedasticity-consistent HC3 standard errors. Variance-inflation factors, Breusch–Pagan and White tests, residual normality diagnostics, Ramsey RESET, leverage, and Cook’s distance were examined. Second, cumulative-logit ordinal models were estimated using standardized predictors. These models were retained to assess robustness of the original analytical strategy, but coefficient interpretation explicitly recognizes STAR’s formative construction. Complementary non-circular models and derived portfolio-burden analyses are described separately below.
3.5. Derived Burden Variables and Complementary Analyses
Two additional models were specified to avoid direct part-whole coupling. First, the analytical PIP score was regressed on CHEB, data confidence, and macroregion indicators using HC3 robust standard errors; probability, impact, vulnerability, and coping capacity were deliberately excluded as predictors. Second, an exploratory cumulative-logit model estimated the association of the supplied STAR risk category with CHEB, data confidence, and macroregion. The latter model was interpreted cautiously because only three outcome categories were observed and the proportional-odds structure was treated as an assumption.
For complementary portfolio-burden analysis, we calculated four transparent derived variables. PIP was defined as aggregated probability × aggregated impact. Because the supplied municipality-level STAR risk category was not always reproduced by thresholding this aggregate cross-product, we treated PIP as an analytical consistency score rather than the official risk measure. We calculated CHEB as hazard count × mean exposure proportion. Exposure-weighted PIP was PIP × exposure. PRB was defined as PIP × CHEB, thereby combining probability-impact intensity with the breadth and average exposure of the local hazard portfolio without re-entering vulnerability or coping capacity, which are already embedded in STAR impact. PRB was min-max rescaled within the national sample to create IPDRI (0–100); the index is sample-relative and must not be interpreted as an absolute probability or expected loss. We summarized structural susceptibility as the mean of vulnerability and the official inverse-coded coping-capacity score, and hazard dynamics as the mean of frequency and probability.
We examined derived variables using Pearson correlations with Fisher-z 95% confidence intervals and Holm correction, alongside Spearman correlations as an ordinal sensitivity analysis. Pre-specified two-group comparisons used Welch independent-samples t tests, Hedges’ g, and Mann–Whitney U sensitivity tests for: data confidence score 3 versus 2, Belgrade versus all other units, and Vojvodina versus Central Serbia. We examined macroregional and district differences with classical and Welch ANOVA where estimable, supplemented by Kruskal–Wallis tests and nonparametric effect sizes. Pairwise district contrasts used Welch tests with Holm correction. We quantified agreement between the PIP-based risk-matrix category and the supplied STAR risk category using exact agreement and linearly/quadratically weighted Cohen’s κ. Finally, exploratory K-means clustering used standardized frequency, CHEB, vulnerability, and coping-capacity code; k = 2–6 solutions were compared using silhouette and Calinski–Harabasz criteria.
3.6. GIS-Based Spatial Data Integration and Thematic Mapping
GIS methods were applied to integrate the municipality-level analytical dataset with the corresponding administrative spatial units and to support the spatial interpretation of the WHO STAR indicators and the derived risk-burden measures. We performed spatial processing and thematic mapping in QGIS version 3.44 using an administrative boundary dataset. All spatial layers were processed in a common coordinate reference system (EPSG:8682).
The analytical database was linked to the administrative boundary layer using consistent local administrative unit identifiers. Before the spatial join, attribute and spatial records were harmonized for administrative-unit names, territorial correspondence, diacritical characters, and dataset structure. Record matching was subsequently verified to ensure one-to-one correspondence between the analytical observations and the mapped local administrative units. For administrative units without analytical observations, we retained them as spatial context and explicitly represented them as “No data”; we did not spatially interpolate or estimate missing analytical values.
We prepared thematic maps for the supplied WHO STAR risk level and its selected components, as well as for the derived exposure-weighted and portfolio-burden measures. Categorical and ordinal indicators were mapped according to their observed score categories, whereas continuous and count-based variables were represented using graduated classes selected according to their empirical distributions; the exact class boundaries are reported in the corresponding map legends. We applied a harmonized cartographic framework across the map series for administrative boundaries, symbology, labels, spatial extent, and missing-data representation. Because the 17 City of Belgrade municipalities are densely packed, an enlarged inset was included to preserve the visibility of individual administrative units and their numerical labels.
The GIS component served as a complementary spatial-analytical procedure rather than a substitute for the statistical analyses. Its primary purpose was to identify and compare the geographic distribution of STAR risk intensity, probability, population exposure, exposure-weighted burden, derived portfolio-risk measures, and exploratory local risk profiles across the 161 local administrative units.
3.7. Visual Overview of the Research Workflow
This subsection visually summarizes how the study was operationalized, from the initial source materials to the final analytic outputs. The figures are not decorative additions; they clarify the logic of the research design, the relationship between the official WHO STAR framework and the derived variables, and the sequence of statistical procedures.
To improve methodological transparency, we added three visual workflow figures. Figure 1 summarizes the overall research process, Figure 2 explains the analytical structure of the official and derived measures, and Figure 3 presents the sequence of statistical procedures used to obtain the final findings.
Figure 2 clarifies the study's analytical logic. The official STAR stream is organized around hazard occurrence, frequency, probability, severity, vulnerability, coping capacity, impact, and the resulting risk intensity. In parallel, the present study constructed complementary portfolio-burden measures—PIP, CHEB, PRB, and IPDRI—to distinguish probability–impact intensity from broader exposure-weighted burden.
Figure 3 synthesizes the statistical workflow. The analysis began with dataset preparation and descriptive profiling, continued with rank-based and territorial comparisons of the official STAR variables, and then moved to constructing and testing derived portfolio-burden measures. The final stage integrated the outputs into tables, figures, and manuscript interpretation.
3.8. Literature Evidence Synthesis
To strengthen the theoretical framing and interpretation of the empirical results, the team conducted a targeted narrative evidence synthesis on 1 September 2026. Searches covered multi-hazard and systemic risk, public-health emergency preparedness, health-system resilience, composite vulnerability/resilience indices, local disaster governance, risk communication, community engagement, and Serbian disaster-risk research. This literature component is a focused narrative synthesis rather than a PRISMA systematic review and is not presented as an exhaustive estimate of the global evidence base.
4. Results
4.1. Data Characteristics and National Risk Distribution
Municipality-level values for all 161 local administrative units are reported in Supplementary Table S5. The mean number of identified hazards was 11.04 (SD = 1.67; median = 10; range = 8–18). Mean exposure was 25.6% (SD = 10.3%; median = 26.4%; range = 1.9%–48.5%). Most ordinal component scores were concentrated around level 3, indicating substantial range restriction: frequency M = 3.04, probability M = 3.01, impact M = 2.72, coping-capacity score M = 2.95, vulnerability M = 2.91, and data confidence M = 2.19. Table 1 summarizes descriptive statistics for all nine analytic variables. The municipality-level spatial distribution of the identified hazard count is provided in Supplementary Figure S1.
The overall risk distribution was strongly concentrated at the moderate level. Of the 161 units, 134 (83.2%) had risk level 3, 18 (11.2%) had risk level 2, and 9 (5.6%) had risk level 4. No units in the analytic spreadsheet were assigned levels 1 or 5.
The municipality-level spatial patterns provide additional context to the national descriptive distribution. The moderate WHO STAR risk category is geographically widespread, whereas low- and high-risk classifications occur in a more limited number of local administrative units (Figure 4A). Probability scores similarly show a predominance of the intermediate category, with higher and lower values occurring more selectively across the country (Figure 4B). In contrast, population exposure shows substantially greater local spatial variability, indicating that administrative units with similar risk or probability scores may differ markedly in the proportion of the population exposed (Figure 4C), while Figure 5 summarizes the corresponding national frequency distribution of the supplied STAR risk levels.
4.2. Associations Between STAR Components and Risk Level
Rank-based analysis showed the strongest positive association between risk level and probability (ρ = 0.534, 95% bootstrap CI [0.357, 0.683], p < 0.001), followed by frequency (ρ = 0.360, 95% CI [0.221, 0.499], p < 0.001). Vulnerability was also positively associated with risk, ρ = 0.287, 95% CI [0.090, 0.478], p < 0.001, as was impact, ρ = 0.258, 95% CI [0.093, 0.409], p = 0.001. The numeric coping-capacity score had a positive association with risk, ρ = 0.240, p = 0.002; because higher STAR capacity scores indicate poorer coping capacity, the substantive direction is consistent with weaker capacity accompanying higher risk. After Holm adjustment across all pairwise correlations, risk remained significantly associated with probability, frequency, vulnerability, and impact, whereas the capacity association did not. The municipality-level spatial distributions of frequency, impact, coping-capacity, and vulnerability scores are shown in Supplementary Figure S2–S5, respectively.
Exposure showed a small negative association with risk that did not reach conventional significance (ρ = −0.139, p = 0.079). Hazard count (ρ = 0.049, p = 0.538) and data confidence (ρ = −0.046, p = 0.561) were not associated with risk. Kendall tau-b results were directionally consistent with the Spearman analysis. Table 2 presents full rank-based association estimates, while Figure 6 visualizes Spearman coefficients with 95% bootstrap confidence intervals.
As a complementary risk-category profile analysis, Kruskal–Wallis tests across low, moderate, and high risk categories showed differences in frequency, probability, impact, vulnerability, and coping-capacity score after Holm adjustment (adjusted p-values ≤ 0.039). In contrast, hazard count, exposure, and data confidence did not differ significantly (adjusted p-values ≥ 0.610). The largest category-separation effect was observed for probability (ε² = 0.307), followed by frequency (ε² = 0.128) and vulnerability (ε² = 0.087). Because probability and impact are embedded in STAR risk construction, and vulnerability and coping capacity contribute to impact, these contrasts are descriptive profile checks rather than independent explanatory tests; we report full results in the supplementary statistical workbook.
4.3. Regional Heterogeneity
All nine analytic variables differed significantly across the 25 districts/territorial groups after Holm correction. The largest regional effects were observed for data confidence, H(24) = 118.47, p < 0.001, ε² = 0.695; exposure, H(24) = 109.97, p < 0.001, ε² = 0.632; hazard count, H(24) = 103.30, p < 0.001, ε² = 0.583; vulnerability, H(24) = 94.29, p < 0.001, ε² = 0.517; and frequency, H(24) = 93.57, p < 0.001, ε² = 0.512. Risk level itself showed a large regional effect, H(24) = 81.95, p < 0.001, ε² = 0.426. The corresponding district-level heterogeneity statistics are summarized in Table 3. The municipality-level maps in Figure 4 and Supplementary Figure S1–S5 provide spatial context for these statistically identified territorial differences.
The district-by-risk contingency table produced χ²(48) = 150.20. Because most expected counts were sparse, we did not rely on the asymptotic chi-square p-value; the 5,000-permutation Monte Carlo test remained significant (p < 0.001), and the bias-corrected Cramér’s V was 0.566, indicating strong geographic structuring of risk-category distributions. Mean risk was highest in North Bačka (M = 3.67; n = 3), Raška (M = 3.60; n = 5), and Bor (M = 3.50; n = 4), while Central Banat (M = 2.20; n = 5) and South Bačka (M = 2.33; n = 12) had the lowest means. Figure 7 shows the district-level composition of low, moderate, and high STAR risk categories, ordered by mean risk level. Interpret these descriptive district rankings cautiously because several districts contained few units.
4.4. Pairwise Regional Contrasts for Risk
Dunn-Holm post hoc tests identified 12 statistically significant district pairs for risk. South Bačka had lower risk ranks than Belgrade, Rasina, Raška, Srem, North Bačka, and Bor. Central Banat had lower risk ranks than Rasina, Raška, Srem, North Bačka, and Bor. The strongest contrast was between South Bačka and Raška (Holm-adjusted p < 0.001). Table 4 reports the 12 statistically significant Dunn–Holm district contrasts. Full post hoc results for all regional component comparisons are provided in the supplementary statistical workbook.
4.5. Model-Based Sensitivity Analyses
The full M3 model explained 48.2% of the variance in the numeric risk score (R² = 0.482, adjusted R² = 0.455). With HC3 standard errors, probability (B = 0.483, β = 0.479, p < 0.001), frequency (B = 0.137, β = 0.176, p = 0.007), vulnerability (B = 0.347, β = 0.241, p = 0.018), and impact (B = 0.171, β = 0.189, p = 0.016) were positively associated with risk. Exposure was negatively associated with risk (B = −0.500, β = −0.126, p = 0.018). The coping-capacity score, hazard count, and data confidence were not independently significant. Full M3 coefficient estimates based on HC3 robust standard errors are reported in Table 5. Adding exposure and capacity to M1 increased R² by 0.020 (nested p = 0.061), and adding hazard count and confidence to M2 increased R² by 0.015 (nested p = 0.109).
The full-model VIFs ranged from 1.13 to 1.31, indicating no material multicollinearity. Breusch–Pagan and White tests did not indicate heteroskedasticity, but residual normality was rejected (Shapiro–Wilk W = 0.939, p < 0.001; Jarque–Bera p < 0.001). Twenty observations exceeded the conventional Cook’s distance threshold of 4/N, reinforcing the decision to treat OLS as a sensitivity analysis. A Brown–Forsythe regional comparison remained significant, p < 0.001. Cumulative-logit sensitivity models were directionally consistent: in a two-component model, a one-standard-deviation increase in probability was associated with 5.62 times the odds of occupying a higher-risk category (95% CI [3.35, 9.45]) and 3.56 times the odds (95% CI [1.96, 6.50]). These odds ratios reflect, in part, STAR’s construction logic and are not interpreted as independent causal effects. Table 6 reports results from the full standardized cumulative-logit sensitivity model.
4.6. Exposure-Weighted Portfolio risk Burden and Aggregation Concordance
The analytical probability-impact product (PIP) had M = 8.18 (SD = 1.70; median = 9; range = 4–12). CHEB, which combines hazard-portfolio breadth with average exposed-population proportion, had M = 2.78 (SD = 1.08), while PRB had M = 22.64 (SD = 10.10). The sample-relative IPDRI therefore had M = 43.64 (SD = 21.45; median = 39.65; range = 0–100). Table 7 summarizes these derived measures nationally, while Supplementary Table S5 provides municipality-level PIP, CHEB, exposure-weighted PIP, PRB, and IPDRI values. We also examined their geographic distributions using GIS-based thematic mapping. Figure 8A–B present CHEB and IPDRI as part of the main spatial results, whereas Supplementary Figure S6–S8 provide municipality-level distributions of PIP, PRB, and exposure-weighted PIP, respectively.
Applying the official STAR risk-matrix thresholds to the aggregate PIP cross-product reproduced the supplied municipality-level STAR risk category in 122 of 161 units (75.8%). Agreement was moderate rather than near-perfect (linear weighted κ = 0.458; quadratic weighted κ = 0.484). In 34 units, the PIP-based category was one level lower than the supplied STAR category; in four units, it was one level higher; and in one unit, it was two levels lower. This pattern indicates that thresholding aggregate probability and impact is not equivalent to the aggregation process that produced the supplied municipality-level risk category, and the PIP score should therefore be interpreted as an analytical cross-product rather than a reconstructed official score.
The new burden dimension was only weakly related to the supplied categorical STAR risk. IPDRI was not significantly correlated with STAR risk, r = 0.117, 95% CI [−0.038, 0.267], p = 0.138, whereas it was moderately related to PIP, r = 0.394, 95% CI [0.254, 0.517], p < 0.001, and very strongly related to CHEB, r = 0.889, 95% CI [0.852, 0.918], p < 0.001. The quartile-based IPDRI burden class was likewise not associated with STAR risk category, χ²(6) = 7.21, p = 0.302, bias-corrected Cramér’s V = 0.061. These results indicate that exposure-weighted multi-hazard burden captures a different local-risk dimension from the supplied STAR intensity category.
4.7. Macroregional Burden Differences and Exploratory Risk-Profile Typologies
IPDRI differed across the three macroregional groupings, Welch F(2, 53.15) = 10.11, p < 0.001. Mean IPDRI was highest in Central Serbia (M = 48.31, SD = 22.09), followed by Vojvodina (M = 37.75, SD = 19.76) and Belgrade (M = 32.00, SD = 12.74). Vojvodina had a lower mean than Central Serbia, Welch t(94.47) = −2.86, p = 0.005, Hedges’ g = −0.49, and Belgrade had a lower burden than all other units combined, Welch t(28.69) = −3.63, p = 0.001, g = −0.61. At the 25-district level, IPDRI heterogeneity was pronounced: classical F(24, 136) = 7.65, p < 0.001, η² = 0.574; Welch F(24, 38.79) = 14.12, p < 0.001; and Kruskal–Wallis H(24) = 93.55, p < 0.001, ε² = 0.511. The highest district-level mean IPDRI values occurred in Mačva (M = 75.49), Pčinja (M = 70.39), and Moravica (M = 65.56), whereas the lowest means occurred in Pirot (M = 13.97), Srem (M = 19.87), and the Danube district (M = 20.98). Table 8 summarizes macroregional descriptive statistics for IPDRI and PRB. Full district rankings and Holm-adjusted pairwise contrasts are provided in the supplementary workbook.
Exploratory K-means analysis of standardized frequency, CHEB, vulnerability, and coping-capacity code favored a three-cluster solution based on the highest silhouette coefficient among k = 2–6 (silhouette = 0.549). Cluster 1 (n = 137) represented the dominant profile and combined partial vulnerability with predominantly moderate/poorer coping capacity; it also had the highest external STAR risk (M = 3.01) and PIP (M = 8.41). Cluster 2 (n = 14) was characterized by lower vulnerability and the lowest external STAR risk (M = 2.57) and PIP (M = 6.36). Cluster 3 (n = 10) combined partial vulnerability with stronger coping capacity (capacity code 2 = high capacity) and lower recurrence, with STAR risk M = 2.60. Although the clustering variables themselves were used to form the groups, external validation showed significant differences in supplied STAR risk, F(2, 158) = 12.72, p < 0.001, η² = 0.139, and PIP, F(2, 158) = 11.19, p < 0.001, η² = 0.124. The cluster solution is exploratory because ordinal STAR scores are treated as approximately interval after standardization. The municipality-level spatial distributions of CHEB and IPDRI, together with the geographic allocation of the three exploratory risk-profile clusters, are shown in Figure 8A–C.
The IPDRI distribution was broad rather than concentrated around a single category, indicating substantial heterogeneity in exposure-weighted portfolio burden even though the official STAR risk category was predominantly moderate (Figure 9). This contrast supports treating categorical risk intensity and cumulative portfolio burden as analytically distinct dimensions, while the corresponding macroregional distribution of IPDRI is shown in Figure 10.
4.8. Extended Risk-Group Profiles and Model Diagnostics
To characterize how component scores change across the three observed STAR risk categories, we compared each raw variable across low, moderate, and high risk groups. Probability displayed the largest separation (ε² = 0.307), followed by frequency (ε² = 0.128), vulnerability (ε² = 0.087), impact (ε² = 0.062), and coping-capacity score (ε² = 0.046). Hazard count, exposure, and data confidence did not differ significantly after Holm correction. These comparisons are descriptive because the STAR risk algorithm embeds probability and impact, while frequency informs probability and vulnerability/coping capacity inform impact (Table 9).
The OLS sensitivity model showed no material multicollinearity or evidence of heteroskedasticity, but residuals were not normally distributed. Influence diagnostics identified a subset of observations with elevated Cook’s distance or leverage, while the model remained stable in the influence sensitivity analysis. These findings support using HC3 robust errors and the primacy of ordinal/nonparametric analyses (Table 10).
4.9. Derived-Variable Correlations and Two-Group Comparisons
The derived-variable analysis clarified which aspects of the new burden measures were shared with, and which were distinct from, the supplied STAR risk category. IPDRI correlated strongly with exposure (r = 0.835, 95% CI [0.781, 0.877], p < 0.001) and moderately with impact (r = 0.389, 95% CI [0.250, 0.513], p < 0.001) and vulnerability (r = 0.232, 95% CI [0.080, 0.373], p = 0.003), but not with the official STAR risk category (r = 0.117, 95% CI [−0.038, 0.267], p = 0.138). CHEB was very strongly associated with exposure (r = 0.940, p < 0.001). PIP was strongly associated with impact (r = 0.754, p < 0.001), probability (r = 0.582, p < 0.001), and the supplied STAR risk category (r = 0.567, p < 0.001). Table 11 reports selected derived-variable correlations, while Figure 11 visualizes the strong positive CHEB–IPDRI association (r = 0.889, 95% CI [0.852, 0.918], p < 0.001).
Welch tests identified several substantively meaningful contrasts. Belgrade had lower IPDRI than all other units (M = 32.00 vs. 45.01), t(28.69) = −3.63, p = 0.001, g = −0.61, and lower CHEB, t(27.35) = −4.73, p < 0.001, g = −0.83. Vojvodina also had lower IPDRI than Central Serbia (M = 37.75 vs. 48.31), t(94.47) = −2.86, p = 0.005, g = −0.49. Units with data-confidence score 3 showed lower structural susceptibility than units with score 2, t(38.15) = −3.28, p = 0.002, g = −0.79. Mann–Whitney sensitivity tests generally supported the principal regional burden contrasts. Table 12 summarizes the complete set of statistically significant pre-specified comparisons, and Figure 12 shows the distribution of the aggregated PIP across the supplied STAR risk categories.
4.10. Parametric and Robust Macroregional and District-Level Comparisons
Macroregional comparisons demonstrated that the strongest differences involved exposure-related burden rather than PIP itself. CHEB, exposure-weighted PIP, PRB, IPDRI, and structural susceptibility differed across macroregions. For IPDRI, classical ANOVA yielded F(2, 158) = 7.04, p = 0.001, η² = 0.082; Welch ANOVA was also significant, F(2, 53.15) = 10.11, p < 0.001, and the Kruskal–Wallis sensitivity test remained significant, H = 11.59, p = 0.003, ε² = 0.061. PIP and hazard dynamics did not differ materially across macroregions. Table 13 reports the complete macroregional omnibus results, and Table 14 reports the significant Holm-adjusted pairwise contrasts. Supplementary Figure S9 and Figure S10 show the municipality-level spatial distributions of structural susceptibility and hazard dynamics, respectively.
District-level heterogeneity was substantially larger than macroregional heterogeneity. CHEB showed the largest district effect (classical η² = 0.644; Kruskal–Wallis ε² = 0.607), followed by exposure-weighted PIP (η² = 0.631; ε² = 0.555), PRB/IPDRI (η² = 0.574; ε² = 0.511), and PIP (η² = 0.413; ε² = 0.290). IPDRI remained highly heterogeneous under Welch ANOVA, F(24, 38.79) = 14.12, p < 0.001. Table 15 and Table 16 summarize the district-level omnibus results for the derived burden measures and the corresponding Holm-significant pairwise contrasts for IPDRI, CHEB, and PIP, respectively.
4.11. Non-Circular Models, Aggregation Concordance, and Complementary Risk Dimensions
To separate exposure burden from STAR’s formative probability–impact algorithm, we regressed PIP only on CHEB, data confidence, and macroregion. The HC3 model was not significant (R² = 0.012, adjusted R² = −0.014, model p = 0.406), and none of the non-constitutive predictors was associated with PIP (Table 17). This result reinforces the analytical separation between probability–impact intensity and exposure-weighted portfolio burden.
In the exploratory non-circular ordered-logit model, higher CHEB was associated with lower odds of occupying a higher supplied STAR risk category (OR = 0.586, 95% CI [0.380, 0.902], p = 0.015). Vojvodina had lower odds than Central Serbia (OR = 0.200, 95% CI [0.073, 0.543], p = 0.002). Data confidence and the Belgrade indicator were not significant. Because only categories 2–4 were observed and we assumed a proportional-odds structure, we interpret this model as exploratory. The full exploratory ordered-logit estimates are reported in Table 18.
Applying the official STAR matrix thresholds to the aggregate PIP cross-product reproduced the supplied risk category in 122 units (75.8%) and disagreed in 39 units. Weighted agreement was moderate (linear κ = 0.458; quadratic κ = 0.484). The discrepancy demonstrates that aggregating probability and impact before applying the risk matrix is not equivalent to aggregating hazard-specific risk results. Table 19 summarizes agreement metrics, and Figure 13 visualizes the cross-classification of the two risk categorizations.
Quartile-based IPDRI burden class was not significantly associated with the supplied STAR risk category, χ²(6) = 7.21, p = 0.302, bias-corrected Cramér’s V = 0.061. This weak cross-classification is consistent with the correlation results and supports interpretation of IPDRI as a complementary portfolio/exposure burden dimension rather than a replacement for STAR risk intensity.
4.12. Exploratory Risk-Profile Clusters and Local Burden Ranking
Among k = 2–6 K-means solutions, k = 3 produced the highest silhouette coefficient (0.549) and was therefore retained as the most coherent exploratory typology. Cluster 1 contained 137 units and combined moderate-to-poor coping capacity with partial vulnerability and the highest mean STAR risk and PIP. Cluster 2 contained 14 units and was characterized by lower vulnerability and the lowest impact/risk profile. Cluster 3 contained 10 units and combined partial vulnerability with stronger coping capacity and lower recurrence. External validation showed cluster differences in STAR risk, F(2, 158) = 12.72, p < 0.001, η² = 0.139; PIP, F(2, 158) = 11.19, p < 0.001, η² = 0.124; impact, F(2, 158) = 19.67, p < 0.001, η² = 0.199; and IPDRI, F(2, 158) = 4.67, p = 0.011, η² = 0.056. Cluster-level mean profiles are summarized in Table 20, while their standardized profiles are visualized in Figure 14.
The burden ranking identified substantial local variation that was not visible from the supplied STAR category alone. Odžaci had the highest sample-relative IPDRI (100.00), followed by Tutin (99.49) and Niš (98.96). Several units with very high IPDRI remained in the moderate STAR risk category, illustrating how broad hazard portfolios and exposure can elevate cumulative burden even when probability–impact intensity remains moderate. The 20 highest-ranked local administrative units are listed in Table 21 and visualized in Figure 15.
5. Discussion
5.1. Principal Findings and Contribution
This nationwide secondary analysis yields four findings with direct methodological and policy significance. First, the Serbian STAR profile is nationally concentrated in the moderate risk category but is characterized by substantial district-level heterogeneity. Second, the observed associations among probability, frequency, impact, vulnerability, coping-capacity score, and risk are consistent with the STAR architecture but cannot be interpreted as independent causal effects because several variables are formative components of the same scoring system. Third, exposure-weighted portfolio burden—captured through CHEB, PRB, and the sample-relative IPDRI—behaves differently from the supplied STAR risk category. Fourth, multiplying aggregate probability by aggregate impact reproduces the supplied risk category only imperfectly, demonstrating an aggregation-order effect that is important for the scientific use of local STAR summaries.
These findings extend recent STAR research in two ways. Existing STAR applications emphasize hazard prioritization, participatory consensus, and the translation of risk profiles into preparedness action (Awoyale et al., 2026; Elhakim et al., 2024; Tomašević et al., 2024). The present study adds a subnational statistical perspective by examining the spatial distribution and internal structure of the resulting local profiles. It also complements Yota et al. (2026), who showed that STAR's correspondence with observed emergencies varies across hazards and contexts, by demonstrating that analytical interpretation is additionally affected by geographic aggregation and by the distinction between risk intensity and cumulative exposure burden.
5.2. National Moderation can Coexist with Pronounced Subnational Heterogeneity
The dominance of the moderate STAR category should not be interpreted as territorial homogeneity or as evidence that local preparedness needs are similar. District membership explained a large share of variation in the supplied risk level and even larger shares for several component and derived measures. Comparable place-based studies show that national averages routinely conceal substantial local variation in vulnerability, exposure, resilience, and capacity (Raduszynski & Numada, 2023; Chelariu et al., 2024; Sibilia et al., 2024; Marzi et al., 2019). The same principle underlies the local administrative-unit emphasis in risk-informed planning frameworks (Galderisi & Limongi, 2021; Zhou & Zhai, 2023).
The GIS results reinforce this interpretation by making municipality-level heterogeneity directly visible. Although the moderate STAR category dominates nationally, the spatial distribution of low and high categories is uneven, while population exposure exhibits substantially greater local differentiation (Figure 4). This spatial contrast illustrates why national or district-level summary statistics alone may not fully describe the territorial configuration of public-health emergency risk.
For Serbia, this pattern is consistent with earlier evidence of uneven preparedness and resilience across municipalities and regions. Local-government capacity research identified variability in strategic, financial, policy, partnership, and communication functions (Cvetković et al., 2021), while the recent BRIC–DROP analysis reported spatial differences in perceived resilience and persistent gaps in warning, financing, evacuation, and rapid decision making (Cvetković et al., 2026a). Qualitative evidence also points to uneven institutional cooperation and strong dependence on central authorities (Cvetković et al., 2026b). The present STAR analysis provides an independent operational assessment that converges on the conclusion that public-health preparedness should be territorially differentiated.
The size of the district effects is also relevant for governance. Disaster-risk management is implemented through multilevel systems in which national standards must be translated into local action. Where local data systems, financing, professional capacity, partnerships, or institutional mandates differ, a standardized assessment tool may still produce strongly heterogeneous profiles (Stoto, 2008; Lee, 2019; Wolf-Fordham, 2020; Dai & Azhar, 2024). The finding therefore supports the Sendai emphasis on disaggregated risk information and risk-informed local planning rather than a single national classification (Mizutori, 2020; Djalante & Lassa, 2019; Cabral-Ramírez et al., 2025).
5.3. Component Associations, Formative Dependence, and the Correct Interpretation of Coping Capacity
Probability showed the strongest association with the supplied risk category, followed by frequency, vulnerability, impact, and coping-capacity score. From a substantive perspective these relationships are expected; from a statistical perspective they require careful qualification. STAR is not a set of independent psychometric predictors. Probability and impact define the hazard-specific risk matrix, frequency contributes to probability assessment, and vulnerability and coping capacity contribute to impact. Strong coefficients for these components therefore partly reflect the instrument's construction. Similar caution is recommended more generally for composite risk and resilience indices, where part-whole correlations can be mistaken for independent explanatory mechanisms (Beccari, 2016; Marzi et al., 2019; Painter et al., 2024).
The reanalysis also resolves an important substantive error in the source interpretation. Under the official Serbian STAR methodological guidance, coping capacity is inverse-coded: 1 denotes very high capacity and 5 very low capacity. A positive association between the numerical coping-capacity score and risk therefore means that poorer capacity accompanies higher risk, not that stronger capacity increases risk. This direction is consistent with resilience theory, which treats available resources, organizational linkages, social capital, information, and adaptive capability as protective assets (Norris et al., 2008; Sherrieb et al., 2010; Pfefferbaum et al., 2015, 2017).
Nevertheless, coping capacity should not be overinterpreted as an independent coefficient in the adjusted models. Its range is restricted, it is already embedded in the impact pathway, and the available dataset contains no usable variation in the separate managerial, health-sector, non-health-sector, and community subcapacity fields. The health-system literature indicates that these subdomains may have different operational roles—governance, financing, workforce, information, service delivery, partnerships, and community functions do not necessarily move together (Khan et al., 2018; Gooding et al., 2022; El-Jardali et al., 2025; Sasie et al., 2026). Future Serbian STAR cycles should therefore retain component-level capacity data for scientific analysis.
5.4. Risk Intensity and Exposure-Weighted Portfolio Burden are Complementary Dimensions
The most important analytical extension is separating probability-impact intensity from cumulative portfolio/exposure burden. The supplied STAR category is fundamentally organized around probability and impact. By contrast, CHEB and IPDRI incorporate the breadth of the local hazard portfolio and the average share of population exposed. The weak IPDRI–STAR association indicates that these dimensions are not interchangeable. A jurisdiction can carry a broad multi-hazard burden with substantial population exposure while remaining in a moderate aggregate probability-impact category.
The GIS-based results make this complementarity spatially explicit. The CHEB and IPDRI maps demonstrate substantial municipality-level variation in exposure-weighted portfolio burden. In contrast, the exploratory cluster map shows that distinct local risk profiles are spatially distributed across the national territory rather than reducible to a single uniform geographic pattern (Figure 8). Spatial visualization therefore provides an additional interpretative layer for identifying where categorical risk intensity and cumulative portfolio burden converge or diverge.
This distinction is consistent with multi-hazard theory. Drakes and Tate (2022) show that aggregate, compound, and cascading multi-hazard perspectives emphasize different dimensions of vulnerability. Pescaroli and Alexander (2018), Gill and Malamud (2016), and van den Hurk et al. (2023) similarly caution that treating hazards independently can overlook risk interactions and cumulative consequences. Global evidence that multi-hazard events drive disproportionate losses and affect populations reinforces the need to consider portfolio and interaction effects (Lee et al., 2024; Jäger et al., 2025).
The derived IPDRI should therefore be understood as an exploratory decision-support construct, not a new official WHO metric or a validated expected-loss index. It lacks hazard-specific population overlap, mortality, morbidity, duration, economic loss, temporal dependence, and interaction terms. Its value is more limited and more defensible: it demonstrates that adding hazard breadth and exposure produces a territorial ranking that contains information absent from the categorical STAR intensity score. This use is consistent with the composite-index literature, in which alternative indices can illuminate different policy dimensions if their construction and limitations are explicit (Orencio & Fujii, 2013; Mavhura et al., 2021; Azzimonti et al., 2020; Bucherie et al., 2022; Marin et al., 2021).
The strong association between CHEB and IPDRI is mathematically expected because CHEB is part of the PRB/IPDRI construction; it is evidence of construct composition, not independent validation. More informative are the weak associations with the supplied STAR category, the distinct regional patterns, and cluster analysis's ability to recover different local profiles. This mirrors evidence that vulnerability and resilience indices may show limited empirical overlap even when both are important for planning (Derakhshan et al., 2022).
5.5. PIP–STAR Discordance Reveals an Aggregation-Order Problem
Applying the official STAR risk-matrix thresholds to aggregate probability × aggregate impact reproduced the supplied risk category in 75.8% of local units, with moderate weighted agreement. This result should not be interpreted as evidence that the STAR algorithm was incorrectly applied. Rather, it reflects a basic property of aggregation: if hazard-specific risk is calculated first and risk, probability, and impact are subsequently summarized by different operations, then the product of the two summary components will not necessarily equal the summary of their hazard-specific products.
This finding has broader implications for reproducibility. Composite-indicator research repeatedly demonstrates that aggregation rules can change rankings and interpretation (Beccari, 2016; Marzi et al., 2019; Sibilia et al., 2024). STAR publications should therefore specify whether municipality-level component values are means, maxima, medians, weighted summaries, or other aggregations; preserve hazard-level records wherever possible; and clearly distinguish hazard-specific risk, portfolio summary risk, and any analytically reconstructed score. Multi-hazard risk modeling and data-scarce national assessments increasingly emphasize similar transparency (Leone et al., 2025; Delves et al., 2026).
The non-circular regression analyses reinforce this interpretation. When constitutive probability, impact, vulnerability, and coping capacity were deliberately excluded, exposure burden and macroregion explained little of aggregate PIP. At the same time, the exploratory ordered model suggested that exposure burden and the supplied categorical risk can move in different directions. The two measures should therefore be treated as distinct outputs serving different planning questions rather than competing estimates of the same latent quantity.
5.6. Implications for Public-Health Preparedness, Local Governance, and Risk Communication
The results support a preparedness model in which risk assessment is linked directly to differentiated action. Local units with high probability-impact intensity may require hazard-specific prevention, surveillance, clinical readiness, and rapid-response planning; units with high portfolio/exposure burden may additionally require broader surge capacity, cross-sector logistics, continuity planning, and prioritization of vulnerable populations. This approach aligns with resilience-based preparedness frameworks that emphasize governance, partnerships, information systems, workforce, equity, and the ability to adapt under pressure (Khan et al., 2018; Khatri et al., 2023; Peterson et al., 2024; Wen et al., 2025).
Regional coordination is equally important. Strong local variation supports shared capacities, regional professional networks, mutual aid, harmonized surveillance, and cross-jurisdictional learning. Evidence from public-health regionalization and emergency-management collaboration suggests that such arrangements can improve planning and resource efficiency when roles, authority, trust, and communication are clear (Stoto, 2008; Wolf-Fordham, 2020; Gooding et al., 2022). At the governance level, fragmented or top-down arrangements can weaken participation and adaptive capacity, particularly in complex or cascading crises (Okunola, 2025a, 2025b; Triyanti et al., 2023; Liu & Renn, 2025).
Data confidence deserves similar policy attention. It displayed one of the strongest territorial patterns in the Serbian dataset. Variation in confidence may reflect differences in surveillance, documentation, access to local evidence, institutional information exchange, or the maturity of assessment teams. Dynamic preparedness approaches emphasize revisiting risk profiles as data and conditions change (Kandel & Chungong, 2022). Yota et al. (2026) likewise argue for integration of real-time surveillance, climate information, seasonality, and finer geographic resolution to strengthen STAR use.
Risk communication and community engagement should be treated as core preparedness capacities rather than peripheral dissemination functions. Systematic reviews consistently support locally grounded engagement, two-way communication, trusted messengers, community feedback, and inclusion (Ryan et al., 2020; Vandrevala et al., 2024; Hinata et al., 2024; Jha et al., 2018). Early-warning research shows that technology without sustained community engagement leaves important gaps in response capability (Sufri et al., 2020). Health-emergency evidence similarly stresses that communities should be involved before crises, not only informed during them (Toppenberg-Pejcic et al., 2019; Novak et al., 2019; Khan et al., 2022; Tambo et al., 2021).
Trust provides a cross-cutting mechanism. Bonfanti et al. (2024) identify trust as central across prevention, preparedness, response, and recovery, while Nicholas et al. (2026) demonstrate that its effects vary by context and by the institution or actor in whom trust is placed. For Serbia, findings near the Duboko landfill show that transparency and access to information are linked to perceived trust and resilience (Nikolić et al., 2025). Standardized risk assessment should therefore be accompanied by transparent communication about evidence quality, uncertainty, scoring logic, and the reasons behind preparedness priorities.
These policy implications are consistent with the IJDRM evidence base. Local governance and community participation repeatedly emerge as prerequisites for translating formal frameworks into preparedness practice (Goyal, 2019; Mohamed Kalakaan, 2025; Salam et al., 2025; Unaam, 2026), while communication research highlights the operational value of clear, timely, multi-channel warning and sustained community engagement (Sukhwani et al., 2019; Sacyaten, 2025; Yamah & Folorunsho, 2026). For Serbia and the Western Balkans, research on first-responder interoperability, locally adapted resilience indicators, inclusive vulnerability reduction, and critical-infrastructure resilience reinforces these implications (Cvetković, 2025; Milenković et al., 2026; Jevtić et al., 2025; Vidović et al., 2024).
5.7. Relevance for Serbia and Southeast Europe
The Serbian results should be interpreted within a broader regional transition from emergency response toward risk-informed prevention and resilience. Previous Serbian research has repeatedly identified the need to strengthen local capacities, planning, public participation, and communication (Cvetković et al., 2021; Cvetković et al., 2018, 2019; Cvetković, 2023). The recent BRIC–DROP and qualitative resilience studies further show that community resilience cannot be reduced to a single institutional or social indicator and that weaknesses in warning, financing, evacuation readiness, and local coordination remain salient (Cvetković et al., 2026a, 2026b).
These findings are not unique to Serbia. Comparative evidence from Bulgaria, Romania, and Albania identifies similar tensions between formal frameworks and operational local capacity (Beli et al., 2025). Romanian spatial risk research also demonstrates pronounced local variation when multi-hazard exposure is combined with social vulnerability (Chelariu et al., 2024). This regional context increases the transferability of the present study: a standardized all-hazards tool can provide a common assessment language, but scientific and policy interpretation still requires attention to local exposure, capacity, evidence quality, and aggregation.
Three policy implications follow. First, Serbia should maintain repeated STAR cycles and link them to interoperable local and national surveillance rather than treat the 2024 profiles as static classifications. Second, preserve hazard-level data and subdomain capacity scores in an analysis-ready format so changes in risk and preparedness can be evaluated longitudinally. Third, resource prioritization should use a dashboard of complementary indicators—risk intensity, exposure-weighted portfolio burden, vulnerability, coping capacity, and data confidence—rather than a single ranking. Such an approach is more consistent with contemporary systemic-risk and resilience governance (Tiernan et al., 2019; Tiggeloven et al., 2026; Dai & Azhar, 2024).
5.8. Limitations and Research Agenda
Several limitations constrain interpretation. The design is cross-sectional and ecological; associations among local-level scores cannot establish causal effects or individual-level relationships. STAR relies on structured expert assessment and available evidence, so comparability depends on local information quality, facilitation, and consensus processes. Several variables have restricted ranges, reducing discrimination and statistical power. The available spreadsheet contains municipality-level summaries rather than hazard-level records, preventing exact reconstruction of the original hazard-specific scoring and limiting analysis of within-unit hazard diversity.
The derived PIP, CHEB, PRB, and IPDRI measures are exploratory. They are not WHO-validated metrics, actuarial risk estimates, expected-loss functions, or substitutes for hazard-specific STAR assessment. CHEB does not de-duplicate individuals who may be exposed to more than one hazard, and IPDRI is a sample-relative rescaling whose values should not be compared directly across countries or assessment cycles without recalibration. K-means typologies also treat standardized ordinal inputs as approximately interval and are therefore descriptive.
Future research should retain the hazard as the primary analytical unit and use longitudinal assessment cycles to evaluate temporal change. Validation against observed outbreaks, emergency activations, morbidity, mortality, service disruption, or disaster losses would allow stronger assessment of predictive or criterion validity. Dynamic or Bayesian multi-hazard approaches could incorporate interactions, changing vulnerability, and infrastructure dependencies (Bakhtiari et al., 2025; de Ruiter & van Loon, 2022; Schlumberger et al., 2022). A mixed-method design could additionally explain why units with similar categorical risk have different capacity or portfolio-burden profiles, thereby combining the strengths of quantitative standardization with context-sensitive local knowledge (Cvetković et al., 2026b; Räsänen et al., 2020).
Finally, future STAR research should evaluate the consequences of aggregation itself. Comparing hazard-level, municipality-level, district-level, and national summaries would clarify when information is lost or rankings change. Sensitivity analysis of alternative aggregation rules, uncertainty propagation, and repeated assessment under updated data would bring STAR-based research into closer alignment with current best practice in composite-indicator and multi-hazard science (Beccari, 2016; Marzi et al., 2019; Laurien et al., 2022; Tiggeloven et al., 2026).
6. Conclusions
The nationwide analysis of 161 local assessments revealed a predominantly moderate public health emergency risk profile in Serbia, accompanied by substantial territorial heterogeneity. Municipalities and districts differed meaningfully in the combination of hazard probability, frequency, potential impact, vulnerability, coping capacity, and population exposure, indicating that similar overall risk classifications may conceal markedly different local risk structures. GIS-based thematic mapping further demonstrated that this heterogeneity is spatially uneven and cannot be inferred from national summary classifications alone.
Among the examined dimensions, probability and frequency showed the strongest alignment with the assigned risk categories, while vulnerability, impact, and coping capacity contributed additional differentiation between local areas. Importantly, the reconstructed probability × impact measure did not fully reproduce the assigned risk categories. This finding demonstrates that aggregated municipality-level indicators do not preserve all of the information contained in more disaggregated risk assessments and should therefore be interpreted as complementary rather than equivalent measures.
A particularly important result was the identification of a distinct exposure-weighted multi-hazard burden. This measure showed pronounced geographic variation but was not significantly associated with the assigned categorical risk level, indicating that risk severity and cumulative population exposure represent different dimensions of local emergency risk. Consequently, municipalities with comparable categorical risk levels may face substantially different preparedness demands because of differences in the number of relevant hazards, population exposure, vulnerability, and available coping capacity.
The exploratory clustering analysis further demonstrated that local areas can be differentiated into recurring risk profiles rather than positioned along a single low-to-high risk continuum. This finding has direct implications for preparedness planning: municipalities characterized by high exposure, elevated vulnerability, recurrent hazards, or limited coping capacity require different combinations of interventions, even when their overall risk classifications appear similar.
Taken together, the results support a multidimensional approach to public health emergency planning in Serbia. Decision-making should not rely on a single aggregate risk category, but should jointly consider risk intensity, hazard frequency, vulnerability, coping capacity, and exposure-weighted multi-hazard burden. Such differentiation provides a stronger empirical basis for prioritizing preparedness investments, strengthening local response capacities, improving surveillance and risk communication, and directing resources toward municipalities where multiple adverse conditions converge. Future assessments should preserve hazard-level information and enable longitudinal monitoring so that changes in local risk profiles can be identified before they translate into greater public health consequences.
Supplementary Materials
The following supporting information can be downloaded at the website of this paper posted on Preprints.org.
Author Contributions
Conceptualization, V.M.C. and D.I.; methodology, V.M.C., D.I. and T.L.; validation, V.M.C., D.I., V.L., J.B. and V.D.C.; formal analysis, V.M.C. and V.D.C.; investigation, D.I. and J.B.; resources, D.I.; data curation, D.I. and V.M.C.; writing—original draft preparation, V.M.C.; writing—review and editing, V.M.C., D.I., V.L., L.S., J.B., T.L. and V.D.C.; visualization, V.M.C., L.S. and V.D.C.; supervision, V.M.C.; project administration, V.M.C. and D.I. All authors have read and agreed to the published version of the manuscript.
Funding
This research was funded by the Scientific-Professional Society for Disaster Risk Management, Belgrade, Serbia (https://spsdrm.org/, accessed on 1 September 2026); the International Institute for Disaster Research, Belgrade, Serbia (https://idr.edu.rs/, accessed on 1 September 2026); and ProSafeNet—The Global Hub for Safety, Security, Risk & Emergency Professionals & Scientists (https://prosafenet.com/, accessed on 1 September 2026).
Data Availability Statement
All aggregate data and statistical results supporting the findings of this study are reported in the article and its appendices.
Acknowledgments
The authors acknowledge the use of Grammarly Premium v1.2.291.1949 and ChatGPT 5.6 in the process of translating and improving the clarity and quality of the English language in this manuscript. The AI tools were used to assist in language enhancement but were not involved in the development of the scientific content. The authors take full responsibility for the originality, validity, and integrity of the manuscript.
References
- Adger, W.N. Vulnerability. Glob. Environ. Change 2006, 16(3), 268–281. [Google Scholar] [CrossRef]
- Agyepong, L.A.; Liang, X. Mapping the knowledge frontiers of public risk communication in disaster risk management. J. Risk Res. 2023, 26(3), 302–323. [Google Scholar] [CrossRef]
- Awoyale, O.; Jimoh, A.; Dede, A.; Akpen, C.; Ogunniyi, A.; Dogo, D.P.; Okagbue, H. Strengthening disaster preparedness and health security in Niger State, Nigeria through a WHO STAR-based multi-hazard risk assessment. Sci. Rep. 2026, 16, 4607. [Google Scholar] [CrossRef] [PubMed]
- Azzimonti, O.; Colleoni, M.; De Amicis, M.; Frigerio, I. Combining hazard, social vulnerability and resilience to provide a proposal for seismic risk assessment. J. Risk Res. 2020, 23(9), 1225–1241. [Google Scholar] [CrossRef]
- Bakhtiari, S.; Najafi, M.R.; Goda, K.; Peerhossaini, H. A dynamic Bayesian network approach to characterize multi-hazard risks and resilience in interconnected critical infrastructures. Reliab. Eng. Syst. Saf. 2025, 257, 110815. [Google Scholar] [CrossRef]
- Beccari, B. A comparative analysis of disaster risk, vulnerability and resilience composite indicators. PLoS Curr. 2016, 8. [Google Scholar] [CrossRef] [PubMed]
- Beli, A.; Renner, R.; Cvetković, V.M.; Ivanov, A.; Gačić, J. A cross-national study of disaster risk management: Strengths and weaknesses in Bulgaria, Romania, and Albania with reflections on Serbia. Int. J. Disaster Risk Manag. 2025, 7(1), 431–460. [Google Scholar] [CrossRef]
- Bonfanti, R.C.; Oberti, B.; Ravazzoli, E.; Rinaldi, A.; Ruggieri, S.; Schimmenti, A. The role of trust in disaster risk reduction: A critical review. Int. J. Environ. Res. Public Health 2024, 21(1), 29. [Google Scholar] [CrossRef] [PubMed]
- Bucherie, A.; Hultquist, C.; Adamo, S.B.; Neely, C.; Ayala, F.; Bazo, J.; Kruczkiewicz, A. A comparison of social vulnerability indices specific to flooding in Ecuador: Principal component analysis and expert knowledge. Int. J. Disaster Risk Reduct. 2022, 73, 102897. [Google Scholar] [CrossRef]
- Cabral-Ramírez, M.; Niño-Barrero, Y.; DiBella, J. Lessons from the implementation of the Sendai Framework for Disaster Risk Reduction from Latin America and the Caribbean. Int. J. Disaster Risk Sci. 2025, 16, 72–83. [Google Scholar] [CrossRef]
- Canete, R.; Biñas, R. Differential risk and the elements of resilience: A framework for advancing disaster risk reduction. Int. J. Disaster Risk Manag. 2025, 7(2), 209–238. [Google Scholar] [CrossRef]
- Chelariu, O.E.; Minea, I.; Iatu, C. Integrated assessment of geophysical and social vulnerability to natural hazards in North-East Region, Romania. Geomat. Nat. Hazards Risk 2024, 15(1), 2384607. [Google Scholar] [CrossRef]
- Cutter, S.L.; Boruff, B.J.; Shirley, W.L. Social vulnerability to environmental hazards. Soc. Sci. Q. 2003, 84(2), 242–261. [Google Scholar] [CrossRef]
- Cvetković, V.M. A predictive model of community disaster resilience based on social identity influences (MODERSI). Int. J. Disaster Risk Manag. 2023, 5(2), 57–80. [Google Scholar] [CrossRef]
- Cvetković, V.M. First responders in the Western Balkans: Strengthening capacities and preparedness for a resilient future. Int. J. Disaster Risk Manag. 2025, 7(2), 361–384. [Google Scholar] [CrossRef]
- Cvetković, V.M.; Milenković, D.; Bašić, J.; Lukić, T.; Renner, R. Predictive model of community disaster resilience across Serbia: A BRIC–DROP composite index and spatial patterns. Safety 2026a, 12(3), 59. [Google Scholar] [CrossRef]
- Cvetković, V.M.; Milenković, D.; Lukić, T.; Renner, R. Theoretical evolution of measuring community resilience to natural and technological disasters: Past, present, and future—Empirical insights from qualitative research in Serbia. Open Geosci. 2026b, 18(1), 20250968. [Google Scholar] [CrossRef]
- Cvetković, V.M.; Renner, R.; Jakovljević, V. Industrial disasters and hazards: From causes to consequences—A holistic approach to resilience. Int. J. Disaster Risk Manag. 2024, 6(2), 149–168. [Google Scholar] [CrossRef]
- Cvetković, V.; Roder, G.; Öcal, A.; Tarolli, P.; Dragićević, S. The role of gender in preparedness and response behaviors towards flood risk in Serbia. Int. J. Environ. Res. Public Health 2018, 15(12), 2761. [Google Scholar] [CrossRef] [PubMed]
- Cvetković, V.; Ronan, K.; Shaw, R.; Filipović, M.; Mano, R.; Gačić, J.; Jakovljević, V. Household earthquake preparedness in Serbia: A study of selected municipalities. Acta Geogr. Slov. 2019, 59(2), 27–42. [Google Scholar] [CrossRef]
- Cvetković, V.; Tanasić, J.; Ocal, A.; Kešetović, Ž.; Nikolić, N.; Dragašević, A. Capacity development of local self-governments for disaster risk management. Int. J. Environ. Res. Public Health 2021, 18(19), 10406. [Google Scholar] [CrossRef] [PubMed]
- Dai, J.; Azhar, A. Collaborative governance in disaster management and sustainable development. Public Adm. Dev. 2024, 44(4), 358–380. [Google Scholar] [CrossRef]
- Dalangin, F.I.J. Assessing good governance practices in disaster risk reduction and management (DRRM) among education institutions: A systematic literature review. Int. J. Disaster Risk Manag. 2025, 7(2), 21–32. [Google Scholar] [CrossRef]
- de Ruiter, M.D.; van Loon, A.V. The challenges of dynamic vulnerability and how to assess it. iScience 2022, 25(8), 104720. [Google Scholar] [CrossRef] [PubMed]
- Delves, J.L.; Renner, K.; Campalani, P.; Piñon, J.; Schneiderbauer, S.; Moreno, M.; Pittore, M. Comprehensive multi-hazard risk assessment in data-scarce regions: A study focused on Burundi. Nat. Hazards Earth Syst. Sci. 2026, 26, 1347–1373. [Google Scholar] [CrossRef]
- Derakhshan, S.; Emrich, C.; Cutter, S. Degree and direction of overlap between social vulnerability and community resilience measurements. PLoS ONE 2022, 17(10), e0275975. [Google Scholar] [CrossRef] [PubMed]
- Djalante, R.; Lassa, S. Governing complexities and its implication on the Sendai Framework for Disaster Risk Reduction Priority 2 on governance. Prog. Disaster Sci. 2019, 2, 100010. [Google Scholar] [CrossRef]
- Djebari, S.; Bestandji, S. The role of spatial analysis in notifiable disease monitoring and health risk management: A case study of Constantine. Int. J. Disaster Risk Manag. 2025, 7(1), 215–233. [Google Scholar] [CrossRef]
- Drakes, O.; Tate, E. Social vulnerability in a multi-hazard context: A systematic review. Environ. Res. Lett. 2022, 17(3), 033001. [Google Scholar] [CrossRef]
- Elhakim, M.; Hammoud, S.; Gmach, S.; Albadri, J.; Mahrous, H.; Arifi, F.; Samhouri, D. Learning interventions in the WHO Eastern Mediterranean region: Supporting Member States to get prepared for better response to health emergencies in the region. Front. Public Health 2024, 12, 1441223. [Google Scholar] [CrossRef] [PubMed]
- El-Jardali, F.; Kanth, P.; Nguyen, S.; Varkey, S.; Duran, D.; Menon, R.; Reid, M. Emergency preparedness and health system resilience assessment tool: Development and initial validation. BMJ Glob. Health 2025, 10(8), e016459. [Google Scholar] [CrossRef] [PubMed]
- Fathollahzadeh, A.; Salmani, I.; Morowatisharifabad, M.; Khajehaminian, M.; Babaie, J.; Fallahzadeh, H. Models and components in disaster risk communication: A systematic literature review. J. Educ. Health Promot. 2023, 12, 87. [Google Scholar] [CrossRef] [PubMed]
- Flanagan, B.E.; Gregory, E.W.; Hallisey, E.J.; Heitgerd, J.L.; Lewis, B. A social vulnerability index for disaster management. J. Homel. Secur. Emerg. Manag. 2011, 8(1), 3. [Google Scholar] [CrossRef]
- Galderisi, A.; Limongi, G. A comprehensive assessment of exposure and vulnerabilities in multi-hazard urban environments: A key tool for risk-informed planning strategies. Sustainability 2021, 13(16), 9055. [Google Scholar] [CrossRef]
- Gill, J.; Malamud, B. Hazard interactions and interaction networks (cascades) within multi-hazard methodologies. Earth Syst. Dyn. 2016, 7, 659–679. [Google Scholar] [CrossRef]
- Goode, E.; Thomas, E.; Landeg, O.; Duarte-Davidson, R.; Hall, L.; Roelofs, J.; Nyberg, A.G. Development of a rapid risk and impact assessment tool to enhance response to environmental emergencies in the early stages of a disaster. Int. J. Disaster Risk Sci. 2021, 12, 528–539. [Google Scholar] [CrossRef]
- Gooding, K.; Bertone, M.; Loffreda, G.; Witter, S. How can we strengthen partnership and coordination for health system emergency preparedness and response? Findings from a synthesis of experience across countries facing shocks. BMC Health Serv. Res. 2022, 22, 1441. [Google Scholar] [CrossRef] [PubMed]
- Goyal, N. Disaster governance and community resilience: The law and the role of SDMAs. Int. J. Disaster Risk Manag. 2019, 1(2), 61–75. [Google Scholar] [CrossRef]
- Hinata, S.; Rohde, H.; Templeton, A. Communicating with the public in emergencies: A systematic review of communication approaches in emergency response. Int. J. Disaster Risk Reduct. 2024, 111, 104719. [Google Scholar] [CrossRef]
- Hunter, J.; Yang, J.E.; Petrie, M.C.; Aragón, T. Integrating a framework for conducting public health systems research into statewide operations-based exercises to improve emergency preparedness. BMC Public Health 2012, 12, 680. [Google Scholar] [CrossRef] [PubMed]
- Ivanov, A. Disaster risk reduction and disaster risk management: State of play in North Macedonia. Int. J. Disaster Risk Manag. 2024, 6(2), 201–212. [Google Scholar] [CrossRef]
- Jäger, W.S.; de Ruiter, M.D.; Tiggeloven, T.; Ward, P.J. What can we learn about multi-hazard impacts from global disaster records? Nat. Hazards Earth Syst. Sci. 2025, 25, 2751–2769. [Google Scholar] [CrossRef]
- Jevtić, M.; Cvetković, V.M.; Gačić, J.; Raonić, Z. Factors of vulnerability and resilience of persons with disabilities during disasters: Challenges and strategies for inclusive risk reduction. Int. J. Disaster Risk Manag. 2025, 7(1), 91–114. [Google Scholar] [CrossRef]
- Jha, A.; Lin, L.; Short, S.M.; Argentini, G.; Gamhewage, G.; Savoia, E. Integrating emergency risk communication into the public health system response: Systematic review of literature to aid formulation of the 2017 WHO guideline for ERC policy and practice. PLoS ONE 2018, 13(10), e0205555. [Google Scholar] [CrossRef] [PubMed]
- Kandel, N.; Chungong, S. Dynamic preparedness metric: A paradigm shift to measure and act on preparedness. Lancet Glob. Health 2022, 10(5), e615–e616. [Google Scholar] [CrossRef] [PubMed]
- Karmaker, R.; Cvetković, V.M. Policy, risk and innovation: A mixed-methods framework for using AI to foster inclusion in marginalized communities in Bangladesh. Int. J. Disaster Risk Manag. 2026, 8(1), 385–408. [Google Scholar] [CrossRef]
- Keim, M. Building human resilience: The role of public health preparedness and response as an adaptation to climate change. Am. J. Prev. Med. 2008, 35(5), 508–516. [Google Scholar] [CrossRef] [PubMed]
- Keim, M. Defining disaster-related health risk: A primer for prevention. Prehospital Disaster Med. 2018, 33(3), 308–316. [Google Scholar] [CrossRef] [PubMed]
- Khan, S.; Mishra, J.; Ahmed, N.; Onyige, C.D.; Lin, K.E.; Siew, R.; Lim, B.H. Risk communication and community engagement during COVID-19. Int. J. Disaster Risk Reduct. 2022, 74, 102903. [Google Scholar] [CrossRef] [PubMed]
- Khan, Y.; Brown, A.D.; Gagliardi, A.; O’Sullivan, T.; Lacarte, S.; Henry, B.; Schwartz, B. Are we prepared? The development of performance indicators for public health emergency preparedness using a modified Delphi approach. PLoS ONE 2019, 14(12), e0226489. [Google Scholar] [CrossRef] [PubMed]
- Khan, Y.; O’Sullivan, T.; Brown, A.; Tracey, S.; Gibson, J.; Généreux, M.; Schwartz, B. Public health emergency preparedness: A framework to promote resilience. BMC Public Health 2018, 18, 1344. [Google Scholar] [CrossRef] [PubMed]
- Khatri, R.; Endalamaw, A.; Erku, D.; Wolka, E.; Nigatu, F.; Zewdie, A.; Assefa, Y. Preparedness, impacts, and responses of public health emergencies towards health security: Qualitative synthesis of evidence. Arch. Public Health 2023, 81, 208. [Google Scholar] [CrossRef] [PubMed]
- Koech, H. Recurrent urban flooding in Nairobi City: A systematic review of environmental determinants, public health impacts and policy gaps. Int. J. Disaster Risk Manag. 2026, 8(1), 331–366. [Google Scholar] [CrossRef]
- Kruk, M.E.; Myers, M.; Varpilah, S.T.; Dahn, B.T. What is a resilient health system? Lessons from Ebola. The Lancet 2015, 385(9980), 1910–1912. [Google Scholar] [CrossRef] [PubMed]
- Laurien, F.; Martin, J.G.C.; Mehryar, S. Climate and disaster resilience measurement: Persistent gaps in multiple hazards, methods, and practicability. Clim. Risk Manag. 2022, 37, 100443. [Google Scholar] [CrossRef]
- Lee, D. Local government’s disaster management capacity and disaster resilience. Local Gov. Stud. 2019, 45(6), 803–826. [Google Scholar] [CrossRef]
- Lee, R.; White, C.J.; Adnan, M.S.G.; Douglas, J.; Mahecha, M.; O’Loughlin, F.; Zscheischler, J. Reclassifying historical disasters: From single to multi-hazards. Sci. Total Environ. 2024, 912, 169120. [Google Scholar] [CrossRef] [PubMed]
- Leone, M.; Zuccaro, G.; De Gregorio, D.; Turchi, A.; Tedeschi, A.; Büegelmayer-Blaschek, M.; Russo, B. A holistic asset-level modelling framework for a comprehensive multi-hazard risk/impact assessment: Insights from the ICARIA project. Int. J. Disaster Risk Reduct. 2025, 119, 105319. [Google Scholar] [CrossRef]
- Liu, H.; Renn, O. Polycrisis and systemic risk: Assessment, governance, and communication. Int. J. Disaster Risk Sci. 2025, 16, 526–549. [Google Scholar] [CrossRef]
- Mah, J.C.; Penwarden, J.L.; Pott, H.; Theou, O.; Andrew, M.K. Social vulnerability indices: A scoping review. BMC Public Health 2023, 23, 1253. [Google Scholar] [CrossRef] [PubMed]
- Marin, G.; Modica, M.; Paleari, S.; Zoboli, R. Assessing disaster risk by integrating natural and socio-economic dimensions: A decision-support tool. Socio-Econ. Plan. Sci. 2021, 77, 101032. [Google Scholar] [CrossRef]
- Marzi, S.; Mysiak, J.; Essenfelder, A.; Amadio, M.; Giove, S.; Fekete, A. Constructing a comprehensive disaster resilience index: The case of Italy. PLoS ONE 2019, 14(9), e0221585. [Google Scholar] [CrossRef] [PubMed]
- Mavhura, E.; Manyangadze, T.; Aryal, K. A composite inherent resilience index for Zimbabwe: An adaptation of the Disaster Resilience of Place model. Int. J. Disaster Risk Reduct. 2021, 57, 102152. [Google Scholar] [CrossRef]
- Milenković, D.; Cvetković, V.M. Rethinking disaster resilience: Conceptual framework, core dimensions, and key actors. Int. J. Disaster Risk Manag. 2025, 7(2), 455–468. [Google Scholar] [CrossRef]
- Milenković, D.; Cvetković, V.M.; Beriša, H.; Jakovljević, V.; Gačić, J.; Cvetković, V.D. Beyond the original BRIC model: Gaps, limitations, and adaptation of community resilience indicators for local contexts. Int. J. Disaster Risk Manag. 2026, 8(1), 55–76. [Google Scholar] [CrossRef]
- Mizutori, M. Reflections on the Sendai Framework for Disaster Risk Reduction: Five years since its adoption. Int. J. Disaster Risk Sci. 2020, 11, 147–151. [Google Scholar] [CrossRef]
- Mohamed Kalakaan, M.M. Evaluating Puntland’s disaster risk management policy: Institutional preparedness, community engagement and implementation challenges. Int. J. Disaster Risk Manag. 2025, 7(1), 507–518. [Google Scholar] [CrossRef]
- Mokhele, M.O. Centres or units: Making sense of decentralisation of disaster management in South African municipalities. Int. J. Disaster Risk Manag. 2024, 6(2), 19–38. [Google Scholar] [CrossRef]
- Nekoei-Moghadam, M.; Moradi, S.M.; Tavan, A. How can the Sendai Framework be implemented for disaster risk reduction and sustainable development? A qualitative study in Iran. Glob. Health 2024, 20, 23. [Google Scholar] [CrossRef] [PubMed]
- Nelson, C.D.; Lurie, N.; Wasserman, J.; Zakowski, S. Conceptualizing and defining public health emergency preparedness. Am. J. Public Health 2007, 97 (Suppl. 1), S9–S11. [Google Scholar] [CrossRef] [PubMed]
- Nicholas, J.P.; Donovan, A.; Oppenheimer, C.; Bell, L.; Van Wyk de Vries, M. How trust shapes individual resilience to natural hazards: A systematic review. Nat. Hazards 2026, 122, 48. [Google Scholar] [CrossRef] [PubMed]
- Nikolić, N.; Cvetković, V.M.; Renner, R.; Cvijović, N.; Gačić, J. Disaster risk perception and local resilience near the “Duboko” landfill: Challenges of governance, management, trust, and environmental communication in Serbia. Open Geosci. 2025, 17(1), 20250850. [Google Scholar] [CrossRef]
- Norris, F.H.; Stevens, S.P.; Pfefferbaum, B.; Wyche, K.F.; Pfefferbaum, R.L. Community resilience as a metaphor, theory, set of capacities, and strategy for disaster readiness. Am. J. Community Psychol. 2008, 41(1–2), 127–150. [Google Scholar] [CrossRef] [PubMed]
- Novak, J.M.; Day, A.M.; Sopory, P.; Wilkins, L.; Padgett, D.; Eckert, S.; Gamhewage, G. Engaging communities in emergency risk and crisis communication: A systematic review and evidence synthesis. J. Int. Crisis Risk Commun. Res. 2019, 2(1), 61–96. [Google Scholar]
- Okunola, O.H. Beyond institutional silos: Rethinking multilevel disaster risk governance in Africa a decade into the Sendai Framework implementation. Int. J. Disaster Risk Sci. 2025a, 16, 321–332. [Google Scholar] [CrossRef]
- Okunola, O.H. Exploring multi-level governance arrangements in disaster recovery: A study of Lagos, Nigeria. Int. J. Disaster Risk Reduct. 2025b, 118, 105254. [Google Scholar] [CrossRef]
- Orencio, P.M.; Fujii, M. A localized disaster-resilience index to assess coastal communities based on an analytic hierarchy process (AHP). Int. J. Disaster Risk Reduct. 2013, 3, 62–75. [Google Scholar] [CrossRef]
- Painter, M.A.; Shah, S.H.; Damestoit, G.C.; Khalid, F.; Prudencio, W.; Chisty, M.A.; Wilhelmi, O.V. A systematic scoping review of the Social Vulnerability Index as applied to natural hazards. Nat. Hazards 2024, 120(8), 7265–7356. [Google Scholar] [CrossRef]
- Pescaroli, G.; Alexander, D. Understanding compound, interconnected, interacting, and cascading risks: A holistic framework. Risk Anal. 2018, 38(11), 2245–2257. [Google Scholar] [CrossRef] [PubMed]
- Peterson, L.N.; Baggett, J.; Evans, A.; Sullivan, K. Evidence-based strategies to enhance public health emergency preparedness and response. J. Public Health Manag. Pract. 2024, 30(2), 311–313. [Google Scholar] [CrossRef] [PubMed]
- Pfefferbaum, B.; Pfefferbaum, R.L.; Van Horn, R.L. Community resilience interventions: Participatory, assessment-based, action-oriented processes. Am. Behav. Sci. 2015, 59(2), 238–253. [Google Scholar] [CrossRef]
- Pfefferbaum, B.; Van Horn, R.L.; Pfefferbaum, R.L. A conceptual framework to enhance community resilience using social capital. Clin. Soc. Work J. 2017, 45(2), 102–110. [Google Scholar] [CrossRef]
- Plough, A.; Fielding, J.; Chandra, A.; Williams, M.V.; Eisenman, D.; Wells, K.; Magaña, A. Building community disaster resilience: Perspectives from a large urban county department of public health. Am. J. Public Health 2013, 103(7), 1190–1197. [Google Scholar] [CrossRef] [PubMed]
- Pradhan, B.; Kumar, S.; Nayak, D. From vulnerability to resilience: A systematic review of Odisha’s integrated approach to disaster risk reduction. Int. J. Disaster Risk Manag. 2025, 7(1), 519–532. [Google Scholar] [CrossRef]
- Raduszynski, T.; Numada, M. Measure and spatial identification of social vulnerability, exposure and risk to natural hazards in Japan using open data. Sci. Rep. 2023, 13, 664. [Google Scholar] [CrossRef] [PubMed]
- Räsänen, A.; Lein, H.; Bird, D.; Setten, G. Conceptualizing community in disaster risk management. Int. J. Disaster Risk Reduct. 2020, 45, 101485. [Google Scholar] [CrossRef]
- Rico, G.C.S. School-community collaboration: Disaster preparedness towards building resilient communities. Int. J. Disaster Risk Manag. 2019, 1(2), 45–61. [Google Scholar] [CrossRef]
- Ryan, B.; Johnston, K.A.; Taylor, M.; McAndrew, R. Community engagement for disaster preparedness: A systematic literature review. Int. J. Disaster Risk Reduct. 2020, 49, 101655. [Google Scholar] [CrossRef]
- Sabljić, L.; Bajić, D.; Marković, S.B.; Adžić, D.; Spalevic, V.; Sestraș, P.; Pavić, D.; Lukić, T. Remote sensing and GIS assessment of drought dynamics in the Ukrina River Basin, Bosnia and Herzegovina. Atmosphere 2026, 17(2), 124. [Google Scholar] [CrossRef]
- Sabljić, L.; Lukić, T.; Bajić, D.; Marković, S.B.; Spalevic, V.; Cvetković, V.; Delić, D.; Adžić, D.; Aleksova, B.; Milevski, I.; Petković Srzentić, G. Spatio-temporal analysis of flood events using GIS and remote sensing-based approach in the Ukrina River Basin, Bosnia and Herzegovina. Open Geosci. 2025, 17(1), 20250856. [Google Scholar] [CrossRef]
- Sacyaten, C.S. Crisis communication in times of disasters: Public perceptions on the timeliness and clarity of safety announcements: A systematic literature review. Int. J. Disaster Risk Manag. 2025, 7(2), 193–208. [Google Scholar] [CrossRef]
- Salam, M.F.; Hemel, B.U.; Roni, A.H.; Pandith, J.C.; Maaeesha, N. Grassroots disaster governance in Bangladesh: The roles of Union Parishads and Disaster Management Committees. Int. J. Disaster Risk Manag. 2025, 7(2), 395–404. [Google Scholar] [CrossRef]
- Sasie, S.D.; Aragaw, F.M.; Gebeyehu, T.A.; Shikur, S.A.; Fekadu, L.; Ali, N.Z.; Argaw, Z.M. Building systems for preparedness: Global scoping studies on institutional governance and National Public Health Agencies. PLoS Glob. Public Health 2026, 6(2), e0005427. [Google Scholar] [CrossRef] [PubMed]
- Sasie, S.D.; Ayano, G.; Van Zuylen, P.; Aragaw, F.M.; Darebo, T.D.; Guerrero-Torres, L.; Spigt, M. Developing a comprehensive framework for evaluating public health emergency management program implementation: A scoping review. Public Health 2025, 239, 22–31. [Google Scholar] [CrossRef] [PubMed]
- Savoia, E.; Testa, M.A.; Biddinger, P.D.; Cadigan, R.O.; Koh, H.; Campbell, P.; Stoto, M.A. Assessing public health capabilities during emergency preparedness tabletop exercises: Reliability and validity of a measurement tool. Public Health Rep. 2009, 124(1), 138–148. [Google Scholar] [CrossRef] [PubMed]
- Schlumberger, J.; Haasnoot, M.; Aerts, J.; de Ruiter, M.D. Proposing DAPP-MR as a disaster risk management pathways framework for complex, dynamic multi-risk. iScience 2022, 25(10), 105219. [Google Scholar] [CrossRef] [PubMed]
- Sherrieb, K.; Norris, F.H.; Galea, S. Measuring capacities for community resilience. Soc. Indic. Res. 2010, 99(2), 227–247. [Google Scholar] [CrossRef]
- Sibilia, A.; Eklund, G.; Marzi, S.; Valli, I.; Bountzouklis, C.; Roeslin, S.; Corbane, C. Developing a multi-level European-wide composite indicator to assess vulnerability dynamics across time and space. Int. J. Disaster Risk Reduct. 2024, 113, 104885. [Google Scholar] [CrossRef]
- Stewart, I. Advancing disaster risk communications. Earth-Sci. Rev. 2024, 249, 104677. [Google Scholar] [CrossRef]
- Stoto, M.A. Regionalization in local public health systems: Variation in rationale, implementation, and impact on public health preparedness. Public Health Rep. 2008, 123(4), 441–449. [Google Scholar] [CrossRef] [PubMed]
- Sufri, S.; Dwirahmadi, F.; Phung, D.; Rutherford, S. A systematic review of community engagement in disaster early warning systems. Prog. Disaster Sci. 2020, 5, 100058. [Google Scholar] [CrossRef]
- Sukhwani, V.; Gyamfi, B.A.; Zhang, R.; AlHinai, A.M.; Shaw, R. Understanding the barriers restraining effective operation of flood early warning systems. Int. J. Disaster Risk Manag. 2019, 1(2), 1–19. [Google Scholar] [CrossRef]
- Surianto, S.; Alim, S.; Nindrea, R.; Trisnantoro, L. Regional policy for disaster risk management in developing countries within the Sendai Framework: A systematic review. Open Access Maced. J. Med. Sci. 2019, 7(13), 2213–2219. [Google Scholar] [CrossRef] [PubMed]
- Tambo, E.; Djuikoue, I.C.; Tazemda, G.K.; Fotsing, M.F.; Zhou, X.-N. Early stage risk communication and community engagement (RCCE) strategies and measures against the coronavirus disease 2019 (COVID-19) pandemic crisis. Glob. Health J. 2021, 5(1), 44–50. [Google Scholar] [CrossRef] [PubMed]
- Tamim, S.T.R.; Faisal, M.; Saha, M.K.; Boiddho, J.; Cvetković, V.M. Assessing local disaster governance in coastal Bangladesh: Comparing institutional and community perspectives on disaster management committees. Int. J. Disaster Risk Manag. 2026, 8(1), 465–486. [Google Scholar] [CrossRef]
- Tascón-González, L.; Ferrer-Juliá, M.; Ruiz, M.; García-Meléndez, E. Social vulnerability assessment for flood risk analysis. Water 2020, 12(2), 558. [Google Scholar] [CrossRef]
- Tiernan, A.; Drennan, L.; Nalau, J.; Onyango, E.; Morrissey, L.; Mackey, B. A review of themes in disaster resilience literature and international practice since 2012. Policy Des. Pract. 2019, 2(1), 53–74. [Google Scholar] [CrossRef]
- Tiggeloven, T.; Raymond, C.; de Ruiter, M.C.; Sillmann, J.; Thieken, A.H.; Buijs, S.L.; Ward, P.J. Multi-hazard risk assessment and management: Pathways for the Sendai Framework and beyond. Geosci. Commun. 2026, 9(2), 185–221. [Google Scholar] [CrossRef]
- Tomašević, T.; Ivanović, D.; Jovanović, V.; Ivanović, I.; Rančić, M.; Boban, J.; Todorović, M. Public health risk assessments at the local government level in the Republic of Serbia. In Proceedings of the International Congress Public Health—Achievements and Challenges, 2024. [Google Scholar] [CrossRef]
- Toppenberg-Pejcic, D.; Noyes, J.; Allen, T.; Alexander, N.; Vanderford, M.L.; Gamhewage, G. Emergency risk communication: Lessons learned from a rapid review of recent gray literature on Ebola, Zika, and yellow fever. Health Commun. 2019, 34(4), 437–455. [Google Scholar] [CrossRef] [PubMed]
- Trgovčević, F.; Stupar, A.; Ivanović, M.; Susman, R. Toward flood resilience in Serbia: The challenges of an (un)sustainable policy. Sustainability 2020, 12(17), 7228. [Google Scholar] [CrossRef]
- Triyanti, A.; Surtiari, G.A.K.; Lassa, J.A.; Rafliana, I.; Hanifa, N.R.; Muhidin, M.I.; Djalante, R. Governing systemic and cascading disaster risk in Indonesia: Where do we stand and future outlook. Disaster Prev. Manag. 2023, 32(1), 27–48. [Google Scholar] [CrossRef]
- Unaam, A. Institutionalizing disaster risk reduction in fragile states: Local governance capacity, conflict insecurity, and community resilience in Lower Juba, Somalia. Int. J. Disaster Risk Manag. 2026, 8(1), 367–384. [Google Scholar] [CrossRef]
- United Nations Office for Disaster Risk Reduction. Sendai framework for disaster risk reduction 2015–2030; Author: Geneva, Switzerland, 2015; Available online: https://www.undrr.org/publication/sendai-framework-disaster-risk-reduction-2015-2030.
- van den Hurk, B.; White, C.; Ramos, A.; Ward, P.; Martius, O.; Olbert, I.; Zscheischler, J. Consideration of compound drivers and impacts in the disaster risk reduction cycle. iScience 2023, 26(3), 106030. [Google Scholar] [CrossRef] [PubMed]
- Vandrevala, T.; Morrow, E.; Coates, T.; Boulton, R.; Crawshaw, A.; O’Dwyer, E.; Heitmeyer, C. Strengthening the relationship between community resilience and health emergency communication: A systematic review. BMC Glob. Public Health 2024, 2, 79. [Google Scholar] [CrossRef] [PubMed]
- Vidović, N.; Cvetković, V.M.; Beriša, H. Optimising disaster resilience through advanced risk management and financial analysis of critical infrastructure in the Serbian defence industry. Int. J. Disaster Risk Manag. 2024, 6(2), 183–200. [Google Scholar] [CrossRef]
- Wen, Q.; Ismail, M.; Abdul Nasir, M.H. A community public health emergency resilience assessment framework based on contrastive learning and hyperbolic embedding. Front. Public Health 2025, 13, 1651331. [Google Scholar] [CrossRef] [PubMed]
- Wolf-Fordham, S. Integrating government silos: Local emergency management and public health department collaboration for emergency planning and response. Am. Rev. Public Adm. 2020, 50(6–7), 560–567. [Google Scholar] [CrossRef]
- World Health Organization. International health regulations (2005), 3rd ed.; Author: Geneva, Switzerland, 2016; Available online: https://www.who.int/publications/i/item/9789241580496.
- World Health Organization. Communicating risk in public health emergencies: A WHO guideline for emergency risk communication (ERC) policy and practice; Author: Geneva, Switzerland, 2017; Available online: https://www.who.int/publications/i/item/9789241550208.
- World Health Organization. Health emergency and disaster risk management framework; Author: Geneva, Switzerland, 2019; Available online: https://www.who.int/publications/i/item/9789241516181.
- World Health Organization. 2019 novel coronavirus (2019-nCoV): Strategic preparedness and response plan; Author: Geneva, Switzerland, 2020; Available online: https://www.who.int/publications/i/item/strategic-preparedness-and-response-plan-for-the-new-coronavirus.
- World Health Organization. Strategic toolkit for assessing risks: A comprehensive toolkit for all-hazards health emergency risk assessment; Author: Geneva, Switzerland, 2021; Available online: https://www.who.int/publications/i/item/9789240036086.
- Yamah, D.; Folorunsho, T. Leveraging social media and mobile technology for disaster communication in Nigeria. Int. J. Disaster Risk Manag. 2026, 8(1), 1–30. [Google Scholar] [CrossRef]
- Yota, D.; Massidi, C.; Talisuna, A.; Tchikamgoua, O.N. Assessing the correlation between STAR health risk forecasts with actual health emergencies in West and Central Africa: A three-year analysis. Front. Public Health 2026, 13, 1728832. [Google Scholar] [CrossRef] [PubMed]
- Zhou, S.; Zhai, G. A multi-hazard risk assessment framework for urban disaster prevention planning: A case study of Xiamen, China. Land 2023, 12(10), 1884. [Google Scholar] [CrossRef]
Figure 1.
Overall research workflow, from source materials and data quality control to primary STAR analyses, derived-variable construction, extended analyses, and scientific synthesis.
Figure 1.
Overall research workflow, from source materials and data quality control to primary STAR analyses, derived-variable construction, extended analyses, and scientific synthesis.
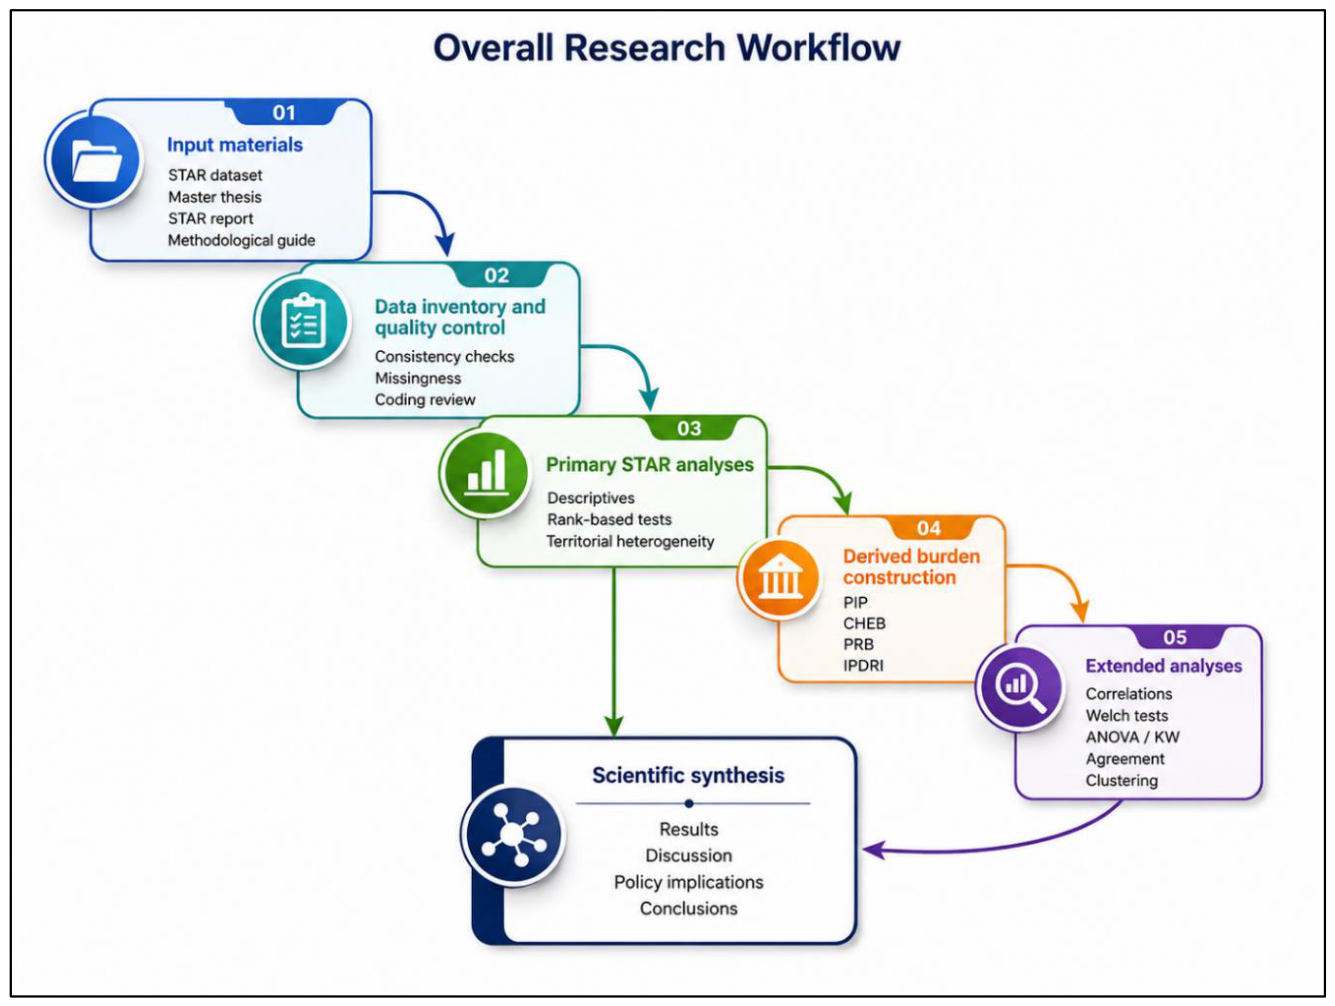
Figure 2.
Analytical structure of the official STAR metrics and the complementary derived burden measures used in the study.
Figure 2.
Analytical structure of the official STAR metrics and the complementary derived burden measures used in the study.
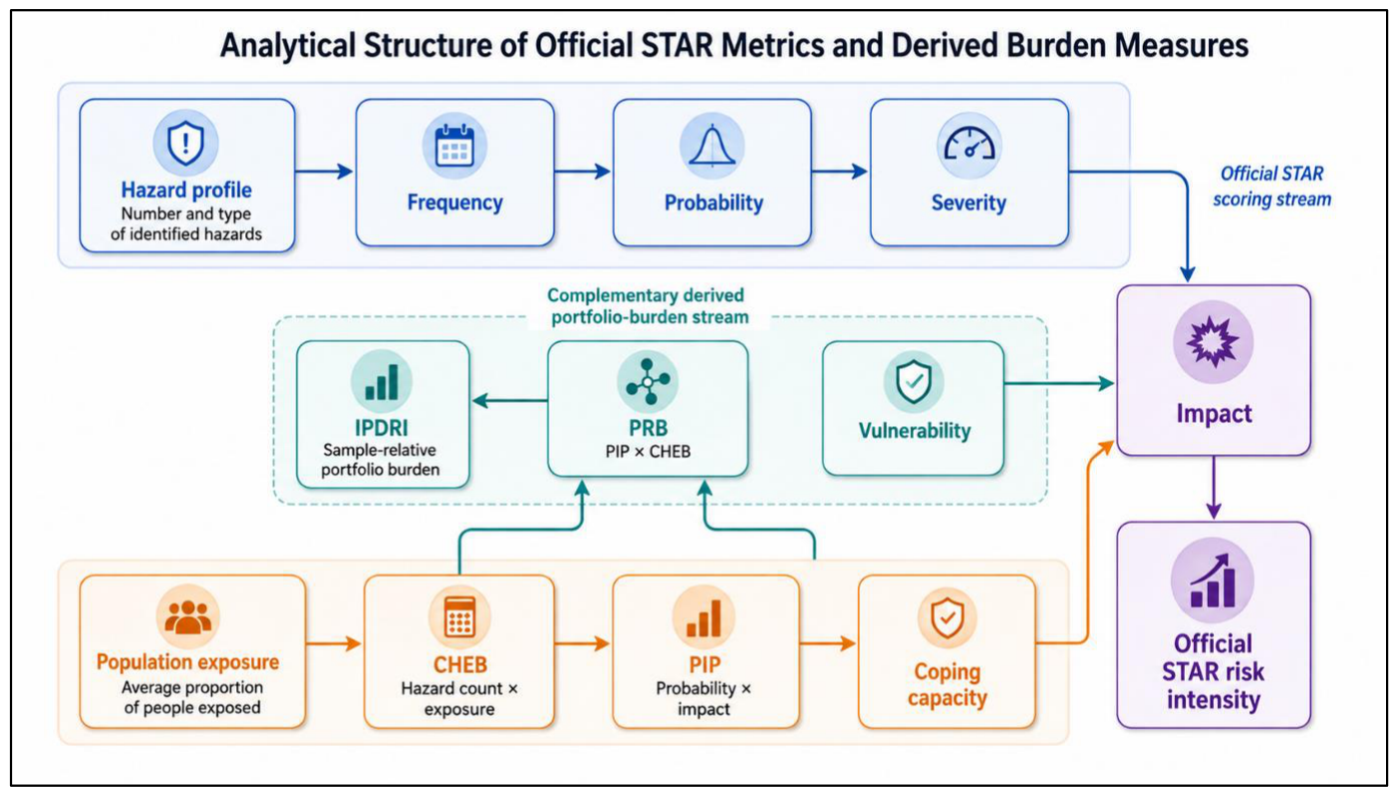
Figure 3.
Statistical analysis workflow showing the sequence of descriptive, inferential, derived-variable, and exploratory procedures used in the study.
Figure 3.
Statistical analysis workflow showing the sequence of descriptive, inferential, derived-variable, and exploratory procedures used in the study.
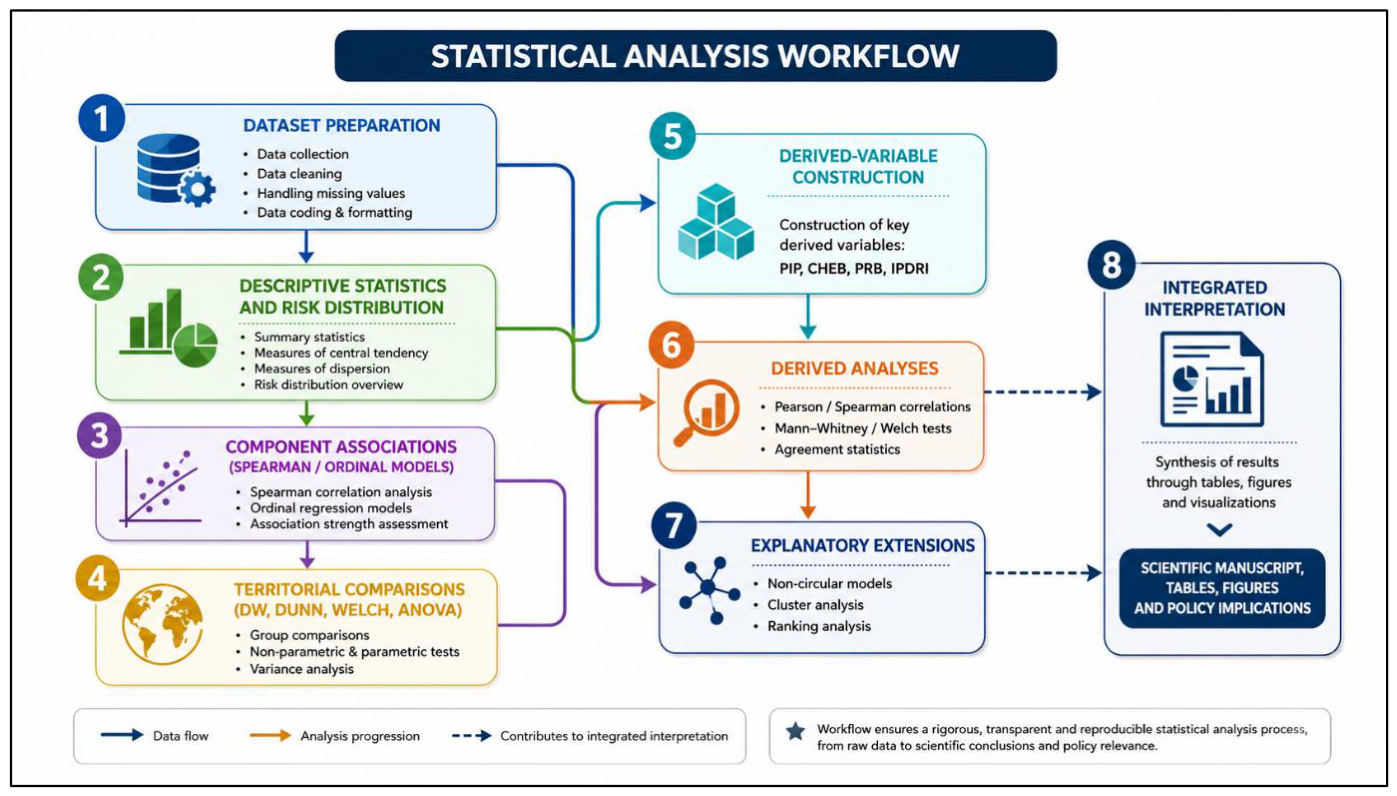
Figure 4.
Spatial distribution of selected WHO STAR public health risk characteristics across Serbian local administrative units: (A) supplied WHO STAR risk level; (B) probability score; and (C) population exposure. The inset enlarges the City of Belgrade to preserve the visibility of its 17 city municipalities. Areas outside the analytical dataset are shown as No data.
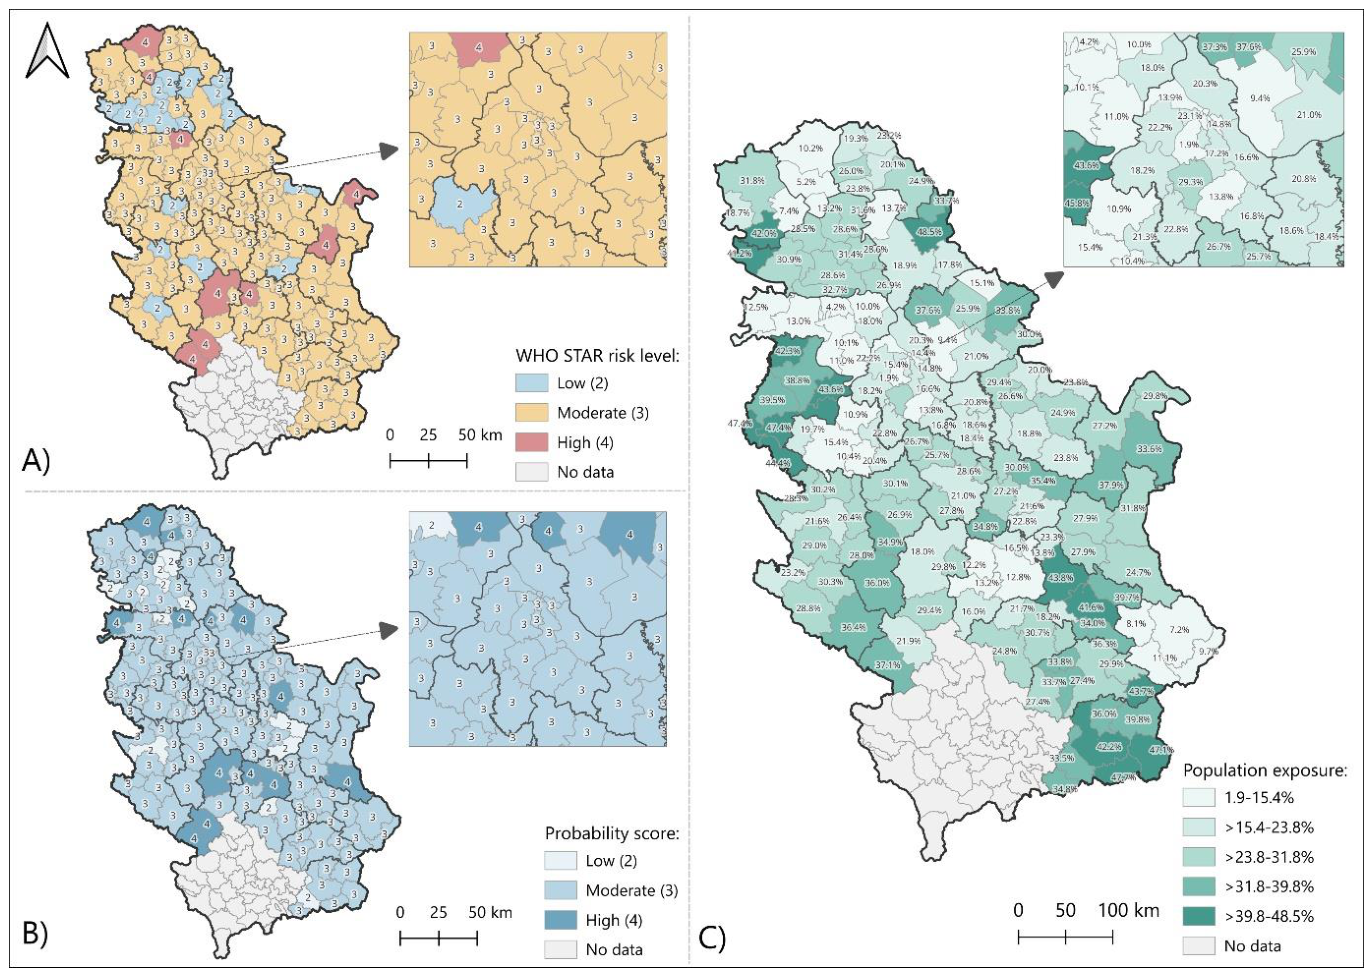
Figure 5.
Distribution of aggregated WHO STAR public health risk levels across 161 local administrative units.
Figure 5.
Distribution of aggregated WHO STAR public health risk levels across 161 local administrative units.
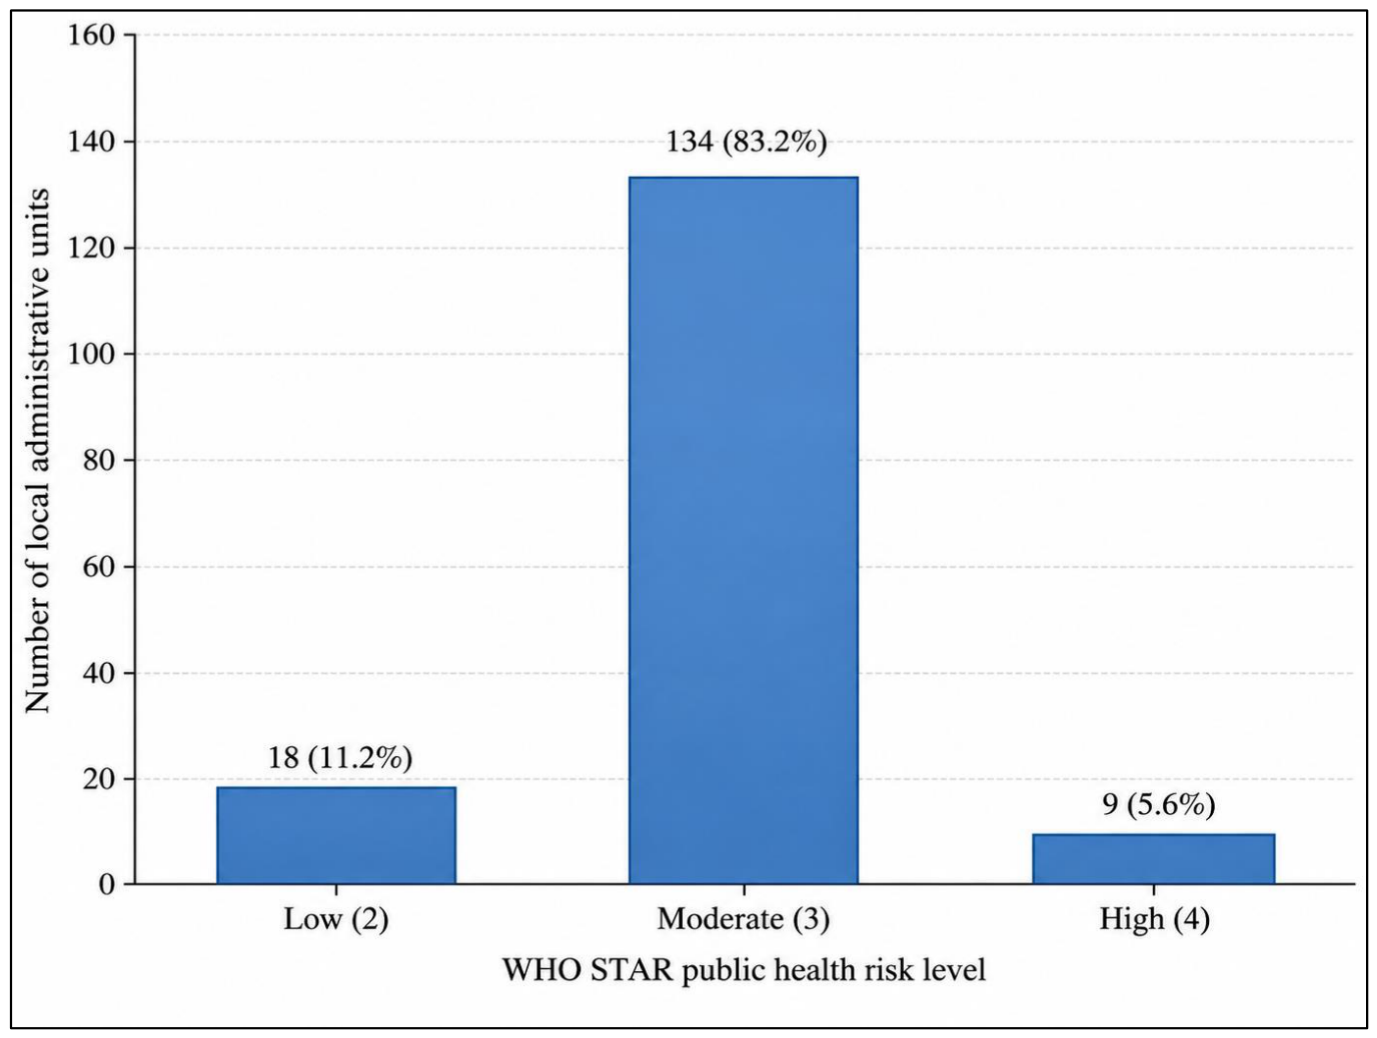
Figure 6.
Spearman rank associations between STAR components and the ordinal risk level, with 95% bootstrap confidence intervals.
Figure 6.
Spearman rank associations between STAR components and the ordinal risk level, with 95% bootstrap confidence intervals.
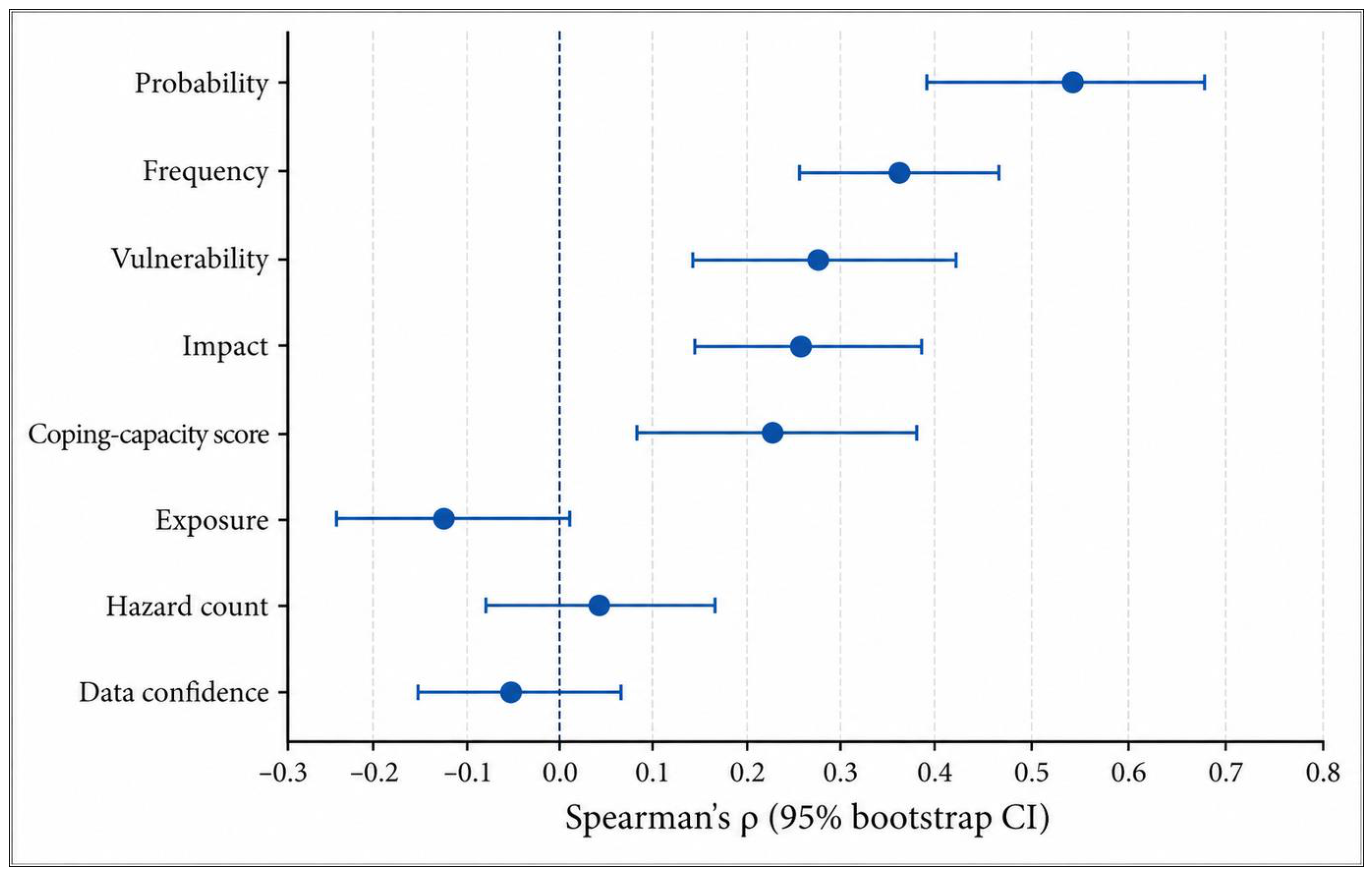
Figure 7.
District-level composition of low, moderate, and high aggregated public health risk categories, ordered by mean risk level.
Figure 7.
District-level composition of low, moderate, and high aggregated public health risk categories, ordered by mean risk level.
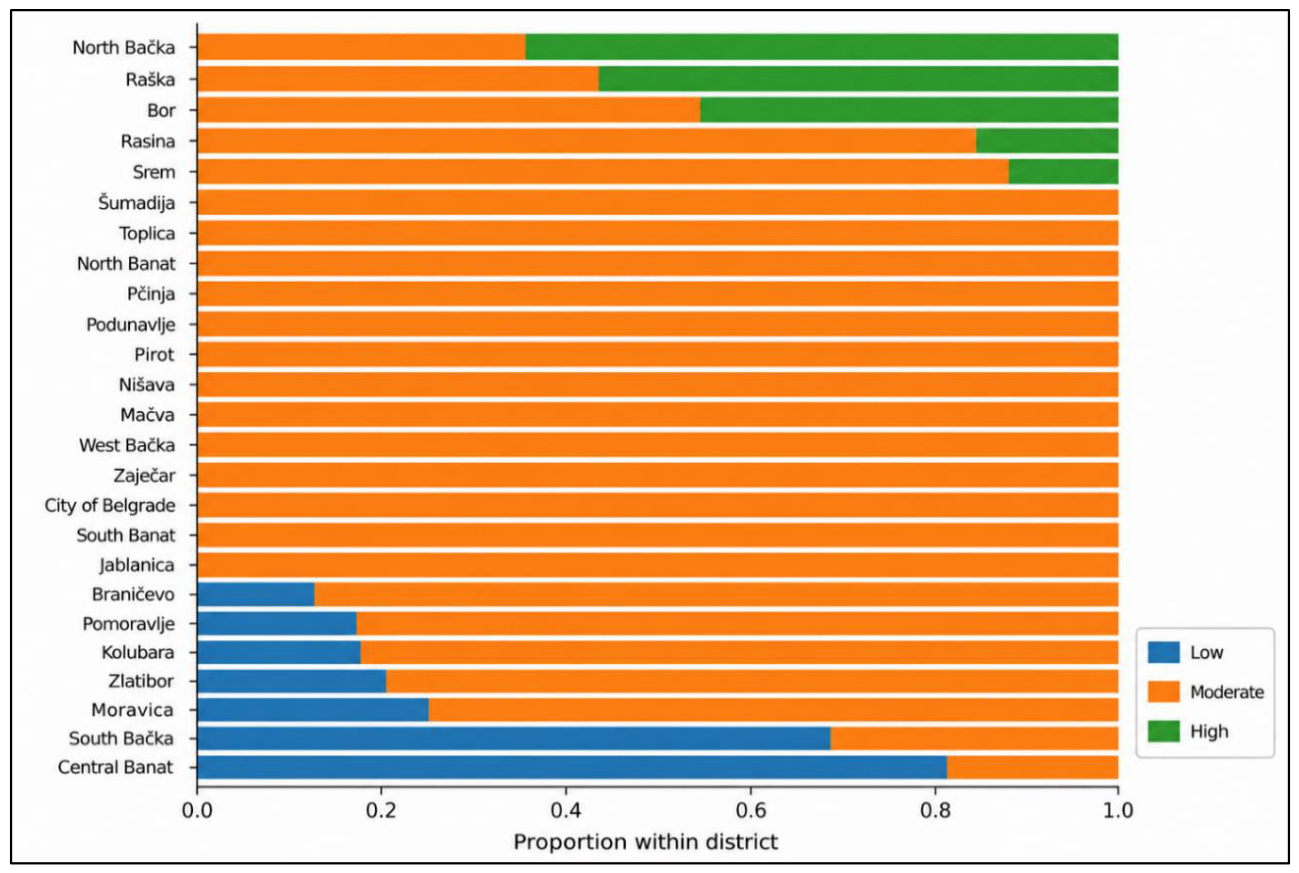
Figure 8.
Spatial distribution of complementary portfolio-risk characteristics across Serbian local administrative units: (A) cumulative hazard–exposure burden (CHEB); (B) Integrated Portfolio Disaster Risk Index (IPDRI); and (C) exploratory local risk-profile cluster membership. The inset enlarges the City of Belgrade to preserve the visibility of its 17 city municipalities. IPDRI is a sample-relative 0–100 measure, whereas cluster membership represents an exploratory typology. Areas outside the analytical dataset are shown as No data.
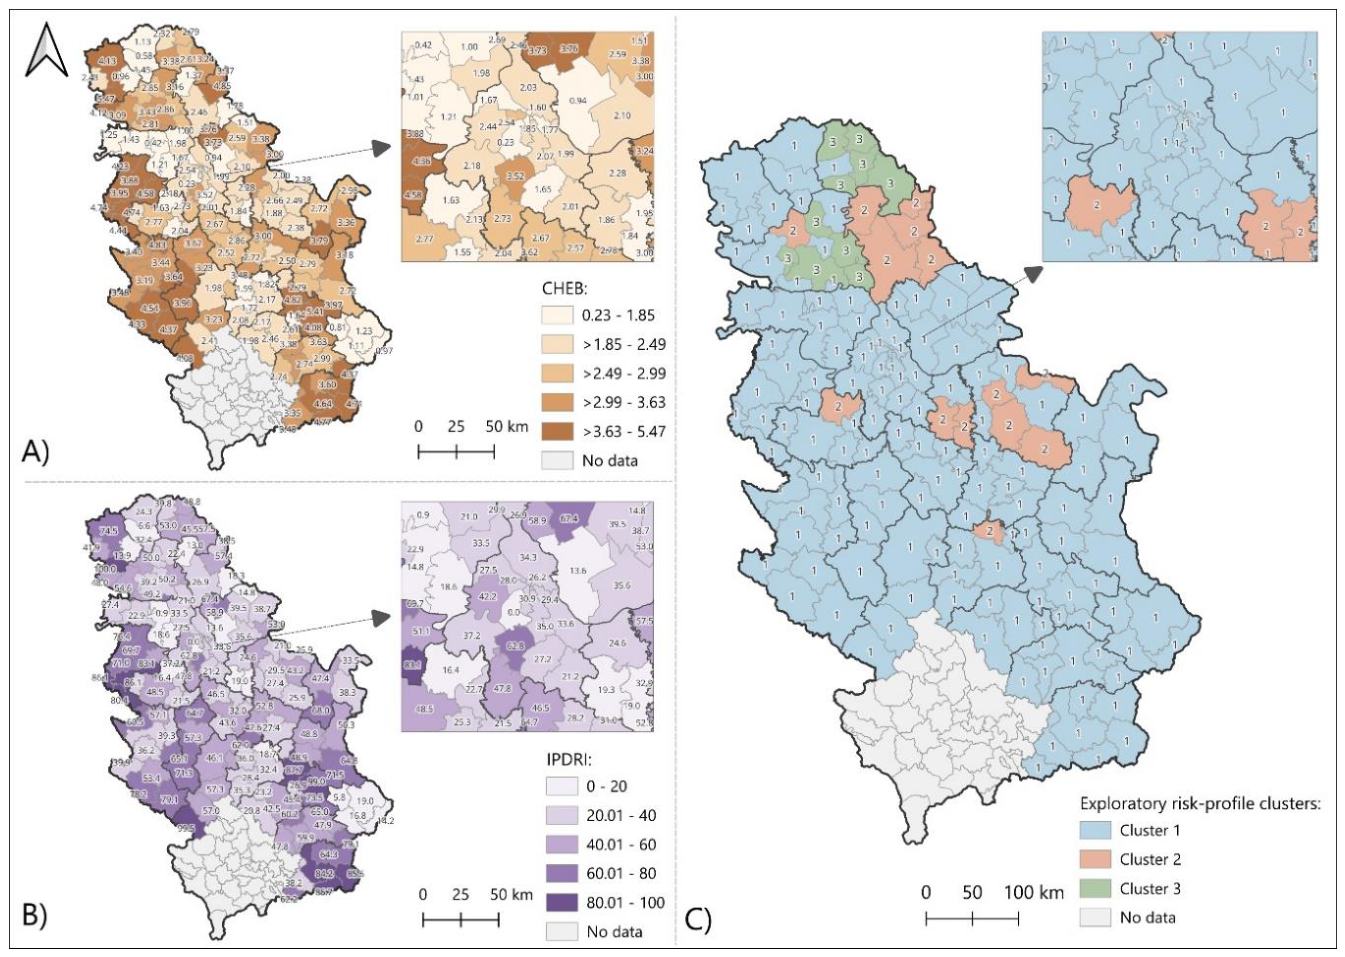
Figure 9.
Distribution of the Integrated Portfolio Disaster Risk Index (IPDRI) across 161 local administrative units.
Figure 9.
Distribution of the Integrated Portfolio Disaster Risk Index (IPDRI) across 161 local administrative units.
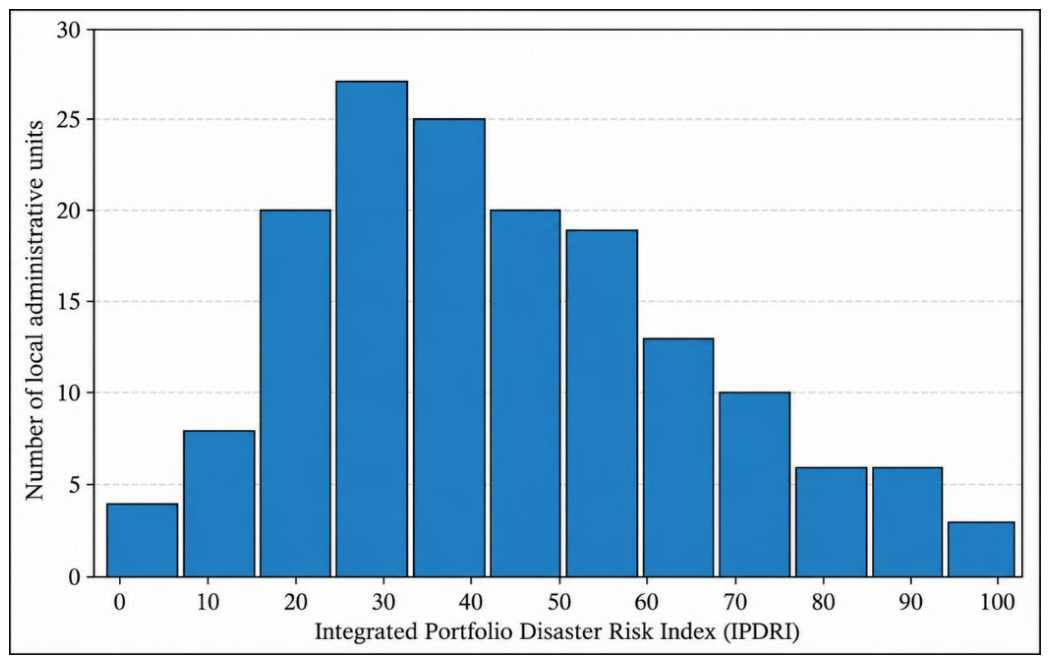
Figure 10.
Distribution of the Integrated Portfolio Disaster Risk Index across Belgrade, Vojvodina, and Central Serbia.
Figure 10.
Distribution of the Integrated Portfolio Disaster Risk Index across Belgrade, Vojvodina, and Central Serbia.
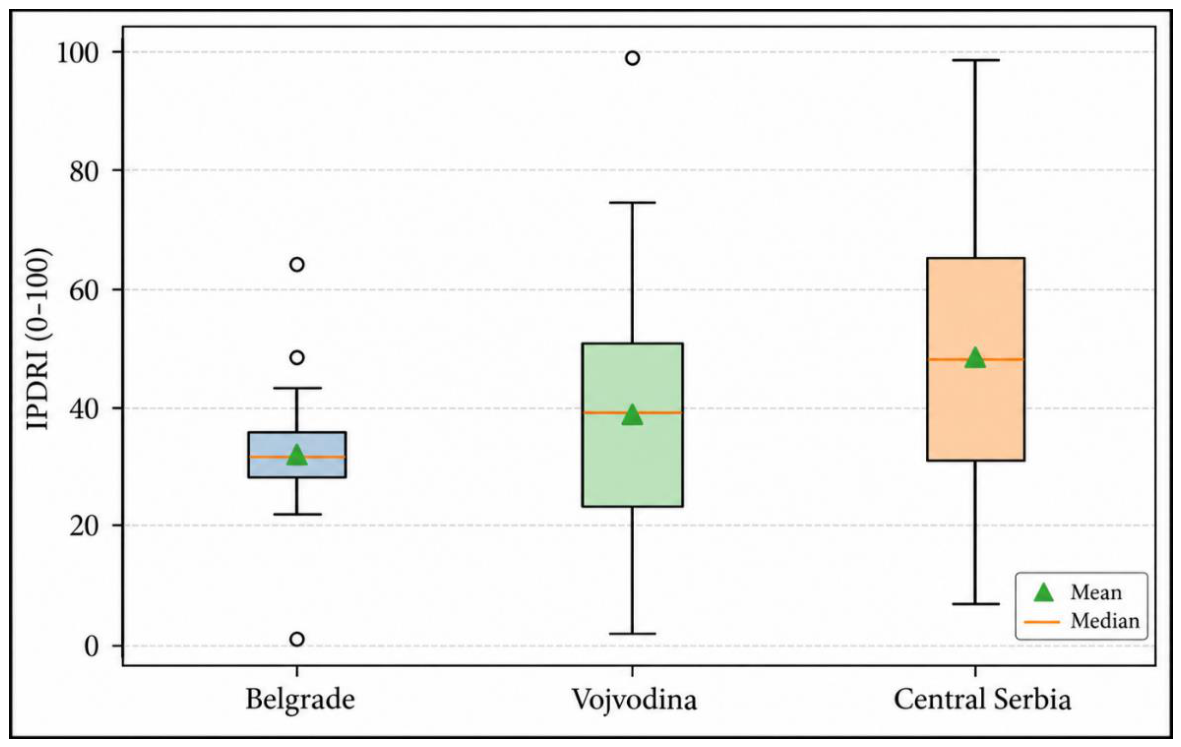
Figure 11.
Association between cumulative hazard–exposure burden (CHEB) and the Integrated Portfolio Disaster Risk Index.
Figure 11.
Association between cumulative hazard–exposure burden (CHEB) and the Integrated Portfolio Disaster Risk Index.
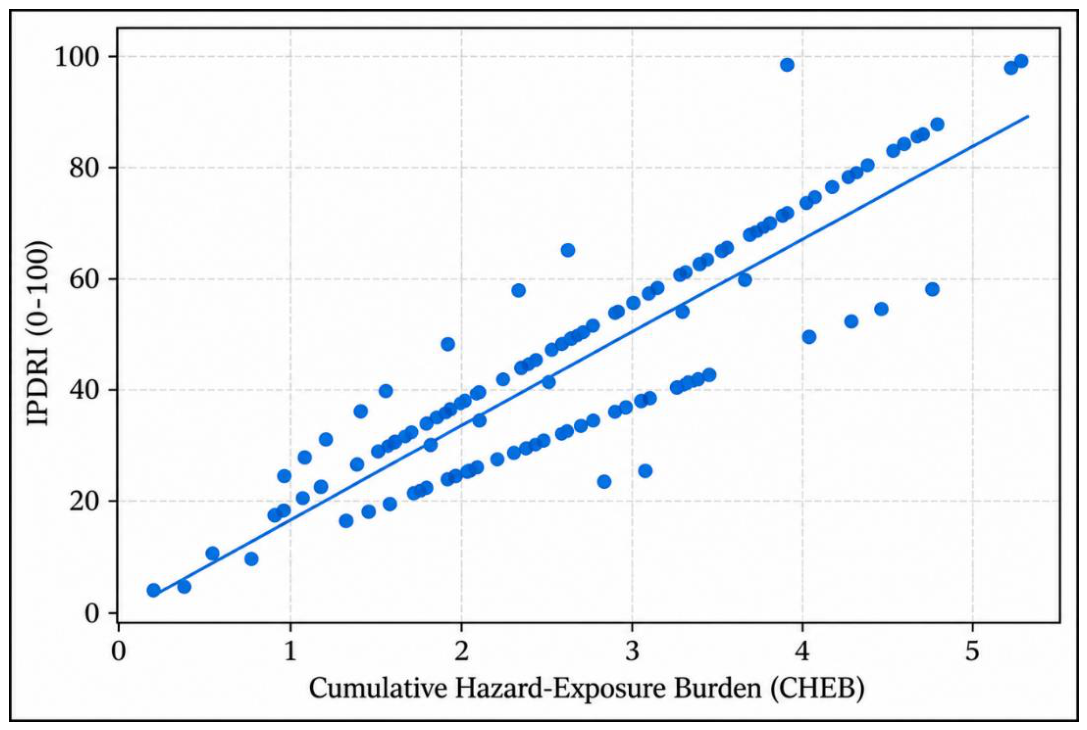
Figure 12.
Distribution of the aggregated probability–impact product across the supplied STAR risk categories.
Figure 12.
Distribution of the aggregated probability–impact product across the supplied STAR risk categories.
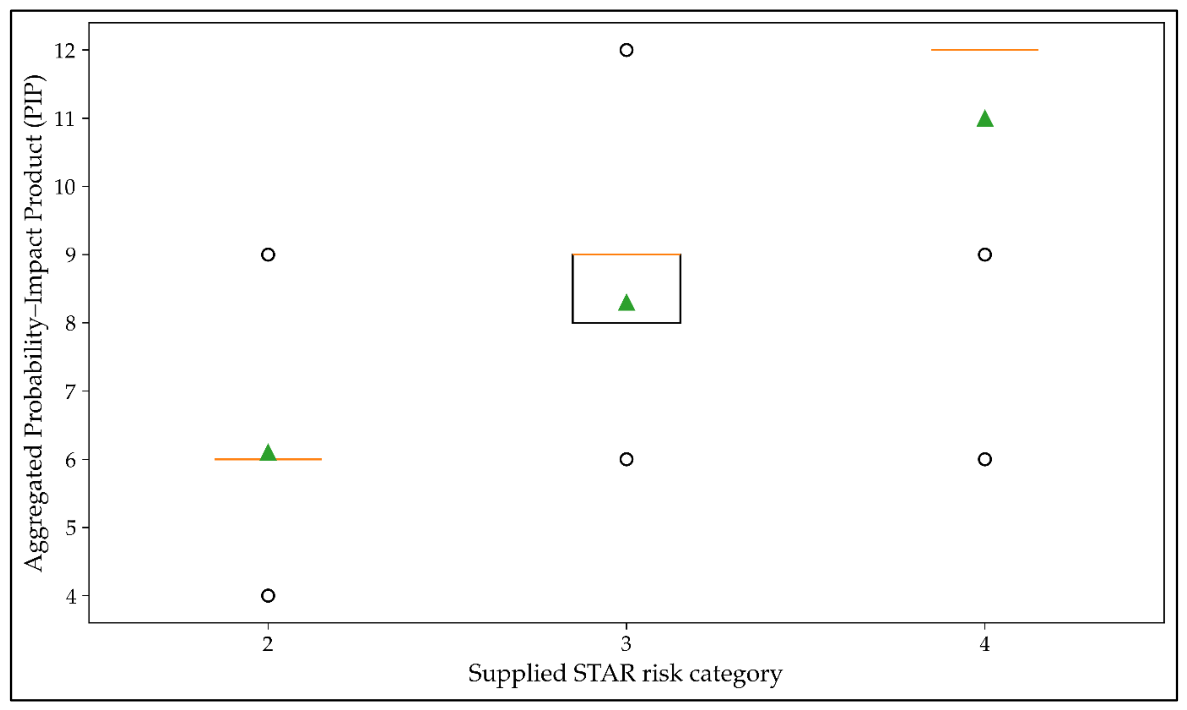
Figure 13.
Cross-classification of PIP-derived and supplied STAR risk categories.
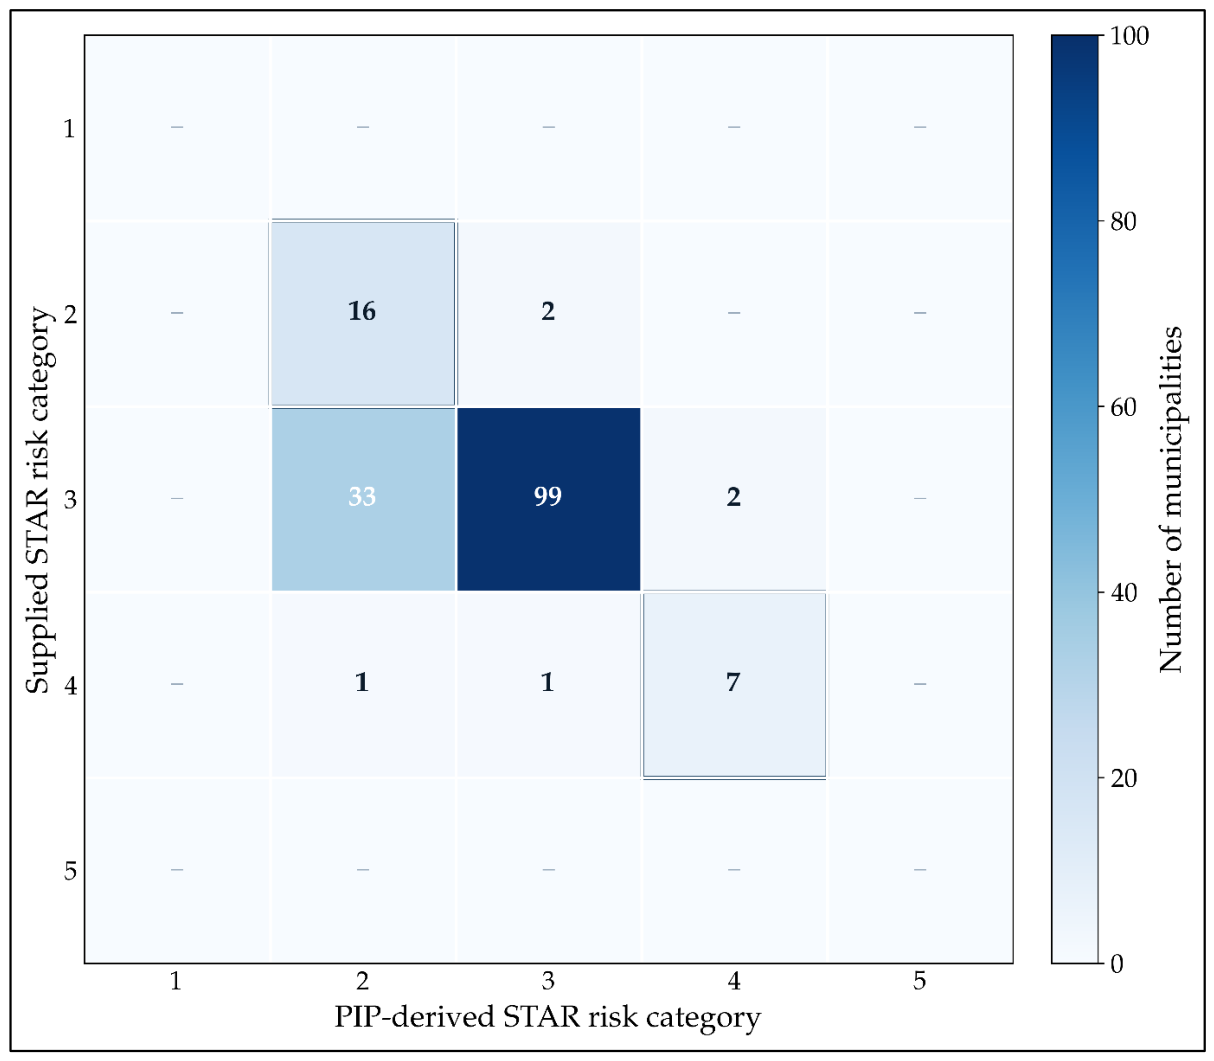
Figure 14.
Standardized profiles of the three exploratory local risk clusters.
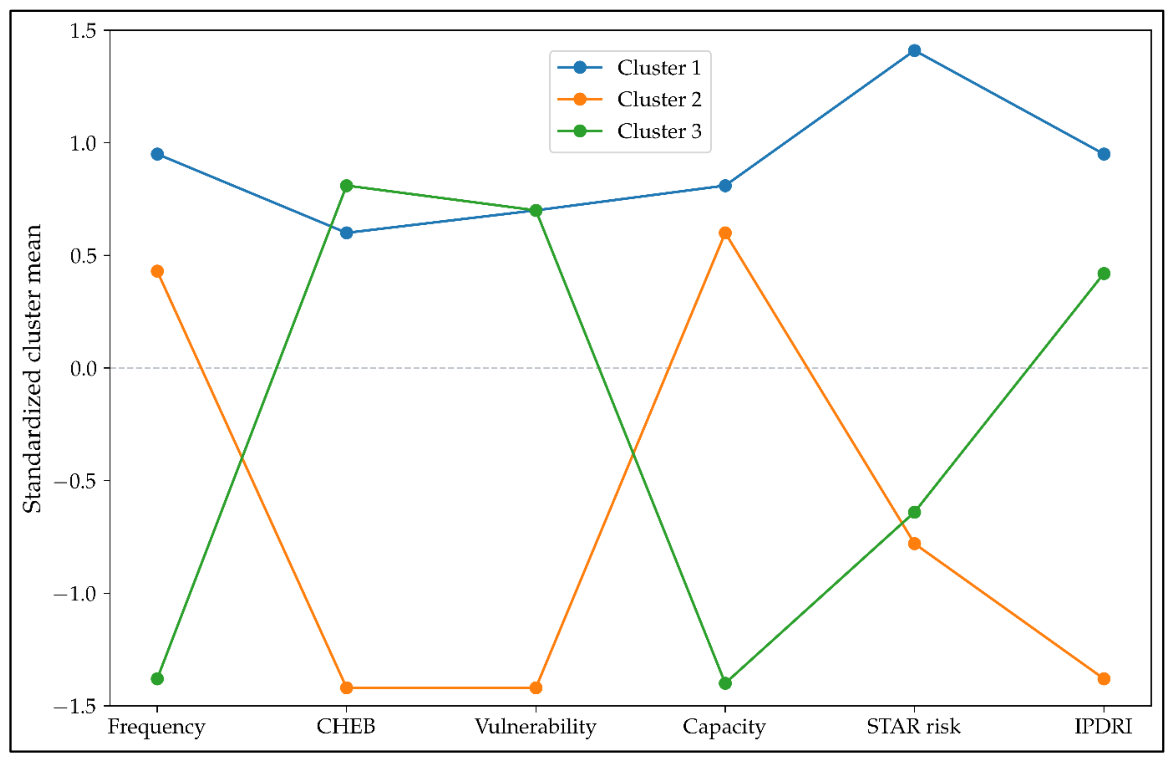
Figure 15.
Twenty local administrative units with the highest exposure-weighted portfolio risk burden.
Figure 15.
Twenty local administrative units with the highest exposure-weighted portfolio risk burden.
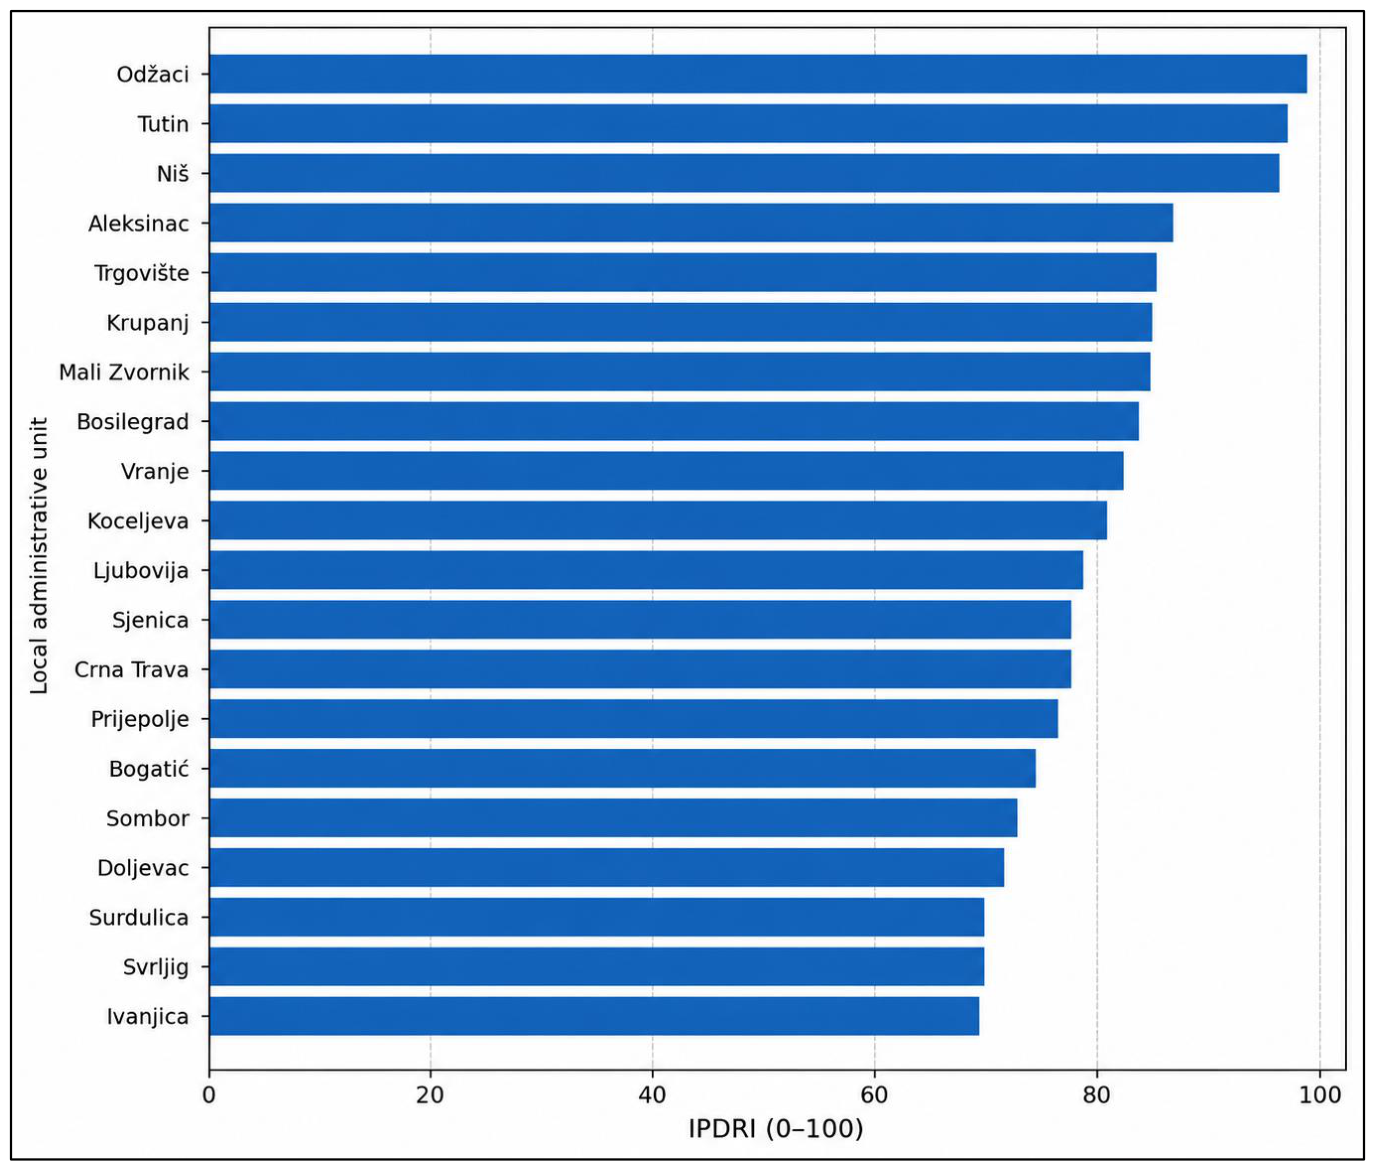

Table 1.
Descriptive characteristics of the municipality-level STAR dataset.
| Variable | Mean | SD | Median | IQR | Range |
|---|---|---|---|---|---|
| Hazard count | 11.04 | 1.67 | 10 | 10–12 | 8–18 |
| Exposure proportion | 0.256 | 0.103 | 0.264 | 0.182–0.318 | 0.019–0.485 |
| Frequency score | 3.04 | 0.52 | 3 | 3–3 | 2–4 |
| Probability score | 3.01 | 0.40 | 3 | 3–3 | 2–4 |
| Impact score | 2.72 | 0.45 | 3 | 2–3 | 2–3 |
| Coping-capacity score | 2.95 | 0.29 | 3 | 3–3 | 2–4 |
| Vulnerability score | 2.91 | 0.28 | 3 | 3–3 | 2–3 |
| Data-confidence score | 2.19 | 0.40 | 2 | 2–2 | 2–3 |
| Risk level | 2.94 | 0.41 | 3 | 3–3 | 2–4 |
Note. N = 161 for all variables after normalization of the Golubac exposure entry. Higher coping-capacity scores indicate poorer coping capacity under official STAR coding.
Table 2.
Rank-based associations with the ordinal risk level.
| Variable | Spearman ρ | 95% bootstrap CI | p | Holm-adjusted p | Kendall τb |
|---|---|---|---|---|---|
| Probability | 0.534 | [0.357, 0.683] | < 0.001 | < 0.001 | 0.523 |
| Frequency | 0.360 | [0.221, 0.499] | < 0.001 | < 0.001 | 0.346 |
| Vulnerability | 0.287 | [0.090, 0.478] | < 0.001 | 0.007 | 0.282 |
| Impact | 0.258 | [0.093, 0.409] | 0.001 | 0.029 | 0.253 |
| Coping-capacity score | 0.240 | [0.051, 0.423] | 0.002 | 0.061 | 0.235 |
| Exposure | −0.139 | [−0.283, 0.020] | 0.079 | 1.000 | −0.112 |
| Hazard count | 0.049 | [−0.100, 0.191] | 0.538 | 1.000 | 0.043 |
| Data confidence | −0.046 | [−0.177, 0.074] | 0.561 | 1.000 | −0.045 |
Note. Bootstrap confidence intervals used 3,000 resamples. Holm adjustment shown here derives from all pairwise correlations among the nine analytic variables—higher coping-capacity score = poorer capacity.
Table 3.
Regional heterogeneity across STAR variables.
| Variable | Kruskal–Wallis H | p | Holm-adjusted p | ε² |
|---|---|---|---|---|
| Data confidence | 118.47 | < 0.001 | < 0.001 | 0.695 |
| Exposure | 109.97 | < 0.001 | < 0.001 | 0.632 |
| Hazard count | 103.30 | < 0.001 | < 0.001 | 0.583 |
| Vulnerability | 94.29 | < 0.001 | < 0.001 | 0.517 |
| Frequency | 93.57 | < 0.001 | < 0.001 | 0.512 |
| Coping-capacity score | 86.64 | < 0.001 | < 0.001 | 0.461 |
| Risk level | 81.95 | < 0.001 | < 0.001 | 0.426 |
| Impact | 61.88 | < 0.001 | < 0.001 | 0.279 |
| Probability | 56.19 | < 0.001 | < 0.001 | 0.237 |
Note. df = 24 for all tests. Epsilon-squared is reported as the nonparametric effect-size estimate—higher coping-capacity score = poorer capacity.
Table 4.
Significant Dunn-Holm pairwise comparisons for risk level.
| District 1 | District 2 | z | Holm p |
|---|---|---|---|
| City of Belgrade | South Bačka | 4.44 | 0.003 |
| City of Belgrade | Central Banat | 3.95 | 0.023 |
| South Bačka | Rasina | −4.13 | 0.010 |
| South Bačka | Raška | −5.80 | < 0.001 |
| South Bačka | Srem | −4.23 | 0.007 |
| South Bačka | North Bačka | −5.03 | < 0.001 |
| South Bačka | Bor | −4.94 | < 0.001 |
| Rasina | Central Banat | 3.97 | 0.021 |
| Raška | Central Banat | 5.41 | < 0.001 |
| Srem | Central Banat | 4.01 | 0.018 |
| North Bačka | Central Banat | 4.90 | < 0.001 |
| Bor | Central Banat | 4.75 | < 0.001 |
Note. Two-sided Dunn tests with Holm correction across all 300 district pairs for risk.
Table 5.
. HC3 regression sensitivity analysis for aggregated risk level (M3).
| Predictor | B | 95% CI for B | HC3 SE | β | p |
|---|---|---|---|---|---|
| Probability | 0.483 | [0.291, 0.675] | 0.098 | 0.479 | < 0.001 |
| Frequency | 0.137 | [0.037, 0.238] | 0.051 | 0.176 | 0.007 |
| Vulnerability | 0.347 | [0.058, 0.636] | 0.147 | 0.241 | 0.018 |
| Impact | 0.171 | [0.032, 0.310] | 0.071 | 0.189 | 0.016 |
| Exposure | −0.500 | [−0.914, −0.085] | 0.211 | −0.126 | 0.018 |
| Coping-capacity score | 0.149 | [−0.050, 0.347] | 0.101 | 0.106 | 0.143 |
| Hazard count | −0.029 | [−0.068, 0.010] | 0.020 | −0.120 | 0.139 |
| Data confidence | 0.039 | [−0.098, 0.176] | 0.070 | 0.038 | 0.575 |
Note. N = 161; R² = 0.482; adjusted R² = 0.455. HC3 robust standard errors and 95% confidence intervals are shown. The model is a sensitivity/decomposition analysis because several predictors are components of STAR impact/risk construction; coefficients must not be interpreted causally—higher coping-capacity score = poorer capacity.
Table 6.
Standardized cumulative-logit sensitivity model for higher STAR risk category.
| Predictor | Odds ratio | 95% CI | p |
|---|---|---|---|
| Probability | 5.038 | [2.809, 9.036] | < 0.001 |
| Frequency | 2.168 | [1.194, 3.936] | 0.011 |
| Vulnerability | 2.114 | [1.297, 3.445] | 0.003 |
| Impact | 2.530 | [1.284, 4.986] | 0.007 |
| Exposure | 0.608 | [0.317, 1.168] | 0.135 |
| Coping-capacity score | 1.608 | [0.923, 2.804] | 0.094 |
| Hazard count | 0.620 | [0.346, 1.111] | 0.108 |
| Data confidence | 1.143 | [0.658, 1.987] | 0.635 |
Note. Predictors were standardized before estimation. Odds ratios represent the odds of occupying a higher-risk category. These estimates are sensitivity results only because the outcome is algorithmically derived from several STAR components and the high-risk category contains only nine units.
Table 7.
Descriptive characteristics of derived exposure-weighted risk-burden measures.
| Measure | Mean | SD | Median | Minimum | Maximum |
|---|---|---|---|---|---|
| PIP | 8.18 | 1.70 | 9.00 | 4.00 | 12.00 |
| CHEB | 2.78 | 1.08 | 2.74 | 0.23 | 5.47 |
| Exposure-weighted PIP | 2.08 | 0.96 | 1.88 | 0.17 | 4.45 |
| PRB | 22.64 | 10.10 | 20.76 | 2.10 | 49.19 |
| IPDRI (0–100) | 43.64 | 21.45 | 39.65 | 0.00 | 100.00 |
| Structural susceptibility | 2.93 | 0.21 | 3.00 | 2.00 | 3.50 |
| Hazard dynamics | 3.02 | 0.38 | 3.00 | 2.00 | 4.00 |
Note. PIP = probability-impact product; CHEB = cumulative hazard-exposure burden; PRB = portfolio risk burden; IPDRI = Integrated Portfolio Disaster Risk Index. IPDRI is a sample-relative rescaling of PRB, not an official WHO STAR score, probability, or expected-loss estimate.
Table 8.
Macroregional distribution of exposure-weighted portfolio burden.
| Macroregion | n | IPDRI Mean | IPDRI SD | PRB Mean | PRB SD |
|---|---|---|---|---|---|
| Belgrade | 17 | 32.00 | 12.74 | 17.16 | 6.00 |
| Vojvodina | 45 | 37.75 | 19.76 | 19.87 | 9.31 |
| Central Serbia | 99 | 48.31 | 22.09 | 24.85 | 10.40 |
Note. IPDRI = Integrated Portfolio Disaster Risk Index; PRB = portfolio risk burden. Macroregional classification was used as a complementary descriptive grouping and does not replace the 25-district analysis.
Table 9.
STAR component profiles across low, moderate, and high risk categories.
| Variable | Low median (IQR) | Moderate median (IQR) | High median (IQR) | H | Holm p | ε² |
|---|---|---|---|---|---|---|
| Hazard count | 10.000 (10.000–11.750) | 10.000 (10.000–12.000) | 11.000 (10.000–11.000) | 0.40 | 0.818 | 0.000 |
| Exposure proportion | 0.289 (0.246–0.313) | 0.258 (0.183–0.325) | 0.180 (0.122–0.298) | 3.19 | 0.610 | 0.008 |
| Frequency score | 3.000 (2.000–3.000) | 3.000 (3.000–3.000) | 4.000 (3.000–4.000) | 22.28 | < 0.001 | 0.128 |
| Probability score | 3.000 (2.000–3.000) | 3.000 (3.000–3.000) | 4.000 (4.000–4.000) | 50.51 | < 0.001 | 0.307 |
| Impact score | 2.000 (2.000–3.000) | 3.000 (3.000–3.000) | 3.000 (3.000–3.000) | 11.76 | 0.014 | 0.062 |
| Coping-capacity score (higher = poorer capacity) | 3.000 (3.000–3.000) | 3.000 (3.000–3.000) | 3.000 (3.000–3.000) | 9.28 | 0.039 | 0.046 |
| Vulnerability score | 3.000 (2.000–3.000) | 3.000 (3.000–3.000) | 3.000 (3.000–3.000) | 15.77 | 0.002 | 0.087 |
| Data confidence score | 2.000 (2.000–2.000) | 2.000 (2.000–2.000) | 2.000 (2.000–2.000) | 2.44 | 0.610 | 0.003 |
Note. Low, moderate, and high correspond to STAR risk categories 2, 3, and 4. Higher coping-capacity scores indicate poorer coping capacity. Omnibus tests are Kruskal–Wallis tests.
Table 10.
Diagnostic and robustness checks for the model-based sensitivity analyses.
| Diagnostic | Result | Interpretation |
|---|---|---|
| M3 VIF range | 1.13–1.31 | No material multicollinearity. |
| Breusch–Pagan | LM = 8.505, p = 0.386 | No evidence of heteroskedasticity. |
| White test | LM = 35.884, p = 0.656 | No evidence of heteroskedasticity. |
| Jarque–Bera | JB = 45.649, p < 0.001 | Residuals are non-normal. |
| Shapiro–Wilk | W = 0.939, p < 0.001 | Residuals are non-normal; HC3 and ordinal/nonparametric analyses are preferred. |
| Ramsey RESET | F = 0.064, p = 0.801 | No evidence of simple functional-form misspecification. |
| Cook's distance | 20 cases > 4/N; max = 0.107 | Influence exists; sensitivity analysis was run. |
| High leverage | 17 cases > 2(k+1)/N; max = 0.201 | Some leverage expected from sparse ordinal patterns. |
| District × risk | Chi-square = 150.199, df = 48; asymptotic p < 0.001; Monte Carlo p = 0.0002; bias-corrected Cramer's V = 0.566 | Strong regional association; Monte Carlo inference used because many expected counts are < 5. |
| Risk one-way ANOVA sensitivity | F(24,136) = 5.959, p < 0.001, eta2 = 0.513, omega2 = 0.425 | Large regional effect; primary test remains Kruskal–Wallis because the outcome is ordinal. |
| Brown–Forsythe sensitivity | F* = 5.415, p = 0.00005 | Regional difference remains under robust variance correction. |
Table 11.
Selected Pearson correlations for the derived risk-burden measures.
| Derived measure | Reference variable | r | 95% CI | p | Holm p |
|---|---|---|---|---|---|
| PIP | probability | 0.582 | [0.470, 0.676] | < 0.001 | < 0.001 |
| PIP | impact | 0.754 | [0.679, 0.814] | < 0.001 | < 0.001 |
| PIP | vulnerability | 0.333 | [0.188, 0.464] | < 0.001 | < 0.001 |
| PIP | star_risk | 0.567 | [0.452, 0.664] | < 0.001 | < 0.001 |
| CHEB | exposure | 0.940 | [0.919, 0.956] | < 0.001 | < 0.001 |
| CHEB | star_risk | -0.150 | [-0.298, 0.005] | 0.058 | 0.462 |
| PRB | exposure | 0.835 | [0.781, 0.877] | < 0.001 | < 0.001 |
| PRB | star_risk | 0.117 | [-0.038, 0.267] | 0.138 | 0.555 |
| IPDRI | exposure | 0.835 | [0.781, 0.877] | < 0.001 | < 0.001 |
| IPDRI | impact | 0.389 | [0.250, 0.513] | < 0.001 | < 0.001 |
| IPDRI | vulnerability | 0.232 | [0.080, 0.373] | 0.003 | 0.022 |
| IPDRI | star_risk | 0.117 | [-0.038, 0.267] | 0.138 | 0.555 |
Note. The complete 63-row Pearson/Spearman matrix is provided in Supplementary Table S1.
Table 12.
Statistically significant Welch independent-samples comparisons and nonparametric sensitivity tests.
Table 12.
Statistically significant Welch independent-samples comparisons and nonparametric sensitivity tests.
| Comparison | Variable | Group 1 n/M | Group 2 n/M | t (df) | p | Hedges g | MW p |
|---|---|---|---|---|---|---|---|
| Data confidence: score 3 vs score 2 |
struct_susc | 31 / 2.81 | 130 / 2.96 | -3.28 (38.15) | 0.002 | -0.79 | < 0.001 |
| Belgrade vs all other units | IPDRI | 17 / 32.00 | 144 / 45.01 | -3.63 (28.69) | 0.001 | -0.61 | 0.023 |
| Belgrade vs. all other units | CHEB | 17 / 2.00 | 144 / 2.87 | -4.73 (27.35) | < 0.001 | -0.83 | < 0.001 |
| Belgrade vs all other units | PRB | 17 / 17.16 | 144 / 23.29 | -3.63 (28.69) | 0.001 | -0.61 | 0.023 |
| Belgrade vs all other units | struct_susc | 17 / 3.00 | 144 / 2.92 | 4.25 (143.00) | < 0.001 | 0.37 | 0.131 |
| Vojvodina vs Central Serbia | IPDRI | 45 / 37.75 | 99 / 48.31 | -2.86 (94.47) | 0.005 | -0.49 | 0.011 |
| Vojvodina vs Central Serbia | CHEB | 45 / 2.53 | 99 / 3.02 | -2.44 (76.93) | 0.017 | -0.46 | 0.030 |
| Vojvodina vs Central Serbia | PRB | 45 / 19.87 | 99 / 24.85 | -2.86 (94.47) | 0.005 | -0.49 | 0.011 |
| Vojvodina vs Central Serbia | struct_susc | 45 / 2.82 | 99 / 2.97 | -3.25 (56.45) | 0.002 | -0.71 | < 0.001 |
| Vojvodina vs Central Serbia | star_risk | 45 / 2.80 | 99 / 3.00 | -2.25 (60.90) | 0.028 | -0.47 | 0.008 |
Note. The full set of 18 pre-specified Welch tests is reproduced in Supplementary Table S2.
Table 13.
Macroregional comparisons using classical ANOVA, Welch ANOVA, and Kruskal–Wallis sensitivity tests.
Table 13.
Macroregional comparisons using classical ANOVA, Welch ANOVA, and Kruskal–Wallis sensitivity tests.
| Variable | F | p | η² | Welch F | Welch p | H | KW p | ε² |
|---|---|---|---|---|---|---|---|---|
| Star_Risk | 4.07 | 0.019 | 0.049 | — | — | 8.24 | 0.016 | 0.040 |
| PIP | 0.72 | 0.488 | 0.009 | 1.69 | 0.195 | 2.27 | 0.321 | 0.002 |
| CHEB | 8.92 | < 0.001 | 0.101 | 14.70 | < 0.001 | 16.47 | < 0.001 | 0.092 |
| EW_PIP | 8.91 | < 0.001 | 0.101 | 14.32 | < 0.001 | 14.23 | < 0.001 | 0.077 |
| PRB | 7.04 | 0.001 | 0.082 | 10.11 | < 0.001 | 11.59 | 0.003 | 0.061 |
| IPDRI | 7.04 | 0.001 | 0.082 | 10.11 | < 0.001 | 11.59 | 0.003 | 0.061 |
| Struct_Susc | 10.05 | < 0.001 | 0.113 | — | — | 18.22 | < 0.001 | 0.103 |
| Hazard_Dynamics | 0.05 | 0.954 | 0.001 | — | — | 0.42 | 0.812 | -0.010 |
Note. Welch statistics are omitted where zero within-group variance prevented stable estimation.
Table 14.
Significant Holm-adjusted macroregional pairwise contrasts.
| Variable | Comparison | Means | Welch t (df) | Holm p | Hedges g |
|---|---|---|---|---|---|
| CHEB | Belgrade vs. Vojvodina | 2.00 vs. 2.53 | -2.29 (49.61) | 0.034 | -0.51 |
| CHEB | Belgrade vs. Central Serbia | 2.00 vs. 3.02 | -5.37 (30.87) | < 0.001 | -1.04 |
| CHEB | Vojvodina vs. Central Serbia | 2.53 vs. 3.02 | -2.44 (76.93) | 0.034 | -0.46 |
| EW_PIP | Belgrade vs. Vojvodina | 1.46 vs. 1.82 | -2.03 (44.97) | 0.048 | -0.47 |
| EW_PIP | Belgrade vs. Central Serbia | 1.46 vs. 2.31 | -5.26 (40.85) | < 0.001 | -0.88 |
| EW_PIP | Vojvodina vs. Central Serbia | 1.82 vs. 2.31 | -3.16 (105.15) | 0.004 | -0.52 |
| PRB | Belgrade vs. Central Serbia | 17.16 vs. 24.85 | -4.29 (35.24) | < 0.001 | -0.77 |
| PRB | Vojvodina vs. Central Serbia | 19.87 vs. 24.85 | -2.86 (94.47) | 0.010 | -0.49 |
| IPDRI | Belgrade vs. Central Serbia | 32.00 vs. 48.31 | -4.29 (35.24) | < 0.001 | -0.77 |
| IPDRI | Vojvodina vs. Central Serbia | 37.75 vs. 48.31 | -2.86 (94.47) | 0.010 | -0.49 |
| struct_susc | Belgrade vs. Vojvodina | 3.00 vs. 2.82 | 4.18 (44.00) | < 0.001 | 0.72 |
| struct_susc | Vojvodina vs. Central Serbia | 2.82 vs. 2.97 | -3.25 (56.45) | 0.004 | -0.71 |
Note. All 24 macroregional pairwise estimates are provided in Supplementary Table S3.
Table 15.
Advanced district-level ANOVA and robust sensitivity analyses for the derived burden measures.
Table 15.
Advanced district-level ANOVA and robust sensitivity analyses for the derived burden measures.
| Variable | F | p | η² | Welch F | Welch p | H | KW p | ε² |
|---|---|---|---|---|---|---|---|---|
| PIP | 3.98 | < 0.001 | 0.413 | — | — | 63.48 | < 0.001 | 0.290 |
| CHEB | 10.26 | < 0.001 | 0.644 | 26.86 | < 0.001 | 106.61 | < 0.001 | 0.607 |
| EW_PIP | 9.68 | < 0.001 | 0.631 | 18.12 | < 0.001 | 99.54 | < 0.001 | 0.555 |
| PRB | 7.65 | < 0.001 | 0.574 | 14.12 | < 0.001 | 93.55 | < 0.001 | 0.511 |
| IPDRI | 7.65 | < 0.001 | 0.574 | 14.12 | < 0.001 | 93.55 | < 0.001 | 0.511 |
Table 16.
Holm-significant district pairwise contrasts for IPDRI, CHEB, and PIP.
| Variable | District comparison | Means | Welch t (df) | Holm p | Hedges g |
|---|---|---|---|---|---|
| IPDRI | Grad Beograd vs. Moravički | 32.00 vs. 65.56 | -7.70 (10.17) | 0.004 | -2.70 |
| IPDRI | Grad Beograd vs. Mačvanski | 32.00 vs. 75.49 | -8.43 (14.98) | < 0.001 | -3.38 |
| IPDRI | Šumadijski vs. Moravički | 35.24 vs. 65.56 | -7.47 (7.14) | 0.035 | -4.11 |
| IPDRI | Šumadijski vs. Mačvanski | 35.24 vs. 75.49 | -8.20 (11.65) | 0.001 | -3.86 |
| IPDRI | Južno-Bački vs. Pirotski | 41.32 vs. 13.97 | 5.62 (12.57) | 0.026 | 2.10 |
| IPDRI | Južno-Bački vs. Mačvanski | 41.32 vs. 75.49 | -6.01 (16.66) | 0.004 | -2.54 |
| IPDRI | Moravički vs. Rasinski | 65.56 vs. 27.33 | 7.78 (7.99) | 0.015 | 4.15 |
| IPDRI | Moravički vs. Pirotski | 65.56 vs. 13.97 | 12.23 (5.98) | 0.005 | 7.52 |
| IPDRI | Moravički vs. Braničevski | 65.56 vs. 32.91 | 6.27 (9.89) | 0.027 | 2.87 |
| IPDRI | Moravički vs. Podunavski | 65.56 vs. 20.98 | 12.45 (4.63) | 0.027 | 7.26 |
| IPDRI | Moravički vs. Sremski | 65.56 vs. 19.87 | 9.19 (8.90) | 0.002 | 4.56 |
| IPDRI | Severno-Banatski vs. Pirotski | 49.14 vs. 13.97 | 9.22 (6.85) | 0.012 | 5.31 |
| IPDRI | Severno-Banatski vs. Podunavski | 49.14 vs. 20.98 | 9.10 (6.85) | 0.013 | 4.61 |
| IPDRI | Severno-Banatski vs. Sremski | 49.14 vs. 19.87 | 6.32 (9.90) | 0.025 | 3.14 |
| IPDRI | Rasinski vs. Mačvanski | 27.33 vs. 75.49 | -8.55 (11.90) | < 0.001 | -4.18 |
| IPDRI | Jablanički vs. Pirotski | 57.94 vs. 13.97 | 7.88 (7.62) | 0.018 | 4.01 |
| IPDRI | Jablanički vs. Sremski | 57.94 vs. 19.87 | 6.17 (10.14) | 0.027 | 3.23 |
| IPDRI | Pirotski vs. Mačvanski | 13.97 vs. 75.49 | -12.21 (9.96) | < 0.001 | -5.53 |
| IPDRI | Pirotski vs. Zlatiborski | 13.97 vs. 54.86 | -7.00 (12.00) | 0.004 | -2.69 |
| IPDRI | Pirotski vs. Pčinjski | 13.97 vs. 70.39 | -7.84 (7.94) | 0.015 | -3.52 |
| IPDRI | Braničevski vs. Mačvanski | 32.91 vs. 75.49 | -7.22 (14.00) | 0.001 | -3.41 |
| IPDRI | Podunavski vs. Mačvanski | 20.98 vs. 75.49 | -12.06 (8.83) | < 0.001 | -4.79 |
| IPDRI | Podunavski vs. Zlatiborski | 20.98 vs. 54.86 | -6.28 (10.68) | 0.019 | -2.16 |
| IPDRI | Mačvanski vs. Sremski | 75.49 vs. 19.87 | 9.78 (12.99) | < 0.001 | 4.72 |
| IPDRI | Mačvanski vs. Kolubarski | 75.49 vs. 28.52 | 7.36 (10.80) | 0.005 | 3.73 |
| IPDRI | Sremski vs. Zlatiborski | 19.87 vs. 54.86 | -5.46 (14.95) | 0.019 | -2.36 |
| IPDRI | Sremski vs. Pčinjski | 19.87 vs. 70.39 | -6.59 (9.75) | 0.019 | -3.30 |
| CHEB | Grad Beograd vs. Južno-Bački | 2.00 vs. 3.13 | -5.67 (26.66) | 0.001 | -1.92 |
| CHEB | Grad Beograd vs. Moravički | 2.00 vs. 3.66 | -7.33 (10.09) | 0.007 | -2.57 |
| CHEB | Grad Beograd vs. Pirotski | 2.00 vs. 1.03 | 5.23 (18.03) | 0.015 | 1.51 |
| CHEB | Grad Beograd vs. Mačvanski | 2.00 vs. 4.36 | -11.93 (22.82) | < 0.001 | -3.94 |
| CHEB | Grad Beograd vs. Zlatiborski | 2.00 vs. 3.87 | -7.64 (20.99) | < 0.001 | -2.85 |
| CHEB | Grad Beograd vs. Pčinjski | 2.00 vs. 4.08 | -7.31 (11.96) | 0.003 | -3.08 |
| CHEB | Šumadijski vs. Rasinski | 2.75 vs. 1.79 | 6.86 (8.02) | 0.033 | 3.69 |
| CHEB | Šumadijski vs. Pirotski | 2.75 vs. 1.03 | 15.07 (6.34) | < 0.001 | 8.65 |
| CHEB | Šumadijski vs. Mačvanski | 2.75 vs. 4.36 | -11.98 (11.11) | < 0.001 | -5.62 |
| CHEB | Šumadijski vs. Sremski | 2.75 vs. 1.19 | 8.10 (7.70) | 0.013 | 4.05 |
| CHEB | Šumadijski vs. Zlatiborski | 2.75 vs. 3.87 | -5.69 (11.31) | 0.032 | -2.28 |
| CHEB | Toplički vs. Mačvanski | 2.30 vs. 4.36 | -11.23 (7.05) | 0.003 | -6.01 |
| CHEB | Toplički vs. Zlatiborski | 2.30 vs. 3.87 | -6.71 (11.15) | 0.008 | -2.78 |
| CHEB | Toplički vs. Pčinjski | 2.30 vs. 4.08 | -6.46 (8.82) | 0.032 | -3.04 |
| CHEB | Južno-Bački vs. Rasinski | 3.13 vs. 1.79 | 7.89 (13.53) | < 0.001 | 3.36 |
| CHEB | Južno-Bački vs. Pirotski | 3.13 vs. 1.03 | 14.04 (12.23) | < 0.001 | 5.31 |
| CHEB | Južno-Bački vs. Mačvanski | 3.13 vs. 4.36 | -7.44 (17.23) | < 0.001 | -3.11 |
| CHEB | Južno-Bački vs. Sremski | 3.13 vs. 1.19 | 9.02 (11.18) | < 0.001 | 4.27 |
| CHEB | Moravički vs. Rasinski | 3.66 vs. 1.79 | 9.29 (6.17) | 0.019 | 5.52 |
| CHEB | Moravički vs. Pirotski | 3.66 vs. 1.03 | 14.24 (4.74) | 0.012 | 8.76 |
| CHEB | Moravički vs. Sremski | 3.66 vs. 1.19 | 10.26 (8.53) | 0.001 | 5.26 |
| CHEB | Moravički vs. Kolubarski | 3.66 vs. 2.05 | 6.72 (7.82) | 0.041 | 3.67 |
| CHEB | Severno-Banatski vs. Pirotski | 2.87 vs. 1.03 | 9.91 (7.43) | 0.004 | 5.00 |
| CHEB | Severno-Banatski vs. Mačvanski | 2.87 vs. 4.36 | -7.53 (9.70) | 0.006 | -3.91 |
| CHEB | Severno-Banatski vs. Sremski | 2.87 vs. 1.19 | 6.96 (11.00) | 0.007 | 3.54 |
| CHEB | Rasinski vs. Mačvanski | 1.79 vs. 4.36 | -15.31 (11.51) | < 0.001 | -7.61 |
| CHEB | Rasinski vs. Zaječarski | 1.79 vs. 2.87 | -6.71 (7.89) | 0.040 | -3.64 |
| CHEB | Rasinski vs. Zlatiborski | 1.79 vs. 3.87 | -9.39 (13.80) | < 0.001 | -3.91 |
| CHEB | Rasinski vs. Pčinjski | 1.79 vs. 4.08 | -8.65 (8.86) | 0.004 | -4.25 |
| CHEB | Jablanički vs. Pirotski | 3.26 vs. 1.03 | 8.39 (6.23) | 0.032 | 4.06 |
| CHEB | Jablanički vs. Sremski | 3.26 vs. 1.19 | 6.75 (9.42) | 0.017 | 3.57 |
| CHEB | Pirotski vs. Pomoravski | 1.03 vs. 2.90 | -7.77 (6.50) | 0.040 | -3.79 |
| CHEB | Pirotski vs. Braničevski | 1.03 vs. 2.37 | -7.33 (9.87) | 0.007 | -3.19 |
| CHEB | Pirotski vs. Mačvanski | 1.03 vs. 4.36 | -22.55 (9.72) | < 0.001 | -10.49 |
| CHEB | Pirotski vs. Zaječarski | 1.03 vs. 2.87 | -13.21 (5.87) | 0.004 | -8.12 |
| CHEB | Pirotski vs. Zlatiborski | 1.03 vs. 3.87 | -13.76 (11.81) | < 0.001 | -5.16 |
| CHEB | Pirotski vs. Pčinjski | 1.03 vs. 4.08 | -12.09 (7.59) | < 0.001 | -5.38 |
| CHEB | Pomoravski vs. Sremski | 2.90 vs. 1.19 | 5.99 (10.08) | 0.033 | 3.13 |
| CHEB | Braničevski vs. Mačvanski | 2.37 vs. 4.36 | -10.11 (12.85) | < 0.001 | -4.78 |
| CHEB | Braničevski vs. Zlatiborski | 2.37 vs. 3.87 | -6.13 (15.99) | 0.004 | -2.69 |
| CHEB | Braničevski vs. Pčinjski | 2.37 vs. 4.08 | -6.01 (10.81) | 0.024 | -2.99 |
| CHEB | Podunavski vs. Mačvanski | 2.00 vs. 4.36 | -12.79 (4.88) | 0.016 | -6.90 |
| CHEB | Podunavski vs. Zlatiborski | 2.00 vs. 3.87 | -7.99 (8.75) | 0.007 | -3.23 |
| CHEB | Podunavski vs. Pčinjski | 2.00 vs. 4.08 | -7.55 (7.98) | 0.017 | -3.40 |
| CHEB | Mačvanski vs. Sremski | 4.36 vs. 1.19 | 14.83 (10.50) | < 0.001 | 7.41 |
| CHEB | Mačvanski vs. Zaječarski | 4.36 vs. 2.87 | 9.52 (9.03) | 0.001 | 4.62 |
| CHEB | Mačvanski vs. Kolubarski | 4.36 vs. 2.05 | 10.87 (9.01) | < 0.001 | 5.74 |
| CHEB | Sremski vs. Zaječarski | 1.19 vs. 2.87 | -8.07 (8.76) | 0.007 | -3.78 |
| CHEB | Sremski vs. Zlatiborski | 1.19 vs. 3.87 | -10.39 (14.55) | < 0.001 | -4.68 |
| CHEB | Sremski vs. Pčinjski | 1.19 vs. 4.08 | -9.77 (11.24) | < 0.001 | -4.89 |
| CHEB | Severno-Bački vs. Pčinjski | 1.05 vs. 4.08 | -8.74 (5.52) | 0.048 | -4.70 |
| CHEB | Zlatiborski vs. Kolubarski | 3.87 vs. 2.05 | 7.08 (13.11) | 0.002 | 3.21 |
| CHEB | Kolubarski vs. Pčinjski | 2.05 vs. 4.08 | -6.88 (10.66) | 0.008 | -3.46 |
| PIP | Grad Beograd vs. Podunavski | 8.65 vs. 6.00 | 10.95 (16.00) | < 0.001 | 2.70 |
| PIP | Grad Beograd vs. Srednje-Banatski | 8.65 vs. 6.00 | 10.95 (16.00) | < 0.001 | 2.86 |
| PIP | Moravički vs. Podunavski | 9.00 vs. 6.00 | — (—) | < 0.001 | — |
| PIP | Moravički vs. Srednje-Banatski | 9.00 vs. 6.00 | — (—) | < 0.001 | — |
| PIP | Severno-Banatski vs. Podunavski | 8.83 vs. 6.00 | 17.00 (5.00) | 0.004 | 7.30 |
| PIP | Severno-Banatski vs. Srednje-Banatski | 8.83 vs. 6.00 | 17.00 (5.00) | 0.004 | 8.51 |
| PIP | Jablanički vs. Podunavski | 9.00 vs. 6.00 | — (—) | < 0.001 | — |
| PIP | Jablanički vs. Srednje-Banatski | 9.00 vs. 6.00 | — (—) | < 0.001 | — |
| PIP | Podunavski vs. Zapadno-Bački | 6.00 vs. 9.00 | — (—) | < 0.001 | — |
| PIP | Zapadno-Bački vs. Srednje-Banatski | 9.00 vs. 6.00 | — (—) | < 0.001 | — |
Note. Ninety Holm-significant contrasts are shown. The accompanying statistical workbook includes all 900 pairwise estimates, including non-significant comparisons.
Table 17.
Non-circular HC3 regression model for the analytical probability–impact product.
| Predictor | B | HC3 SE | 95% CI | p |
|---|---|---|---|---|
| Intercept | 8.699 | 0.966 | [6.806, 10.593] | < 0.001 |
| CHEB | -0.034 | 0.137 | [-0.302, 0.235] | 0.806 |
| Data confidence | -0.212 | 0.349 | [-0.896, 0.472] | 0.544 |
| Vojvodina vs Central Serbia | -0.028 | 0.349 | [-0.711, 0.656] | 0.937 |
Note. N = 161; R² = 0.012; adjusted R² = −0.014; model p = 0.406. We excluded probability, impact, vulnerability, and coping capacity from the predictor set to avoid direct mathematical coupling.
Table 18.
Exploratory non-circular ordered-logit model for the supplied STAR risk category.
| Predictor | B | SE | p | Odds ratio | 95% CI OR |
|---|---|---|---|---|---|
| CHEB | -0.535 | 0.220 | 0.015 | 0.586 | [0.380, 0.902] |
| Data confidence | -0.389 | 0.551 | 0.480 | 0.678 | [0.230, 1.994] |
| Vojvodina vs Central Serbia | -1.610 | 0.510 | 0.002 | 0.200 | [0.073, 0.543] |
| Belgrade vs Central Serbia | -0.629 | 0.801 | 0.432 | 0.533 | [0.111, 2.561] |
Table 19.
Agreement between the PIP-derived risk-matrix category and the supplied STAR risk category.
Table 19.
Agreement between the PIP-derived risk-matrix category and the supplied STAR risk category.
| Agreement metric | Value |
|---|---|
| Exact agreement | 75.8% |
| Disagreement | 39 units |
| Weighted κ (linear) | 0.458 |
| Weighted κ (quadratic) | 0.484 |
Table 20.
Profiles of the three exploratory local risk clusters.
| Cluster | n | Frequency | CHEB | Vulnerability | Capacity | Probability | Impact | STAR risk | PIP | IPDRI |
|---|---|---|---|---|---|---|---|---|---|---|
| 1 | 137 | 3.06 | 2.81 | 3.00 | 3.02 | 3.03 | 2.78 | 3.01 | 8.41 | 45.45 |
| 2 | 14 | 3.00 | 2.37 | 2.00 | 2.93 | 3.07 | 2.07 | 2.57 | 6.36 | 27.58 |
| 3 | 10 | 2.80 | 2.86 | 3.00 | 2.00 | 2.70 | 2.80 | 2.60 | 7.60 | 41.34 |
Note. Higher capacity code denotes poorer coping capacity. K-means used standardized frequency, CHEB, vulnerability, and coping-capacity code.
Table 21.
Twenty local administrative units with the highest Integrated Portfolio Disaster Risk Index.
Table 21.
Twenty local administrative units with the highest Integrated Portfolio Disaster Risk Index.
| Rank | District | Local unit | IPDRI | PRB | CHEB | PIP | STAR risk | Burden class | Cluster |
|---|---|---|---|---|---|---|---|---|---|
| 1 | Zapadno-Bački | Odžaci | 100.00 | 49.19 | 5.47 | 9.00 | 3 | Very high | 1 |
| 2 | Raški | Tutin | 99.49 | 48.95 | 4.08 | 12.00 | 4 | Very high | 1 |
| 3 | Nišavski | Niš | 98.96 | 48.70 | 5.41 | 9.00 | 3 | Very high | 1 |
| 4 | Nišavski | Aleksinac | 87.69 | 43.39 | 4.82 | 9.00 | 3 | Very high | 1 |
| 5 | Pčinjski | Trgovište | 86.73 | 42.94 | 4.77 | 9.00 | 3 | Very high | 1 |
| 6 | Mačvanski | Krupanj | 86.12 | 42.65 | 4.74 | 9.00 | 3 | Very high | 1 |
| 7 | Mačvanski | Mali Zvornik | 86.12 | 42.65 | 4.74 | 9.00 | 3 | Very high | 1 |
| 8 | Pčinjski | Bosilegrad | 85.51 | 42.36 | 4.71 | 9.00 | 3 | Very high | 1 |
| 9 | Pčinjski | Vranje | 84.23 | 41.76 | 4.64 | 9.00 | 3 | Very high | 1 |
| 10 | Mačvanski | Koceljeva | 83.06 | 41.21 | 4.58 | 9.00 | 3 | Very high | 1 |
| 11 | Mačvanski | Ljubovija | 80.39 | 39.95 | 4.44 | 9.00 | 3 | Very high | 1 |
| 12 | Zlatiborski | Sjenica | 79.10 | 39.34 | 4.37 | 9.00 | 3 | Very high | 1 |
| 13 | Jablanički | Crna Trava | 79.09 | 39.34 | 4.37 | 9.00 | 3 | Very high | 1 |
| 14 | Zlatiborski | Prijepolje | 78.23 | 38.93 | 4.33 | 9.00 | 3 | Very high | 1 |
| 15 | Mačvanski | Bogatić | 76.41 | 38.08 | 4.23 | 9.00 | 3 | Very high | 1 |
| 16 | Zapadno-Bački | Sombor | 74.46 | 37.16 | 4.13 | 9.00 | 3 | Very high | 1 |
| 17 | Nišavski | Doljevac | 73.48 | 36.70 | 4.08 | 9.00 | 3 | Very high | 1 |
| 18 | Pčinjski | Surdulica | 71.58 | 35.80 | 3.98 | 9.00 | 3 | Very high | 1 |
| 19 | Nišavski | Svrljig | 71.50 | 35.77 | 3.97 | 9.00 | 3 | Very high | 1 |
| 20 | Moravički | Ivanjica | 71.30 | 35.67 | 3.96 | 9.00 | 3 | Very high | 1 |
Disclaimer/Publisher’s Note: The statements, opinions and data contained in all publications are solely those of the individual author(s) and contributor(s) and not of MDPI and/or the editor(s). MDPI and/or the editor(s) disclaim responsibility for any injury to people or property resulting from any ideas, methods, instructions or products referred to in the content. |
© 2026 by the authors. Licensee MDPI, Basel, Switzerland. This article is an open access article distributed under the terms and conditions of the Creative Commons Attribution (CC BY) license (http://creativecommons.org/licenses/by/4.0/).
Copyright: This open access article is published under a Creative Commons CC BY 4.0 license, which permit the free download, distribution, and reuse, provided that the author and preprint are cited in any reuse.