

Submitted:
15 September 2026
Posted:
16 September 2026
You are already at the latest version
Abstract
Ski piste development and management provide recreational and economic benefits in mountain regions. However, piste development and management often introduce anthropogenic disturbances: slope grading, technical snowmaking, and infrastructure installation may alter soil properties, vegetation structure, and microclimatic conditions, raising concerns about potential impacts on soil biochemical functioning. This study evaluated the impact of ski-piste management on soil microbial activity across one medium‑sized (MS) and three small‑sized (SS) ski resorts. Paired piste (P)-control (C) plots were established, and sampling was conducted over two consecutive summers in MS and for one year in SS ski resorts. Comparisons between P and adjacent C soils showed no statistically significant differences (p > 0.05) in enzymatic activity or microbial biomass in both ski resorts. In contrast, interannual variation was associated with significant differences in microbial biomass and most enzyme activities (p < 0.05). Piste soils consistently exhibited higher pH than control soils, although this shift did not correspond to detectable changes in biochemical functioning. Overall, ski piste management did not significantly affect soil biochemical functioning under the conditions investigated, whereas interannual variability appeared to be more strongly driven by differences in soil moisture and snow cover. Continued monitoring at broader spatial and temporal scales is essential to assess the long‑term ecological consequences of ski resorts in mountain grasslands.
Keywords:
piste soils
; control soils
; enzyme activity
; microbial biomass
; mountain grasslands
; ski resorts
; Southern Alps
1. Introduction
Ski piste construction and subsequent management can perturb mountain ecosystems in diverse ways: they can lead to land-use and land-cover change, primarily through piste grading [1], but also through the establishment of ski resort infrastructures, including ski lifts, water reservoirs, and water transport systems for snowmaking. Technical snow input is essential to ensure the skiing season [2,3], and it may alter soil properties, causing a local water surplus due to snowmelt at the end of the winter season [2,4,5]. Part of this water cannot infiltrate into the soil profile because the soil on ski pistes is often compacted, thereby reducing its infiltration and permeability [6].
Snow compaction may also lead to periodic anoxia since the soil freezing under the snow cover could impede gas exchange between the soil and the atmosphere [7]. Soil freezing may occur more frequently on ski pistes because of the snow compaction, which reduces the snow depth and increases its density by decreasing its insulation capacity [8]. Rixen et al. [9,10] reported that ground temperature under the compacted natural snow cover on ski slopes can reach as low as -12 °C. Furthermore, the frequency of freeze-thaw cycles in the absence of the natural snow cover is increased [11]. The soil insulation guaranteed by the natural snow cover plays a critical role in the soil nutrient cycle, as preserving a soil temperature higher than the air temperature allows the activity of soil microorganisms, which can produce exoenzymes crucial for the C and N cycles [12].
Changes in land use may affect soil quality, intended as “the capacity of a specific kind of soil to function, within natural or managed ecosystem boundaries, to sustain plant and animal productivity, maintain or enhance water and air quality, and support human health and habitation” [13]. Soil quality is considered “poor” from a physical point of view when water infiltration is low and aeration is scarce [14]. These conditions are common on ski pistes, where they also increase the risk of erosion and consequently contribute to land degradation [15]. The topsoil of the ski pistes may also be altered by the removal of obstacles such as stones and vegetation, which could reduce A- and part of the B-soil horizons [1,16] . Ski pistes may have poor soils in terms of nutrient content and lower C and N compared to natural control sites [17,18]. The addition of technical snow can provide an extra input of mineral elements and increase soil pH on the ski piste, because often both its electrical conductivity (EC) and pH are higher than those of natural precipitation [19,20]. An increase in pH could be a further factor affecting the soil microbial community, since each enzyme has an optimum pH range for its activity [21,22]. For example, the ratio of acid- to alkaline-phosphomonoesterase may detect shifts in soil pH earlier than chemical detection [23,24].
Vegetation also represents a significant source of variation for the soil microbial community. Several studies report differences in vegetation types between ski pistes and adjacent areas [17,19,25,26]. In particular, it has been noticed that shifts from plants adapted to low-nutrient conditions to plants typical of mesotrophic habitats have been observed [25]. Since vegetation and soil interact, different plant species may affect the abiotic and biotic environments [27].
Taken together, repeated soil grading, vegetation removal, grooming, soil compaction, and technical snow production constitute interacting disturbance factors that may alter soil habitat conditions and have long-term consequences for soil functioning and microbial communities.
Soil enzymes could give an estimate of microbial community structure and activity. Gros et al. [18] reported that lower microbial growth and enzymatic activity were observed on ski pistes, compared to undisturbed adjacent sites, attributed to lower temperatures and a shorter growing season, together with less favorable soil conditions on the ski pistes. They also found that ski run construction, particularly ski grooming, adversely affected soil microbial activity, as other studies on the effects of tillage have shown [28]. Moreover, bacterial community richness can also be affected by snow properties and snow presence. Previous studies reported a decline in bacterial community richness following snow removal at experimental sites [29].
There are studies focusing only on the impact of ski pistes on soil properties [15,17,30,31]. However, there are few findings on the effects of ski pistes on both soil enzymatic and microbial functions. Soil enzyme activity is a useful tool for measuring the response of soil to natural and anthropogenic factors, such as agricultural or pollution effects, because it is affected by all the processes occurring in the soil [32]. Therefore, it can be used as an indicator of ecosystem perturbation or soil quality [33], to evaluate the sustainability of land management practices [34] and also in relation to changes in land use [35], and in climatic conditions [36]. Sowerby et al. [37]measured changes in microbial activity by analyzing soil enzymes following a 0.9 °C increase in soil temperature.
Starting from the results of previous publications [19], the activity of soil enzymes and the microbial biomass were measured with the aim of studying the impact of ski pistes on the soil microbial community and their activity.
Lower enzymatic activity was expected on the ski pistes than in the surrounding natural areas, due to the higher land-use intensity and the associated changes in soil pH. This research was undertaken in the Southern Alps (Italy), in a ski area where technical snow is widely used to extend the skiing season in medium-sized (4-5 months) and small-sized (2-3 months) ski resorts. At the study site, the total precipitation recorded in January, February, and March 2016 was 65.6 mm, whereas only 38.5 mm was recorded during the same months in 2017 [38]. Therefore, during the winter of 2016-2017, the lack of snow outside the ski pistes may have resulted in soil temperatures that were as low as those on the ski pistes (the mean absolute soil temperatures were similar in the control plots and on the ski pistes; [19], potentially leading to a different response of microbial activity compared with the previous winter.
This study addressed two main research questions: 1) How do ski pistes affect the activity of hydrolytic soil enzymes, acP: alkP, dsDNA (proxy microbial biomass) and soil pH, when comparing control and piste plots in a medium-sized ski resort (MS) and in small-sized ski resorts (SS) in 2016 and 2017? 2) How do year-to-year variations, particularly with normal precipitation in the first trial year (2016) versus dry conditions in the second trial year (2017), influence the effects of ski piste management on soil pH, microbial biomass and hydrolytic soil enzyme activities at the MS ski resort?
2. Materials and Methods
2.1. Study Site
The present study assessed four ski resorts situated in South Tyrol, in the Southern Alps (Figure 1). The climate in the region is boreal with warm summers. Yearly average annual precipitation is about 826 mm, and the average annual temperature is 7.1 °C, based on records from 2011 to 2016 (Autonomous Province of Bozen-Bolzano, South Tyrol). All ski resorts lie on dolomitic bedrock and employ technical snow to guarantee and extend the ski season.
22 squared experimental plots of 16 m2 (4 m × 4 m) were built on 14 ski pistes, following a pairwise design of plots on the ski piste (P) and corresponding control plots (C) with similar elevation and exposure in the natural surroundings, for a direct comparative analysis. Site 1 (S1) is a representative medium-sized ski resort with a total of 49 km of slopes; there, sampling began in June 2016, whereas the other three ski resorts (S2, S3, S4) are smaller (0.6-7 km of pistes) and were added in June 2017 (for plots characteristics, see Figure 1 and Table 1). The experimental plots were selected after excluding areas that had undergone recent modifications or revegetation interventions.
2.2. Soil Sample Collection and Preparations
Collection of soil samples began in July 2016 at the MS ski resort (the only site monitored for two consecutive years), designated as site one (S1). From each plot, three soil cores (0.03 m diameter) were taken from the A-horizon (0-10 cm depth) at three randomly chosen points of all the experimental plots. The same soil sampling was repeated from July to August 2017 in S1, S2, S3, and S4. The soil cores were directly transported to the laboratory and air-dried. The three soil cores collected from each plot were pooled, sieved through a 2-mm mesh and thoroughly homogenized.
2.3. Soil Enzyme Activity and dsDNA Analysis
Soil enzyme activities were quantified in soil extracts obtained by a heteromolecular exchange procedure using lysozyme as a desorbant [39]. The 300 mg of dry soil was placed in a 2-ml Eppendorf tube, together with 0.4 ml of 80-m-diameter glass beads and 0.4 ml of 1000-m-diameter ceramic beads, after the addition of 1.4 ml of 3% lysozyme solution (pH 7.0). The tubes were subjected to bead-beating using the MM 400 beating mill (Retsch, Haan, Germany) to disrupt aggregates and microbial cells. Tubes were then centrifuged at 20,000 g for 2 minutes. An aliquot of the supernatant containing desorbed enzymes was dispensed into 384-well white microplates with the appropriate buffer to fluorometrically quantify the enzymatic activities using fluorogenic 4-methyl-umbelliferyl (MUF) and 4-amido-7-methyl-coumarin (AMC) substrates. All measurements were performed in duplicate, and the activities were expressed as nanomoles (nmol) of MUF (or AMC) h-1 g-1 dry soil. 17 hydrolytic soil enzymes were assayed: α-glucosidase (α-G), β-glucosidase (β-G), α-galactosidase (α-GAL), β-galactosidase (β-GAL), α-mannosidase (α-MAN), β-mannosidase (β-MAN), glucuronidase (uroni), cellobiohydrolase (cell), xilosidase (xilo), chitinase (chit), leucine-aminopeptidase (leu), tripsin-like protease (trip), acid-phosphomonoesterase (acP), alkaline-phosphomonoesterase (alkP), phospho-diesterase (bisP), and pyrophosphate-phosphodiesterase (piroP) are P-cycling; arylsulphatase (aryS).
Microbial biomass was estimated by quantifying double-stranded DNA (dsDNA), according to [40]. The soil dsDNA (microbial biomass) was extracted using a procedure similar to that described for soil enzyme extraction, except the extractant was 0.12 M, pH 7.8 sodium phosphate buffer. An aliquot of extract was diluted, and dsDNA was quantified using Pico Green reagent (Invitrogen) in black microplates. The dsDNA concentrations, expressed as µg g−1 dry soil, were used as a proxy for microbial biomass quantification [40].
2.4. Soil pH Determination
Soil pH was measured in soil extracts using a 1:2.5 soil-to-deionized water ratio. pH was determined by both a standard potentiometric method (glass electrode) and using pH indicators in a 96-well microplate, according to Fornasier and Di Marco [41]. The purpose of applying two methods for soil pH was to compare their results, as the new microplate and indicator-based method is 5-10 times faster than the potentiometric method.
2.5. Statistical Analysis
Soil enzyme activities (17 hydrolytic soil enzymes) nmol g-1 dry soil h-1, the acP: alkP ratio, dsDNA (as a proxy for microbial biomass) µg g−1 soil and soil pH were analyzed using the paired t-test. Comparisons were conducted at two levels: (i) within each ski size class (MS: C vs. P plots; equally, in SS ski: C vs. P plots), and (ii) across experimental years (2016 vs. 2017) in the MS ski resort only. To increase statistical power while preserving plot-level independence, data from the three SS ski resort sites (S2, S3, and S4) were grouped for analysis purposes only.
Principal component analysis (PCA) was applied as an exploratory method to condense the covariance structure among 19 continuous variables. Analyses were made separately for the MS ski resort (two years) and the SS ski resorts (single year). Variables were z-standardized, and PCA was run on correlation matrices using prcomp in R. The first two components (PC1, PC2) were retained, with importance assessed via eigenvalues and variance explained (scree plots). Sample scores were also visualized in score plots and biplots, with grouping factors (plot, ski size, year, identity) used only for point coloring or shape. Data ellipses (68% confidence) illustrated dispersion without implying significance. PCA was strictly descriptive; apparent separations were formally tested with a linear mixed-effects model.
Linear mixed-effects models (LMMs) provided the primary inferential framework. Separate models were fitted for each response variable by applying lme4 with Restricted Maximum Likelihood (REML) estimation and Satterthwaite’s approximation (lmerTest). Marginal means were obtained through emmeans; model fit was evaluated with log-likelihood, AIC, and marginal/conditional (R2) [42] .
In the MS ski resort, the response∼ treatment × year + (1∣ plot) (formal inference) was applied. Fixed effects included treatment, year, and their interaction, and plot identity was a random intercept. Singular fits (with near-zero random variance) were retained to avoid disrupting the existing design.
However, in SS ski resorts, the response∼ treatment + (1∣ resort) (exploratory) model was used. Here, treatment was a fixed effect, and resort identity was a random intercept. Limited replication and frequent singular fits restricted inference, so the SS ski analyses were treated as descriptive. The same structures were applied to the PCA axis scores.
In the multiple testing, the false discovery rate (FDR) correction was applied to p-values for treatment effects across enzyme models. Inferences emphasized on consistent patterns, with primary weight given to the MS ski dataset. Lastly, we examined the autocorrelation structure within and among soil enzyme groups, and between these groups and soil pH. All data analyses were conducted in R (v4.6.0) using tidyverse, factoextra, lme4, lmerTest, and emmeans packages.
3. Results
3.1. Soil Enzyme Activity Dynamics Across Ski-Size Categories and Spatiotemporal Variability
At a medium-sized ski resort (S1), all the assessed hydrolytic soil enzyme activities, including acP: alkP ratio (Figure 3 and Figure 4), and the dsDNA (as a proxy measurement for microbial biomass), expressed in µg g-1 of soil (Figure 2a-c) showed no statistically significant differences between control and piste plots, both in 2016 and 2017 experimental years (p < 0.05). For some enzymes, minor shifts in enzymatic activity were observed in 2017: acP, alkP, α-G, trip, and the acP: alkP ratio were higher in C-plots than in P-plots. Whereas the β-G, cell, and chit were likewise higher in P-soils than in C-soils; however, none of these differences were statistically significant.
Figure 2.
dsDNA-based microbial biomass responses to spatiotemporal changes. a) dsDNA in MS (=medium-size) C vs. P in 2016, n=13; b) dsDNA in MS (=medium-size) C vs. P in 2017, n= 14; c) dsDNA in SS (= small-size) C vs. P in 2017, n= 8; d) 2016 vs. 2017 trial years, n= 13, n=14 respectively. C= Control; P= Piste.
Figure 2.
dsDNA-based microbial biomass responses to spatiotemporal changes. a) dsDNA in MS (=medium-size) C vs. P in 2016, n=13; b) dsDNA in MS (=medium-size) C vs. P in 2017, n= 14; c) dsDNA in SS (= small-size) C vs. P in 2017, n= 8; d) 2016 vs. 2017 trial years, n= 13, n=14 respectively. C= Control; P= Piste.
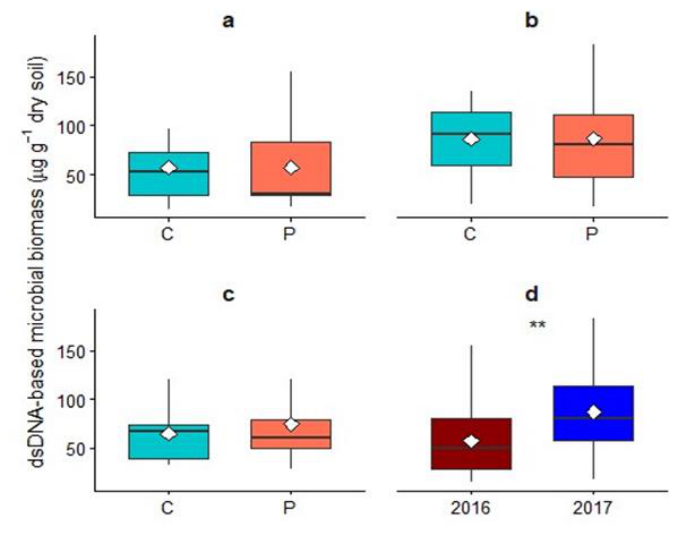
Figure 3.
Enzyme activity (nmol g-1 soil h-1) in MS (=medium-size) ski resort, in 2016 soil samples (n =13): a) acid-phosphomonoesterase (acP); b) acid-phosphomonoesterase to alkaline-phosphomonoesterase ratio (acP: alkP); c) α-glucosidase (α-G); d) α-galactosidase (α-GAL); e) α-mannosidase (α-MAN); f) alkaline-phosphomonoesterase (alkP); g) arylsulphatase (aryS); h) β-glucosidase (β-G); i) β-galactosidase (β-GAL); j) β-mannosidase (β-MAN); k) phospho-diesterase (bisP); l) cellobiohydrolase (cell); m) chitinase (chit); n) leucine-aminopeptidase (leu); o) pyrophosphate-phosphodiesterase (piroP); p) tripsin-like protease (trip); q) glucuronidase (uroni); r) xilosidase (xilo). Box plots indicate means (◇) of the plots; C = Control; P = Piste; ns = not significant differences between controls and ski pistes according to paired t-test.
Figure 3.
Enzyme activity (nmol g-1 soil h-1) in MS (=medium-size) ski resort, in 2016 soil samples (n =13): a) acid-phosphomonoesterase (acP); b) acid-phosphomonoesterase to alkaline-phosphomonoesterase ratio (acP: alkP); c) α-glucosidase (α-G); d) α-galactosidase (α-GAL); e) α-mannosidase (α-MAN); f) alkaline-phosphomonoesterase (alkP); g) arylsulphatase (aryS); h) β-glucosidase (β-G); i) β-galactosidase (β-GAL); j) β-mannosidase (β-MAN); k) phospho-diesterase (bisP); l) cellobiohydrolase (cell); m) chitinase (chit); n) leucine-aminopeptidase (leu); o) pyrophosphate-phosphodiesterase (piroP); p) tripsin-like protease (trip); q) glucuronidase (uroni); r) xilosidase (xilo). Box plots indicate means (◇) of the plots; C = Control; P = Piste; ns = not significant differences between controls and ski pistes according to paired t-test.
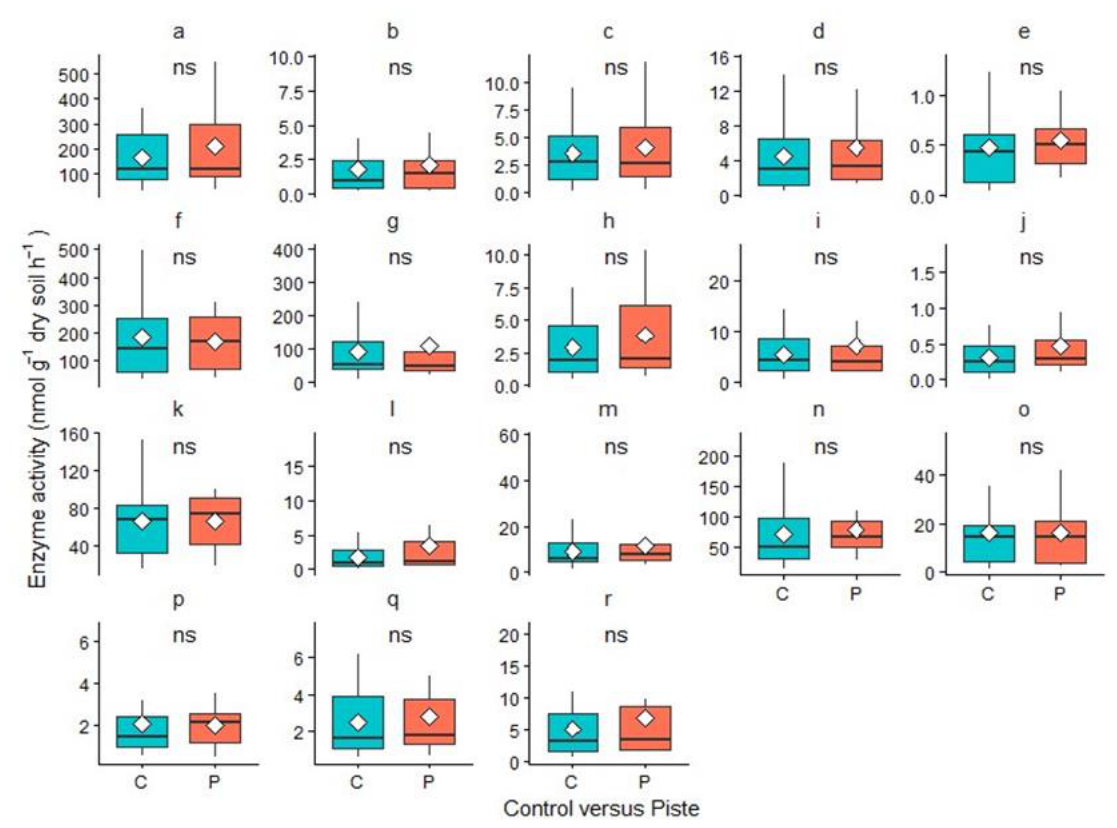
Figure 4.
Enzyme activity (nmol g-1 soil h-1) in MS (=medium-size) ski resort, in 2017 soil samples (n =14): a) acid-phosphomonoesterase (acP); b) acid-phosphomonoesterase to alkaline-phosphomonoesterase ratio (acP: alkP); c) α-glucosidase (α-G); d) α-galactosidase (α-GAL); e) α-mannosidase (α-MAN); f) alkaline-phosphomonoesterase (alkP); g) arylsulphatase (aryS); h) β-glucosidase (β-G); i) β-galactosidase (β-GAL); j) β-mannosidase (β-MAN); k) phospho-diesterase (bisP); l) cellobiohydrolase (cell); m) chitinase (chit); n) leucine-aminopeptidase (leu); o) pyrophosphate-phosphodiesterase (piroP); p) tripsin-like protease (trip); q) glucuronidase (uroni); r) xilosidase (xilo). Box plots indicate means (◇) of the plots; C = Control; P = Piste; ns = not significant differences between controls and ski pistes according to paired t-test.
Figure 4.
Enzyme activity (nmol g-1 soil h-1) in MS (=medium-size) ski resort, in 2017 soil samples (n =14): a) acid-phosphomonoesterase (acP); b) acid-phosphomonoesterase to alkaline-phosphomonoesterase ratio (acP: alkP); c) α-glucosidase (α-G); d) α-galactosidase (α-GAL); e) α-mannosidase (α-MAN); f) alkaline-phosphomonoesterase (alkP); g) arylsulphatase (aryS); h) β-glucosidase (β-G); i) β-galactosidase (β-GAL); j) β-mannosidase (β-MAN); k) phospho-diesterase (bisP); l) cellobiohydrolase (cell); m) chitinase (chit); n) leucine-aminopeptidase (leu); o) pyrophosphate-phosphodiesterase (piroP); p) tripsin-like protease (trip); q) glucuronidase (uroni); r) xilosidase (xilo). Box plots indicate means (◇) of the plots; C = Control; P = Piste; ns = not significant differences between controls and ski pistes according to paired t-test.
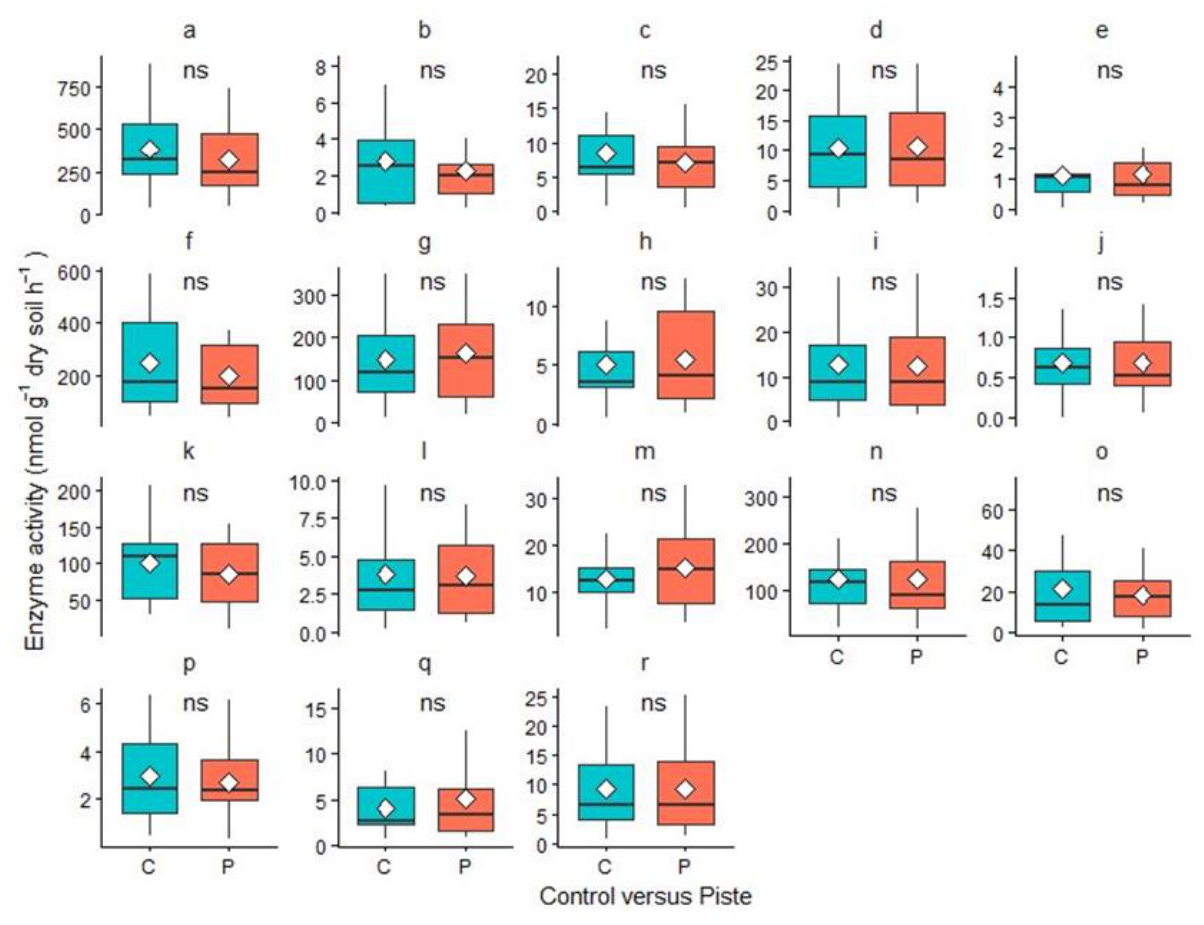
After the comparison of the functional groups of the tested hydrolytic soil enzymes linked with the carbon (C), nitrogen (N), sulfur (S) and phosphorus (P) cycling, it emerges that all groups showed similar seasonal trends and magnitudes of variation across the two sampling years and between C and P plots. In 2017, some mean enzymatic activities in P-samples were lower than in the control plots, but still, the differences were not statistically significant.
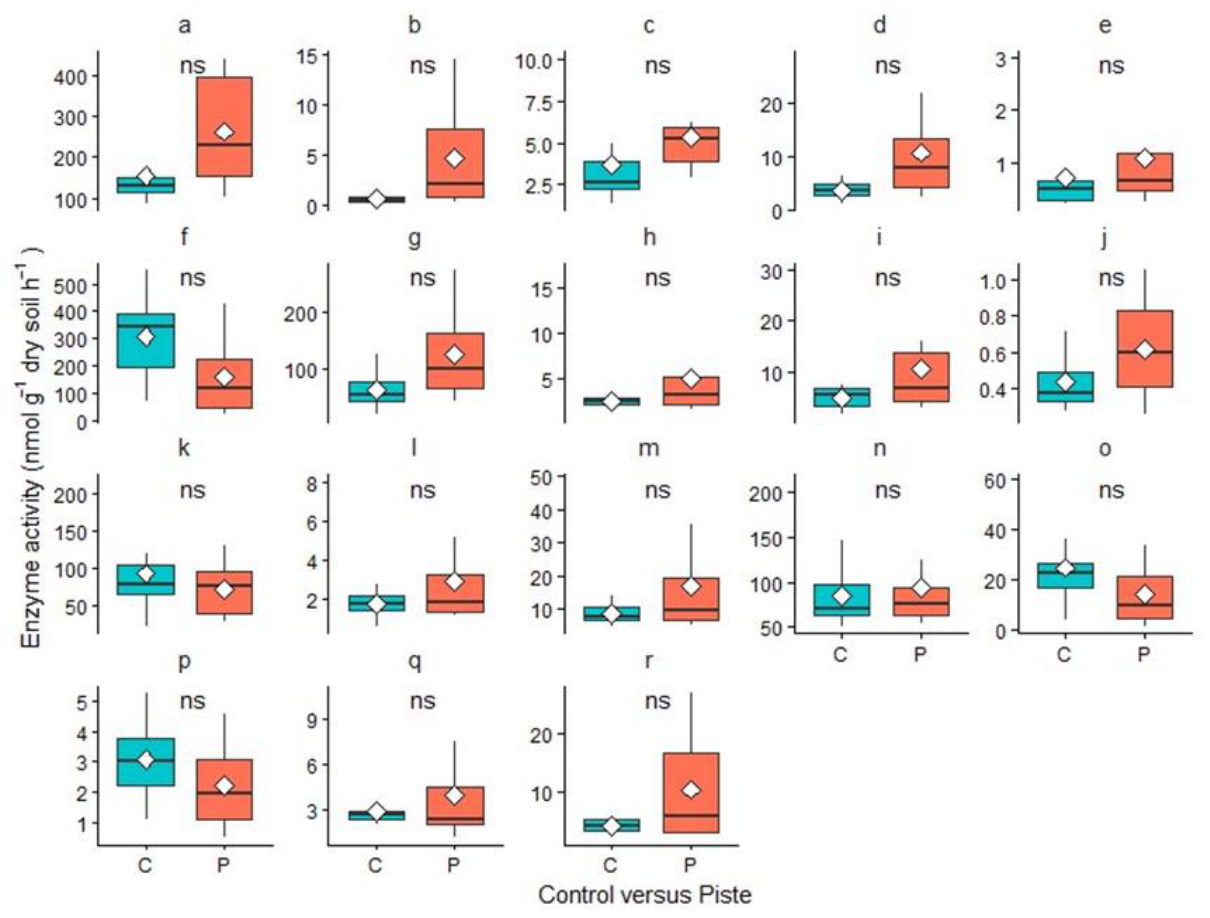
A similar trend was observed in the SS ski resorts (Sites 2, 3, and 4) in 2017, where none of the hydrolytic soil enzyme activities showed statistically significant differences between C and P soils. For instance, activities of phosphorus-cycling enzymes (bisP, piroP, trip, the alkP: acP ratio), plus uroni and dsDNA (as a proxy for microbial biomass) showed moderate reductions of the total enzymatic activity and microbial biomass in the piste plots; yet again, these differences were not statistically significant (p > 0.05; Figure 4).
Figure 5.
Enzyme activity (nmol g-1 soil h-1) in SS (=small-size) ski resorts, in 2017 soil samples (n =8): a) acid-phosphomonoesterase (acP); b) acid-phosphomonoesterase to alkaline-phosphomonoesterase ratio (acP: alkP); c) α-glucosidase (α-G); d) α-galactosidase (α-GAL); e) α-mannosidase (α-MAN); f) alkaline-phosphomonoesterase (alkP); g) arylsulphatase (aryS); h) β-glucosidase (β-G); i) β-galactosidase (β-GAL); j) β-mannosidase (β-MAN); k) phospho-diesterase (bisP); l) cellobiohydrolase (cell); m) chitinase (chit); n) leucine-aminopeptidase (leu); o) pyrophosphate-phosphodiesterase (piroP); p) tripsin-like protease (trip); q) glucuronidase (uroni); r) xilosidase (xilo). Box plots indicate means (◇) of the plots; C = Control; P = Piste; ns = not significant differences between controls and ski pistes according to paired t-test.
Figure 5.
Enzyme activity (nmol g-1 soil h-1) in SS (=small-size) ski resorts, in 2017 soil samples (n =8): a) acid-phosphomonoesterase (acP); b) acid-phosphomonoesterase to alkaline-phosphomonoesterase ratio (acP: alkP); c) α-glucosidase (α-G); d) α-galactosidase (α-GAL); e) α-mannosidase (α-MAN); f) alkaline-phosphomonoesterase (alkP); g) arylsulphatase (aryS); h) β-glucosidase (β-G); i) β-galactosidase (β-GAL); j) β-mannosidase (β-MAN); k) phospho-diesterase (bisP); l) cellobiohydrolase (cell); m) chitinase (chit); n) leucine-aminopeptidase (leu); o) pyrophosphate-phosphodiesterase (piroP); p) tripsin-like protease (trip); q) glucuronidase (uroni); r) xilosidase (xilo). Box plots indicate means (◇) of the plots; C = Control; P = Piste; ns = not significant differences between controls and ski pistes according to paired t-test.
3.1.1. Effect of Temporal Variability (2016 vs. 2017 Trial Years) on Enzyme Activity and Microbial Biomass
This comparison was possible only for the MS ski resort (S1), which was sampled for the two consecutive years. Out of the 17 tested hydrolytic soil enzymes, the majority of enzymes and dsDNA (as a proxy for microbial biomass) showed statistically significant differences (p < 0.05; Figure 6) between the two sampling years. Enzymes such as the acP (p < 0.01), chit (p < 0.05), leu (p< 0.05), α-G (p < 0.001), α-GAL (p < 0.01), β-GAL (p < 0.05), α-MAN (p < 0.01), β-MAN (p < 0.01), uroni (p < 0.05), and the microbial biomass also affected by the temporal variability (p < 0.01; Figure 2d)) . All these significant differences showed consistently higher mean values of enzymatic activity in 2017 than in 2016.
3.2. PCA-Based Multivariate Patterns of Soil Enzyme Activity Across Ski Sizes and Years
Principal component analysis (PCA) for the MS ski resort revealed that the first principal component (PC1) accounted for 63% of the total variance. However, the second component (PC2) explained an additional 20.4%; together, the two PC components accounted for 83.4% of the overall multivariate variability in the score plot (Figure 7). In the PCA score plot, control and piste soils showed substantial overlap along both PC1 and PC2, indicating no clear multivariate separation between C and P plots. In contrast, most of the samples were more distinctly structured by sampling year.
The PCA biplot (Figure 8) showed that these enzymes contributed strongly to the major axis and had weak loadings near the origin. This biplot also combines scores (samples) and loadings (variables) within a single plot. The α-GAL, β-GAL and xilo, which had strong negative loadings on PC1 (left-aligned), and the alkP, trip, piroP and bisP showed strong positive loadings, while the acP: alkP ratio showed a strong negative loading on PC2 (vertically aligned).
The PCA ordination for the SS ski resorts revealed a clear multivariate separation between control and piste soils along the first two principal components, PC1 (63.0%) and PC2 (20.4%), which together explained 83.4% of the total variance. In the PCA score plot (Figure 9), the piste soils formed a distinct cluster separated from controls primarily along PC1. The enzymes with the strongest positive loadings on PC1 in the biplot (Figure 10), such as leu, α-G, xilo and dsDNA (as a proxy for microbial biomass), were oriented towards the piste cluster. Conversely, control plots were associated with higher contributions from alkP, bisP, trip, and piroP along PC2.
3.3. Spatiotemporal Variability Effects on Soil Enzyme Activity Analyzed Using Linear Mixed-Effects Models (LMMs)
In the MS ski resort (n = 27), the type III ANOVA outputs from the linear mixed-effects models showed that piste management had no significant effect on any of the measured hydrolytic soil enzyme activities when compared with the adjacent control plots (Table S2). In contrast, the main effect of the year-to-year change (2016 vs 2017) showed a significant divergence (p < 0.05) for most of the variables tested. These significant variations had higher values in 2017 trial year than in 2016, according to type III ANOVA results, as shown by the primary inferential analysis (Table 2 and Table S2), and were consistent with the univariate analysis results. The LMMs performance metrics (logLik, AIC, R2) in MS and SS ski resorts was also analyzed (Table S1), and the Log-Likelihood (logLik quantifies how well the model explains the observed data. Coefficient estimates for treatment (P vs. C) in LMMs at the MS and SS ski resorts (Table S3) and the LMM ANOVA results for PCA axis scores (PC1, PC2) at a MS and SS ski resorts elaborated under Table S4.
In the small-sized ski resorts sampled only in 2017 (n = 8), all measured hydrolytic soil enzyme activities showed non-significant differences between P and C plots through the exploratory analysis (p > 0.05) for all variables.
3.4. Soil pH Responses to Ski-Piste Disturbance Across Sites and Sampling Years
In the MS ski resort, both in 2016 and 2017, a significant increase in soil pH on the ski piste plots compared to the control plots was measured (Table 3).
A comparable pattern was detected in the small-sized ski resorts during the 2017 trial year as well, where piste soils again exhibited significantly higher pH values than adjacent control soils (p < 0.01; Table S7).
3.5. Pearson Correlation Matrix Among Soil Enzymes, acP: alkP, dsDNA and pH Across Spatiotemporal Changes
The correlation matrix in the MS ski resort revealed strong, mostly positive interactions among hydrolytic soil enzymes and dsDNA, excluding the soil pH. The dsDNA (as a proxy for microbial biomass) exhibited strong positive associations with nearly all measured enzymes (r = 0.52- 0.77, p < 0.001). And carbohydrate-degrading enzymes were highly and positively intercorrelated; the phosphorus-cycling enzyme (leu) also displayed strong positive relations with all the assessed hydrolytic enzymes. Soil pH showed weak correlations with some hydrolytic enzymes and certainly no relationships with most of them (Table S5).
In the SS ski resorts, only a small subset of enzymes: aryS, β-G, and leu exhibited strong positive associations with microbial biomass, whereas α-G, β-GAL, cell, acP, β-MAN, and xilo showed only moderate to weak relationships. All remaining enzymes showed no detectable correlation with microbial DNA, indicating a sparsely connected enzymatic network under the lower disturbance regime. Soil pH in these ski resorts followed the same pattern observed in the MS ski resort, with piste soils consistently exhibiting higher pH than adjacent controls (Table S6).
4. Discussion
4.1. Soil Enzymes, dsDNA Responses to Ski Piste Disturbance Across Trial Sites and Years
Contrary to our hypothesis, no significant differences in mean enzymatic activities between C and P soils were detected, neither in the MS nor in the SS ski resorts. The same applies to microbial biomass, measured as dsDNA content, which showed equivalent concentrations between C and P in soils in both MS and SS ski resorts.
These results differ from most of the findings of similar studies, where ski-piste development and subsequent maintenance had an impact on soil assets and microbial and enzymatic functioning [17,18,28,42,43]. Land-use change may decrease the activity of some soil enzymes significantly, as reported by Mir et al. [44]. They measured a decrease in acid phosphatase, alkaline phosphatase, arylsulfatase and fluorescein diacetate hydrolase across the measured land-use types compared to forest land uses, displaying the progressive decline in soil enzyme activity and biological abundance from undisturbed to more disturbed land-use types.
However, our current results indicated a resilient microbial and enzymatic functional profile under the current ski-piste disturbance level, which is quantified by the intensity of machine grading, by the amount of technical snow used and by its quality. The lack of difference in the soil enzymatic activity between piste and controls in the SS ski resorts was expected, as the effects in the small ski areas are more limited compared to the medium, most probably due to the different amount of technical snow used and for the different duration of the growing season [19,28]. On the other hand, since in previous works soil pH was found to affect the soil microbiological quality [21], a difference in the enzyme activities between control and piste soils in the MS ski resort was expected. A possible explanation for the lack of this difference could lie in the interactions between soil microbial activity and soil temperature [21,44]. In fact, snow scarcity and the lack of snow lead to low temperatures similar to those reached under the compacted technical snow [19]. In a low-snow winter such as 2016-2017, the lack of natural snow cover from mid-November to early February exposed both the ski piste and the surrounding areas to similarly cold temperatures, which may have contributed to a levelling of soil enzyme activity patterns. Our findings suggest that, when freezing temperatures occur, the limiting effect of soil temperature may become a stronger constraint than soil pH in determining microbial enzyme activity and soil microbial biomass [27,44]. The absence of differences in the soil microbial biomass between ski piste and controls is in contrast with the role of soil pH as a major driver of microbial community structure and biomass, with higher pH generally favoring bacterial growth and abundance, particularly in acidic soils [45,46] . Given the higher soil pH observed on the ski piste, a higher microbial biomass could therefore have been expected compared with the control plots. However, this potential positive effect of pH may have been offset by the greater vegetation biomass outside the ski piste [19], which may provide greater inputs of organic carbon through rhizodeposition and plant residues, thereby supporting microbial biomass independently of soil pH. Furthermore, legumes, which were more abundant on the ski piste than in the control plots, had a smaller root biomass compared to grasses, which were more abundant outside the ski piste. Grasses may contribute to higher belowground carbon inputs and organic matter accumulation, potentially further reducing the expected effect of soil pH on microbial biomass. In contrast to the non-significant difference between P and C, differences between 2016 and 2017 sampling years in the MS ski resort were observed. Among the assessed soil enzymes, the majority of them in the MS ski resort showed higher enzymatic activities and microbial biomass in 2017 compared to 2016. Likewise, the microbial biomass differed significantly between the two years.
The year 2017 was a particularly dry winter season that well represented the scarcity of snow within the interannual variability of snow-cover regimes. This trend has been widely predicted by global climate models [46,47]. Soil enzyme activity is strongly influenced by soil moisture and, consequently, by soil water content (SWC) [48,49,50,51]. Therefore, higher enzyme activities in 2016 than in 2017 were expected, as the former was characterized by wetter conditions. Although technical snowmaking compensates for the lack of natural snowfall, the total snow cover on ski pistes is generally maintained at a relatively constant level, regardless of natural snowfall, to ensure “The perfect ski day” [52]. Consequently, the particularly dry conditions in 2017 were not expected to substantially affect snow cover on the ski piste compared with 2016. A possible explanation for the observed pattern is the later snowmelt in 2017, both on the ski piste and in the control plots. Alpine studies showed that microbial biomass, dissolved C and enzyme dynamics can respond strongly to snowmelt timing and snow-cover insulation, because snow regulates winter soil temperature, moisture conditions and substrate availability [52,53]. Although snowmelt on the ski piste was delayed by up to 17 days compared with the controls, snow also arrived later in the season at the control sites and persisted until the first week of May [19]. This delayed snowmelt may have increased soil water availability immediately before sampling through snowmelt infiltration, thereby promoting soil enzyme activity to a greater extent than in the previous year. These findings show that precipitation alone cannot justify interannual variability in microbial functioning. Most commonly, in mountain grassland ecosystems, soil enzyme activity is regulated by multiple climatic and edaphic factors, including snowmelt timing, soil temperature and moisture dynamics, rather than rainfall totals alone [21,44,47,53,54].
Although most of the P, C and N-cycling enzymes exhibited a sensitivity to seasonal climatic variation, some hydrolytic soil enzymes showed little or no change from one year to another. This divergence indicates that some soil enzymes do not respond uniformly to environmental or anthropogenic drivers, with their activity being more tightly regulated by parameters such as substrate availability or microbial functioning than by short-term climatic fluctuations [48,49].
4.2. Multivariate PCA and LMMs Analysis on Patterns of Soil Enzymes and Microbial Biomass Across C vs. P Plots and Observed Years
Multivariate analysis was additionally performed to determine whether the results of the ski-piste effects detected through the univariate tests were consistent or not, when considering the full suite of all variables simultaneously. The PCA and LMM results supported the univariate analysis by showing no distinct separation in microbial biomass and soil enzyme activities between P and C soils. Since PCA summarizes the combined variation of several enzyme indicators, the overlap between piste and control samples suggests that soil biochemical functioning remained broadly similar between managed and adjacent control soils. The strong co-loading of enzymes involved in carbon, nitrogen, and phosphorus acquisition indicates an integrated microbial response, consistent with observations from alpine mountain soils, where hydrolytic enzyme systems are tightly coupled to microbial biomass and substrate availability [54,55].
Regardless of the physical disturbance associated with ski piste construction and subsequent management, P and C plots overlapped substantially in the PCA score plot ordination space, indicating no pronounced alteration of the multivariate enzymatic evidence. Similar functional stability has been reported in alpine grasslands and mountain ecosystems, where moderate land use disturbance does not necessarily disrupt microbial functional capacity [21,56]. Similarly, the absence of strong piste-driven separation in the PCA patterns suggests that the overall microbial biomass and enzyme activity involved in nutrient cycling were not substantially altered by the current ski piste management practices. In contrast, the variation between the observed years in the MS ski resort indicates that temporal climatic variations affected the majority of the tested soil enzymes and microbial biomass, both in the univariate and multivariate PCA structures. This supports the interpretation that the snowmelt timing and soil moisture conditions could modify soil biochemical activity, leading to interannual variations. The strong contribution of enzymes involved in carbon degradation (e.g., α-G), nitrogen acquisition (chit, leu), and phosphorus cycling (acP) to the main PCA axes suggests that temporal variability affects multiple nutrient cycling enzymes simultaneously, a characteristic feature of the alpine mountain soils with short growing seasons [44,48]. A comparable pattern emerged in the type III ANOVA analysis results from the LMMs in both SS and MS ski resorts, where only the inter-annual variation significantly influenced mean soil enzyme activities and microbial biomass.
4.3. Relations Among Soil Enzyme Activity, acP: alkP, dsDNA and Soil pH
The relationships among soil enzyme activity, microbial biomass and soil pH help clarify whether changes in microbial abundance and pH are associated with shifts in enzymatic functioning. In this study, the correlation patterns suggest that soil enzymes were more closely linked to microbial biomass than to soil pH. This indicates that the overall enzyme system was mainly shaped by microbial functional activity, while the higher pH observed in piste soils did not correspond to a consistent change in hydrolytic enzyme activity.
However, the higher pH in piste soils did not translate into broad suppression of hydrolytic enzyme activity. This may indicate that the observed pH shift remained within a range that did not strongly limit enzyme production or activity under the studied conditions.
The correlation patterns further support this interpretation, showing different trends across ski resort sizes. In MS ski resorts, hydrolytic soil enzymes involved in carbon, nitrogen, sulfur, and phosphorus cycling formed a tightly integrated network with microbial biomass (Figure S5). Such coordinated responses suggest that dsDNA remains a dominant driver of enzymatic activity under the current ski-piste management. This pattern aligns with evidence that microbial communities exposed to continuing disturbance maintain functional redundancy and synchronized enzyme production to stabilize the nutrient cycling processes [57,58]. The very strong intercorrelations among carbohydrate-degrading enzymes further indicated a highly coupled C-gaining strategy, showing the biochemical mutuality of polysaccharide depolymerization pathways in grassland soils [55].
On the other hand, in SS ski resorts, a relatively different soil enzymatic network was demonstrated. Almost all C-cycling enzymes, primarily carbohydrate-degrading hydrolase enzymes, showed moderate to strong correlations with each other and with microbial biomass. However, some of the remaining enzymes exhibited negative relations, and some had no associations (Figure S6). This weak link likely reflected times of lower disturbance pressure, where enzymatic activity is sharply shaped by substrate availability and plant-microbe interactions rather than by disturbance-driven constraints [21,55]. Yet again, the soil pH also consistently showed no correlation with most of the soil enzymes and negatively correlated with α-MAN, uroni, trip, bisP, piroP and alkP in the SS ski resorts, consistent with studies indicating pH effects on microbial community composition more strongly than on enzyme activity [59].
Overall, the lack of significant differences in hydrolytic soil enzyme activities and dsDNA-based microbial biomass between C and P soils indicates that biological functioning remained largely stable under the current ski-piste disturbance. In contrast, the consistent shift in soil pH between C and P soils highlights pH as a more sensitive indicator of piste-related chemical alteration. Moreover, year-to-year climatic variability significantly influenced the majority of enzymes and microbial biomass, underscoring that temporal climatic variations had a stronger control over soil biochemical functioning than the disturbance associated with ski-piste management.
5. Conclusion
These findings suggest that soil biochemical functioning based on enzymatic activity in the studied mountain grasslands of the Southern Alps was largely unaffected by the level of ski piste disturbance observed in this study. The combined effect of soil pH, soil temperature and vegetation may have contributed to buffering the potential impacts of ski piste disturbance on soil biochemical functioning. The interannual variability observed between the trial years could be related to snow-cover patterns and snowmelt dynamics, which can regulate soil insulation, moisture availability and microbial activity in mountain soils.
This shift may reflect strong climatic control: lower soil moisture in 2017 likely intensified microbial resource limitation, thereby leading to a high production of hydrolytic enzymes to sustain carbon acquisition. This interpretation is relevant in the context of ongoing changes in mountain snow regimes. Declines in snow depth and snow-cover duration have been reported across the European Alps, with strong variation depending on elevation, region, and season [48]. Reduced natural snow reliability may increase dependence on technical snowmaking and alter the timing, density, and persistence of snow cover on managed ski slopes [47,51].
Soil enzymes respond to microbial biomass, substrate availability, nutrient demand, moisture, and pH, making them valuable indicators of soil biological processes [33,54,59]. However, enzyme activity alone cannot fully capture ecosystem recovery or degradation, and future studies should integrate multi-year enzyme measurements with soil moisture, soil temperature, snow-cover duration, vegetation structure, soil organic matter, and microbial community data. Such integrated monitoring would help to identify the disturbance threshold beyond which ski-piste management begins to impair soil biochemical functioning, especially under declining natural snow reliability and increasing reliance on technical snowmaking in mountain regions.
Supplementary Materials
The following supporting information can be downloaded at the website of this paper posted on Preprints.org.
Author Contributions
Conceptualization, C. Wellstein, S. Casagrande Bacchiocchi; methodology, S. Casagrande Bacchiocchi, F. Fornasier; validation, Prof. Camilla; formal analysis, Z.M. Gebru, Shebeshe Assefa; data curation, S. Casagrande Bacchiocchi, Z.M. Gebru; writing, Z. M. Gebru; review and editing, S. Casagrande Bacchiocchi, F. Fornasier, Shebeshe Assefa, C. Wellstein; visualization, Zinabu Marsie and Shebeshe Assefa; supervision, C. Wellstein. All authors have read and agreed to publish this final version of the manuscript.
Funding
The authors received no external financial support for this research.
Data Availability Statement
The data supporting the findings of this study are available from the corresponding author upon reasonable request.
Acknowledgments
We thank the ski resort presidents and operators for their collaboration and availability. The laboratory staff for their help with the lab analysis and the fieldwork.
Conflicts of Interest
The authors declare no conflicts of interest.
References
- E. Barni, M. Freppaz, and C. Siniscalco, “Interactions between vegetation, roots, and soil stability in restored high-altitude ski runs in the Alps,” Arctic, Antarctic Alp. Res., vol. 39, no. 1, pp. 25–33, 2007. [CrossRef]
- C. De Jong, G. Carletti, and F. Previtali, “Assessing Impacts of Climate Change, Ski Slope, Snow and Hydraulic Engineering on Slope Stability in Ski Resorts (French And Italian Alps),” in Engineering Geology for Society and Territory - Volume 1: Climate Change and Engineering Geology, Springer International Publishing, 2015, pp. 51–56. [CrossRef]
- C. Marty, “Climate change and snow cover in the European Alps,” Impacts Ski. Relat. Winter Recreat. Act. Mt. Environ. Bentham, pp. 30–44, 2013.
- C. Rixen, V. Stoeckli, and W. Ammann, “Does artificial snow production affect soil and vegetation of ski pistes? A review,” 2003. [CrossRef]
- M. Freppaz, E. Pintaldi, A. Magnani, D. Viglietti, and M. W. Williams, “Topsoil and snow: a continuum system,” Appl. Soil Ecol., vol. 123, no. December 2016, pp. 435–440, 2018. [CrossRef]
- C. de Jong, “Engineering geology for society and territory – Volume 1: Climate change and engineering geology,” Eng. Geol. Soc. Territ. - Vol. 1 Clim. Chang. Eng. Geol., no. August 2014, pp. 1–572, 2014. [CrossRef]
- F. Martz, J. Vuosku, A. Ovaskainen, S. Stark, and P. Rautio, “The snow must go on: Ground ice encasement, Snow Compaction and absence of snow differently cause soil hypoxia, CO2 accumulation and tree seedling damage in boreal forest,” PLoS One, vol. 11, no. 6, pp. 1–18, 2016. [CrossRef]
- C. Rixen, M. Freppaz, V. Stoeckli, C. Huovinen, K. Huovinen, and S. Wipf, “Altered snow density and chemistry change soil nitrogen mineralization and plant growth,” Arctic, Antarct. Alp. Res., vol. 40, no. 3, pp. 568–575, 2008. [CrossRef]
- T. Keller, C. Pielmeier, C. Rixen, F. Gadient, D. Gustafsson, and M. Stähli, “Impact of artificial snow and ski-slope grooming on snowpack properties and soil thermal regime in a sub-alpine ski area,” Ann. Glaciol., vol. 38, pp. 314–318, 2004. [CrossRef]
- C. Rixen, W. Haeberli, and V. Stoeckli, “Ground temperatures under ski pistes with artificial and natural snow,” Arctic, Antarctic. Alp. Res., vol. 36, no. 4, pp. 419–427, 2004. [CrossRef]
- M. Sarady and E. A. U. Sahlin, “The influence of snow cover on ground freeze-thaw frequency, intensity, and duration: An experimental study conducted in coastal northern Sweden,” Nor. Geogr. Tidsskr. - Nor. J. Geogr., vol. 70, no. 2, pp. 82–94, Mar. 2016. [CrossRef]
- P. O. Sorensen, A. C. Finzi, M. A. Giasson, A. B. Reinmann, R. Sanders-DeMott, and P. H. Templer, “Winter soil freeze-thaw cycles lead to reductions in soil microbial biomass and activity not compensated for by soil warming,” Soil Biol. Biochem., vol. 116, no. February 2017, pp. 39–47, 2018. [CrossRef]
- and D. L. K. D.L. Allan, D.C. Adriano, D.F. Bezdicek, R.G. Cline, D.C. Coleman, J.W. Doran, J. Haberern, R.F. Harris, A.S.R. Juo, M.J. Mausbach, G.A. Peterson, G.E. Schuman, M.J. Singer, “Part 624 – Soil Quality,” no. January, pp. 1–2, 1995.
- R. Dexter, “Soil physical quality,” Soil Tillage Res., vol. 79, no. 2 SPEC.ISS., pp. 129–130, 2004. [CrossRef]
- M. Freppaz, G. Filippa, G. Corti, and S. Cocco, “Soil Properties on Ski Runs,” Bentham Sci. Publ., no. January, pp. 45–64, 2013.
- J. W. Burt and K. J. Rice, “Not all ski slopes are created equal: Disturbance intensity affects ecosystem properties,” Ecol. Appl., vol. 19, no. 8, pp. 2242–2253, Dec. 2009. [CrossRef]
- P. Roux-Fouillet, S. Wipf, and C. Rixen, “Long-term impacts of ski piste management on alpine vegetation and soils,” J. Appl. Ecol., vol. 48, no. 4, pp. 906–915, 2011. [CrossRef]
- R. Gros, L. Jocteur Monrozier, F. Bartoli, J. L. Chotte, and P. Faivre, “Relationships between soil physico-chemical properties and microbial activity along a restoration chronosequence of alpine grasslands following ski run construction,” Appl. Soil Ecol., vol. 27, no. 1, pp. 7–22, Sep. 2004. [CrossRef]
- S. Casagrande Bacchiocchi, S. Zerbe, L. A. Cavieres, and C. Wellstein, “Impact of ski piste management on mountain grassland ecosystems in the Southern Alps,” Sci. Total Environ., vol. 665, pp. 959–967, 2019. [CrossRef]
- R. Delgado, M. Sánchez-Marañón, J. M. Martín-García, V. Aranda, F. Serrano-Bernardo, and J. L. Rosúa, “Impact of ski pistes on soil properties: A case study from a mountainous area in the Mediterranean region,” Soil Use Manag., vol. 23, no. 3, pp. 269–277, Sep. 2007. [CrossRef]
- J. Puissant et al., “The pH optimum of soil exoenzymes adapt to long term changes in soil pH,” Soil Biol. Biochem., vol. 138, no. September, p. 107601, 2019. [CrossRef]
- B. L. Turner, “Variation in ph optima of hydrolytic enzyme activities in tropical rain forest soils,” Appl. Environ. Microbiol., vol. 76, no. 19, pp. 6485–6493, 2010. [CrossRef]
- P. Campdelacreu Rocabruna, X. Domene, C. Preece, and J. Peñuelas, “Relationship among Soil Biophysicochemical Properties, Agricultural Practices and Climate Factors Influencing Soil Phosphatase Activity in Agricultural Land,” Agric., vol. 14, no. 2, 2024. [CrossRef]
- W. A. Dick, L. Cheng, and P. Wang, “Soil acid and alkaline phosphatase activity as pH adjustment indicators,” Soil Biol. Biochem., vol. 32, no. 13, pp. 1915–1919, 2000. [CrossRef]
- S. Klačanová et al., “Vegetation responses to artificial snow and abiotic factors on ski slopes in Slovakia,” Reg. Environ. Chang., vol. 26, no. 1, pp. 1–16, 2026. [CrossRef]
- S. Wipf, C. Rixen, M. Fischer, B. Schmid, and V. Stoeckli, “Effects of ski piste preparation on alpine vegetation,” J. Appl. Ecol., vol. 42, no. 2, pp. 306–316, Apr. 2005. [CrossRef]
- M. P. Meijer zu Schlochtern, C. Rixen, S. Wipf, and J. H. C. Cornelissen, “Management, winter climate and plant-soil feedbacks on ski slopes: A synthesis,” Ecol. Res., vol. 29, no. 4, pp. 583–592, 2014. [CrossRef]
- C. Hudek, E. Barni, S. Stanchi, M. D’Amico, E. Pintaldi, and M. Freppaz, “Mid and long-term ecological impacts of ski run construction on alpine ecosystems,” Sci. Rep., vol. 10, no. 1, Dec. 2020. [CrossRef]
- L. Liu, R. Xie, D. Ma, L. Fu, and X. Wu, “Effects of snow removal on seasonal dynamics of soil bacterial community and enzyme activity,” Eur. J. Soil Biol., vol. 119, no. September, p. 103564, 2023. [CrossRef]
- Delgado et al., “Impact of ski pistes on soil properties: a case study from a mountainous area in the Mediterranean region, Soil Use Manage 23:269–277,” 2007, British Society of Soil Science.
- E. Pintaldi, C. Hudek, S. Stanchi, T. Spiegelberger, E. Rivella, and M. Freppaz, “Sustainable soil management in ski areas: Threats and challenges,” Nov. 22, 2017, MDPI. [CrossRef]
- E. B. Utobo and L. Tewari, “Soil enzymes as bioindicators of soil ecosystem status,” Appl. Ecol. Environ. Res., vol. 13, no. 1, pp. 147–169, 2015. [CrossRef]
- Karaca, S. C. Cetin, O. C. Turgay, and R. Kizilkaya, Soil Enzymes as Indication of Soil Quality, no. October. 2010. [CrossRef]
- S. H. Lee, M. S. Kim, J. G. Kim, and S. O. Kim, “Use of soil enzymes as indicators for contaminated soil monitoring and sustainable management,” Sustain., vol. 12, no. 19, pp. 1–14, 2020. [CrossRef]
- Y. Wang, T. Shan, P. Zhang, and M. Li, “Changes in Soil Organic Carbon and Enzyme Activity After Land Use Change in Northeast China,” Agronomy, vol. 15, no. 1, 2025. [CrossRef]
- E. Blagodatskaya, S. Blagodatsky, N. Khomyakov, O. Myachina, and Y. Kuzyakov, “Temperature sensitivity and enzymatic mechanisms of soil organic matter decomposition along an altitudinal gradient on Mount Kilimanjaro,” Sci. Rep., vol. 6, no. May 2015, pp. 1–11, 2016. [CrossRef]
- Sowerby et al., “Microbial community changes in heathland soil communities along a geographical gradient: Interaction with climate change manipulations,” Soil Biol. Biochem., vol. 37, no. 10, pp. 1805–1813, 2005. [CrossRef]
- Autonomous Province of Bozen-South Tyrol., “Authonomus province Report,” 2017. [Online]. Available: https://weather.provinz.bz.it/mountain-wind-stations.asp?stat_stid=821&utm_source=copilot.com.
- T. Bardelli et al., “Effects of slope exposure on soil physico-chemical and microbiological properties along an altitudinal climosequence in the Italian Alps,” Sci. Total Environ., vol. 575, pp. 1041–1055, 2017. [CrossRef]
- F. Fornasier, J. Ascher, M. T. Ceccherini, E. Tomat, and G. Pietramellara, “A simplified rapid, low-cost and versatile DNA-based assessment of soil microbial biomass,” Ecol. Indic., vol. 45, pp. 75–82, 2014. [CrossRef]
- E. Fornasier, F. Fornasier, and V. Di Marco, “Spectrophotometric methods for the measurement of soil pH: A reappraisal,” Spectrochim. Acta - Part A Mol. Biomol. Spectrosc., vol. 204, pp. 113–118, 2018. [CrossRef]
- S. Nakagawa and H. Schielzeth, “A general and simple method for obtaining R2 from generalized linear mixed-effects models,” Methods Ecol. Evol., vol. 4, no. 2, pp. 133–142, 2013. [CrossRef]
- M. Negro et al., “Differential responses of ground dwelling arthropods to ski-piste restoration by hydroseeding,” Biodivers. Conserv., vol. 22, no. 11, pp. 2607–2634, Oct. 2013. [CrossRef]
- Y. H. Mir et al., “Soil microbial and enzyme activities in different land use systems of the Northwestern Himalayas,” PeerJ, vol. 11, pp. 1–22, 2023. [CrossRef]
- A. D. Broadbent et al., “Climate change alters temporal dynamics of alpine soil microbial functioning and biogeochemical cycling via earlier snowmelt,” ISME J., vol. 15, no. 8, pp. 2264–2275, 2021. [CrossRef]
- J. Rousk, P. C. Brookes, and E. Bååth, “Investigating the mechanisms for the opposing pH relationships of fungal and bacterial growth in soil,” Soil Biol. Biochem., vol. 42, no. 6, pp. 926–934, 2010. [CrossRef]
- S. Schilling et al., “Ski Areas and Snow Reliability Decline in the European Alps Under Increasing Global Warming—A Remote Sensing Perspective,” Remote Sens., vol. 18, no. 3, pp. 1–26, 2026. [CrossRef]
- M. Matiu et al., “Observed snow depth trends in the European Alps: 1971 to 2019,” Cryosphere, vol. 15, no. 3, pp. 1343–1382, 2021. [CrossRef]
- P. Baldrian, V. Merhautová, M. Petránková, T. Cajthaml, and J. Šnajdr, “Distribution of microbial biomass and activity of extracellular enzymes in a hardwood forest soil reflect soil moisture content,” Appl. Soil Ecol., vol. 46, no. 2, pp. 177–182, 2010. [CrossRef]
- T. H. Bell and H. A. L. Henry, “Fine scale variability in soil extracellular enzyme activity is insensitive to rain events and temperature in a mesic system,” Pedobiologia (Jena)., vol. 54, no. 2, pp. 141–146, 2011. [CrossRef]
- N. J. Reichart, S. Bell, V. A. Garayburu-Caruso, N. Sadler, S. Zhao, and K. S. Hofmockel, “Impact of moisture on microbial decomposition phenotypes and enzyme dynamics,” ISME J., vol. 19, no. 1, pp. 1–13, 2025. [CrossRef]
- P. Spandre, H. François, E. George-Marcelpoil, and S. Morin, “Panel based assessment of snow management operations in French ski resorts,” J. Outdoor Recreat. Tour., vol. 16, no. February, pp. 24–36, 2016. [CrossRef]
- A. D. Broadbent et al., “Climate change alters temporal dynamics of alpine soil microbial functioning and biogeochemical cycling via earlier snowmelt,” ISME J., vol. 15, no. 8, pp. 2264–2275, Aug. 2021. [CrossRef]
- Rindt et al., “Biogeochemical dynamics during snowmelt and in summer in the Alps,” Biogeochemistry, vol. 162, no. 2, pp. 257–266, 2023. [CrossRef]
- R. L. Sinsabaugh et al., “Stoichiometry of soil enzyme activity at global scale,” Ecol. Lett., vol. 11, no. 11, pp. 1252–1264, 2008. [CrossRef]
- H. Kang, S. Kim, K. Song, M. J. Kwon, and J. Lee, “Intermediate Disturbances Enhance Microbial Enzyme Activities in Soil Ecosystems,” Microorganisms, vol. 12, no. 7, 2024. [CrossRef]
- J. Donhauser and B. Frey, “Alpine soil microbial ecology in a changing world,” FEMS Microbiol. Ecol., vol. 94, no. 9, pp. 1–31, 2018. [CrossRef]
- S. D. Allison and J. B. H. Martiny, “Resistance, resilience, and redundancy in microbial communities,” 2008. [Online]. Available: www.pnas.org/cgi/content/full/.
- C. Wang and Y. Kuzyakov, “Soil organic matter priming: The pH effects,” Glob. Chang. Biol., vol. 30, no. 6, pp. 1–21, 2024. [CrossRef]
Figure 1.
Location map of the study sites; numbers indicate ski resorts: 1= Ski Center Latemar (MS), 2= Petersberg [SS], 3= Schwarzhorn (SS), 4= Skigebiet Villnöss (SS). MS = Medium-sized ski resort; SS = Small-sized ski resort.
Figure 1.
Location map of the study sites; numbers indicate ski resorts: 1= Ski Center Latemar (MS), 2= Petersberg [SS], 3= Schwarzhorn (SS), 4= Skigebiet Villnöss (SS). MS = Medium-sized ski resort; SS = Small-sized ski resort.
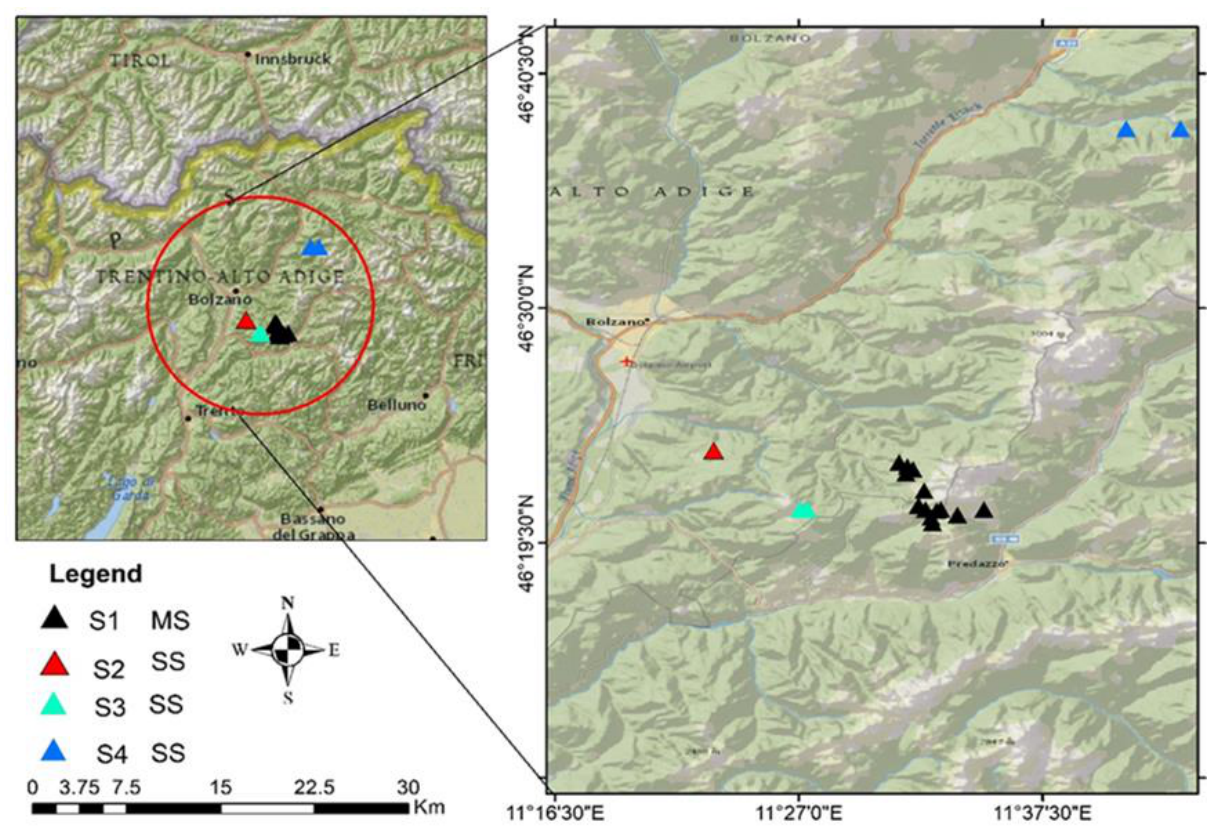
Figure 6.
Enzyme activity (nmol g-1 soil h-1) in 2016 and 2017 soil samples (n =13, n = 14 respectively) : a) acid-phosphomonoesterase (acP); b) acid-phosphomonoesterase to alkaline-phosphomonoesterase ratio (acP: alkP); c) α-glucosidase (α-G); d) α-galactosidase (α-GAL); e) α-mannosidase (α-MAN); f) alkaline-phosphomonoesterase (alkP); g) arylsulphatase (aryS); h) β-glucosidase (β-G); i) β-galactosidase (β-GAL); j) β-mannosidase (β-MAN); k) phospho-diesterase (bisP); l) cellobiohydrolase (cell); m) chitinase (chit); n) leucine-aminopeptidase (leu); o) pyrophosphate-phosphodiesterase (piroP); p) tripsin-like protease (trip); q) glucuronidase (uroni); r) xilosidase (xilo). Box plots indicate means (◇) of the plots; Stars indicate significant differences (*p < 0.05; **p <0.01; ns = not significant differences between controls and ski pistes according to paired t-test.
Figure 6.
Enzyme activity (nmol g-1 soil h-1) in 2016 and 2017 soil samples (n =13, n = 14 respectively) : a) acid-phosphomonoesterase (acP); b) acid-phosphomonoesterase to alkaline-phosphomonoesterase ratio (acP: alkP); c) α-glucosidase (α-G); d) α-galactosidase (α-GAL); e) α-mannosidase (α-MAN); f) alkaline-phosphomonoesterase (alkP); g) arylsulphatase (aryS); h) β-glucosidase (β-G); i) β-galactosidase (β-GAL); j) β-mannosidase (β-MAN); k) phospho-diesterase (bisP); l) cellobiohydrolase (cell); m) chitinase (chit); n) leucine-aminopeptidase (leu); o) pyrophosphate-phosphodiesterase (piroP); p) tripsin-like protease (trip); q) glucuronidase (uroni); r) xilosidase (xilo). Box plots indicate means (◇) of the plots; Stars indicate significant differences (*p < 0.05; **p <0.01; ns = not significant differences between controls and ski pistes according to paired t-test.
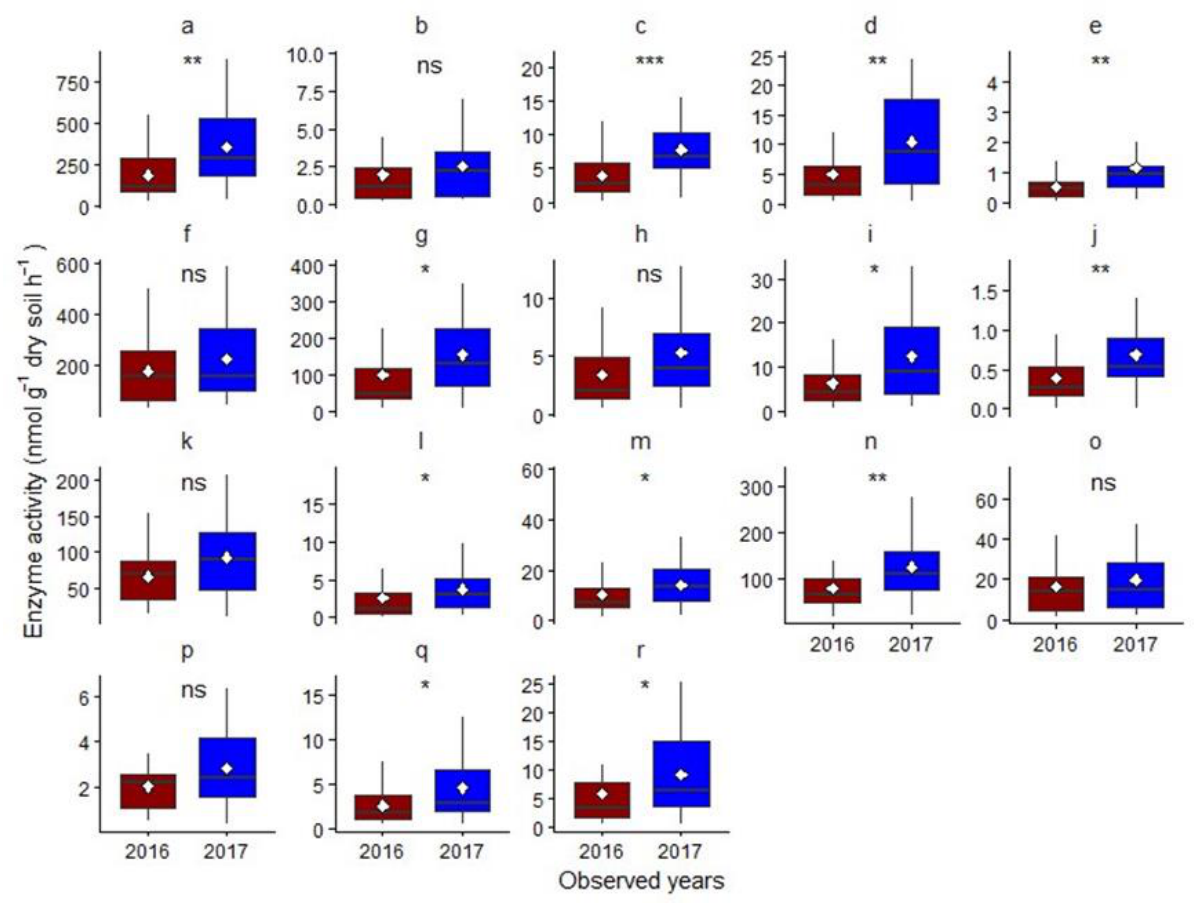
Figure 7.
PCA score plot in MS (=Medium-sized) ski resort displaying data grouped (ellipses) by plots and sampling year (68% conf. level). It focuses on the samples projected into PCA space. PC1 = Principal Component 1; PC2 = Principal component 2; C =Control; P = Piste.
Figure 7.
PCA score plot in MS (=Medium-sized) ski resort displaying data grouped (ellipses) by plots and sampling year (68% conf. level). It focuses on the samples projected into PCA space. PC1 = Principal Component 1; PC2 = Principal component 2; C =Control; P = Piste.
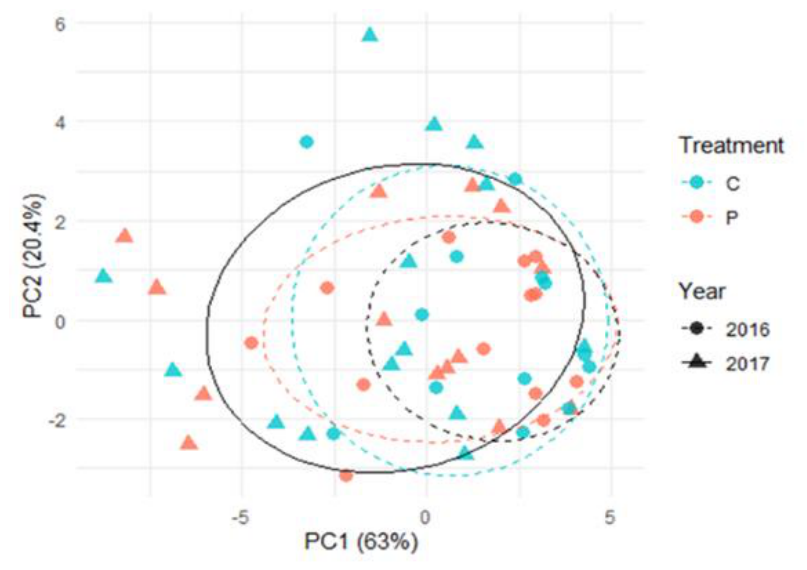
Figure 8.
PCA biplot on the MS (=Medium-sized) ski resort showing sample scores colored by plots and shaped by sampling year, together with standardized variable loadings (arrows): ellipses represent 68% confidence regions. Overlapping variables were excluded from the biplot to avoid redundancy. Axes (PC1, PC2) = first two principal components; Points = observations; Vectors/arrows = variables, showing direction and strength of contribution. C = Control; P = Piste; alkP = alkaline-phosphomonoesterase; acP: alkP (acP_alkP) = acid-phosphomonoesterase to alkaline-phosphomonoesterase ratio; α-GAL = α-galactosidase; β-GAL = β-galactosidase; bisP = phospho-diesterase; piroP = pyrophosphate-phosphodiesterase; trip = tripsin-like protease; xilo = xilosidase.
Figure 8.
PCA biplot on the MS (=Medium-sized) ski resort showing sample scores colored by plots and shaped by sampling year, together with standardized variable loadings (arrows): ellipses represent 68% confidence regions. Overlapping variables were excluded from the biplot to avoid redundancy. Axes (PC1, PC2) = first two principal components; Points = observations; Vectors/arrows = variables, showing direction and strength of contribution. C = Control; P = Piste; alkP = alkaline-phosphomonoesterase; acP: alkP (acP_alkP) = acid-phosphomonoesterase to alkaline-phosphomonoesterase ratio; α-GAL = α-galactosidase; β-GAL = β-galactosidase; bisP = phospho-diesterase; piroP = pyrophosphate-phosphodiesterase; trip = tripsin-like protease; xilo = xilosidase.
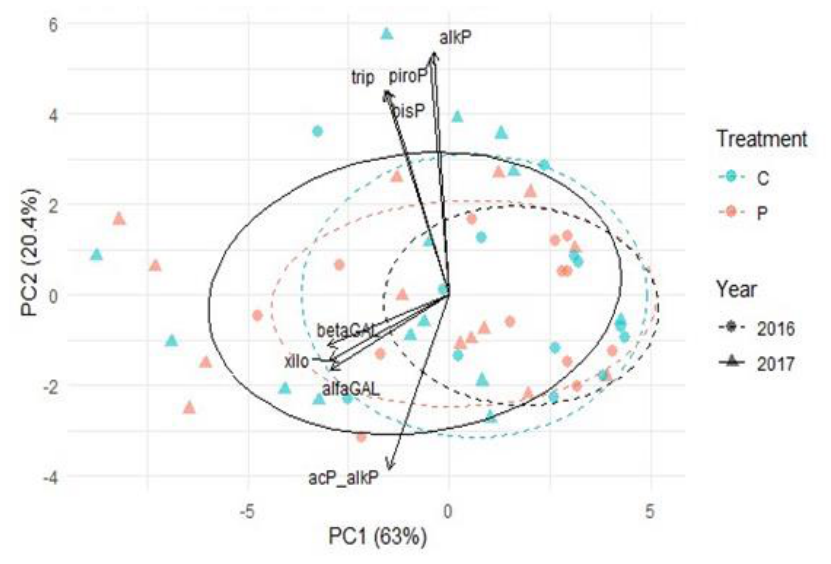
Figure 9.
PCA score plot in SS (=Small-sized) ski resorts with samples colored by plot (C vs. P); ellipses represent 68% confidence regions. It focuses only on the samples projected into PCA space. PC1, PC2= first two principal components; C = Control; P = Piste.
Figure 9.
PCA score plot in SS (=Small-sized) ski resorts with samples colored by plot (C vs. P); ellipses represent 68% confidence regions. It focuses only on the samples projected into PCA space. PC1, PC2= first two principal components; C = Control; P = Piste.
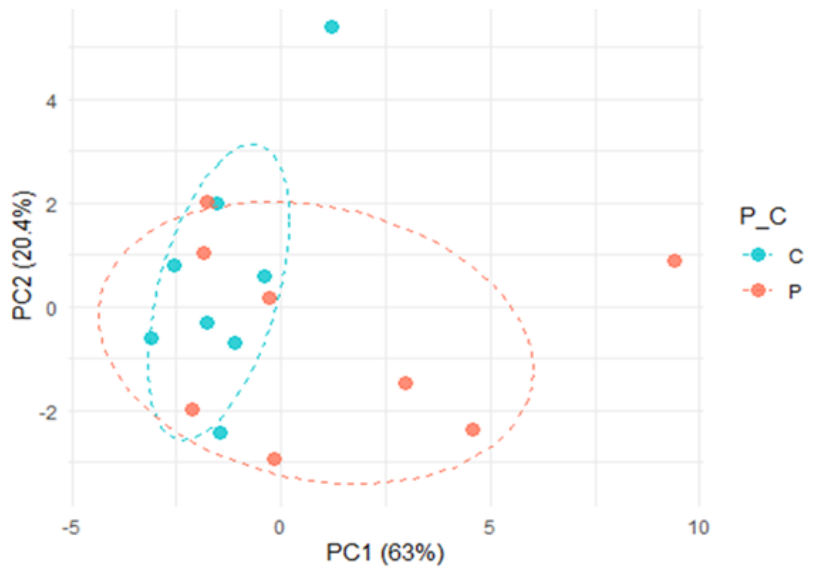
Figure 10.
PCA biplot of SS (=Small-sized) ski resorts showing sample scores colored by treatment (C vs. P) and standardized variable loadings; ellipses indicate 68% confidence regions. Overlapping variables were excluded from the biplot to avoid redundancy. PC1, PC2= first two principal components; Points= observations; Arrows= variables, showing direction and strength of contribution. C= Control; P = Piste; alkP = alkaline-phosphomonoesterase; bisP = phospho-diesterase; piroP = pyrophosphate-phosphodiesterase; trip = tripsin-like protease; xilo = xilosidase; α-G = α-glucosidase; leu = leucine-aminopeptidase; dsDNA = double-stranded DNA.
Figure 10.
PCA biplot of SS (=Small-sized) ski resorts showing sample scores colored by treatment (C vs. P) and standardized variable loadings; ellipses indicate 68% confidence regions. Overlapping variables were excluded from the biplot to avoid redundancy. PC1, PC2= first two principal components; Points= observations; Arrows= variables, showing direction and strength of contribution. C= Control; P = Piste; alkP = alkaline-phosphomonoesterase; bisP = phospho-diesterase; piroP = pyrophosphate-phosphodiesterase; trip = tripsin-like protease; xilo = xilosidase; α-G = α-glucosidase; leu = leucine-aminopeptidase; dsDNA = double-stranded DNA.
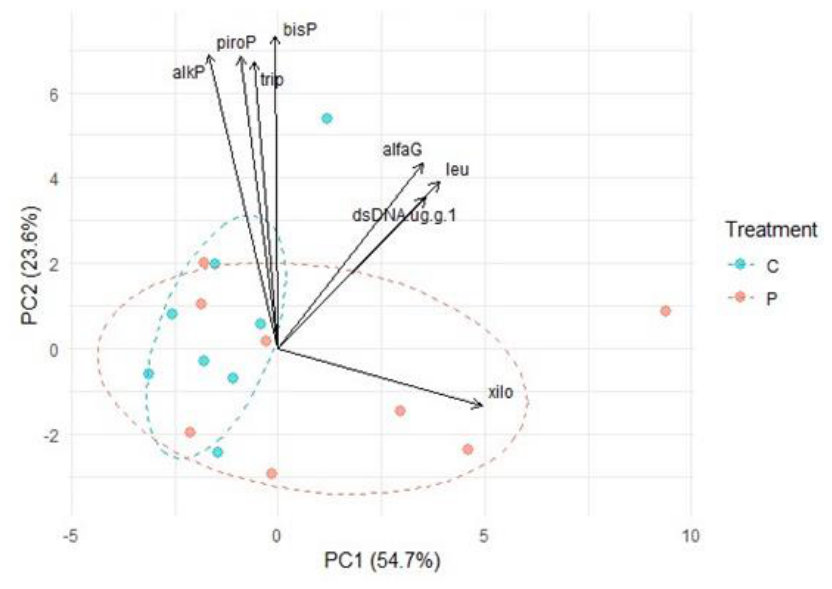

Table 1.
Study sites in the four ski resorts: MS = medium-sized; SS = small-sized, and relevant data for each site. Each site contains one plot on the ski piste and one beside the ski piste.
Table 1.
Study sites in the four ski resorts: MS = medium-sized; SS = small-sized, and relevant data for each site. Each site contains one plot on the ski piste and one beside the ski piste.
| Ski resort | Site | Piste | Latitude | Longitude | Elevation (m a.s.l.) | Aspect |
| MS | S1 | Oberholz | 46°22′55N | 11°31′40E | 1580 | N |
| MS | S1 | Oberholz | 46°22′66N | 11°31′95E | 1714 | NNW |
| MS | S1 | Oberholz | 46°22′48N | 11°31′96E | 1881 | NNW |
| MS | S1 | Oberholz | 46°22′39N | 11°33′18E | 2020 | W |
| MS | S1 | Oberholz | 46°23′64N | 11°23′19E | 2135 | WNW |
| MS | S1 | Laner | 46°21′89N | 11°32′38E | 1915 | W |
| MS | S1 | Reiter | 46°21′18N | 11°32′12E | 2032 | N |
| MS | S1 | Todesca | 46°20′95N | 11°32′56E | 1946 | WSW |
| MS | S1 | Pala di Santa | 46°20′59N | 11°32′28E | 1928 | SSE |
| MS | S1 | Residenza | 46°20′99N | 11°33′09E | 1940 | SW |
| MS | S1 | 5 Nazioni | 46°20′74N | 11°33′52E | 2126 | S |
| MS | S1 | Tresca | 46°29′60N | 11°19′84E | 1860 | NNW |
| MS | S1 | Agnello | 46°20′25N | 11°32′87E | 2038 | ENE |
| MS | S1 | Naturale Agnello | 46°20′39N | 11°32′78E | 1873 | NNW |
| SS | S2 | Petersberg | 46°23′60N | 11°23′21E | 1363 | NNW |
| SS | S2 | Petersberg | 46°23′62N | 11°23′17E | 1384 | NNW |
| SS | S3 | Schwarzhorn | 46°20′49N | 11°27′24E | 2096 | N |
| SS | S3 | Schwarzhorn | 46°20′74N | 11°27′24E | 2013 | N |
| SS | S3 | Weißhorn | 46°21′02N | 11°26′97E | 2075 | SE |
| SS | S3 | Weißhorn | 46°20′98N | 11°27′02E | 2045 | SE |
| SS | S4 | Villnöss | 46°37′94N | 11°42′87E | 1448 | N |
| SS | S4 | Villnöss | 46°38′04N | 11°42′85E | 1421 | N |
Reproduced from Casagrande Bacchiocchi et al. [19].
Table 2.
LMMs fitted to MS ski resort (n =27, 2016 & 2017), representing primary inferential analysis.
Table 2.
LMMs fitted to MS ski resort (n =27, 2016 & 2017), representing primary inferential analysis.
| Response | Direction (P vs C) | numDF_Year | denDF_Year | F_Year | p_Year | Sig_Year |
| dsDNA.ug.g.1 | + | 1 | 39 | 7.46 | 0.009 | ** |
| aryS | + | 1 | 39.1 | 3.76 | 0.06 | |
| alfaG | + | 1 | 39 | 12.72 | 0.001 | ** |
| betaG | + | 1 | 39 | 4.2 | 0.047 | * |
| alfaGAL | + | 1 | 50 | 9.6 | 0.003 | ** |
| betaGAL | + | 1 | 50 | 6.88 | 0.012 | * |
| alfaMAN | + | 1 | 50 | 8.07 | 0.006 | ** |
| betaMAN | + | 1 | 39 | 7.8 | 0.008 | ** |
| uroni | + | 1 | 39.1 | 5.48 | 0.024 | * |
| cell | + | 1 | 39.1 | 1.56 | 0.219 | |
| xilo | + | 1 | 50 | 3.43 | 0.07 | |
| chit | + | 1 | 50 | 1.91 | 0.173 | |
| leu | + | 1 | 50 | 6.9 | 0.011 | * |
| trip | - | 1 | 38.1 | 4.36 | 0.043 | * |
| acP | + | 1 | 50 | 9.81 | 0.003 | ** |
| bisP | - | 1 | 38.3 | 6.03 | 0.019 | * |
| piroP | - | 1 | 50 | 0.75 | 0.391 | |
| alkP | - | 1 | 50 | 1.44 | 0.236 | |
| acP: alkP | + | 1 | 50 | 0.86 | 0.357 |
numDF= Numerator Degrees of Freedom; denDF= Denominator Degrees of Freedom; F-statistic, P = piste, C = control. Stars indicate significant differences (**p < 0.01; *p < 0.05).
Table 3.
Mean values (± standard deviation) of the soil pH sampled in 2016 (n = 13) and 2017 (n = 14) in the Medium-sized ski resort. Stars indicate significant differences (***p < 0.001) according to paired t-test.
Table 3.
Mean values (± standard deviation) of the soil pH sampled in 2016 (n = 13) and 2017 (n = 14) in the Medium-sized ski resort. Stars indicate significant differences (***p < 0.001) according to paired t-test.
| Year | Piste | Control |
| 2016 | 6.385 (± 0.793)*** | 5.558 (± 0.846)*** |
| 2017 | 6.947(± 0.660)*** | 5.845 (± 0.556)*** |
Disclaimer/Publisher’s Note: The statements, opinions and data contained in all publications are solely those of the individual author(s) and contributor(s) and not of MDPI and/or the editor(s). MDPI and/or the editor(s) disclaim responsibility for any injury to people or property resulting from any ideas, methods, instructions or products referred to in the content. |
© 2026 by the authors. Licensee MDPI, Basel, Switzerland. This article is an open access article distributed under the terms and conditions of the Creative Commons Attribution (CC BY) license (http://creativecommons.org/licenses/by/4.0/).
Copyright: This open access article is published under a Creative Commons CC BY 4.0 license, which permit the free download, distribution, and reuse, provided that the author and preprint are cited in any reuse.