

Submitted:
15 September 2026
Posted:
16 September 2026
You are already at the latest version
Abstract
Contaminated chicken and turkey products are estimated to have caused about 25 percent of domestically acquired foodborne cases of salmonellosis in the United States during 2018 – 2022 [1]. Process interventions reduce most but not all Salmonella, but salmonellosis has remained a major health concern [2]. Little research has considered the role contaminated poultry intestinal tracts play in Salmonella control. This paper examines the effect of intestinal (cecal) Salmonella on Salmonella in finished chicken carcasses using regression modeling and data from the United States Department of Agriculture, Food Safety and Inspection Service (USDA, FSIS). The paper finds that better control of Cecal Salmonella could reduce finished carcass Salmonella by up to 1 percent at establishments with weak pre-slaughter/farm controls and improved process controls could reduce carcass Salmonella by up to 2 percent at establishments with weak process controls. Results are consistent across 16 different combinations of serotype groups and working datasets and suggest that improved pre-slaughter/farm-level and finishing control can reduce Salmonella in chicken slaughter establishments with weak controls.
Keywords:
FSIS
; food safety
; Salmonella
; chicken ceca
; chicken carcass
; cecal Salmonella
1. Introduction
Contaminated chicken and turkey products are estimated to have caused about 25 percent of domestically acquired foodborne cases of salmonellosis in the United States during 2018 – 2022 [1]. Since 1996, the United States Department of Agriculture’s Food Safety Inspection Service (USDA, FSIS) has relied on the standards established under the Pathogen Reduction and Hazard Analysis Critical Control Point (PR/HACCP) rule to control Salmonella in chicken carcasses and other USDA, FSIS regulated products [3]. Industry Salmonella rates dropped sharply starting in 2006 when USDA, FSIS announced plans to publicly disclose Salmonella test results of chicken carcass establishments [4]. Since 2012, however, Salmonella rates have changed very little (Figure 1).
Environmental cross-contamination and feed withdrawal are major sources of Salmonella contamination [7,8,9]. Other sources include feed, water, chicken ceca, and others [10]. Process interventions reduce Salmonella on the skin and feathers, but pre-scald brushing, picking, and rupture of gastrointestinal tracts (crop, ceca, etc.) cross-contaminates all birds and embeds Salmonella into bird skin [11,12,13].
Process interventions have greatly reduced Salmonella but have been unable to completely control post-chill (Product) Salmonella. Research has shown that Salmonella incidence dropped 92 percent and process interventions reduced Salmonella serovar complexity [2,14]. Relatively little has considered the role of Salmonella in the chicken intestinal tract may play in Product Salmonella.
Salmonella contaminates the ceca of young chicks but diminishes over the grow out period and amounts to about 25 percent of samples after grow-out [15,16]. Research has shown that matching Salmonella strains found in the gastrointestinal tract (Cecal Salmonella) to Product Salmonella in the carcass through molecular tracking provides an accurate association of the Cecal Salmonella to Product Salmonella link [17]. Cecal contents are the best samples to evaluate the broilers’ intestinal microbiota because fecal material is contaminated from various sources [18,19].
Several small case studies have shown that serotypes of Cecal Salmonella match serotypes in Product Salmonella) [20,21].[i] Other research found that Cecal Salmonella PFGE types did not always correlate with Product Salmonella in chickens slaughtered in 6 Belgian establishments [10]. Another study found no relation between turkey Cecal Salmonella and ground turkey Product Salmonella, but they used only one cecum, which is not representative of a flock, and compared it to ground turkey, which has diverse and pooled serotypes [22].
Case studies with one or a few establishments are important, but they do not show a systematic and broad-based correlation between Cecal Salmonella and Product Salmonella, making the Cecal Salmonella - Product Salmonella linkage unclear. This paper differs from previous studies in that it uses broad-based datasets to examine the association of Cecal Salmonella and carcass finishing process controls with Product Salmonella. The paper uses regression analyses and chicken Cecal and Product Salmonella data collected by USDA, FSIS in nationally representative National Antimicrobial Resistance Monitoring System (NARMS) and PR/HACCP data collection efforts [5,23].
The paper focuses on whether groups of Salmonella serotypes in the ceca, including serotypes of public health importance, are associated with the same groups of Salmonella serotypes in finished broiler carcasses. The paper finds that Cecal Salmonella is positively associated with Product Salmonella. The findings are robust across multiple regressions and groups of Salmonella serotypes and suggest that establishments with weak cecal controls could improve performance on Product Salmonella tests by up to 1 percent of samples tested
2. Materials and Methods
Researchers have used regression analyses to examine the impact of processing interventions, as measured by historic establishment Salmonella rates, establishment size, and the performance of sanitation tasks and tasks mandated under PR/HACCP on Product Salmonella [4,24,25]. This paper incorporates features used in those studies in a model that examines the association of Cecal Salmonella with Product Salmonella. Our aim is to show that changes in Cecal Salmonella are associated with changes in carcass Salmonella across various serotype groups.
2.1. Data
All data come from USDA, FSIS. Salmonella test results for finished chicken carcasses come from tests for Salmonella used to monitor process control (79 FR 49566) in routine USDA, FSIS sampling under PR/HACCP. Data are available from 2000-2025. Currently, USDA, FSIS samples four finished chicken carcasses per month for higher volume establishments [5]. USDA, FSIS’ NARMS Salmonella test data are used for estimates of the Salmonella rate for the chicken ceca (Cecal Salmonella) and are available from 2013 to 2025 [23]. ii
NARMS cecal sampling is based on production volume, with larger establishments sampled more than smaller ones. The Salmonella rate pi is defined as , where si is the number of samples positive for Salmonella over the test period; Ni is the total number of samples tested.
The matched NARMS – PR/HACCP Salmonella data overlaps over 2013 -2025. Data before 2018 were excluded because USDA, FSIS changed the rinsate solution used in chicken sampling in 2016 after it was found that Salmonella test results could be compromised by the residual antimicrobials in the rinsates used in sampling [26]. The change led to higher, but more accurate, estimates of the Salmonella rate [27].
The NARMS and PR/HACCP Salmonella data are two independent datasets that occur simultaneously in time. Thus, finished carcass and cecal samples come from different flocks of chickens and are tested on different days. Finished carcass and cecal samples do come from the same establishment and are assumed to be representative of Product and Cecal Salmonella populations in finished chicken carcasses and pre-harvest chickens at the establishment-level.
PR/HACCP sampling provides an ample number of test samples to compute Product Salmonella rates that are representative of the establishment’s rate. USDA, FSIS used 7,752 carcass samples in 2022 to verify performance standards for approximately 180 establishments. By contrast, NARMS cecal sampling required only 724 Cecal samples to reach its isolate collection goals in 2022; only 41 establishments had more than 3 cecal samples.
For valid statistical regression results, it is necessary to have at least 30 establishment-year observations in the dataset; each observation must also have an ample number of cecal samples to compute Cecal Salmonella rates. Thus, we considered only establishments with at least 8 cecal samples to ensure enough cecal samples for calculation of the Cecal Salmonella rate. To gain statistical precision, we use two years of NARMS and PR/HACCP samples per time unit, yielding 81 establishments and 184 establishment-level observations across three periods: 2020-21, 2022-23, and 2024-25. Because more cecal samples per establishment may give a more representative measure of Salmonella in the ceca, we created another two-year dataset with a minimum of 16 cecal samples per establishment, which allows for 32 establishments with 72 observations in our dataset.
As a robustness check, we also created two three-year datasets – one with 8 cecal samples per establishment and another with 16 cecal samples per establishment. There are two periods: the years 2020-2022 and 2023-2025.
For each dataset, we created four Salmonella serotype groups distinguished by Salmonella virulence identified in previous [28,29,30]. By using four different Salmonella serotype groups, we will be able to observe whether model results vary with the choice of serotype group and evaluate the robustness of our empirical tests. The four Salmonella serotype groups include: (1) General Salmonella which includes all 79 Salmonella serotypes in our dataset, (2) EpiX-12 Salmonella which includes the 12 serotypes identified by EpiX Analytics in a risk assessment commissioned by USDA, FSIS as more virulent (Muenchen, I4,[5],12: i-, Typhimurium, Newport, Berta, Enteritidis, Litchfield, Saintpaul, Dublin, I4,[5],12: b-, Blockley, and Hadar), (3) General Minus 12 Salmonella which includes the 67 serotypes (out of 79) that are not among the EpiX-12 Salmonella serotypes but occur in our data, and (4) Marshall-3 Salmonella which includes 3 serotypes (Enteritidis, Infantis, and Blockley) identified in outbreak data [29,31].
We use several control variables in our regression. We account for establishment size with a variable equal to millions of chickens slaughtered. Safety task variables are specified in terms of noncompliance rates of Standard Sanitation Operating Procedures (SSOPs) and tasks required under HACCP. Noncompliance rates are defined as: , where NCit is the number of noncompliant tasks and Taskit is the number of tasks performed.
Researchers have used quintiles of performance based on establishment-level mean Salmonella rates as a measure of historic Product Salmonella rate and found that better historical performance on Salmonella tests led to lower current test results [24,25]. We use this measure to evaluate differences in Salmonella control between establishments.
Following previous research, we created quintiles of performance based on establishment-level mean Salmonella rates over two periods: 2018-2019 and the 4 years before the rinsates change in mid-2016 [24,25]. For each period, establishments with the lowest Salmonella rates, which are assumed to come from establishments with the strongest process controls, were placed in quintile 5; establishments with the highest Salmonella rates (weakest process controls) were put in quintile 1. Then, quintiles were added by establishments across the two periods to obtain cumulative quintiles that ranged from 2 -10. Establishments were then assigned to four Food Safety Groups (FSGs) based on cumulative scores. We use only four FSGs to ensure an ample number of establishments in each FSG. Establishments with scores of 9 or 10, 7 or 8, 5 or 6, and less than 5 assigned to FSG4, FSG3, FSG2, and FSG1, respectively. Under this arrangement, establishments in FSG4 have the strongest process controls, and establishments in FSG1 have the weakest process controls.
Table 1 and Table 2 show the number of Salmonella positives, Cecal Salmonella rates, and variables that account for millions of chickens slaughtered and noncompliance rates for SSOPs and HACCP tasks. Table 1 shows that the 2-year, 8-cecal sample datasets have 184 observations and 81 establishments and the 2-year, 16-cecal sample datasets have 72 observations and 32 establishments. Table 2 shows that the 3-year, 8-cecal sample datasets have 167 observations and 100 establishments and the 3-year, 16-sample datasets have 96 observations and 56 establishments.
2.2. Model
Model 1 is used to examine the association between Product and Cecal Salmonella rates in 16 regressions that vary by Salmonella group and dataset. The dependent variable, the Product Salmonella rate, is a ratio variable that falls between zero and one, making Ordinary Least Squares (OLS) inappropriate. Instead, we use a fixed-effects generalized linear model (FEGLM), which controls unobserved establishment-specific factors through establishment fixed effects ). FEGLM specifies a binomial distribution for the dependent variable with a logistic linking function that ensures outcomes fall between zero and one. Outcomes are the number of Product Salmonella positives (si) given a specified number of test samples (Ni).
, family (binomial Ni), link(logit)
where:
si,t : Number of Product Salmonella positives;
Ni,t: Number of samples tested for Salmonella.
Ci,t : NARMS Cecal Salmonella rate, with the parameter indicating the influence of Cecal Salmonella on Product Salmonella.
FSGi : food safety groups is a vector that includes four groups of establishments [FSG1, FSG2, FSG3, and FSG4] categorized by historical Salmonella testing performance, ranked from establishments with the highest Salmonella rates, which are assumed to have the weakest process controls (FSG1) to establishments with lowest Salmonella rates, which are assumed to have the strongest process controls (FSG4). The intermediate FSGs (FSG2 and FSG3) serve as reference groups because our main interest is to evaluate the performance of establishments with the strongest relative to establishments with the weakest process controls. The parameter for the vector FSG represents the influences of FSG1 and FSG4 on Product Salmonella.
xi,t: Vector of establishment characteristics that includes millions of chickens slaughtered and the safety task variables (non-compliant rates for Operational (Op) SSOPs, Pre-Op SSOPs, and HACCP tasks). Table 1 and Table 2 give means and ranges for all continuous variables.
Tt : Time trend is a trend variable starting at first period.
We use STATA to estimate GLM regressions. Each regression was adjusted for establishment level clustered standard errors. GLM models give parameter values in log-odds and require exponential transformation for direct interpretation. We report parameter estimates as marginal effects and use the Stata’s “Margin at ()” command to estimate Product Salmonella at key values, such as the mean Cecal Salmonella rate of establishments in the first and fourth quartile of Cecal Salmonella rates [32]. Estimates of Product Salmonella are the average all Product Salmonella estimates computed using the previously fitted regression and every observation in the dataset at the specific point, such as the 4th quartile of Cecal Salmonella rates.
3. Results
Figure 2 shows mean Product Salmonella of better- and worse-performing Cecal Groups (CGs) and FSGs using the two-year data with 8 cecal sample data. CGs are quantiles of the Cecal Salmonella rate and are useful for showing how Product Salmonella varies with Cecal Salmonella. They are not used in the regression. CG1 establishments fall within the quartile that has the highest Cecal Salmonella rates and are assumed to have weak cecal controls; CG4 establishments are in the quartile with the lowest Cecal Salmonella rates and are assumed to have strong cecal controls. Figure 2 shows that the FSGs and CGs with strong control controls (FSG4 and CG4) had the lowest Product Salmonella rates. Pairwise differences between the establishments with the strongest cecal controls (CG4) and those with the weakest controls (CG1) and between establishments with the strongest and weakest process controls (FSG4 and FSG1) are significant.
In Table 3 and Table 4 we give regression results using the 8-sample and 16-sample, 2-year and 3-year datasets for each Salmonella group and Model 1. Results given in Table 3 show that that Cecal Salmonella is significant and positive in all cases and FSG4 is significant and negative in 6 of 8 cases. Other variables are not significant. Using the “Margins at” command in Stata, we find that there are 0.10 and 0.137 decreases in Product General Salmonella positives associated with 10 percent decreases in the Cecal General Salmonella rate for the 8- and 16-sample regressions. These are substantial effects, but we want to directly compare estimates of Product Salmonella due to the Cecal Salmonella rate (a continuous variable) to FSG effects (a dummy variable). Thus, we estimate the model using mean Cecal Salmonella rates associated with the first and fourth quartiles of cecal control and compare those results to the first and fourth quartiles of process control (FSG1 and FSG4).
For Product General Salmonella and the 2-year 8-sample dataset, we estimate that establishments in the fourth quantile of cecal control (strongest cecal control) had 1 fewer Product Salmonella positive than establishments in the first quantile of cecal control (weakest cecal control). Table 3, last row shows the difference in percent Product Salmonella between establishments with the weakest and strongest process control is 0.9 percent of all samples tested. Differences between establishments with the strongest and intermediate controls (third and second quartiles) were 0.26 and 0.51 percents. These differences can be interpreted as the improvements that establishments with weaker cecal controls would achieve if they performed at a level equal to establishments with the strongest cecal controls.
Model estimates show that establishments in FSG4 (strongest process controls) have 2.14 fewer Salmonella positives than establishments in FSG1 (weakest process controls). Table 3, second last row shows the reduction in percent Salmonella that the establishment with the weakest process controls (FSG1) would achieve if it performed at a level equal to an establishment with the strongest control (FSG4). It shows that the improvement in Product Salmonella General would 1.9 percent of all samples tested. Table 3, Column 2 gives similar results for the 2-year 16-sample dataset.
Columns 3 and 4 give results for Product Epix-12 Salmonella. Results show that differences in Product Epix-12 Salmonella are larger between establishments with the strongest and weakest cecal controls than for establishments with the strongest and weakest process controls (FSGs)-- 0.45 percent for Cecal Salmonella and 0.25 for FSGs in the 2-year 8-observation data. Results for Marshal-3 (columns 5 and 6) show that improvements in Product Marshal-3 would be substantially greater for cecal controls. For Product General Minus 12 Salmonella (columns 7 and 8), differences in percent Product Salmonella positives between establishments with the strongest and weakest cecal controls was 1.10 percent while differences between establishments with the strongest and weakest process controls (FSG4 and FSG1) were 1.48 percents of all samples tested for the 2-year 8-observation data. Overall, results suggest that process controls give a larger improvement for Product General Salmonella and Product General-12 Salmonella and cecal controls yielded a larger benefit for Epix-12 Salmonella and Marshal-3 Salmonella.
Table 4 gives results for 8 regressions using the 3-year 8-cecal sample and 16-cecal sample datasets. The Wald Chi-square statistics and Cecal Salmonella are significant in all cases; FSG4 and FSG1 are significant in 12 of 16 cases. Results for the 3-year 8-cecal sample dataset are like results given in Table 3 except for a few differences. Marshall-3 Salmonella has smaller changes due to process controls in the 2-year data, and Product General Minus-12 Salmonella was about 1-percent greater for the 3-year 16-cecal sample dataset than for the 2-year dataset.
Our dataset spanned the SARS Covid-19 pandemic which could have affected our results. Table A1 and Table A2 in the appendix giving results using datasets that use the 2-year data over 2022-25 and the 3-year data over 2023-25, which are outside the SARS Covid-19 period. Results are like those given in Table 3 and Table 4 in that the Cecal Salmonella and FSG4 are associated with Product Salmonella in 15 of 16 and 14 of 16 cases, respectively. We also tested our model using single serotypes: Salmonella Enteritidis, Infantis, and Typhimurium (Table A3 and Table A4). Results show that Cecal Salmonella is consistently positively associated with Product Salmonella.
Overall, results suggest that both Cecal Salmonella and historic process controls have strong associations with Product Salmonella. Differences in Product General Salmonella due to differences in cecal controls range from 0.9 to 1.45 percent of Salmonella samples tested whereas differences for due to process controls are about 1.9 to 3.32 percent of Salmonella samples tested. Differences for Product Epix-12 Salmonella cecal controls vary from 0.42 to 0.63 percent of Salmonella samples and process controls range from 0.123 to 0.66 percent of Salmonella samples. Overall, these results mean that both processing (as measured by FSGs) and pre-slaughter farm-level controls have substantial impacts, and those impacts may vary by Salmonella group. One caveat is that we could not control for pre-slaughter/farm-level Salmonella control practices. Thus, it is possible that our results capture the impact of both Cecal Salmonella and pre-slaughter controls on Product Salmonella.
4. Discussion
This paper used NARMS Salmonella test results for chicken cecal samples and PR/HACCP Salmonella test results for finished chicken carcasses to explore the association between Cecal- and Product-Salmonella. The paper finds that better control of Cecal Salmonella and better historical process control is associated with reduced levels of Product Salmonella. Results are consistent across 16 regressions using 16 different combinations of serotype groups and working datasets. The paper illustrates the extent to which Salmonella could be reduced if establishments with weak controls improved their performance on Salmonella tests to that of establishments with strong controls. It finds that improving the Cecal Salmonella rate from the weakest (first quantile) to strongest (fourth quantile) level of Cecal Salmonella control would reduce the prevalence of Product General Salmonella by about 1 percent and reduce the prevalence of Product Epix-12 Salmonella by about one/half percent. Improvements in finishing operations from establishments with weak to strong process controls would reduce the prevalence of Product General Salmonella by about 2 percent and reduce the prevalence of Product Epix-12 Salmonella by about one/quarter percent. These are large reductions in the context of a mean industry Salmonella rate of about 3.0 percent and mean industry Epix-12 Salmonella rate of 0.65 percent.
Results are consistent with case studies that have shown that Salmonella exists pre-slaughter in the ceca and in the chicken carcass in the same slaughterhouses [20,21]. Our results differ from these two case studies in three important ways. First, using NARMS cecal sample data and USDA, FSIS’s PR/HACCP data, we were able to construct broad comprehensive datasets capturing up to 100 different establishments with data covering 2020-2025. Second, our results show a strong relationship between Salmonella in the ceca and Salmonella in the finished carcass that persisted across three groups of Salmonella serotypes. Third, by using four different datasets, we showed that the relationship between Cecal- and Product-Salmonella is robust across definitions of the Cecal- and Product-Salmonella rates.
Results are robust but caution is warranted because NARMS sampling is designed to study antibiotic resistance across the U.S. population of broiler chicken and may not capture a representative sample of Cecal Salmonella at the individual establishment level. Moreover, relatively few cecal samples are collected per establishment, meaning one Salmonella positive sample could lead to large changes in Cecal Salmonella rates. To help overcome cecal sample uncertainty, we created four working datasets that allowed us to examine the data from four different vantage points. The robust relationship between Cecal and Product Salmonella should be further examined with a follow-up study specifically designed to evaluate the Cecal-Product Salmonella link inclusive of Salmonella serotypes and levels, and sampling of cloaca, crops, vent feathers or footpads as indicated in a turkey carcass mapping study [33].
5. Conclusion
USDA, FSIS and the chicken slaughter industry have made substantial progress in reducing Salmonella in chicken carcasses over 2000-2026. However, cases of salmonellosis remain a serious public health concern. Results of this paper suggest that further reductions in Salmonella are possible through improved establishment-level and pre-slaughter/farm-level controls at establishments with weak controls. We estimate that improved pre-slaughter controls could reduce the percent of samples testing positive for General Salmonella by 1 percent of samples tested and the percent of samples testing positive for Epix-12 Salmonella by 0.5 percent of samples tested. These findings are based on analyses using nationwide NARMS sampling data designed for the study of antimicrobial resistance across the U.S. population of broiler chickens and may not capture a representative sample of Cecal Salmonella at the individual establishment level. Nonetheless, the results of this paper point to the importance of considering Cecal Salmonella when devising food safety process control practices. It is well established that Salmonella from the ceca cross contaminates other birds when the cecum bursts during slaughter operations and becomes embedded into chicken follicles [34]. Our results suggest processing steps after cecum removal in chicken slaughter operations are not completely effective in controlling Salmonella. Thus, it appears researchers offer sound advice when they emphasize the importance of addressing Salmonella at the pre-harvest (farm) level [34].
Author Contributions
Conceptualization, 90% and 10%; methodology, 60% and 40%; software, 100%, 0%; validation, 100%; formal analysis, 70% and 30%; investigation, 100%; resources, 100%; data curation, 100%; writing—original draft preparation, 100%.; writing—review and editing, 70% and 30%; visualization, 100%; supervision, 100%; project administration, 100%. All authors have read and agreed to the published version of the manuscript.
Funding
This research received no external funding.
Institutional Review Board Statement
This research required no Institution Review Board Statement.
Informed Consent Statement
Not applicable.
Data Availability Statement
NARMS Salmonella data are publicly available on the USDA, FSIS website. Chicken carcass Salmonella data and data on sanitation and HACCP tasks and millions of chickens slaughtered come from FSIS administrative files and cannot be shared.:
Acknowledgments
We are grateful to USDA, FSIS personnel, including those in the field and laboratories, for their efforts in nationwide sample collection, analysis, and the generation and publication of data.
Conflicts of Interest
The authors declare no conflicts of interest.
Abbreviations
| CG | Cecal Group |
| CG1 | Cecal Groups with weakest cecal controls |
| CG4 | Cecal Group with strongest cecal controls. |
| FSG | Food Safety Group |
| FSG1 | Food Safety Group with strong weak controls |
| FSG4 | Food Safety Group with strong process controls |
| NARMS | National Antimicrobial Resistance Monitoring System |
| NC | Non-compliance |
| NCR | Non-compliance rate |
| OLS | Ordinary Least Squares |
| FEGLM | Fixed Effects General Linear Model |
| PFGE | Pulsed-Field Gel Electrophoresis |
| PR/HACCP | Pathogen Reduction and Hazard Analysis Critical Control Point |
| SSOP | Standard Sanitation Operating Procedures |
| USDA, FSIS | United States Department of Agriculture, Food Safety and Inspection Service |
Appendix A

Table A1.
Marginal Effects of Model 1: The effect of the Cecal Salmonella rate and Food Safety Group on the number of Salmonella positives in chicken carcasses over two two-year periods over 2022-2025 after SARS Covid-19 using 8-and 16-cecal sample data. (cluster-robust standard errors in parentheses).
Table A1.
Marginal Effects of Model 1: The effect of the Cecal Salmonella rate and Food Safety Group on the number of Salmonella positives in chicken carcasses over two two-year periods over 2022-2025 after SARS Covid-19 using 8-and 16-cecal sample data. (cluster-robust standard errors in parentheses).
| ---------------------------- Salmonella group-------------------------- | |||||||||||||||||
| - Product General- | --ProductEpiX-12-- | -Product Marshall-3- | Product General Minus 12 | ||||||||||||||
| Cecal Samples | 8-samples | 16-samples | 8-samples | 16-samples | 8-samples | 16-samples | 8-samples | 16-samples | |||||||||
| Variable | (1) | (2) | (3) | (4) | (5) | (6) | (7) | (8) | |||||||||
| Cecal General | 2.088** (0.831) |
2.559** (1.332) |
- | - | - | - | - | - | |||||||||
| CecalEpiX-12 | - | - | 1.896** (0.828) |
2.131 (1.436) |
- | - | - | - | |||||||||
| Cecal Marshall-3 | - | - | - | - | 3.412*** (0.638) |
4.669*** (1.129) |
|||||||||||
| Cecal General Minus 12 | - | - | - | - | - | - | 2.313*** (0.852) |
2.478* (1.435) |
|||||||||
| FSG 4 | -1.650*** (0.342) |
-1.704*** (0.535) |
-0.318** (0.158) |
-0.140 (0.339) |
-0.492 (0.240) |
-0.723* (0.437) |
-1.352*** (0.316) |
-1.565*** (0.502) |
|||||||||
| FSG 1 | 0.278 (0.498) |
0.928 (0.752) |
-0.120 (0.185) |
-0.367 (0.359) |
-0.348 (0.307) |
-0.120 (0.754) |
0.382 (0.423) |
1.102 (0.716) |
|||||||||
| Trend | -0.013 (0.064) |
0.281 (0.309) |
-0.028 (0.082) |
0.097 (0.159) |
0.066 (0.120) |
0.437** (0.225) |
-0.006 (0.184) |
0.246 (0.322) |
|||||||||
| Controls for Establishment Characteristics | Yes | Yes | Yes | Yes | Yes | Yes | Yes | Yes | |||||||||
| Observations | 123 | 47 | 123 | 47 | 123 | 47 | 123 | 47 | |||||||||
| Log Pseudolikelihood | -255.2 | -94.7 | -132.1 | -51.8 | -171 | -67.9 | -235.9 | -88.5 | |||||||||
| Wald χ2 | 43.1*** | 55.9*** | 11.4 | 7.79 | 61.4*** | 62.0*** | 36.5** | 34.5*** | |||||||||
Single, double, and triple asterisks (*, **, ***), represent significance at the 10%, 5%, and 1%. Product General includes all Salmonella serotypes; Product EpiX-12 includes the following Salmonella serotypes: Muenchen, I4,[5],12: i-, Typhimurium, Newport, Berta, Enteritidis, Litchfield, Saintpaul, Dublin, I4,[5],12: b-, Blockley, and Hadar; Marshall-3 Salmonella includes Salmonella Enteritidis, Infantis, and Blockley; Product General Minus 12 Salmonella includes all serotypes except those in EpiX-12 Salmonella. FSG4 is a food safety group that represents establishments with strong process controls; FSG1 is a food safety group that represents establishments with weak process controls; PRE-OP NCPLY SSOP is non- compliance rate for Standard Sanitation Operating Procedures (SSOP) prior to operations and OP NCPLY SSOP is during operations; HACCP NCPLY is non- compliance rate for tasks required under PR/HACCP.
Table A2.
Marginal Effects of Model 1: The effect of the Cecal Salmonella rate and Food Safety Group on the number of Salmonella positives in chicken carcasses over one three-year period after SARS Covid-19 over 2023-2025, using 8- and 16-cecal sample data. (cluster-robust standard errors in parentheses).
Table A2.
Marginal Effects of Model 1: The effect of the Cecal Salmonella rate and Food Safety Group on the number of Salmonella positives in chicken carcasses over one three-year period after SARS Covid-19 over 2023-2025, using 8- and 16-cecal sample data. (cluster-robust standard errors in parentheses).
| ---------------------------- Salmonella group-------------------------- | |||||||||||
| Product General | Product EpiX-12 | -Product Marshall-3- | Product General Minus 12 | ||||||||
| Cecal samples | 8-samples | 16-samples | 8-samples | 16-samples | 8-samples | 16-samples | 8-samples | 16-samples | |||
| Variable | (1) | (2) | (3) | (4) | (5) | (6) | (7) | (8) | |||
| Cecal General | 4.747*** (1.627) |
6.143** (2.427) |
- | - | - | - | - | - | |||
| Cecal EpiX -12 | - | - | 3.592*** (1.120) |
2.358** (1.664) |
- | - | - | ||||
| Cecal Marshall-3 | - | - | - | 6.303*** (1.248) |
8.091*** (1.837) |
||||||
| Cecal General Minus 12 | - | - | - | - | - | - | 6.178*** (1.385) |
7.916** (2.018) |
|||
| FSG 4 | -2.435*** (0.661) |
-3.450*** (0.862) |
-0.592** (0.300) |
-0.587 (0.417) |
-1.148*** (0.381) |
-1.631*** (0.535) |
-1.820*** (0.571) |
-2.850*** (0.650) |
|||
| FSG 1 | 0.664 (0.779) |
1.578 (1.376) |
0.322 (0.369) |
0.121 (0.512) |
-0.135 (0.510) |
-0.571 (0.770) |
0.216 (0.622) |
0.919 (1.044) |
|||
| Controls for Establishment Characteristics | Yes | Yes | Yes | Yes | Yes | Yes | Yes | Yes | |||
| Observations | 85 | 48 | 85 | 48 | 85 | 48 | 85 | 48 | |||
| Log Pseudolikelihood | -203 | -116 | -120 | -70 | -151 | -86 | -187 | -104 | |||
| Wald χ2 | 31.1*** | 40.0*** | 18.6*** | 8.0 | -48.3*** | 45.3*** | 38.7*** | 43.9*** | |||
Single, double, and triple asterisks (*, ***, **) represent significance at the 10%, 5%, and 1%. Product General includes all Salmonella serotypes; Product EpiX-12 includes the following Salmonella serotypes: Muenchen, I4,[5],12: i-, Typhimurium, Newport, Berta, Enteritidis, Litchfield, Saintpaul, Dublin, I4,[5],12: b-, Blockley, and Hadar; Marshall-3 Salmonella includes Salmonella Enteritidis, Infantis, and Blockley; Product General Minus 12 Salmonella includes all serotypes except those in EpiX-12 Salmonella. FSG4 is a food safety group that represents establishments with strong process controls; FSG1 is a food safety group that represents establishments with weak process controls; PRE-OP NCPLY SSOP is non- compliance rate for Standard Sanitation Operating Procedures (SSOP) prior to operations and OP NCPLY SSOP is during operations; HACCP NCPLY is non- compliance rate for tasks required under PR/HACCP.
Table A3.
Marginal Effects of Model 1 and Single Serotypes: The effect of the Cecal Salmonella rate and Food Safety Group on the number of Salmonella positives in chicken carcasses over three two-year periods over 2020-2025 using 8-and 16-cecal sample data. (cluster-robust standard errors in parentheses).
Table A3.
Marginal Effects of Model 1 and Single Serotypes: The effect of the Cecal Salmonella rate and Food Safety Group on the number of Salmonella positives in chicken carcasses over three two-year periods over 2020-2025 using 8-and 16-cecal sample data. (cluster-robust standard errors in parentheses).
| ---------------------------- Salmonella group-------------------------- | ||||||||
| - Enteritidis- | --Infantis -- | -Typhimurium- | ||||||
| Cecal Samples | 8-samples | 16-samples | 8-samples | 16-samples | 8-samples | 16-samples | ||
| Variable | (1) | (2) | (3) | (4) | (5) | (6) | ||
| Enteritidis | 1.450** (0.677) |
3.179*** (1.212) |
- | - | - | - | ||
| Infantis | - | - | 3.742*** (0.474) |
4.450*** (1.317) |
- | - | ||
| Typhimurium | - | - | - | - | 1.559*** (0.332) |
5.773*** (2.226) |
||
| FSG 4 | -0.182* (0.101) |
0.101 (0.323) |
-0.499** (0.250) |
-0.379 (0.317) |
-0.081 (0.090) |
-0.288 (1.004) |
||
| FSG 1 | 0.050 (0.155) |
-0.084 (0.752) |
-0.260 (0.281) |
-0.155 (0.576) |
-0.063 (0.086) |
- | ||
| Trend | 0.009 (0.026) |
0.074 (0.049) |
-0.144 (0.084) |
-0.050 (0.133) |
0.009 (0.026) |
0.124 (0.206) |
||
| Controls for Establishment Characteristics | Yes | Yes | Yes | Yes | Yes | Yes | ||
| Observations | 183 | 72 | 183 | 72 | 183 | 72 | ||
| Log Pseudolikelihood | -139.0 | -56.0 | -211.3 | -90.7 | -88.7 | -33.5 | ||
| Wald χ2 | 16.9** | 14.8* | 82.2*** | 54.2*** | 71.1*** | - | ||
Single, double, and triple asterisks (*, **, ***), represent significance at the 10%, 5%, and 1%. FSG4 is a food safety group that represents establishments with strong process controls; FSG1 is a food safety group that represents establishments with weak process controls; PRE-OP NCPLY SSOP is non- compliance rate for Standard Sanitation Operating Procedures (SSOP) prior to operations and OP NCPLY SSOP is during operations; HACCP NCPLY is non- compliance rate for tasks required under PR/HACCP.
Table A4.
Marginal Effects of Model 1 and Single Serotypes: The effect of the Cecal Salmonella rate and Food Safety Group on the number of Salmonella positives in chicken carcasses over two three-year periods over 2020-2025, using 8- and 16-cecal sample data. (cluster-robust standard errors in parentheses).
Table A4.
Marginal Effects of Model 1 and Single Serotypes: The effect of the Cecal Salmonella rate and Food Safety Group on the number of Salmonella positives in chicken carcasses over two three-year periods over 2020-2025, using 8- and 16-cecal sample data. (cluster-robust standard errors in parentheses).
| ---------------------------- Salmonella group-------------------------- | ||||||||
| - Enteritidis- | --Infantis -- | -Typhimurium- | ||||||
| Cecal Samples | 8-samples | 16-samples | 8-samples | 16-samples | 8-samples | 16-samples | ||
| Variable | (1) | (2) | (3) | (4) | (5) | (6) | ||
| Enteritidis | 3.132*** (0.993) |
4.214** (2.092) |
- | - | - | - | ||
| Infantis | - | - | 5.237*** (1.011) |
7.088*** (1.621) |
- | - | ||
| Typhimurium | - | - | - | - | 2.820*** (0.867) |
3.900** (1.595) |
||
| FSG 4 | -0.279* (0.144) |
-0.404 (0.369) |
-0.662*** (0.236) |
-0.872** (0.358) |
-0.138 (0.188) |
-0.171 (0.293) |
||
| FSG 1 | 0.128 (0.193) |
0.445 (0.446) |
-0.002 (0.311) |
-0.056 (0.478) |
-0.392 (0.288) |
0.221 (0.469) |
||
| Year_2024 | 0.043 (0.132) |
0.305 (0.234) |
-0.481** (0.239) |
-0.410 (0.301) |
-0.071 (0.531) |
0.008 (0.192) |
||
| Controls for Establishment Characteristics | Yes | Yes | Yes | Yes | Yes | Yes | ||
| Observations | 167 | 96 | 167 | 96 | 167 | 96 | ||
| Log Pseudolikelihood | -167.0 | -96.3 | -238.0 | -130.2 | -128.2 | -80.0 | ||
| Wald χ2 | 25.7** | 20.1** | 71.0*** | 60.3 | 43.6*** | 34.0*** | ||
References
- IFSAC. Interagency Food Safety Analytics Consortium. 2024. Available online: https://www.cdc.gov/ifsac/php/data-research/annual-reports/?CDC_AAref_Val=https://www.cdc.gov/ifsac/php/annual-reports/index.html.
- (accessed on 21 August 2026). accessed.
- Boynton, Tye O.; Haro, J.; Pelham, D.; Shaw, W. K. FSIS Poultry Exploratory Sampling Program Report. U.S. Department of Agriculture, Food Safety and Inspection Service, Athens, Georgia. and US Department of Agriculture, Food Safety and Inspection Service, 2023. Washington D.C. Accessed March 28, 2025. Available online: https://www.fsis.usda.gov/sites/default/files/media_file/documents/Exploratory_<i>Salmonella</i>_Sampling_Report_July2024.pdf (accessed on 10 September 2026).
- FSIS]. U.S. Department of Agriculture; Food Safety; and Inspection Service. Hazard Analysis and Critical Control Point (HACCP) Systems, Final Rule. Available online: www.govinfo.gov/content/pkg/FR-1996-07-25/pdf/96-17837.pdf (accessed on 21 August 2026).
- Ollinger, M.; Bovay, J. Producer Response to Public Disclosure of Food Safety Information. Am. J. Agric. Econ. 2020, 102(1), 186–201. [Google Scholar] [CrossRef]
- FSIS. U.S. Department of Agriculture; Food Safety; and Inspection Service. Sample Datasets and Documentation. Available online: https://www.fsis.usda.gov/news-events/publications/sample-datasets-and-documentation. (accessed on 21 August 2026).
- FSIS U.S. Department of Agriculture; Food Safety; and Inspection Service. Sampling Results for FSIS Regulated Products. Available online: https://www.fsis.usda.gov/science-data/sampling-program/sampling-results-fsis-regulated-products. (accessed on 9 September 2026).
- Ramirez, G.A.; Sarlin, L. L.; Caldwell, D. J.; Yezak, C. R.; Hume, M. E.; Courrier, D. E.; Deloach, J. R.; Hargis, B. M. Effect of Feed Withdrawal on the Incidence of Salmonella in the Crops and Ceca of Market Age Broiler Chickens. Poult. Sci. 1997, 76, 654–656. [Google Scholar] [CrossRef] [PubMed]
- Corrier, D. E.; Byrd, J. A.; Hargis, B. M.; Hume, M. E.; Bailey, R. H.; Stanker, L. H. Presence of Salmonella in the crop and ceca of broiler chickens before and after preslaughter feed withdrawal. J. Food Prot. 1999, 62(10), 1196–1199. [Google Scholar]
- Rasschaert, G.; Houf, K.; Godard, C.; Wildemauwe, C.; Pastuszczak-Frak, M.; De Zutter, L. Contamination of carcasses with Salmonella during poultry slaughter. J. Food Prot. 2008, 71(1), 146–152. [Google Scholar] [CrossRef] [PubMed]
- Thippareddi, H.; Singh, M.; Applegate, T.; Yadav, S. Critical Look at Reducing the Risk of Salmonella from Poultry—Part 1. Food Saf. Mag. 2022a. [Google Scholar]
- Hargis, B. M.; Caldwell, D.J.; Brewer, R.L.; Corrier, D.E.; Deloach, J. R. Evaluation of the chicken crop as a source of Salmonella contamination for broiler carcasses. Poult. Sci. 1995, 74, 1548–1552. [Google Scholar] [CrossRef] [PubMed]
- Russell, S. M. Controlling Salmonella in poultry production and processing; CRS Press/Taylor & Francis: Boca Raton, 2012. [Google Scholar]
- Zeng, H.; De Reu, K.; Gabriel, S.; Mattheus, W.; DeZutter, L.; Rasschaert, G. Salmonella prevalence and persistence in industrialized poultry houses. Poult. Sci. 2021, 100(4). [Google Scholar] [CrossRef] [PubMed]
- Richards, A. K.; Siceloff, A. T.; Simmons, M.; Tillman, G. E.; Shariat, N. W. Poultry Processing Interventions Reduce Salmonella Serovar Complexity on Postchill Young Chicken Carcasses as Determined by Deep Serotyping. J. Food Prot. 2024, 87, 100208. [Google Scholar] [CrossRef] [PubMed]
- Wang, J.; Vaddu, S.; Bhumanapalli, S.; Kataria, J.; Sidhu, G.; Leone, C.; Singh, M.; Dalloul, R. A.; Thippareddi, H. Colonization, spread and persistence of Salmonella (Typhimurium, Infantis and Reading) in internal organs of broilers. Poult. Sci. 2024, 103, 103806. [Google Scholar] [CrossRef] [PubMed]
- Manjankattil, S.; Wang, J.; Poudel, S.; Bailey, M.; Adhikari, Y.; Casco, K. G.; Fatima, A.; Raut, R.; Rahman, F. A.; Rochell; S. Bourassa, D. Survival and clearance dynamics of Salmonella in litter, carcasses, and internal organs of chickens fed different dietary fat sour. Poult. Sci. 2025, 104, 105819. [Google Scholar] [CrossRef] [PubMed]
- Boubendir, S.; Arsenault, J.; Quessy, S.; Thibodeau, A.; Fravalo, P.; Thériault, W. P.; Fournaise, S.; Gaucher, M. L. Salmonella contamination of broiler chicken carcasses at critical steps of the slaughter process and in the environment of two slaughter plants: Prevalence, genetic profiles, and association with the final carcass status. J. Food Prot. 2021, 84(2), 321–331. [Google Scholar] [CrossRef] [PubMed]
- Pauwels, J.; Taminiau, B.; Janssens, G.P.J.; Beenhouwer, M. de.; Delhalle, L.; Daube, G. Cecal drop reflects the chickens’ cecal microbiome, fecal drop does not. J. Microbiol. Methods. 2015, 117, 164–70. [Google Scholar] [CrossRef] [PubMed]
- Ijaz, U.Z.; Sivaloganathan, L.; Mckenna, A.; Richmond, A.; Kelly, C.; Linton, M. Comprehensive longitudinal microbiome analysis of the chicken cecum reveals a shift from competitive to environmental drivers and a window of opportunity for Campylobacter. Front. Microbiol. 2018, 15(9), 2452. [Google Scholar] [CrossRef] [PubMed]
- Kim, T.; Kim, Y.; Kim, H.; Moon, J. S.; Chon, J.; Song, W.Y.; Seo, K.-H. Prevalence of Salmonella serotypes isolated from clinical samples in chicken farms and meat in slaughterhouses in South Korea. Poult. Sci. 2025, 104. [Google Scholar] [CrossRef] [PubMed]
- Zhu, Y.; Lai, L.; Zou, L.; Yin, S.; Wang, C.; Han, X.; Xia, X.; Hu, K.; He, L.; Zhou, K.; Chen, S.; Ao, X.; Liu, S. Antimicrobial resistance and resistance genes in Salmonella strains isolated from broiler chickens along the slaughtering process in China. Int. J. Food Microbiol. 2017, 259, 43–51. [Google Scholar] [CrossRef] [PubMed]
- Tzirin, M. O.; Paredes, M. B.; Bannister, G.; Cason, E. E.; Byrd, J. A.; Howard, J. V.; Carlson, A.; Shariat, N.W.; Vipham, J. L. “Ceca May Not Serve as an Adequate Predictive Sample for Salmonella enterica in Ground Turkey” Food Prot. Trends 2026, 46(3), 255–262. [Google Scholar]
- FSIS NARMS. National Antimicrobial Resistance Monitoring System (NARMS) Cecal Sampling. n.d. Available online: www.fsis.usda.gov/news-events/publications/national-antimicrobial-resistance-monitoring-system-narms-cecal-sampling. (accessed on 21 August 2026).
- Ollinger, M.; Lim, K.H.; Knott, T. Incentives for Salmonella control in chicken broilers: Why the sampling protocol matters. Food Control. 2024, 155(110083), 1–8. [Google Scholar] [CrossRef]
- Lim, K.; Hu, L.; Zheng, Y.; Ollinger, M. A course correction? The correlation between GFSI-recognized certifications and Salmonella in raw chicken products. Food Control 2026, 181. [Google Scholar] [CrossRef]
- Gamble, G. R.; Berrang, M.E.; Buhr, R.J.; Hinton, A., Jr.; Bourassa, D.V.; Ingram, K.D.; Adams, E.S.; Feldner, P.W.; Johnston, J.J. Neutralization of Bactericidal Activity Related to Antimicrobial Carryover in Broiler Carcass Rinse Samples. J. Food Prot. 2017, 80, 685–691. [Google Scholar] [CrossRef] [PubMed]
- Williams, M. S.; Ebel, E.; Hretz, S.; Golden, N. Adoption of Neutralizing Buffered Peptone Water Coincides with Changes in Apparent Prevalence of Salmonella and Campylobacter of Broiler Rinse Samples. J. Food Prot. 2018, 81(11), 1851–1863. [Google Scholar] [CrossRef] [PubMed]
- FSIS. Quantitative Risk Assessment for Salmonella in Raw Chicken and Raw Chicken Products. 2024a. Available online: www.fsis.usda.gov/sites/default/files/media_file/documents/Chicken_SRA_July2024.pdf (accessed on 21 August 2026).
- Marshall, K. E.; Cui, Z.; Gleason, B. L.; Hartley, C.; Wise, M. E.; Bruce, B.B.; Griffin, P. M. An Approach to Describe Salmonella Serotypes of Concern for Outbreaks: Using Burden and Trajectory of Outbreak-related Illnesses Associated with Meat and Poultry. J. Food Prot. 2024, 87, 100331. [Google Scholar] [CrossRef] [PubMed]
- Fenske, G. J.; Pouzou, J.G.; Poullot, R.; Taylor, D.D.; Costard, S.; Zagmutt, F.J. The genomic and epidemiological virulence patterns of Salmonella enterica serovars in the United States. PLoS ONE 2023, 18(12), e0294624. [Google Scholar] [CrossRef] [PubMed]
- Analytics, EpiX. Quantitative Risk Assessment for Salmonella in Raw Chicken and Raw Chicken Products. Produced for FSIS under co-operative agreement FSIS-02152022. In FSIS: Washington, D.C.; Venu, A., Baker, N., Berhanu, T., Bilanovic, I., Ebel, E., Kumar, S., LaBarre, D., Posny, D., Saini, G., Williams, M., Zablotsky-Kufel, J., Eds.; 2024; Available online: https://www.fsis.usda.gov/sites/default/files/media_file/documents/Chicken_SRA_July2024.pdf (accessed on 21 August 2026).
- Stata. Margins —Adjusted predictions, predictive margins, and marginal effects. Available online: https://www.stata.com/manuals/cmmargins.pdf (accessed on 9 September 2026).
- Byrd, J.A.; Faust, S.; Caldwell, D.Y.; Swaggerty, C.L.; Genovese, K.; Kogut, M.H.; Carlson, A.V.; Johnson, C.; Poole, T.; Norman, K.N. Recovery of Salmonella from alternative anatomical sites after an oral challenge with three different Salmonella serotypes in turkeys. Poult. Sci. 2025, 104(9), 105406. Available online: https://www.sciencedirect.com/science/article/pii/S0032579125006509. [CrossRef] [PubMed]
- Thippareddi, H.; Singh, M.; Applegate, T.; Yadav, S. A Critical Look at Reducing the Risk of Salmonella from Poultry, Part 3: Processing Controls. Food Saf. Mag. 2022b. [Google Scholar]
| ii | NARMS is a collaboration of several U.S. agencies, including USDA, FSIS, that was initiated in 1996 to serve as a public health surveillance system that explores antimicrobial resistance across the food safety continuum. USDA, FSIS’ NARMS program for chicken focuses on antimicrobial resistance surveillance in Salmonella and Campylobacter. The purpose of NARMS data is to assess antimicrobial resistance (AMR) in Salmonella and other bacteria by obtaining Salmonella isolates from ceca. |
Figure 1.
.
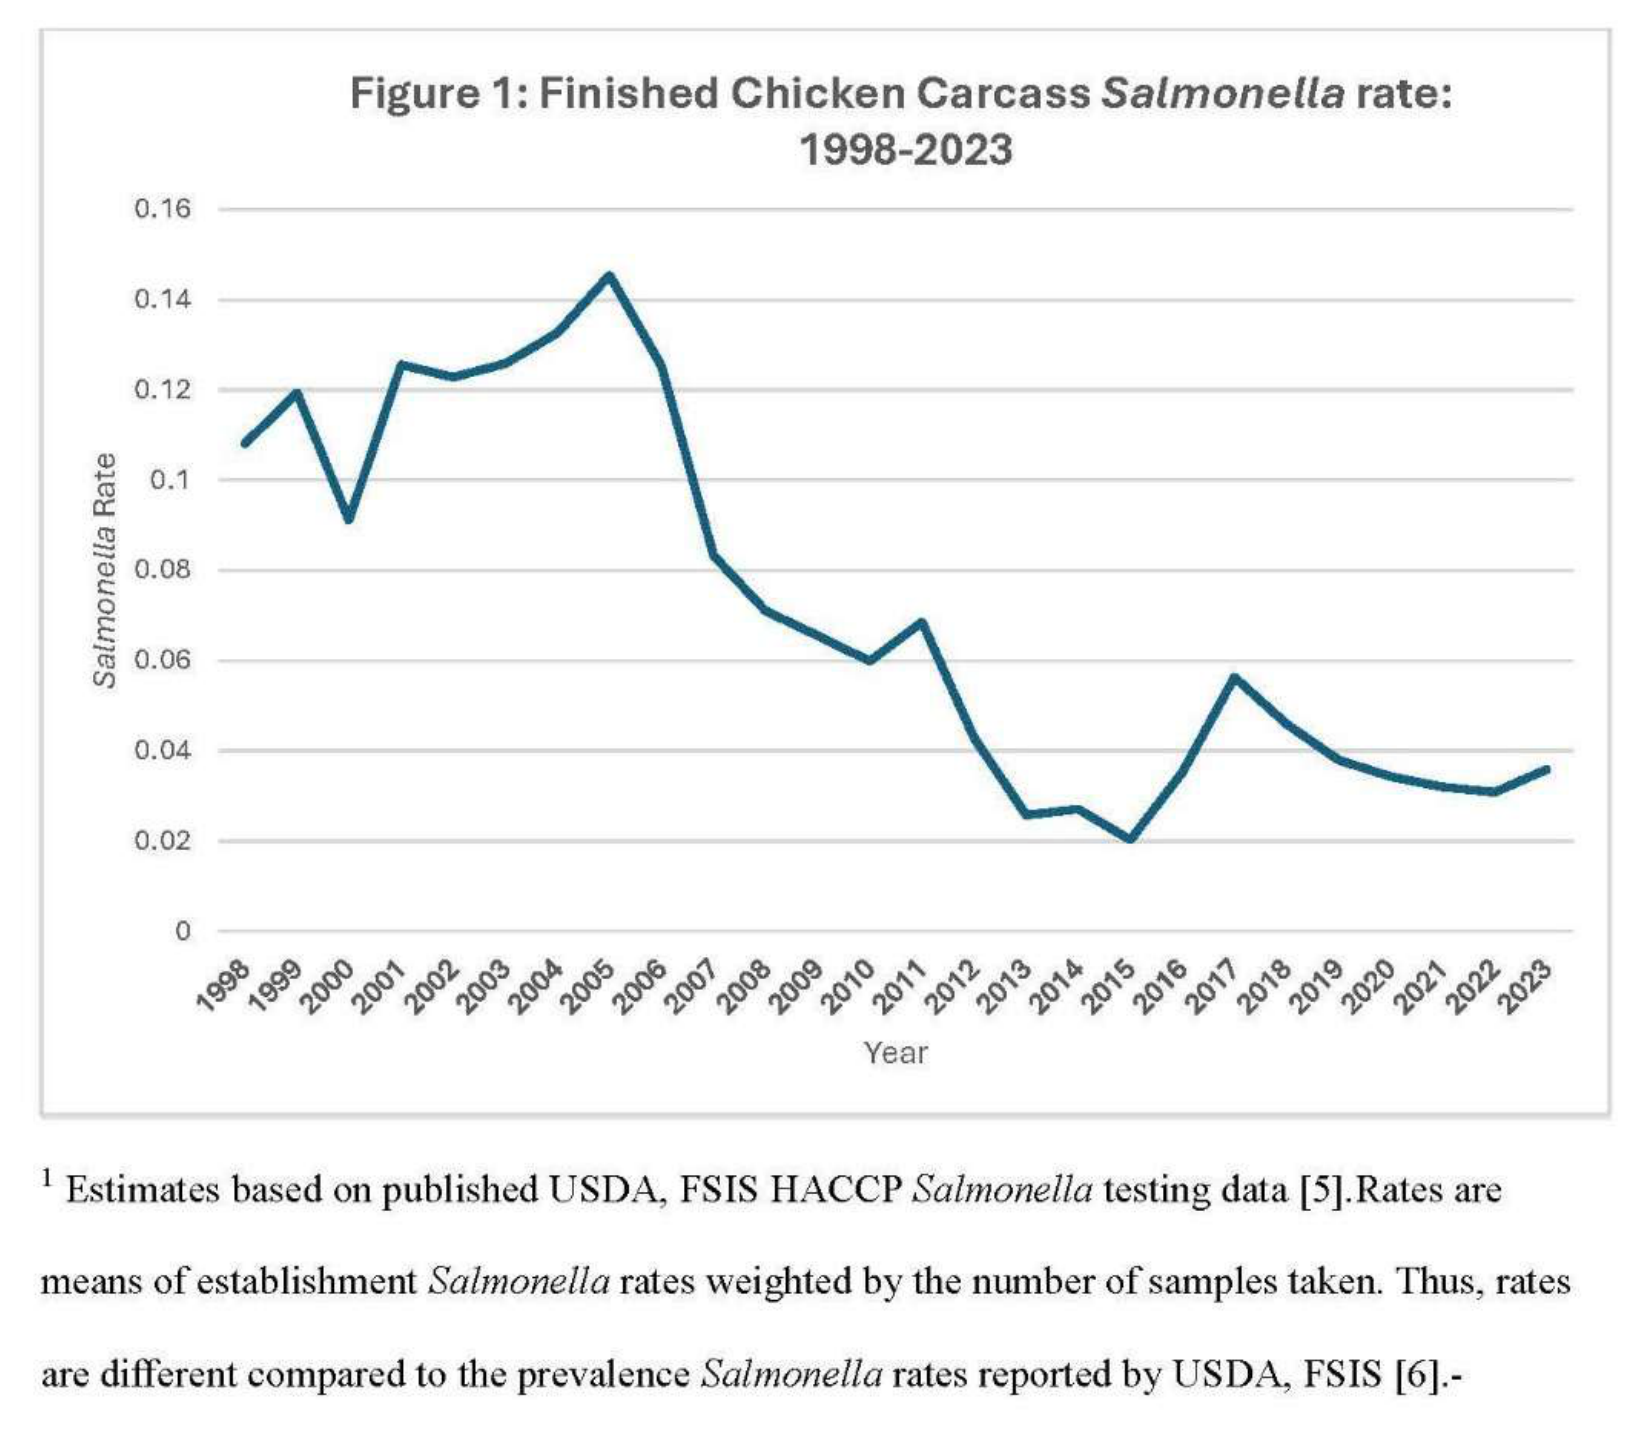
Figure 2.
.
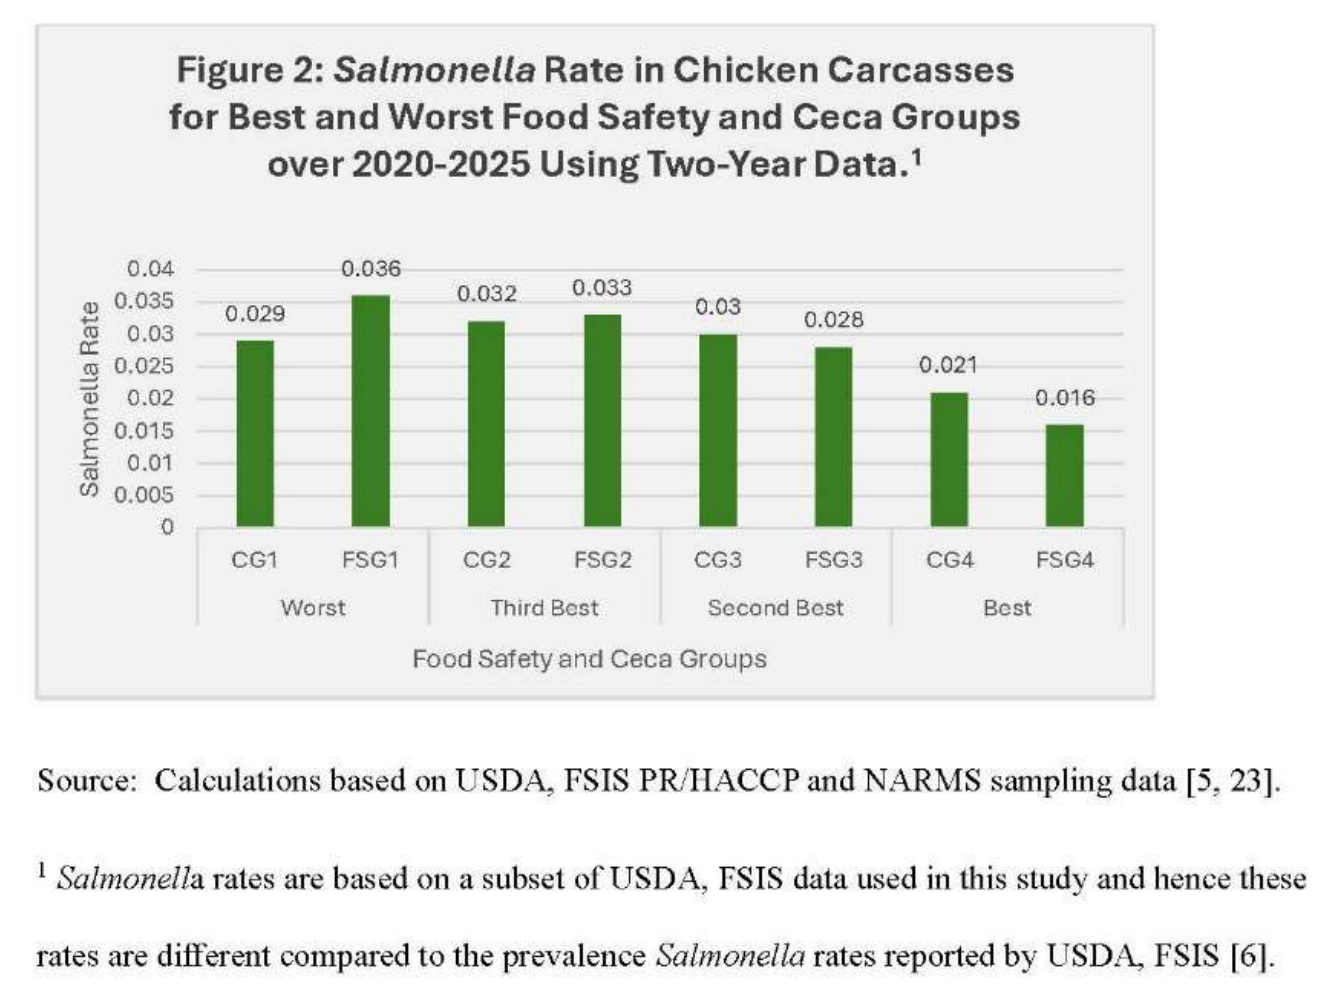
Table 1.
Variable List and Summary Statistics for Data Spanning Three Two-Year Time Periods Over 2020-2025 with Minimums of Either 8 or 16 Cecal Samples.
Table 1.
Variable List and Summary Statistics for Data Spanning Three Two-Year Time Periods Over 2020-2025 with Minimums of Either 8 or 16 Cecal Samples.
|
Type of data |
---------------------2020-2025 Data------------------- |
|||
| Minimum number of samples | -8-cecal sample data- | -16-cecal sample data- | ||
| Mean | Range | Mean | Range | |
| Dependent Variable: Salmonella Positives1 | -------------------------Numbers of Positives------------------------------ | |||
| Product General | 3.17 | 0-11.0 | 3.40 | 0-11.0 |
| Product EpiX-12 | 0.69 | 0-9.0 | 0.74 | 0-5.0 |
| Product Marshall-3 | 1.28 | 0-9.0 | 1.54 | 0-9.0 |
| Product General Minus 12 | 2.49 | 0-10.0 | 2.67 | 0-10.0 |
| -----------------Number of Test Samples---------- | ||||
| Salmonella Test Samples | 113.5 | 93-121 | 113 | 101-121 |
| Independent Variables | ||||
| Cecal SalmonellaRates: | ---------------------Ratio (positives/samples) ----------------------------- | |||
| Cecal General | 0.473 | 0.00-0.95 | 0.487 | 0.125-0.95 |
| Cecal EpiX-12 | 0.117 | 0.0-0.50 | 0.108 | 0.0-0.52 |
| Cecal Marshall-3 | 0.227 | 0.0-0.80 | 0.232 | 0.0-0.80 |
| Cecal General Minus 12 | 0.370 | 0.0-0.86 | 0.379 | 0.0-0.85 |
| Control Variables: | ||||
| Million chickens | 80.6 | 39.6-163.1 | 97.9 | 65.4-163.1 |
| ------------------------------Ratio-------------------------------------------- | ||||
| PRE-OP NCPLY SSOP | 0.216 | 0.00-0.73 | 0.221 | 0.01-0.66 |
| OP NCPLY SSOP (shares) | 0.099 | 0.00-0.55 | 0.107 | 0.003-0.48 |
| HACCP NCPLY (shares) | 0.017 | 0.00-0.14 | 0.018 | 0.00-0.14 |
| ------------------Number------------------------- | ||||
| Observations | 184 | 72 |
||
| Establishments | 81 | 32 | ||
PRE-OP NCPLY SSOP (shares) - refers to non-compliant share of the total Pre-operational Standard Sanitation Operating Procedures. OP NCPLY SSOP (shares) refers to non-compliant share of the total Operational Standard Sanitation Operating Procedures HACCP NCPLY (shares) refers to non-compliant share of the total HACCP tasks performed.
Table 2.
Variable List and Summary Statistics for Data Spanning Two Three Year Time Periods Over 2020-2025 with Minimums of 8 or 16 Cecal Samples.
Table 2.
Variable List and Summary Statistics for Data Spanning Two Three Year Time Periods Over 2020-2025 with Minimums of 8 or 16 Cecal Samples.
|
Type of data |
---------------------2020-2025 Data------------------- |
|||
| Minimum number of samples | -8-cecal sample data- | -16-cecal sample data- | ||
| Mean | Range | Mean | Range | |
| Dependent Variable: Salmonella Positives1 | -------------------------Numbers of Positives------------------------------ | |||
| Product General | 5.09 | 0-20.0 | 5.35 | 0-20.0 |
| Product EpiX-12 | 1.13 | 0-12.0 | 1.28 | 0-12.0 |
| Product Marshall-3 | 1.98 | 0-10.0 | 2.03 | 0-10 |
| Product General Minus 12 | 3.95 | 0-16.0 | 4.07 | 0-16.0 |
| ---------------------Number of Test Samples--------------- | ||||
| Salmonella Test Samples | 166.5 | 107-181 | 169.3 | 112-181 |
| Independent Variables | ||||
| Cecal SalmonellaRates: | ---------------------Ratio (positives/samples) ----------------------------- | |||
| Cecal General | 0.463 | 0.04-0.88 | 0.458 | 0.04-0.85 |
| Cecal EpiX-12 | 0.100 | 0.0-0.50 | 0.107 | 0.00-0.50 |
| Cecal Marshall-3 | 0.219 | 0.0-0.79 | 0.223 | 0.00-0.79 |
| Cecal General Minus 12 | 0.363 | 0.0-0.88 | 0.351 | 0.04-0.79 |
| Control Variables: | ||||
| Million chickens | 80.6 | 39.6-163.1 | 88.9 | 63.5-163.1 |
| ------------------------------Ratio-------------------------------------------- | ||||
| PRE-OP NCPLY SSOP | 0.209 | 0.00-0.73 | 0.213 | 0.01-0.73 |
| OP NCPLY SSOP (shares) | 0.094 | 0.00-0.56 | 0.100 | 0.00-0.55 |
| HACCP NCPLY (shares) | 0.018 | 0.00-0.14 | 0.019 | 0.00-0.14 |
| ------------------Number------------------------- | ||||
| Observations | 167 | 96 |
||
| Establishments | 100 | 56 | ||
PRE-OP NCPLY SSOP (shares) - refers to non-compliant share of the total Pre-operational Standard Sanitation Operating Procedures. OP NCPLY SSOP (shares) refers to non-compliant share of the total Operational Standard Sanitation Operating Procedures. HACCP NCPLY (shares) refers to non-compliant share of the total HACCP tasks performed.
Table 3.
Marginal Effects of Model 1: The effect of the Cecal Salmonella rate and Food Safety Group on the number of Salmonella positives in chicken carcasses over three 2-year periods over 2020-2025 using 8-and 16-cecal sample data. (cluster-robust standard+ errors in parentheses).
Table 3.
Marginal Effects of Model 1: The effect of the Cecal Salmonella rate and Food Safety Group on the number of Salmonella positives in chicken carcasses over three 2-year periods over 2020-2025 using 8-and 16-cecal sample data. (cluster-robust standard+ errors in parentheses).
| ---------------------------- Salmonella group-------------------------- | |||||||||||||||
| - Product General- | --ProductEpiX-12-- | Product Marshall-3 | Product General Minus 12 | ||||||||||||
| Cecal Samples | 8-samples | 16-samples | 8-samples | 16-samples | 8-samples | 16-samples | 8-samples | 16-samples | |||||||
| Variable | (1) | (2) | (3) | (4) | (5) | (6) | (7) | (8) | |||||||
| Cecal General | 2.189*** (0.710) |
2.814** (1.146) |
- | - | - | - | - | - | |||||||
| Cecal EpiX-12 | - | - | 1.869*** (0.600) |
2.414** (0.982) |
- | - | - | - | |||||||
| Cecal Marshall-3 | - | - | - | - | 3.516*** (0.557) |
5.349*** (1.186)- |
|||||||||
| Cecal General Minus 12 | - | - | - | - | - | - | 2.313*** (0.769) |
3.150** (1.421) |
|||||||
| FSG 4 | -1.619*** (0.333) |
-1.084*** (0.497) |
-0.285** (0.120) |
-0.068 (0.234) |
-0.541** (0.219) |
-0.357 (0.755) |
-1.291*** (0.302) |
-1.010** (0.464) |
|||||||
| FSG 1 | 0.368 (0.483) |
1.236 (0.922) |
-0.016 (0.151) |
-0.190 (0.289) |
-0.242 (0.279) |
-0.399 (0.422) |
0.35 (0.416) |
1.153 (0.889) |
|||||||
| Trend | -0.095 (0.103) |
0.101 (0.137) |
0.015 (0.035) |
0.069 (0.075) |
-0.124* (0.072) |
-0.024 (0.117) |
-0.109 (0.099) |
0.030 (0.155) |
|||||||
| Million chickens | 0.010 (0.009) |
-0.022* (0.012) |
0.002 (0.003) |
-0.007 (0.009) |
-0.001 (0.005) |
-0.015 (0.011) |
0.008 (0.009) |
-0.017 (0.012) |
|||||||
| PRE-OP NCPLY SSOP | 0.674 (1.086) |
-3.597* (2.000) |
-0.301 (0.505) |
-1.880* (1.087) |
0.446 (0.699) |
-0.064 (1.293) |
0.754 (1.045) |
-2.268 (1.816) |
|||||||
| OP NCPLY SSOP | -0.833 (2.265) |
-0.186 (2.909) |
-0.280 (0.947) |
1.678 (1.673) |
2.151 (1.839) |
0.704 (2.739) |
-0.372 (2.337) |
-2.034 (3.152) |
|||||||
| HACCP NCPLY | 7.590 (8.430) |
16.23** (8.10) |
3.004 (2.874) |
4.500 (5.310) |
-5.202 (6.854) |
2.176 (10.30) |
4.909 (7.611) |
13.76*8 (5.76) |
|||||||
| Observations | 183 | 72 | 183 | 72 | 183 | 72 | 183 | 72 | |||||||
| Log Pseudolikelihood | -375.4 | -144.8 | -186.1 | -75.5 | -255.4 | -104.3 | -355.4 | -137.0 | |||||||
| Wald χ2 | 41.4*** | 43.3*** | 20.5** | 15.06** | 92.3*** | 68.5*** | 41.3*** | 32.65*** | |||||||
| -Salmonella Difference between establishments with weak vs strong process controls (FSG4-FSG1)- | |||||||||||||||
|
--------------Percent Product Salmonella------------------ |
|||||||||||||||
| 1.9 | 2.1 | 0.25 | 0.10 | 0.16 | 0.0 | 1.48 | 1 .93 |
||||||||
| -Product Salmonella Difference between establishments with weak vs strong cecal controls - |
|||||||||||||||
| -------------Percent Product Salmonella------------- | |||||||||||||||
| 0.9 | 1.2 | 0.47 | 0.63 | 1.03 | 3.89 | 1.10 | 1.45 | ||||||||
Single, double, and triple asterisks (*, **, ***), represent significance at the 10%, 5%, and 1%. Product General includes all Salmonella serotypes; Product EpiX-12 includes the following Salmonella serotypes: Muenchen, I4,[5],12: i-, Typhimurium, Newport, Berta, Enteritidis, Litchfield, Saintpaul, Dublin, I4,[5],12: b-, Blockley, and Hadar; Marshall-3 Salmonella includes Salmonella Enteritidis, Infantis, and Blockley; Product General Minus 12 Salmonella includes all serotypes except those in EpiX-12 Salmonella. FSG4 is a food safety group that represents establishments with strong process controls; FSG1 is a food safety group that represents establishments with weak process controls; PRE-OP NCPLY SSOP is non- compliance rate for Standard Sanitation Operating Procedures (SSOP) prior to operations and OP NCPLY SSOP is during operations; HACCP NCPLY is non- compliance rate for tasks required under PR/HACCP.
Table 4.
Marginal Effects of Model 1: The effect of the Cecal Salmonella rate and Food Safety Group on the number of Salmonella positives in chicken carcasses over two 3-year periods over 2020-2025, using 8- and 16-cecal sample data. (cluster-robust standard errors in parentheses).
Table 4.
Marginal Effects of Model 1: The effect of the Cecal Salmonella rate and Food Safety Group on the number of Salmonella positives in chicken carcasses over two 3-year periods over 2020-2025, using 8- and 16-cecal sample data. (cluster-robust standard errors in parentheses).
| ---------------------------- Salmonella group-------------------------- | ||||||||||
| Product General | Product EpiX-12 | Product Marshall-3 | Product General Minus 12 | |||||||
| Cecal samples | 8-samples | 16-samples | 8-samples | 16-samples | 8-samples | 16-samples | 8-samples | 16-samples | ||
| Variable | (1) | (2) | (3) | (4) | (5) | (6) | (7) | (8) | ||
| Cecal General | 3.928*** (1.362) |
5.364** (2.204- |
- | - | - | - | - | - | ||
| Cecal EpiX -12 | - | - | 3.826*** (0.961) |
2.753** (1.348) |
- | - | - | |||
| Cecal Marshall-3 | - | - | - | - | 5.482*** (0.957) |
7.163*** (1.569) |
||||
| Cecal General Minus 12 | - | - | - | - | - | - | 5.195*** (1.172) |
6.574** (2.041) |
||
| FSG 4 | -1.985*** (0.540) |
-3.002*** (0.705) |
-0.473** (0.199) |
-0.417 (0.295) |
-0.899*** (0.275) |
-1.068** (0.433) |
-1.423*** (0.509) |
-2.493*** (0.596) |
||
| FSG 1 | 1.277* (0.733) |
2.630** (1.445) |
0.626** (0.311) |
0.599 (0.541) |
0.027 (0.396) |
0.282 (0.687) |
0.571 (0.579) |
1.695* (1.068) |
||
| Year_2024 | -0.247 (0.452) |
0.115 (0.533) |
-0.038 (0.210) |
0.108 (0.225) |
0.407 (0.262) |
-0.240 (0.280) |
-0.287 (0.370) |
-0.025 (0.465) |
||
| Million chickens | 0.004 (0.014) |
0.021 (0.023) |
0.001 (0.005) |
-0.002 (0.008) |
0.0003 (0.007) |
0.015 (0.012) |
0.007 (0.014) |
0.025 (0.022) |
||
| PRE-OP NCPLY SSOP | 0.085 (1.752) |
-2.894 (2.710) |
-0.855 (0.768) |
-2.480* (1.361) |
-0.359 (1.007) |
-1.315 (1.503) |
0.186 (1.526) |
-2.074 (2.188) |
||
| OP NCPLY SSOP | 2.114 (3.768) |
0.915 (3.942) |
2.407 (1.902) |
3.534 (2.257) |
2.342 (2.201) |
0.349 (2.828) |
-0.811 (2.672) |
-0.251 (3.032) |
||
| HACCP NCPLY | 3.596 (9.914) |
12.85* (9.30) |
-3.340 (4.960) |
-3.938 (6.950) |
-6.623 (7.382) |
3.392 (8.932) |
9.257* (6.237) |
13.10** (7.05) |
||
| Observations | 167 | 96 | 167 | 96 | 167 | 96 | 167 | 96 | ||
| Log Pseudolikelihood | -409 | -233 | -228 | -137 | -288 | -160 | -377 | -214 | ||
| Wald χ2 | 37.8*** | 43.4*** | 38.1*** | 18.6** | 74.6*** | 49.3*** | 42.1*** | 38.9*** | ||
| -Product Salmonella Difference between establishments with weak vs strong process controls (FSG4-FSG1)- | ||||||||||
| ------------------Percent Product Salmonella----------------------- | ||||||||||
| 1.9 | 3.32 | 0.123 | 0.66 | 0.55 | 1.40 | 1.19 | 4.32 | |||
| - Product Salmonella Difference between establishments with weak vs strong cecal control- | ||||||||||
| --------------------Percent Product Salmonella-------------------------- | ||||||||||
| 0.90 | 1.45 | 0.42 | 0.63 | 1.55 | 3.47 | 1.13 | 2.49 | |||
Single, double, and triple asterisks (*, ***, **) represent significance at the 10%, 5%, and 1%. Product General includes all Salmonella serotypes; Product EpiX-12 includes the following Salmonella serotypes: Muenchen, I4,[5],12: i-, Typhimurium, Newport, Berta, Enteritidis, Litchfield, Saintpaul, Dublin, I4,[5],12: b-, Blockley, and Hadar; Marshall-3 Salmonella includes Salmonella Enteritidis, Infantis, and Blockley; Product General Minus 12 Salmonella includes all serotypes except those in EpiX-12 Salmonella. FSG4 is a food safety group that represents establishments with strong process controls; FSG1 is a food safety group that represents establishments with weak process controls; PRE-OP NCPLY SSOP is non- compliance rate for Standard Sanitation Operating Procedures (SSOP) prior to operations and OP NCPLY SSOP is during operations; HACCP NCPLY is non- compliance rate for tasks required under PR/HACCP.
Disclaimer/Publisher’s Note: The statements, opinions and data contained in all publications are solely those of the individual author(s) and contributor(s) and not of MDPI and/or the editor(s). MDPI and/or the editor(s) disclaim responsibility for any injury to people or property resulting from any ideas, methods, instructions or products referred to in the content. |
© 2026 by the authors. Licensee MDPI, Basel, Switzerland. This article is an open access article distributed under the terms and conditions of the Creative Commons Attribution (CC BY) license (http://creativecommons.org/licenses/by/4.0/).
Copyright: This open access article is published under a Creative Commons CC BY 4.0 license, which permit the free download, distribution, and reuse, provided that the author and preprint are cited in any reuse.