

Submitted:
15 September 2026
Posted:
16 September 2026
You are already at the latest version
Abstract
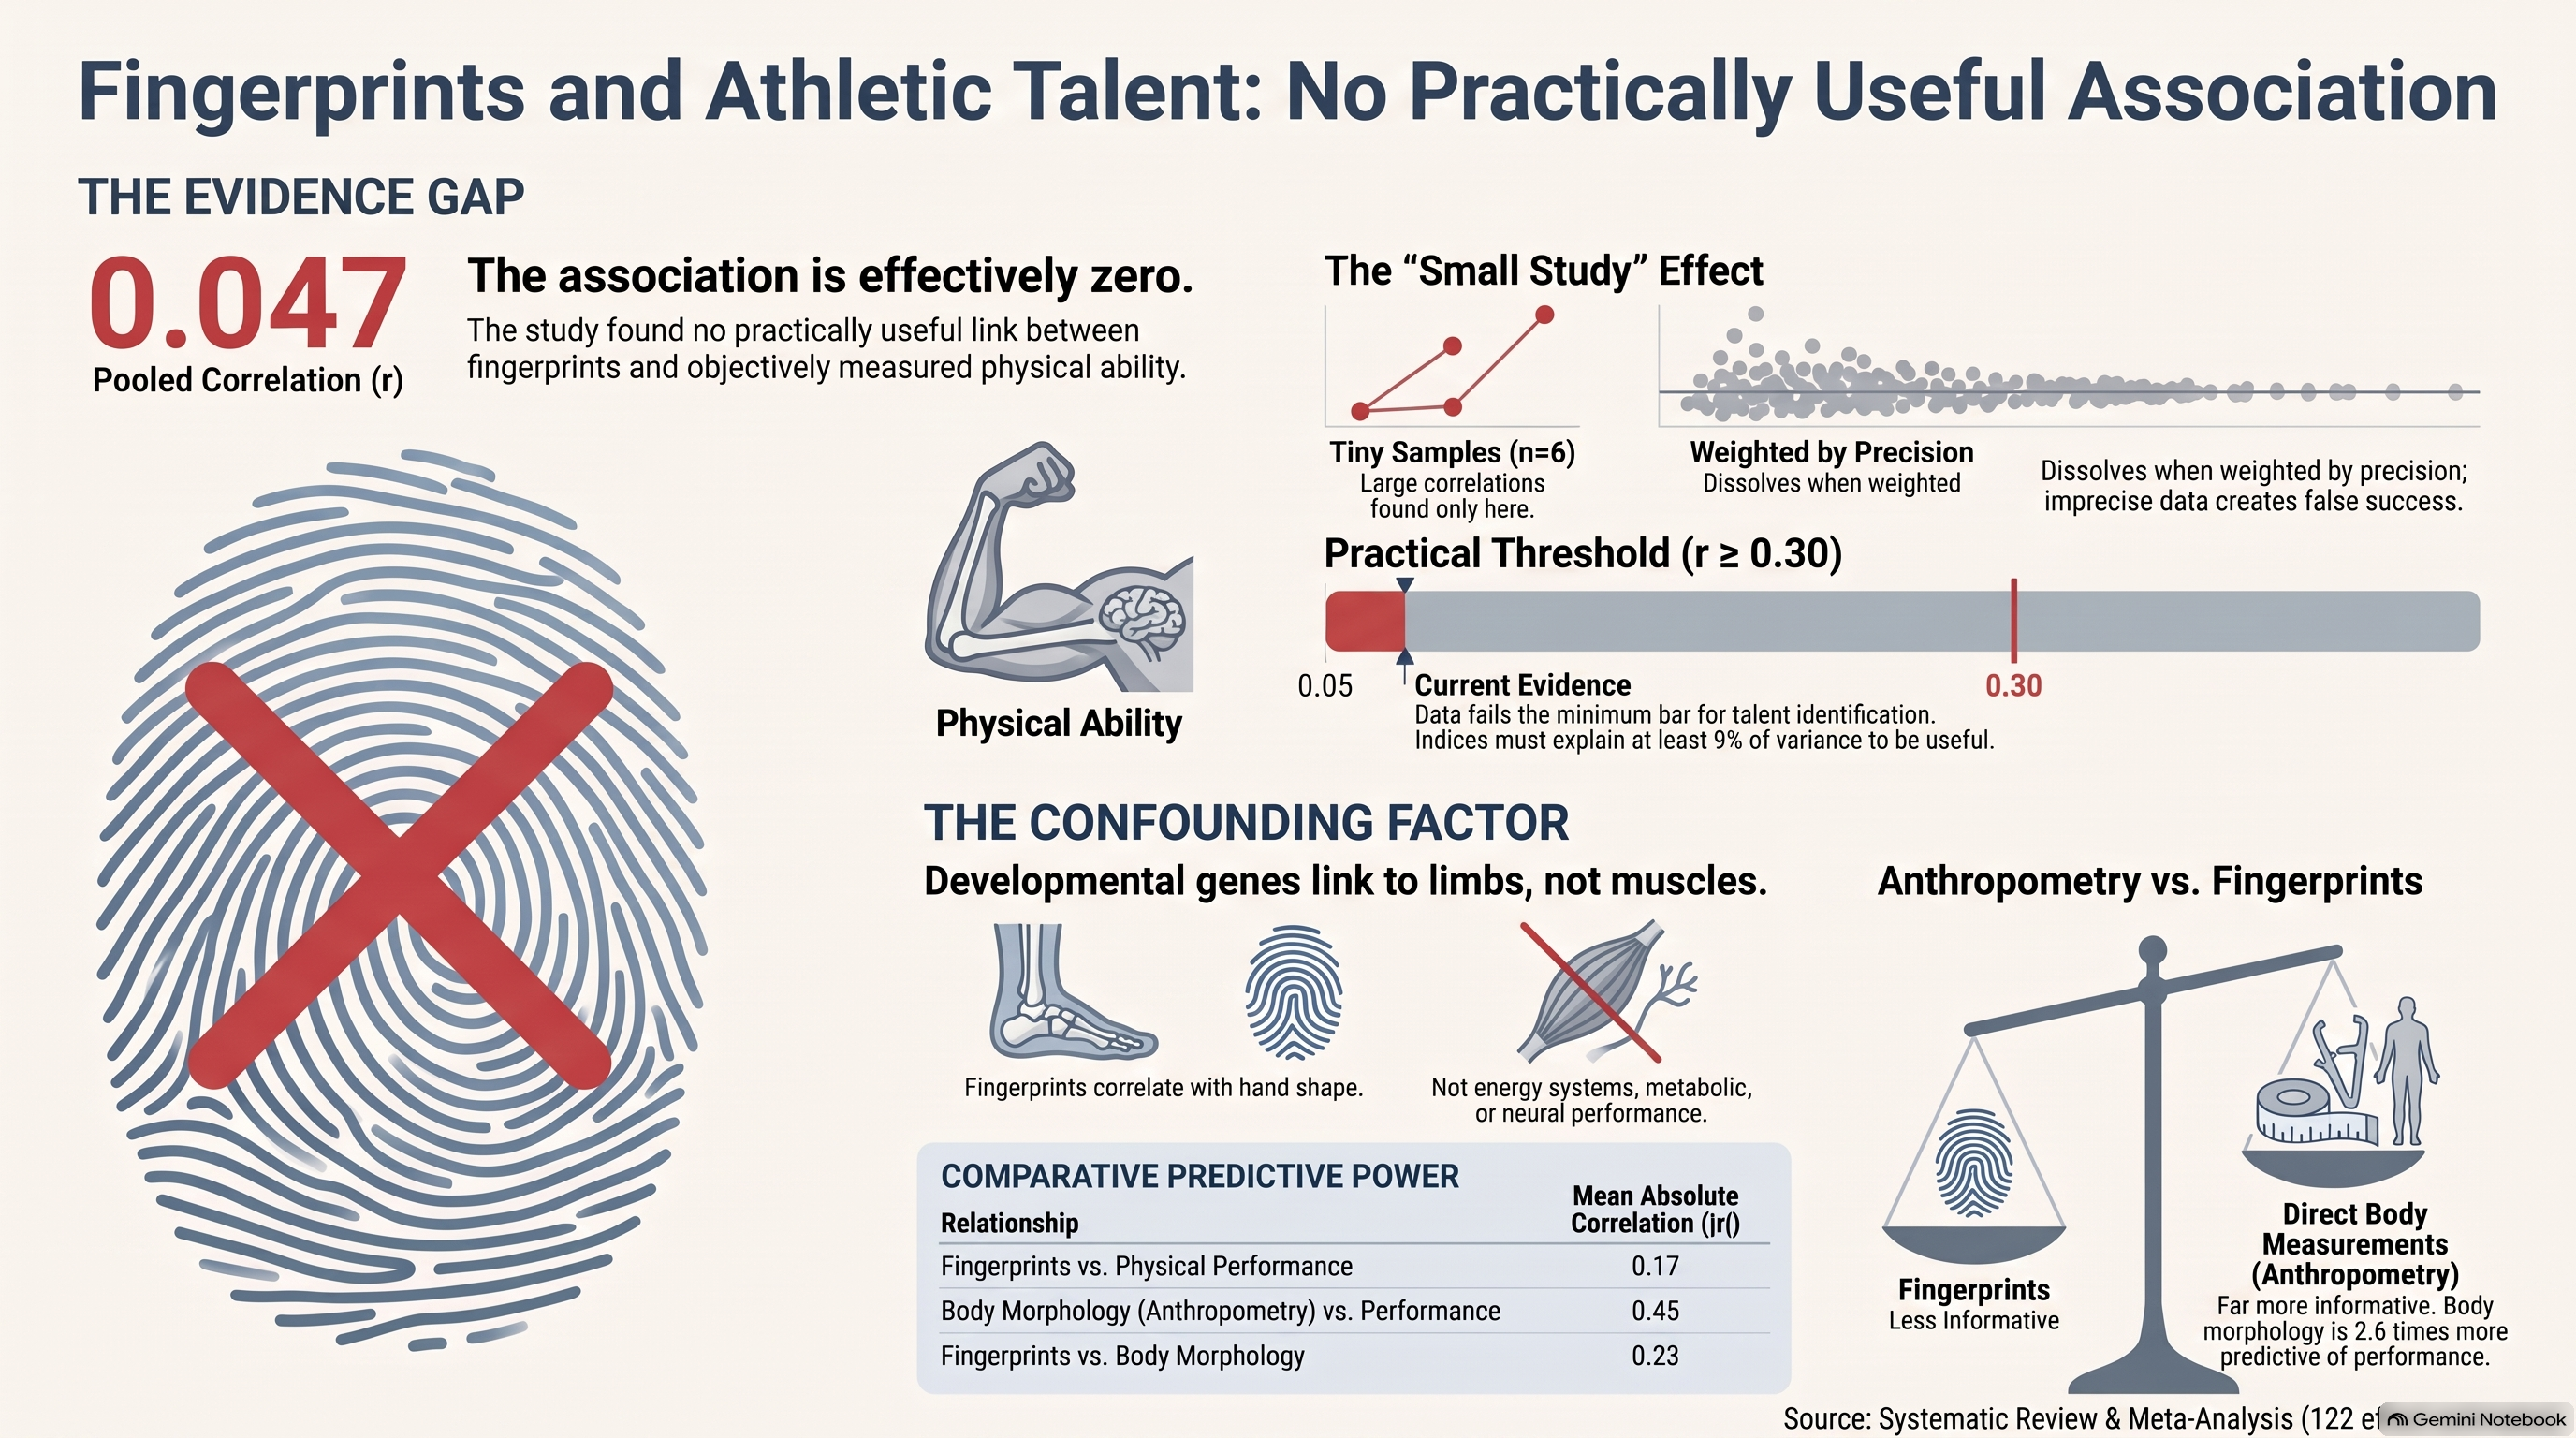
Fingerprint dermatoglyphics is used in Ibero-America and Eastern Europe as a marker of physical ability for talent identification. A 2022 genome-wide study linked fingerprint loci to limb development and hand proportions, thereby supporting a morphological hypothesis. We quantified the association between quantitative fingerprint indices and objectively measured physical ability and assessed whether it persisted after adjustment for morphology. Following a registered protocol (PROSPERO CRD420261469333), we searched Web of Science and four Ibero-American databases and pooled Fisher z-transformed correlations in a correlated-and-hierarchical-effects model with cluster-robust variance estimation, with three-level and Bayesian models as companions. Twenty studies were eligible; nine contributed 122 effect estimates from 337 participants. The pooled correlation was r = 0.047 (95% confidence interval: −0.218 to 0.306); the three-level model gave r = 0.025 (−0.028 to 0.078), an anti-conservative interval. No study adjusted for anthropometry, maturation, or training; in four studies measuring all three, anthropometry correlated with performance (mean |r| = 0.45) more strongly than fingerprints (mean |r| = 0.17), and partial correlations did not increase the fingerprint–performance association. Certainty was very low. This study shows no practical association between morphological and physical capacities, which does not support using fingerprints to select young athletes.
Keywords:
dermatoglyphics
; fingerprints
; talent identification
; physical fitness
; athletic performance
; anthropometry
; confounding
; prognostic factor
; meta-analysis
1. Introduction
Dermatoglyphics, the study of the epidermal ridge patterns of the fingers and palms, occupies an unusual place in sports science. It is marginal in the international literature yet central to practice in large parts of the world. Across Ibero-America and the countries of the former Soviet sphere, fingerprint analysis is used to orient children toward sports, to build athlete profiles, and, in some settings, to inform selection decisions [1,2]. Ridge patterns are established and mature before the 24th week of gestation and do not change thereafter [3]; they are under demonstrable genetic control, to the point that a mutation in a skin-specific isoform of SMARCAD1 produces autosomal-dominant adermatoglyphia [4]; and they can be captured in seconds with ink and paper or an inexpensive optical reader. A stable, heritable, and cheaply measured trait has evident appeal for a talent-identification program in a resource-constrained setting.
The inferential chain from those premises to practice has three links. Fingerprints are fixed in utero and do not change. Fingerprints are heritable. Therefore, fingerprints are genetic markers of physical ability and of the energy systems that underpin it. The first two links are supported by evidence. The third has never been tested. It is assumed, and it is assumed in a specific and consequential form: a fixed table of equivalences, inherited from Soviet-era sports anthropology, in which arches indicate strength, loops indicate speed, whorls indicate coordination, and the delta index indicates endurance. That table is applied in the primary literature without independent validation [1,5].
Two developments now make the third link testable. The first is genomic. A trans-ethnic genome-wide association meta-analysis identified 43 loci associated with fingerprint patterns; neighboring genes were strongly enriched for limb-development pathways rather than for muscle, metabolic, or neural pathways; a regulatory variant near EVI1 was implicated in limb and digit development based on human developmental expression data, and functional evidence for Evi1 in dermatoglyph patterning was obtained in mice; and fingerprint patterns were genetically correlated with hand proportions in human cohorts [6]. This finding does not support the assumed mechanism and suggests an alternative. If fingerprints and limb morphology share developmental genes, and body morphology partly determines physical performance, then an observed fingerprint–performance association may reflect morphology rather than a direct genetic signal. The confounding path (fingerprint ← limb-development genes → hand and limb proportions → performance) is a hypothesis that this review tests indirectly, not an established pathway. Before the 2022 genome-wide meta-analysis, it could not be formulated with confidence because the genetic architecture of fingerprint variation was largely uncharacterized.
The second development is quantitative. The field treats its dermatoglyphic indices as interchangeable genetic markers, but published twin data do not support this treatment. Heritability estimates range from 0.11 to 0.96 across dermatoglyphic characteristics and digits in one female twin series [7], and the additive genetic component ranges from 49% to 81% for digital ridge counts and from 0% to 50% for palmar counts in another [8]. A blanket heritability figure applied uniformly to the delta index, ridge count, and atd angle is therefore not defensible.
Two systematic reviews of sports dermatoglyphics exist. One focused on strength and conducted a narrative synthesis of six studies [5]; the other mapped the Americas between 2010 and 2019 and conducted a descriptive synthesis of thirteen studies [1]. Neither performed a meta-analysis, assessed reporting bias or certainty of evidence, nor addressed confounding by morphology. Meta-analyses of dermatoglyphics exist in other domains, notably pediatric oral disease [9,10]: one reported between-study heterogeneity (I²) of roughly 78% to 98% [10], and the other found no overall difference in pattern distribution by caries status [9]. The heterogeneity reported in [10] informed our prior expectation for the present synthesis.
We therefore conducted a systematic review and meta-analysis with two aims: to quantify the magnitude and direction of the association between quantitative fingerprint dermatoglyphic indices and objectively measured physical abilities, and to determine the extent to which that association is attenuated by adjustment for anthropometry, body composition, biological maturation, and training exposure, that is, to test the morphological-confounding hypothesis. The hypothesis under test is the one the applied literature makes: that each index predicts the capacity assigned to it in the equivalence table with an association large enough to guide orientation. We prespecified r = 0.30 as the minimum magnitude at which such use would begin to be defensible: below that value, an index explains less than 9% of performance variance and cannot rank individuals with useful accuracy. Because the equivalence table predicts different signs for different index-by-capacity combinations, the overall pooled estimate serves as an omnibus summary of the literature, while the index-specific predictions are examined in the subgroup analyses and the evidence map.
2. Materials and Methods
2.1. Protocol, Registration, and Reporting
The protocol was registered prospectively in PROSPERO (CRD420261469333) before screening began, and the full protocol document was uploaded to the register. Reporting follows PRISMA 2020 [11]; the completed checklist is provided as supplementary material. Where quantitative pooling was not appropriate, synthesis and its reporting follow the Synthesis Without Meta-analysis (SWiM) guideline [12]. No amendments were made to the registered protocol after screening began; the three deviations that arose are declared in Section 2.9.
2.2. Eligibility Criteria
The review question was framed as PECO. Population: humans of any age, sex, and competitive level, athletes and non-athletes alike. Exposure: normal anatomical variation in fingerprint or palmar dermatoglyphic patterns, characterized by quantitative indices: delta index (D10), total ridge count (SQTL), frequency of arches, loops, and whorls, atd angle, a–b ridge count, or digital formula (Figure 1). Comparator: individuals with a contrasting dermatoglyphic profile; athletes versus non-athletes; or sports of predominantly aerobic versus predominantly anaerobic demand. Correlational designs without an explicit comparison group were admitted and analyzed separately. Outcome: objectively measured physical ability, comprising maximal and isometric strength, handgrip strength, muscular power and explosive strength, sprint speed, agility, aerobic and anaerobic endurance, flexibility, and motor coordination.
Musculoskeletal injury and musculoskeletal disease were excluded as outcomes per the protocol to distinguish this review from the registered record CRD420261326579, which covers that domain. Eligible designs were cross-sectional studies, case-control studies, cohort studies, and trials in which dermatoglyphics were measured at baseline. Case reports, case series without a comparison group, editorials, conference abstracts without full text, narrative reviews, and other reviews without primary data were excluded. Preprints and articles awaiting peer review, retrieved from the preprint servers listed in Section 2.3, were screened using the same criteria; none contributed to the quantitative synthesis. No language or date restrictions were applied at the search stage.
2.3. Information Sources and Search Strategy
The Web of Science Core Collection was searched via an institutional proxy, along with four Ibero-American databases treated as mandatory rather than supplementary (SciELO, LILACS/BVS, Redalyc, and Dialnet), because the bulk of this literature is Ibero-American and not indexed in the major English-language databases. PubMed, Europe PMC, Crossref, Semantic Scholar, DOAJ, OpenAlex, Cochrane Library, and the medRxiv and bioRxiv preprint servers were also consulted. Searches were run on 3–4 August 2026. The full search syntax for each source is provided in the supplementary material and has been uploaded to PROSPERO.
One feature of the strategy warrants emphasis because it materially affects yield. The term "fingerprint" is used in at least six unrelated senses in the indexed literature: spectral, molecular, epigenetic, connectomic, facial, and radio-frequency. Without an explicit NOT block or restriction of the term to the title field, retrieval is heavily contaminated; the field in which the term was searched in each source is stated in the search syntax (Supplementary Material S2). We verified this empirically: eight records reaching full-text assessment in this review were "fingerprint" papers in one of those other senses, including surface-enhanced Raman spectroscopy of β2-agonists, received-signal-strength-indicator fingerprinting for robot localization, and a connectomic study of motor skill.
2.4. Study Selection and Data Collection
Titles and abstracts of the 121 deduplicated records were screened against the eligibility criteria by one reviewer (A.R.-J.), and the full texts of the 77 unique reports available for assessment were read in full by the same reviewer; decisions were recorded per record with the exclusion code applied (Supplementary Material S3). The four records co-authored by G.G.-C. were decided jointly by A.R.-J. and J.G.A. under the recusal rule, and the single borderline report (Section 3.1) was adjudicated by the guarantor. Dual independent screening and extraction were therefore not performed for the corpus, and no inter-reviewer agreement statistic is available; this is a limitation (Section 4.8). A keyword-based pre-classification flag was generated for each record solely as an orienting signal and was not used for decision-making; no automated screening tool was used. Data were extracted into a structured workbook that recorded, for each effect estimate, the study, sample size, dermatoglyphic index, capacity domain, specific test, the coefficient exactly as published, the published p-value where available, the table or figure from which the value was taken, and whether the sign had been reversed. Four correlation matrices were published as images without extractable text; these were read by rendering the source page at 140 and 400 dots per inch and are identified as figure-derived in the extraction file. Every transcribed coefficient was checked for arithmetic consistency with its published p-value at the stated sample size (Section 4.8).
One member of the review team (GGC) has co-authored primary studies in this field and co-authored one of the two previous systematic reviews. A recusal rule was registered and applied: he took no part in eligibility, extraction, or risk-of-bias assessment for any record he co-authored, which were handled by the other two reviewers; he is not the guarantor; and the author-group sensitivity analysis was applied to his group on identical terms.
2.5. Risk of Bias and Certainty
Risk of bias was assessed using the Quality in Prognosis Studies (QUIPS) tool [14], applied domain by domain within a prognostic-factor framework by the two reviewers named in Section 2.4. ROBINS-E [15] was considered for observational exposure designs but not applied because all included studies were cross-sectional prognostic-factor designs for which QUIPS was sufficient. Per-study, per-domain judgments with their justifications are provided in Supplementary Material S3 (Table S2). Measurement validity of the exposure was also assessed, covering the capture method, assessor training, blinding to the outcome, and reported intra- and inter-rater reliability. The Jadad scale was not used; it was designed for randomized trials, and its application to cross-sectional and case-control studies in previous reviews in this field (Section 4.5) represents a mismatch between the instrument and the study design. Certainty was rated using the Grading of Recommendations Assessment, Development and Evaluation (GRADE) approach, adapted for prognostic-factor questions [16].
2.6. Effect Measures and Synthesis
Only published correlation coefficients were pooled. Studies reporting associations as group-difference statistics on categorized exposures or outcomes (for example, chi-square or Kruskal–Wallis tests across handgrip categories [17]) were retained in the review and the evidence map but were not converted to r because such conversions require assumptions about the underlying distributions that the reports do not permit verification; the consequence of this rule is stated in Section 4.8. Effects reported only as p-values or as non-significant without a coefficient could not be extracted; the study was retained in the evidence map. Correlations were transformed to Fisher z with sampling variance 1/(n − 3). Where a test is scored in time so that a lower value denotes better performance (2000 m rowing ergometer time and the Illinois agility test), the sign was reversed so that a positive value indicates that a higher value of the dermatoglyphic index is associated with better performance. Sign reversal was applied only to time-scored tests; no reversal was applied on the basis of the index. For arch frequency, which lies at the opposite pole of pattern complexity from whorl frequency, delta index, and ridge count, a positive coefficient indicates that higher arch frequency is associated with better performance. The overall pooled estimate consequently averages indices of opposite polarity and opposite predicted sign under the equivalence table and is an omnibus summary rather than a test of the index-specific predictions (Section 3.5 and Section 4.8). The convention is recorded per effect in the extraction file.
The primary model was a three-level random-effects model with effects nested within studies and studies within author groups [18], estimated by restricted maximum likelihood with a Hartung–Knapp adjustment to the confidence interval (CI) [19], with k − 1 = 121 degrees of freedom for the t-quantile (a choice that itself contributes to the anti-conservatism discussed below; with studies − 1 = 8 degrees of freedom the t-quantile rises from 1.98 to 2.31), and a mandatory 95% prediction interval [20]. Author group was modeled as a clustering variable because preliminary searches showed that a small number of groups account for most of the corpus; treating their effects as independent would overstate precision. The model estimates two variance components, between-study and between-author-group, and does not estimate a within-study (between-effect) component; it treats multiple effects from a single study, which are computed on the same participants and therefore have correlated sampling errors, as conditionally independent. When both between-level variances are estimated at or near zero, the model reduces to a fixed-effect analysis of 122 pseudo-independent effects, and its interval is anti-conservative. We therefore additionally computed cluster-robust variance estimates [21] with clustering at the study- and author-group levels, and we base the inferential statements of this review on these dependency-aware intervals and on the one-effect-per-cluster sensitivity analyses (Section 3.8), rather than on the three-level interval alone. With only nine studies and five author groups, the robust standard errors without small-sample correction are themselves anti-conservative, and the author-group interval in particular should be read as indicative rather than inferential; we therefore also fitted, as the primary inferential analysis, a correlated-and-hierarchical-effects (CHE) working model [22] in which effects are nested within studies, sampling errors within a study are assumed correlated at ρ = 0.6 (with sensitivity analyses at ρ = 0.3 and 0.9), and both a between-study (τ²) and a within-study (ω²) variance component are estimated by restricted maximum likelihood; the standard error of the pooled mean was obtained by cluster-robust variance estimation at the study level with the CR2 small-sample adjustment and Satterthwaite degrees of freedom [23]. The CHE model was implemented directly in Python (Section 2.7) and was added after peer review; it is labeled as such in the Results.
A Bayesian counterpart to the three-level structure was fitted with weakly informative priors: a standard normal prior on the pooled mean in Fisher z units and half-Cauchy (0, 0.5) priors on both between-level standard deviations. A single chain of 200,000 iterations of blocked Metropolis sampling with adaptation during burn-in was run; convergence was assessed using the acceptance rate and the Geweke diagnostic. Multi-chain diagnostics (R-hat), effective sample sizes, and a prior-sensitivity analysis were not computed and are noted as limitations in Section 4.8. The Bayesian 95% prediction interval is the central 95% interval of the posterior predictive distribution of the true correlation in a new study from a new author group. Posterior probabilities were computed for practically meaningful thresholds: |r| < 0.10 as a practical null, |r| < 0.20, and r > 0.30 as the minimum magnitude at which use of the marker for orientation would begin to be defensible (Section 1).
Prespecified subgroup analyses were by dermatoglyphic index and by type of physical ability. Subgroup p-values are exploratory: ten subgroups were examined, no multiplicity correction was applied, and no subgroup hierarchy was prespecified. Prespecified sensitivity analyses included a two-level model, retention of a single effect per study, retention of a single effect per author group, and a leave-one-study-out influence analysis. An analysis restricted to hypothesis-concordant effects, in which each effect is signed according to the prediction of the equivalence table for its index-by-capacity combination, was not registered; it was added after peer review as a post hoc analysis and is reported, labeled as such, in Section 3.5. Under the equivalence table, the hypothesis-concordant cells with data in the corpus are arches × strength, loops × speed, and total ridge count or delta index × aerobic endurance; all four predict a positive oriented correlation, so pooling them with the CHE model tests the direction the field asserts.
2.7. Software
All analyses were performed in Python 3.11.15 with NumPy 2.4.4 and SciPy 1.17.1. The three-level restricted maximum-likelihood estimator was implemented directly, maximizing the restricted log-likelihood over the two between-level variance components using the Nelder–Mead algorithm from scipy.optimize, with multiple starting values to guard against local optima; the Hartung–Knapp adjustment, the multilevel I² decomposition, the prediction interval, and the cluster-robust variance estimator were likewise implemented directly rather than taken from a package, and the code is provided in full. The correlated-and-hierarchical-effects model added after peer review was implemented in the same way: the working covariance matrix of each study combines the assumed sampling correlation with the between-study and within-study variance components, both estimated by restricted maximum likelihood with Nelder–Mead, and the CR2 adjustment matrices and Satterthwaite degrees of freedom follow the formulae of Tipton [23]; single-covariate partial correlations were computed from the published matrices with the standard first-order formula. The Bayesian model was fitted with a blocked random-walk Metropolis sampler written for this analysis, using the PCG64 generator of numpy.random with a fixed seed; step sizes were adapted during burn-in, and convergence was checked using the acceptance rate and the Geweke diagnostic. Figures were produced with Matplotlib 3.10.9, and the extraction workbooks with openpyxl 3.1.5. For data capture, text and tables were extracted from the retrieved PDFs with Poppler 24.02.0 (pdftotext, including layout-preserving mode); pages containing image-only tables were rendered with pdftoppm at 140 and 400 dots per inch; and two image-only reports were read with Tesseract 5.3.4. No commercial statistical package was used, and no analysis relied on default settings of a black-box routine; every estimator reported here can be reproduced from the deposited code.
2.8. Reporting Bias
The protocol conditioned the interpretation of funnel plots and the use of Egger regression on the availability of at least ten studies. Nine studies contributed extractable effects, so Egger regression was not performed, and the funnel plot is presented for descriptive purposes only. A funnel plot of dependent effects is not a valid display of small-study effects across studies because each study's effect is stacked at a single standard error; methods designed for dependent effects exist [24] but require more studies than are available here. We report this decision explicitly because an underpowered, non-significant test would be misread as evidence of no bias.
2.9. Deviations from the Registered Protocol
Four deviations are declared here. First, the protocol anticipated pooling only when at least three studies shared a comparable outcome and metric. Several index-by-capacity cells contain three or four studies (Figure 8), but no cell contains three studies measuring the outcome with a comparable metric, defined as the same measured quantity obtained with the same class of instrument (for example, VO2max measured by gas analysis rather than estimated from a field test; jump height from a force platform or photoelectric system rather than from a tape measure). Cell-level estimates are therefore presented descriptively as an evidence map, and pooled estimates are reported at the index, capacity domain, and overall levels. Second, cluster-robust variance estimation was not prespecified; it was added because the extracted data contained many effects per study, and after peer review, the correlated-and-hierarchical-effects model with CR2 adjustment replaced the registered three-level model as the basis of inference, for the reasons given in Section 2.6; the registered model is retained as a sensitivity analysis. Third, two post hoc analyses were added after peer review and are labeled as such where reported: the pooling of hypothesis-concordant effects (Section 3.5) and the single-covariate partial correlations in studies with complete matrices (Section 3.9). Fourth, we introduced an eligibility category, retained in the review and in the evidence map but contributing no poolable effect, for studies that measured both exposure and outcome in the same sample but did not publish any statistic linking them. The registered protocol treats the absence of standard deviations as a sensitivity analysis rather than an eligibility criterion, and excluding these studies would have contradicted the registration and erased precisely the empty cells the review set out to document.
3. Results
3.1. Study Selection
The searches returned 132 records, 68 from Web of Science Core Collection and 64 from the Ibero-American databases and the supplementary sources listed in Section 2.3 (Google Scholar, Scopus, and the Russian-language index eLibrary/RSCI were not searched, a limitation stated in Section 4.8). After removing 11 duplicates, the 121 unique records were distributed by source of retrieval as follows: Web of Science 68, Dialnet 33, SciELO and LILACS/BVS 15 (two of these also indexed in PubMed), Semantic Scholar/Consensus 3, and Crossref 2; the record-level source is given in Supplementary Material S3. The 121 records were screened by title and abstract, and 36 were excluded. Full texts were sought for 85 reports, and 12 could not be retrieved; these are listed, along with the retrieval attempts made, in Supplementary Material S3. Four additional records that no search had returned were identified in the retrieved full texts, so eligibility was assessed for 77 unique studies. Fifty-seven were excluded with documented reasons, listed with the reason for each report in Supplementary Material S3, and 20 were included (Figure 2).
Of the 20 included studies, 12 report an estimate of the association between a dermatoglyphic index and a measured physical ability. Nine of these report correlation coefficients and constitute the quantitative synthesis; three, including [17], report only group-difference statistics for categorized variables, which were not converted to r per the rule in Section 2.6 and thus contribute solely to the evidence map. Seven studies measure both constructs within the same sample but do not publish any statistics linking them. One study [25] was classified as borderline; it was retained in the review and the evidence map but excluded from the quantitative synthesis on the basis of outcome considerations, a decision made prior to assessing its impact on the pooled estimate (Section 3.8).
The distribution of exclusion reasons is itself a finding (Table 1). The largest category, with 18 studies, involves measuring a dermatoglyphic profile without assessing any physical ability. The second, with 10, comprises excluded designs. A third category, coded separately because it is a design error rather than a reporting defect, contains seven studies that measured no physical ability, deduced it from the fingerprint itself using the inherited table of equivalences, and then presented that deduction as a result about their athletes' capacities. The design is circular: no data could contradict the conclusion. These studies appear in indexed journals.
One duplicate publication was confirmed. The same sample of the Brazilian men's national volleyball squad (12 senior, 12 junior, and 14 youth players) appears in a 2007 Brazilian journal [26] and again in 2010 in a French journal [27], with no cross-declaration. The second report was an image-only PDF and was identified via optical character recognition. Two further duplication suspicions could not be resolved and are reported in Section 4.8.
3.2. Characteristics of the Included Studies
The nine studies reporting effects include 337 participants and 122 correlations. The median sample size is 20; only two studies exceed 50 participants. All are cross-sectional. None is prospective, none randomizes, and none follows participants over time. Populations are convenience samples from single squads or teams: a departmental under-16 football selection, a six-athlete national military pentathlon squad, a university basketball team, a departmental delegation of high-performance athletes, a youth artistic gymnastics team, a national rowing squad, a youth volleyball club, two football groups from one city, and one under-20 football squad. Full characteristics are provided in Table 2 and the supplementary extraction file.
Five author groups account for all nine studies. A Bogotá cluster spanning three institutions with recurring shared authorship contributes four studies and 41 of the 122 effects; a Tolima group contributes two studies and 48 effects, close to 40% of the total. This concentration is the reason the author group was modeled as a level rather than treated as a covariate.
The most consequential characteristic of this literature is an absence. None of the 20 included studies estimated the dermatoglyph–performance association while adjusting for anthropometry, body composition, biological maturation, or training exposure. Four studies measured anthropometry and dermatoglyphics in the same participants and correlated the two, but none included anthropometry as a covariate in any model with physical ability as the outcome. The registered secondary objective, to quantify attenuation after adjustment, therefore has no adjusted estimate to act on; that vacancy is reported here as a principal finding, and the indirect approach that the published matrices permit is described in Section 3.9.
3.3. Risk of Bias
All nine studies were judged to have a high overall risk of bias (Figure 3; per-study, per-domain judgments with justifications in Table S2, Supplementary Material S3). Two domains drive this judgment. Confounding was rated high in nine of nine studies: every study either ignored morphology entirely or measured it without adjusting for it. Measurement of the prognostic factor was rated high in six of nine and moderate in the remaining three, for a reason that is uniform across the corpus: no study reported intra- or inter-rater reliability for its dermatoglyphic measurements, and no study reported blinding of the person classifying the fingerprints to the participants' performance results, although a concordance study between computerized and traditional reading is available [45].
Outcome measurement was the strongest domain, rated low in seven of nine studies that used linear encoders, force platforms, photoelectric jump sensors, calibrated dynamometers, or laboratory ergospirometry; the two moderate ratings reflect maximal oxygen uptake estimated from a regression equation rather than measured. Attrition was not applicable in any study given the cross-sectional design. Analysis and reporting were rated high in six of nine, on documented grounds detailed in Section 3.10.
3.4. Primary Synthesis
The pooled correlation between quantitative dermatoglyphic indices and objectively measured physical ability under the three-level model was r = 0.025 (95% CI, −0.028 to 0.078; k = 122 effects, 9 studies, 5 author groups, 337 participants; p = 0.347). The 95% prediction interval was −0.043 to 0.093. The point estimate is indistinguishable from zero. The width of this interval must be interpreted in light of the model's assumptions (Section 2.6): the standard error of about 0.027 in r units corresponds to the information content of roughly 1,400 independent participants, about four times the 337 studied, because the 122 effects are treated as conditionally independent and both between-level variances were estimated at or near zero; the prediction interval is narrow for the same reason. The dependency-aware analyses reported in the next paragraphs and in Section 3.8 define the precision of the conclusion.
Figure 4 displays the pattern that governs the entire analysis. The two studies with more than 80 participants have a value of zero, and the large coefficients come exclusively from the smallest samples. The military pentathlon study, with six participants, reports correlations of 0.925 and −0.890; with six observations, the standard error of the Fisher z is 0.577, and the expected absolute value of a sample correlation under the null is about 0.36, so that study carries less than 1% of the weight in the pooled estimate. Across the corpus, the magnitude a study reports and the information it contributes are inversely related.
Because multiple effects within a study share participants, we also computed cluster-robust standard errors. Clustering by study yielded r = 0.056 (95% CI −0.018 to 0.130; 8 degrees of freedom; p = 0.120), and clustering by author group yielded r = 0.064 (95% CI −0.162 to 0.283; 4 degrees of freedom; p = 0.478). Neither interval excludes zero; the study-level interval excludes r = 0.30 at its upper bound, but it rests on eight degrees of freedom without small-sample correction, and the author-group interval, with four degrees of freedom, is indicative only. Together with the one-effect-per-cluster analyses in Section 3.8, these intervals indicate that the evidence is consistent with no association and cannot rule out small-to-moderate associations.
The correlated-and-hierarchical-effects model with CR2 cluster-robust variance estimation (Section 2.6; added after peer review) is the analysis on which the inferential statements of this review rest. With a within-study sampling correlation of ρ = 0.6, the pooled correlation was r = 0.047 (95% CI −0.218 to 0.306; Satterthwaite degrees of freedom = 2.1; p = 0.55). The between-study variance was estimated at zero and the within-study variance at ω² = 0.055 in Fisher z units, so that about 47% of the total variance is attributable to dispersion among effects within studies. The estimate was insensitive to the assumed correlation: r = 0.041 (95% CI −0.260 to 0.334) at ρ = 0.3 and r = 0.050 (95% CI −0.148 to 0.243) at ρ = 0.9. The Satterthwaite degrees of freedom are close to two because the two studies with more than 80 participants carry most of the weight, and the interval is correspondingly wide. The conclusion that this interval supports is that the evidence is compatible with no association and cannot exclude associations up to about r = 0.30 in either direction; the three-level interval reported above is retained as a sensitivity analysis.
3.5. Subgroup Analyses
No subgroup provides evidence of an association of useful magnitude (Figure 5; Table 3). The total ridge count yields r = 0.081, with a three-level interval of 0.048 to 0.114 and a nominal p < 0.001. That interval treats 29 effects from six studies as conditionally independent with zero estimated heterogeneity, implies the information content of about 3,500 independent participants, and is not interpreted as evidence of an effect; it is an artifact of the dependency described in Section 2.6. Under the CHE model with CR2 adjustment, the same 29 effects give r = 0.079 (95% CI −0.126 to 0.277; p = 0.19). Even taken at face value, the coefficient explains 0.7% of the variance in performance, which, for orienting a child toward a sport or excluding one from a selection pathway, is indistinguishable from no association. Because the overall estimate averages indices of opposite polarity (Section 2.6), the sign pattern of the pattern-frequency subgroups (arches +0.133, loops +0.171, whorls −0.221) is what pooling indices of opposite polarity without a common direction produces; none of these intervals excludes zero.
Post hoc analysis of hypothesis-concordant effects (not registered; Section 2.6). Twenty-one effects from five studies fall in the cells for which the equivalence table predicts a positive oriented correlation: arches × strength (7 effects), loops × speed (3), total ridge count × aerobic endurance (6), and delta index × aerobic endurance (5). Pooled with the CHE model, these effects gave r = 0.056 (95% CI −0.770 to 0.811; Satterthwaite degrees of freedom = 1.4; p = 0.78). The point estimate is as close to zero as the omnibus estimate, and the interval is uninformative: the direct test of the field's directional hypothesis cannot, with the available data, confirm or refute it.
The loop and whorl subgroups have prediction intervals that span nearly the full range of possible correlation, from −0.82 to 0.91 in the first case. Such an interval does not indicate a large effect; it indicates that the available evidence is compatible with almost any result, including one in the opposite direction to what the field postulates. The agility subgroup is shown as an interval from −1 to 1 rather than being suppressed, because it shows what is being pooled when five correlations from twenty athletes are combined.
3.6. Heterogeneity
Overall heterogeneity under the primary model was low: I² = 2.1%, with between-study variance effectively zero and between-author-group variance of 0.0005 in Fisher z units. This contradicts the expectation stated in the protocol, which anticipated very high heterogeneity based on a meta-analysis of dermatoglyphics in pediatric oral disease [10]. The apparent spread of published coefficients, from −0.89 to 0.93, is almost entirely due to sampling error in small samples whose estimates oscillate widely around zero; once weighted by precision, the studies do not disagree. Two qualifications apply. Restricted maximum likelihood readily returns boundary estimates of zero heterogeneity with nine clusters, and the Bayesian counterpart, whose priors hold the variance components away from zero, yields a much wider prediction interval (Section 3.7). The three-level model does not estimate a within-study (between-effect) variance component, so dispersion among effects within a study (for example, from −0.89 to 0.93 within the pentathlon study) is attributed entirely to sampling error. The CHE model (Section 3.4) does estimate it: ω² = 0.055 in Fisher z units against a between-study variance of zero, so that the I² decomposition by level assigns about 47% of the total variance to the within-study level and none to the between-study level. Heterogeneity in this corpus is heterogeneity among the indices and tests within a study, not among studies.
Heterogeneity reappears, with I² above 90%, in the loop and whorl subgroups. In both cases, the dispersion is produced by the same two studies with six and twelve participants. It is dispersion generated by sampling error in very small samples, not by moderators, and modeling it as though it reflected substantive differences between populations or protocols is not warranted.
3.7. Bayesian Analysis
The Bayesian three-level model yielded a posterior median of r = 0.044 (Figure 6c), with a 95% credible interval of −0.113 to 0.293 and a 95% prediction interval of −0.392 to 0.540. The Bayesian prediction interval is much wider than its frequentist counterpart because the half-Cauchy priors keep the between-study and between-group standard deviations away from zero, whereas restricted maximum likelihood estimates them at or near zero. With nine studies in five groups, the data cannot overrule those priors, so this interval is the more conservative statement of what a future study might observe, and the frequentist prediction interval is the more optimistic one. The posterior medians for the between-study and between-group standard deviations were 0.093 and 0.075 in Fisher z units. The acceptance rate for the pooled mean was 25%, and the Geweke diagnostic was z = 0.22, indicating no evidence against convergence in the single-chain run; multi-chain diagnostics and a prior-sensitivity analysis were not performed (Section 4.8).
The posterior probabilities that the true correlation is smaller than 0.10 in absolute value, smaller than 0.20, and exceeds 0.30 (the minimum magnitude at which use of the marker for orientation would become defensible) are 0.715, 0.92, and 0.024, respectively (Figure 6c prints the first value truncated to two decimals). The frequentist analysis indicates that the null cannot be rejected. Under the stated priors, the posterior favors a null or trivial effect over a useful one. With nine studies, the priors on the variance components influence this result, and the upper bound of the credible interval (0.293) lies just below the 0.30 threshold.
3.8. Sensitivity Analyses
The pooled point estimate remained stable across all analytical decisions tested. A two-level model gave r = 0.023. Retaining one effect per study yielded 0.112 (95% CI, −0.067 to 0.284). Retaining one effect per author group gave 0.166 (95% CI −0.155 to 0.456). Leave-one-study-out analysis moved the estimate between 0.012 and 0.060. No specification produced an interval excluding zero, and none produced a point estimate reaching 0.20; the one-effect-per-cluster intervals, which make no assumption about within-study dependence, have upper bounds of 0.284 and 0.456, and the CHE interval (Section 3.4) has an upper bound of 0.306; none excludes r = 0.30.
The most informative contrast concerns the borderline study. Adding the single report that correlates thumb ridge count with basketball passing, shooting, and dribbling [25], with r = 0.81, 0.86, and 0.92, moves the pooled estimate from 0.025 to 0.321 and raises I² from 2.1% to 93.4%. One report, with magnitudes far above any other in the corpus, sixty participants, and an outcome that is technical skill rather than any capacity on the registered outcome list, is sufficient to invert the review's conclusion. It was retained in the review as borderline and excluded from the quantitative synthesis on outcome grounds under the registered criteria (Section 3.1); its peer-review status could not be confirmed (Section 4.8). We report the counterfactual so that readers can weigh that decision for themselves.
3.9. The Morphological-Confounding Triangle
Because no study reported an adjusted estimate, the registered secondary objective could not be addressed as planned. It could be approached differently by using the complete correlation matrices from the four studies that measured fingerprints, body morphology, and performance in the same participants (Figure 7; Table 4).
The pattern is compatible with the confounding hypothesis. The mean absolute correlation of anthropometry with physical ability (0.447; precision-weighted 0.447) is about 2.6 times that of dermatoglyphics with physical ability (0.172; precision-weighted 0.150), and on the r² scale, the ratio is about 6.8; fingerprints resemble anthropometry (0.233; precision-weighted 0.221) more closely than they resemble performance. Precision weighting does not change the ordering. Three cautions apply. The means are means of absolute correlations, which are inflated in small samples, and are reported without intervals because each vertex rests on two to four dependent clusters. The vertices are not represented on equal terms: 56, 33, and 11 coefficients, from three, three, and two studies, respectively; the anthropometry × ability vertex contains no coefficient below about |r| = 0.27 (Figure 7b) because the two contributing articles [39,40] published only the anthropometry × performance coefficients they selected, so the contrast between vertices is probably inflated by the coefficients available for extraction. The comparison is therefore descriptive.
Two studies show this with particular clarity. Among under-20 footballers in Bogotá [40], the delta index and total ridge count correlate significantly with endomorphy (−0.43 and −0.48), and maximal oxygen uptake correlates with body mass index (−0.57), body mass (−0.51), fat mass (−0.50) and ectomorphy (0.52); yet the correlations between the dermatoglyphic indices and maximal oxygen uptake are 0.16 and 0.12, neither significant. Two arms of the triangle are present, and the third is absent. Among artistic gymnasts in Tolima [39], height and body mass correlate with countermovement jump height (0.386 and 0.359) and with squat jump height (0.405 and 0.507), respectively, as well as with any dermatoglyphic index, in the same table and among the same thirty participants.
A third line of evidence comes from the only study in the corpus with objective biological maturation. In 136 boys aged 10 to 14 assessed by wrist and hand radiography, basic physical qualities increased with advancing pubertal stage, while no differences in dermatoglyphics or somatotype were found between maturation stages [28]. Performance tracked maturation; the fingerprint did not.
This evidence is indirect: it does not substitute for an adjusted analysis, which does not exist. Two further limits apply. A confounded association is still an association: the product of the two indirect arms of the triangle (0.233 × 0.447 ≈ 0.10) is the fingerprint–performance correlation that a pure confounding path would generate, and it lies within every interval reported in Section 3.4 and Section 3.8, so the data cannot distinguish no association from a confounded association near r = 0.10. And where a complete matrix is published, the within-study partial correlation of the fingerprint index with performance, controlling for one anthropometric variable at a time, is computable. We computed it post hoc (not registered) for the 37 index–test–covariate triplets available in the two studies whose matrices contain all three coefficients [39,40]: the mean absolute correlation fell from 0.190 to 0.173 and the median from 0.160 to 0.114 after adjustment; in the Bogotá footballers [40], the delta index–VO2max correlation of 0.16 fell to between −0.04 and 0.13 depending on the covariate, and the ridge count–VO2max correlation of 0.12 fell to between −0.13 and 0.06. Adjustment therefore reduced, and in no case increased beyond sampling noise, the already small fingerprint–performance associations; the exception is the loop and whorl frequencies in the gymnasts [39], whose correlations of about ±0.4 with jump height were unchanged by height or body mass, which those two variables do not predict in that sample. These partial correlations are single-covariate adjustments for 22 and 30 participants, respectively, and are the closest approximation to the registered secondary objective that the published data permit. What the data support is more modest: in the only samples in which all three constructs were measured together, the morphology–performance link is strong, the fingerprint–morphology link is moderate, and the fingerprint–performance link does not appear, so fingerprint indices add no information about performance beyond that carried by anthropometry. That configuration is compatible with the published associations being an attenuated, noisy reflection of body morphology, but it does not establish that they are.
3.10. Evidence Map and Reporting Bias
The evidence map (Figure 8) shows how the field has distributed its effort. Occupied cells are based on one to four studies, and four of the thirty cells shown are empty. Motor coordination and anaerobic endurance, two of the capacities the equivalence table claims to predict, have no published coefficients and are omitted from the map. Flexibility contributes a single coefficient. Power accounts for 59 of the 122 effects, nearly half, and comes from four studies, two of which share an author group. Under the null hypothesis, the expected absolute value of a sample correlation is √(2/(π(n − 1))), about 0.18 at the corpus median n of 20. The observed median |r| across all 122 effects is 0.164, and the mean |r| at the fingerprint–performance vertex is 0.172 (Table 4), both consistent with the null. Because no cell contained three studies with a comparable metric, as defined in Section 2.9, cell-level estimates are presented as descriptions of the map, following SWiM guidance [12], rather than as synthesis estimates.
Egger regression was not performed for the reason given in Section 2.8. The funnel plot (Figure 6a) is shown for descriptive purposes only: precise effects cluster around zero, and dispersion increases as precision declines. However, because effects from one study share a single standard error and are stacked vertically, the plot cannot display small-study effects across studies [24], and we draw no inference from it regarding publication bias. A further limitation applies: the plot could be drawn at all only because four studies published complete correlation matrices. Studies that publish a single chosen coefficient do not appear in the funnel with their suppressed effects; they appear with the effect they chose to show.
Within-study reporting discrepancies are documented in three studies. In the gymnastics study, the coefficient the abstract presents as the principal finding, r = 0.485 with p = 0.007, is a correlation between two dermatoglyphic indices, total ridge count and whorls, not between a dermatoglyphic index and power; the same article states in its text that two of the jump variables show no correlation with dermatoglyphic characteristics [39]. In a futsal study, the results text asserts significant correlations between anthropometry and dermatoglyphics, while the table shows none, and the discussion states two pages later that no statistically significant relationship existed [29]. In the neuromuscular-profile study, two rows of the published correlation table showed coefficients that were arithmetically inconsistent with their accompanying p-values for the stated sample size; those two rows were excluded from extraction, and the three internally consistent rows were retained [37]. None of the three publishes a false number; in each, the abstract or conclusion does not correspond to the tabulated results.
Of the 93 effect estimates with a published p-value, 30 (32.3%) reached p < 0.05. The median absolute correlation across all 122 effects was 0.164.
3.11. Certainty of the Evidence
Certainty was rated using GRADE, adapted for prognostic-factor questions [16]. The body of observational evidence begins at high certainty and was rated down by two levels for risk of bias, since all nine studies were at high risk in the confounding domain and six of nine in exposure measurement; by one level for indirectness, since the exposure is measured without any published reliability and the outcome set is a heterogeneous collection of surrogates in convenience samples of single squads; by one level for imprecision, since the primary interval and the other dependency-aware intervals (Section 3.4 and Section 3.8) do not exclude r = 0.30, the threshold of practical usefulness; and by one level for suspected publication and reporting bias, given documented selective within-study reporting and too few studies to test formally. Inconsistency was rated as not serious for the overall estimate, because between-study variance was estimated at zero under both the three-level and the correlated-and-hierarchical-effects models and the dispersion is within studies, and as serious for strength (I² = 52%). Certainty is very low for every outcome (Table 5).
One asymmetry in that rating deserves emphasis. Two of the domains driving the downgrade, unadjusted confounding and selective reporting, would be expected to bias the pooled estimate away from the null, not toward it. A body of evidence with those defects that nonetheless yields a pooled correlation of 0.025 is unlikely to be underestimating the association. The very low certainty attaches to the magnitude of the association, which the dependency-aware intervals leave between about −0.2 and 0.5, not to the absence of evidence for a useful association.
4. Discussion
4.1. Principal Findings
This is, to our knowledge, the first meta-analysis of the association between fingerprint dermatoglyphics and objectively measured physical ability. Across 122 effect estimates from nine studies and 337 participants, the pooled correlation under the correlated-and-hierarchical-effects model, which is the basis of inference, was 0.047 (95% CI −0.218 to 0.306); the registered three-level model gave 0.025 (95% CI −0.028 to 0.078), the other dependency-aware analyses gave point estimates between 0.056 and 0.166 with upper confidence bounds between 0.130 and 0.456, and the Bayesian posterior placed 92% of its mass below |r| = 0.20 and 2.4% above 0.30. No specification produced an interval excluding zero, and no dependency-aware interval excluded r = 0.30. The post hoc pooling of hypothesis-concordant effects gave 0.056 with an uninformative interval. The finding is therefore an absence of evidence for an association of practical magnitude, given a body of evidence that cannot exclude small-to-moderate associations. The total-ridge-count subgroup reached nominal significance only under the conditional-independence assumption of the three-level model and is not interpreted as an effect (Section 3.5).
Alongside that quantitative result sits a structural one. None of the 20 included studies has tested the field's central claim against its most obvious rival explanation. The registered secondary objective was to quantify the extent to which the dermatoglyph–performance association is attenuated after adjustment for morphology, maturation, and training. No study has made such an adjustment; the objective could be approached only indirectly, through the confounding triangle and through single-covariate partial correlations in the two studies with complete matrices, which reduced rather than increased the fingerprint–performance associations (Section 3.9).
4.2. Why a Field Can See an Effect that a Meta-Analysis Cannot
The individual studies in this literature routinely report correlations of 0.5, 0.7, and higher, and the studies reporting the largest coefficients are systematically the smallest. That is the expected behavior of underpowered literature. With n = 6, the sampling standard deviation of a Fisher z is 0.577, and the expected absolute correlation under the null is about 0.36, so correlations beyond 0.8 arise readily even when the true correlation is zero; at the corpus median n of 20, the null expectation is about 0.18, which matches the observed median |r| of 0.164. Low statistical power not only reduces the chance of detecting a true effect; it also inflates the magnitude of effects that reach significance and lowers the probability that a significant result reflects a true effect [46]. Correlation estimates do not stabilize until sample sizes reach roughly 150 to 250 for typical effect sizes [47]; the median sample in this corpus is 20.
The consequence is a literature that is internally consistent in a misleading way. Each study finds "significant" associations; each cites its predecessors as corroboration; and the accumulated citations create the appearance of a replicated finding. Precision weighting dissolves this appearance. Once the imprecise studies carry the weight their information warrants, the corpus shows little between-study heterogeneity under the primary model (I² of 2.1%). This low heterogeneity contradicts our registered expectation; it should be read with two caveats stated in Section 3.6, namely that restricted maximum likelihood returns boundary estimates readily with nine clusters and that the model does not estimate within-study heterogeneity.
4.3. What the Genetics Now Says
The mechanistic case for sports dermatoglyphics has always been inferential rather than molecular: fingerprints are heritable, physical ability is heritable; therefore, fingerprints mark physical ability. The premise contains a non sequitur (two heritable traits imply nothing about their shared genetic architecture), and genomic evidence is now available. The 43 fingerprint-associated loci identified in a trans-ethnic meta-analysis lie near genes enriched for limb-development pathways, not for muscle contraction, energy metabolism, or neural drive; functional evidence for the EVI1 locus in dermatoglyph patterning comes from mice; the limb-and-digit inference rests on human developmental expression data; and the genetic correlation of fingerprint patterns with hand proportions was estimated in human cohorts [6]. The developmental biology points toward morphology. This genomic reframing is an argument we make from [6], not a finding of the review.
Our descriptive findings are consistent with that argument. Across the four studies that measured all three constructs, fingerprints correlated more strongly with body morphology (mean |r| = 0.23) than with performance (0.17), while morphology correlated more strongly with performance than either (0.45). Cautions regarding extraction and weighting are stated in Section 3.9. If a fingerprint index carries any information about performance, the most parsimonious account is that it carries a degraded copy of the information that anthropometry carries directly. Under that account, anthropometry is the more informative measurement.
The heritability premise warrants the same scrutiny. Twin data do not support uniform heritability across indices: heritability ranges from 0.11 to 0.96 depending on trait and digit [7], and additive genetic components range from 49% to 81% for digital ridge counts, compared with 0% to 50% for palmar counts [8]. Even if fingerprints were strongly predictive of performance, the indices would not be interchangeable, yet the applied literature treats them as if they were.
4.4. Circularity as a Measurement Problem
Seven of the 57 studies excluded at the full-text stage did not measure any physical ability. They inferred it from the fingerprint using the equivalence table and reported the inference as a finding about their participants. The design creates a closed loop that renders the hypothesis unfalsifiable: a study that assigns "coordination" to an athlete because she has whorls and then concludes that whorls indicate coordination has generated no evidence.
Related to this is the reliability vacuum. Not one study in the corpus reported intra- or inter-rater agreement for its dermatoglyphic classification, and not one blinded the classifier to performance. Ridge counting and pattern classification are human judgments made on images of variable quality; treating them as error-free measurements is untenable. The field has the instrument-comparison literature available to it [45], but has not used it to characterize measurement error in its own studies. An exposure with unknown reliability attenuates observed associations toward the null, meaning the true association could, in principle, be somewhat larger than we estimate. It also means no study in this literature can currently distinguish a null association from a well-measured small one.
4.5. Relation to Previous Reviews
The two prior systematic reviews reached broadly favorable conclusions about the utility of dermatoglyphics [1,5]. None of them pooled effect sizes, assessed reporting bias, evaluated certainty, or examined confounding; one applied the Jadad scale, designed for randomized trials, to cross-sectional and case-control studies. The divergence between their conclusions and ours is therefore not a disagreement about the data but a difference in how the same data were used: counting studies that report significant associations yields a different answer than weighting effect estimates by their precision. Our finding is also consistent with meta-analytic work in adjacent domains: one meta-analysis of dermatoglyphics and pediatric oral disease reported heterogeneity of 78–98% [10], a pattern that suggests the aggregation of noise rather than the estimation of a stable effect, and another found no overall difference in pattern distribution by caries status [9].
4.6. Implications for Practice
For practitioners, the implication is clear. Based on the present evidence, fingerprint dermatoglyphics should not be used to orient children toward particular sports, to construct athlete profiles that inform training prescriptions, or to inform selection or de-selection decisions. The pooled association is not statistically distinguishable from zero in any specification. The primary interval (−0.22 to 0.31) cannot exclude small-to-moderate associations, but no analysis supports, and none estimates, an association of the magnitude (r ≥ 0.30) at which use for orientation would begin to be defensible. The Bayesian analysis assigns a posterior probability of 0.024 to that magnitude. The certainty of this evidence is very low.
Talent identification is a selection decision, and selection decisions based on invalid predictors misallocate opportunity in ways that are opaque to the child and the family [48]. In the four studies that measured fingerprints, anthropometry, and performance together, standardized anthropometry showed, descriptively, about 2.6 times the mean absolute correlation with performance that fingerprint indices did (Section 3.9; very low certainty).
4.7. Implications for Research
If the field wishes to test its hypothesis rather than assume it, three requirements follow. First, any future study must report the reliability of its dermatoglyphic measurements and blind the classifier to the outcome; without this, the literature cannot distinguish between the absence of association and measurement failure. Second, the association must be estimated with adjustment for anthropometry, body composition, and biological maturation, which, in pediatric samples, requires an objective maturity indicator rather than chronological age; the one study in this corpus with radiographic bone age found that physical qualities advanced with puberty, whereas dermatoglyphics did not differ between maturation stages [28]. Third, sample sizes must be commensurate with the effects being sought: detecting r = 0.20 with 80% power at a two-sided α of 0.05 requires about 195 participants, which exceeds the combined sample of all nine studies contributing to this meta-analysis.
Three analyses added after peer review (Section 3.4 and Section 3.5, and 3.9) narrow what remains to be done with the existing data. The correlated-and-hierarchical-effects model with CR2 adjustment, the post hoc pooling of hypothesis-concordant effects, and the single-covariate partial correlations in the two studies with complete matrices all yield estimates near zero, with intervals that the small number of clusters makes wide. Two extensions remain. First, the CHE model should be applied to each subgroup in Table 3 once the corpus contains enough studies per subgroup for the Satterthwaite degrees of freedom to exceed four; with two to seven studies per subgroup, the robust intervals are currently uninformative and are reported only for the total ridge count (Section 3.5). Second, a sensitivity analysis including effects converted from group-difference statistics would accommodate the largest samples in the literature (for example, [17], n = 367, and [49], n = 1,002); this would require access to the categorical cross-tabulations, which the reports do not publish in full. A more productive reframing may also be available. If fingerprints and limb morphology share developmental genes [6], then fingerprint patterns may be informative about limb and hand proportions, and there is a legitimate research question about whether they index aspects of morphology that are relevant to performance in specific sports. That is a different, weaker, and testable claim, and it does not license current practice.
4.8. Strengths and Limitations
The review has four strengths. The protocol was registered prospectively, with the full document deposited, and the three deviations were disclosed. The search treated Ibero-American databases as mandatory rather than supplementary, which recovered the majority of the eligible literature; a review restricted to the major English-language indexes would have missed most of this field. The dependency structure of the data was addressed with a correlated-and-hierarchical-effects model and small-sample-corrected cluster-robust estimation, and cross-checked with the registered three-level model, uncorrected robust estimation at two levels, and one-effect-per-cluster analyses, which make no assumptions about correlations among effects from the same participants; the point estimate did not move outside 0.02 to 0.06 under any of them. And the extraction is traceable: every one of the 122 coefficients is recorded with the table or figure it came from, and the internal arithmetic consistency of each published coefficient and its p-value was checked against the stated sample size, which is how two incompatible rows were detected and excluded.
The limitations are substantial. The evidence base is small: nine studies, 337 participants, and a median sample of 20. The registered three-level model does not estimate a within-study variance component and treats 122 effects computed on 337 participants as conditionally independent; with both between-level variances estimated at or near zero, its interval and prediction interval are anti-conservative, and the total-ridge-count p-value is an artifact of that assumption. The correlated-and-hierarchical-effects model with CR2 adjustment that we adopted after peer review as the primary inferential analysis [22,23] corrects this, at the cost of Satterthwaite degrees of freedom near two, because two studies carry most of the weight; its interval (−0.22 to 0.31) is the honest statement of precision, and the CHE model could not be applied informatively to subgroups with fewer than four studies. The overall estimate averages indices with opposite polarity and opposite predicted sign, so it is an omnibus summary rather than a test of the index-specific hypothesis; the post hoc hypothesis-concordant analysis (Section 3.5) rests on 21 effects from five studies and is uninformative. The Bayesian analysis used a single chain without multi-chain diagnostics or prior-sensitivity analysis, and its priors are informed by nine studies. The search did not include Google Scholar, Scopus, or the Russian-language index eLibrary/RSCI, although the practice under review is also established in Eastern Europe; per-source record counts are provided in Section 3.1 and Supplementary Material S3. One record brought to our attention during peer review does not appear among the included studies: a cross-sectional study of dermatoglyphics and abdominal endurance in 1,002 girls aged 10 to 16 [49], published on a platform with post-publication peer review and, at the time of writing, not approved by its reviewers; it reports chi-square associations by digit and no correlation coefficient, so under Section 2.6 it would have entered the evidence map without contributing a poolable effect, and it shares an author (G.G.-C.) with the review team. Its screening record is as follows: the report was returned by none of the searches listed in Section 2.3, was not among the 121 records screened or the 77 full texts assessed, and was first noted during full-text assessment as a citation inside an unidentifiable document that was itself excluded; it was not retrieved before the search closed. Had it been retrieved, the recusal rule would have applied, and the decision would have rested with A.R.-J. and J.G.A.; under Section 2.6, it would have entered the review and the evidence map without contributing a poolable effect. Three studies with a non-correlational association statistic, including [17] with 367 participants, were not converted to r and were therefore excluded from the synthesis, which discarded the largest available samples. Twelve reports sought could not be retrieved, and four of these (three twin studies of the heritability of physical fitness and one report on skeletal maturation from the group that published [28], apparently on the same cohort) are precisely those most informative for the confounding question; their absence is a real threat to the completeness of our synthesis. Egger regression was not performed because the protocol conditioned it on ten studies, and the funnel plot of dependent effects is descriptive only. The confounding triangle is constructed from correlations reported within studies, not from adjusted models; its vertices are unequally represented, its means carry no interval, and the post hoc partial correlations (Section 3.9) adjust for one covariate at a time in two samples of 22 and 30 participants; it is indirect evidence compatible with the confounding hypothesis, not a test of it. The borderline report [25] appeared in a library-science venue; the publisher page confirms the title but not the volume, pages, or the peer-review procedure, so its status could not be confirmed, and it was excluded from the synthesis on outcome grounds independently of that question. Certainty is very low for every outcome. Two further suspicions of duplicate publication, noted in Section 3.1, could not be resolved from the published reports: two descriptions of the same Colombian elite track-cycling squad under the same protocol, both excluded at full text, and the Linhares 2009 [28] and Vidal-Linhares 2010 reports on what appears to be the same adolescent cohort, the second of which was not retrieved. Neither affects the pooled estimate, since none of the four reports contributed an effect. Finally, screening and extraction were performed by a single reviewer, with a second reviewer involved only in the four recused records and the borderline decision (Section 2.4), so no agreement statistic is available and single-reviewer error cannot be excluded; the screening and extraction files are published in full so that any reader can audit every decision.
5. Conclusions
Quantitative fingerprint dermatoglyphic indices show no association of practical magnitude with objectively measured physical ability. The pooled correlation is 0.047 (95% CI −0.218 to 0.306) under the correlated-and-hierarchical-effects model that is the basis of inference, and 0.025 under the registered three-level model; no interval excludes zero, the dependency-aware intervals do not rule out small-to-moderate associations, and the Bayesian posterior places 2.4% of its mass above the threshold at which the marker would begin to be defensible for orientation. No study in this literature has estimated the association with adjustment for body morphology, maturation, or training exposure; in the four studies that measured all three constructs in the same participants, anthropometry showed, descriptively, about 2.6 times the mean absolute correlation with performance that fingerprints showed, and adjusting for anthropometry did not increase the fingerprint–performance correlations. The evidence is compatible with the published associations being an attenuated reflection of body morphology rather than a genetic signal of physical capacity, but it does not establish this. Current use of dermatoglyphics to orient or select young athletes is not supported by the literature. Direct body measurements are better established and more informative.
Supplementary Materials
The following supporting information can be downloaded at the website of this paper posted on Preprints.org. The completed PRISMA 2020 checklist (Table S1); the full search syntax for every source (Supplementary Material S2); and the extraction workbook with all 122 effect estimates and their provenance, the risk-of-bias judgments with their justifications and the screening records, together with the analysis code with its raw numerical output (Supplementary Material S3).
Author Contributions
Conceptualization, A.R.-J.; methodology, A.R.-J.; formal analysis, A.R.-J.; investigation (screening, data extraction and risk-of-bias assessment), A.R.-J. and J.G.A.; resources (domain expertise on the Ibero-American corpus, subject to the recusal rule in Section 2.4), E.I.A-M. and G.G.-C.; data curation, A.R.-J. and J.G.A.; writing—original draft preparation, O.A.S-T. and A.R.-J.; writing—review and editing, A.R.-J., G.G.-C. and J.G.A.; supervision and project administration, A.R.-J. (guarantor). All authors have read and agreed to the published version of the manuscript.
Funding
This research received no external funding.
Institutional Review Board Statement
Not applicable; this review used only published aggregate data.
Informed Consent Statement
Not applicable.
Data Availability Statement
The screening workbooks (title-and-abstract screening of the 121 records with source, recusal flag, and decision code; full-text assessment of the 77 reports with inclusion category, exclusion code, and non-retrieved and duplicate lists), the extraction tables (Supplementary Material S2: included studies, all 122 effect estimates with their table or figure of origin and sign convention, subgroup and sensitivity results, the confounding-triangle coefficients, and the Bayesian output), the risk-of-bias judgments with their justifications (Table S2), the analysis scripts, and the raw numerical output are provided as supplementary material and will be deposited in Zenodo, with the DOI inserted at proof stage. The analysis code implements every estimator reported here directly in Python 3 (NumPy, SciPy) and is provided in full.
Conflicts of Interest
GGC has co-authored primary studies eligible for this review and co-authored one of the two previous systematic reviews in this field, and belongs to one of the author groups whose non-independence the review models. This was declared in the registered protocol together with the safeguards applied: he took no part in eligibility assessment, data extraction or risk-of-bias assessment for any record he co-authored; he is not the guarantor; the author-group sensitivity analysis was applied to his group on identical terms; and the assessment of how this review differs from the previous one he co-authored was made by the guarantor. ARJ and JGA declare no competing interests.
References
- Fernández-Aljoe, R.; García-Fernández, D.A.; Gastélum-Cuadras, G. La dermatoglifia deportiva en América en la última década: una revisión sistemática. Retos 2020, 38, 831–837. [Google Scholar] [CrossRef]
- Leiva Deantonio, J.H.; Melo Buitrago, P.J. Dermatoglifia dactilar, somatotipo y consumo de oxígeno en atletas de pentatlón militar de la Escuela Militar de Cadetes "General José María Córdova. Rev. Cient. Gen. José María Córdova 2012, 10, 305–318. [Google Scholar] [CrossRef]
- Kyselicová, K.; Dukonyová, D.; Belica, I.; Ballová, D.S.; Jankovičová, V.; Ostatníková, D. Fingerprint patterns in relation to an altered neurodevelopment in patients with autism spectrum disorder. Dev. Psychobiol. 2023, 65, e22432. [Google Scholar] [CrossRef]
- Nousbeck, J.; Burger, B.; Fuchs-Telem, D.; Pavlovsky, M.; Fenig, S.; Sarig, O.; Itin, P.; Sprecher, E. A mutation in a skin-specific isoform of SMARCAD1 causes autosomal-dominant adermatoglyphia. Am. J. Hum. Genet. 2011, 89, 302–307. [Google Scholar] [CrossRef]
- Herrera Romero, R.L.; Castro Jiménez, L.E. Revisión sistemática entre dermatoglifia dactilar y fuerza en el deporte a nivel mundial. Rev. Cienc. Act. Fís. 2022, 23, 1–12. [Google Scholar] [CrossRef]
- Li, J.; Glover, J.D.; Zhang, H.; Peng, M.; Tan, J.; Mallick, C.B.; Hou, D.; Yang, Y.; Wu, S.; Liu, Y.; et al. Limb development genes underlie variation in human fingerprint patterns. Cell 2022, 185, 95–112.e18. [Google Scholar] [CrossRef]
- Machado, J.F.; Fernandes, P.R.; Roquetti, R.W.; Fernandes Filho, J. Digital dermatoglyphic heritability differences as evidenced by a female twin study. Twin Res. Hum. Genet. 2010, 13, 482–489. [Google Scholar] [CrossRef]
- Temaj, G.; Škarić-Jurić, T.; Butković, A.; Behluli, E.; Zajc Petranović, M.; Moder, A. Three patterns of inheritance of quantitative dermatoglyphic traits: Kosovo Albanian twin study. Twin Res. Hum. Genet. 2021, 24, 371–376. [Google Scholar] [CrossRef]
- Wang, H.; Yan, J.; Ouyang, W.; Xu, X.; Lan, C.; Ouyang, S.; Sun, D. The correlation between dental caries and dermatoglyphics: A systematic review and meta-analysis. J. Clin. Pediatr. Dent. 2024, 48, 45–58. [Google Scholar] [CrossRef]
- Jain, C.; Uddin, A.; Sharma, N.; Verma, S.; Pandey, A.; Mandava, P.; Singaraju, G.S. Associations between dermatoglyphic patterns and oral diseases in children: A systematic review and meta-analysis. Cureus 2025, 17, e95455. [Google Scholar] [CrossRef]
- Page, M.J.; McKenzie, J.E.; Bossuyt, P.M.; Boutron, I.; Hoffmann, T.C.; Mulrow, C.D.; Shamseer, L.; Tetzlaff, J.M.; Akl, E.A.; Brennan, S.E.; et al. The PRISMA 2020 statement: An updated guideline for reporting systematic reviews. BMJ 2021, 372, n71. [Google Scholar] [CrossRef]
- Campbell, M.; McKenzie, J.E.; Sowden, A.; Katikireddi, S.V.; Brennan, S.E.; Ellis, S.; Hartmann-Boyce, J.; Ryan, R.; Shepperd, S.; Thomas, J.; et al. Synthesis without meta-analysis (SWiM) in systematic reviews: Reporting guideline. BMJ 2020, 368, l6890. [Google Scholar] [CrossRef]
- Cummins, H.; Midlo, C. Finger Prints, Palms and Soles: An Introduction to Dermatoglyphics; Blakiston: Philadelphia, PA, USA, 1943. [Google Scholar]
- Hayden, J.A.; van der Windt, D.A.; Cartwright, J.L.; Côté, P.; Bombardier, C. Assessing bias in studies of prognostic factors. Ann. Intern. Med. 2013, 158, 280–286. [Google Scholar] [CrossRef]
- Higgins, J.P.T.; Morgan, R.L.; Rooney, A.A.; Taylor, K.W.; Thayer, K.A.; Silva, R.A.; Lemeris, C.; Akl, E.A.; Bateson, T.F.; Berkman, N.D.; et al. A tool to assess risk of bias in non-randomized follow-up studies of exposure effects (ROBINS-E). Environ. Int. 2024, 186, 108602. [Google Scholar] [CrossRef]
- Foroutan, F.; Guyatt, G.; Zuk, V.; Vandvik, P.O.; Alba, A.C.; Mustafa, R.; Vernooij, R.; Arevalo-Rodriguez, I.; Munn, Z.; Roshanov, P.; et al. GRADE Guidelines 28: Use of GRADE for the assessment of evidence about prognostic factors: Rating certainty in identification of groups of patients with different absolute risks. J. Clin. Epidemiol. 2020, 121, 62–70. [Google Scholar] [CrossRef]
- Cruz, I.E.S.; Bim, M.A.; Rigo, V.; Cardoso, A.; Pedrozo, S.C.; Grigollo, L.R.; Zavorski, E.B.; Jesus, J.A.; Nodari Júnior, R.J. Relaciones entre características dermatoglíficas y fuerza manual en hombres. Lect. Educ. Fís. Deport. 2023, 28, 123–138. [Google Scholar] [CrossRef]
- Cheung, M.W.-L. Modeling dependent effect sizes with three-level meta-analyses: A structural equation modeling approach. Psychol. Methods 2014, 19, 211–229. [Google Scholar] [CrossRef]
- IntHout, J.; Ioannidis, J.P.A.; Borm, G.F. The Hartung-Knapp-Sidik-Jonkman method for random effects meta-analysis is straightforward and considerably outperforms the standard DerSimonian-Laird method. BMC Med. Res. Methodol. 2014, 14, 25. [Google Scholar] [CrossRef]
- IntHout, J.; Ioannidis, J.P.A.; Rovers, M.M.; Goeman, J.J. Plea for routinely presenting prediction intervals in meta-analysis. BMJ Open 2016, 6, e010247. [Google Scholar] [CrossRef]
- Hedges, L.V.; Tipton, E.; Johnson, M.C. Robust variance estimation in meta-regression with dependent effect size estimates. Res. Synth. Methods 2010, 1, 39–65. [Google Scholar] [CrossRef]
- Pustejovsky, J.E.; Tipton, E. Meta-analysis with robust variance estimation: Expanding the range of working models. Prev. Sci. 2022, 23, 425–438. [Google Scholar] [CrossRef]
- Tipton, E. Small sample adjustments for robust variance estimation with meta-regression. Psychol. Methods 2015, 20, 375–393. [Google Scholar] [CrossRef]
- Rodgers, M.A.; Pustejovsky, J.E. Evaluating meta-analytic methods to detect selective reporting in the presence of dependent effect sizes. Psychol. Methods 2021, 26, 141–160. [Google Scholar] [CrossRef]
- Joseph, R.; Swathy, K.K.; Philip, N.; Varghese, B.G. Dermatoglyphics and athletic talent: Analyzing thumb fingerprint ridge counts in junior basketball players. Libr. Prog. Int. 2024, 44, 16780–16788. [Google Scholar]
- Zary, J.C.F.; Fernandes Filho, J. Identificação do perfil dermatoglífico e somatotípico dos atletas de voleibol masculino adulto, juvenil e infanto-juvenil, de alto rendimento no Brasil. R. Bras. Ci. Mov. 2007, 15, 53–60. [Google Scholar]
- Zary, J.C.; Reis, V.M.; Rouboa, A.; Silva, A.J.; Fernandes, P.R.; Fernandes Filho, J. The somatotype and dermatoglyphic profiles of adult, junior and juvenile male Brazilian top-level volleyball players. Sci. Sports 2010, 25, 146–152. [Google Scholar] [CrossRef]
- Linhares, R.V.; Matta, M.O.; Lima, J.R.P.; Dantas, P.M.S.; Costa, M.B.; Fernandes Filho, J. Efeitos da maturação sexual na composição corporal, nos dermatóglifos, no somatótipo e nas qualidades físicas básicas de adolescentes. Arq. Bras. Endocrinol. Metabol. 2009, 53, 47–54. [Google Scholar] [CrossRef]
- Gálvez Pardo, A.Y.; Cortés García, A.D.; González Reina, D.F.; Castro Jiménez, L.E.; Arguello Gutiérrez, Y.P.; Melo Buitrago, P.J. Dermatoglifía y su relación con el perfil morfo-funcional en un club de fútbol sala masculino profesional de Bogotá. SPORT TK 2021, 10, 76–90. [Google Scholar] [CrossRef]
- De Sousa Luna, A.L.; Linhares, R.V.; Costa e Silva, G.V.; Fernandes Filho, J. Antropometría, coordinación motora, dermatoglifia y el proceso de alfabetización de los niños. Rev. Investig. Cuerpo Cult. Mov. 2021, 11, 149–168. [Google Scholar] [CrossRef]
- Montoya Monroy, J.S.; Castro Jiménez, L.E.; Melo Buitrago, P.J.; Argüello Gutiérrez, Y.P. Dermatoglifia dactilar y su relación con el consumo máximo de oxígeno en integrantes del equipo de voleibol femenino de la Universidad Santo Tomás. Mov. Cient. 2019, 13, 23–30. [Google Scholar] [CrossRef]
- Fonseca, C.L.T.; Dantas, P.M.S.; Fernandes, P.R.; Fernandes Filho, J. Perfil dermatoglífico, somatotípico e da força explosiva de atletas da seleção brasileira de voleibol feminino. Fit. Perf. J. 2008, 7, 35–40. [Google Scholar] [CrossRef]
- Hernández Chaparro, C.A.; Naranjo Orjuela, R.A. Determinación del perfil genotípico y fenotípico en jugadoras bogotanas del Club Gol Star. Rev. Digit. Act. Fís. Deport. Available online [URL to be supplied] (accessed on [date to be supplied]). Volume and year not stated in the published article. [CrossRef]
- Sánchez Rodríguez, D.A. Perfil de las características dermatoglifias dactilares, de composición corporal y del nivel de fuerza explosiva de atletas de semifondo. Rev. Digit. Act. Fís. Deport. Available online [URL to be supplied] (accessed on [date to be supplied]). Volume and year not stated in the published article. [CrossRef]
- Restrepo Pardo, C.A. Caracterización de la composición corporal, el perfil dermatoglífico, el consumo máximo de oxígeno y la fuerza prensil en la selección Bogotá de triatlón. Rev. Digit. Act. Fís. Deport. Available online [URL to be supplied] (accessed on [date to be supplied]). Volume and year not stated in the published article. [CrossRef]
- Santos, L.C.; Dantas, P.M.S.; Fernandes Filho, J. Características genotípicas e fenotípicas em atletas velocistas. Available online. 4, 49–56, Journal title and year not stated in the retrieved article. [CrossRef]
- Ramos Parraci, C.A.; Patiño-Palma, B.E.; Wheeler-Botero, C.A. Marcadores dermatoglíficos y su relación con el perfil neuromuscular en deportistas colombianos de alto rendimiento. Retos 2022, 46, 597–603. [Google Scholar] [CrossRef]
- Castro Jiménez, L.E.; Argüello Gutiérrez, Y.P.; Melo Buitrago, P.J.; Sánchez Rojas, I.A. Perfil dermatoglífico y funcional en futbolistas profesionales y en formación de la ciudad de Bogotá, Colombia. Rev. Iberoam. Cienc. Act. Fís. Deporte 2025, 14, 325–336. [Google Scholar] [CrossRef]
- Núñez Morales, V.E.; Sandoval Cifuentes, A.A.; Villarreal Ángeles, M.A. Análisis correlacional del perfil dermatoglífico y la potencia del equipo gimnasia artística femenino departamento del Tolima en Colombia. Retos 2025, 70, 870–881. [Google Scholar] [CrossRef]
- Erazo Bello, J.S.; Gálvez Pardo, A.Y.; Castro Jiménez, L.E.; Arguello Gutiérrez, Y.P.; Melo Buitrago, P.J. Composición corporal, dermatoglifia y resistencia aeróbica en futbolistas bogotanos categoría sub 20. MHSalud 2021, 19, 1–12. [Google Scholar] [CrossRef]
- Montenegro Arjona, O.A.; Rodríguez Arrieta, A.N.; Petro Soto, J.L. Perfil dermatoglífico y condición física de jugadores adolescentes de futbol. Educ. Fís. Cienc. 2017, 19, e038. [Google Scholar] [CrossRef]
- Abad-Colil, A.; Hernández-Mosqueira, C.; Fernandes-Filho, J. Dermatoglifia, fuerza máxima y rendimiento ergométrico en seleccionados chilenos de remo. Rev. Horiz. Cienc. Act. Fís. 2015, 6, 7–13. [Google Scholar]
- Donoso Cortés, W.; Castro Jiménez, L.; Argüello Gutiérrez, Y.; Gálvez Pardo, A.; Melo Buitrago, P. Dermatoglifia y fuerza muscular en deportistas de baloncesto universitario. Rev. Cienc. Act. Fís. UCM 2022, 23, 1–9. [Google Scholar] [CrossRef]
- Costa, C.L.A.; Silva, H.G.; Silva, H.M.; Capistrano, R.D.S. Perfil dermatoglífico e qualidades físicas básicas de jovens atletas de voleibol. Conexões 2010, 8, 1–15. [Google Scholar] [CrossRef]
- Nodari-Júnior, R.J.; Heberle, A.; Ferreira-Emygdio, R.; Knackfuss, M.I. Dermatoglyphics: Correlation between software and traditional method in kineanthropometric application. Rev. Andal. Med. Deporte 2014, 7, 60–65. [Google Scholar] [CrossRef]
- Button, K.S.; Ioannidis, J.P.A.; Mokrysz, C.; Nosek, B.A.; Flint, J.; Robinson, E.S.J.; Munafò, M.R. Power failure: Why small sample size undermines the reliability of neuroscience. Nat. Rev. Neurosci. 2013, 14, 365–376. [Google Scholar] [CrossRef]
- Schönbrodt, F.D.; Perugini, M. At what sample size do correlations stabilize? J. Res. Pers. 2013, 47, 609–612. [Google Scholar] [CrossRef]
- Bergkamp, T.L.G.; Niessen, A.S.M.; den Hartigh, R.J.R.; Frencken, W.G.P.; Meijer, R.R. Methodological issues in soccer talent identification research. Sports Med. 2019, 49, 1317–1335. [Google Scholar] [CrossRef]
- Souza, R.; Alberti, A.; Gastélum Cuadras, G.; et al. Dermatoglyphics and abdominal resistance in female children and adolescents: A cross-sectional study [version 1; peer review: 1 approved with reservations, 1 not approved]. F1000Research 2021, 10, 945. [Google Scholar] [CrossRef]
Figure 1.
The quantitative dermatoglyphic indices that constitute the exposure. (a) The three distal-phalanx patterns, defined by their number of triradii or deltas. (b) Per-digit ridge count and its total across the ten digits (SQTL). (c) The delta index (D10) with a worked example. (d) Palmar triradii, the atd angle and the a–b ridge count. (e) Digital formulas. Original schematic; the definitions depicted are transcribed from the full texts of the included corpus, which attribute them to the Cummins and Midlo protocol [13]. No panel reproduces a real fingerprint.
Figure 1.
The quantitative dermatoglyphic indices that constitute the exposure. (a) The three distal-phalanx patterns, defined by their number of triradii or deltas. (b) Per-digit ridge count and its total across the ten digits (SQTL). (c) The delta index (D10) with a worked example. (d) Palmar triradii, the atd angle and the a–b ridge count. (e) Digital formulas. Original schematic; the definitions depicted are transcribed from the full texts of the included corpus, which attribute them to the Cummins and Midlo protocol [13]. No panel reproduces a real fingerprint.
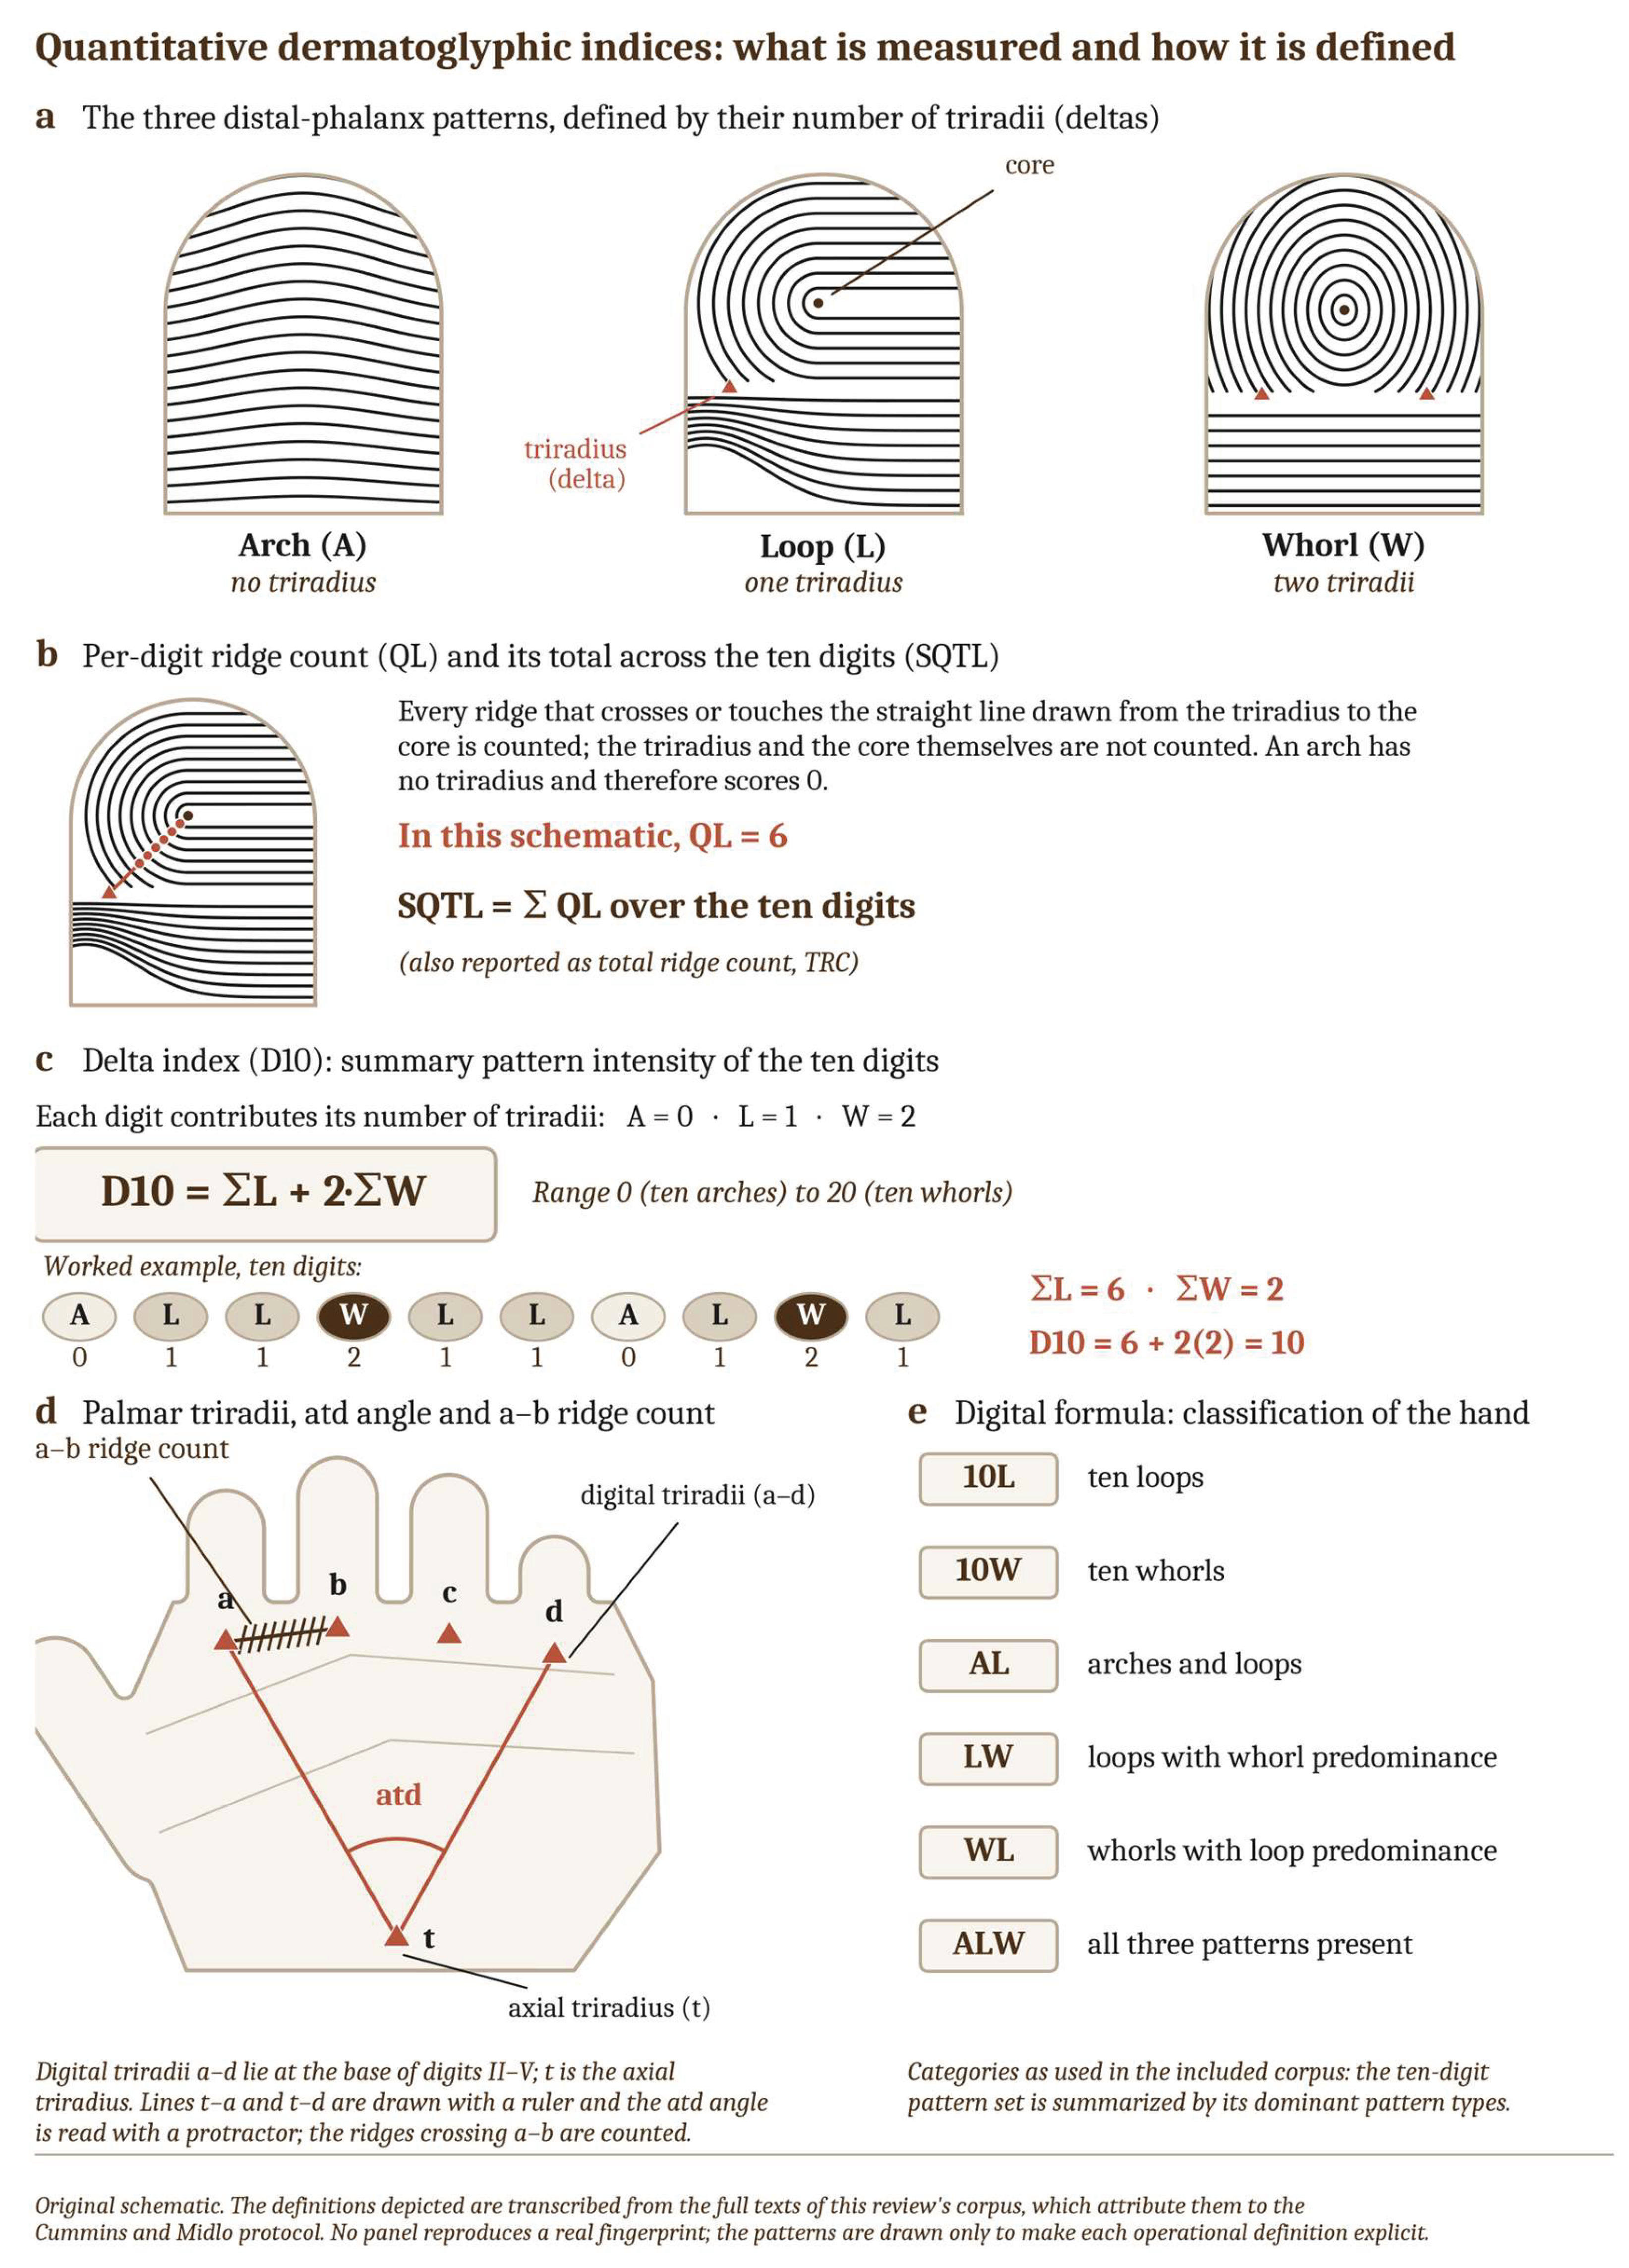
Figure 2.
PRISMA 2020 flow diagram. Exclusion codes are defined in Table 1.
Figure 2.
PRISMA 2020 flow diagram. Exclusion codes are defined in Table 1.
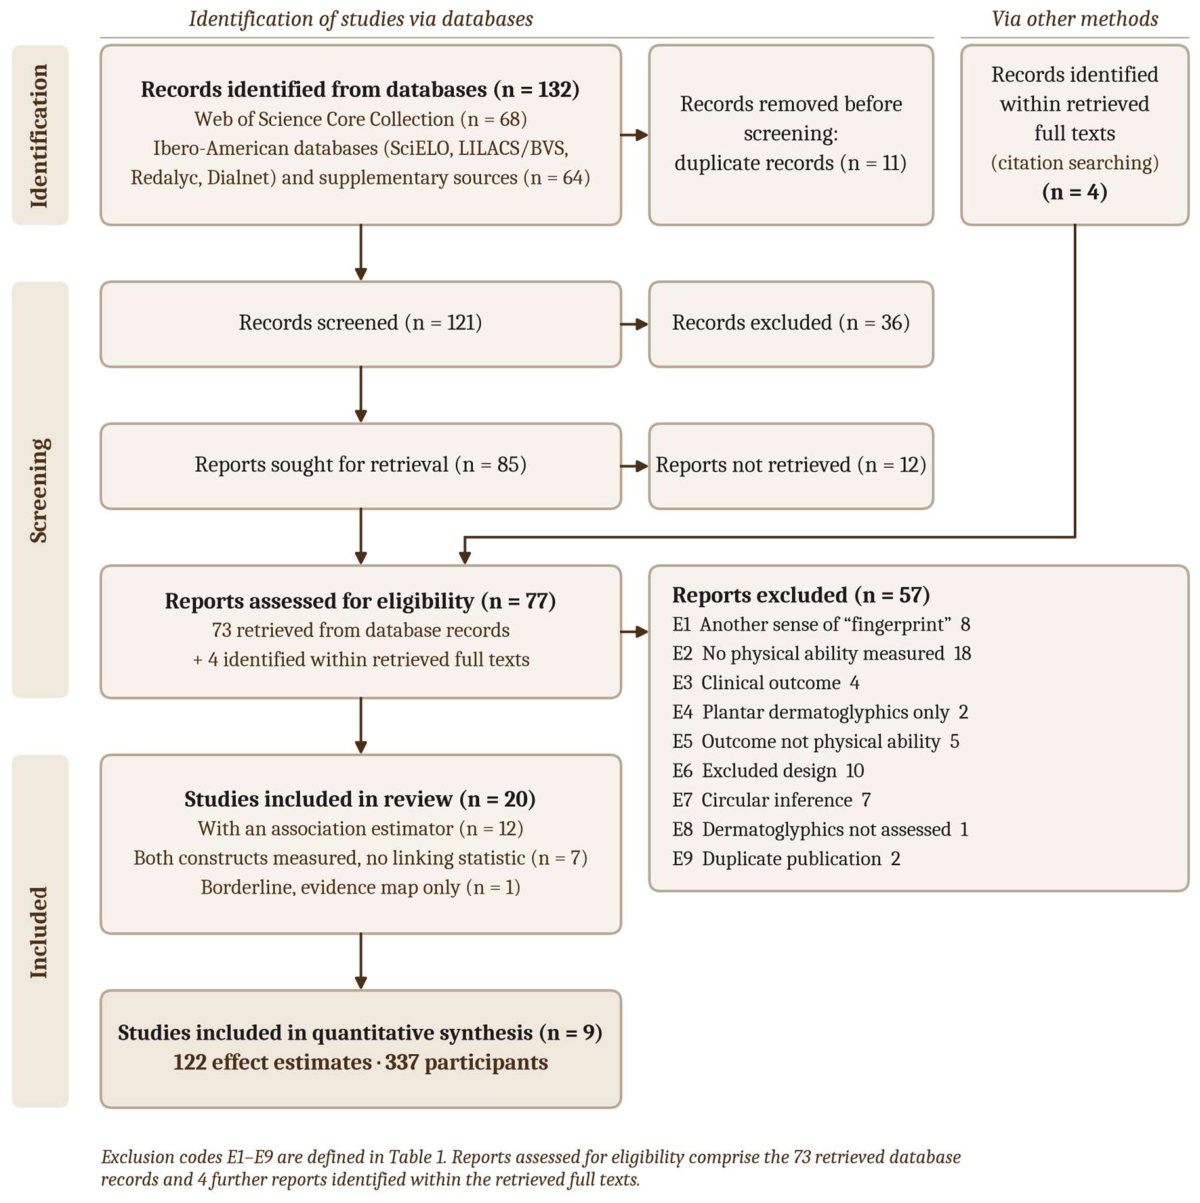
Figure 3.
Risk of bias by QUIPS domain across the nine studies in the quantitative synthesis. Bars give the number of studies judged at low, moderate, or high risk in each domain; attrition is not applicable to cross-sectional designs. Per-study judgments and their justifications are given in Table S2 (Supplementary Material S3).
Figure 3.
Risk of bias by QUIPS domain across the nine studies in the quantitative synthesis. Bars give the number of studies judged at low, moderate, or high risk in each domain; attrition is not applicable to cross-sectional designs. Per-study judgments and their justifications are given in Table S2 (Supplementary Material S3).
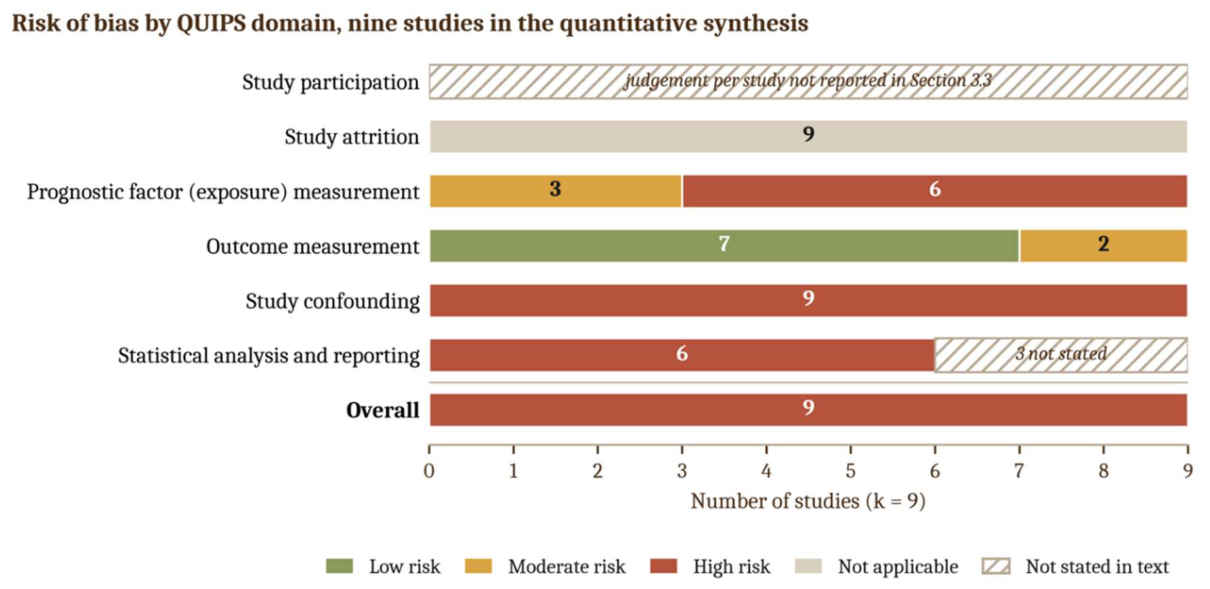
Figure 4.
Within-study mean association between dermatoglyphic indices and physical ability. Each study is labeled on the left, with its numeric estimate on the right; the bottom row shows the overall pooled estimate from the three-level model, along with its sample size, number of effects, and confidence interval. Within-study intervals were computed from the mean Fisher z using a variance of 1/(n − 3). The marker area is proportional to sample size; n is the number of participants, and k is the number of correlations contributed. The pale bar at the pooled estimate is the 95% prediction interval. Study labels follow the article bylines: Erazo Bello et al. 2021 [40]; Montenegro Arjona et al. 2017 [41]; Costa et al. 2010 [44].
Figure 4.
Within-study mean association between dermatoglyphic indices and physical ability. Each study is labeled on the left, with its numeric estimate on the right; the bottom row shows the overall pooled estimate from the three-level model, along with its sample size, number of effects, and confidence interval. Within-study intervals were computed from the mean Fisher z using a variance of 1/(n − 3). The marker area is proportional to sample size; n is the number of participants, and k is the number of correlations contributed. The pale bar at the pooled estimate is the 95% prediction interval. Study labels follow the article bylines: Erazo Bello et al. 2021 [40]; Montenegro Arjona et al. 2017 [41]; Costa et al. 2010 [44].
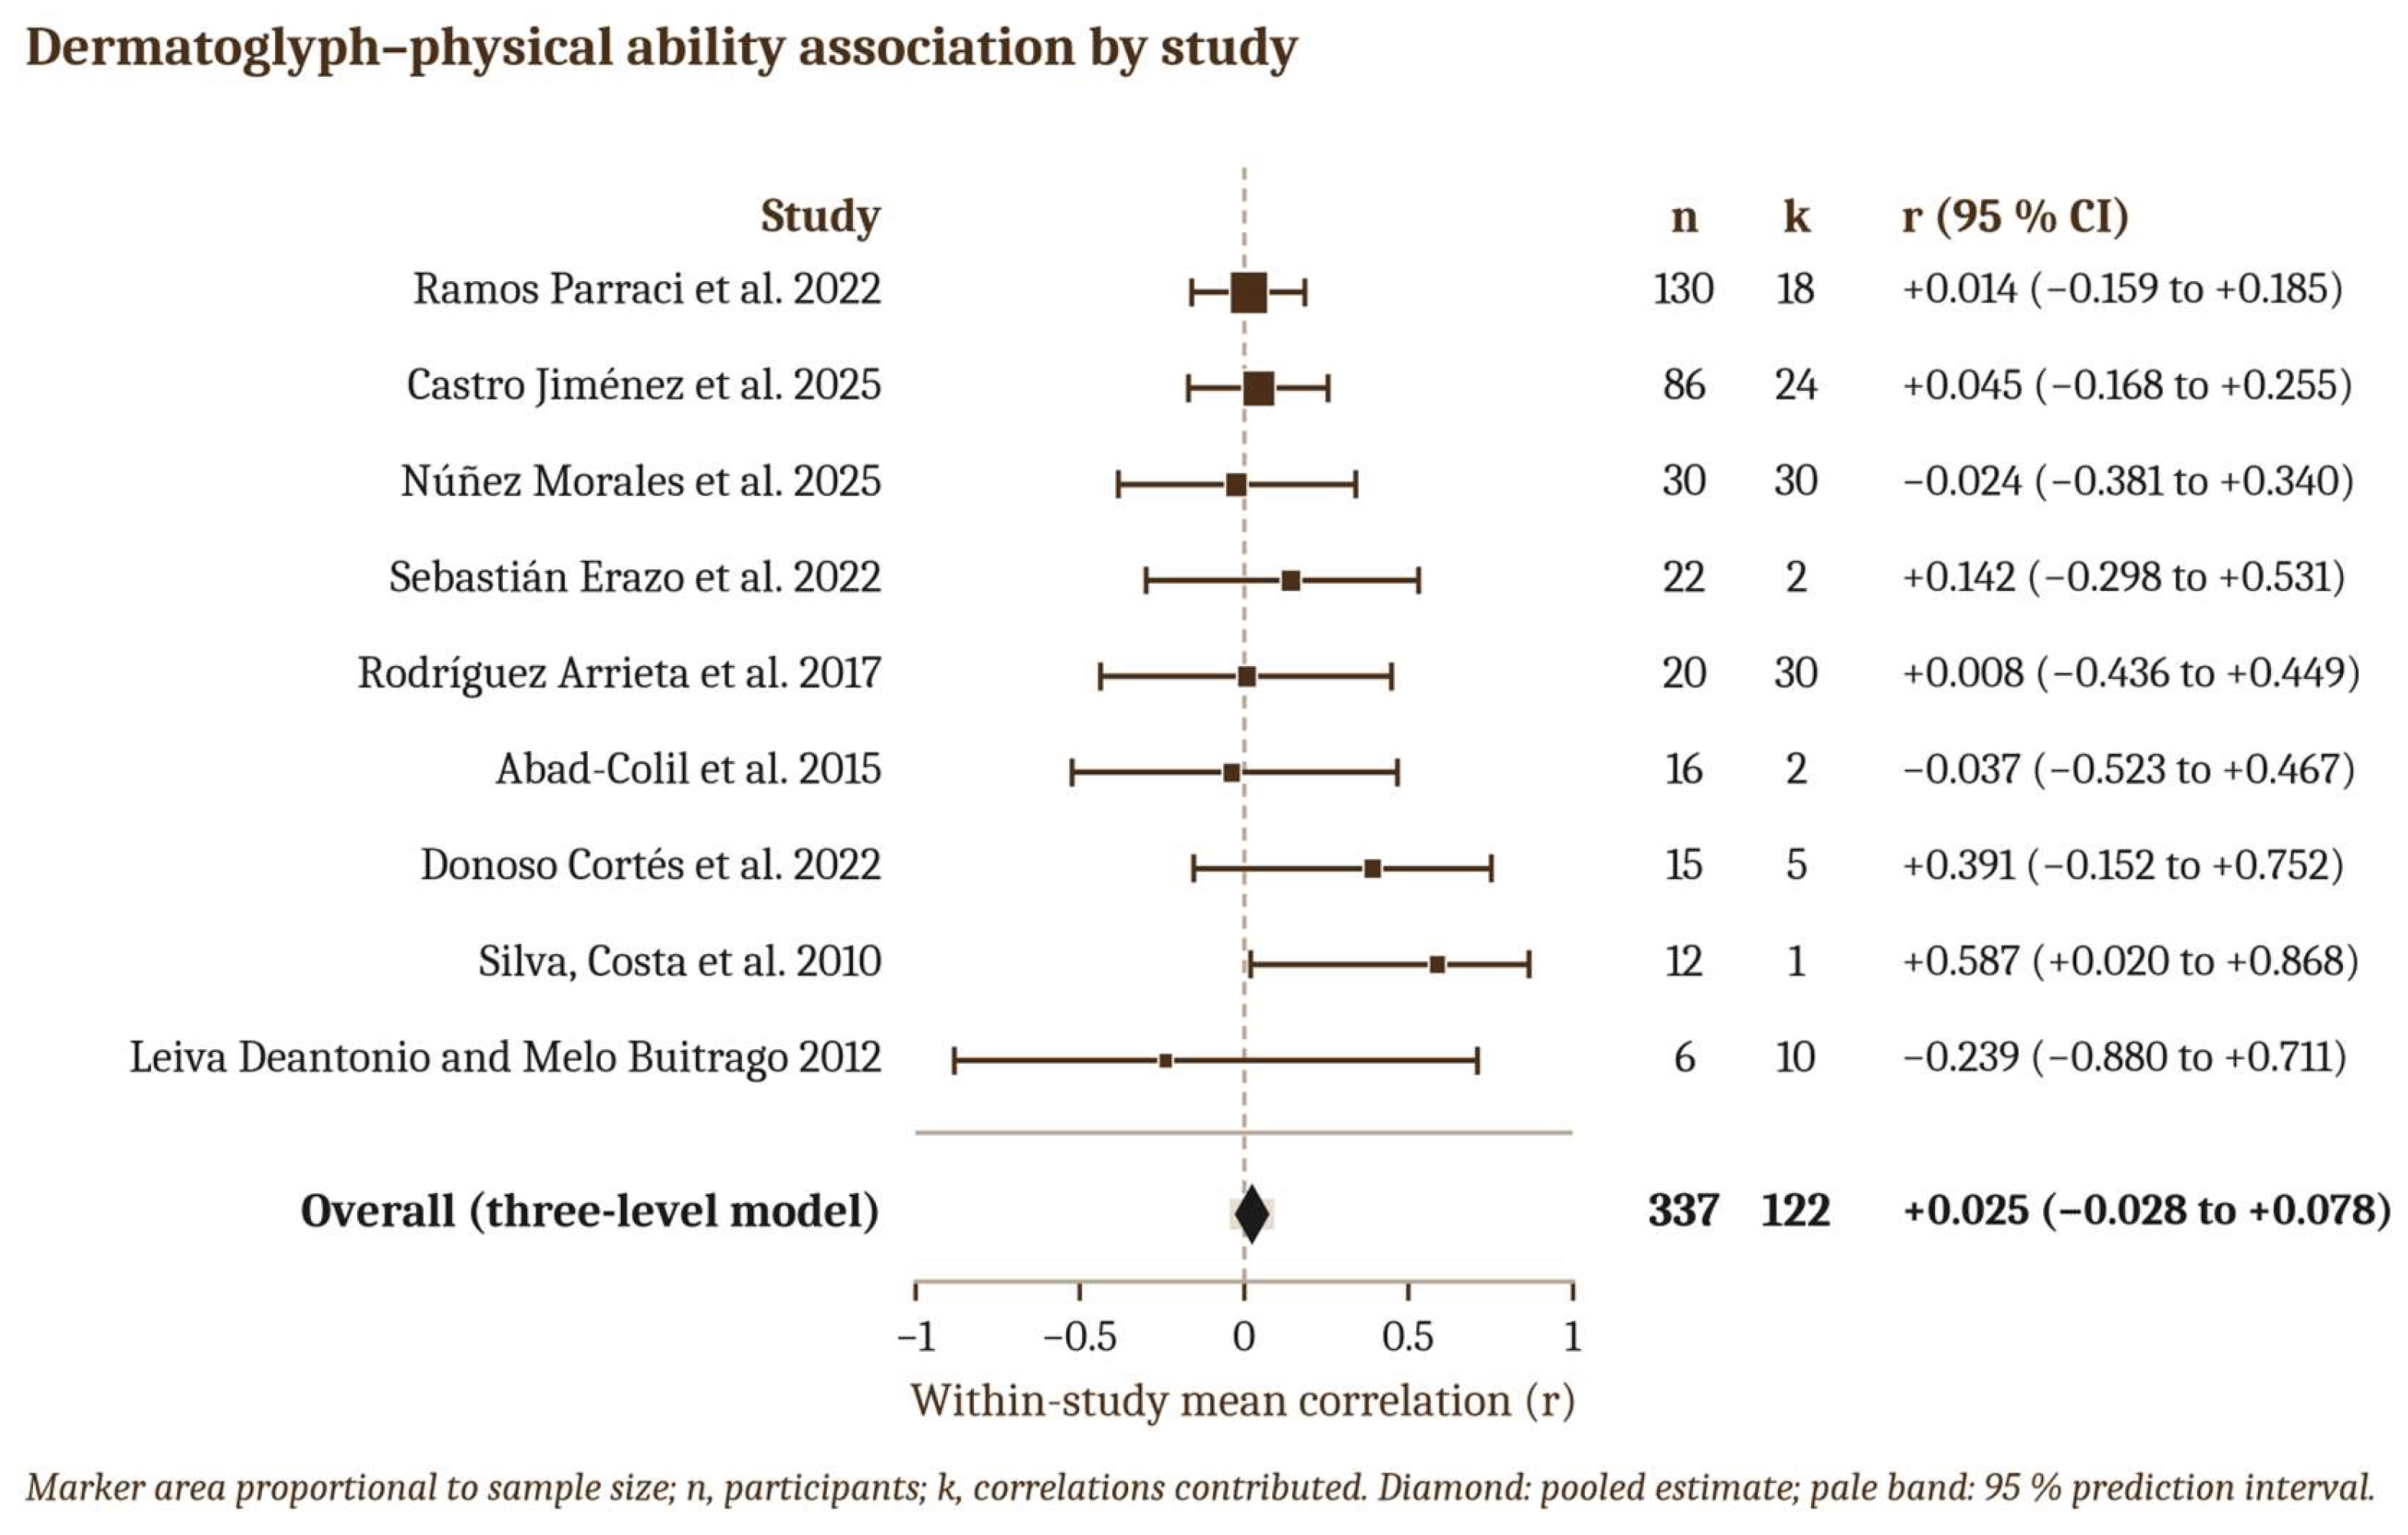
Figure 5.
Overall pooled estimate and estimates by prespecified subgroup. Each subgroup is named on the left, and its numeric estimate is given on the right; k is the number of effects, and St. is the number of studies contributing. The pale bar is the 95% prediction interval, and confidence intervals carry the Hartung–Knapp adjustment and, like Table 3, assume conditional independence of effects within studies (Section 2.6). Agility is shown with its full interval from −1 to 1.
Figure 5.
Overall pooled estimate and estimates by prespecified subgroup. Each subgroup is named on the left, and its numeric estimate is given on the right; k is the number of effects, and St. is the number of studies contributing. The pale bar is the 95% prediction interval, and confidence intervals carry the Hartung–Knapp adjustment and, like Table 3, assume conditional independence of effects within studies (Section 2.6). Agility is shown with its full interval from −1 to 1.
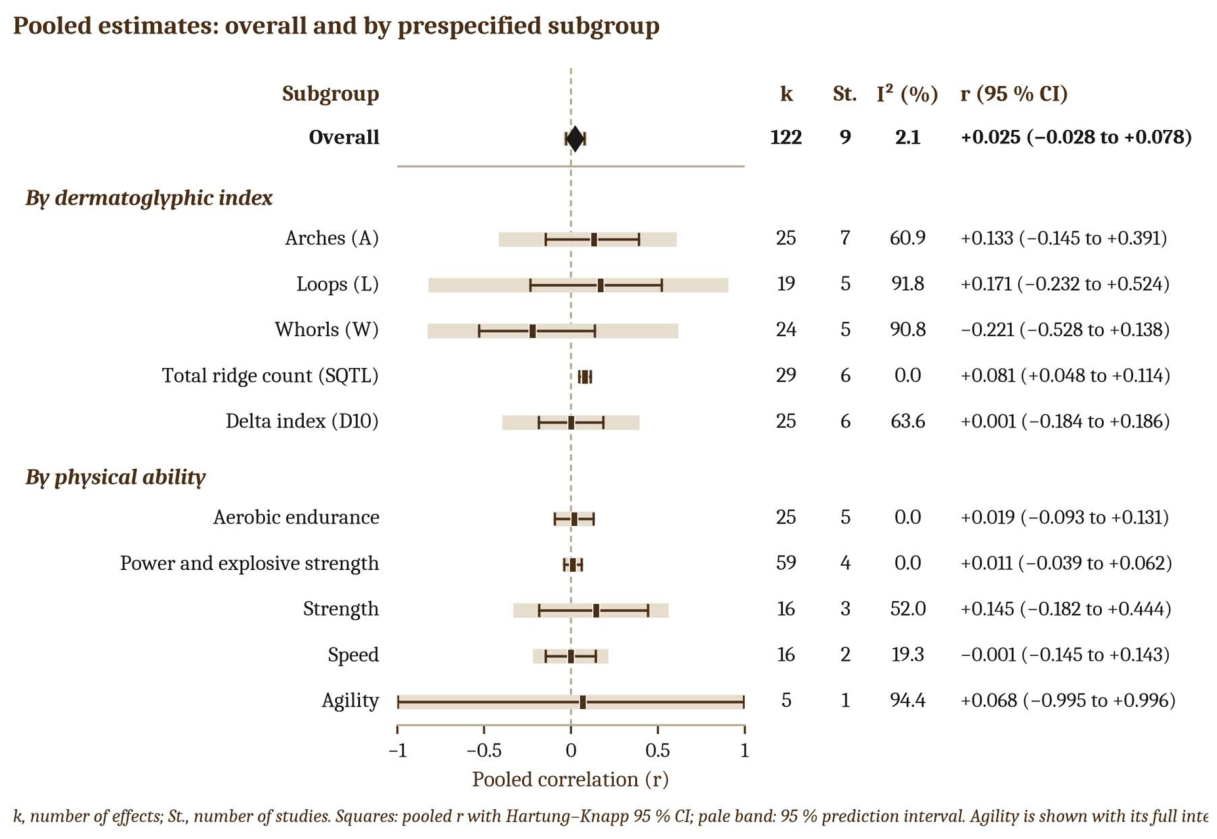
Figure 6.
(a) Funnel plot of the 122 effect estimates, shown for description only: effects from one study share a single standard error and stack vertically, so the plot cannot display small-study effects across studies [24]. (b) Distribution of observed correlations, with the median marked. (c) Posterior median of the pooled correlation with its 95% credible interval (thick line) and 95% prediction interval (thin line); the shaded band marks the practical null, |r| < 0.10.
Figure 6.
(a) Funnel plot of the 122 effect estimates, shown for description only: effects from one study share a single standard error and stack vertically, so the plot cannot display small-study effects across studies [24]. (b) Distribution of observed correlations, with the median marked. (c) Posterior median of the pooled correlation with its 95% credible interval (thick line) and 95% prediction interval (thin line); the shaded band marks the practical null, |r| < 0.10.
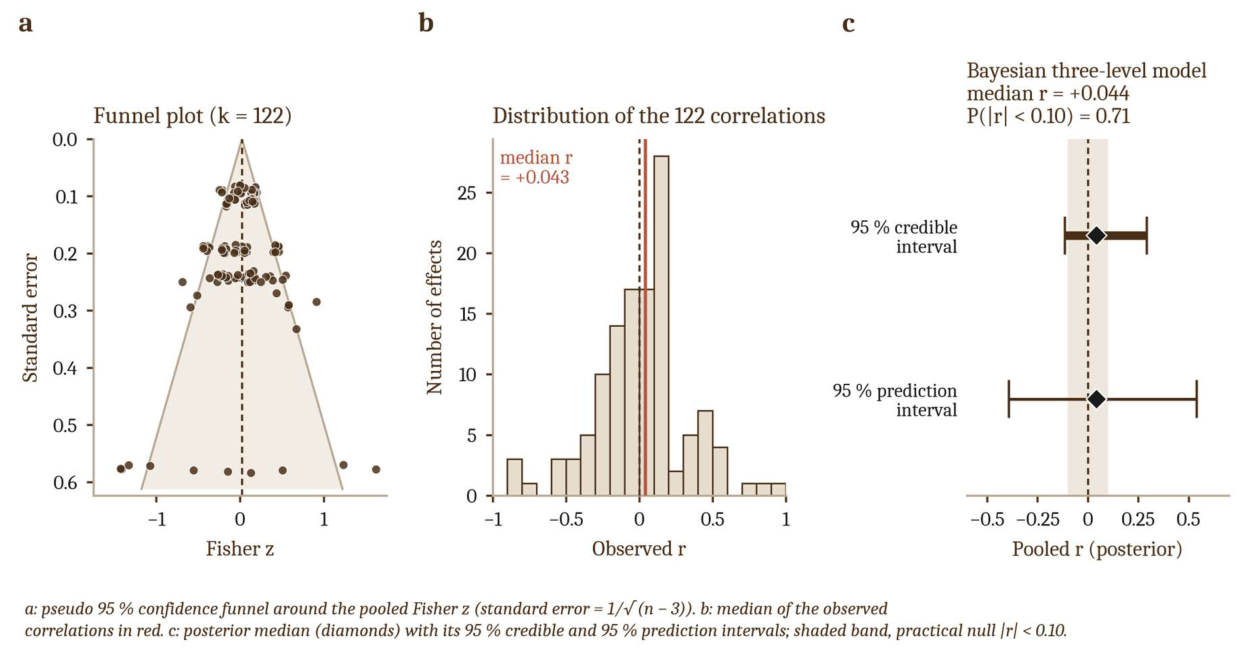
Figure 7.
(a) Mean and (b) distribution of the absolute correlation at the three vertices of the confounding triangle, computed within the four studies that report all three relationships (Table 4). Means are unweighted and carry no interval; the anthropometry × physical ability vertex contains no coefficient below about |r| = 0.27, which indicates that not every coefficient at that vertex was available for extraction (Section 3.9).
Figure 7.
(a) Mean and (b) distribution of the absolute correlation at the three vertices of the confounding triangle, computed within the four studies that report all three relationships (Table 4). Means are unweighted and carry no interval; the anthropometry × physical ability vertex contains no coefficient below about |r| = 0.27, which indicates that not every coefficient at that vertex was available for extraction (Section 3.9).
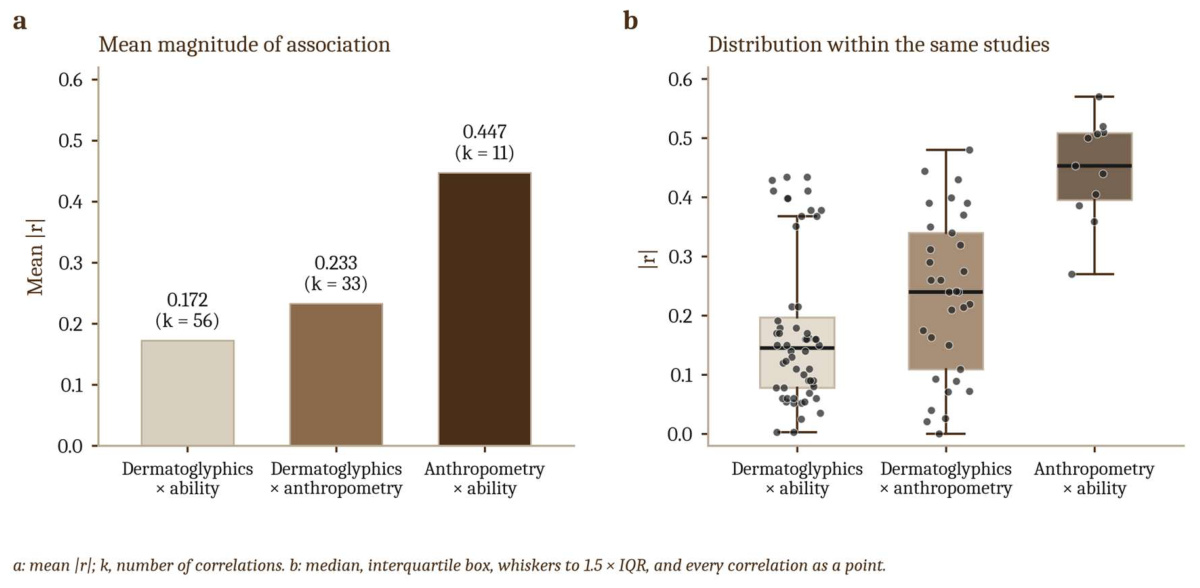
Figure 8.
Precision-weighted correlation per cell of the dermatoglyphic index by capacity domain: the inverse-variance (n − 3)-weighted mean of the Fisher z values in the cell, back-transformed to r; k effects and e studies. Cells with a dash contain no data. Motor coordination and anaerobic endurance have no column because no study published a coefficient for either; the single flexibility coefficient is not shown.
Figure 8.
Precision-weighted correlation per cell of the dermatoglyphic index by capacity domain: the inverse-variance (n − 3)-weighted mean of the Fisher z values in the cell, back-transformed to r; k effects and e studies. Cells with a dash contain no data. Motor coordination and anaerobic endurance have no column because no study published a coefficient for either; the single flexibility coefficient is not shown.
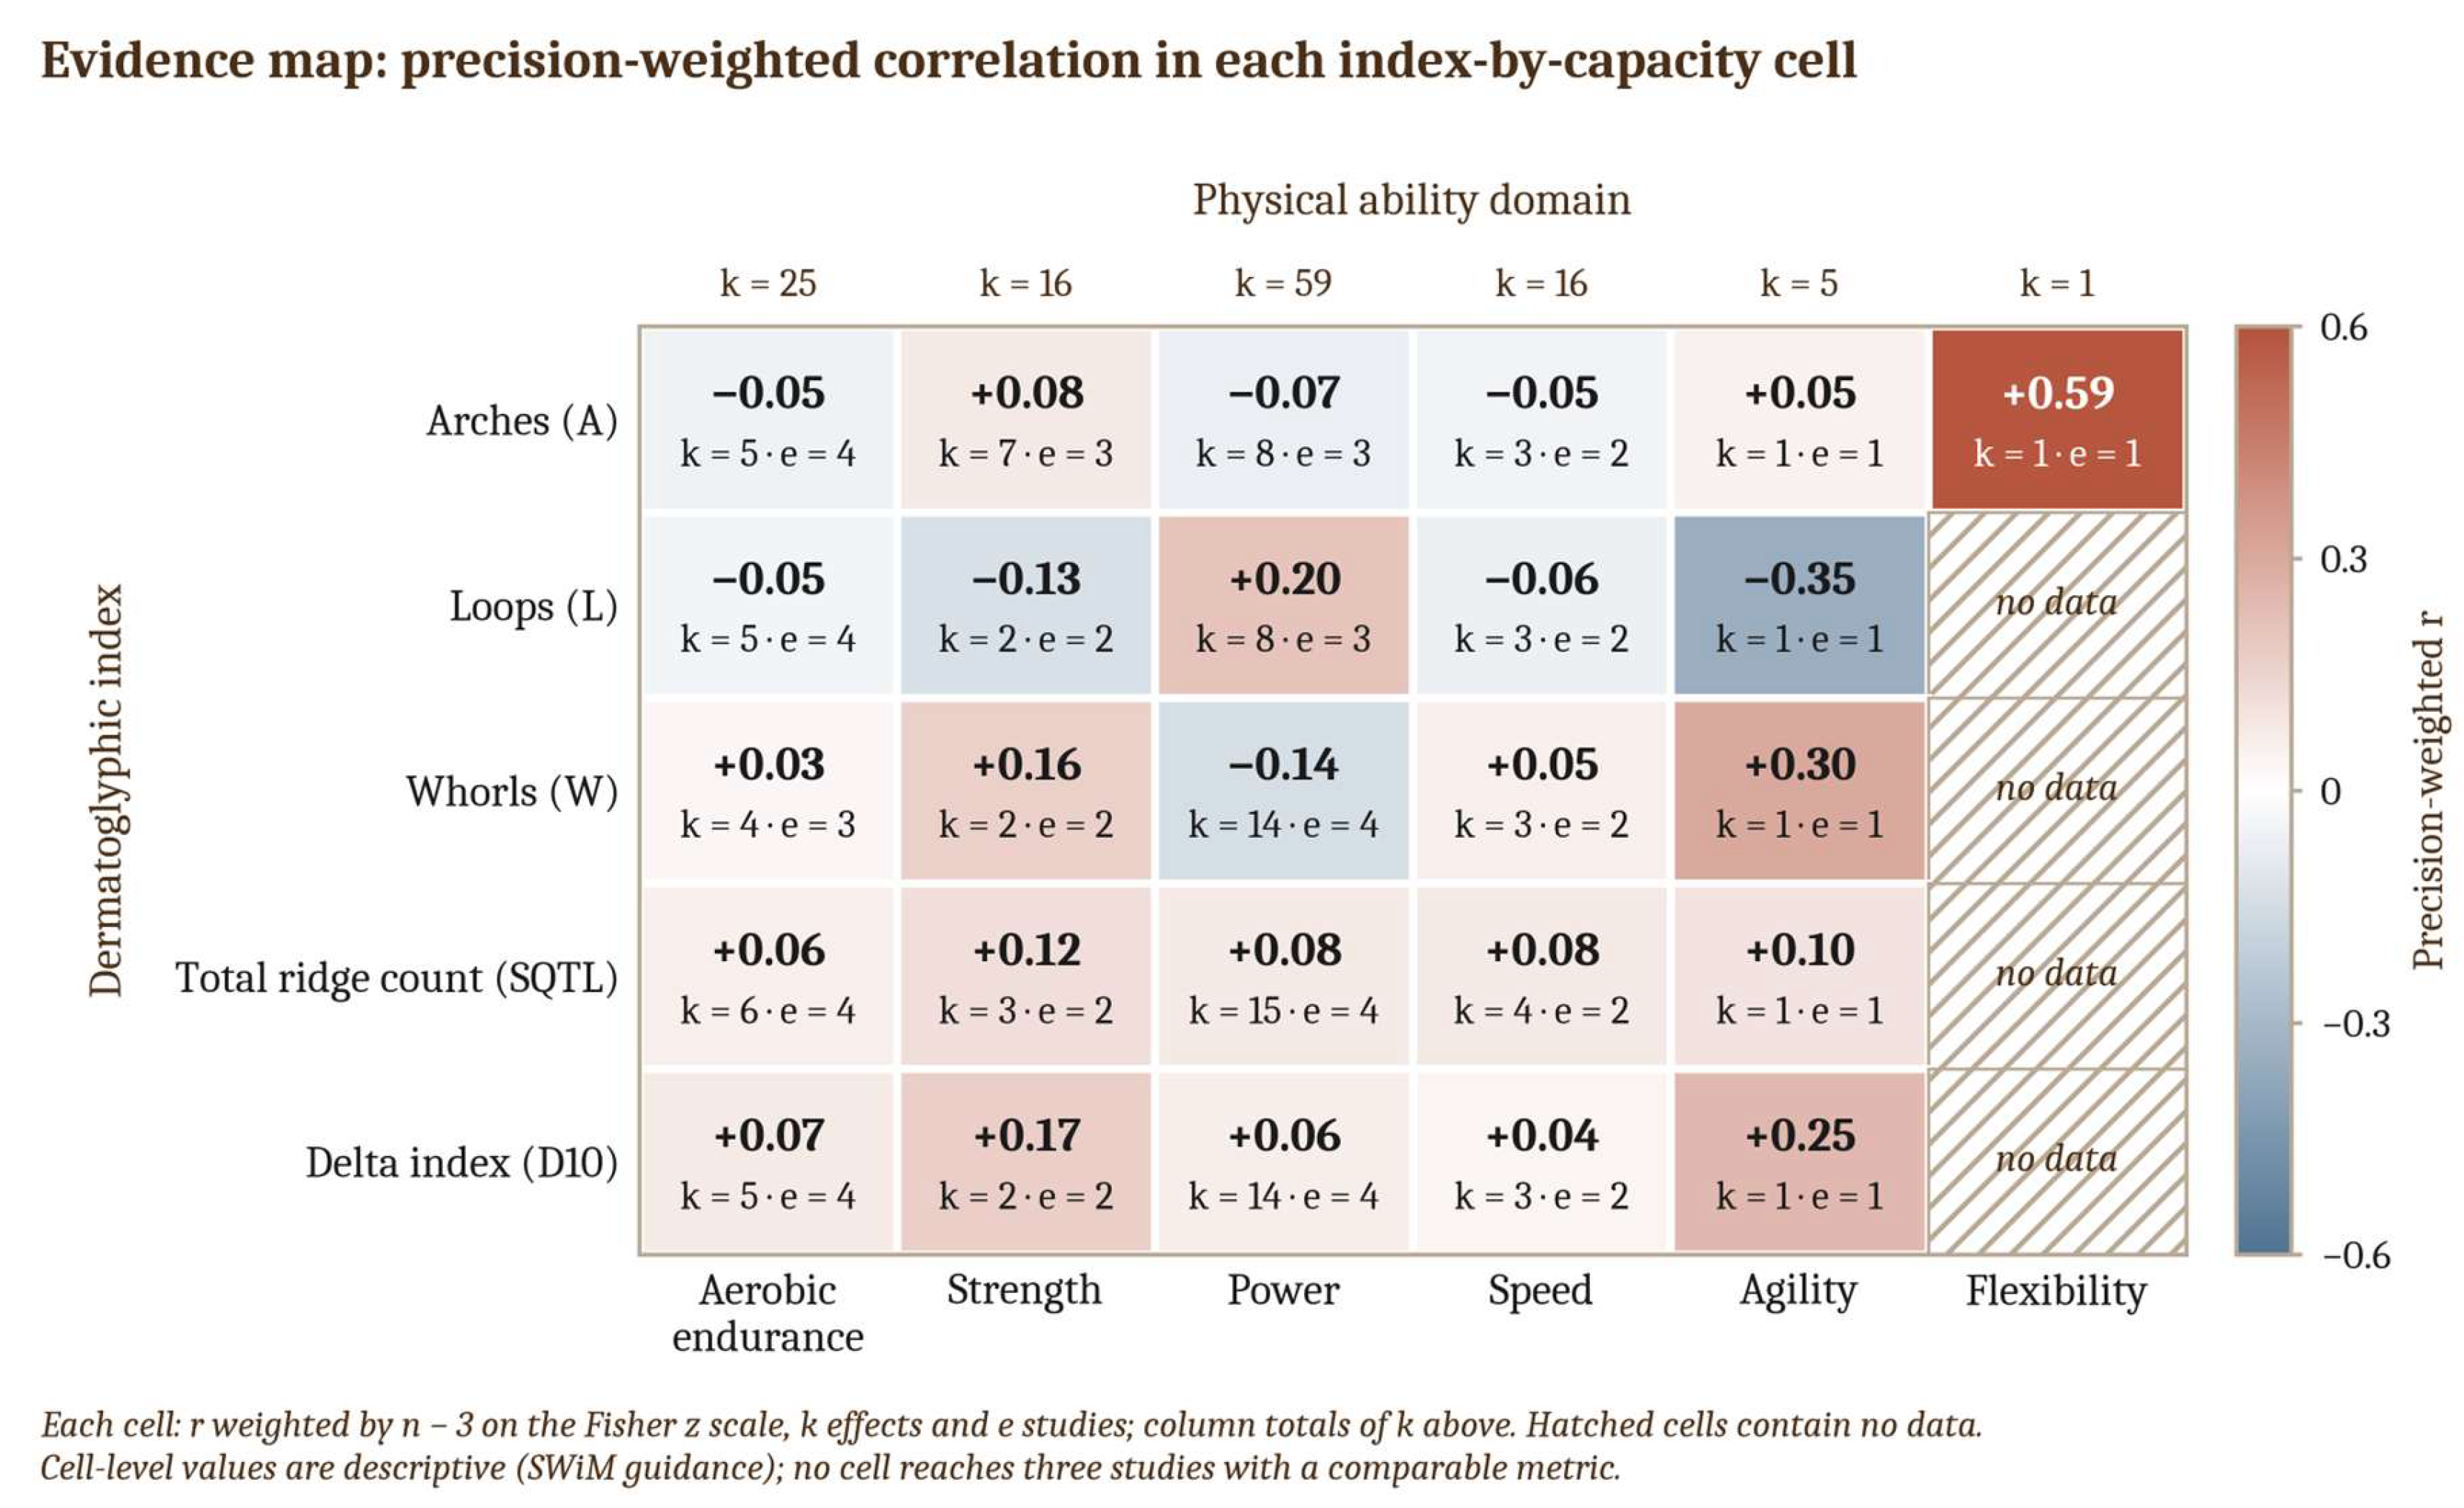

Table 1.
Reasons for exclusion at full-text assessment (n = 57).
| Code | Reason for exclusion at full text | n |
|---|---|---|
| E1 | Not finger or palmar dermatoglyphics: another sense of "fingerprint" (spectral, molecular, epigenetic, connectomic, facial, radio-frequency) | 8 |
| E2 | No physical ability measured with an objective test; profile described or compared only | 18 |
| E3 | Clinical outcome: injury, musculoskeletal disease, blood pressure, cancer | 4 |
| E4 | Plantar dermatoglyphics only | 2 |
| E5 | Outcome is genotype, handedness, or competitive level, not measured physical ability | 5 |
| E6 | Excluded design: review without primary data, reflection article, case series, instrument validation | 10 |
| E7 | Circularity: physical ability inferred from the fingerprint itself rather than measured | 7 |
| E8 | Dermatoglyphics not assessed | 1 |
| E9 | Duplicate publication of the same dataset | 2 |
Table 2.
Characteristics of the nine studies contributing extractable effect estimates. The eleven additional studies [17,25,28,29,30,31,32,33,34,35,36] include three that report a non-correlational association statistic not convertible under Section 2.6, seven that measured both constructs but published no linking statistic, and one borderline report [25]; they are described in the supplementary extraction file. No study in either group reported an anthropometry-adjusted estimate or the reliability of its dermatoglyphic measurement. The n given for [37] is the sample size used to compute the published correlation matrix; the article reports a total sample of 149 athletes. Age range, sex, the indices reported, and the completeness of the published correlation matrix for each study are given in the supplementary extraction file; the studies with complete fingerprint–anthropometry–performance matrices are marked † (the fourth, Gálvez Pardo et al. 2021 [29], contributed anthropometry correlations only and is listed among the studies without a poolable effect) and are identified in Table 4.
Table 2.
Characteristics of the nine studies contributing extractable effect estimates. The eleven additional studies [17,25,28,29,30,31,32,33,34,35,36] include three that report a non-correlational association statistic not convertible under Section 2.6, seven that measured both constructs but published no linking statistic, and one borderline report [25]; they are described in the supplementary extraction file. No study in either group reported an anthropometry-adjusted estimate or the reliability of its dermatoglyphic measurement. The n given for [37] is the sample size used to compute the published correlation matrix; the article reports a total sample of 149 athletes. Age range, sex, the indices reported, and the completeness of the published correlation matrix for each study are given in the supplementary extraction file; the studies with complete fingerprint–anthropometry–performance matrices are marked † (the fourth, Gálvez Pardo et al. 2021 [29], contributed anthropometry correlations only and is listed among the studies without a poolable effect) and are identified in Table 4.
| Study [ref] | Country | n | Population | Exposure capture | Physical ability tests | Author group | Effects |
|---|---|---|---|---|---|---|---|
| Ramos Parraci et al. 2022 [37] | Colombia | 130 | High-performance athletes, five disciplines | DERMASOFT digital reader | Bosco protocol: squat jump (SJ), countermovement jump (CMJ), Abalakov jump, drop jump; photoelectric sensor | Tolima | 18 |
| Castro Jiménez et al. 2025 [38] † | Colombia | 86 | Professional (42) and academy (44) footballers | Digital reader, ridge count per digit | Maximal oxygen uptake (VO2max); T-Force dynamometry (force, power, velocity) | Bogotá | 24 |
| Núñez Morales et al. 2025 [39] † | Colombia | 30 | Youth female artistic gymnasts | Digital reader with software | Bosco protocol: SJ and CMJ (height, force, peak power) | Tolima | 30 |
| Erazo Bello et al. 2021 [40] † | Colombia | 22 | Under-20 footballers | Cummins and Midlo protocol [13], ink | VO2max estimated from Course Navette | Bogotá | 2 |
| Montenegro Arjona et al. 2017 [41] | Colombia | 20 | Under-16 departmental football selection | Cummins and Midlo protocol [13], ink | VO2max, standing long jump, dynamometry, 30 m, 50 m, Illinois | Córdoba | 30 |
| Abad-Colil et al. 2015 [42] | Chile | 16 | National rowing squad | Cummins and Midlo protocol [13], ink | One-repetition maximum (1RM), upper and lower limb; 2000 m rowing ergometer | Chile | 2 |
| Donoso Cortés et al. 2022 [43] | Colombia | 15 | University basketball players | Cummins and Midlo protocol [13], ink | T-Force linear encoder (velocity and acceleration) | Bogotá | 5 |
| Costa et al. 2010 [44] | Brazil | 12 | Youth volleyball players | Dermatoglyphic method | PROESP-BR (Projeto Esporte Brasil) field-test battery | Brazil | 1 |
| Leiva Deantonio and Melo Buitrago 2012 [2] | Colombia | 6 | National military pentathlon squad | Cummins and Midlo protocol [13], ink | Ergospirometry (Bruce, gas analyzer); Abalakov jump | Bogotá | 10 |
Table 3.
Three-level meta-analysis by prespecified subgroup. HK Hartung–Knapp. Intervals assume conditional independence of effects within studies and are anti-conservative (Section 2.6); p-values are exploratory. The correlated-and-hierarchical-effects estimate is given in the text for the overall analysis (Section 3.4) and for the total ridge count (Section 3.5); for the other subgroups, the number of studies is too small for a robust interval to be informative. When I² = 0.0%, the prediction interval coincides with the CI because the between-level variances are estimated to be zero. The subgroups by physical ability sum to 121 effects; the single flexibility effect is not assigned to any subgroup.
Table 3.
Three-level meta-analysis by prespecified subgroup. HK Hartung–Knapp. Intervals assume conditional independence of effects within studies and are anti-conservative (Section 2.6); p-values are exploratory. The correlated-and-hierarchical-effects estimate is given in the text for the overall analysis (Section 3.4) and for the total ridge count (Section 3.5); for the other subgroups, the number of studies is too small for a robust interval to be informative. When I² = 0.0%, the prediction interval coincides with the CI because the between-level variances are estimated to be zero. The subgroups by physical ability sum to 121 effects; the single flexibility effect is not assigned to any subgroup.
| Analysis | k | Studies | Pooled r | 95% CI (HK) | 95% prediction interval | I² (%) | p |
|---|---|---|---|---|---|---|---|
| Overall | 122 | 9 | 0.025 | −0.028 to 0.078 | −0.043 to 0.093 | 2.1 | 0.347 |
| Arches (A) | 25 | 7 | 0.133 | −0.145 to 0.391 | −0.415 to 0.610 | 60.9 | 0.333 |
| Loops (L) | 19 | 5 | 0.171 | −0.232 to 0.524 | −0.820 to 0.906 | 91.8 | 0.387 |
| Whorls (W) | 24 | 5 | −0.221 | −0.528 to 0.138 | −0.825 to 0.619 | 90.8 | 0.214 |
| Total ridge count (SQTL) | 29 | 6 | 0.081 | 0.048 to 0.114 | 0.048 to 0.114 | 0.0 | < 0.001 |
| Delta index (D10) | 25 | 6 | 0.001 | −0.184 to 0.186 | −0.394 to 0.396 | 63.6 | 0.988 |
| Aerobic endurance | 25 | 5 | 0.019 | −0.093 to 0.131 | −0.093 to 0.132 | 0.0 | 0.724 |
| Power and explosive strength | 59 | 4 | 0.011 | −0.039 to 0.062 | −0.039 to 0.062 | 0.0 | 0.650 |
| Strength | 16 | 3 | 0.145 | −0.182 to 0.444 | −0.331 to 0.563 | 52.0 | 0.361 |
| Speed | 16 | 2 | −0.001 | −0.145 to 0.143 | −0.218 to 0.216 | 19.3 | 0.986 |
| Agility | 5 | 1 | 0.068 | −0.995 to 0.996 | −1.000 to 1.000 | 94.4 | 0.953 |
Table 4.
Magnitudes of the absolute correlation at the three vertices of the confounding triangle, within the four studies reporting all three relationships: Castro Jiménez et al. 2025 [38], Núñez Morales et al. 2025 [39], Erazo Bello et al. 2021 [40], and Gálvez Pardo et al. 2021 [29]; these studies are marked in Table 2. k is the number of correlations; the number of coefficients per vertex is unequal because the published matrices do not report every pairwise coefficient, and each vertex lists the studies that contribute to it. The precision-weighted mean is the inverse-variance (n − 3)-weighted mean of the Fisher z of |r|, back-transformed. No interval is given: the coefficients are dependent within studies, and each vertex rests on two to four studies, too few for a cluster bootstrap resampling study.
Table 4.
Magnitudes of the absolute correlation at the three vertices of the confounding triangle, within the four studies reporting all three relationships: Castro Jiménez et al. 2025 [38], Núñez Morales et al. 2025 [39], Erazo Bello et al. 2021 [40], and Gálvez Pardo et al. 2021 [29]; these studies are marked in Table 2. k is the number of correlations; the number of coefficients per vertex is unequal because the published matrices do not report every pairwise coefficient, and each vertex lists the studies that contribute to it. The precision-weighted mean is the inverse-variance (n − 3)-weighted mean of the Fisher z of |r|, back-transformed. No interval is given: the coefficients are dependent within studies, and each vertex rests on two to four studies, too few for a cluster bootstrap resampling study.
| Vertex of the triangle | k | Mean |r| | Median |r| | Precision-weighted |r| | Studies (per-study mean |r|) |
|---|---|---|---|---|---|
| Dermatoglyphics × physical ability | 56 | 0.172 | 0.145 | 0.150 | [38] k = 24, 0.120; [39] k = 30, 0.216; [40] k = 2, 0.142 |
| Dermatoglyphics × anthropometry | 33 | 0.233 | 0.240 | 0.221 | [40] k = 14, 0.314; [29] k = 9, 0.238; [39] k = 10, 0.114 |
| Anthropometry × physical ability | 11 | 0.447 | 0.453 | 0.447 | [40] k = 6, 0.468; [39] k = 5, 0.422 |
Table 5.
GRADE certainty ratings, adapted to prognostic-factor questions. Bodies of observational evidence begin at high certainty. Imprecision is rated on the dependency-aware intervals (Section 3.4 and Section 3.8), not on the three-level interval shown. Unadjusted confounding and selective reporting would be expected to bias estimates away from the null.
Table 5.
GRADE certainty ratings, adapted to prognostic-factor questions. Bodies of observational evidence begin at high certainty. Imprecision is rated on the dependency-aware intervals (Section 3.4 and Section 3.8), not on the three-level interval shown. Unadjusted confounding and selective reporting would be expected to bias estimates away from the null.
| Outcome | Studies (effects) | Pooled r (95% CI) | Risk of bias | Inconsistency | Indirectness | Imprecision | Publication bias | Certainty |
|---|---|---|---|---|---|---|---|---|
| Any physical ability | 9 (122) | 0.025 (−0.028 to 0.078) | Very serious (−2) | Not serious | Serious (−1) | Serious (−1) | Suspected (−1) | Very low |
| Aerobic endurance | 5 (25) | 0.019 (−0.093 to 0.131) | Very serious (−2) | Not serious | Serious (−1) | Serious (−1) | Suspected (−1) | Very low |
| Power / explosive strength | 4 (59) | 0.011 (−0.039 to 0.062) | Very serious (−2) | Not serious | Serious (−1) | Serious (−1) | Suspected (−1) | Very low |
| Strength | 3 (16) | 0.145 (−0.182 to 0.444) | Very serious (−2) | Serious (−1) | Serious (−1) | Serious (−1) | Suspected (−1) | Very low |
| Speed | 2 (16) | −0.001 (−0.145 to 0.143) | Very serious (−2) | Not serious | Serious (−1) | Serious (−1) | Suspected (−1) | Very low |
| Agility | 1 (5) | 0.068 (−0.995 to 0.996) | Very serious (−2) | Not assessable | Serious (−1) | Very serious (−2) | Suspected (−1) | Very low |
Disclaimer/Publisher’s Note: The statements, opinions and data contained in all publications are solely those of the individual author(s) and contributor(s) and not of MDPI and/or the editor(s). MDPI and/or the editor(s) disclaim responsibility for any injury to people or property resulting from any ideas, methods, instructions or products referred to in the content. |
© 2026 by the authors. Licensee MDPI, Basel, Switzerland. This article is an open access article distributed under the terms and conditions of the Creative Commons Attribution (CC BY) license (http://creativecommons.org/licenses/by/4.0/).
Copyright: This open access article is published under a Creative Commons CC BY 4.0 license, which permit the free download, distribution, and reuse, provided that the author and preprint are cited in any reuse.