

Submitted:
15 September 2026
Posted:
16 September 2026
You are already at the latest version
Abstract
Background/Objectives: Migraine is three times more common in women and worsens during perimenopause, a phase in which estrogen fluctuations are accompanied by deterioration in body composition — increased fat mass (FM) and reduced fat-free mass (FFM) — amplifying systemic inflammation. Despite this biological link, body composition is not systematically assessed in perimenopausal migraine management. This pre-specified exploratory analysis of the MEDEA study evaluates whether body composition, measured by bioelectrical impedance analysis (BIA), is associated with migraine disability in perimenopausal women, and secondarily describes changes in body composition during an anti-inflammatory nutritional intervention with prebiotics and probiotics. Methods: Single-arm, single-center, prospective interventional study (MEDEA study, Neurological Clinic ASUFC, Udine); the present work is a pre-specified exploratory secondary analysis. Seventeen women (mean age 52 ± 2.6 years) with episodic or chronic migraine, intestinal dysbiosis, and perimenopausal status (STRAW classification) were assessed with Akern BIA at baseline (T0), 3 months (T3), and 6 months (T6). Changes over time were analyzed with the Wilcoxon signed-rank test; correlations with migraine disability with Spearman's rho. Results: Over the intervention period, FM decreased selectively (median −1.60 kg at T3, p = 0.001; median −3.00 kg at T6, p < 0.001), with FFM remaining broadly stable. At baseline, higher FFM correlated with lower migraine disability (MIDAS: rho = −0.667, p = 0.009, n = 14). Longitudinal Δ-Δ associations (ECW, phase angle) are reported as exploratory. Conclusions: These exploratory findings suggest that fat-free mass is associated with migraine disability in perimenopause and warrant confirmation, with multivariable adjustment, in the complete sample (n = 54).
Keywords:
migraine
; perimenopause
; bioimpedance analysis
; body composition
; fat mass
; phase angle
; dysbiosis
; anti-inflammatory diet
; probiotics
1. Introduction
Migraine is the second leading cause of disability worldwide and affects women at a rate about three times higher than men [1]. This difference is largely attributed to the modulatory role of estrogens on cortical excitability and pain threshold[2].
During perimenopause, about 30% of women with migraine experience a worsening of attacks [3,4]. The main mechanism is the unpredictable fluctuation of hormone levels: according to the so-called estrogen withdrawal hypothesis, a rapid drop in estrogens lowers the cortical excitability threshold and activates the trigeminovascular pathways [5]. Perimenopause amplifies the variability already present in the menstrual cycle, making episodes less predictable and often less responsive to pharmacologic prophylaxis [6].
In parallel with neurological changes, the menopausal transition entails unfavorable changes in body composition. The SWAN study documented that during perimenopause the rate of fat mass accumulation more than doubles compared to the premenopausal period, while lean mass begins to decline [7,8]. The reduction in estrogens promotes the redistribution of fat towards the visceral compartment, resulting in increased insulin resistance and cardiometabolic risk [9]. These changes cannot be detected by BMI alone, which may remain unchanged while the FM/FFM ratio significantly worsens [8]. Bioimpedance analysis (BIA) is the most suitable tool to detect these changes in outpatient practice: it is noninvasive, inexpensive, and repeatable [10].
The link between body composition and migraine has a biological basis. Visceral fat mass maintains a state of low-grade chronic inflammation, with elevation of pro-inflammatory cytokines such as TNF-α, IL-1β, and IL-6 [11]. TNF-α, in particular, amplifies nociceptive responses in the trigeminovascular system and contributes to pain chronification [12]. In contrast, good lean mass — an indicator of muscle status and protein metabolism — is associated with lower systemic inflammation and greater neuroendocrine resilience [13].
Another relevant mechanism is the gut-brain axis. Intestinal dysbiosis increases mucosal barrier permeability (leaky gut), with systemic release of cytokines that amplify trigeminal nociceptive responses [14,15]. In women with migraine, reduced microbiota diversity and a decrease in butyrate-producing bacteria have been documented [16,17]. Menopause further alters the microbiotic composition through the reduction of estrogens [18,19]. Anti-inflammatory nutritional interventions with prebiotics and probiotics represent an emerging strategy to modulate the gut-brain axis and reduce migraine burden [20]. However, it is still unclear whether the clinical benefit depends on the direct effect on the microbiota, on body recomposition induced by the diet, or on the interaction between these mechanisms.
No study to date has systematically explored the relationship between BIA parameters and migraine disability in perimenopausal women. The objective is twofold: to assess whether body composition is an independent predictor of migraine disability at baseline — before the intervention — and whether its variations over time are an indicator of the response to the nutritional intervention.
2. Materials and Methods
2.1. Study Design and Participants
The MEDEA Study (Modifications of the Microbiota and Migraine in Women in Perimenopause with an Anti-inflammatory Nutritional Regimen) is a single-arm, single-center, prospective interventional study. The present analysis is a pre-specified exploratory secondary analysis restricted to participants with BIA data available at the interim data lock (May 2026).
The participants were recruited from patients attending the Headache Center of the Neurological Clinic of Udine. The eligibility criteria are reported in Table 1. Pharmacological prophylaxis therapies remained unchanged for at least two months prior to enrollment and throughout the duration of the study. The recruitment flow is illustrated in Figure 1. Of the 17 enrolled participants, 15 underwent BIA assessment at T0; two did not undergo BIA at any timepoint and were excluded from all body composition analyses. The present analysis includes all 17 enrolled participants for descriptive purposes (mean age 52 ± 2.6 years, range 46–56); body composition analyses are restricted to the 15 participants with BIA data. The characteristics of the sample are reported in Table 1. The values of the clinical scales at T0 are presented for descriptive purposes; their longitudinal analyses will be the subject of a separate publication on the complete sample (n=54). Enrollment began in September 2023 and is ongoing; the data reported here represent an interim analysis conducted in May 2026.
At each visit (T0, T3, T6), participants underwent neurological and nutritional assessment, completed the clinical questionnaires (MIDAS, HIT-6, HEADWORK, VAS-EQ-5D), and were evaluated with BIA. General blood tests and headache diary review were performed at all timepoints. Gut microbiota analysis (genetic-molecular characterization of bacterial phyla and metabolomic analysis on fecal samples) was performed at T0 and T3 only. The dietary plan was reviewed at each visit.
Migraine disability and headache impact were assessed using four validated questionnaires: the Migraine Disability Assessment Score (MIDAS) [21], the Headache Impact Test-6 (HIT-6)[22] , the HEADWORK Questionnaire [23], and the Visual Analogue Scale for health-related quality of life (VAS-EQ-5D) [24].
2.2. Inclusion and Exclusion Criteria
The patients are identified among those attending the Headache Center of the Neurology Clinic in Udine, according to the predetermined inclusion and exclusion criteria (Table 2).
2.3. Ethical Aspects
The study was conducted in accordance with the Declaration of Helsinki and Good Clinical Practice guidelines, and was approved on 10 May 2023 by the Institutional Review Board (IRB) of the Department of Medical Area, University of Udine (protocol code 79/2023, Tit. III cl. 13 fasc. 5/2023). Prior to enrollment, each participant received a written patient information sheet describing the study rationale, procedures, follow-up duration, and data handling procedures in non-technical language. Written informed consent was obtained from all participants before any study-related procedure. Participants were free to withdraw at any time without consequence for their clinical care. Personal data were collected anonymously using sequential identification codes, in compliance with EU Regulation 679/2016 (GDPR) and Italian Legislative Decree 196/2003 as amended by D.Lgs. 101/2018.
2.4. Dietetic Intervention and Nutritional Evaluations
Participants voluntarily followed a personalized anti-inflammatory dietary plan, either normo- or hypocaloric, based on individual energy needs, aimed at reducing systemic inflammatory burden and correcting intestinal dysbiosis. The dietary pattern was structured around the following weekly consumption targets: vegetables (2 portions/day), fresh fruit (1 portion/day), nuts (1 portion/day), legumes (3–4 times/week), eggs (3–4/week), and fish (3–4 times/week), with a preference for white fish (sole, cod, hake) and oily fish (salmon, anchovies, mackerel); crustaceans and mollusks were excluded. White meat (poultry, veal) was allowed once per week; red meat was limited to once per month; processed meats were excluded entirely. Pasta and cereals were consumed daily, preferably wholegrain and at lunch. Aged cheeses (≥ 18 months maturation, preferably from goat or sheep milk) were allowed once per week; fresh and medium-aged cheeses were avoided. Extra virgin olive oil was used exclusively raw as the primary fat source; polyunsaturated vegetable fats were preferred. Industrial vinegars and condiment sauces were excluded [25]. Participants were instructed to maintain a daily water intake of at least 2–2.5 L, to limit added salt, and to drastically reduce alcohol and refined sugar consumption [26].
In parallel, each participant received targeted pre- and probiotic supplementation selected according to the individual dysbiosis profile identified at enrollment, in line with routine clinical practice. The dietary plan and supplementation were reviewed and adjusted by a trained nutritionist biologist at each follow-up visit based on BIA findings, dietary recall, and clinical response.
2.5. Bioelectrical Impedance Analysis (BIA) and Vector Analysis (BIVA)
Body composition was assessed using the BIA 101 BIVA PRO system (Akern Srl, Pisa, Italy), a validated, non-invasive, and reproducible method for the evaluation of body composition in clinical settings [27]. BIA measures the resistance of biological tissues to the passage of a low-intensity alternating electrical current, exploiting the different electrical properties of fat mass, fat-free mass, and body water compartments [27]. The obtained parameters reflect the distribution of body fluids and the structural integrity of cell membranes, making BIA particularly suited to detecting changes in body composition that traditional anthropometric measures, such as BMI, are unable to capture [27].
All measurements were performed under standardized conditions: minimum 4-hour fasting, empty bladder, supine position, and no intense physical activity in the 12 hours prior to assessment. Electrodes were positioned using the hand-to-foot technique. Measurements were conducted by the same trained nutritionist biologist at each timepoint (T0, T3, T6) to minimize inter-operator variability.
The following parameters were recorded: body mass index (BMI, kg/m²), fat mass (FM, kg), fat-free mass (FFM, kg), phase angle (°), intracellular water (ICW, L), and extracellular water (ECW, L). The phase angle, derived from the ratio between resistance and reactance, is an indicator of cell membrane integrity and nutritional status: higher values reflect better cellular quality and hydration [28]. ECW reflects the extracellular fluid compartment and serves as an indirect marker of peripheral inflammation and tissue edema: elevated ECW values are associated with chronic low-grade inflammatory states [29]. FFM encompasses muscle mass, bone mass, and total body water, and is considered a proxy of metabolic and nutritional reserve [27].
Raw resistance (R) and reactance (Xc) values were standardized by height in meters to calculate R/H and Xc/H. These values were plotted on the bioimpedance vector graph using the Hospital Bodygram software (version 3.0.33), referencing the healthy Italian population [28]. The R/H and Xc/H data for each patient were analyzed in relation to the 50%, 75%, and 95% tolerance ellipses of the reference population, enabling classification of hydration and nutritional status according to the criteria of Bioelectrical Impedance Vector Analysis (BIVA) [30,31].
2.6. Interventions
In parallel with the dietary intervention, each participant received OMNi-BiOTiC® METAtox (Institut AllergoSan, Graz, Austria), a multispecies probiotic food supplement formulated in a powder matrix of maize starch, maltodextrin, potassium chloride, hydrolyzed rice protein, magnesium sulfate, amylases, chromium picolinate, and manganese sulfate. Each 3 g sachet contains 9 probiotic strains of human origin — Lactobacillus acidophilus W37, Levilactobacillus brevis W63, Lacticaseibacillus paracasei W56, Ligilactobacillus salivarius W24, Bifidobacterium bifidum W23, Bifidobacterium animalis ssp. lactis W52, Bifidobacterium animalis ssp. lactis W51, Lactococcus lactis ssp. lactis W19, and Lactococcus lactis ssp. lactis W58 — with a total count of at least 7.5 × 10⁹ colony-forming units (CFU) per sachet. The product is free from gluten, lactose, animal proteins, yeast, and genetically modified organisms. Participants were instructed to dissolve one sachet in approximately 125 ml of water, allow one minute of activation time, and consume the product on an empty stomach. Two sachets per day were administered (6 g/day, delivering at least 1.5 × 10¹⁰ CFU/day), one in the morning before breakfast and one in the evening before dinner or before bedtime. The specific probiotic formulation was selected on the basis of its documented action on intestinal barrier integrity and metabolic dysbiosis, consistent with the pathophysiological framework of the study. The methodological approach for probiotic characterization follows the reporting standards adopted in previous clinical studies using OMNi-BiOTiC® multispecies formulations [32].
2.7. Outcomes
The primary outcome of this analysis was the cross-sectional association at baseline (T0) between BIA-derived body composition (primarily FFM) and migraine-related disability (MIDAS).
Secondary, exploratory outcomes were: (i) changes in body composition over time (T0, T3, T6); (ii) co-variation between changes in BIA parameters and changes in clinical measures over T0 to T3.
2.8. Data and Statistical Analysis
Changes in BIA parameters over time were analyzed using the Wilcoxon signed-rank test for paired measurements. Correlations with migraine disability scales (MIDAS, HEADWORK, VAS) were calculated using Spearman’s rho coefficient, both on baseline absolute values and on T0→T3 changes (delta). The significance threshold was set at p<0.05; values between 0.05 and 0.10 were considered borderline trends (†). Analyses were conducted in Python (scipy, pandas). No formal sample size estimation was performed for this exploratory secondary analysis; all participants with available BIA data at the interim data lock were analyzed (convenience sample). The reduced and underpowered sample is a limitation, and results are hypothesis-generating. All analyses used complete cases; no imputation was applied. Given the exploratory nature of the analysis and the number of correlations examined, p-values are reported without correction for multiple comparisons and should be interpreted with caution. Correlation analyses were conducted on the longitudinal analytical sample, defined as participants with BIA data at T0 and at least one follow-up visit. Two participants did not undergo BIA assessment at T0 and were excluded from all body composition analyses, leaving n = 15 with BIA data at baseline. A third participant had BIA data at T0 but did not attend any follow-up visit and was therefore also excluded from correlation analyses. The baseline correlation sample thus comprised n = 14.
3. Results
3.1. Body Composition Changes Over Time
A total of 17 patients were enrolled at baseline (T0); 14 completed the 3-month follow-up visit (T3) and 11 completed the 6-month follow-up (T6). In both cases, loss to follow-up was due to failure to attend the scheduled visit. No withdrawals due to adverse events, dietary intolerances, or probiotic-related side effects were recorded. Of the 17 enrolled participants, 15 underwent BIA assessment at T0 (two did not undergo BIA at any timepoint), 11 at T3, and 13 at T6. Paired analyses were conducted on n = 11 per cell at T3 and n = 13 per cell at T6.
Following the nutritional intervention, body composition underwent significant and selective changes. Table 3 reports baseline values together with the paired changes at T3 and T6. Fat mass is the only variable with a statistically significant and consistent change at both follow-ups: it decreases by a median of 1.60 kg at T3 (IQR: −2.15 to −1.40 kg; n = 11 paired, all 11 pairs concordant, p = 0.001) and by a median of 3.00 kg at T6 (IQR: −3.80 to −2.10 kg; n = 13 paired, 12 of 13 pairs concordant, p < 0.001; Figure 2A). The stronger significance at T6 despite similar paired sample size reflects higher within-pair concordance. FFM remained broadly stable at both timepoints (median +0.30 kg at T3, IQR: 0.30 to 0.35 kg, n = 11, p = 0.130; median +0.60 kg at T6, IQR: 0.60 to 2.90 kg, n = 13, p = 0.144; Figure 2B), reflecting a profile of selective body recomposition consistent with a normoproteic anti-inflammatory diet. BMI showed a significant reduction at T3 (median −0.50 kg/m², IQR: −1.00 to −0.40, n = 11, p = 0.042*) and a borderline trend at T6 (median −1.00 kg/m², IQR: −1.20 to −0.70, n = 13, p = 0.089†), probably due to the narrow BMI range observed in this sample (18.6–26.2 kg/m²). Phase angle shows a borderline increase at both follow-ups (median +0.20° at T3, p = 0.076†; median +0.40° at T6, p = 0.062†; Figure 3A), indicating progressive improvement in cell membrane integrity. Variations in ICW and ECW are modest and non-significant at both timepoints, with a borderline trend for ICW at T6 (p = 0.082†); the stability of ECW excludes inflammatory states with peripheral fluid retention.
These data describe the trajectory of body composition over the intervention period. To determine whether body composition at baseline is independently associated with migraine severity—prior to any intervention—correlations were calculated between BIA parameters at T0 and migraine disability scales.
3.2. Baseline Correlations Between Body Composition and Migraine-Related Disability
Of the 15 patients with BIA data at baseline, correlation analyses were restricted to the longitudinal analytical sample (participants with at least one follow-up visit), comprising n = 14 participants. One participant had BIA and clinical scale data at T0 but did not attend any follow-up visit and was therefore excluded from all correlation analyses.
Table 4 reports the Spearman correlations between BIA parameters and migraine disability scales at baseline (n = 14). FFM is the parameter most strongly correlated with migraine-related disability: patients with higher lean mass show significantly lower MIDAS scores (rho = −0.667, p = 0.009, n = 14; Figure 4). A trend in the same direction is observed for HEADWORK (rho = −0.513, p = 0.061†, n = 14). ECW shows a negative correlation with MIDAS (rho = −0.601, p = 0.023, n = 14) and a borderline trend with HEADWORK (rho = −0.507, p = 0.065†), a finding requiring cautious interpretation and discussed in section 4. BMI, FM, and phase angle do not show significant correlations with the clinical scales at baseline.
In addition to the baseline predictive value, it was explored whether changes in body composition induced by the intervention co-varied with clinical improvement over the T0→T3 interval.
3.3. Longitudinal Correlations Between BIA Changes and Clinical Outcome Changes (T0→T3)
Table 5 shows the correlations between BIA changes and clinical changes in the T0→T3 interval (n = 11 per cell). Three associations reach statistical significance. The reduction in ECW co-varies with improvement in MIDAS (rho = +0.740, p = 0.009; Figure 5): patients who reduce extracellular water the most show the greatest improvement in migraine-related disability. Improvement in phase angle is associated with improvement in perceived quality of life (ΔPhaseAngle↔ΔVAS: rho = +0.621, p = 0.042; Figure 3B). ΔMIDAS↔ΔBMI also reaches statistical significance (rho = +0.606, p = 0.048*), suggesting that a greater reduction in BMI is associated with greater improvement in migraine-related disability. There is a borderline trend for ΔMIDAS↔ΔFM (rho = +0.588, p = 0.057†), suggesting that a greater reduction in fat mass tends to be associated with greater improvement in migraine-related disability, although the small sample size does not allow statistical significance to be reached.
4. Discussion
The MEDEA study provides a systematic characterization of body composition by bioelectrical impedance analysis, and its relationship with migraine disability, in perimenopausal women with migraine and documented intestinal dysbiosis, assessed before and after an anti-inflammatory nutritional intervention with pre- and probiotics. To our knowledge, this combination of population and assessment has not been reported previously. The findings are exploratory and describe associations. They suggest that body composition deserves to be examined as a possible modifier of migraine vulnerability at this stage of life, rather than as a simple correlate of general health status.
The baseline profile confirms that BMI alone is insufficient to describe body composition in this population. Prospective longitudinal studies have documented that, during the menopausal transition, visceral abdominal fat can increase from 5 to 8 percent to 15 to 20 percent of total body fat, with an android distribution pattern that entails an increased cardiometabolic risk even in the absence of significant changes in body weight [33,34]. In the study sample, despite a mean BMI within the normal range (22.55 ± 2.19 kg/m²), mean fat mass was 18.09 ± 5.78 kg with wide individual variability, a pattern that confirms the need for assessment tools more sensitive than the weight index alone. The evaluation of visceral fat in perimenopausal women is therefore relevant, since its distribution is closely related to cardiometabolic risk and is not adequately captured by traditional anthropometric measures [8].
Over the intervention period we observed a significant and selective reduction in fat mass, with preservation and a slight increase of lean mass. This pattern of body recomposition, with fat mass falling and fat-free mass stable or rising, is the pattern expected with normoproteic anti-inflammatory diets [35]. Because the study has no control group, the observed changes cannot be attributed to the intervention, and the unfavourable trend typical of perimenopause to which we compare them is drawn from the literature rather than from a parallel arm. The direction of the change is nonetheless consistent with our previous work in patients with migraine on a ketogenic diet, in which a reduction in migraine burden was accompanied by a selective reduction in fat mass without loss of lean mass [36].
Comparison with the literature places the present findings in context. The relationship between body composition and migraine has been explored in a limited number of studies, most of them using BMI as an indirect measure of adiposity. Large population studies have documented a significantly higher risk of migraine chronification in obese subjects [37], but BMI does not distinguish fat mass from lean mass, which limits any mechanistic reading. Ojha and Malhotra showed, in 168 premenopausal women with migraine, that a high percentage of fat mass increases the risk of chronification by 2.8 times (95% CI 1.4–5.6, p=0.003) [38]. Razeghi Jahromi et al., in a cross-sectional study of 1,510 middle-aged women recruited at a weight-reduction clinic, found that higher fat-free mass was the only body composition parameter inversely and independently associated with the risk of migraine after multivariable adjustment [39]. That sample comprised overweight and obese women, whereas the present cohort is predominantly of normal weight (mean BMI 22.55 ± 2.19 kg/m²), so our observation extends the fat-free mass association to a normal-weight perimenopausal population. More recently, Jia et al. reported two complementary analyses: in a cross-sectional study of approximately 10,400 NHANES 1999 to 2004 participants, a higher appendicular lean mass to BMI ratio was independently associated with lower migraine prevalence after full adjustment (OR 0.243, 95% CI 0.122 to 0.487, p < 0.001). In a separate two-sample Mendelian randomization on GWAS data, a modest causal effect of muscle mass on migraine was suggested (OR 0.997, 95% CI 0.994 to 1.000, p = 0.045), with inflammatory markers mediating only 2 to 3 percent of the association [40]. The correlation between fat-free mass and MIDAS observed here at baseline (rho=−0.667, p=0.009) is consistent in direction with this body of evidence and adds the dimension of functional disability, as measured by MIDAS, to that of attack frequency. We note that the mediation estimate reported by Jia et al. argues against inflammation as the principal pathway, and our data do not address the question, since inflammatory markers were not measured.
The correlation between fat-free mass and disability is present at baseline, before any intervention: participants with greater lean mass showed lower migraine-related disability irrespective of subsequent treatment. The design is cross-sectional at that timepoint and the direction of the association cannot be established. Greater disability may plausibly reduce physical activity and, through it, lean mass, so reverse causation is as compatible with these data as the reading we propose. From a pathophysiological standpoint, excess fat mass, and visceral fat in particular, is associated with a chronic pro-inflammatory cytokine response characterized by elevated TNF-α, IL-1β, and IL-6, molecules that amplify trigeminovascular activation and lower the nociceptive threshold [41,42]. Higher lean mass is in turn associated with a more favourable inflammatory profile, better insulin sensitivity and greater mitochondrial capacity in muscle, factors that may collectively contribute to resilience to the pathogenic mechanisms of migraine [13]. A similar trend was observed for HEADWORK (rho = −0.513, p=0.061), which suggests that the occupational impact of headache may follow the same pattern, although this value did not reach the conventional threshold.
The negative correlation between extracellular water and MIDAS at baseline (rho = −0.601, p=0.023) requires cautious interpretation. Under physiological conditions extracellular volume is proportional to lean mass, since muscle tissues are its main water component. This correlation therefore probably reflects, at least in part, the same relationship observed between fat-free mass and MIDAS, rather than an independent effect of extracellular hydration. Mediation analyses on the full sample will be needed to separate the contributions of the two parameters. All correlations reported here are unadjusted bivariate analyses. Multivariable models adjusting for age, migraine chronicity, attack frequency, prophylactic treatment and STRAW stage are planned for the complete sample.
Longitudinally, the change in extracellular water correlated with the change in disability in the opposite direction to the baseline association (ΔECW versus ΔMIDAS, rho = +0.740, p = 0.009). One reading is that a reduction in extracellular water during an anti-inflammatory intervention reflects resolution of low-grade tissue oedema, a process distinct from the physiological proportionality with fat-free mass that dominates the cross-sectional picture. The correlation between change in phase angle and change in VAS (rho = +0.621, p = 0.042) would be consistent with that reading. We emphasize, however, that a variable correlating in opposite directions cross-sectionally and longitudinally in a sample of this size is also the pattern produced by sampling variability, and that no inflammatory marker was measured to support the mechanistic interpretation. Both correlations should therefore be regarded as hypotheses to be tested in the complete cohort.
Growing evidence indicates that probiotics and an anti-inflammatory diet may reduce migraine burden through modulation of the gut microbiota, restoration of the mucosal barrier and attenuation of inflammatory signalling mediated by the gut-brain axis [20,43]. The individual co-variation we observed between the degree of BIA change and the extent of clinical improvement in compatible with the hypothesis that body recomposition and migraine benefit share part of the same biological substrate, although the present study cannot distinguish this from two processes improving in parallel for independent reasons. Confirming a shared substrate would require measurement of the putative mediators, which this analysis did not include.
The present study has some relevant strengths. BIA measurements were performed by the same nutrition biologist under standardized conditions at each timepoint, which reduces inter-operator variability, and the use of BIVA referenced to the healthy Italian population adds methodological precision beyond the simple estimation of derived parameters. The population is homogeneous and well-characterized, since all patients are perimenopausal according to the STRAW classification, with ICHD-3 diagnosis and documented dysbiosis, and the longitudinal three-timepoint design allows baseline and dynamic correlations to be distinguished in a population sparsely explored in the literature. Several limitations must be acknowledged. The sample (n = 17 enrolled, n = 11 per cell at T3 and n = 13 per cell at T6 in paired analyses) is below the target of 54 participants and limits statistical power, precluding definitive conclusions. Given the exploratory nature of the analysis and the number of correlations examined, p-values are not corrected for multiplicity and individual associations may not survive replication. The study is observational and lacks a control group and separate arms so the independent effect of each component of the intervention cannot be estimated and unmeasured confounding cannot be excluded. Two confounders deserve to be named explicitly. Physical activity was not recorded, and it plausibly acts on lean mass, fat mass and migraine-related disability at the same time, so it may account for part of the associations reported here. Reverse causation is equally possible, since women with more disabling migraine may be less physically active and may lose lean mass as a consequence. Recording a measure of physical activity in the complete cohort would allow both to be addressed. Inflammatory markers were not measured, so the inflammatory pathway invoked throughout this discussion remains a hypothesis rather than an observation. The correlation between extracellular water and MIDAS at baseline, plausibly mediated by fat-free mass, requires verification by mediation analysis. Correlations between BIA changes and clinical changes were calculated only for the T0 to T3 interval, since the reduction in sample size at T6 does not ensure adequate power, and these analyses will be repeated on the complete sample. Gut microbiota data and longitudinal analyses of the clinical scales will be the subject of dedicated publications.
5. Conclusions
Perimenopausal women with greater lean mass exhibit significantly lower migraine-related disability already at baseline, before any intervention. This suggests that the worsening of migraine during the menopausal transition is not solely attributable to hormonal fluctuations, but is mediated—at least in part—by the deterioration of body composition: reduction of lean mass and accumulation of visceral fat, with the consequent increase in low-grade systemic inflammation. These data raise the hypothesis that interventions aimed at preserving lean mass and reducing fat mass may contribute to reducing migraine-related disability; this hypothesis warrants testing in adequately powered controlled trials.
The anti-inflammatory nutritional intervention with pre- and probiotics has been shown to effectively counter this tendency, with a significant and selective reduction in fat mass and preservation of lean mass. The correlations between BIA changes and clinical improvement indicate that body recomposition and migraine benefit share a common biological substrate: the reduction of systemic inflammation.
These exploratory findings, which require confirmation in the complete cohort (n=54) and in future controlled studies, support the investigation of body composition assessment as a potentially informative tool in the clinical evaluation of perimenopausal migraine.
Author Contributions
F.F.: Conceptualization, data curation, visualization, writing— original draft; S.P.: Investigation, data curation; A.P.: Investigation, data curation; A.T.: Investigation, data curation; E.L: Investigation, data curation; F.K.: Investigation, data curation; GL.G.: Conceptualization, supervision, resources, validation; G.M.: Conceptualization, supervision, resources, validation, writing—review and editing, formal analysis, statistical analysis; M.V.: Conceptualization, supervision, resources, validation, writing—review and editing, project administration. All authors have read and agreed to the published version of the manuscript.
Funding
This research received no external funding.
Institutional Review Board Statement
The study was conducted in accordance with the Declaration of Helsinki and was approved on 10 May 2023 by the Institutional Review Board of the Department of Medical Area, University of Udine (protocol code 79/2023, Tit. III cl. 13 fasc. 5/2023).
Informed Consent Statement
All patients involved in the study gave written informed consent for study participation.
Data Availability Statement
The data presented in this study are available on reasonable request from the corresponding author. The data are not publicly available due to privacy restrictions.:
Conflicts of Interest
The authors declare no conflicts of interest.
Abbreviations
The following abbreviations are used in this manuscript:
| BIA | Bioelectrical Impedance Analysis |
| BIVA | Bioelectrical Impedance Vector Analysis |
| BMI | Body Mass Index |
| CFU | Colony-Forming Units |
| ECW | Extracellular Water |
| EQ-5D | EuroQol-5Dimension |
| FFM | Fat Free Mass |
| FM | Fat Mass |
| FSS | Fatigue Severity Scale |
| GDPR | General Data Protection Regulation |
| GCP | Good Clinical Practice |
| HEADWORK | Headwork Questionnaire |
| HIT-6 | Headache Impact Test-6 |
| ICHD-3 | International Classification of Headache Disorders, 3rd edition |
| ICW | Intracellular Water |
| IL-1 β | Interleukin-1 beta |
| IL-6 | Interleukin-6 |
| IRB | Institutional Review Board |
| MEDEA | Modifications of the Microbiota and Migraine in Women in Perimenopause with an Anti-inflammatory Nutritional Regimen |
| MENO-D | Menopausal Depression Scale |
| MIDAS | Migraine Disability Assessment Score |
| NRS | Nutritional Risk Screening |
| PSQI | Pittsburgh Sleep Quality Index |
| R | Resistance |
| STRAW | Stages of Reproductive Aging Workshop |
| SWAN | Study of Women's Health Across the Nation |
| TNF -α | Tumor Necrosis Factor-alpha |
| VAS | Visual Analogue Scale |
| XC | Reactance |
References
- Dodick, D.W. Migraine. Lancet 2018, 391, 1315–1330. [Google Scholar] [CrossRef] [PubMed]
- Ibrahimi, K.; Couturier, E.G.M.; Maassenvandenbrink, A. Migraine and Perimenopause. Maturitas 2014, 78, 277–280. [Google Scholar] [CrossRef] [PubMed]
- Martin, V.T.; Pavlovic, J.; Fanning, K.M.; Buse, D.C.; Reed, M.L.; Lipton, R.B. Perimenopause and Menopause Are Associated with High Frequency Headache in Women with Migraine: Results of the American Migraine Prevalence and Prevention Study. Headache 2016, 56, 292–305. [Google Scholar] [CrossRef] [PubMed]
- Waliszewska-Prosół, M.; Grandi, G.; Ornello, R.; Raffaelli, B.; Straburzyński, M.; Tana, C.; Martelletti, P. Menopause, Perimenopause, and Migraine: Understanding the Intersections and Implications for Treatment. Neurol. Ther. 2025, 14, 665–680. [Google Scholar] [CrossRef] [PubMed]
- Korn, T.F.; Bernstein, C. Migraine across the Menopausal Transition and beyond: A Narrative Review. Headache 2026, 66, 1390–1404. [Google Scholar] [CrossRef] [PubMed]
- MacGregor, E.A. Menstrual and Perimenopausal Migraine: A Narrative Review. Maturitas 2020, 142, 24–30. [Google Scholar] [CrossRef] [PubMed]
- Greendale, G.A.; Sternfeld, B.; Huang, M.H.; Han, W.; Karvonen-Gutierrez, C.; Ruppert, K.; Cauley, J.A.; Finkelstein, J.S.; Jiang, S.F.; Karlamangla, A.S. Changes in Body Composition and Weight during the Menopause Transition. JCI Insight 2019, 4. [Google Scholar] [CrossRef] [PubMed]
- Marlatt, K.L.; Pitynski-Miller, D.R.; Gavin, K.M.; Moreau, K.L.; Melanson, E.L.; Santoro, N.; Kohrt, W.M. Body Composition and Cardiometabolic Health across the Menopause Transition. Obesity 2022, 30, 14–27. [Google Scholar] [CrossRef] [PubMed]
- Lizcano, F.; Guzmán, G. Estrogen Deficiency and the Origin of Obesity during Menopause. BioMed Res. Int. 2014, 2014, 757461. [Google Scholar] [CrossRef] [PubMed]
- Karaflou, M.; Goulis, D.G. Body Composition Analysis: A Snapshot across the Perimenopause. Maturitas 2024, 180, 107898. [Google Scholar] [CrossRef] [PubMed]
- Arzani, M.; Razeghi Jahromi, S.; Ghorbani, Z.; Vahabizad, F.; Martelletti, P.; Ghaemi, A.; Sacco, S.; Togha, M. Gut-Brain Axis and Migraine Headache: A Comprehensive Review. J. Headache Pain 2020, 21, 15. [Google Scholar] [CrossRef] [PubMed]
- Tang, Y.; Liu, S.; Shu, H.; Yanagisawa, L.; Tao, F. Gut Microbiota Dysbiosis Enhances Migraine-Like Pain Via TNFα Upregulation. Mol. Neurobiol. 2019, 57, 461–468. [Google Scholar] [CrossRef] [PubMed]
- Tuttle, C.S.L.; Thang, L.A.N.; Maier, A.B. Markers of Inflammation and Their Association with Muscle Strength and Mass: A Systematic Review and Meta-Analysis. Ageing Res. Rev. 2020, 64. [Google Scholar] [CrossRef] [PubMed]
- Socała, K.; Doboszewska, U.; Szopa, A.; Serefko, A.; Włodarczyk, M.; Zielińska, A.; Poleszak, E.; Fichna, J.; Wlaź, P. The Role of Microbiota-Gut-Brain Axis in Neuropsychiatric and Neurological Disorders. Pharmacol. Res. 2021, 172, 105840. [Google Scholar] [CrossRef] [PubMed]
- Crawford, J.; Liu, S.; Tao, F. Gut Microbiota and Migraine. Neurobiol. Pain 2022, 11, 100090. [Google Scholar] [CrossRef] [PubMed]
- Hagerty, S.L.; Hutchison, K.E.; Lowry, C.A.; Bryan, A.D. An Empirically Derived Method for Measuring Human Gut Microbiome Alpha Diversity: Demonstrated Utility in Predicting Health-Related Outcomes among a Human Clinical Sample. PLoS ONE 2020, 15, e0229204. [Google Scholar] [CrossRef] [PubMed]
- Chen, J.; Wang, Q.; Wang, A.; Lin, Z. Structural and Functional Characterization of the Gut Microbiota in Elderly Women With Migraine. Front. Cell. Infect. Microbiol. 2020, 9, 470. [Google Scholar] [CrossRef] [PubMed]
- Vieira, A.T.; Castelo, P.M.; Ribeiro, D.A.; Ferreira, C.M. Influence of Oral and Gut Microbiota in the Health of Menopausal Women. Front. Microbiol. 2017, 8, 1884. [Google Scholar] [CrossRef] [PubMed]
- Georgescu, D.; Iurciuc, M.S.; Ionita, I.; Dragan, S.; Muntean, M.; Ancusa, O.E.; Reisz, D.; Ionita, M.; Lighezan, D. Migraine without Aura and Subclinical Atherosclerosis in Young Females: Is Gut Microbiota to Blame? Medicina 2019, 55, 786. [Google Scholar] [CrossRef] [PubMed]
- Kozák, M.; Sitku, T.; Hodossy-Takács, R.; Sápi, F.; Várkonyi, I.; Barta, Z. Migraine and the Gut–Brain Axis—The Role of Microbiome-Targeted Biotics. Nutrients 2026, 18, 720. [Google Scholar] [CrossRef] [PubMed]
- D’Amico, D.; Mosconi, P.; Genco, S.; Usai, S.; Prudenzano, A.M.P.; Grazzi, L.; Leone, M.; Puca, F.M.; Bussone, G. The Migraine Disability Assessment (MIDAS) Questionnaire: Translation and Reliability of the Italian Version. Cephalalgia 2001, 21, 947–952. [Google Scholar] [CrossRef] [PubMed]
- Houston, M.N.; Bookbinder, H.A.; Roach, S.P.; Ross, J.D.; Aderman, M.J.; Peck, K.Y.; Malvasi, S.R.; Svoboda, S.J.; Cameron, K.L. Reference Values for the Headache Impact Test-6 Questionnaire. Arch. Phys. Med. Rehabil. 2021, 102, 2369–2376. [Google Scholar] [CrossRef] [PubMed]
- Raggi, A.; Covelli, V.; Guastafierro, E.; Leonardi, M.; Scaratti, C.; Grazzi, L.; Bartolini, M.; Viticchi, G.; Cevoli, S.; Pierangeli, G.; et al. Validation of a Self-Reported Instrument to Assess Work-Related Difficulties in Patients with Migraine: The HEADWORK Questionnaire. J. Headache Pain 2018, 19. [Google Scholar] [CrossRef] [PubMed]
- Balestroni, G.; Bertolotti, G. [EuroQol-5D (EQ-5D): An Instrument for Measuring Quality of Life]. Monaldi Arch. Chest Dis. 2012, 78, 155–159. [Google Scholar] [CrossRef] [PubMed]
- Estruch, R.; Ros, E.; Salas-Salvadó, J.; Covas, M.-I.; Corella, D.; Arós, F.; Gómez-Gracia, E.; Ruiz-Gutiérrez, V.; Fiol, M.; Lapetra, J.; et al. Primary Prevention of Cardiovascular Disease with a Mediterranean Diet Supplemented with Extra-Virgin Olive Oil or Nuts. N. Engl. J. Med. 2018, 378. [Google Scholar] [CrossRef] [PubMed]
- SINU LARN - Livelli Di Assunzione Di Riferimento Di Nutrienti Ed Energia per La Popolazione Italiana. Documento di sintesi per il XXXV Congresso Nazionale SINU; 2012.
- Marra, M.; Sammarco, R.; De Lorenzo, A.; Iellamo, F.; Siervo, M.; Pietrobelli, A.; Donini, L.M.; Santarpia, L.; Cataldi, M.; Pasanisi, F.; et al. Assessment of Body Composition in Health and Disease Using Bioelectrical Impedance Analysis (BIA) and Dual Energy X-Ray Absorptiometry (DXA): A Critical Overview. Contrast Media Mol. Imaging 2019, 2019, 3548284. [Google Scholar] [CrossRef] [PubMed]
- Ward, L.C.; Brantlov, S. Bioimpedance Basics and Phase Angle Fundamentals. Rev. Endocr. Metab. Disord. 2023, 24, 381–391. [Google Scholar] [CrossRef] [PubMed]
- Cvijetić, S.; Boschiero, D.; Shin, H.; Reilly, A.S.; Noorani, S.T.; Vasiljevic, N.; Ilich, J.Z. Extracellular Water and Phase Angle, Markers of Heightened Inflammatory State, and Their Extrapolative Potential for Body Composition Outcomes in Adults. Metabolites 2026, 16, 40. [Google Scholar] [CrossRef] [PubMed]
- Piccoli, A.; Rossi, B.; Pillon, L.; Bucciante, G. A New Method for Monitoring Body Fluid Variation by Bioimpedance Analysis: The RXc Graph. Kidney Int. 1994, 46, 534–539. [Google Scholar] [CrossRef] [PubMed]
- Nwosu, A.C.; Mayland, C.R.; Mason, S.; Cox, T.F.; Varro, A.; Stanley, S.; Ellershaw, J. Bioelectrical Impedance Vector Analysis (BIVA) as a Method to Compare Body Composition Differences According to Cancer Stage and Type. Clin. Nutr. ESPEN 2019, 30, 59–66. [Google Scholar] [CrossRef] [PubMed]
- Horvath, A.; Haller, R.; Schmid-Zalaudek, K.; Goswami, N.; Wagner-Skacel, J.; Habisch, H.; Madl, T.; Stadlbauer, V. The Beneficial Effect of a Multispecies Probiotic Intervention on Quality of Sleep - a Randomized, Double-Blinded, Placebo-Controlled Study. J. Psychiatr. Res. 2026, 195, 244–256. [Google Scholar] [CrossRef] [PubMed]
- Kodoth, V.; Scaccia, S.; Aggarwal, B. Adverse Changes in Body Composition During the Menopausal Transition and Relation to Cardiovascular Risk: A Contemporary Review. Womens Health Rep. (New Rochelle) 2022, 3, 573–581. [Google Scholar] [CrossRef] [PubMed]
- Davis, S.R.; Castelo-Branco, C.; Chedraui, P.; Lumsden, M.A.; Nappi, R.E.; Shah, D.; Villaseca, P. Understanding Weight Gain at Menopause. Climacteric 2012, 15, 419–429. [Google Scholar] [CrossRef] [PubMed]
- Forsythe, L.K.; Wallace, J.M.W.; Livingstone, M.B.E. Obesity and Inflammation: The Effects of Weight Loss. Nutr. Res. Rev. 2008, 21, 117–133. [Google Scholar] [CrossRef] [PubMed]
- Valente, M.; Garbo, R.; Filippi, F.; Antonutti, A.; Ceccarini, V.; Tereshko, Y.; Di Lorenzo, C.; Gigli, G.L. Migraine Prevention through Ketogenic Diet: More than Body Mass Composition Changes. J. Clin. Med. 2022, 11. [Google Scholar] [CrossRef] [PubMed]
- Bigal, M.E.; Liberman, J.N.; Lipton, R.B. Obesity and Migraine: A Population Study. Neurology 2006, 66, 545–550. [Google Scholar] [CrossRef] [PubMed]
- Ojha, P.; Malhotra, V. Implication of High Body Fat Percentage on Migraine Chronification in Premenopausal Females. Neurol. Res. Int. 2022, 2022, 8219254. [Google Scholar] [CrossRef] [PubMed]
- Jahromi, S.R.; Abolhasani, M.; Meysamie, A.; Togha, M. The Effect of Body Fat Mass and Fat Free Mass on Migraine Headache. Iran. J. Neurol. 2013, 12, 23–27. [Google Scholar] [PubMed]
- Jia, C.; Li, H.; Yang, S.; Liu, Y.; Liu, L.; Ma, A.; Zhang, L. Inflammation Factors Mediate Association of Muscle Mass and Migraine: NHANES 1999–2004 and Mendelian Randomization. J. Pain Res. 2025, 18, 2269–2283. [Google Scholar] [CrossRef] [PubMed]
- Sudershan, A.; Sudershan, S.; Sharma, I.; Kumar, H.; Panjaliya, R.K.; Kumar, P. Role of TNF-α in the Pathogenesis of Migraine. Pain Res. Manag. 2024, 2024, 1377143. [Google Scholar] [CrossRef] [PubMed]
- Song, Y.; Zhao, S.; Peng, P.; Zhang, C.; Liu, Y.; Chen, Y.; Luo, Y.; Li, B.; Liu, L. Neuron-Glia Crosstalk and Inflammatory Mediators in Migraine Pathophysiology. Neuroscience 2024, 560, 381–396. [Google Scholar] [CrossRef] [PubMed]
- Biagioli, V.; Mela, F.; Ferraro, P.; Villano, G.; Orsini, A.; Diana, M.C.; Striano, P.; Santangelo, A. The Interplay Between Gut Microbiota, Adipose Tissue, and Migraine: A Narrative Review. Nutrients 2025, 17, 337. [Google Scholar] [CrossRef] [PubMed]
Figure 1.
Study flow diagram.
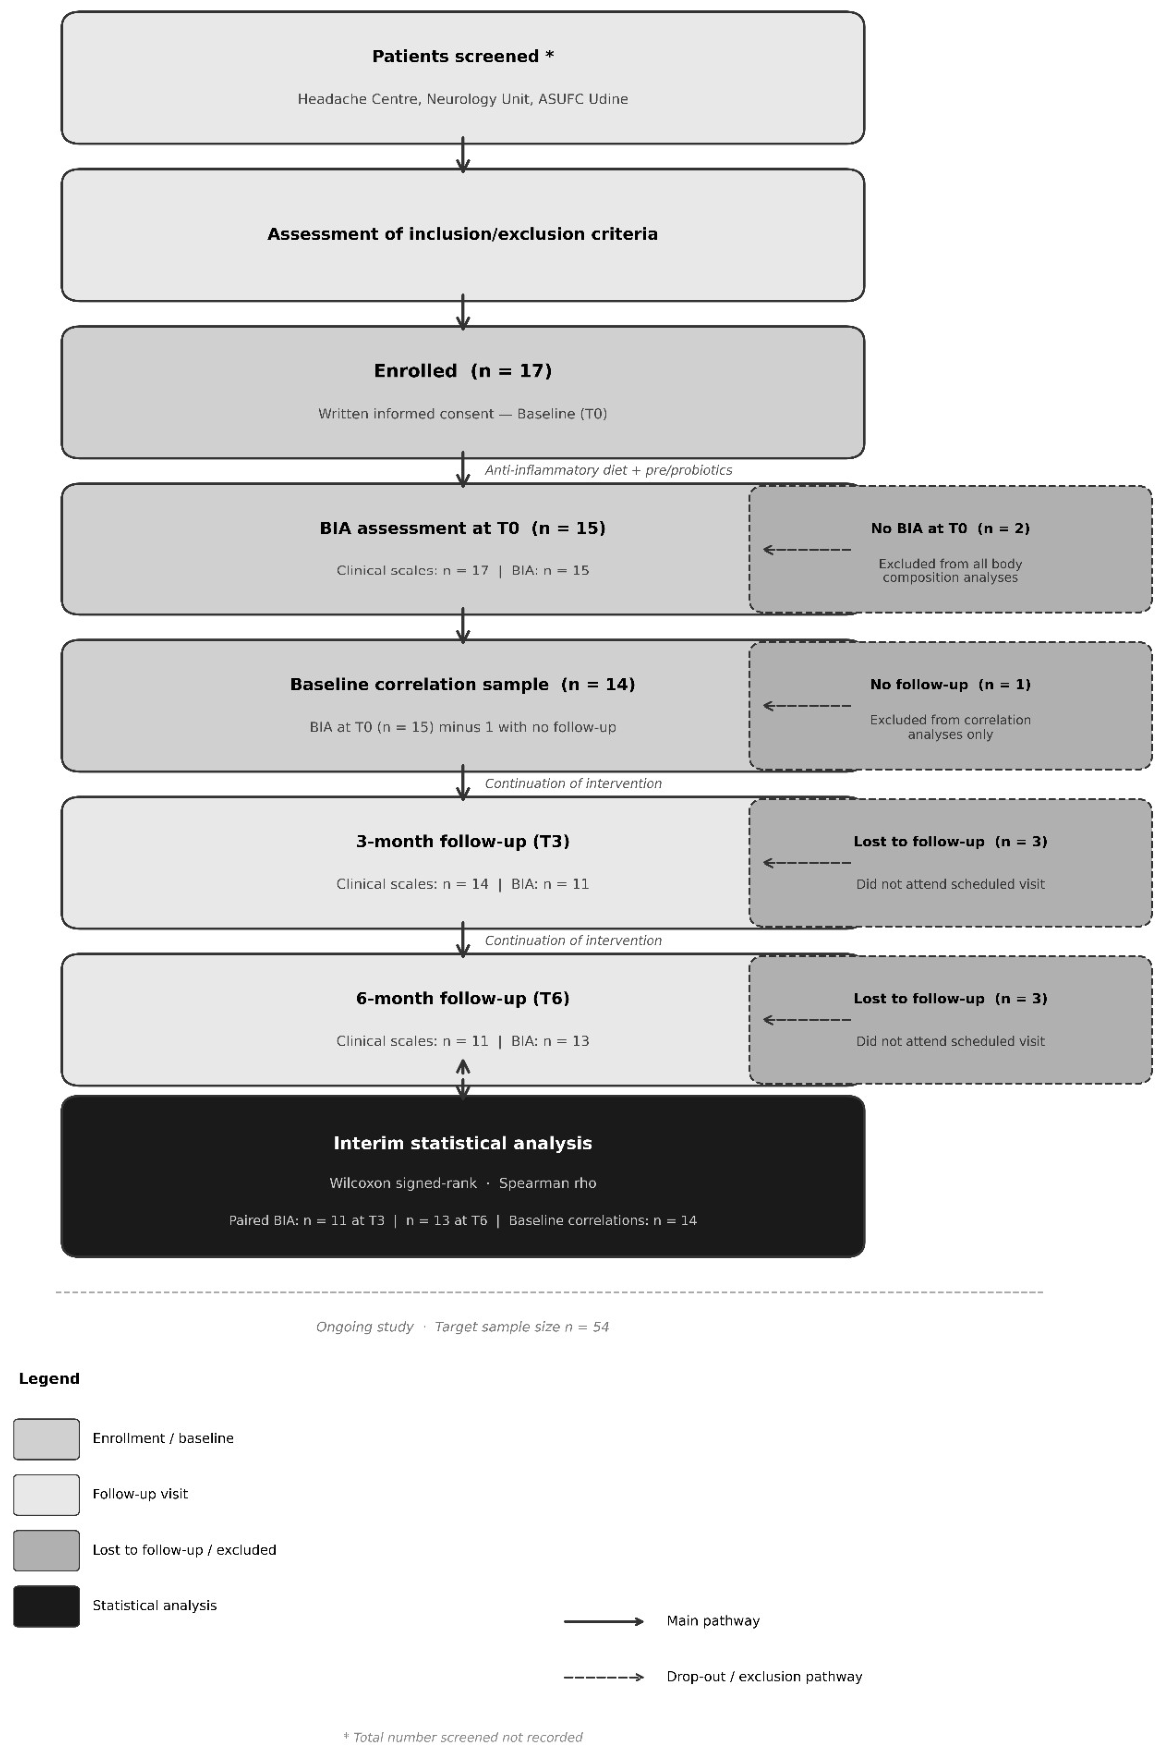
Figure 2.
Changes in body composition over time: (A) Fat Mass (FM, kg) and (B) Fat-Free Mass (FFM, kg) at baseline (T0), 3 months (T3), and 6 months (T6). Data are presented as mean ± SD for all participants with BIA data at each timepoint (n = 15 at T0, n = 11 at T3, n = 13 at T6). Statistical comparisons (p-values) refer to Wilcoxon signed-rank tests on complete pairs only (n = 11 paired at T3; n = 13 paired at T6); see Table 3 for paired subset details. **: p < 0.01; ***: p < 0.001; ns: not significant.
Figure 2.
Changes in body composition over time: (A) Fat Mass (FM, kg) and (B) Fat-Free Mass (FFM, kg) at baseline (T0), 3 months (T3), and 6 months (T6). Data are presented as mean ± SD for all participants with BIA data at each timepoint (n = 15 at T0, n = 11 at T3, n = 13 at T6). Statistical comparisons (p-values) refer to Wilcoxon signed-rank tests on complete pairs only (n = 11 paired at T3; n = 13 paired at T6); see Table 3 for paired subset details. **: p < 0.01; ***: p < 0.001; ns: not significant.
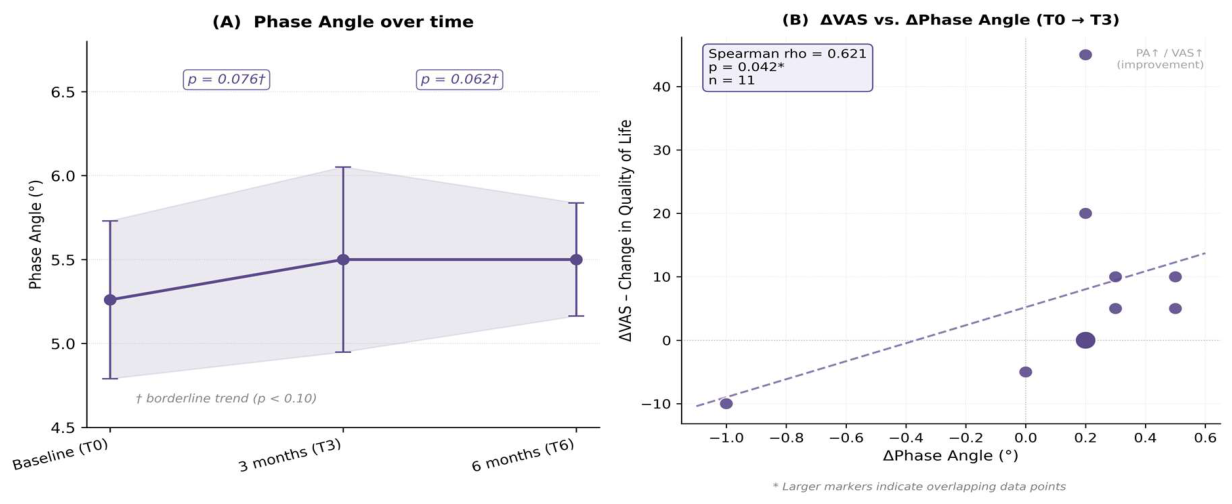
Figure 3.
(A) Phase Angle (°) at baseline (T0), 3 months (T3), and 6 months (T6). Data are presented as mean ± SD for all participants with BIA data at each timepoint (n = 15 at T0, n = 11 at T3, n = 13 at T6). Statistical comparisons refer to Wilcoxon signed-rank tests on complete pairs (n = 11 at T3; n = 13 at T6). †: borderline trend (p < 0.10). (B) Spearman correlation between change in Phase Angle (ΔPhase Angle, °) and change in health-related quality of life (ΔVAS) over the T0→T3 interval. rho = +0.621, p = 0.042*, n = 11. Larger markers indicate overlapping data points. Patients with greater improvement in cellular integrity show a corresponding improvement in perceived quality of life.
Figure 3.
(A) Phase Angle (°) at baseline (T0), 3 months (T3), and 6 months (T6). Data are presented as mean ± SD for all participants with BIA data at each timepoint (n = 15 at T0, n = 11 at T3, n = 13 at T6). Statistical comparisons refer to Wilcoxon signed-rank tests on complete pairs (n = 11 at T3; n = 13 at T6). †: borderline trend (p < 0.10). (B) Spearman correlation between change in Phase Angle (ΔPhase Angle, °) and change in health-related quality of life (ΔVAS) over the T0→T3 interval. rho = +0.621, p = 0.042*, n = 11. Larger markers indicate overlapping data points. Patients with greater improvement in cellular integrity show a corresponding improvement in perceived quality of life.
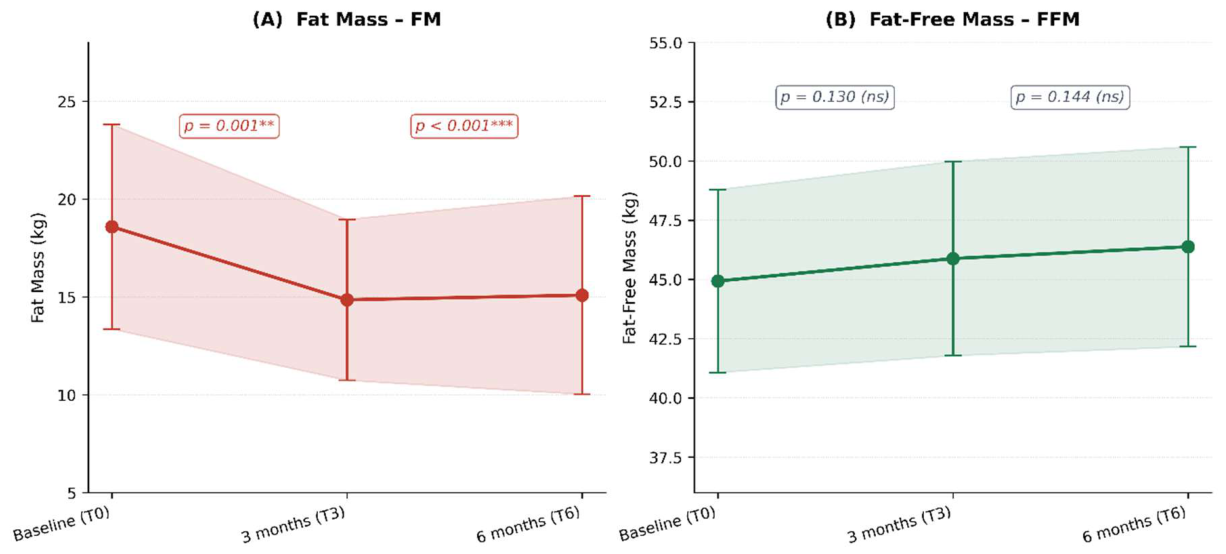
Figure 4.
Spearman correlation between Fat-Free Mass (FFM, kg) and MIDAS score at baseline (T0). rho = −0.667, p = 0.009**, n = 14 (participants with BIA data at T0 and at least one follow-up visit; three participants had no follow-up visits and were excluded, of whom two also lacked BIA data). The dashed line represents the linear regression line. Patients with higher fat-free mass show significantly lower migraine-related disability at baseline, independently of the nutritional intervention.
Figure 4.
Spearman correlation between Fat-Free Mass (FFM, kg) and MIDAS score at baseline (T0). rho = −0.667, p = 0.009**, n = 14 (participants with BIA data at T0 and at least one follow-up visit; three participants had no follow-up visits and were excluded, of whom two also lacked BIA data). The dashed line represents the linear regression line. Patients with higher fat-free mass show significantly lower migraine-related disability at baseline, independently of the nutritional intervention.
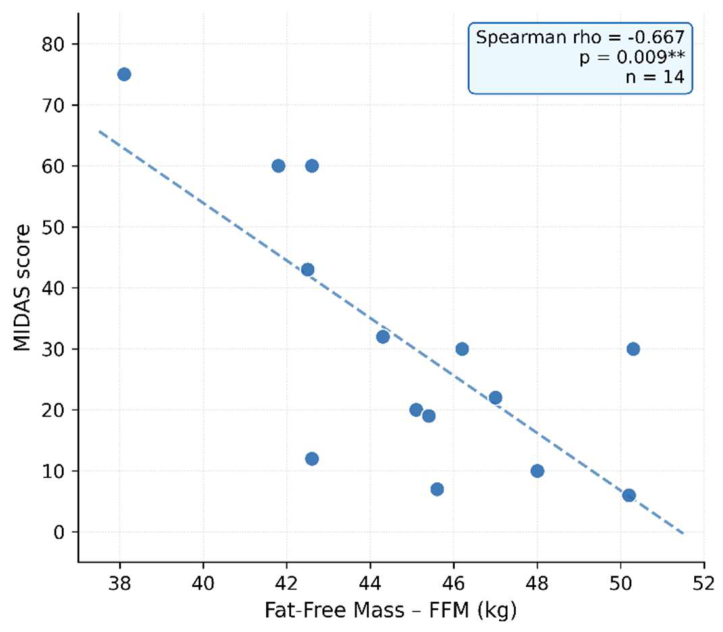
Figure 5.
Spearman correlation between change in Extracellular Water (ΔECW, L) and change in MIDAS score (ΔMIDAS) over the T0→T3 interval. rho = +0.740, p = 0.009**, n = 11. The dashed line represents the linear regression line. Dotted lines indicate the zero axes. Patients with greater reduction in extracellular water show greater improvement in migraine-related disability.
Figure 5.
Spearman correlation between change in Extracellular Water (ΔECW, L) and change in MIDAS score (ΔMIDAS) over the T0→T3 interval. rho = +0.740, p = 0.009**, n = 11. The dashed line represents the linear regression line. Dotted lines indicate the zero axes. Patients with greater reduction in extracellular water show greater improvement in migraine-related disability.
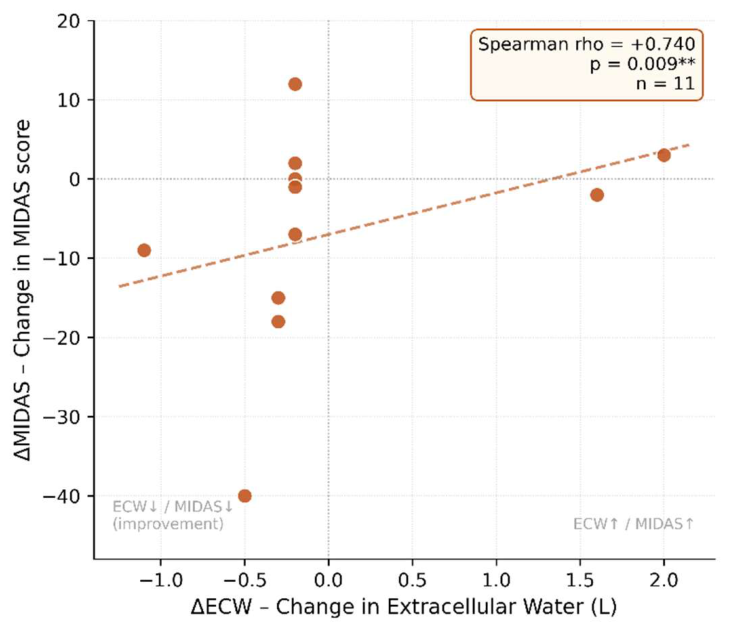

Table 1.
Baseline demographic, clinical, and body composition characteristics of the study sample (n = 17 enrolled; n = 15 for BIA parameters). MIDAS: Migraine Disability Assessment Score; HEADWORK: headache impact on work; HIT-6: Headache Impact Test-6; VAS: Visual Analogue Scale quality of life; PSQI: Pittsburgh Sleep Quality Index; MENO-D: Menopausal Depression Scale; FSS: Fatigue Severity Scale; EQ-5D: EuroQol-5 Dimension. Clinical scale values are reported for descriptive purposes only.
Table 1.
Baseline demographic, clinical, and body composition characteristics of the study sample (n = 17 enrolled; n = 15 for BIA parameters). MIDAS: Migraine Disability Assessment Score; HEADWORK: headache impact on work; HIT-6: Headache Impact Test-6; VAS: Visual Analogue Scale quality of life; PSQI: Pittsburgh Sleep Quality Index; MENO-D: Menopausal Depression Scale; FSS: Fatigue Severity Scale; EQ-5D: EuroQol-5 Dimension. Clinical scale values are reported for descriptive purposes only.
| Characteristic | n | Mean ± SD | Range |
|---|---|---|---|
| Demographic and clinical data | |||
| Age (years) | 17 | 52.0 ± 2.6 | 46–56 |
| BMI (kg/m²) | 17 | 22.87 ± 2.05 | 18.6–26.2 |
| Migraine attacks/month | 161 | 7.6 ± 4.1 | 4–20 |
| BIA parameters (Baseline T0) | |||
| FM – Fat Mass (kg) | 152 | 18.09 ± 5.78 | 6.9–28.1 |
| FFM – Fat-Free Mass (kg) | 15 | 45.21 ± 3.35 | 38.1–50.3 |
| Phase Angle (°) | 15 | 5.26 ± 0.47 | 4.5–6.6 |
| ECW – Extracellular Water (L) | 15 | 16.49 ± 1.41 | 14.1–18.8 |
| ICW – Intracellular Water (L) | 15 | 16.87 ± 1.52 | 13.8–19.2 |
| Clinical scales (Baseline T0) — descriptive values | |||
| MIDAS (0–270, ↑ = greater disability) | 173 | 30 [19–60] † | 6–75 |
| HEADWORK (0–100, ↑ = greater impact) | 17 | 25.2 ± 12.6 | 7–46 |
| HIT-6 (36–78, ↑ = greater impact) | 17 | 62.7 ± 4.5 | 56–73 |
| VAS quality of life (0–100, ↑ = better) | 17 | 61.5 ± 20.1 | 30–100 |
| PSQI (0–21, ↑ = worse sleep quality) | 17 | 9.5 ± 3.9 | 2–14 |
| MENO-D (0–36, ↑ = worse mood) | 17 | 13.1 ± 6.9 | 4–25 |
| FSS (1–7, ↑ = greater fatigue) | 17 | 3.75 ± 1.96 | 1–7 |
| EQ-5D (number of dimensions with reported problems, 0–5, ↑ = worse) | 17 | 1.71 ± 1.31 | 0–4 |
1 Migraine attacks/month is the mean number of discrete attacks per month, derived from the headache diary over the 3 months preceding baseline. Eligibility required ≥ 6 migraine days/month, which may be met with fewer attacks of longer duration. Data not available for one participant (n = 16). 2 BIA parameters are available for n = 15 participants; two enrolled participants did not undergo BIA assessment at T0 and were excluded from all body composition analyses. 3 Clinical scale values at baseline are reported for the full enrolled sample (n = 17) and are presented for descriptive purposes only. Correlation analyses (Table 4) were restricted to the longitudinal analytical sample (n = 14; see Methods). † MIDAS is presented as median [IQR] due to non-normal distribution (mean ± SD = 34.4 ± 23.8).
Table 2.
Inclusion and exclusion criteria.
| Domain | Inclusion Criteria | Exclusion criteria |
|---|---|---|
| Migraine diagnosis | Episodic migraine: < 15 headache days/month with ≥ 6 migraine days/month; OR chronic migraine: ≥ 15 headache days/month, of which ≥ 8 with migrainous features for ≥ 3 months (ICHD-31 criteria). | Tension-type headache, cluster headache, hemiplegic migraine, continuous chronic migraine (no pain-free periods), or other non-migrainous headache disorders. |
| Gastrointestinal symptoms | ≥ 1 of the following, persistent and consistent with intestinal dysbiosis: abdominal pain, abdominal bloating, nausea, bowel habit alterations — for which anti-inflammatory nutrition + pre/probiotics already initiated as routine clinical practice | Chronic inflammatory bowel disease (Crohn's disease, ulcerative colitis) |
| Reproductive stage | Perimenopausal status (STRAW2 classification) | — |
| Anthropometric parameters | BMI 18–30 kg/m2 Nutritional Risk Screening (NRS3) < 3 |
— |
| Organ function | — | Moderate-to-severe hepatic impairment |
| Moderate-to-severe renal impairment |
1 ICHD-3: International Classification of Headache Disorders, 3rd edition; 2 STRAW: Stages of Reproductive Aging Workshop; 3 NRS: Nutritional Risk Screening.
Table 3.
Body composition at baseline (T0) and paired within-subject changes at 3 months (T3) and 6 months (T6): baseline means with standard deviations, median change with interquartile range, and p-values (Wilcoxon signed-rank test vs. baseline).
Table 3.
Body composition at baseline (T0) and paired within-subject changes at 3 months (T3) and 6 months (T6): baseline means with standard deviations, median change with interquartile range, and p-values (Wilcoxon signed-rank test vs. baseline).
| Variable | Baseline T0 (full BIA sample, n=15) |
3-month follow-up (T3) | 6-month follow-up (T6) | |||||||
|---|---|---|---|---|---|---|---|---|---|---|
| Variable | Mean ± SD | n |
T0 mean ± SD (paired subset) |
n | Median Δ [IQR] | p |
T0 mean ± SD (paired subset) |
n | Median Δ [IQR] | p |
| FM – Fat Mass (kg) | 18.09 ± 5.78 | 15 | 17.25 ± 5.95 | 11 | −1.60 [−2.15; −1.40] | 0.001 ** | 18.59 ± 5.81 | 13 | −3.00 [−3.80; −2.10] | <0.001 *** |
| FFM – Fat-Free Mass (kg) | 45.21 ± 3.35 | 15 | 44.85 ± 3.29 | 11 | +0.30 [0.30; 0.35] | 0.130 | 44.93 ± 3.49 | 13 | +0.60 [0.60; 2.90] | 0.144 |
| BMI (kg/m²) | 22.55 ± 2.19 | 15 | 22.27 ± 2.38 | 11 | −0.50 [−1.00; −0.40] | 0.042* | 22.68 ± 2.30 | 13 | −1.00 [−1.20; −0.70] | 0.089† |
| Phase Angle (°) | 5.26 ± 0.47 | 15 | 5.35 ± 0.47 | 11 | +0.20 [0.20; 0.30] | 0.076 † | 5.30 ± 0.49 | 13 | +0.40 [0.10; 0.50] | 0.062 † |
| ECW – Extracellular Water (L) | 16.49 ± 1.41 | 15 | 16.20 ± 1.34 | 11 | −0.20 [−0.30; −0.20] | 0.308 | 16.32 ± 1.43 | 13 | −0.40 [−0.50; 0.40] | 0.622 |
| ICW – Intracellular Water (L) | 16.87 ± 1.52 | 15 | 16.94 ± 1.51 | 11 | +0.40 [0.40; 0.50] | 0.231 | 16.84 ± 1.62 | 13 | +0.70 [0.50; 1.00] | 0.082 † |
†: p < 0.10 (borderline trend); *: p < 0.05; **: p < 0.01; ***: p < 0.001. Wilcoxon signed-rank test vs. baseline (paired). The 'Baseline T0 (full sample)' reports descriptive statistics for n = 15 participants with BIA data at T0. The 'T0 mean ± SD (paired subset)' reports baseline values restricted to participants with data at the respective follow-up timepoint. Median Δ [IQR] is the statistic consistent with the Wilcoxon signed-rank test. FM concordance: all 11/11 pairs reduced FM at T3; 12/13 pairs at T6 — explaining the stronger p despite similar n. FM: fat mass; FFM: fat-free mass; ECW: extracellular water; ICW: intracellular water.
Table 4.
Spearman correlation coefficients (rho) between BIA parameters and migraine disability scales at baseline (T0).
Table 4.
Spearman correlation coefficients (rho) between BIA parameters and migraine disability scales at baseline (T0).
| Scale | BMI | FM | FFM | Phase Angle | ECW | ICW | n |
|---|---|---|---|---|---|---|---|
| MIDAS | +0.01 | −0.25 | −0.67** | +0.04 | −0.60* | −0.31 | 14 |
| HEADWORK | −0.07 | −0.16 | −0.51† | +0.13 | −0.51† | −0.32 | 14 |
| HIT-6 | −0.39 | −0.27 | +0.05 | −0.12 | +0.09 | −0.16 | 14 |
| VAS | −0.18 | +0.04 | +0.03 | +0.18 | −0.04 | +0.11 | 14 |
†: p < 0.10 (borderline trend); *: p < 0.05; **: p < 0.01. Spearman's rho. n = 14 per row for all columns. The six BIA parameters derive from a single impedance acquisition, so n is constant across all BIA columns within each row and varies only between rows according to scale availability. Shaded cells indicate significant or borderline correlations. BMI: body mass index; FM: fat mass; FFM: fat-free mass; ECW: extracellular water; ICW: intracellular water.
Table 5.
Spearman correlation coefficients (rho) between changes in BIA parameters and changes in clinical outcome measures over the T0→T3 interval.
Table 5.
Spearman correlation coefficients (rho) between changes in BIA parameters and changes in clinical outcome measures over the T0→T3 interval.
| Scale | ΔBMI | ΔFM | ΔFFM | ΔPhase Angle | ΔECW | ΔICW | n |
|---|---|---|---|---|---|---|---|
| ΔMIDAS | +0.61* | +0.59† | −0.02 | +0.44 | +0.74** | +0.14 | 11 |
| ΔHEADWORK | −0.41 | −0.31 | −0.48 | +0.07 | −0.42 | −0.38 | 11 |
| ΔVAS | +0.27 | +0.39 | −0.18 | +0.62* | −0.23 | +0.33 | 11 |
†: p < 0.10 (borderline trend); *: p < 0.05; **: p < 0.01. Spearman’s rho. For MIDAS and HEADWORK, a positive Δ indicates worsening; for VAS, a positive Δ indicates improvement. Highlighted rows indicate significant or borderline correlations. n = 11 per cell.
Disclaimer/Publisher’s Note: The statements, opinions and data contained in all publications are solely those of the individual author(s) and contributor(s) and not of MDPI and/or the editor(s). MDPI and/or the editor(s) disclaim responsibility for any injury to people or property resulting from any ideas, methods, instructions or products referred to in the content. |
© 2026 by the authors. Licensee MDPI, Basel, Switzerland. This article is an open access article distributed under the terms and conditions of the Creative Commons Attribution (CC BY) license (http://creativecommons.org/licenses/by/4.0/).
Copyright: This open access article is published under a Creative Commons CC BY 4.0 license, which permit the free download, distribution, and reuse, provided that the author and preprint are cited in any reuse.