

Submitted:
15 September 2026
Posted:
16 September 2026
You are already at the latest version
Abstract
EraGene is a platform that compiles experimentally validated engineering targets and production data from engineered Escherichia coli strains for metabolite overproduction. By integrating published metabolic engineering studies, it includes recurrently modified reactions, enabling identification of successful engineering strategies for biochemically related metabolites. We demonstrate its utility through two applications: identifying conserved engineering targets for pathway reinforcement and improving constraint-based metabolic model predictions using experimentally validated modifications. Leave-one-out analysis showed that 75.52% of a metabolite’s engineered reactions were, on average, already annotated for other metabolites, indicating substantial conservation of central metabolism and opportunities for knowledge transfer. Incorporating reactions with conserved modulation direction into QPAML simulations reduced the average search space from 180.21 to 43.51 candidate reactions per metabolite while recovering 81.88% of experimentally validated modifications in the prediction set, corresponding to a 3.41-fold enrichment. At publication, EraGene contained 3,833 production measurements from 2,611 strains across 360 studies, comprising 342 native reactions involving 921 genes. The analytical dataset included 300 native reactions associated with 88 metabolites producible from glucose as the sole carbon source. EraGene is publicly available at https://eragene.com for visualization and data download.
Keywords:
rational strain design
; genetic modifications
; metabolism
; metabolites
; biomanufacturing
; flux balance analysis
; metabolic engineering
1. Introduction
Microbial biosynthesis of metabolites has received increasing attention because of its advantages over chemical production, including reduced toxicity, cost-effectiveness, environmental sustainability, and scalability in fermenters, which lower land and water requirements. Although microorganisms naturally produce a variety of compounds, their production levels often fall short of industrial demands. To address this, metabolic engineering and synthetic biology are crucial for optimizing strain performance [1]. However, identifying the key genes and reactions that improve metabolite production is a complex challenge, which has driven the development of numerous algorithms [2,3,4,5,6,7,8,9,10].
The minimal set of reactions that constitutes the optimal pathway for the production of a target compound can be identified using CoBRA (constraint-based reconstruction and analysis) methods [11]; however, as experimental observations have shown, only a subset of these reactions exerts significant control over metabolite overproduction [12] . Integrating experimental data can improve the prediction of such reactions. One representative approach combines short-term metabolic perturbation experiments, flux balance analysis (FBA), thermodynamic network evaluation, and Metabolic Control Analysis (MCA) to identify key metabolic reactions that strongly control metabolic fluxes [13]. These integrated analyses are time-consuming, costly, and highly complex. Consequently, researchers have developed several strategies to identify key reactions and genes that enhance metabolite production [2,14,15,16,17,18,19,20], gradually building a collective understanding of the critical metabolic steps that contribute to improved yields across different metabolic pathways in Escherichia coli.
Dividing metabolic networks into functional modules reduces complexity and helps identify key reactions, an approach shown to enhance the production of a wide range of metabolites [14,19,21,22,23,24]. The repeated presence of certain key metabolic reactions across these modules raises an important question: are there key metabolic reactions in Escherichia coli that can be systematically reused to design strains overproducing different metabolites? Identifying such reactions could improve the predictive power of CoBRA methods by reducing the number of candidate genes predicted to influence metabolite production, thereby decreasing the experimental validation required.
This study introduces a comprehensive database of genetically engineered Escherichia coli strains developed for overproducing high-value metabolites. E. coli was selected as the study organism because of its status as a canonical model system with extensive research resources, including well-curated databases [25,26,27] , as well as a substantial body of literature in metabolic engineering.
Although KEGG [27], BioCyc [28], BRENDA [29], and RegulonDB [26] provide extensive information on metabolic reactions, enzyme characteristics, and regulatory networks in Escherichia coli, they do not identify which genetic modifications effectively increase the production of specific metabolites. Engineering metabolic systems based on reaction kinetics or pathway architecture is constrained by the robust and tightly regulated nature of cellular networks. Incomplete knowledge of regulatory mechanisms, together with cross-regulation, multifunctional enzymes, and pathway crosstalk, frequently introduces unforeseen effects that undermine rational design and limit predictive success [30]. Researchers have developed structured annotations of experimentally validated metabolic engineering designs to organize knowledge of metabolite overproduction strategies [31]. Here, we extend their utility by applying this information to improve CoBRA model predictive performance.
A systematic analysis of the compiled data identifies metabolic reactions that function as potential transferable engineering targets, enabling the rational extension of validated strategies from well-characterized metabolites to their biochemical derivatives. Traditional strain design often treats target molecules in isolation, leading to redundant, de novo optimization of shared precursor pathways. EraGene addresses this inefficiency by mapping recurrent genetic modifications across the metabolic network, allowing researchers to bypass the redundant engineering of established biosynthetic hubs and focus efforts exclusively on pathway-specific terminal steps. Furthermore, integrating experimentally validated modifications with the Qualitative Perturbation Analysis and Machine Learning (QPAML) algorithm reduces the prediction search space 4-fold while recovering 81.88% of the experimentally confirmed targets present among the model predictions, thereby improving both the accuracy and efficiency of model-driven design.
2. Results
2.1. Database Statistics
We manually reviewed 360 scientific publications to extract information on 2,611 engineered Escherichia coli strains, 1,123 plasmids, and 921 genes associated with overproduction of 101 target and 35 non-target metabolites. Of these, 88 target metabolites were produced using glucose as the sole carbon source and were selected for subsequent analyses. In total, 485 reactions were modified across the engineered strains for metabolite overproduction. Of these, 342 were native to E. coli, whereas the remaining reactions were heterologous.
Figure 1 summarizes the distribution of engineered reactions across 88 metabolites produced from glucose as the sole carbon source. Of the annotated reactions, 139 are involved in the production of a single metabolite, whereas 161 participate in at least two. Notably, the 139 reaction modifications associated with a single metabolite account for 15.27% of the total modifications identified across metabolites.
Transport reactions constitute 25.18% (35 reactions) of metabolite-specific modifications, mediating uptake and secretion. The remaining modifications predominantly target terminal biosynthetic steps.
2.2. Rarefaction Dynamics of Engineered Reactions
The rarefaction analysis (Figure 2) showed a gradual increase in the number of unique engineered reactions as more metabolites were incorporated, although the curve did not reach a clear plateau. The decreasing rate of reaction discovery indicates substantial sharing of engineered reactions across metabolites, reflecting that many reactions already present in the database also contribute to unannotated metabolites. This pattern suggests the database captures a broadly representative core set of production-modulating reactions, even though it is not fully saturated. Good–Turing estimation of the reaction discovery curve suggests that the E. coli reaction space saturates at approximately 354 reactions (95% CI: 342.7 to 368.6), compared to the 300 reactions observed directly. This indicates that sampling has captured roughly 85% of the estimated total diversity.
2.3. Proportion of Shared to Specific Reactions
The 88 metabolites produced from glucose as the main carbon source had an average of 12.15 ± 8.18 modified reactions per metabolite, including 10.346 ± 8.27 native reactions that improved production. Among the 88 metabolites analyzed, L-tryptophan exhibited the highest number of modified reactions (48), including 46 native and 2 heterologous reactions (Figure 3).
The leave-one(metabolite)-out analysis showed that 75.52 ± 29.08% of the native reactions were already annotated for a given unannotated metabolite, as they appear in the biosynthetic routes of other metabolites. This indicates that the remaining reactions are metabolite-specific. These specific reactions were primarily associated with transport processes (35 reactions) and with the terminal steps of the corresponding biosynthetic pathways. Figure 4 shows a visual representation of this analysis.
To assess whether the overlap of engineered reactions across metabolites exceeded chance, we compared the leave-one-out coverage from EraGene with the distribution generated from 100,000 random reaction sets of the same size sampled from the iML1515 metabolic model. The random samples yielded a mean leave-one-out coverage of approximately 14.78%, whereas EraGene achieved 75.52% coverage (Figure 5). This value was significantly higher than expected under random sampling (empirical permutation P < 1 × 10⁻⁵), indicating that the overlap of engineered reactions across metabolites is substantially greater than expected by chance.
To establish a highly stringent and biologically informative baseline, we performed a degree-preserving randomization of the bipartite reaction-by-metabolite matrix using the Curveball algorithm (Table 1). This approach strictly preserves both individual reaction frequencies (the popularity of central metabolic nodes) and the specific target set sizes per metabolite. Under this degree-preserving null model, the expected random overlap was 76.94 ± 1.25%. Interestingly, the observed EraGene overlap of 75.52% does not significantly deviate from this randomized baseline (z = -1.13, empirical lower-tail permutation P = 0.135). This statistical congruence indicates that the underlying degree distribution of the metabolic target space largely explains the high conservation of engineered reactions across different biosynthetic pathways. Rather than reflecting arbitrary or pathway-specific segregation under this constraint, the observed overlap is heavily shaped by a recurrent, highly canalized core of central metabolic reactions. Indeed, of the 2,712 native biochemical reactions in the Escherichia coli genome-scale reconstruction iML1515, the curated metabolic engineering literature converges on a remarkably consolidated space of only 300 native reactions, with the entire engineered repertoire estimated to saturate at just 354 reactions. This marked concentration highlights that E. coli operates as a highly specialized host organism historically optimized for specific families of biochemically related compounds. Because these diverse target molecules branch from shared central metabolic hubs, such as the shikimate and chorismate pathways for aromatic amino acids and their high-value downstream derivatives like violacein, serotonin, psilocybin, and 5-hydroxytryptophan, optimizing core precursor networks yields a high rate of target duplication across different studies. Consequently, the observed 75.52% reaction overlap should be interpreted as an empirical measure of pathway-family transferability within the curated corpus. Rather than indicating statistical redundancy, this behavior empirically validates platform-strain design rules, showing that core precursor-optimizing modifications are universally reusable and allowing researchers to bypass redundant efforts on established biosynthetic hubs and focus exclusively on terminal biosynthetic and transport steps.
2.4. Classification of Engineered Reactions Based on Modulation Tendency
A total of 50.33% of the reactions involved in metabolite production are activated, 30% are consistently repressed, and 18.67% exhibit both behaviors (Figure 6), depending on the metabolite in which they participate.
2.5. Comparison of Engineered Reactions from QPAML Predictions
Figure 7 shows a visualization of QPAML-predicted reactions affecting tryptophan production, filtered by the Eragene annotations.
Of the 101 metabolites in the database corresponding to experimentally validated overproduction targets, we selected 88 for production simulations using QPAML. We chose these metabolites because the corresponding studies used D-glucose as the carbon source. Suggestions were generated using engineered reactions from other metabolites (knowledge-guided reactions; Section 4.7) and subsequently compared with experimentally validated genetic modifications (Figure 8).
QPAML predicted an average of 180.21 reactions per metabolite. Of these predictions, 43.51 reactions overlapped with engineered reactions for other metabolites, while 5.06 matched experimentally validated modifications of the target metabolite. Across all QPAML predictions, 3.42% (6.18/180.21) were found to be experimentally validated for the corresponding target metabolite. In contrast, reactions overlapping with conserved reactions showed an experimental validation rate of 11.66% (5.06/43.51), representing a 3.41-fold enrichment compared with the complete prediction set. Filtering QPAML predictions by conserved reactions reduced the candidate set from 180.21 to 43.51 reactions (75.86% reduction) while keeping 81.88% (5.06/6.18) of experimentally validated modifications.
2.6. Co-occurrence Analysis of Modification Patterns
The reaction-modulation co-occurrence analysis revealed generally low levels of simultaneous modulation across strains, as shown in the heatmap, where co-occurring reactions are sparse (Figure 9). Co-occurrence clusters are primarily near the diagonal and appear reddish, consistent with hierarchical clustering by reaction modulation profiles. These patterns indicate that only a few reactions are co-modulated in small clusters, whereas most modulations occur independently.
2.7. Analysis of Community Structure in Modification Patterns
We identified 153 communities from the graph constructed from the database. After filtering these communities based on the genetic modifications recorded in the database, we performed KEGG pathway enrichment analysis. Of the 153 identified communities, only 33 contained genetic modifications.
KEGG enrichment analysis identified significant enrichment for native Escherichia coli metabolic pathways in 20 of the 33 communities containing genetic modifications (Figure 10). Most enriched communities were associated with specific biological processes, including amino acid biosynthesis, oxidative phosphorylation, purine metabolism, cofactor biosynthesis, and carbohydrate metabolism. Several communities, including 31 and 67, were associated with multiple central carbon metabolism pathways, such as pyruvate metabolism, the citrate cycle, and glycolysis. The remaining 13 communities were not assigned to native E. coli pathways because they were primarily associated with heterologous biosynthetic pathways, including violacein (community 151), ectoine (community 152), and L-DOPA (community 11).
3. Discussion
3.1. Database Saturation
We estimated the total number of native engineered reactions in E. coli using the Good–Turing estimator [32], based on the reaction annotations available in the database, yielding an estimate of 354.1 reactions (95% CI: 342.7–368.6). The rarefaction curve did not approach a clear plateau, indicating that the database needs further curation before it reaches saturation. Nonetheless, the decreasing slope of the rarefaction curve shows substantial sharing of key reactions across metabolites, as progressively fewer new reactions appear when additional metabolites are incorporated. Despite the lack of full saturation, this extensive overlap indicates that a considerable portion of the database has already been consistently annotated, providing a representative and operationally valuable set of reactions suitable for downstream computational and comparative analyses.
3.2. Shared and Specific Engineered Reactions in Metabolite Production
After filtering for metabolites produced using glucose as the sole carbon source, systematic screening identified 300 native reactions that modulate the production of 88 distinct metabolites. Among these, 139 reactions were associated with the production of a single metabolite (Figure 1a). These specific reactions were predominantly linked to transport processes (35 reactions) or to the terminal steps of biosynthetic pathways. This suggests that modifying transport reactions can serve as a heuristic for metabolite overproduction.
When feasible, secreting the target metabolite enhances production by reducing intracellular accumulation and mitigating toxicity [33]. A recurrent pattern among transport-related modifications involves increasing export while limiting the compound’s uptake. However, excessive secretion of essential metabolites may deplete intracellular pools and compromise cellular viability [34]. These considerations illustrate why transport steps frequently appear among specific metabolic interventions.
Terminal pathway reactions exhibit similar relevance. Their annotation provides insights into engineering derivative heterologous metabolites, since modulating end-point biosynthetic nodes can direct metabolic flux toward structurally related compounds. For instance, reactions identified in tryptophan biosynthesis can be repurposed to optimize the production of compounds such as violacein [35,36], serotonin [36,37], psilocybin [38], and 5-hydroxytryptophan [39,40]. The tryptophan-overproducing platform strain S028 exemplifies this translational ability, as the pre-optimized precursor pathway was extended to direct metabolic flux toward high-value derivatives [41]. From a practical metabolic engineering perspective, evaluating transferability within these closely related chemical families is highly relevant. Re-engineering precursor nodes (e.g., shikimate and prephenate pathways) for each derivative would represent an unnecessary duplication of experimental effort; thus, the high reaction overlap documented in EraGene serves as an empirical validation of platform-strain design rules rather than a mere consequence of database redundancy.
Although specific reactions were more numerous, 84.73% of the reported genetic interventions targeted shared reactions, indicating that these frequently targeted nodes are highly relevant to metabolic engineering. This predominance highlights the central role of shared reactions in optimizing metabolic fluxes and underscores the database’s utility as a reference for rational strain design. This conclusion is further supported by the leave-one-metabolite-out sampling, which shows that, on average, 75.52 ± 29.08% of the reactions associated with an unannotated metabolite are already represented in the database.
The standard deviation of engineered reactions reported enhancing metabolite production is 8.18 reactions, indicating substantial variability in the number of reactions documented per target metabolite and highlighting uneven research depth across compounds (Figure 3). To address this imbalance, we conducted additional literature searches to expand the curated reaction sets for metabolites with sparse annotations; however, we found no further data. This outcome suggests that, for certain metabolites, existing studies focus primarily on establishing production rather than pursuing subsequent optimization, even when these metabolites are derived from extensively investigated precursors. A representative case is ergothioneine, whose biosynthesis depends mainly on histidine, glutamate, and cysteine, yet it remains comparatively underexplored despite its connection to well-studied amino acid pathways [42].
Our bipartite matrix randomization using the Curveball algorithm provides crucial insights into the topological organization of metabolic engineering targets. While a simple uniform random sampling of reactions from the iML1515 model yields a low baseline overlap of 14.78 ± 1.20% (z = +50.62, P < 0.001), the degree-preserving null model, which accounts for the heavy clustering of genetic modifications within central metabolism, projects an expected overlap of 76.94 ± 1.25%. Interestingly, our observed overlap of 75.52% does not significantly deviate from this randomized baseline (z = -1.13, P = 0.135). This statistical congruence indicates that the underlying degree distribution of the metabolic target space largely explains the high conservation of engineered reactions across different biosynthetic pathways. Rather than reflecting arbitrary pathway segregation, the observed overlap is heavily shaped by a recurrent, highly canalized core of central metabolic reactions. From a practical metabolic engineering perspective, this behavior empirically validates platform-strain design rules. It mathematically confirms that core precursor-optimizing modifications are universally reusable across biochemically diverse pathways, allowing researchers to bypass redundant, de novo optimization of shared metabolic hubs and focus development efforts exclusively on pathway-specific terminal steps and transport processes.
3.3. Patterns of Engineered Reaction Modulation in Metabolic Engineering
Not all engineered reactions are modulated in the same way: some are upregulated, others downregulated, and some can be modulated in both directions (Figure 6). The classification of reactions in this study is therefore essential, as comparisons with QPAML could otherwise yield misleading discrepancies when the correct reaction is identified. Still, the modulation direction (upregulation or downregulation) is predicted incorrectly.
Although regulatory tendencies were consistent for most reactions, applying them as a filtering criterion excluded 20.44% of experimentally validated reactions because their modulation direction differed from QPAML predictions. This suggests that, while dominant regulatory tendencies exist, additional curation is needed to characterize context-dependent modulation patterns fully. Nevertheless, specific examples support the overall validity of the observed patterns.
3.3.1. Tendency of Highly Active Reactions to Be Downregulated
The glucose-specific phosphotransferase system (PTS) has been engineered into more than 21 metabolite-production systems, yet it has consistently been downregulated rather than upregulated. This system, composed of EI, HPr, EIIAGlc, and EIICBGlc, couples glucose uptake with phosphorylation, generating glucose-6-phosphate and pyruvate [43]. Excess pyruvate promotes acetate accumulation, whereas phosphoenolpyruvate consumption restricts its availability for other metabolic pathways [44]. Under high glucose concentrations, dephosphorylated EIICBGlc sequesters the Mlc repressor, activating the PTS regulon and increasing glucose uptake through a positive feedback loop [45]. These characteristics explain why the PTS is preferentially downregulated, as its intrinsic efficiency prevents metabolic saturation under typical fermentation conditions.
3.3.2. Preferential Upregulation of Reactions with Low Activity
Upregulated reactions generally exhibit low catalytic efficiency and must be enhanced when involved in metabolite production. Secretion reactions exemplify this behavior by transporting metabolites from the cytoplasm to the periplasmic space. Essential intracellular metabolites, such as amino acids, are typically retained within the cell [46]; therefore, secretion reactions normally display low basal activity. However, metabolite secretion plays a crucial role in alleviating feedback repression associated with product accumulation [47]. Consequently, when the target metabolite can be secreted, the corresponding transport reactions tend to be consistently overregulated, despite their specificity for individual metabolites.
3.3.3. Heterologous Reactions
Heterologous reactions were omitted from the analysis, in accordance with the criteria described in Section 4.4. As Wei et al. (2024) [11] describe, two kinds of heterologous reactions are considered in metabolic engineering: the first are required to enable the production of heterologous metabolites, whereas the second introduce alternative pathways to increase the conversion rate of substrate to target metabolite. In both cases, reactions are classified as targets for upregulation because they are not available in the E. coli chassis and must be introduced.
3.3.4. Reactions Exhibiting Dual Modulation
Reactions located at metabolic branch points may participate directly in the biosynthetic pathway of a given metabolite, where upregulation is required, while simultaneously diverting shared precursors toward competing pathways, where downregulation is necessary. This context-dependent regulation is exemplified at the chorismate node, where chorismate serves as a common precursor for the biosynthesis of tryptophan, phenylalanine, and tyrosine. Under these conditions, enzymes such as anthranilate synthase and chorismate mutase can exhibit opposite regulatory requirements depending on the metabolite targeted for overproduction [48,49,50].
3.3.5. Reactions Unsuitable as Targets for Genetic Modification
Most engineered strains are far from the maximal theoretical conversion rate, as part of the substrate and energy must be allocated to biomass formation and cellular maintenance. However, strain SDU4 has nearly attained the theoretical maximum for (R)-lactate [12], despite the absence of extensive pathway modifications or complete suppression of competing routes. This observation suggests that the phenomenon arises from intrinsic differences in catalytic performance between biosynthetic and competing pathways. Enzymes in the biosynthetic pathway generally exhibit high catalytic efficiency, favoring the directed conversion to the desired metabolite. In contrast, reactions in competing pathways exhibit lower catalytic activity when utilizing shared precursors. Under such conditions, additional modifications offer minimal benefit, and these competing reactions are unlikely to constitute effective targets for further engineering. Moreover, altering these reactions can impose a substantial metabolic burden on the host cell, ultimately diminishing production yields, as previously reported [51,52].
3.4. Selection of Target Reactions Requires Alignment with Metabolic Pathways
Using the engineered reactions annotated in this database to identify target reactions to enhance the production of a given metabolite is not viable unless those key reactions align with the metabolic pathway that synthesizes that metabolite. Generally, reactions identified as candidates for upregulation are part of optimal or suboptimal production routes, whereas those targeted for downregulation are part of competing pathways [7]. Nonetheless, numerous exceptions exist, particularly among secondary pathways that supply essential cofactors or molecular moieties for the primary biosynthetic route. Typical examples include reactions maintaining the redox balance between NADH and NADPH through pntAB/sthA [16,48,53] or NAD kinase [14,16,54], and those associated with the formation of inhibitory by-products such as acetate, formate, ethanol, or lactate.
We used the QPAML model as an in silico approach to identify reactions associated with metabolite production, and we compared its predictions with experimentally observed modifications. Unlike most CoBRA-based methods, QPAML can distinguish reactions that favor or hinder overproduction of a given metabolite and computes substantially faster. Although it classifies all reactions in the network by their contribution to the target phenotype, it does not identify true key metabolic reactions, and its predictions often assign similar importance to entire metabolic modules, inflating the candidate set.
Using knowledge-guided reactions to filter QPAML predictions reduced the search space for key reactions by a factor of 4, increased the density of experimentally validated reactions by 3.41-fold, and recovered 81.88% of the predicted validated targets. The reactions that remain unfiltered correspond primarily to pathway-specific steps directly involved in target metabolite biosynthesis. However, these are not included in the masked-reaction set; QPAML still consistently predicts them.
To confirm that this predictive enrichment was not a statistical artifact of either reduced filter space or the inherent popularity of central metabolic reactions, we evaluated performance against two custom null models (Table 1). A random filter of equal size yielded a baseline validation rate of only 3.86 ± 0.61% (z = +12.85, P < 0.001). More importantly, when we weighted the randomized selection by modification frequencies in the curated database to account for reaction popularity (centrality), the expected validation rate rose to 10.20 ± 0.25%. Yet, it remained significantly below our observed rate of 11.66% (z = +5.98, P < 0.001). This statistical divergence shows that the predictive enrichment of the filtered QPAML model is driven by specific, knowledge-guided reaction–metabolite associations rather than biased selection toward highly investigated central pathways.
The substantially larger number of reactions identified by QPAML than by the smaller set of experimentally validated reactions indicates that only a subset of these reactions meaningfully influences metabolite overproduction. This contrast underscores that, among all candidates, only specific key reactions are suitable targets for effective metabolic tuning.
Reactions predicted by QPAML that fall within the set of knowledge-guided reactions and have not yet been evaluated experimentally for metabolite overproduction represent promising candidates for future modification. This reduced set of candidate reactions is manageable with modern technologies such as multiplex automated genome engineering (MAGE), which enables systematic combinations of gene-tuning interventions to enhance target metabolite production [55]. Although testing 44 reactions per target may seem excessive, evidence from extensively studied metabolites supports this estimate, with more than 48 distinct reaction modifications reported to improve production across different engineering strategies (Figure 3).
3.5. Functional Analysis of Cluster Co-occurrence
The cluster analysis of engineered reactions indicates that metabolic regulation in E. coli operates primarily through fine control of individual reactions or small groups of enzymes, rather than through large innate regulatory modules. The fragmentation of reaction-modulation states supports this conclusion: 178 clusters, 81 of which contain a single reaction (Supplementary Figure Table S2), rather than aggregating into a few coherent regulatory modules.
The fragmented architecture of engineered reactions stems from central metabolism’s shared participation across pathways with diverse objectives. This inherent multi-functionality prevents broad co-regulation of the constituent reactions. The observation that glycolytic and TCA-cycle reactions are distributed across numerous small clusters aligns with their need to respond to diverse, often competing regulatory signals, rather than functioning as unified blocks.
The silhouette score of 0.50 for 178 clusters indicates limited cluster cohesion. Analysis of large clusters reveals that they primarily result from artifacts of genetic manipulation, in which complete operons were modulated rather than from identifying true metabolic bottlenecks. Examples include the tryptophan, histidine, and leucine operons; however, this strategy is not always advantageous, as it can impose a substantial metabolic burden on the cell [52]. Additionally, small clusters frequently form around enzymes that catalyze multiple reactions, such as the fused enzymes chorismate mutase/prephenate dehydrogenase (TyrA) and chorismate mutase/prephenate dehydratase (PheA). These findings reinforce the validity of small clusters as meaningful indicators of metabolic regulation while highlighting that large clusters often reflect experimental design rather than inherent biological organization.
Despite the overall weak clustering of reaction co-occurrence, several small groups appear to function as genuinely co-modulated reaction sets. For instance, cluster 3 comprises gnd and zwf, two genes encoding key enzymes of the oxidative branch of the pentose phosphate pathway that support elevated NADPH generation. Cluster 83 reflects the recurrent combination of reduced PTS activity together with enhanced expression of glucokinase (glk), a pattern consistent with a shift toward ATP-dependent glucose phosphorylation. Finally, cluster 60 aggregates modulations that increase the availability of aromatic amino acid precursors, indicating coordinated modulation of flux toward the shikimate pathway.
3.6. Biological Interpretation of Communities through KEGG Pathway Enrichment
In contrast to co-occurrence analysis, representing the database as a knowledge graph enables the identification of communities that correspond to larger functional modules, which can subsequently be assigned biological meaning through KEGG pathway enrichment analysis. These communities associate similar nodes [56], which in our knowledge graph correspond to metabolites, reactions, genes, and strains, creating subsets of nodes that share common properties. These structures represent promising directions for future research, supporting the development of prediction algorithms that leverage similarity relationships within the knowledge graph and network centrality measures to identify genes and reactions with critical functional roles within each module.
The communities detected are associated with particular metabolites. Communities 18 and 48, for example, both relate to aromatic amino acids. Still, community 48 is more closely associated with L-tryptophan production and its derivatives, whereas community 18 is more closely associated with L-tyrosine and L-phenylalanine.
Community 147 represents strategies for modulating oxidative phosphorylation and reducing power. Overexpression of the genes belonging to this community increases ATP availability and thereby improves the production of energetically costly compounds such as histidine [52], while its downregulation increases the reducing power of the cell increasing the production of reduced compounds such as isobutanol and 2,3-butanediol [57].
Community detection resolved two functionally distinct modules within central carbon metabolism, Communities 31 and 67. Although both contain genes associated with the citrate cycle, their compositions suggest contrasting metabolic roles. Community 31 is enriched in genes involved in pyruvate and acetyl-CoA partitioning, linking fermentative pathways with oxidative respiration and energy metabolism. In contrast, Community 67 is enriched in anaplerotic reactions and the redistribution of TCA intermediates toward precursor biosynthesis. Thus, the two communities appear to represent complementary modules associated primarily with energy and redox metabolism versus precursor supply, respectively. Resolving these distinctions within a shared metabolic context highlights the community detection approach’s ability to capture subtle organizational features of the metabolic network. From a strain-design perspective, this modular organization suggests that Community 31 may be particularly relevant for engineering strategies targeting energy and redox metabolism. In contrast, Community 67 may provide more suitable targets for enhancing precursor availability to support diverse biosynthetic pathways.
3.7. Limitations of the Database
Although the database provides a comprehensive compilation of conserved regulatory reactions experimentally validated across multiple metabolites, several limitations remain.
This resource is inherently retrospective, as it relies exclusively on interventions already reported in the literature. For this reason, it cannot support inference of new regulatory targets or reactions not previously explored. Its main value lies in transferring established engineering strategies to related metabolites [58], rather than identifying entirely novel intervention points.
The regulatory tendencies captured in the database may also vary with metabolic context. Overproduction frequently disrupts intracellular homeostasis, leading to precursor depletion or accumulation of inhibitory intermediates. These imbalances can alter the effective behavior of regulated reactions, causing certain reactions to exhibit different modulation tendencies under specific physiological conditions [59].
Additional variability arises from differences in strain backgrounds, cultivation conditions, carbon sources, and expression systems. Although curation procedures aim to reduce such heterogeneity, these factors may still influence the generalizability of the observed regulatory patterns. These observations underscore the need to continue expanding the database, which will progressively strengthen our understanding of the mechanisms underlying metabolite overproduction.
A further and more fundamental limitation is publication bias. The database includes only successful, published interventions; negative results, failed modifications, and unreported intermediate constructs are systematically absent. Consequently, these data cannot estimate the false-positive rate of a given engineering target, and the positive predictive value of a transferred strategy should be treated as an upper bound rather than an expectation.
Attribution of effect is also ambiguous. Because most engineered strains carry multiple simultaneous modifications, up to 48 in the case of L-tryptophan, the published data do not identify the individual contribution of any single reaction to the observed improvement. Reactions are therefore recorded as intervened rather than as demonstrably causal, and the annotations are treated as binary indicators without weighting by the magnitude of the associated gain in titer or yield.
The observations compiled here are furthermore not statistically independent. Strains derived from a common parental background inherit modifications by descent, and metabolites belonging to the same biosynthetic family share reactions by construction. Both forms of dependence inflate apparent co-occurrence and reduce the effective sample size underlying the leave-one-out estimate. Consequently, interpret this metric as a measure of operational redundancy and pathway-family transferability within the curated corpus, rather than a guarantee of transferability to a biosynthetically unrelated target. Nevertheless, in practical biomanufacturing, transfer within related families (such as from aromatic amino acids to alkaloids or indole derivatives) represents the primary route for strain development, making this high overlap a highly actionable engineering metric.
Finally, metabolite coverage is markedly uneven, ranging from 48 engineered reactions for L-tryptophan to only a handful for under-investigated compounds. Aggregate statistics therefore skew toward a few intensively studied hub metabolites, and all inferences remain specific to the E. coli chassis and glucose as the carbon source.
The strains compiled in this database are not independent observations. Essentially all Escherichia coli strains used for metabolite overproduction descend from a few environmental isolates. The two dominant chassis, MG1655 and W3110, differ at only eight true sequence positions besides the W3110 rrnD-rrnE inversion, and BW25113, the base strain for most lambda-Red workflows, is likewise a K-12 derivative. Only BL21(DE3), of the B lineage, and W (ATCC 9637), of phylogroup B1, constitute genuinely separate backgrounds.
This matters for interpreting recurrent engineering targets. The K-12 background carries lesions shared by all three of its dominant derivatives: rph-1 is polar on pyrE and causes internal pyrimidine limitation, while the ilvG frameshift inactivates acetohydroxyacid synthase II. Chassis backgrounds also differ in precisely the phenotype that recurs throughout the curated records, since E. coli W shows fast, highly oxidative metabolism with low acetate formation. In contrast, acetate overflow is a persistent theme across the K-12 entries. A target that recurs because it compensates for a chassis-specific bottleneck will not transfer to a different background, so we report the leave-one-out overlap both within and across the K-12 chassis.
4. Materials and Methods
4.1. Software
We used the Django framework to manage the database. We retrieved CoBRA methods from the COBRApy [60], Cameo [9], and QPAML [7] Python packages. We used Gurobi [61] as the linear programming solver. We used NetworkX [62] to construct and manipulate graphs. We performed community detection using the Python-Louvain package, which implements the Louvain community detection algorithm introduced by Blondel et al. (2008) [63]. We calculated false discovery rates (FDRs) using the multipletests function from the statsmodels package [64]. Pairwise Jaccard similarity scores were calculated using the scikit-learn library [65].
4.2. Database Curation
We manually reviewed publications reporting metabolite overproduction and structured the database to capture the most frequently reported data types, as outlined in Figure 11. Each annotation is linked to its corresponding literature reference to ensure traceability.
Strains constitute the central entities in the database. Each strain may undergo genetic modifications introduced either through chromosomal editing or plasmid transformation. A single strain can produce several metabolites, with target metabolites defined as those intended for production and non-target metabolites arising as by-products or intermediates.
Each genetic modification is annotated with the affected gene, the reactions it influences, and the type of modification performed. Although genes are generally linked to all reactions catalyzed by their encoded enzymes, the database also records the specific reactions intentionally targeted by the modification. This distinction matters because many enzymes act in multiple pathways due to catalytic promiscuity or multiple functional domains, and it prevents inadvertent annotation of reactions that were not intentionally modified.
We excluded strains and their annotations from the analysis if they did not increase target metabolite production relative to their closest parental ancestors, except when a modification enhanced another relevant trait. One illustrative case is silencing genes involved in the glucose phosphotransferase system (PTS), which we included because, although this modification alone reduces titer, combining it with hexokinase overexpression restores titer while maintaining improved substrate-to-product conversion efficiency (yield) [44,66,67,68,69,70,71].
To complement the database, we integrated information on metabolites, genes, reactions, and organisms using BioCyc as a reference [28]. We also recorded the carbon source used in each experiment; however, we restricted the analysis to studies using glucose, as it is the most widely used substrate and reports on alternative carbon sources are limited. Because metabolic pathways vary substantially with the carbon source, focusing on glucose ensures a consistent basis for comparison across datasets [33]. The Supplementary Materials, Section S1, describe the database curation workflow in detail.
4.3. Rarefaction Curve of Reactions Implicated in Metabolite Overproduction
To assess whether the database captures most reactions implicated in metabolite overproduction, we generated a rarefaction curve [72]. This analysis estimates how the cumulative number of unique engineered reactions grows as we incorporate additional metabolites. By repeatedly subsampling metabolites and quantifying the rate at which previously unobserved reactions emerge, the rarefaction curve indicates database completeness and whether further sampling is expected to uncover additional production-relevant reactions. The asymptotic richness of the engineered-reaction repertoire was estimated with the Good–Turing estimator, which infers unobserved richness from the frequency of singleton observations; 95% confidence intervals were obtained by bootstrap resampling of the metabolite-by-reaction incidence matrix (1,000 replicates). We did not apply the Chao1 [73] and ICE [74] estimators because the high proportion of singleton reactions makes them unstable in this dataset [75].
4.4. Classification of Reactions According to Regulatory Behavior
The present analysis was restricted to native E. coli reactions to test whether a limited subset of endogenous reactions exerts predominant control over metabolite production across different pathways. We excluded heterologous reactions because they create an unbounded search space across biological diversity. This focus aims to identify transferable engineering strategies based on strategic modulation of the host’s core metabolic network, rather than introducing pathway-specific heterologous enzymes.
We assigned each reaction a modulation trend based on the genetic alterations introduced in experimental studies aimed at improving metabolite production. For each strain, we annotated reactions as overregulated when the corresponding genes were duplicated or overexpressed, and as downregulated when gene attenuation, silencing, or deletion was reported. For each metabolite, a reaction was classified as overregulated or downregulated when only one of these modulation types was observed across all associated strains, and as dual when both up- and downregulation were reported. Each classification was based solely on the available experimental evidence, without weighting by frequency of observation. Finally, we compared reactions across all strains to identify consistent patterns of overregulation, downregulation, or dual modulatory behavior in different production contexts.
4.5. Estimating Reaction Overlap for Novel Metabolites Using Leave-One-Out Resampling
We implemented a leave-one-out resampling procedure to assess the fraction of shared reactions already annotated in the database that are associated with a novel metabolite. This approach follows the resampling principle introduced by Quenouille [76]. Let M = {M₁, …, MN} denote the set of N annotated metabolites, and let kᵢ represent the set of reactions annotated as contributing to the production of metabolite Mᵢ. For each metabolite Mⱼ, the method simulates the case in which Mⱼ is considered novel by temporarily excluding its annotations. A masked reaction set R₋ⱼ is then constructed as the union of all annotated reactions associated with every Mᵢ except Mⱼ, as described in Equation (1).
We then compare each reaction r ∈ kⱼ against R₋ⱼ. A reaction is classified as overlapping if it is already present in R₋ⱼ (i.e., annotated for at least one other metabolite), or as unique if absent from R₋ⱼ (i.e., specific to Mⱼ). The overlap proportion for metabolite Mⱼ is computed as in Equation (2).
where |·| denotes the number of elements in the set. The global redundancy metric, representing the expected proportion of reactions already cataloged for a novel metabolite, is obtained as the mean overlap across all metabolites, as in Equation (3).
4.5.1. Evaluation of the Significance of Experimentally Validated Reaction Overlap
To assess whether the reaction overlap observed in EraGene deviated from stochastic expectations, we compared the empirical leave-one-out redundancy metric, calculated according to Equation (3), with four complementary null models. For each model, 100,000 bootstrap replicates were generated, from which empirical z-scores and permutation-based P-values were calculated using the corresponding null distributions.
The first null model consisted of uniform random sampling from the iML1515 genome-scale metabolic model (Equations (4) and (5)). For each target metabolite, kj reactions were sampled without replacement from the 2,712 native metabolic reactions, where kj denotes the number of curated engineered reactions associated with metabolite j. This model assumes that all native reactions have an equal probability (Equation (6)) of being selected and therefore provides a baseline expectation in the absence of preferential reaction selection. We assessed statistical significance using the empirical permutation test described by Neuhäuser [77].
To account for the non-uniform distribution of reaction modifications in the curated database, we next employed a degree-preserving randomization based on the Curveball algorithm [78]. We represented the curated data as a bipartite reaction-by-metabolite adjacency matrix A ∈ {0,1}(N × |U|), where rows correspond to target metabolites and columns to native reactions. An entry Aⱼ,r = 1 indicates that reaction r belongs to the curated reaction set kⱼ, whereas Aⱼ,r = 0 otherwise. The row sum therefore gives the number of validated reactions associated with each metabolite:
Conversely, the modification frequency of each reaction across the curated database is represented by its column sum:
We used the Curveball algorithm to generate randomized matrices while preserving both the row and column sums. Thus, for every bootstrap replicate:
and
This procedure preserves both the number of validated reactions associated with each metabolite and the overall modification frequency of each reaction, while randomizing the specific metabolite–reaction associations. We then calculated the simulated global redundancy metric for each randomized matrix using Equation (3). This provides a more stringent null model that accounts for differences in reaction popularity within the curated database.
We used two additional null models to evaluate the contribution of QPAML’s knowledge-guided filtering strategy. Let Pⱼ denote the set of candidate reactions predicted by QPAML for metabolite Mⱼ, and let Fⱼ represent the empirical knowledge-guided filter obtained from the intersection between Pⱼ and the corresponding leave-one-out reaction set. The size of the empirical filter is therefore |Fⱼ|.
In the first QPAML null model, candidate reactions were sampled uniformly from Pⱼ while maintaining the same filter size as the empirical filter:
Each candidate reaction r ∈ Pⱼ was assigned the same selection probability:
This model preserves the number of reactions retained by the filter while removing the specific information derived from EraGene. It therefore provides a baseline for determining whether the observed enrichment could arise simply from filter size.
Finally, we evaluated whether QPAML-driven enrichment could be explained by preferential selection of frequently modified reactions. To do so, we sampled candidate reactions according to their modification frequencies in the curated database. For each candidate reaction r ∈ Pⱼ, the corresponding sampling weight was defined as:
And the normalized selection probability was calculated as:
We generated the randomized filter with the same size as the empirical filter, |Fⱼ|. Unlike the uniform QPAML null model, this procedure preserves the tendency to select frequently modified reactions while removing the specific knowledge-guided associations used by QPAML. Comparison with this null model therefore allowed us to determine whether the observed enrichment was attributable to the curated reaction–metabolite relationships rather than to reaction popularity alone.
For all four null models, we compared the observed global redundancy metric with the corresponding bootstrap distribution. We used the mean and standard deviation of each null distribution to calculate the empirical z-score, quantifying the observed metric’s deviation from the stochastic expectation in units of the null-model standard deviation. We calculated permutation-based lower- and upper-tail P-values as the proportions of bootstrap replicates yielding values equal to or more extreme than the observed metric in the corresponding direction. All statistical calculations were performed using NumPy [79].
4.6. Prediction of Reactions Affecting Metabolite Production
We used the QPAML model [7], previously developed by our research group, to predict reactions influencing metabolite production. We simulated the Escherichia coli iML1515 model [80]. Because several target metabolites are heterologous, we conducted the simulations in an extended metabolic space based on the universal BiGG model [81], following the strategy described by Wei et al. (2024) [11]. We incorporated reactions not included in either iML1515 or the universal model when reported in experimental publications.
We identified the optimal minimal pathways for heterologous metabolite synthesis by solving the mixed-integer linear programming (MILP) problem defined in Equation (15) and then integrating them into the chassis model.
The MILP model distinguishes between chassis (C) and heterologous (H) reactions. Chassis reactions are part of the Escherichia coli metabolic network, whereas heterologous reactions, derived from other organisms, are included only in the universal BiGG model. Binary variables govern their integration into the chassis model, and the formulation aims to minimize the number of heterologous reactions required to produce the target metabolite.
Let Sᵢ‚ⱼ denote the stoichiometric coefficient of metabolite i in reaction j; vⱼ denote the steady-state flux of reaction j; yⱼ ∈ {0,1} be a binary variable indicating whether the heterologous reaction j ∈ H is active; and lbⱼ and ubⱼ denote the lower and upper flux bounds, respectively. A small positive constant ε was used to enforce a non-zero target flux (vtarget ≥ ε), since strict inequalities are not admissible in mixed-integer linear programming. The reaction producing the target metabolite is represented by vtarget.
For each metabolite, we annotated the reactions identified by QPAML as targets for either overregulation or downregulation (including classifications for knockout or knockdown interventions). We excluded all other classes predicted by the model because they are not suitable engineering targets [7]. To account for substrate uptake and target-metabolite secretion, we defined vsubstrate and vtarget as the exchange reactions associated with each metabolite when the corresponding transporter reactions were annotated in the chassis. All simulations were performed under the following constraints: glucose uptake fixed at 16 mmol gDW-1 h-1; oxygen uptake set to 7.5 mmol gDW-1 h-1 (aerobic conditions); non-growth-associated maintenance (ATPM) fixed at the iML1515 default of 6.86 mmol gDW-1 h-1; and the biomass lower bound was set to 0.05 h-1. Because strict inequalities are not admissible in mixed-integer linear programming, the constraint on the target flux was implemented as vtarget >= ε, with ε = 1.0 x 10⁻⁵ mmol gDW-1 h-1.
4.7. Knowledge-Guided Reaction Filtering
For each metabolite, a QPAML simulation was conducted. To constrain the search space for target reactions, we filtered the predicted reactions using the set of masked reactions R₋ⱼ (see Section 4.5). Then we compared them with experimentally validated reactions kⱼ. We included masked reactions only when the QPAML simulation consistently classified them as upregulated or downregulated across both datasets. We retained reactions showing both regulatory tendencies within the masked set for any corresponding QPAML prediction. For all simulations, we summed the numbers of predicted, masked, and experimentally validated reactions across metabolites and reported the mean final counts.
4.8. Clustering of Co-occurring Reaction Modulation
To identify groups of reaction modulations that tend to co-occur across engineered Escherichia coli strains, we applied hierarchical clustering to a binary reaction-by-strain matrix. In this matrix, rows represent strains and columns correspond to reactions encoded separately for upregulation and downregulation. Each entry is 1 when a reaction is modulated in a given strain and 0 otherwise.
A pairwise similarity matrix was computed using the Jaccard similarity coefficient and subsequently converted into a distance matrix (d = 1—J), where J denotes the Jaccard similarity. We then performed hierarchical agglomerative clustering using Ward’s minimum-variance method, implemented through the linkage function in SciPy [82]. We determined the optimal number of clusters by identifying the value of k that maximized the silhouette coefficient [83], evaluated over a range of k values (2–400).
4.9. Graph-Based Community Identification of Reactions
We constructed a knowledge graph by integrating the iML1515 genome-scale metabolic model with the database. We identified communities using the Louvain community detection algorithm [63]. We then retained communities containing genetically modified genes for further analysis. Finally, we performed KEGG pathway enrichment analysis on each retained community, using Escherichia coli as the reference organism, to identify the metabolic pathways characterizing each reaction module. We identified significantly enriched pathways using an FDR threshold of ≤ 0.05.
4.10. Web Platform and Dataset Distribution
The curated annotations and simulation results are accessible through the EraGene web platform (https://eragene.com). To support graph-based analyses, we converted the database annotations into a Neo4j graph database, and a database dump is publicly available at https://gitlab.com/amalib/eragene_cypher/ and Zenodo (10.5281/zenodo.22325904) [84].
5. Conclusions
This database provides a structured compilation of current genetic modifications for improving the production of high-value metabolites in E. coli. It summarizes established metabolic-engineering strategies and identifies recurrent engineering targets. Integrating this dataset with Constraint-Based Reconstruction and Analysis methods improves the identification of target reactions for metabolite overproduction and substantially reduces the number of predicted key reactions. Furthermore, the resource enables the identification of reactions shared across different metabolic pathways, facilitating the transfer of regulatory insights to improve the synthesis of novel compounds. Analysis of the compiled data also reveals general patterns in metabolite overproduction, such as the critical role of transporter proteins and the recurring challenge of inhibitory-metabolite accumulation.
In its current form, the database serves as a valuable resource for assessing the predictive performance of constraint-based metabolic models in identifying genetic interventions that enhance metabolite production. Looking ahead, expanding the database will provide the structured knowledge needed to develop machine-learning approaches that can predict effective genetic modifications for metabolites not yet investigated.
Supplementary Materials
Author Contributions
Conceptualization, M.A.R.-V. and A.M.-A.; methodology, M.A.R.-V.; software, M.A.R.-V.; validation, M.A.R.-V.; formal analysis, M.A.R.-V.; investigation, M.A.R.-V.; resources, A.M.-A.; data curation, M.A.R.-V.; writing—original draft preparation, M.A.R.-V.; writing—review and editing, A.M.-A.; visualization, M.A.R.-V.; supervision, A.M.-A.; project administration, A.M.-A.; funding acquisition, A.M.-A. All authors have read and agreed to the published version of the manuscript.
Funding
M.A.R.-V. was a recipient of an SECIHTI Ph.D. scholarship (486528). IDEA (Guanajuato State) and Biofab México co-funded this project awarded to A.M.-A. (Finnovateg CFINN-0057).
Institutional Review Board Statement
Not applicable.
Informed Consent Statement
Not applicable.
Data Availability Statement
The complete database is available through the interactive web platform at https://eragene.com and can also be accessed as a Neo4j database dump at https://gitlab.com/amalib/eragene_cypher and https://doi.org/10.5281/zenodo.22325903.
Acknowledgments
The authors gratefully acknowledge Lucía C. Alzati Ramírez for her assistance with data curation, María del Rosario Cárdenas Aquino for her valuable technical assistance, and Gurobi Optimization, LLC for providing the academic license used in this study.
Conflicts of Interest
The authors declare the following potential conflict of interest: Author A.M.-A. is founder and shareholder of Biofab México S.A.P.I. de C.V., the company that provided partial funding for this study. Author A.M.-A. affirms that this research was conducted in the absence of any commercial or financial relationships that could have influenced the design, execution, interpretation, or reporting of the study. Author M.A.R.-V. declares no conflicts of interest.
Abbreviations
The following abbreviations are used in this manuscript:
| PTS | Phosphotransferase system |
| FBA | Flux balance analysis |
| MCA | Metabolic control analysis |
| mm | Molecular mass |
| Mw | Molecular weight |
| id | Identifier |
| MILP | Mixed-integer linear programming |
| CoBRA | Constraint-Based Reconstruction and Analysis |
| MAGE | Multiplex automated genome engineering |
| FDR | False Discovery Rate |
| QPAML | Qualitative Perturbation Analysis and Machine Learning |
References
- Chaudhary, R.; Nawaz, A.; Fouillaud, M.; Dufossé, L.; Haq, I.U.; Mukhtar, H. Microbial Cell Factories: Biodiversity, Pathway Construction, Robustness, and Industrial Applicability. Microbiol. Res. 2024, 15, 247–272. [Google Scholar] [CrossRef]
- Choi, H.S.; Lee, S.Y.; Kim, T.Y.; Woo, H.M. In Silico Identification of Gene Amplification Targets for Improvement of Lycopene Production. Appl. Environ. Microbiol. 2010, 76, 3097–3105. [Google Scholar] [CrossRef]
- Kim, J.; Reed, J.L. OptORF: Optimal Metabolic and Regulatory Perturbations for Metabolic Engineering of Microbial Strains. BMC Syst. Biol. 2010, 4, 53. [Google Scholar] [CrossRef]
- Ranganathan, S.; Suthers, P.F.; Maranas, C.D. OptForce: An Optimization Procedure for Identifying All Genetic Manipulations Leading to Targeted Overproductions. PLoS Comput Biol. 2010, 6, e1000744. [Google Scholar] [CrossRef]
- Burgard, A.P.; Pharkya, P.; Maranas, C.D. Optknock: A Bilevel Programming Framework for Identifying Gene Knockout Strategies for Microbial Strain Optimization. Biotech Bioeng. 2003, 84, 647–657. [Google Scholar] [CrossRef]
- Pharkya, P.; Burgard, A.P.; Maranas, C.D. OptStrain: A Computational Framework for Redesign of Microbial Production Systems. Genome Res. 2004, 14, 2367–2376. [Google Scholar] [CrossRef]
- Ramos-Valdovinos, M.A.; Salas-Navarrete, P.C.; Amores, G.R.; Hernández-Orihuela, A.L.; Martínez-Antonio, A. Qualitative Perturbation Analysis and Machine Learning: Elucidating Bacterial Optimization of Tryptophan Production. Algorithms 2024, 17, 282. [Google Scholar] [CrossRef]
- Zhang, J.; Petersen, S.D.; Radivojevic, T.; Ramirez, A.; Pérez-Manríquez, A.; Abeliuk, E.; Sánchez, B.J.; Costello, Z.; Chen, Y.; Fero, M.J.; et al. Combining Mechanistic and Machine Learning Models for Predictive Engineering and Optimization of Tryptophan Metabolism. Nat. Commun. 2020, 11, 4880. [Google Scholar] [CrossRef]
- Cardoso, J.G.R.; Jensen, K.; Lieven, C.; Lærke Hansen, A.S.; Galkina, S.; Beber, M.; Özdemir, E.; Herrgård, M.J.; Redestig, H.; Sonnenschein, N. Cameo: A Python Library for Computer Aided Metabolic Engineering and Optimization of Cell Factories. ACS Synth. Biol. 2018, 7, 1163–1166. [Google Scholar] [CrossRef]
- Pharkya, P.; Maranas, C.D. An Optimization Framework for Identifying Reaction Activation/Inhibition or Elimination Candidates for Overproduction in Microbial Systems. Metab. Eng. 2006, 8, 1–13. [Google Scholar] [CrossRef]
- Wei, F.; Cai, J.; Mao, Y.; Wang, R.; Li, H.; Mao, Z.; Liao, X.; Li, A.; Deng, X.; Li, F.; et al. Unveiling Metabolic Engineering Strategies by Quantitative Heterologous Pathway Design. Adv. Sci. 2024, 11, 2404632. [Google Scholar] [CrossRef]
- Liu, H.; Kang, J.; Qi, Q.; Chen, G. Production of Lactate in Escherichia Coli by Redox Regulation Genetically and Physiologically. Appl. Biochem Biotechnol. 2011, 164, 162–169. [Google Scholar] [CrossRef]
- Tröndle, J.; Schoppel, K.; Bleidt, A.; Trachtmann, N.; Sprenger, G.A.; Weuster-Botz, D. Metabolic Control Analysis of L-Tryptophan Production with Escherichia Coli Based on Data from Short-Term Perturbation Experiments. J. Biotechnol. 2020, 307, 15–28. [Google Scholar] [CrossRef]
- Hao, Y.; Pan, X.; Xing, R.; You, J.; Hu, M.; Liu, Z.; Li, X.; Xu, M.; Rao, Z. High-Level Production of L-Valine in Escherichia Coli Using Multi-Modular Engineering. Bioresour. Technol. 2022, 359, 127461. [Google Scholar] [CrossRef]
- Caballero Cerbon, D.A.; Widmann, J.; Weuster-Botz, D. Metabolic Control Analysis Enabled the Improvement of the L-Cysteine Production Process with Escherichia Coli. Appl. Microbiol. Biotechnol. 2024, 108, 108. [Google Scholar] [CrossRef]
- Yang, H.; Zhang, B.; Wu, Z.-D.; Chen, L.-F.; Pan, J.-Y.; Xiu, X.-L.; Cai, X.; Liu, Z.-Q.; Zheng, Y.-G. Combinatorial Metabolic Engineering of Escherichia Coli for Enhanced L-Cysteine Production: Insights into Crucial Regulatory Modes and Optimization of Carbon-Sulfur Metabolism and Cofactor Availability. J. Agric. Food Chem. 2023, 71, 13409–13418. [Google Scholar] [CrossRef]
- Jiang, S.; Wang, R.; Wang, D.; Zhao, C.; Ma, Q.; Wu, H.; Xie, X. Metabolic Reprogramming and Biosensor-Assisted Mutagenesis Screening for High-Level Production of L-Arginine in Escherichia Coli. Metab. Eng. 2023, 76, 146–157. [Google Scholar] [CrossRef]
- Zhou, L.; Wang, Y.; Han, L.; Wang, Q.; Liu, H.; Cheng, P.; Li, R.; Guo, X.; Zhou, Z. Enhancement of Patchoulol Production in Escherichia Coli via Multiple Engineering Strategies. J. Agric. Food Chem. 2021, 69, 7572–7580. [Google Scholar] [CrossRef]
- Yang, H.; Xue, Y.; Yang, C.; Shen, W.; Fan, Y.; Chen, X. Modular Engineering of Tyrosol Production in Escherichia Coli. J. Agric. Food Chem. 2019, 67, 3900–3908. [Google Scholar] [CrossRef]
- Zhang, K.; Qin, M.; Hou, Y.; Zhang, W.; Wang, Z.; Wang, H. Efficient Production of Guanosine in Escherichia Coli by Combinatorial Metabolic Engineering. Microb. Cell Fact. 2024, 23, 182. [Google Scholar] [CrossRef]
- Jin, C.-C.; Zhang, J.-L.; Song, H.; Cao, Y.-X. Boosting the Biosynthesis of Betulinic Acid and Related Triterpenoids in Yarrowia Lipolytica via Multimodular Metabolic Engineering. Microb. Cell Fact. 2019, 18, 77. [Google Scholar] [CrossRef]
- Liu, H.; Fang, G.; Wu, H.; Li, Z.; Ye, Q. L-Cysteine Production in Escherichia Coli Based on Rational Metabolic Engineering and Modular Strategy. Biotechnol. J. 2018, 13, 1700695. [Google Scholar] [CrossRef]
- Juminaga, D.; Baidoo, E.E.K.; Redding-Johanson, A.M.; Batth, T.S.; Burd, H.; Mukhopadhyay, A.; Petzold, C.J.; Keasling, J.D. Modular Engineering of l -Tyrosine Production in Escherichia Coli. Appl. Environ. Microbiol. 2012, 78, 89–98. [Google Scholar] [CrossRef]
- Niu, K.; Zheng, R.; Zhang, M.; Chen, M.; Kong, Y.; Liu, Z.; Zheng, Y. Adjustment of the Main Biosynthesis Modules to Enhance the Production of l -homoserine in Escherichia Coli W3110. Biotech Amp Bioeng. 2025, 122, 223–232. [Google Scholar] [CrossRef]
- Moore, L.R.; Caspi, R.; Boyd, D.; Berkmen, M.; Mackie, A.; Paley, S.; Karp, P.D. Revisiting the Y-Ome of Escherichia Coli. Nucleic Acids Res. 2024, 52, 12201–12207. [Google Scholar] [CrossRef]
- Salgado, H.; Gama-Castro, S.; Lara, P.; Mejia-Almonte, C.; Alarcón-Carranza, G.; López-Almazo, A.G.; Betancourt-Figueroa, F.; Peña-Loredo, P.; Alquicira-Hernández, S.; Ledezma-Tejeida, D.; et al. RegulonDB V12.0: A Comprehensive Resource of Transcriptional Regulation in E. Coli K-12. Nucleic Acids Res. 2024, 52, D255–D264. [Google Scholar] [CrossRef]
- Kanehisa, M.; Furumichi, M.; Sato, Y.; Matsuura, Y.; Ishiguro-Watanabe, M. KEGG: Biological Systems Database as a Model of the Real World. Nucleic Acids Res. 2025, 53, D672–D677. [Google Scholar] [CrossRef]
- Karp, P.D.; Billington, R.; Caspi, R.; Fulcher, C.A.; Latendresse, M.; Kothari, A.; Keseler, I.M.; Krummenacker, M.; Midford, P.E.; Ong, Q.; et al. The BioCyc Collection of Microbial Genomes and Metabolic Pathways. Brief. Bioinform. 2019, 20, 1085–1093. [Google Scholar] [CrossRef]
- Chang, A.; Jeske, L.; Ulbrich, S.; Hofmann, J.; Koblitz, J.; Schomburg, I.; Neumann-Schaal, M.; Jahn, D.; Schomburg, D. BRENDA, the ELIXIR Core Data Resource in 2021: New Developments and Updates. Nucleic Acids Res. 2021, 49, D498–D508. [Google Scholar] [CrossRef]
- Nielsen, J.; Keasling, J.D. Engineering Cellular Metabolism. Cell 2016, 164, 1185–1197. [Google Scholar] [CrossRef]
- Winkler, J.D.; Halweg-Edwards, A.L.; Gill, R.T. The LASER Database: Formalizing Design Rules for Metabolic Engineering. Metab. Eng. Commun. 2015, 2, 30–38. [Google Scholar] [CrossRef]
- Good, I.J. THE POPULATION FREQUENCIES OF SPECIES AND THE ESTIMATION OF POPULATION PARAMETERS. Biometrika 1953, 40, 237–264. [Google Scholar] [CrossRef]
- Ramos-Valdovinos, M.A.; Martínez-Antonio, A. Optimizing Fermentation Strategies for Enhanced Tryptophan Production in Escherichia Coli: Integrating Genetic and Environmental Controls for Industrial Applications. Processes 2024, 12, 2422. [Google Scholar] [CrossRef]
- Liu, Q.; Cheng, Y.; Xie, X.; Xu, Q.; Chen, N. Modification of Tryptophan Transport System and Its Impact on Production of L-Tryptophan in Escherichia Coli. Bioresour. Technol. 2012, 114, 549–554. [Google Scholar] [CrossRef]
- Hoshino, T. Violacein and Related Tryptophan Metabolites Produced by Chromobacterium Violaceum: Biosynthetic Mechanism and Pathway for Construction of Violacein Core. Appl. Microbiol. Biotechnol. 2011, 91, 1463–1475. [Google Scholar] [CrossRef]
- Park, S.; Kang, K.; Lee, S.W.; Ahn, M.-J.; Bae, J.-M.; Back, K. Production of Serotonin by Dual Expression of Tryptophan Decarboxylase and Tryptamine 5-Hydroxylase in Escherichia Coli. Appl. Microbiol. Biotechnol. 2011, 89, 1387–1394. [Google Scholar] [CrossRef]
- Park, M.; Kang, K.; Park, S.; Back, K. Conversion of 5-Hydroxytryptophan into Serotonin by Tryptophan Decarboxylase in Plants, Escherichia Coli, and Yeast. Biosci. Biotechnol. Biochem. 2008, 72, 2456–2458. [Google Scholar] [CrossRef]
- Guo, C.; Luu, N.N.T.; Adwer, M.M.; Hosseinzadeh, H.; Balan, V.; Yan, Y.; Lin, Y. Engineering Artificial Biosynthetic Pathways for Efficient Microbial Production of Psilocybin and Psilocin. Metab. Eng. 2026, 94, 24–34. [Google Scholar] [CrossRef]
- Xu, D.; Fang, M.; Wang, H.; Huang, L.; Xu, Q.; Xu, Z. Enhanced Production of 5-Hydroxytryptophan through the Regulation of L-Tryptophan Biosynthetic Pathway. Appl. Microbiol. Biotechnol. 2020, 104, 2481–2488. [Google Scholar] [CrossRef]
- Zhang, Z.; Yu, Z.; Wang, J.; Yu, Y.; Li, L.; Sun, P.; Fan, X.; Xu, Q. Metabolic Engineering of Escherichia Coli for Efficient Production of L-5-Hydroxytryptophan from Glucose. Microb. Cell Fact. 2022, 21, 198. [Google Scholar] [CrossRef]
- Mora-Villalobos, J.-A.; Zeng, A.-P. Synthetic Pathways and Processes for Effective Production of 5-Hydroxytryptophan and Serotonin from Glucose in Escherichia Coli. J. Biol. Eng. 2018, 12, 3. [Google Scholar] [CrossRef]
- Osawa, R.; Kamide, T.; Satoh, Y.; Kawano, Y.; Ohtsu, I.; Dairi, T. Heterologous and High Production of Ergothioneine in Escherichia Coli. J. Agric. Food Chem. 2018, 66, 1191–1196. [Google Scholar] [CrossRef]
- Gabor, E.; Göhler, A.-K.; Kosfeld, A.; Staab, A.; Kremling, A.; Jahreis, K. The Phosphoenolpyruvate-Dependent Glucose–Phosphotransferase System from Escherichia Coli K-12 as the Center of a Network Regulating Carbohydrate Flux in the Cell. Eur. J. Cell Biol. 2011, 90, 711–720. [Google Scholar] [CrossRef]
- Lu, N.; Zhang, B.; Cheng, L.; Wang, J.; Zhang, S.; Fu, S.; Xiao, Y.; Liu, H. Gene Modification of Escherichia Coli and Incorporation of Process Control to Decrease Acetate Accumulation and Increase ʟ-Tryptophan Production. Ann. Microbiol. 2017, 67, 567–576. [Google Scholar] [CrossRef]
- Nam, T.; Cho, S.; Shin, D.; Kim, J.; Jeong, J.; Lee, J.; Roe, J.; Peterkofsky, A.; Kang, S.; Ryu, S.; et al. The Escherichia Coli Glucose Transporter Enzyme IICBGlc Recruits the Global Repressor Mlc. EMBO J. 2001, 20, 491–498. [Google Scholar] [CrossRef]
- Kay, W.W.; Gronlund, A.F. Amino Acid Transport in Pseudomonas Aeruginosa. J. Bacteriol. 1969, 97, 273–281. [Google Scholar] [CrossRef]
- Xiu, Z.-L.; Zeng, A.-P.; Deckwer, W.-D. Model Analysis Concerning the Effects of Growth Rate and Intracellular Tryptophan Level on the Stability and Dynamics of Tryptophan Biosynthesis in Bacteria. J. Biotechnol. 1997, 58, 125–140. [Google Scholar] [CrossRef]
- Ping, J.; Wang, L.; Qin, Z.; Zhou, Z.; Zhou, J. Synergetic Engineering of Escherichia Coli for Efficient Production of L-Tyrosine. Synth. Syst. Biotechnol. 2023, 8, 724–731. [Google Scholar] [CrossRef]
- Yakandawala, N.; Romeo, T.; Friesen, A.D.; Madhyastha, S. Metabolic Engineering of Escherichia Coli to Enhance Phenylalanine Production. Appl. Microbiol. Biotechnol. 2008, 78, 283–291. [Google Scholar] [CrossRef]
- Shen, T.; Liu, Q.; Xie, X.; Xu, Q.; Chen, N. Improved Production of Tryptophan in Genetically Engineered Escherichia Coli with TktA and PpsA Overexpression. J. Biomed. Biotechnol. 2012, 2012, 1–8. [Google Scholar] [CrossRef]
- Liu, S.; Wang, B.-B.; Xu, J.-Z.; Zhang, W.-G. Engineering of Shikimate Pathway and Terminal Branch for Efficient Production of L-Tryptophan in Escherichia Coli. IJMS 2023, 24, 11866. [Google Scholar] [CrossRef]
- Yang, F.; Liao, Y.; Zhao, Z.; Cai, M.; You, J.; Qiao, Z.; Xu, M.; Rao, Z. Development of Escherichia Coli by Combining Channel Engineering and Energy Engineering for the Production of L-Histidine. Chem. Eng. J. 2025, 520, 165521. [Google Scholar] [CrossRef]
- Dai, J.; Geng, M.; Du, Y.; Iqbal, M.W.; Yang, H.; Shen, X.; Wang, J.; Sun, X.; Yuan, Q. Microbial Synthesis of Nucleosides: Advances and Prospects. ACS Synth. Biol. 2025, 14, 1–9. [Google Scholar] [CrossRef]
- Huang, J.; Liu, Z.; Jin, L.; Tang, X.; Shen, Z.; Yin, H.; Zheng, Y. Metabolic Engineering of Escherichia Coli for Microbial Production of L-methionine. Biotech Bioeng. 2017, 114, 843–851. [Google Scholar] [CrossRef]
- Wei, T.; Cheng, B.-Y.; Liu, J.-Z. Genome Engineering Escherichia Coli for L-DOPA Overproduction from Glucose. Sci. Rep. 2016, 6, 30080. [Google Scholar] [CrossRef]
- Fortunato, S.; Castellano, C. Community Structure in Graphs 2007. [CrossRef]
- Jung, H.; Han, J.; Oh, M. Improved Production of 2,3-butanediol and Isobutanol by Engineering Electron Transport Chain in Escherichia Coli. Microb. Biotechnol. 2021, 14, 213–226. [Google Scholar] [CrossRef]
- Li, X.; Yu, W.; Guo, B.; Lang, X.; Xu, X.; Liu, Y.; Li, J.; Du, G.; Lv, X.; Liu, L. Metabolic Engineering of Escherichia Coli for Biosynthesis of Inosinic Acid. Syst. Microbiol. Biomanuf 2025, 5, 1609–1621. [Google Scholar] [CrossRef]
- Li, Z.; Ding, D.; Wang, H.; Liu, L.; Fang, H.; Chen, T.; Zhang, D. Engineering Escherichia Coli to Improve Tryptophan Production via Genetic Manipulation of Precursor and Cofactor Pathways. Synth. Syst. Biotechnol. 2020, 5, 200–205. [Google Scholar] [CrossRef]
- Ebrahim, A.; Lerman, J.A.; Palsson, B.O.; Hyduke, D.R. COBRApy: COnstraints-Based Reconstruction and Analysis for Python. BMC Syst. Biol. 2013, 7, 74. [Google Scholar] [CrossRef]
- LLC Gurobi Optimization Gurobi Optimizer Reference Manual 2023.
- Hagberg, A.; Swart, P.J.; Schult, D.A. Exploring Network Structure, Dynamics, and Function Using NetworkX; Los Alamos National Laboratory (LANL): Los Alamos, NM (United States), January 2008. [Google Scholar]
- Blondel, V.D.; Guillaume, J.-L.; Lambiotte, R.; Lefebvre, E. Fast Unfolding of Communities in Large Networks. J. Stat. Mech. 2008, 2008, P10008. [Google Scholar] [CrossRef]
- Seabold, S.; Perktold, J. Statsmodels Econom. Stat. Model. With Python 2010, 92–96.
- Buitinck, L.; Louppe, G.; Blondel, M.; Pedregosa, F.; Mueller, A.; Grisel, O.; Niculae, V.; Prettenhofer, P.; Gramfort, A.; Grobler, J.; et al. API Design for Machine Learning Software: Experiences from the Scikit-Learn Project. 2013. [Google Scholar] [CrossRef]
- Vo, T.M.; Park, S. Metabolic Engineering of Escherichia Coli W3110 for Efficient Production of Homoserine from Glucose. Metab. Eng. 2022, 73, 104–113. [Google Scholar] [CrossRef]
- Gu, P.; Yang, F.; Su, T.; Li, F.; Li, Y.; Qi, Q. Construction of an l -Serine Producing Escherichia Coli via Metabolic Engineering. J. Ind. Microbiol. Biotechnol. 2014, 41, 1443–1450. [Google Scholar] [CrossRef]
- Xiong, B.; Zhu, Y.; Tian, D.; Jiang, S.; Fan, X.; Ma, Q.; Wu, H.; Xie, X. Flux Redistribution of Central Carbon Metabolism for Efficient Production of l -tryptophan in Escherichia Coli. Biotech Bioeng. 2021, 118, 1393–1404. [Google Scholar] [CrossRef]
- Saini, M.; Wang, Z.W.; Chiang, C.-J.; Chao, Y.-P. Metabolic Engineering of Escherichia Coli for Production of Butyric Acid. J. Agric. Food Chem. 2014, 62, 4342–4348. [Google Scholar] [CrossRef]
- Gu, P.; Yang, F.; Kang, J.; Wang, Q.; Qi, Q. One-Step of Tryptophan Attenuator Inactivation and Promoter Swapping to Improve the Production of L-Tryptophan in Escherichia Coli. Microb. Cell Fact. 2012, 11, 30. [Google Scholar] [CrossRef]
- Zhang, S.; Yang, W.; Chen, H.; Liu, B.; Lin, B.; Tao, Y. Metabolic Engineering for Efficient Supply of Acetyl-CoA from Different Carbon Sources in Escherichia Coli. Microb. Cell Fact. 2019, 18, 130. [Google Scholar] [CrossRef]
- Sanders, H.L. Marine Benthic Diversity: A Comparative Study. Am. Nat. 1968, 102, 243–282. [Google Scholar] [CrossRef]
- Chao, A. Nonparametric Estimation of the Number of Classes in a Population. Scand. J. Stat. 1984, 11, 265–270. [Google Scholar]
- Lee, S.-M.; Chao, A. Estimating Population Size Via Sample Coverage for Closed Capture-Recapture Models. Biometrics 1994, 50, 88. [Google Scholar] [CrossRef]
- Chao, A.; Bunge, J. Estimating the Number of Species in a Stochastic Abundance Model. Biometrics 2002, 58, 531–539. [Google Scholar] [CrossRef]
- Quenouille, M.H. Notes on Bias in Estimation. Biometrika 1956, 43, 353. [Google Scholar] [CrossRef]
- Neuhäuser, M. Permutation Tests. In International Encyclopedia of Statistical Science; Lovric, M., Ed.; Springer Berlin Heidelberg: Berlin, Heidelberg, 2025; pp. 1891–1893. ISBN 978-3-662-69358-2. [Google Scholar]
- Strona, G.; Nappo, D.; Boccacci, F.; Fattorini, S.; San-Miguel-Ayanz, J. A Fast and Unbiased Procedure to Randomize Ecological Binary Matrices with Fixed Row and Column Totals. Nat. Commun. 2014, 5, 4114. [Google Scholar] [CrossRef]
- Harris, C.R.; Millman, K.J.; Van Der Walt, S.J.; Gommers, R.; Virtanen, P.; Cournapeau, D.; Wieser, E.; Taylor, J.; Berg, S.; Smith, N.J.; et al. Array Programming with NumPy. Nature 2020, 585, 357–362. [Google Scholar] [CrossRef]
- Monk, J.M.; Lloyd, C.J.; Brunk, E.; Mih, N.; Sastry, A.; King, Z.; Takeuchi, R.; Nomura, W.; Zhang, Z.; Mori, H.; et al. iML1515, a Knowledgebase That Computes Escherichia Coli Traits. Nat. Biotechnol. 2017, 35, 904–908. [Google Scholar] [CrossRef]
- King, Z.A.; Lu, J.; Dräger, A.; Miller, P.; Federowicz, S.; Lerman, J.A.; Ebrahim, A.; Palsson, B.O.; Lewis, N.E. BiGG Models: A Platform for Integrating, Standardizing and Sharing Genome-Scale Models. Nucleic Acids Res. 2016, 44, D515–D522. [Google Scholar] [CrossRef]
- Virtanen, P.; Gommers, R.; Oliphant, T.E.; Haberland, M.; Reddy, T.; Cournapeau, D.; Burovski, E.; Peterson, P.; Weckesser, W.; Bright, J.; et al. SciPy 1.0: Fundamental Algorithms for Scientific Computing in Python. Nat. Methods 2020, 17, 261–272. [Google Scholar] [CrossRef]
- Rousseeuw, P.J. Silhouettes: A Graphical Aid to the Interpretation and Validation of Cluster Analysis. J. Comput. Appl. Math. 1987, 20, 53–65. [Google Scholar] [CrossRef]
- Ramos-Valdovinos, M.A.; Martínez-Antonio, A. EraGene Cypher Dataset 2026.
- Mundhada, H.; Seoane, J.M.; Schneider, K.; Koza, A.; Christensen, H.B.; Klein, T.; Phaneuf, P.V.; Herrgard, M.; Feist, A.M.; Nielsen, A.T. Increased Production of L-Serine in Escherichia Coli through Adaptive Laboratory Evolution. Metab. Eng. 2017, 39, 141–150. [Google Scholar] [CrossRef]
- Caspi, R.; Billington, R.; Ferrer, L.; Foerster, H.; Fulcher, C.A.; Keseler, I.M.; Kothari, A.; Krummenacker, M.; Latendresse, M.; Mueller, L.A.; et al. The MetaCyc Database of Metabolic Pathways and Enzymes and the BioCyc Collection of Pathway/Genome Databases. Nucleic Acids Res. 2016, 44, D471–D480. [Google Scholar] [CrossRef]
- Du, L.; Zhang, Z.; Xu, Q.; Chen, N. Central Metabolic Pathway Modification to Improve L-Tryptophan Production in Escherichia Coli. Bioengineered 2019, 10, 59–70. [Google Scholar] [CrossRef]
- Page, M.J.; McKenzie, J.E.; Bossuyt, P.M.; Boutron, I.; Hoffmann, T.C.; Mulrow, C.D.; Shamseer, L.; Tetzlaff, J.M.; Akl, E.A.; Brennan, S.E.; et al. Declaración PRISMA 2020: una guía actualizada para la publicación de revisiones sistemáticas. Rev. Española De Cardiol. 2021, 74, 790–799. [Google Scholar] [CrossRef]
Figure 1.
Distribution of engineered reactions associated with metabolite overproduction from glucose. (a) Number of engineered reactions grouped by the number of metabolites they affect. (b) Cumulative count of modifications, calculated as the number of metabolites affected by each reaction multiplied by the number of reactions.
Figure 1.
Distribution of engineered reactions associated with metabolite overproduction from glucose. (a) Number of engineered reactions grouped by the number of metabolites they affect. (b) Cumulative count of modifications, calculated as the number of metabolites affected by each reaction multiplied by the number of reactions.
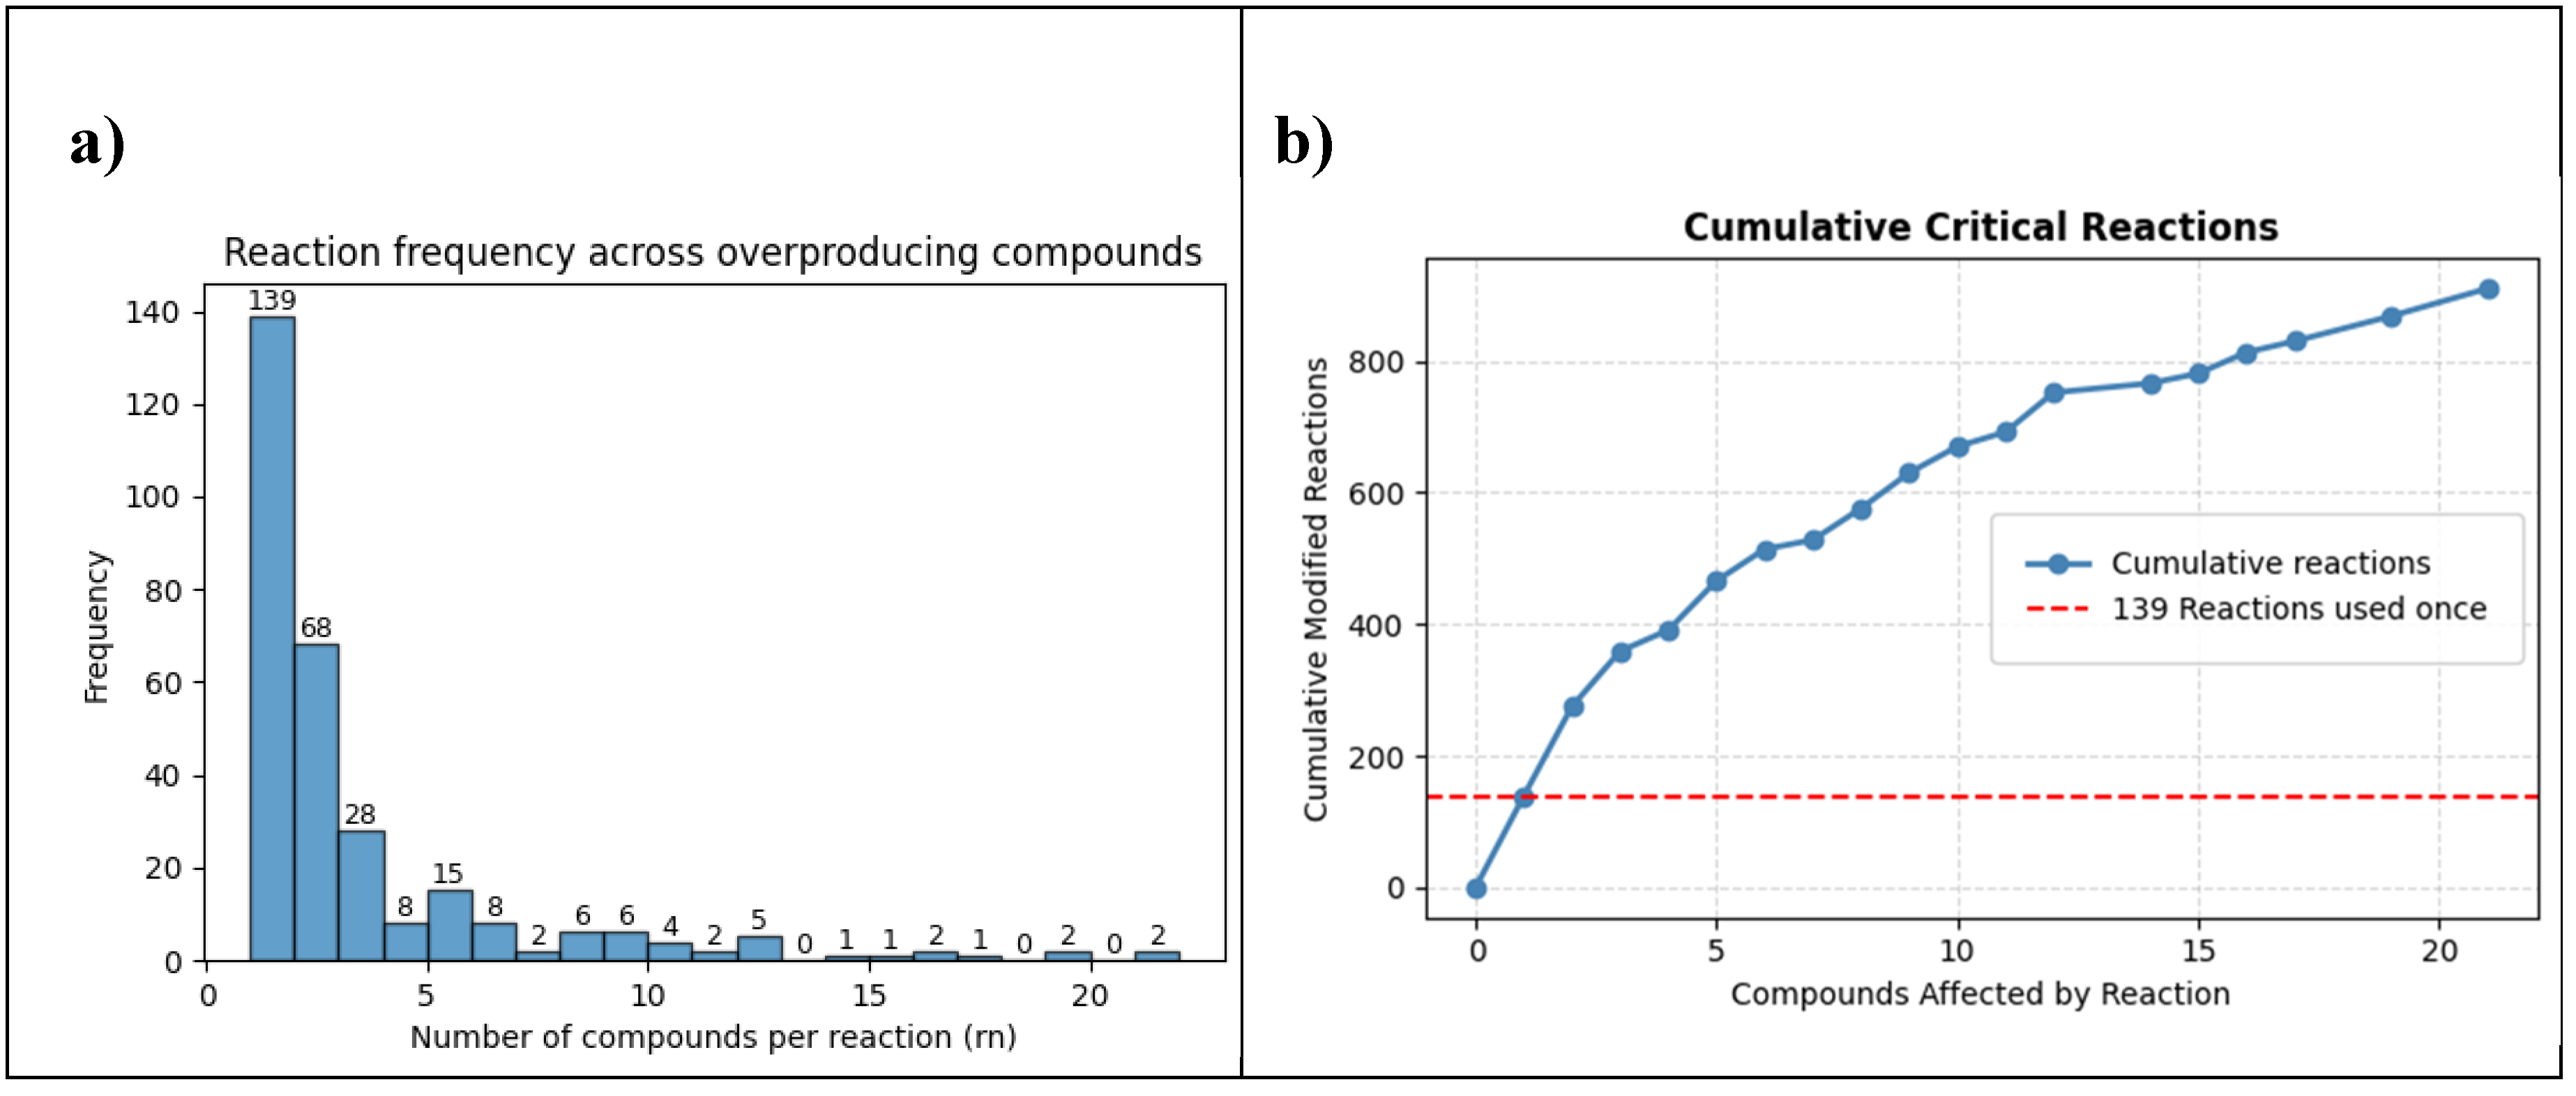
Figure 2.
Rarefaction curve of engineered reactions. Each sample reflects the sequential addition of a metabolite to the database; the y-axis represents the cumulative number of reactions identified as modulating its production.
Figure 2.
Rarefaction curve of engineered reactions. Each sample reflects the sequential addition of a metabolite to the database; the y-axis represents the cumulative number of reactions identified as modulating its production.
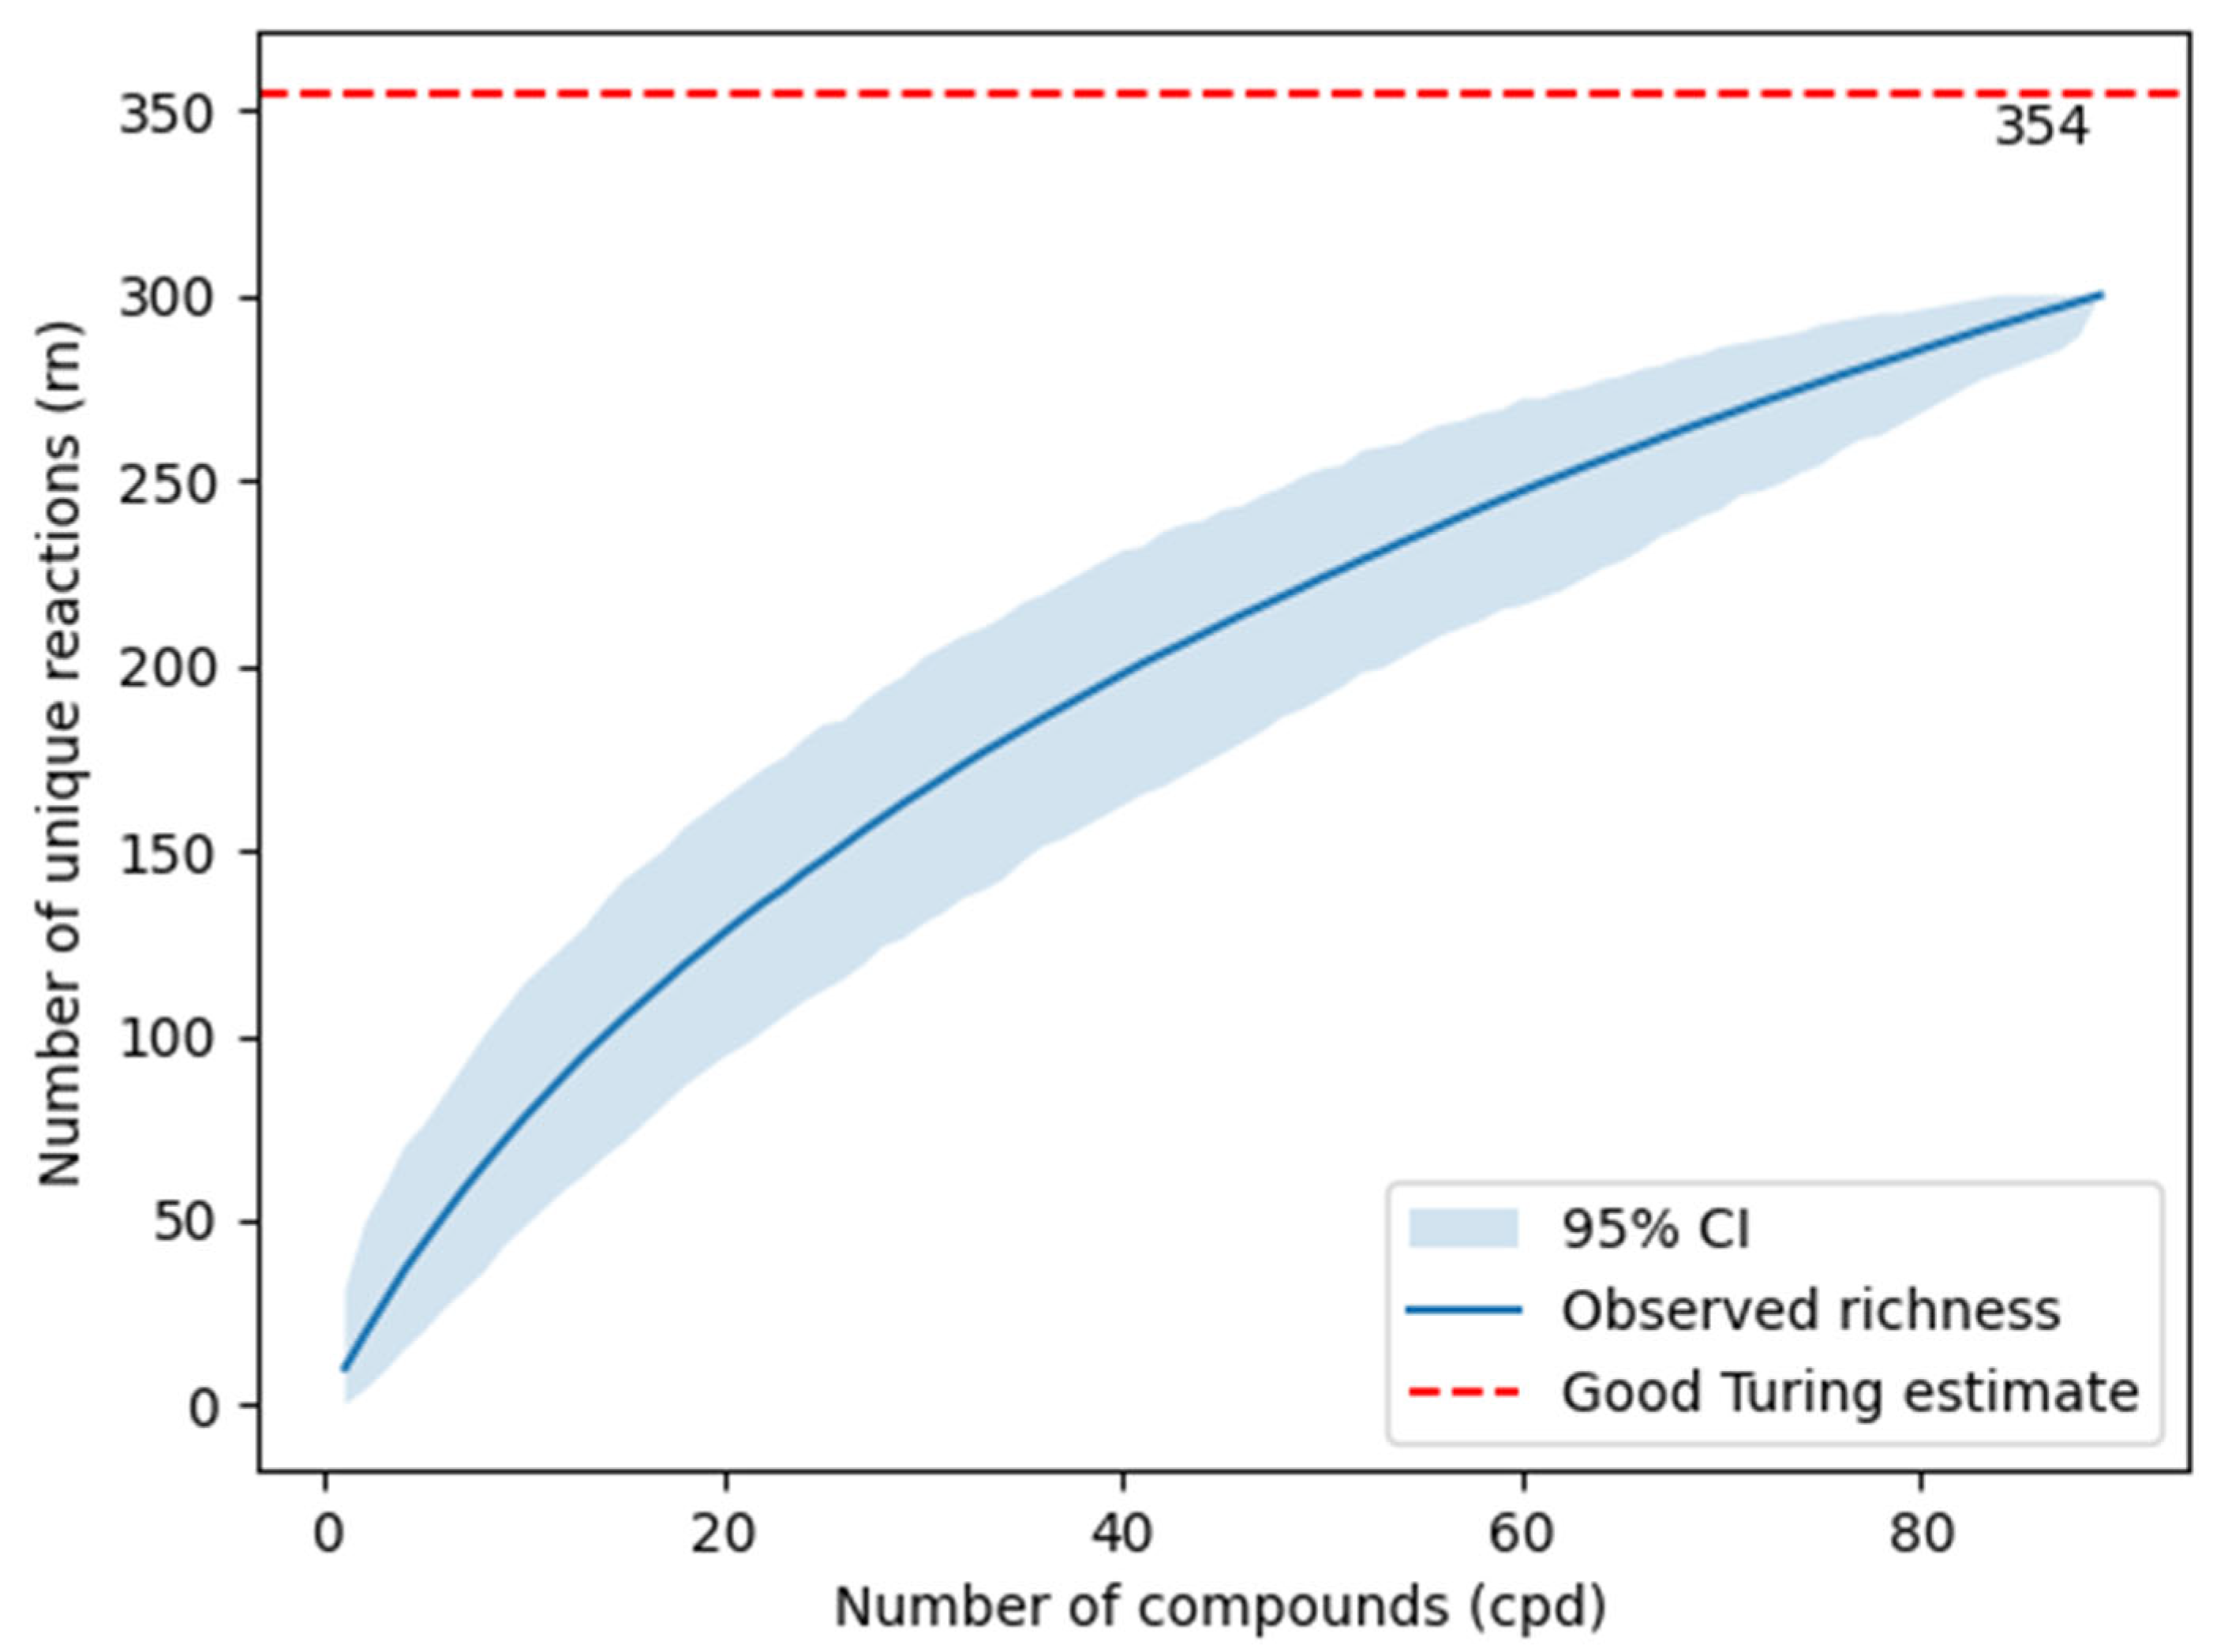
Figure 3.
Frequency of engineered reactions for metabolite overproduction. The number of genetic interventions varied widely among strains engineered to produce different metabolites.
Figure 3.
Frequency of engineered reactions for metabolite overproduction. The number of genetic interventions varied widely among strains engineered to produce different metabolites.
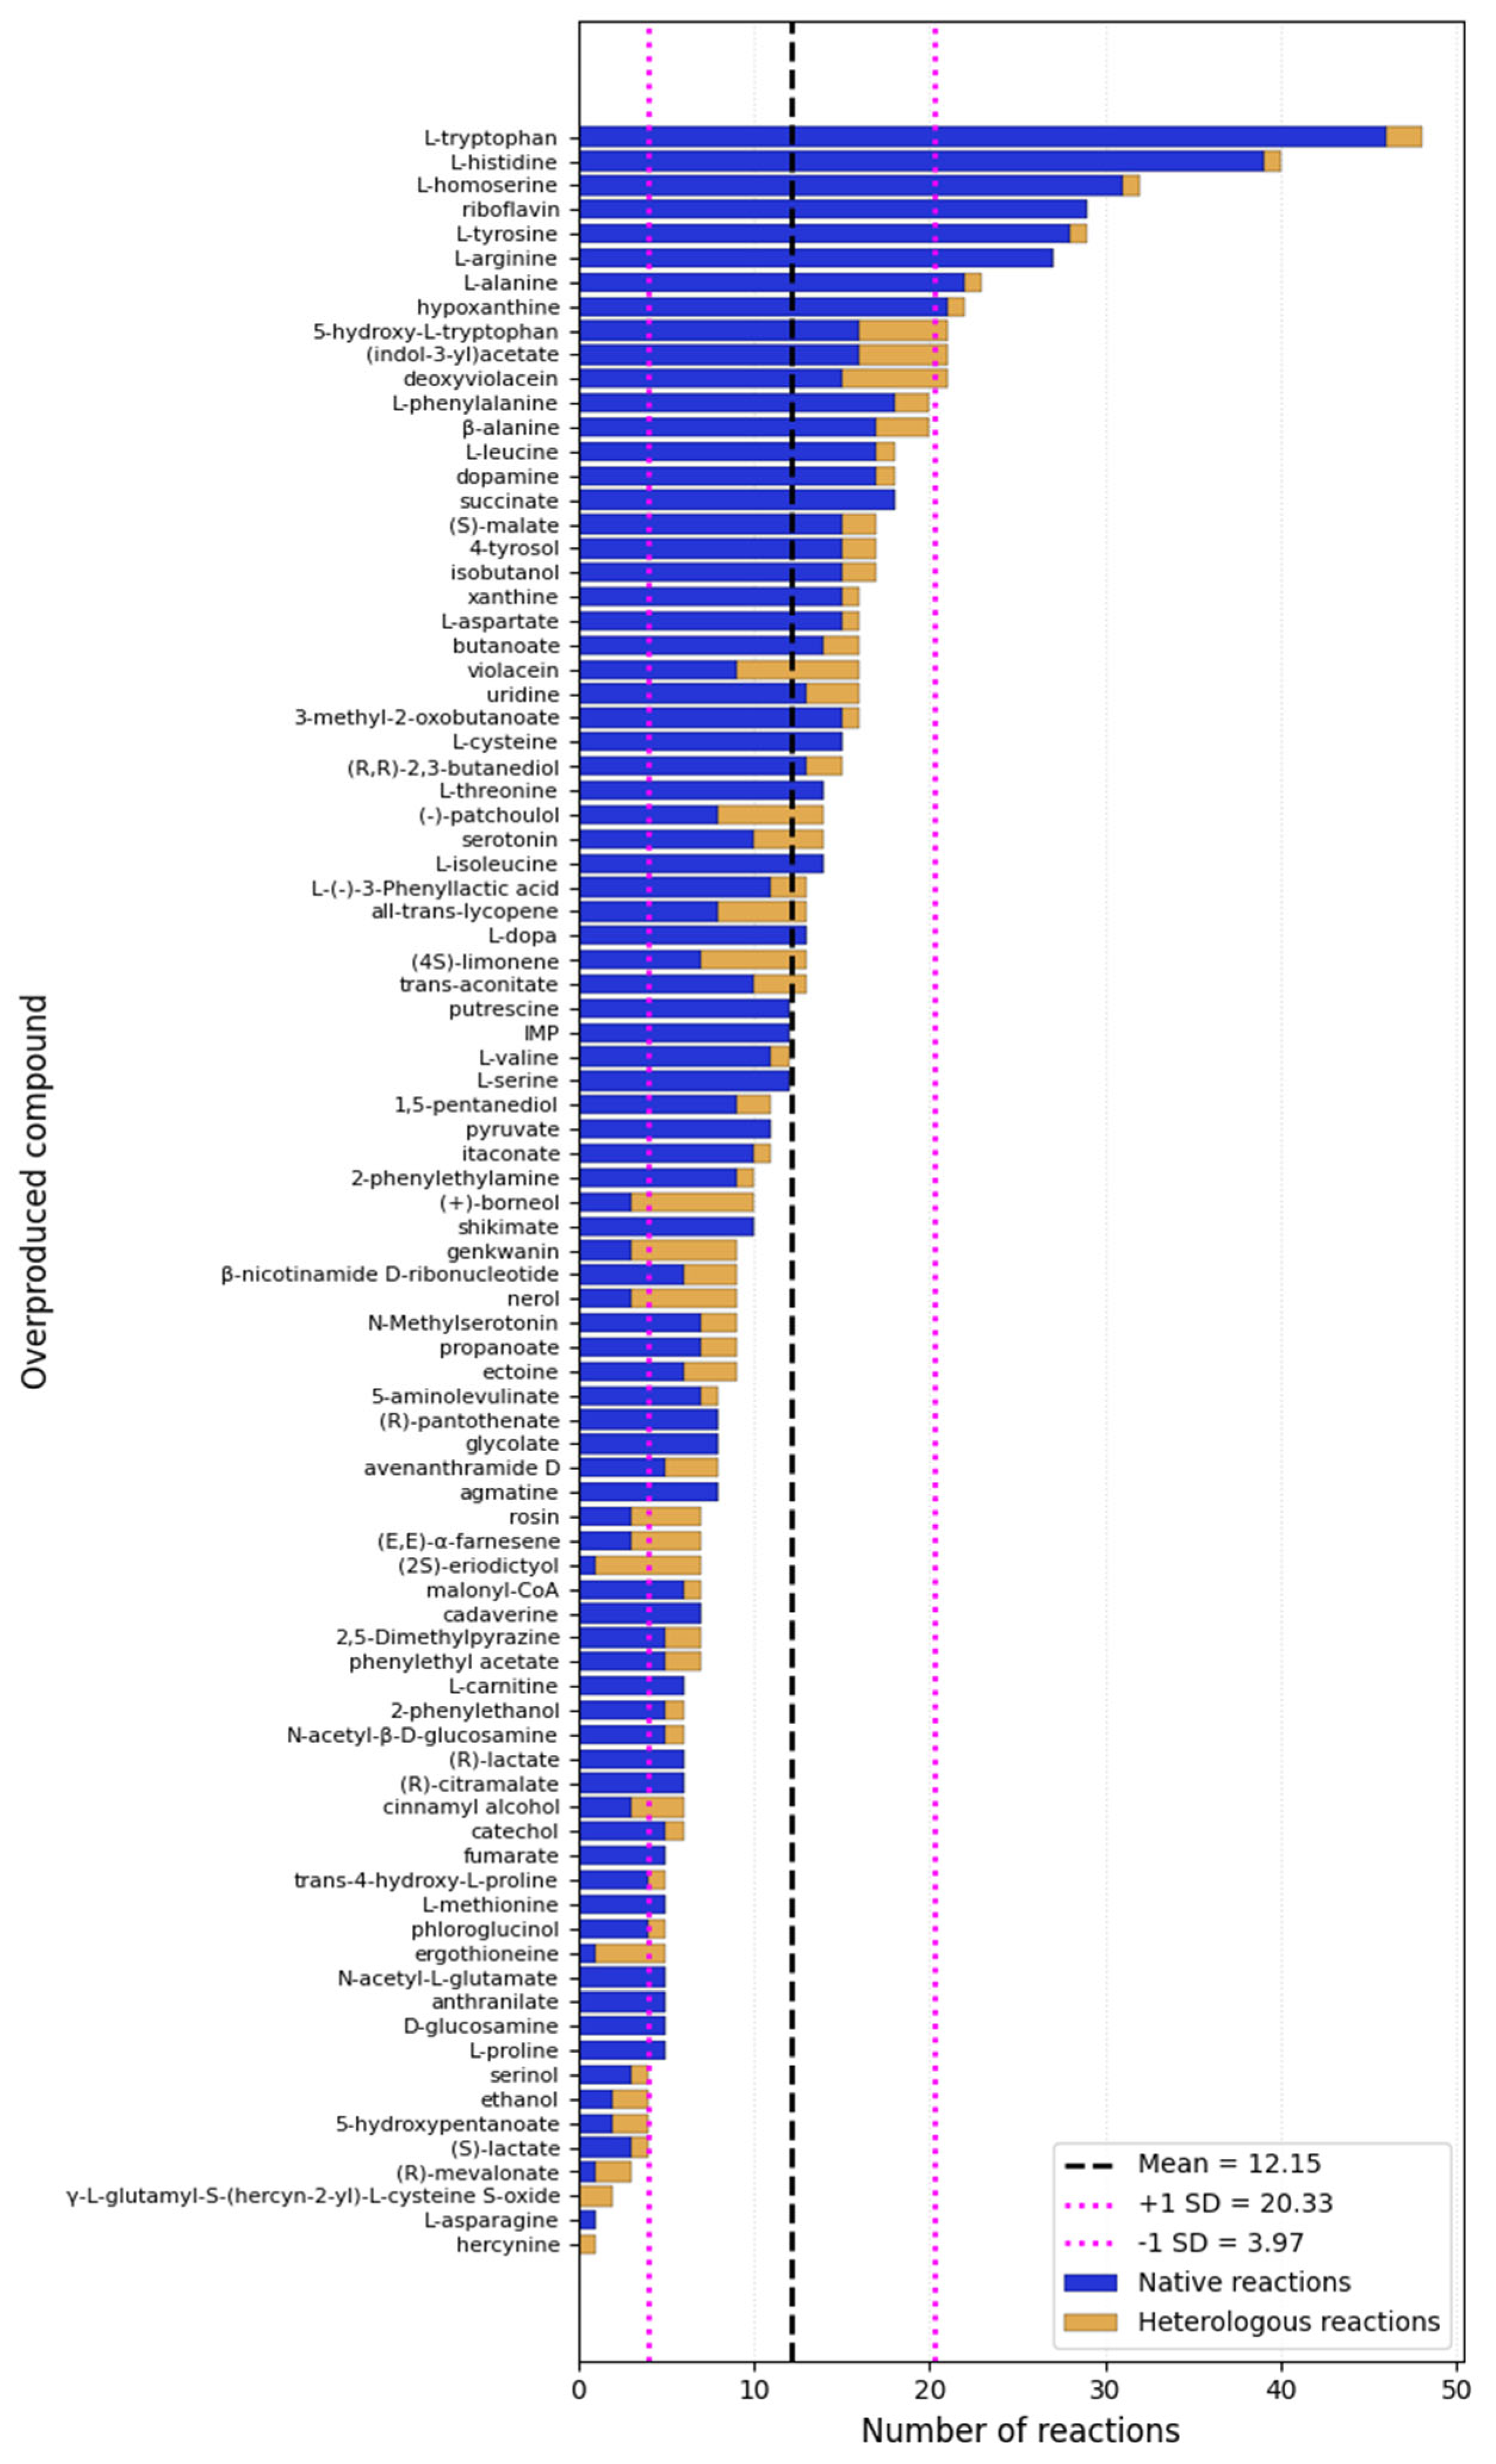
Figure 4.
Schematic representation of the identification of common engineering targets in metabolic networks using the EraGene database. The figure shows the Escherichia coli metabolic network as gray bars, with colored lines indicating specific metabolic pathways and circles denoting individual enzymatic reactions. EraGene highlights experimentally validated reactions in yellow. These engineered reactions, which strongly influence metabolic flux and product yield, include central nodes of carbon metabolism, biosynthetic steps, and transport processes. When analyzing the biosynthetic route of a new target metabolite (blue bars), this curated information supports selecting regulatory targets by narrowing the set of candidate reactions for genetic modification and reducing experimental validation effort.
Figure 4.
Schematic representation of the identification of common engineering targets in metabolic networks using the EraGene database. The figure shows the Escherichia coli metabolic network as gray bars, with colored lines indicating specific metabolic pathways and circles denoting individual enzymatic reactions. EraGene highlights experimentally validated reactions in yellow. These engineered reactions, which strongly influence metabolic flux and product yield, include central nodes of carbon metabolism, biosynthetic steps, and transport processes. When analyzing the biosynthetic route of a new target metabolite (blue bars), this curated information supports selecting regulatory targets by narrowing the set of candidate reactions for genetic modification and reducing experimental validation effort.
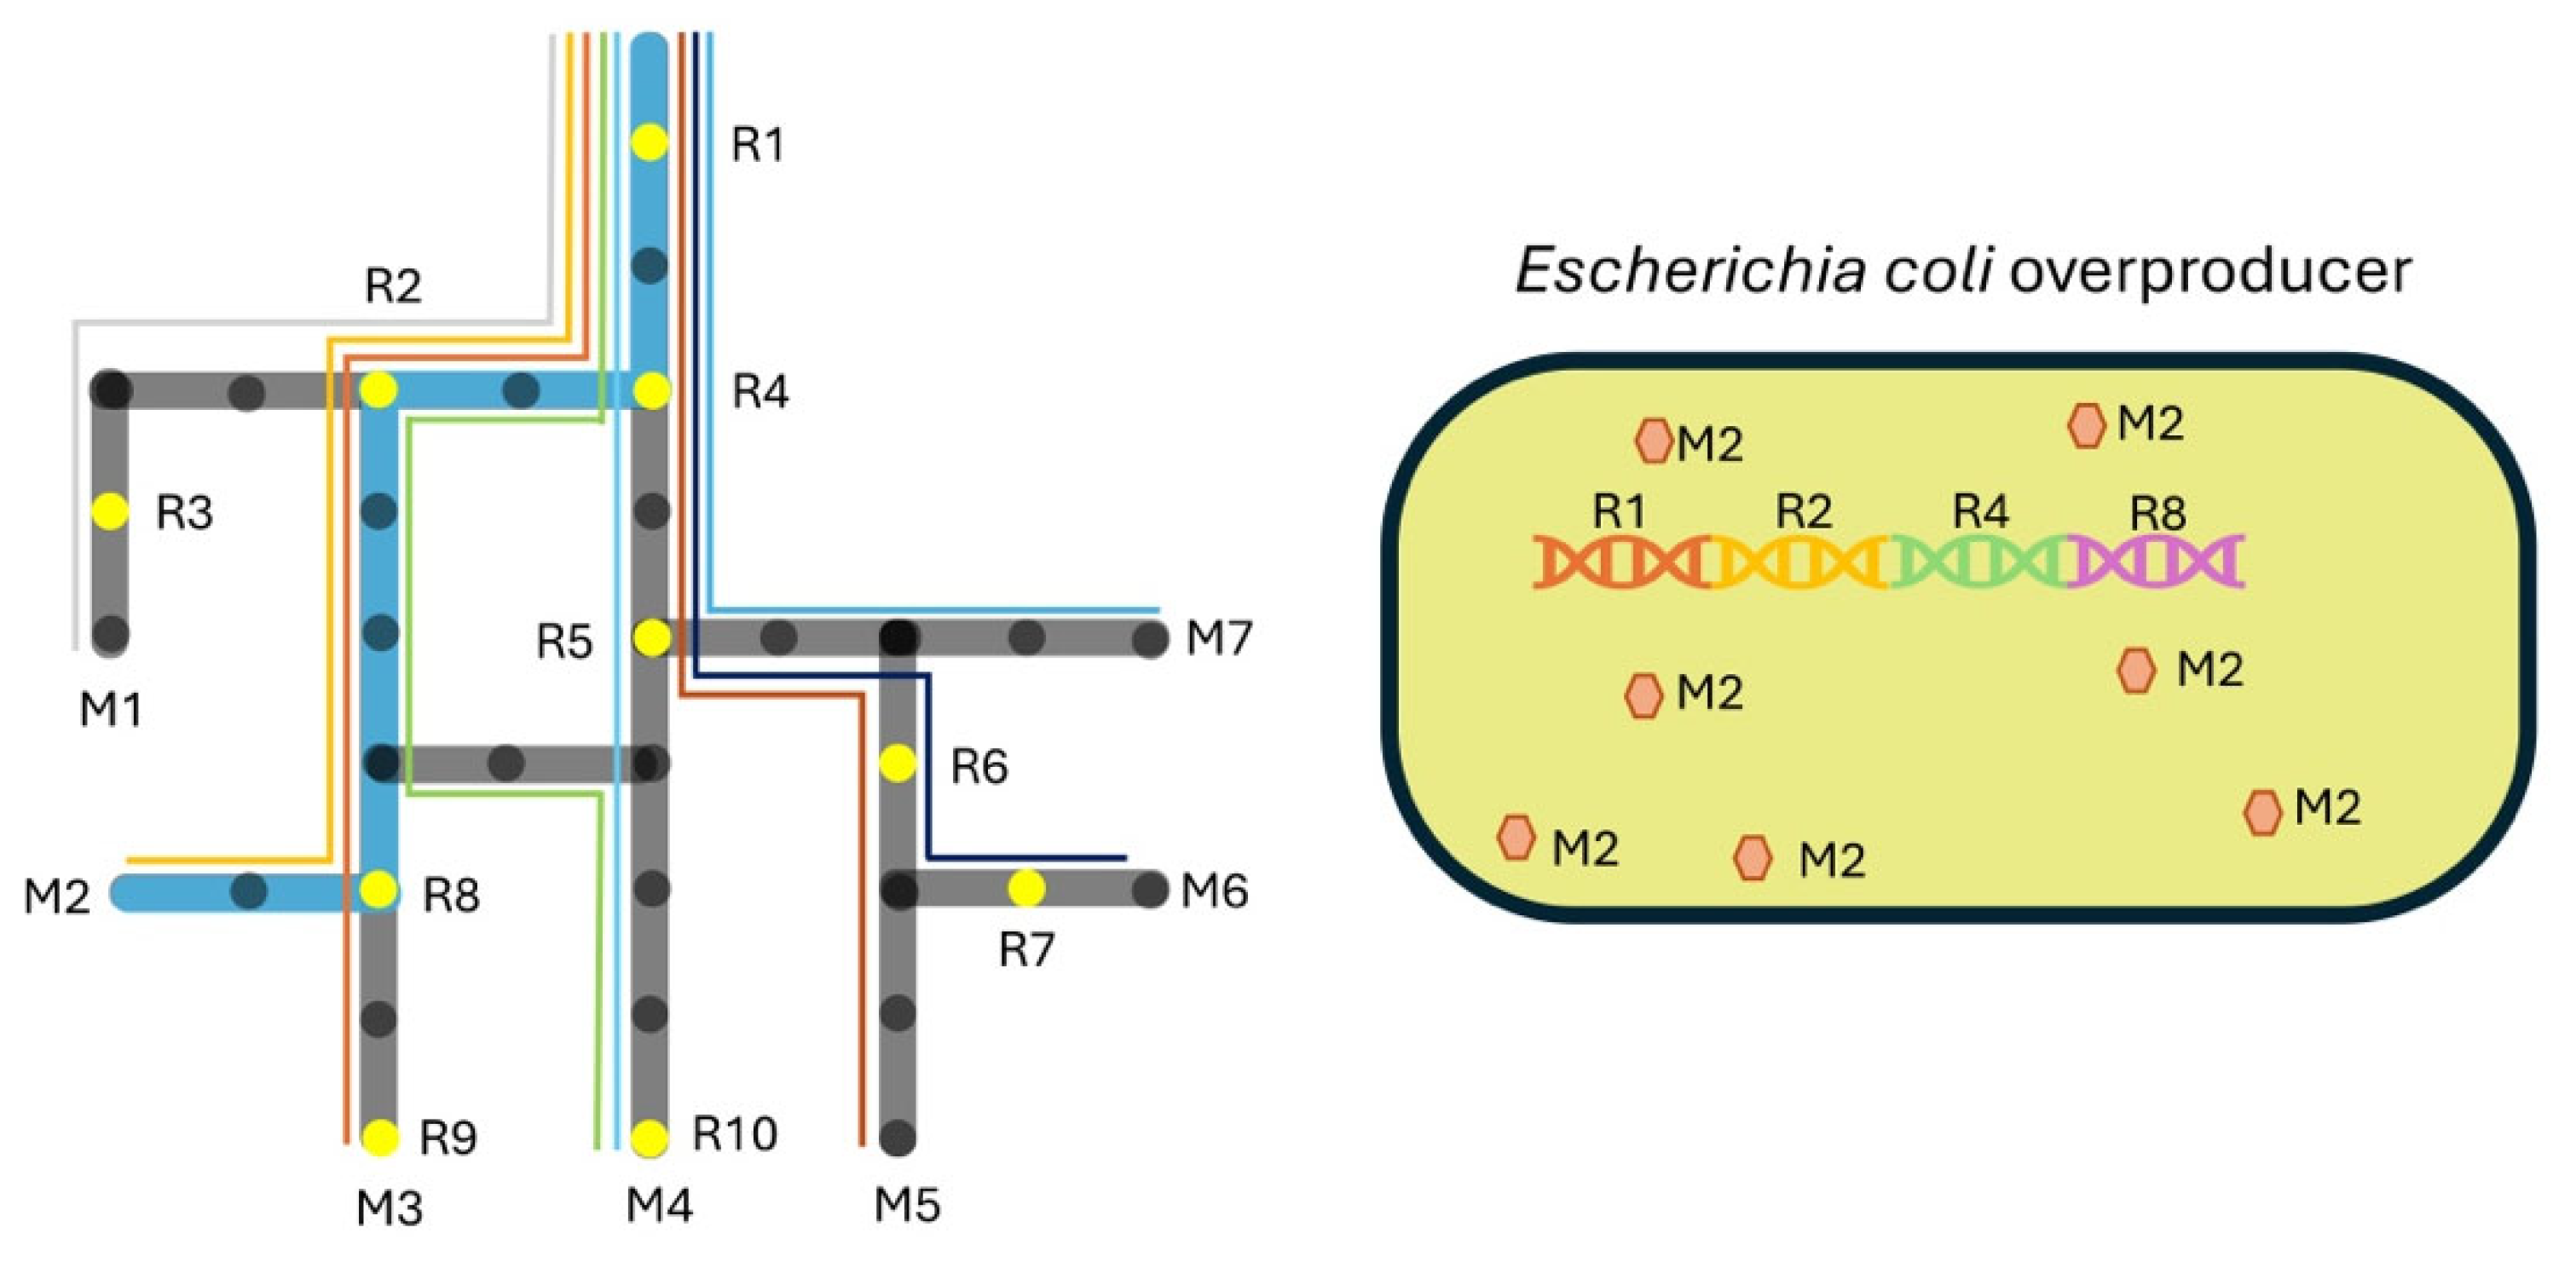
Figure 5.
Leave-one-out evaluation with random sampling and database. We performed leave-one-out analysis on 100,000 random samples of reactions from the iML1515 metabolic model (blue bars). The red line indicates the result obtained using the EraGene annotations.
Figure 5.
Leave-one-out evaluation with random sampling and database. We performed leave-one-out analysis on 100,000 random samples of reactions from the iML1515 metabolic model (blue bars). The red line indicates the result obtained using the EraGene annotations.
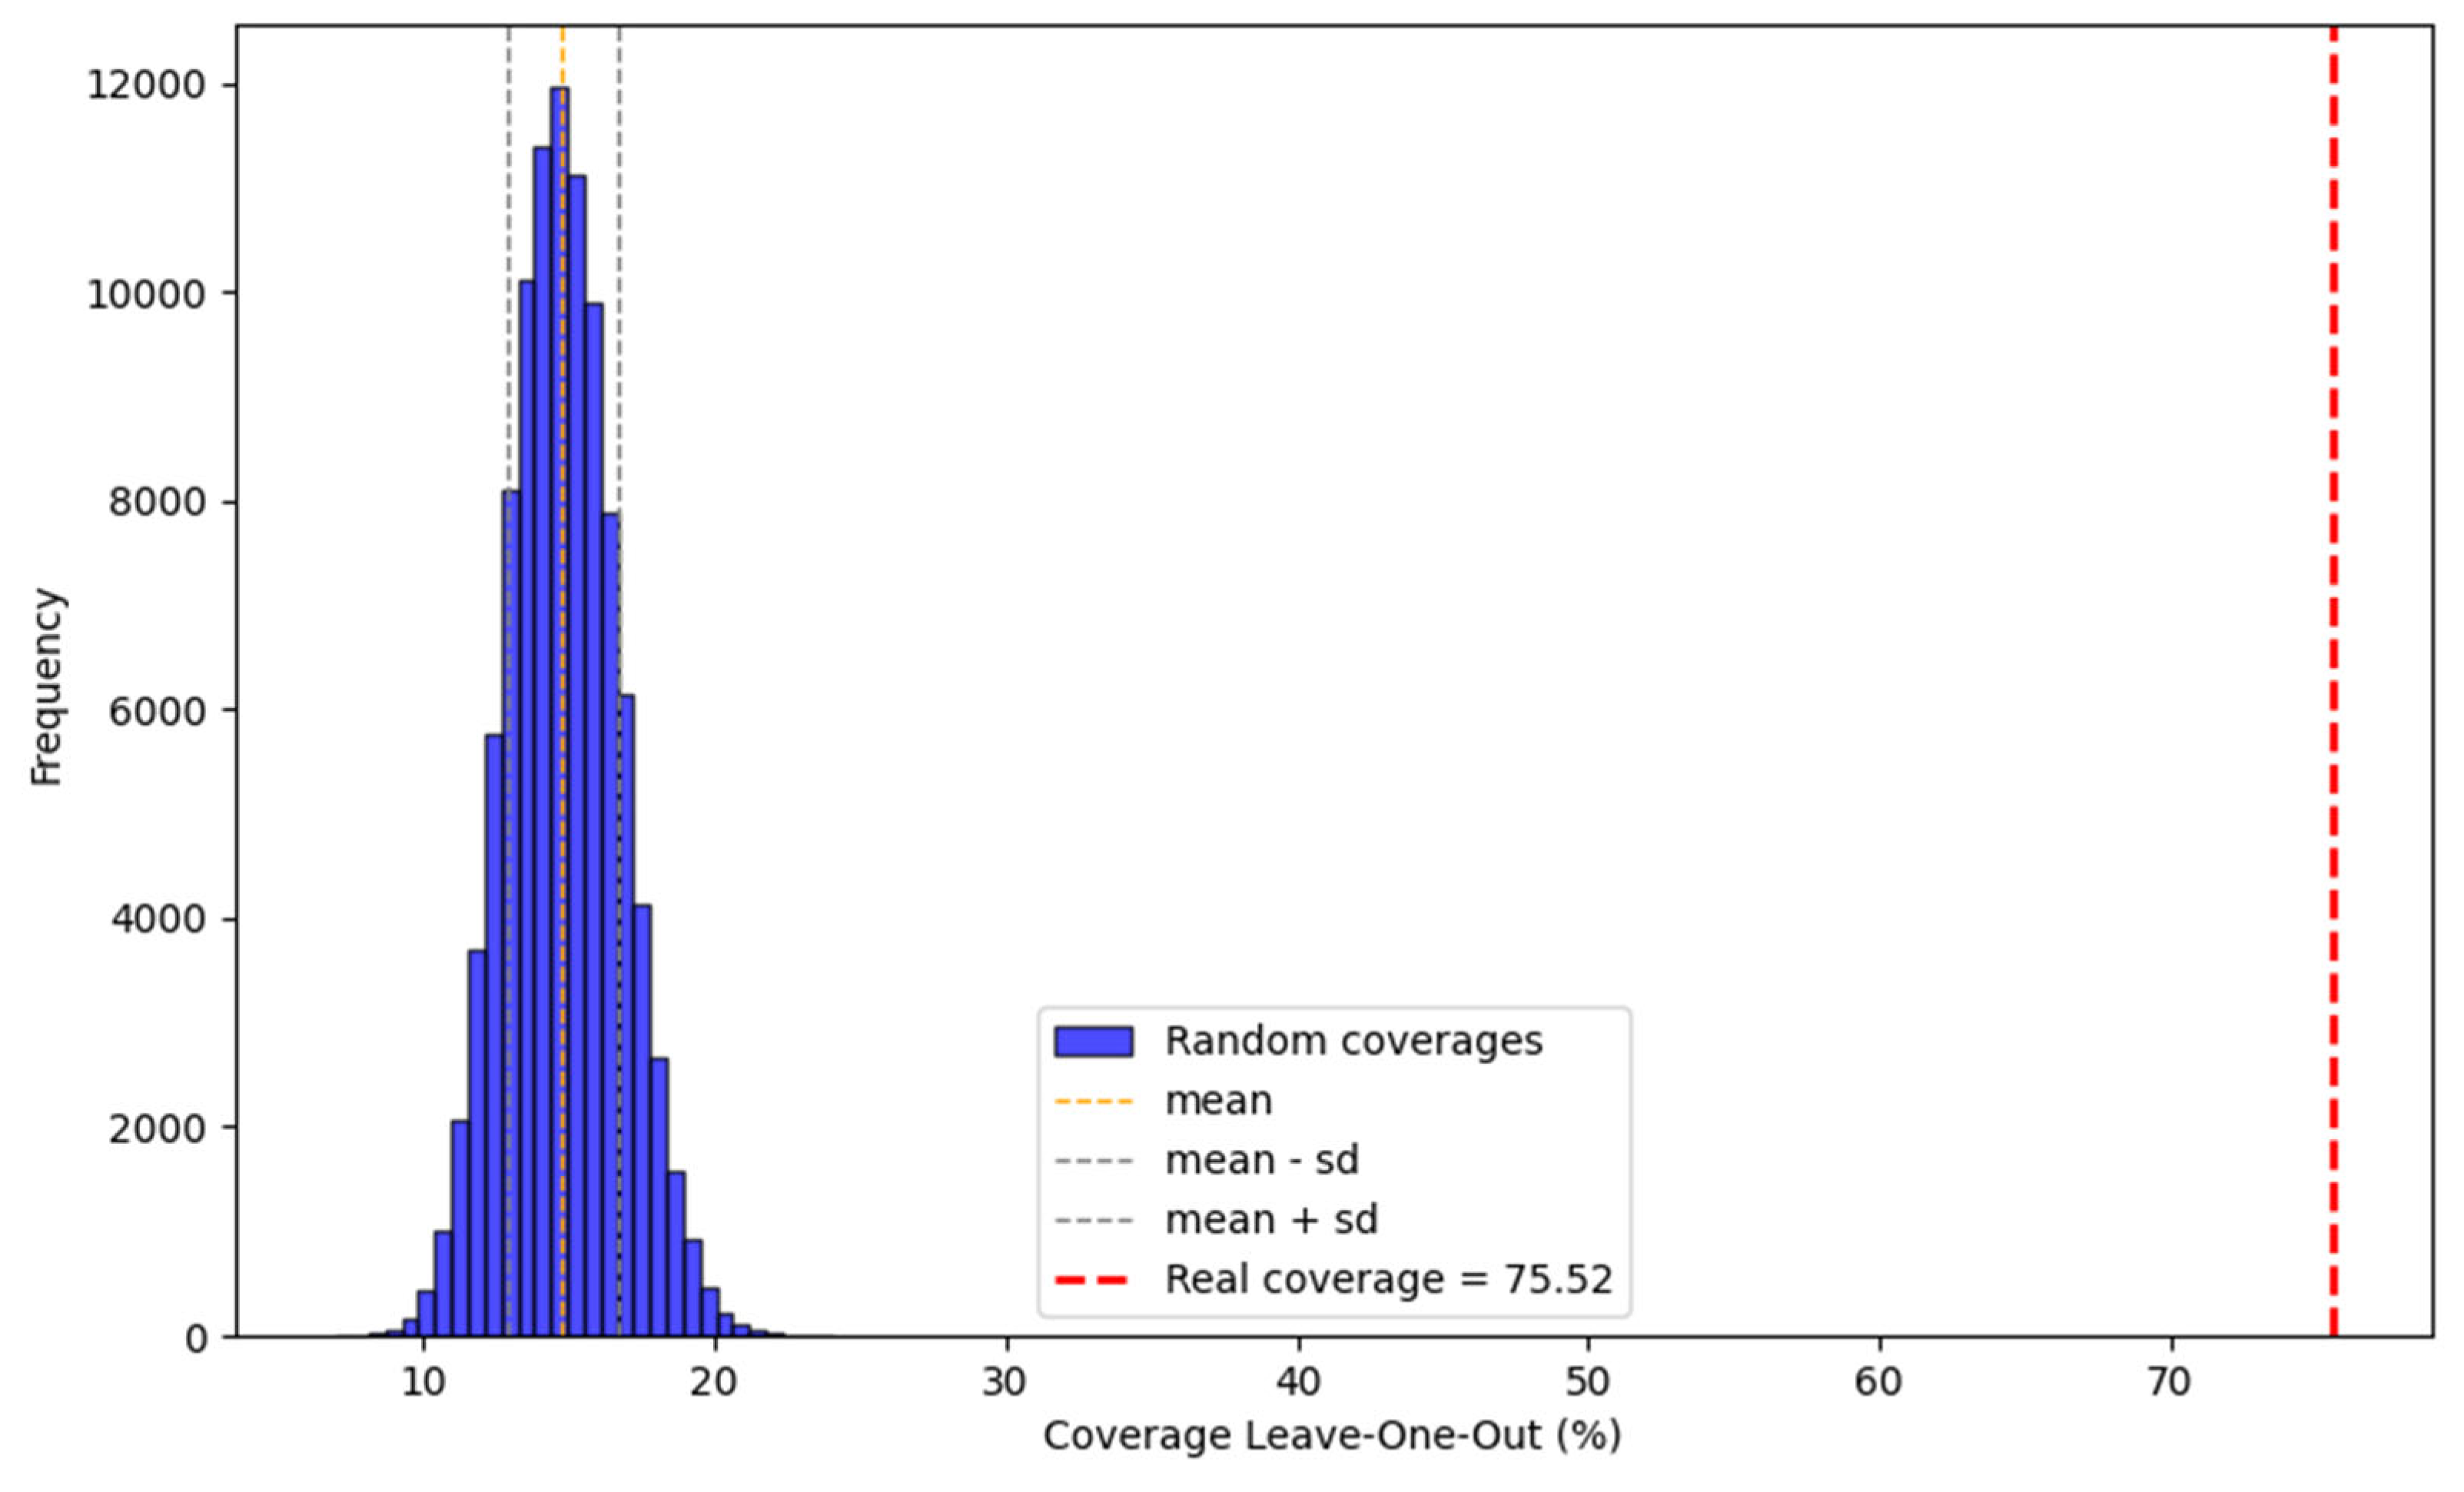
Figure 6.
Distribution of engineered reaction modulation. Reactions can be activated (over), repressed (down), or exhibit both patterns of modulation (dual).
Figure 6.
Distribution of engineered reaction modulation. Reactions can be activated (over), repressed (down), or exhibit both patterns of modulation (dual).
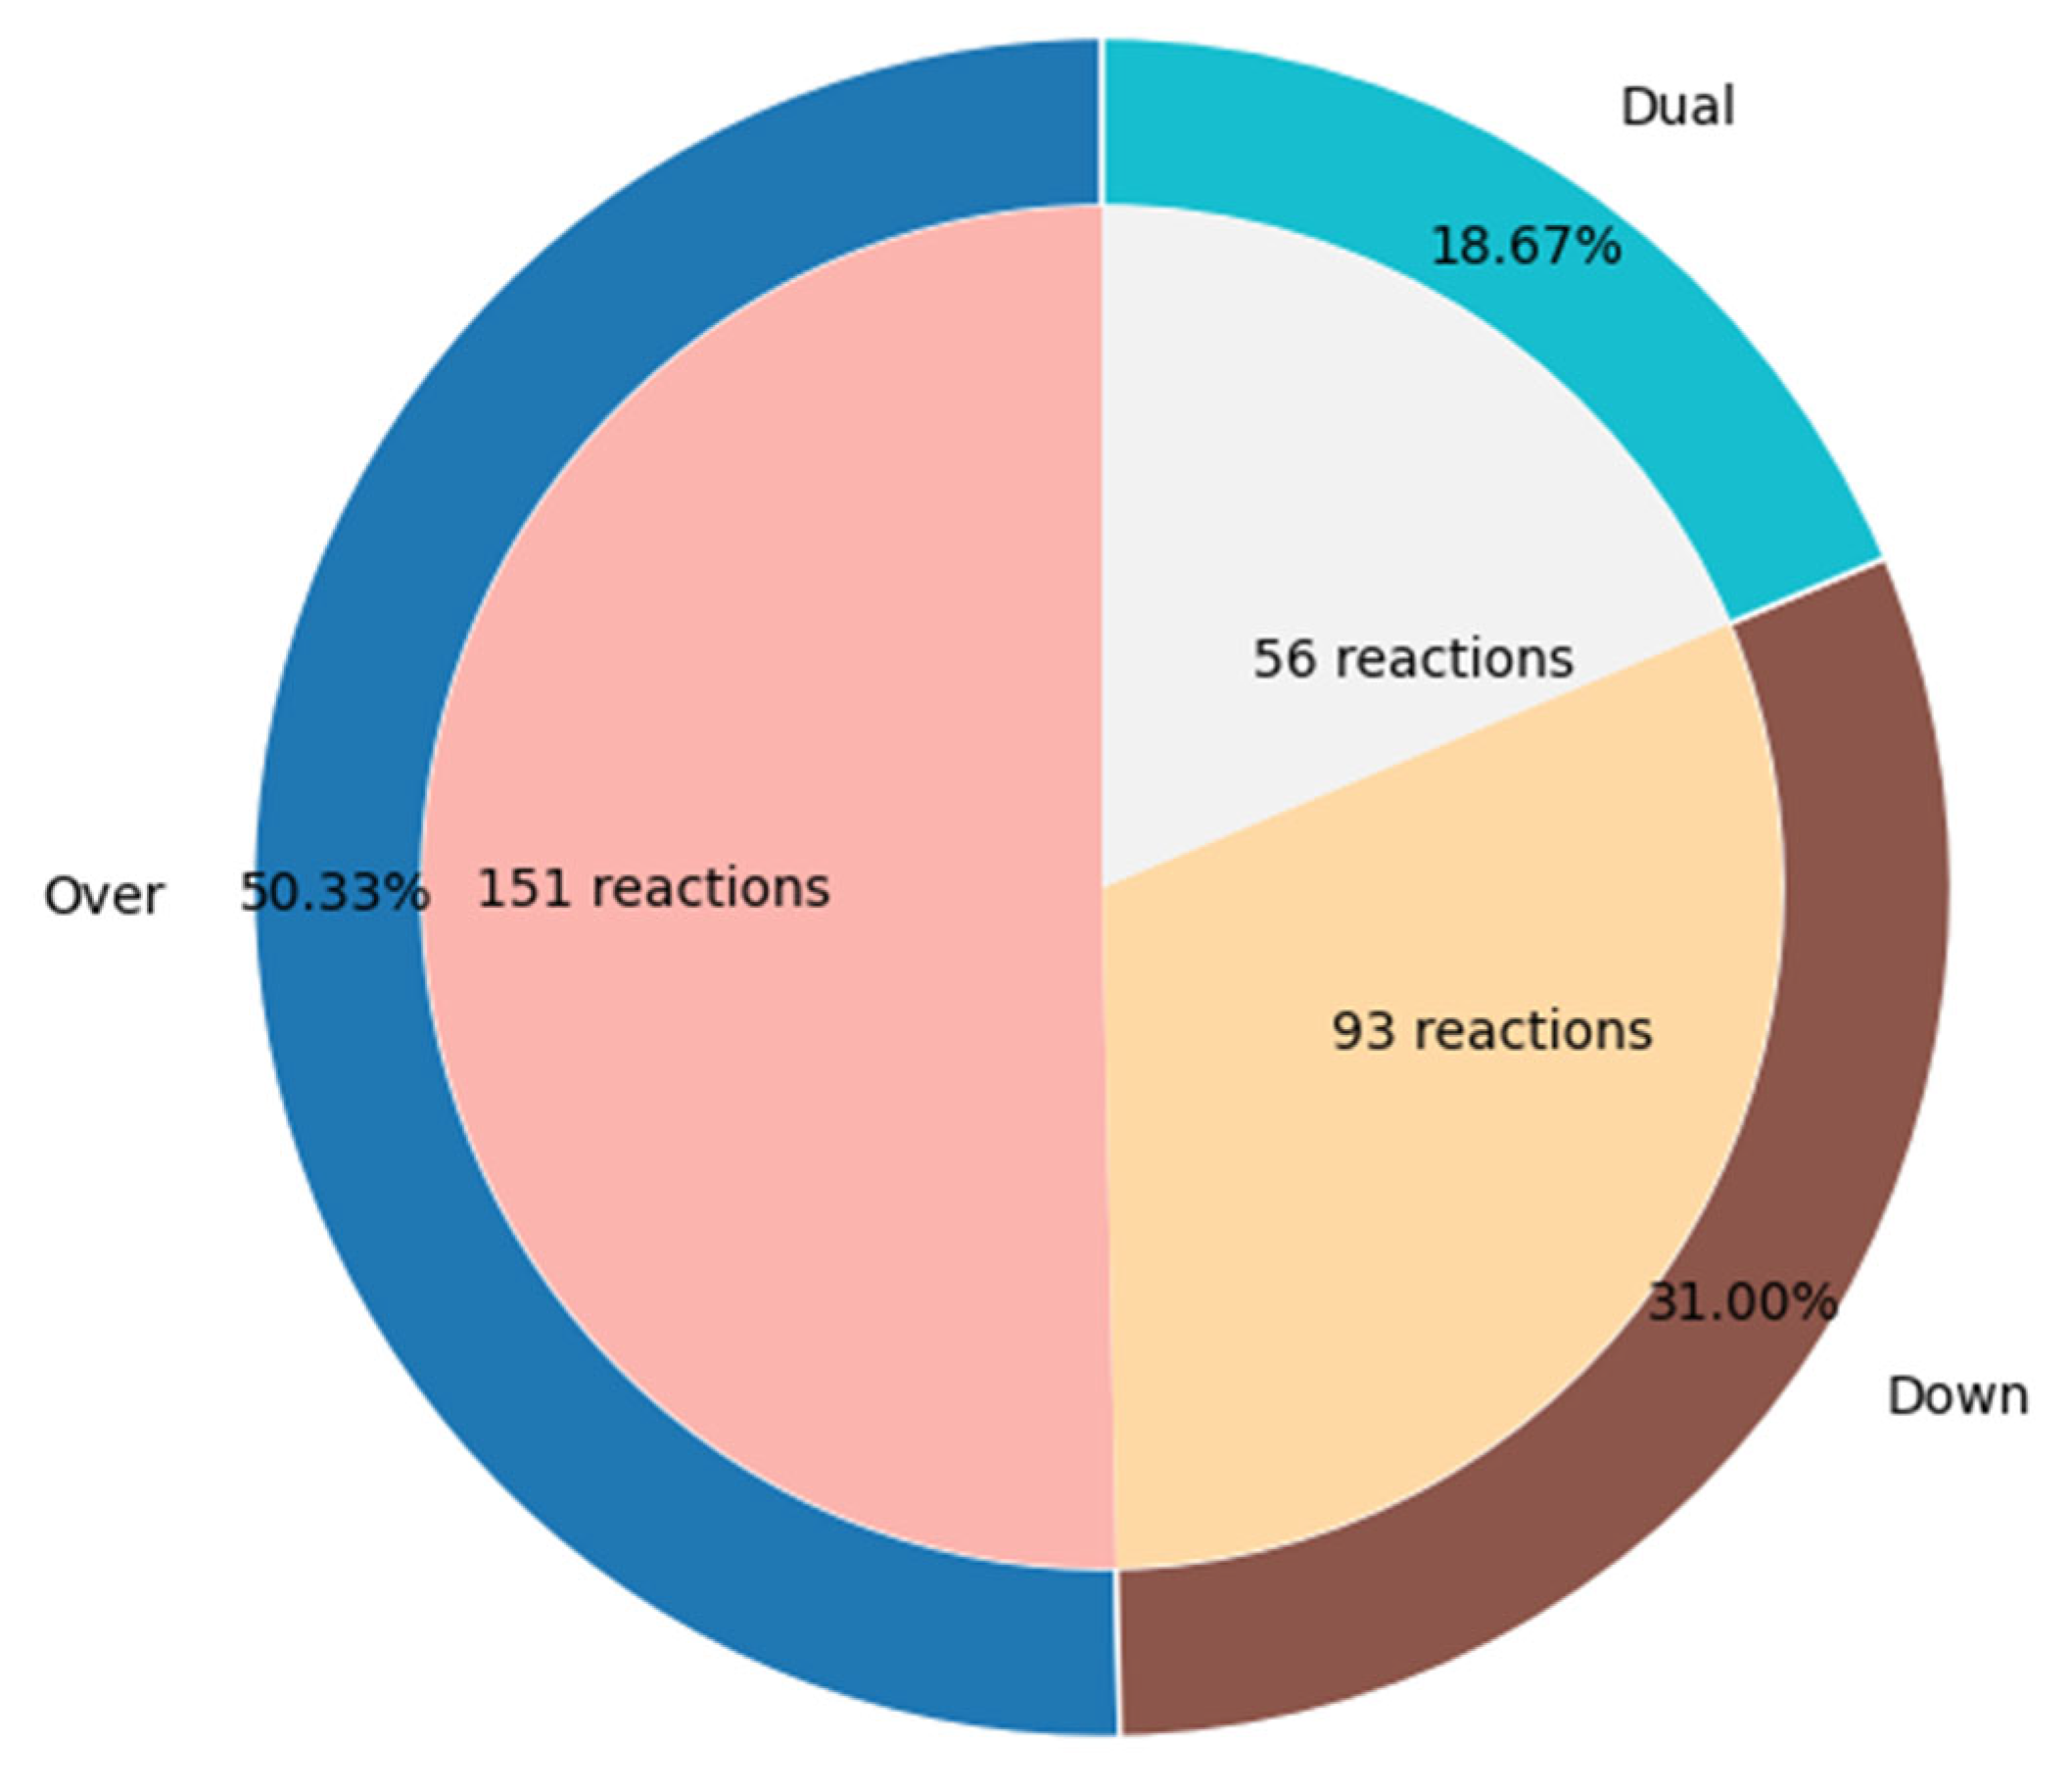
Figure 7.
Visual comparison of QPAML-predicted reactions with database annotations. The network shows reactions QPAML predicted to contribute to tryptophan production. Circles represent metabolites: green for substrates and red for the target. Edges represent reactions: blue for candidates for overregulation, orange for knockout, and red for attenuation. Arrows indicate reaction direction. Solid lines are unmodified reactions, dotted lines indicate reactions modified for the target metabolite (feedback effects), and dashed lines indicate reactions modified for other metabolites but not the target. You can run simulations using the simulation module available at https://eragene.com.
Figure 7.
Visual comparison of QPAML-predicted reactions with database annotations. The network shows reactions QPAML predicted to contribute to tryptophan production. Circles represent metabolites: green for substrates and red for the target. Edges represent reactions: blue for candidates for overregulation, orange for knockout, and red for attenuation. Arrows indicate reaction direction. Solid lines are unmodified reactions, dotted lines indicate reactions modified for the target metabolite (feedback effects), and dashed lines indicate reactions modified for other metabolites but not the target. You can run simulations using the simulation module available at https://eragene.com.
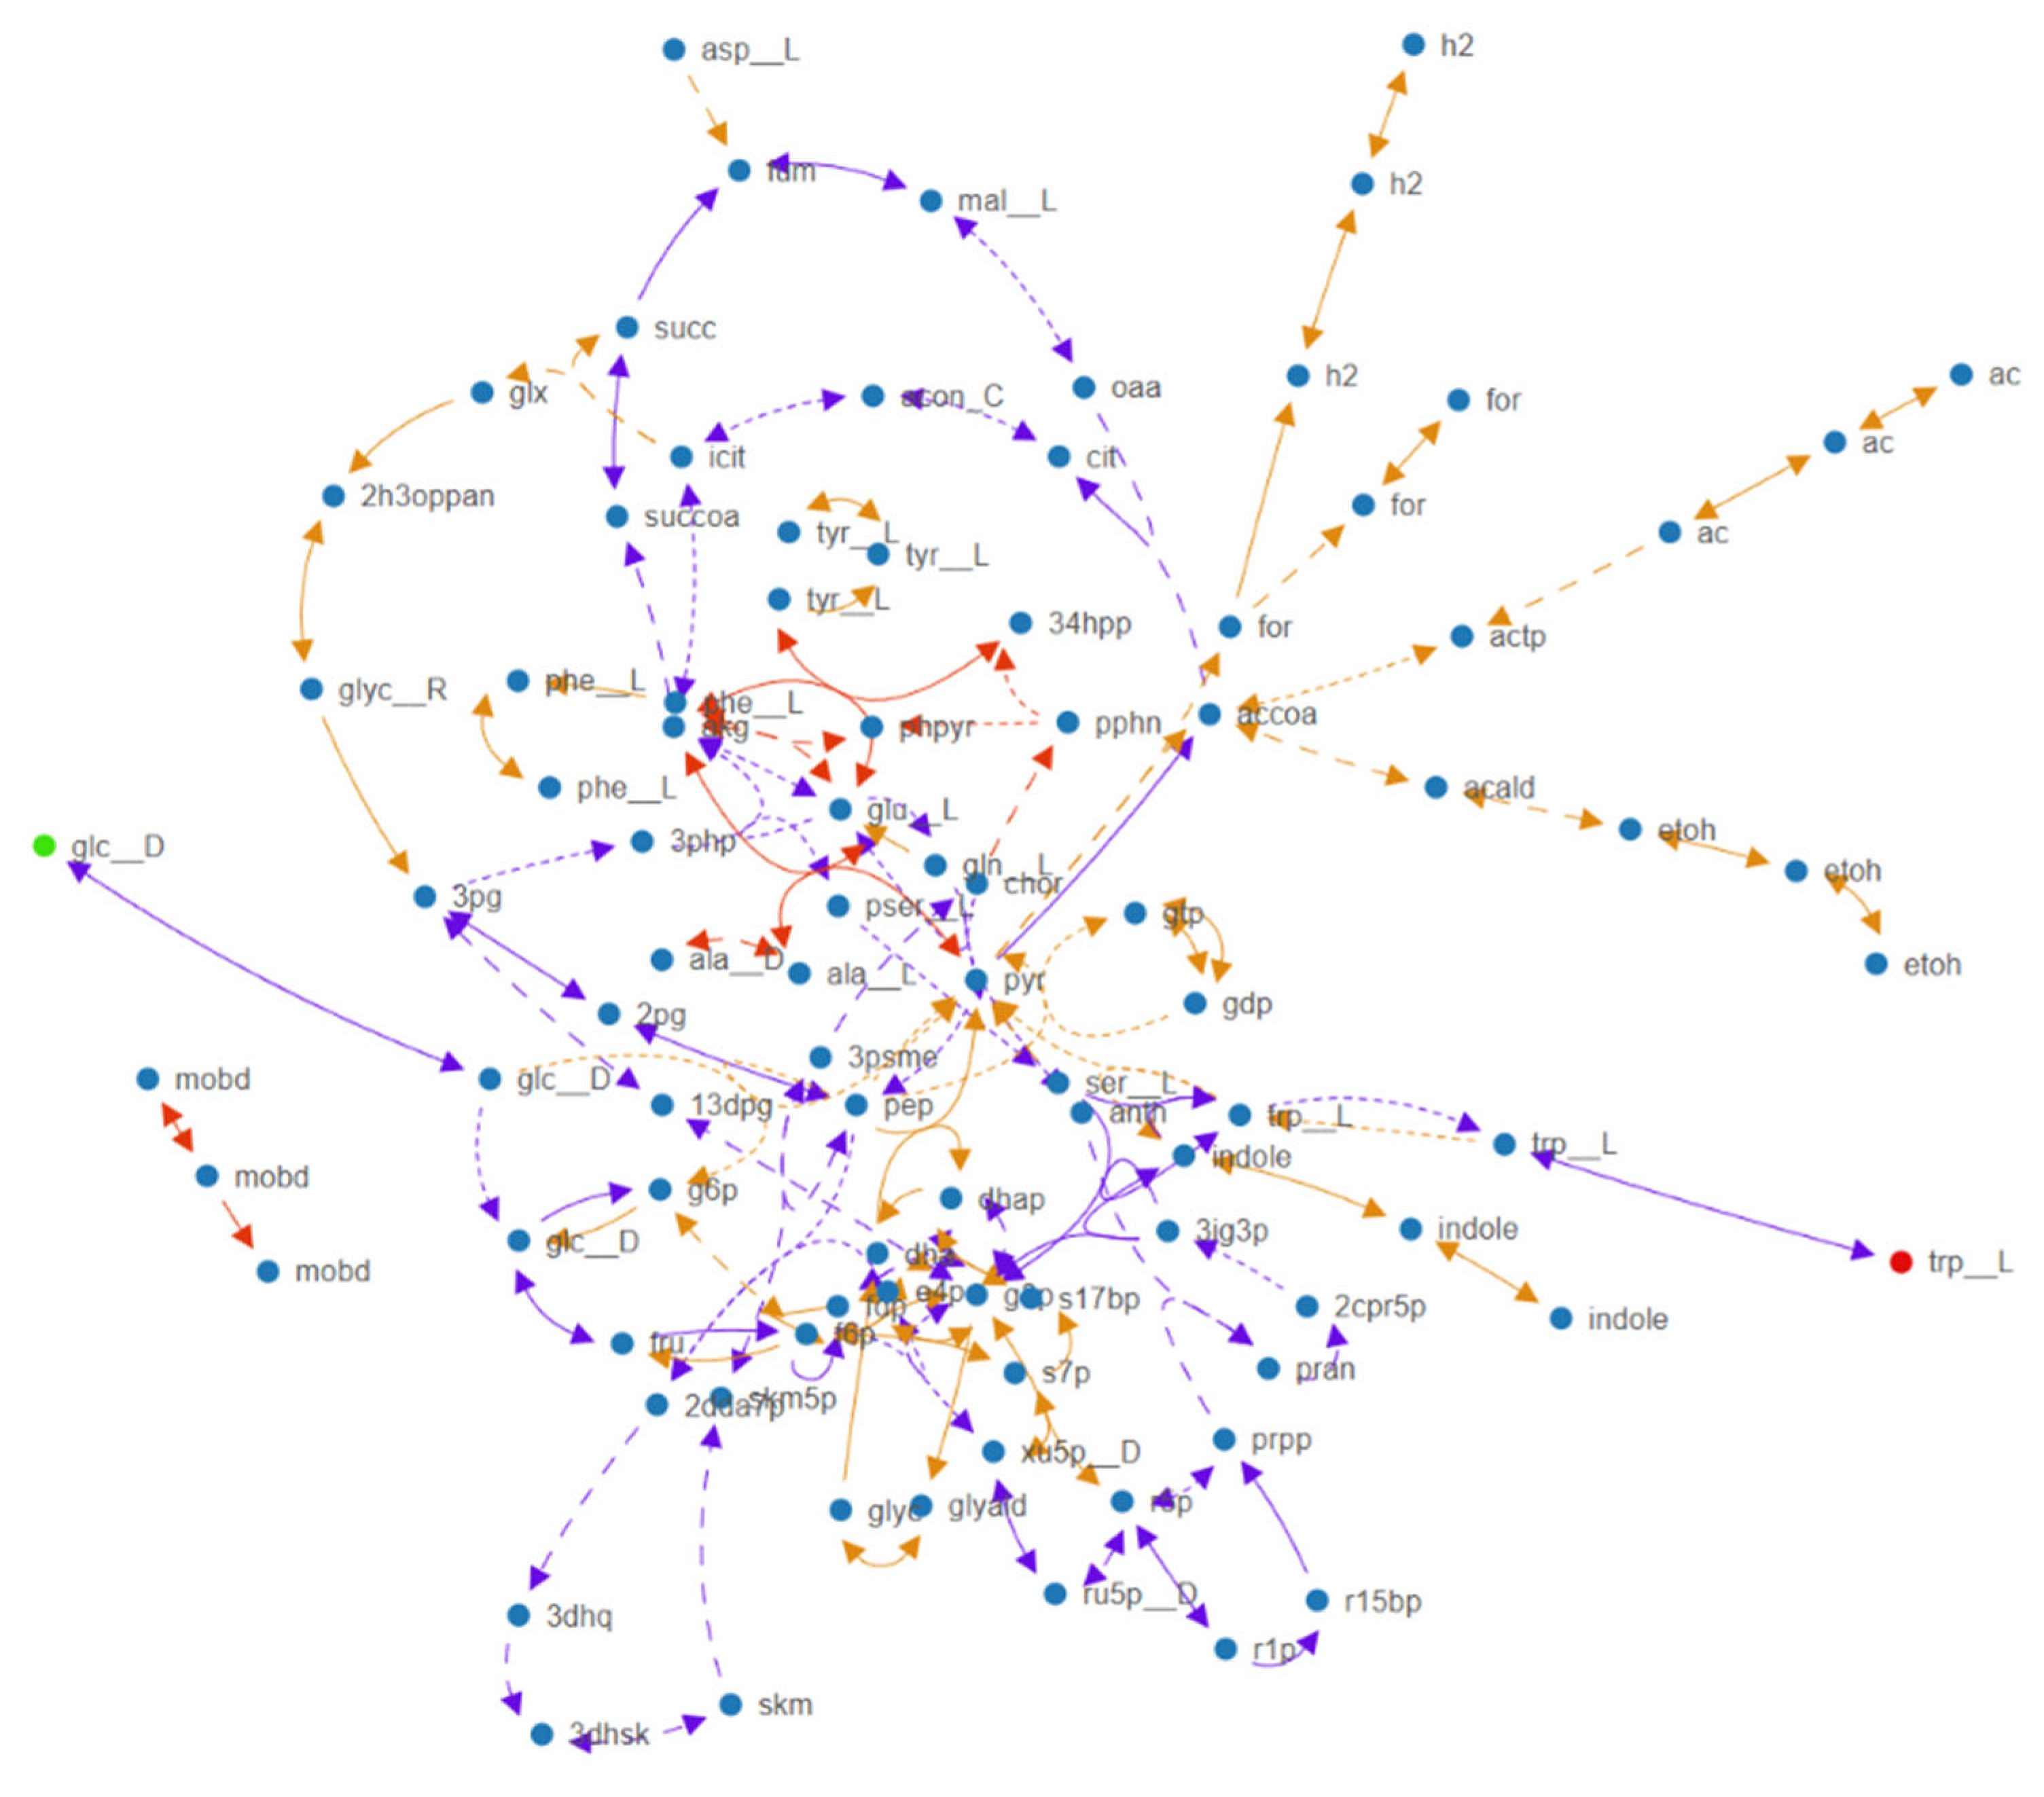
Figure 8.
Comparative analysis of the average reaction sets predicted, annotated, and experimentally validated under different regulatory conditions. The Venn diagrams show the overlap among reactions predicted by the QPAML model, those annotated in the database, and those experimentally validated. The left panel shows predictions made without metabolite-specific modulation, whereas the right panel shows predictions incorporating metabolite-specific modulation (overregulated, downregulated, or both). QPAML denotes computationally predicted reactions; knowledge-guided refers to reactions annotated in the database using intentionally hidden metabolite-specific annotations; and experimental corresponds to reactions annotated in the database for the respective metabolite.
Figure 8.
Comparative analysis of the average reaction sets predicted, annotated, and experimentally validated under different regulatory conditions. The Venn diagrams show the overlap among reactions predicted by the QPAML model, those annotated in the database, and those experimentally validated. The left panel shows predictions made without metabolite-specific modulation, whereas the right panel shows predictions incorporating metabolite-specific modulation (overregulated, downregulated, or both). QPAML denotes computationally predicted reactions; knowledge-guided refers to reactions annotated in the database using intentionally hidden metabolite-specific annotations; and experimental corresponds to reactions annotated in the database for the respective metabolite.
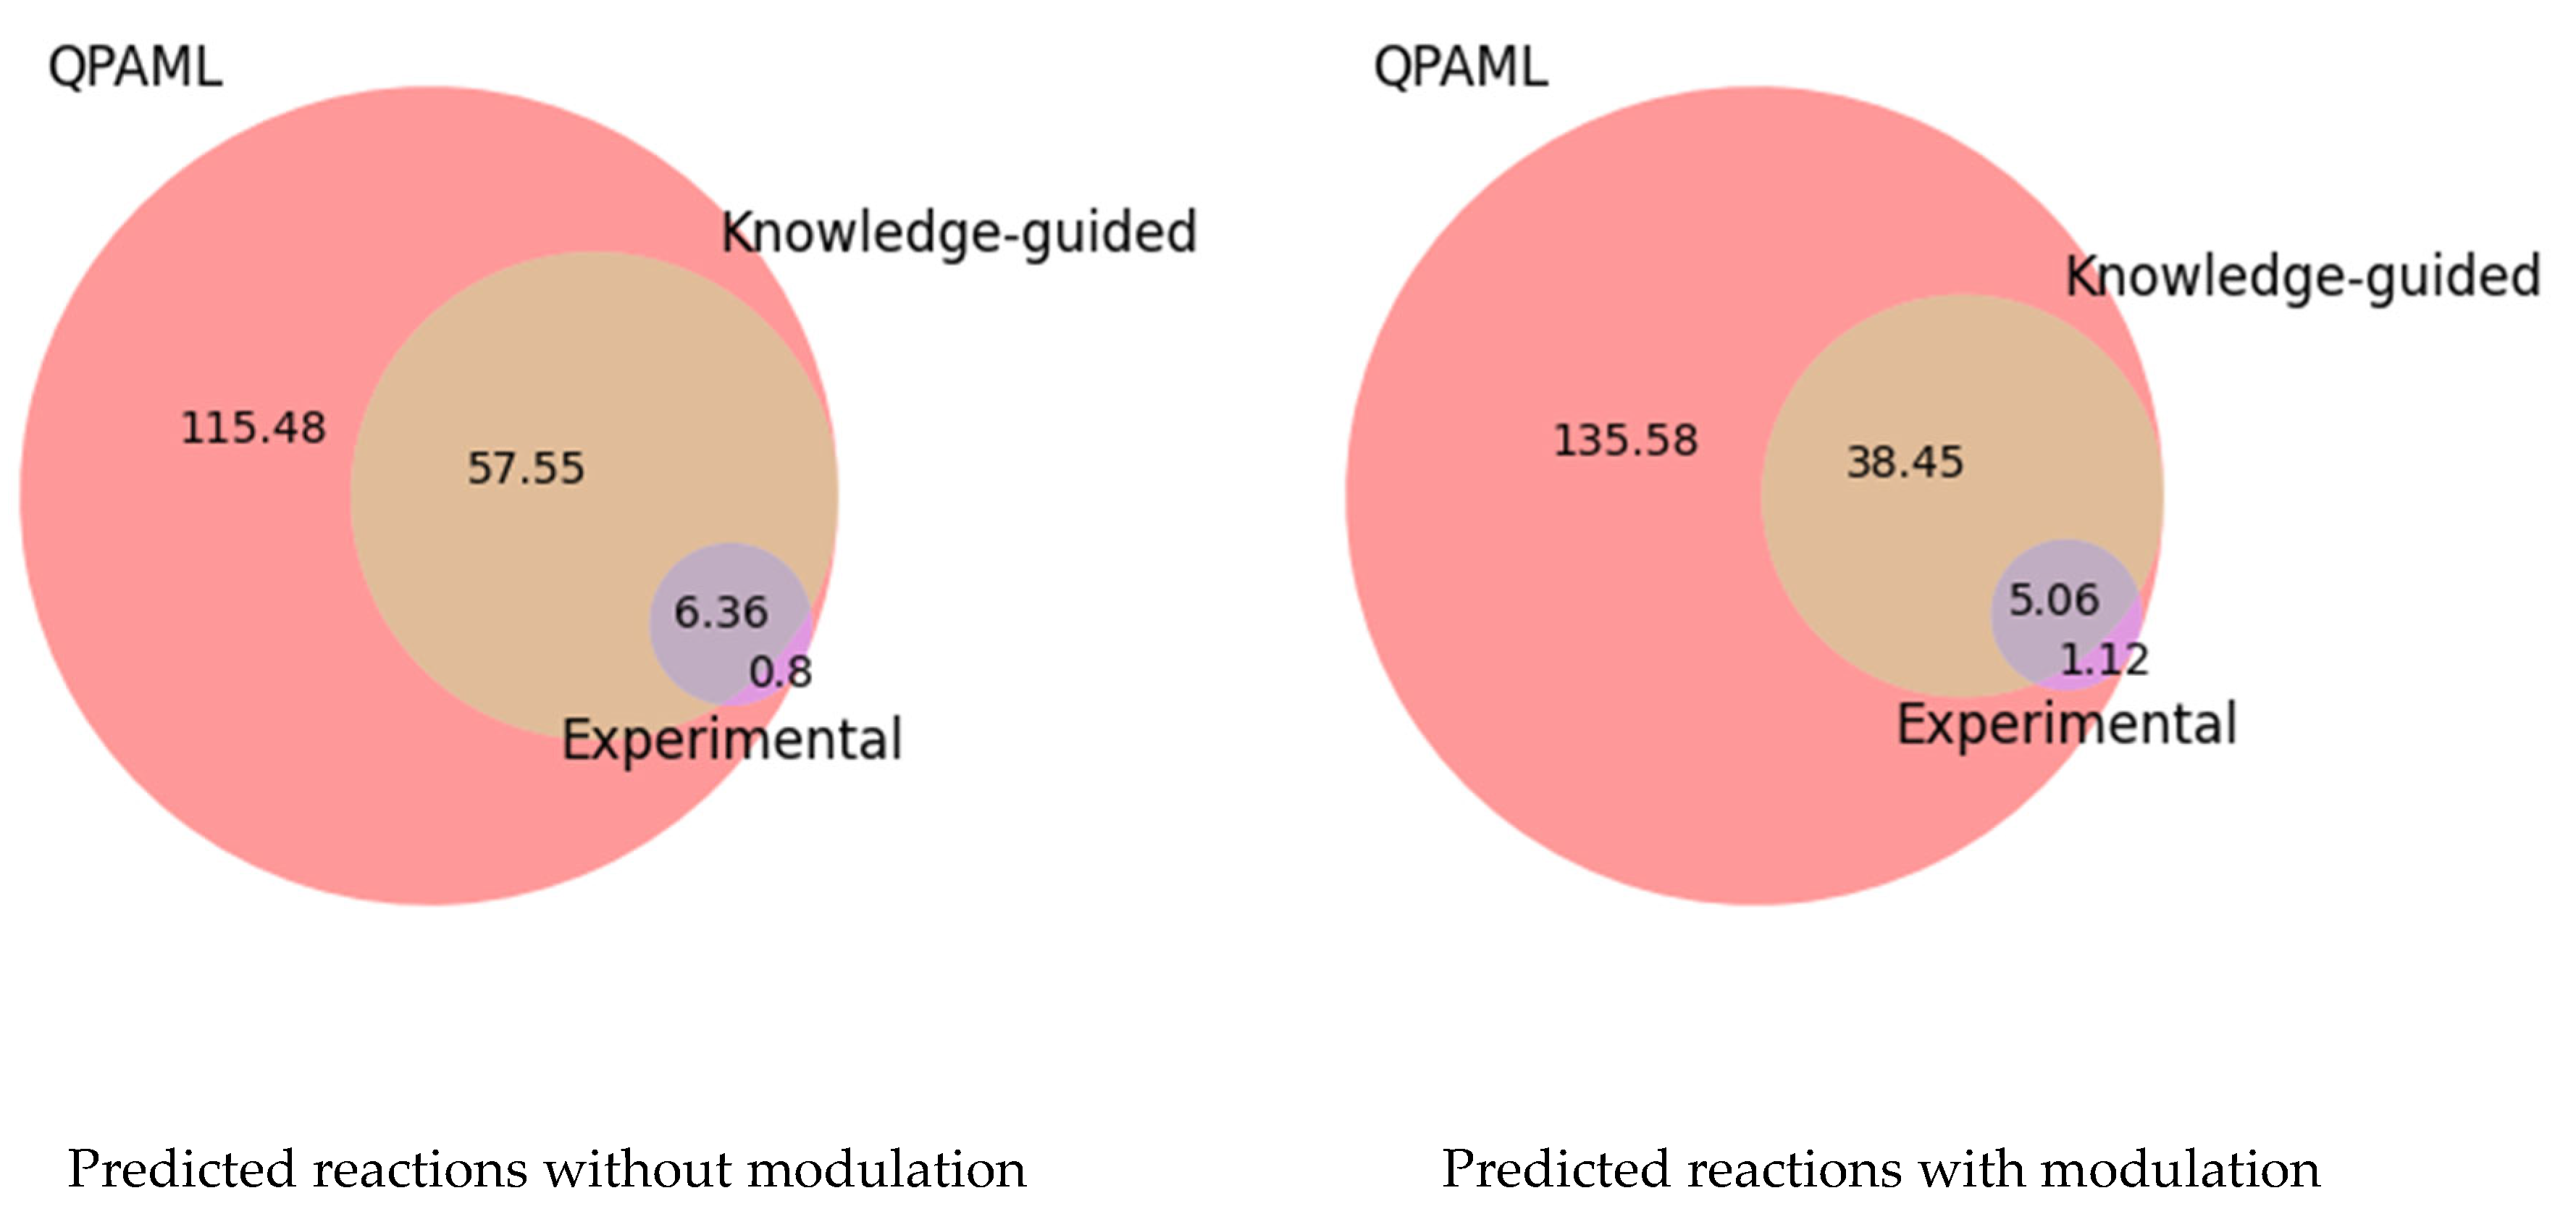
Figure 9.
Heatmap of reaction-modulation co-occurrence. The heatmap displays the pairwise co-occurrence of reaction modulations across engineered strains. Reactions are sorted according to hierarchical clustering, which groups reactions with similar modulation patterns. Co-occurrences are sparse overall, with a few clusters near the diagonal (reddish colors) representing reactions that co-modulate more frequently, whereas most reactions show independent modulation. Color intensity reflects the frequency of co-occurrence between reaction pairs.
Figure 9.
Heatmap of reaction-modulation co-occurrence. The heatmap displays the pairwise co-occurrence of reaction modulations across engineered strains. Reactions are sorted according to hierarchical clustering, which groups reactions with similar modulation patterns. Co-occurrences are sparse overall, with a few clusters near the diagonal (reddish colors) representing reactions that co-modulate more frequently, whereas most reactions show independent modulation. Color intensity reflects the frequency of co-occurrence between reaction pairs.
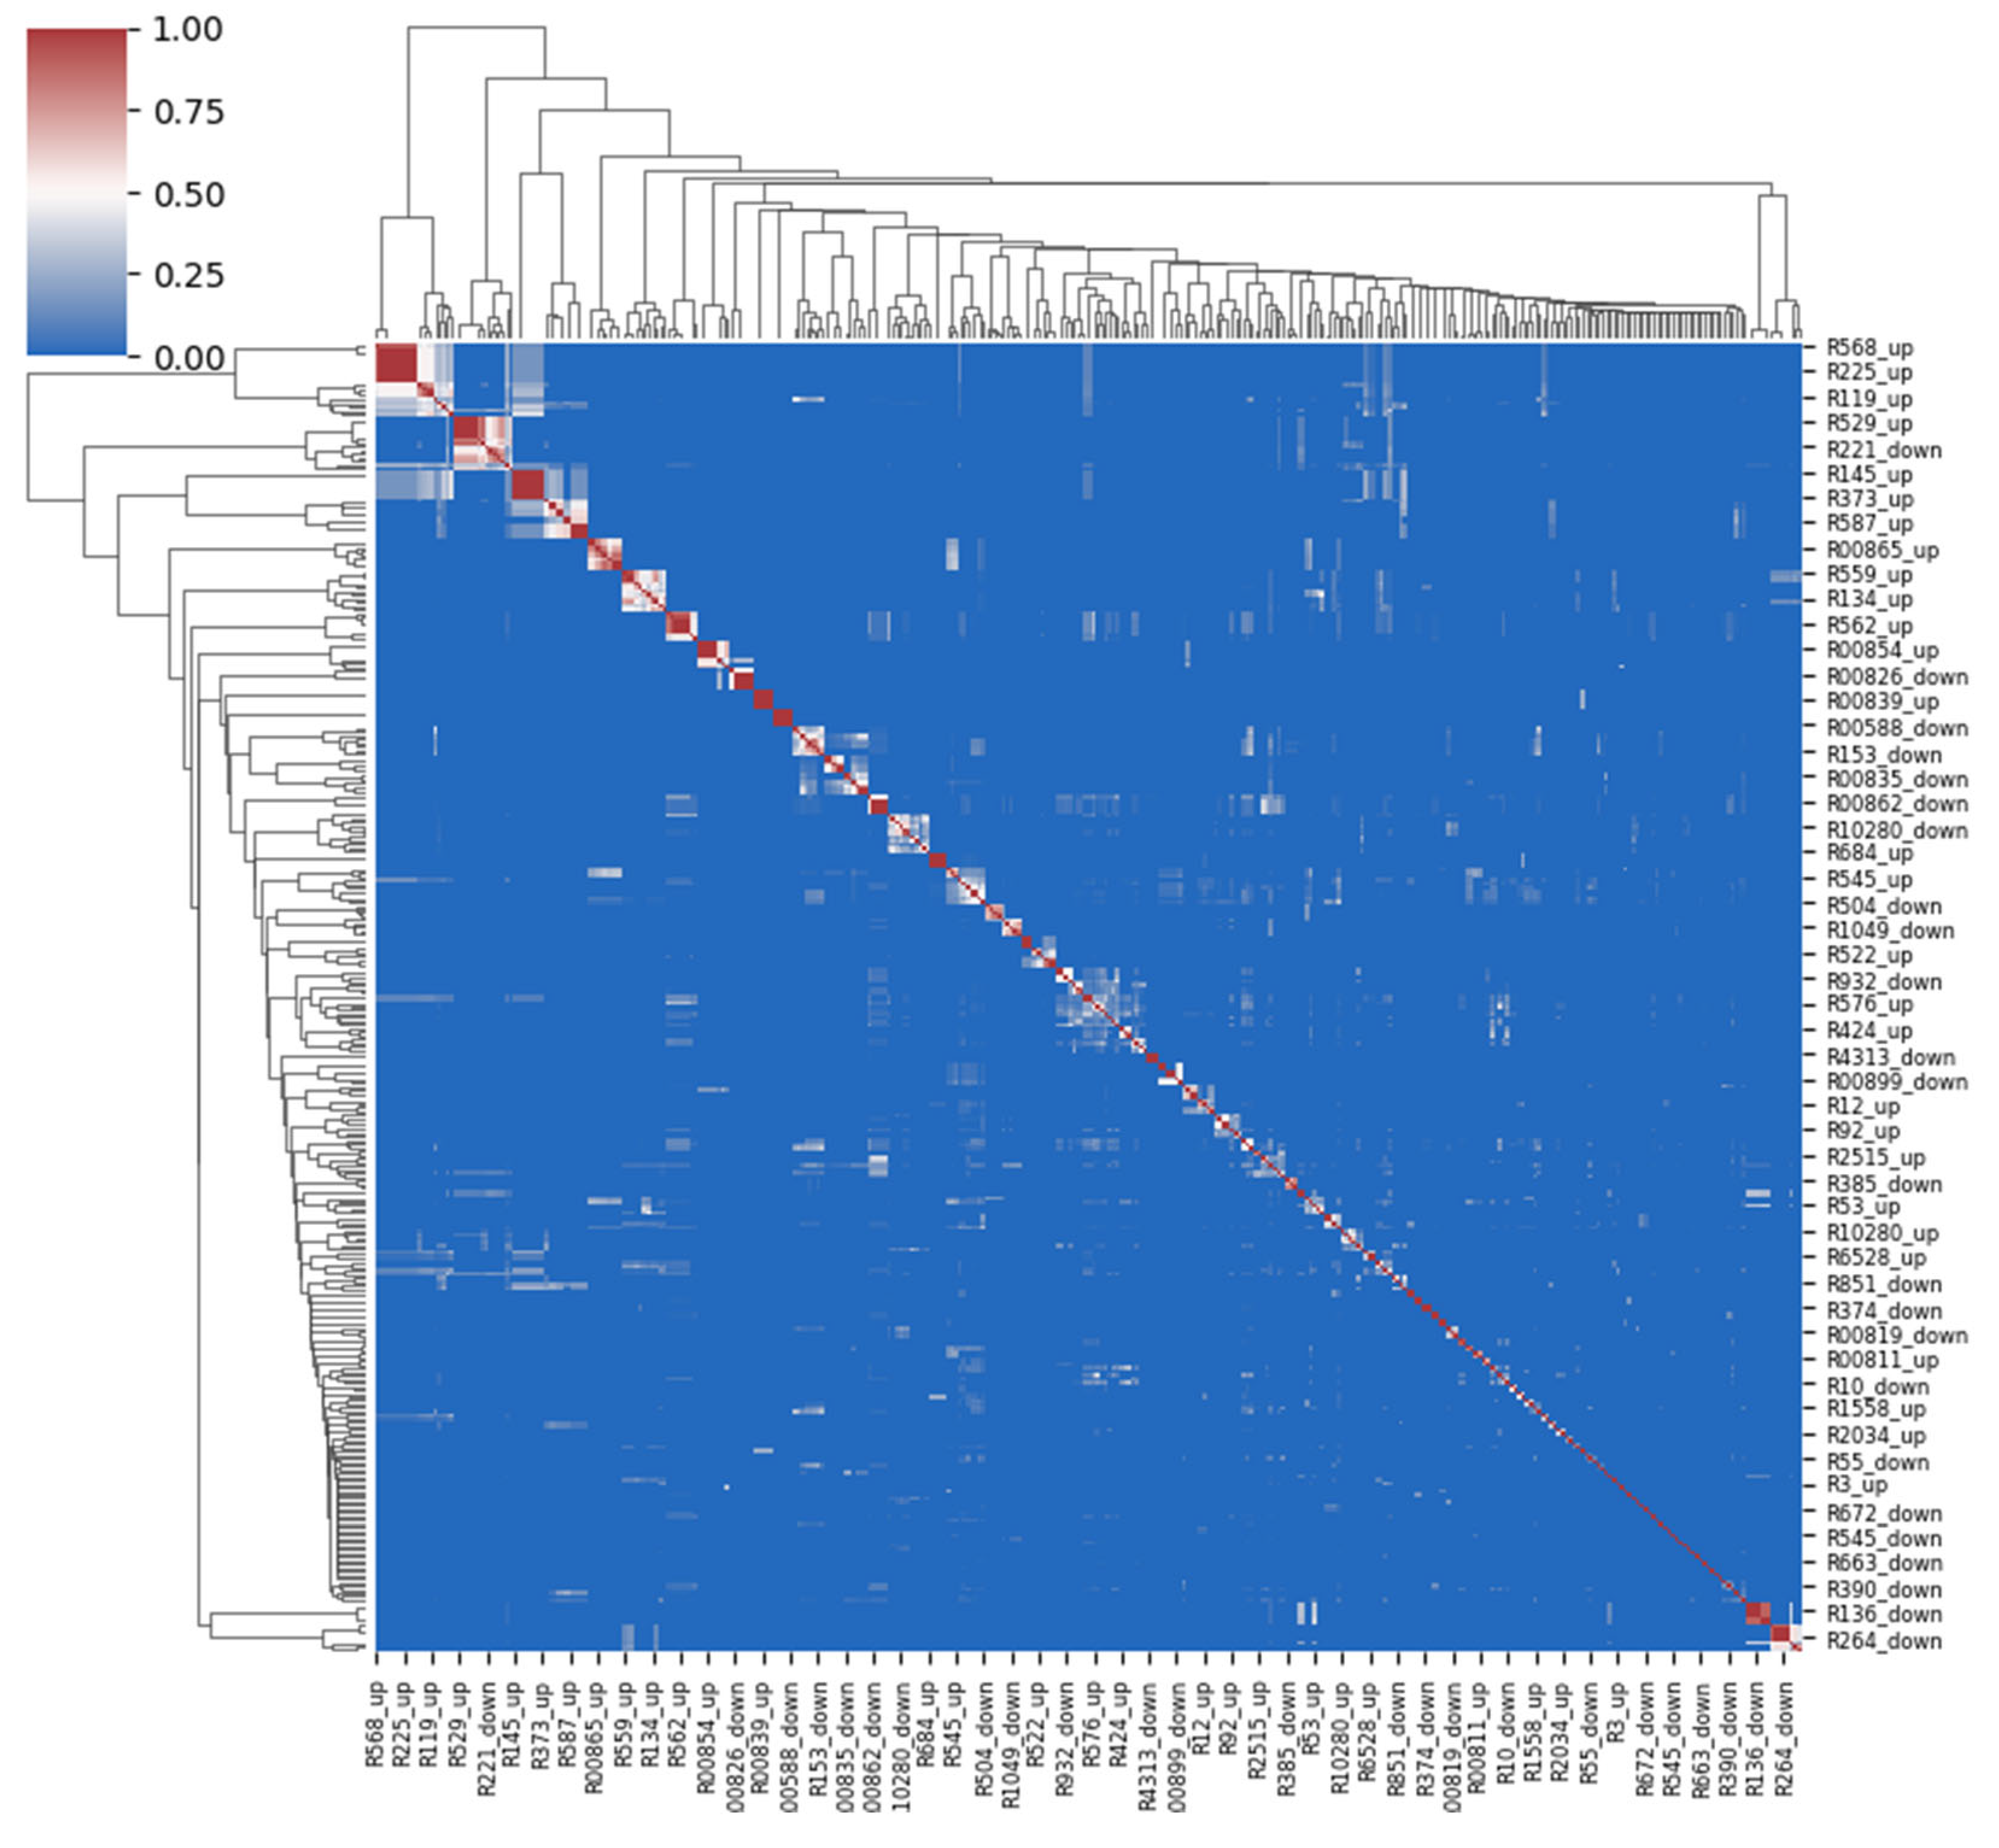
Figure 10.
KEGG enrichment analysis of identified communities. We detected communities from a knowledge graph and filtered them to retain those containing genetically modified genes before KEGG pathway enrichment analysis. FDR, false discovery rate.
Figure 10.
KEGG enrichment analysis of identified communities. We detected communities from a knowledge graph and filtered them to retain those containing genetically modified genes before KEGG pathway enrichment analysis. FDR, false discovery rate.
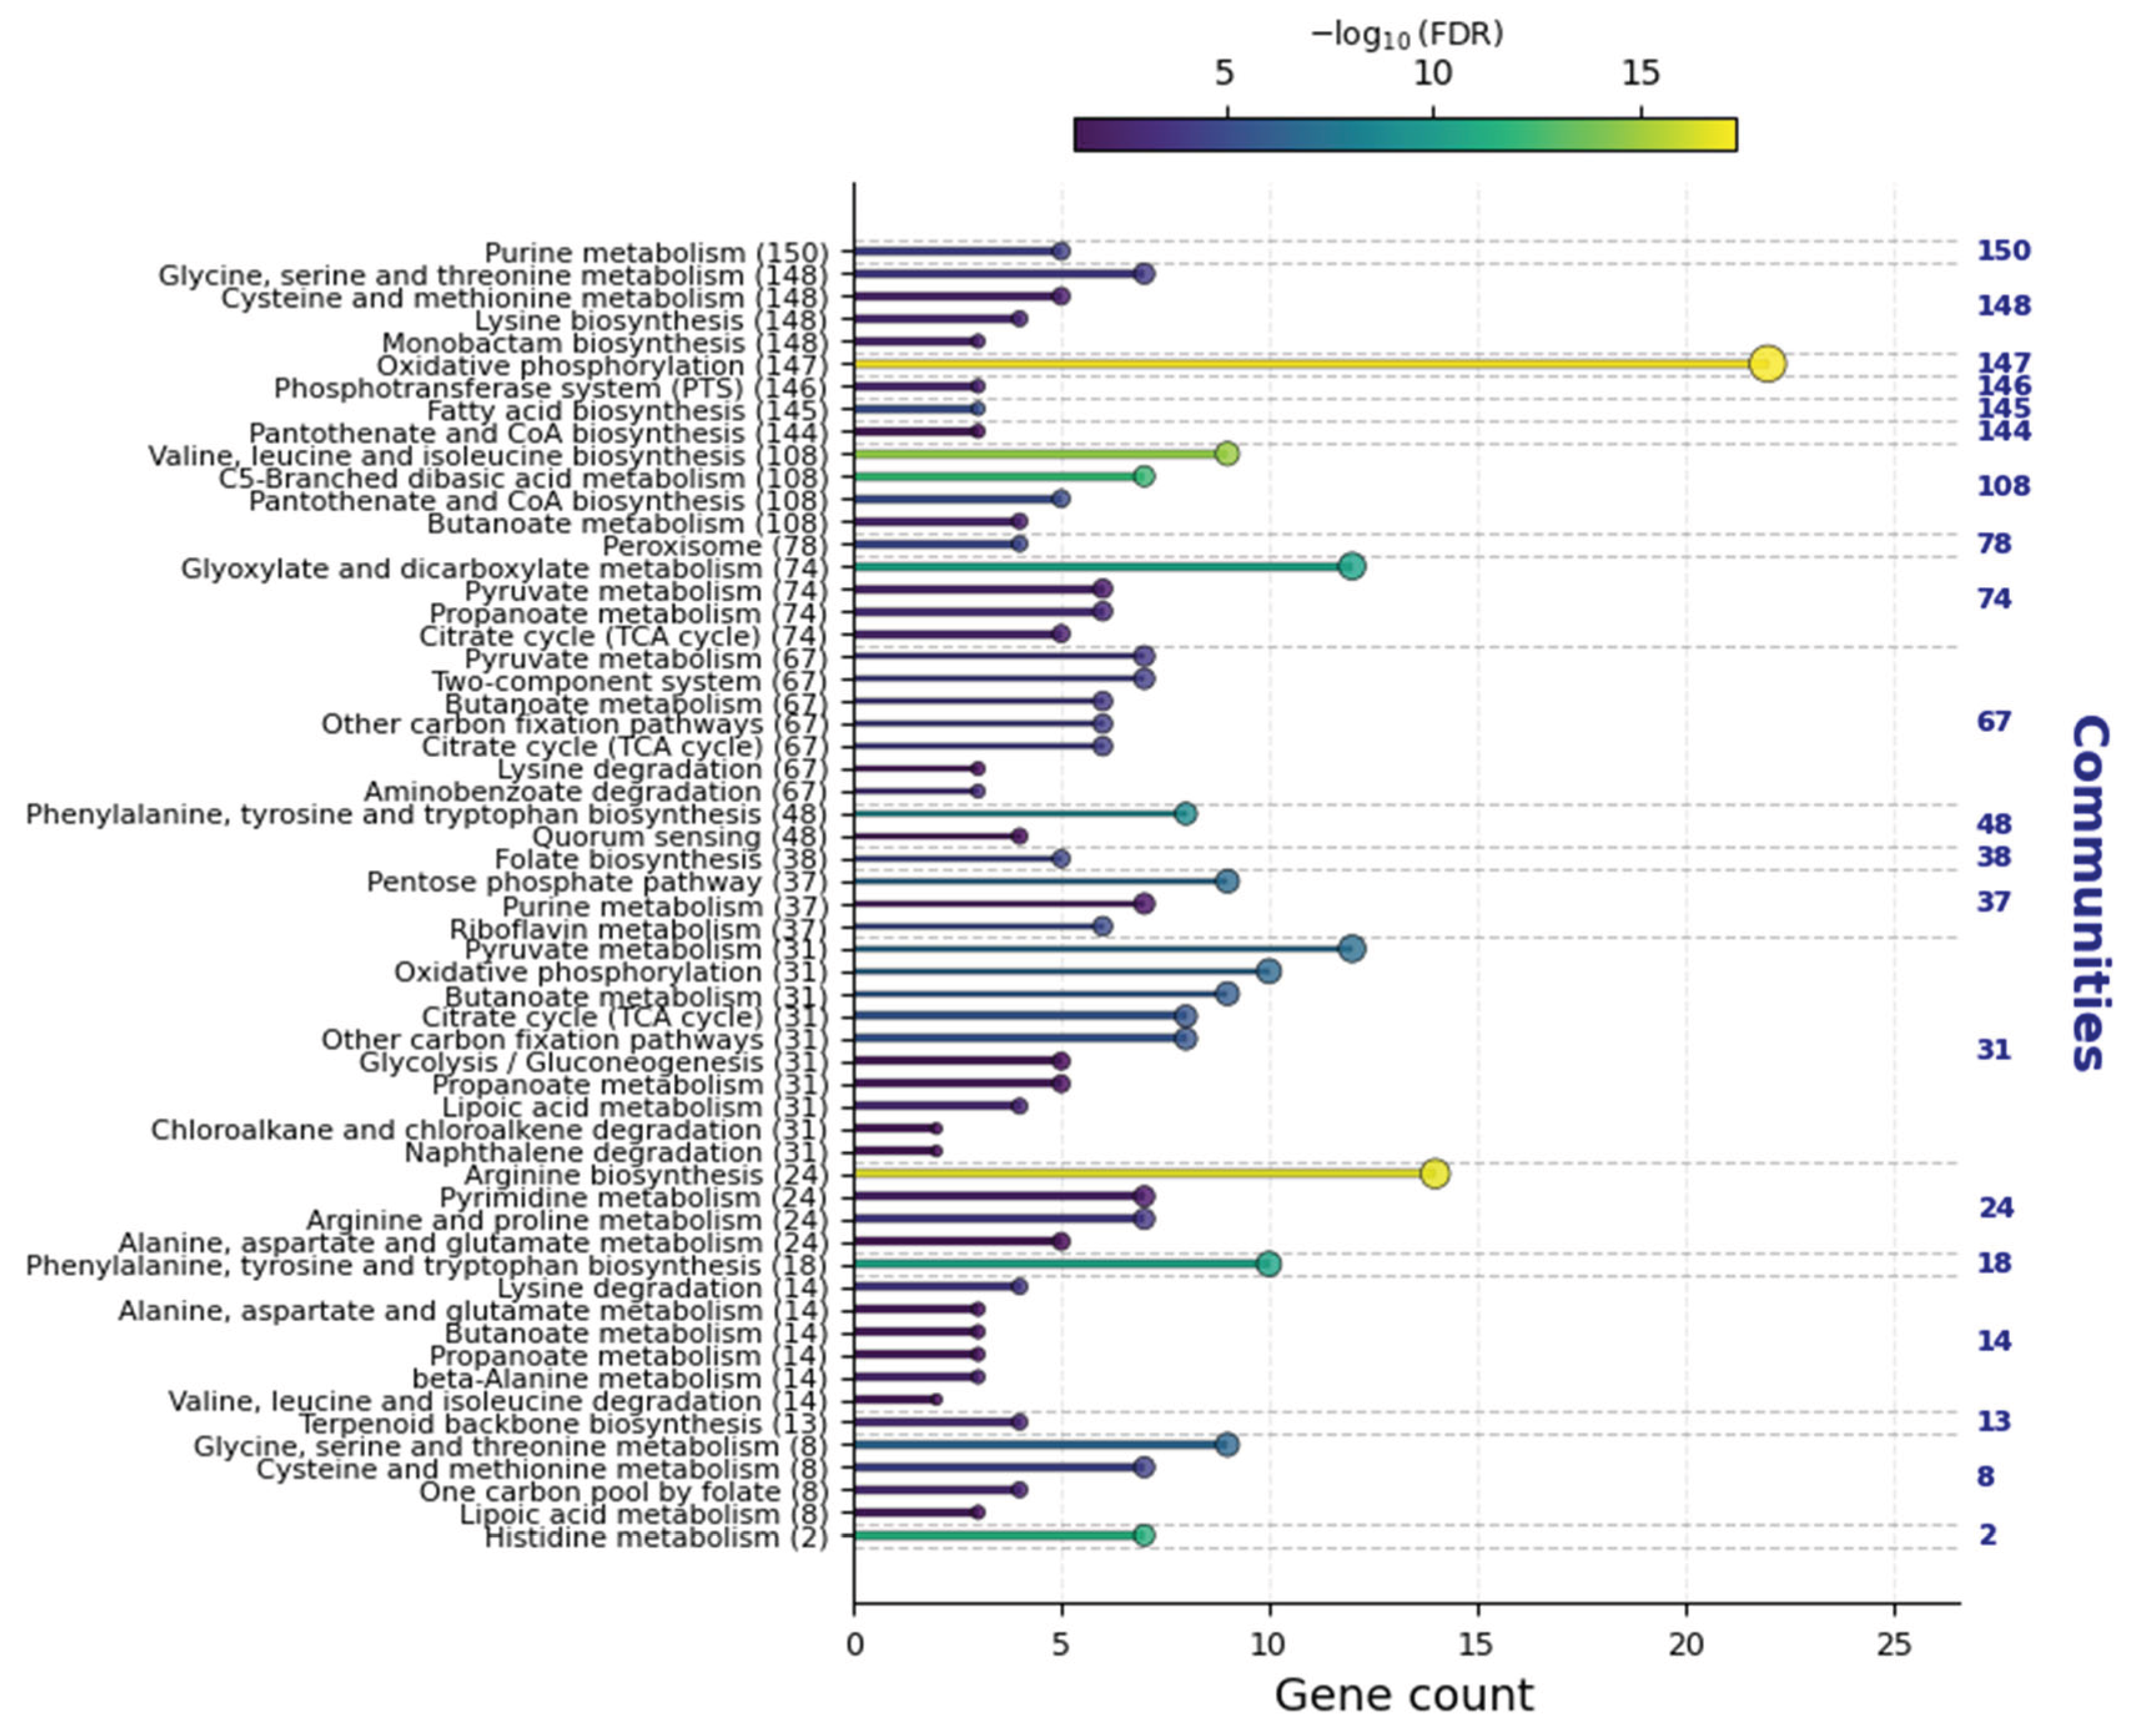
Figure 11.
Database schema. Each rectangle represents a table, with headers indicating table names. Parameters are listed in the left column, with primary keys in bold; the right column specifies variable types. Lines represent relationships between tables, with asterisks (*) indicating many-to-many relationships and the number 1 indicating one-to-one relationships. Abbreviations: Mw (molecular weight), mm (molecular mass), and id (identifier).
Figure 11.
Database schema. Each rectangle represents a table, with headers indicating table names. Parameters are listed in the left column, with primary keys in bold; the right column specifies variable types. Lines represent relationships between tables, with asterisks (*) indicating many-to-many relationships and the number 1 indicating one-to-one relationships. Abbreviations: Mw (molecular weight), mm (molecular mass), and id (identifier).
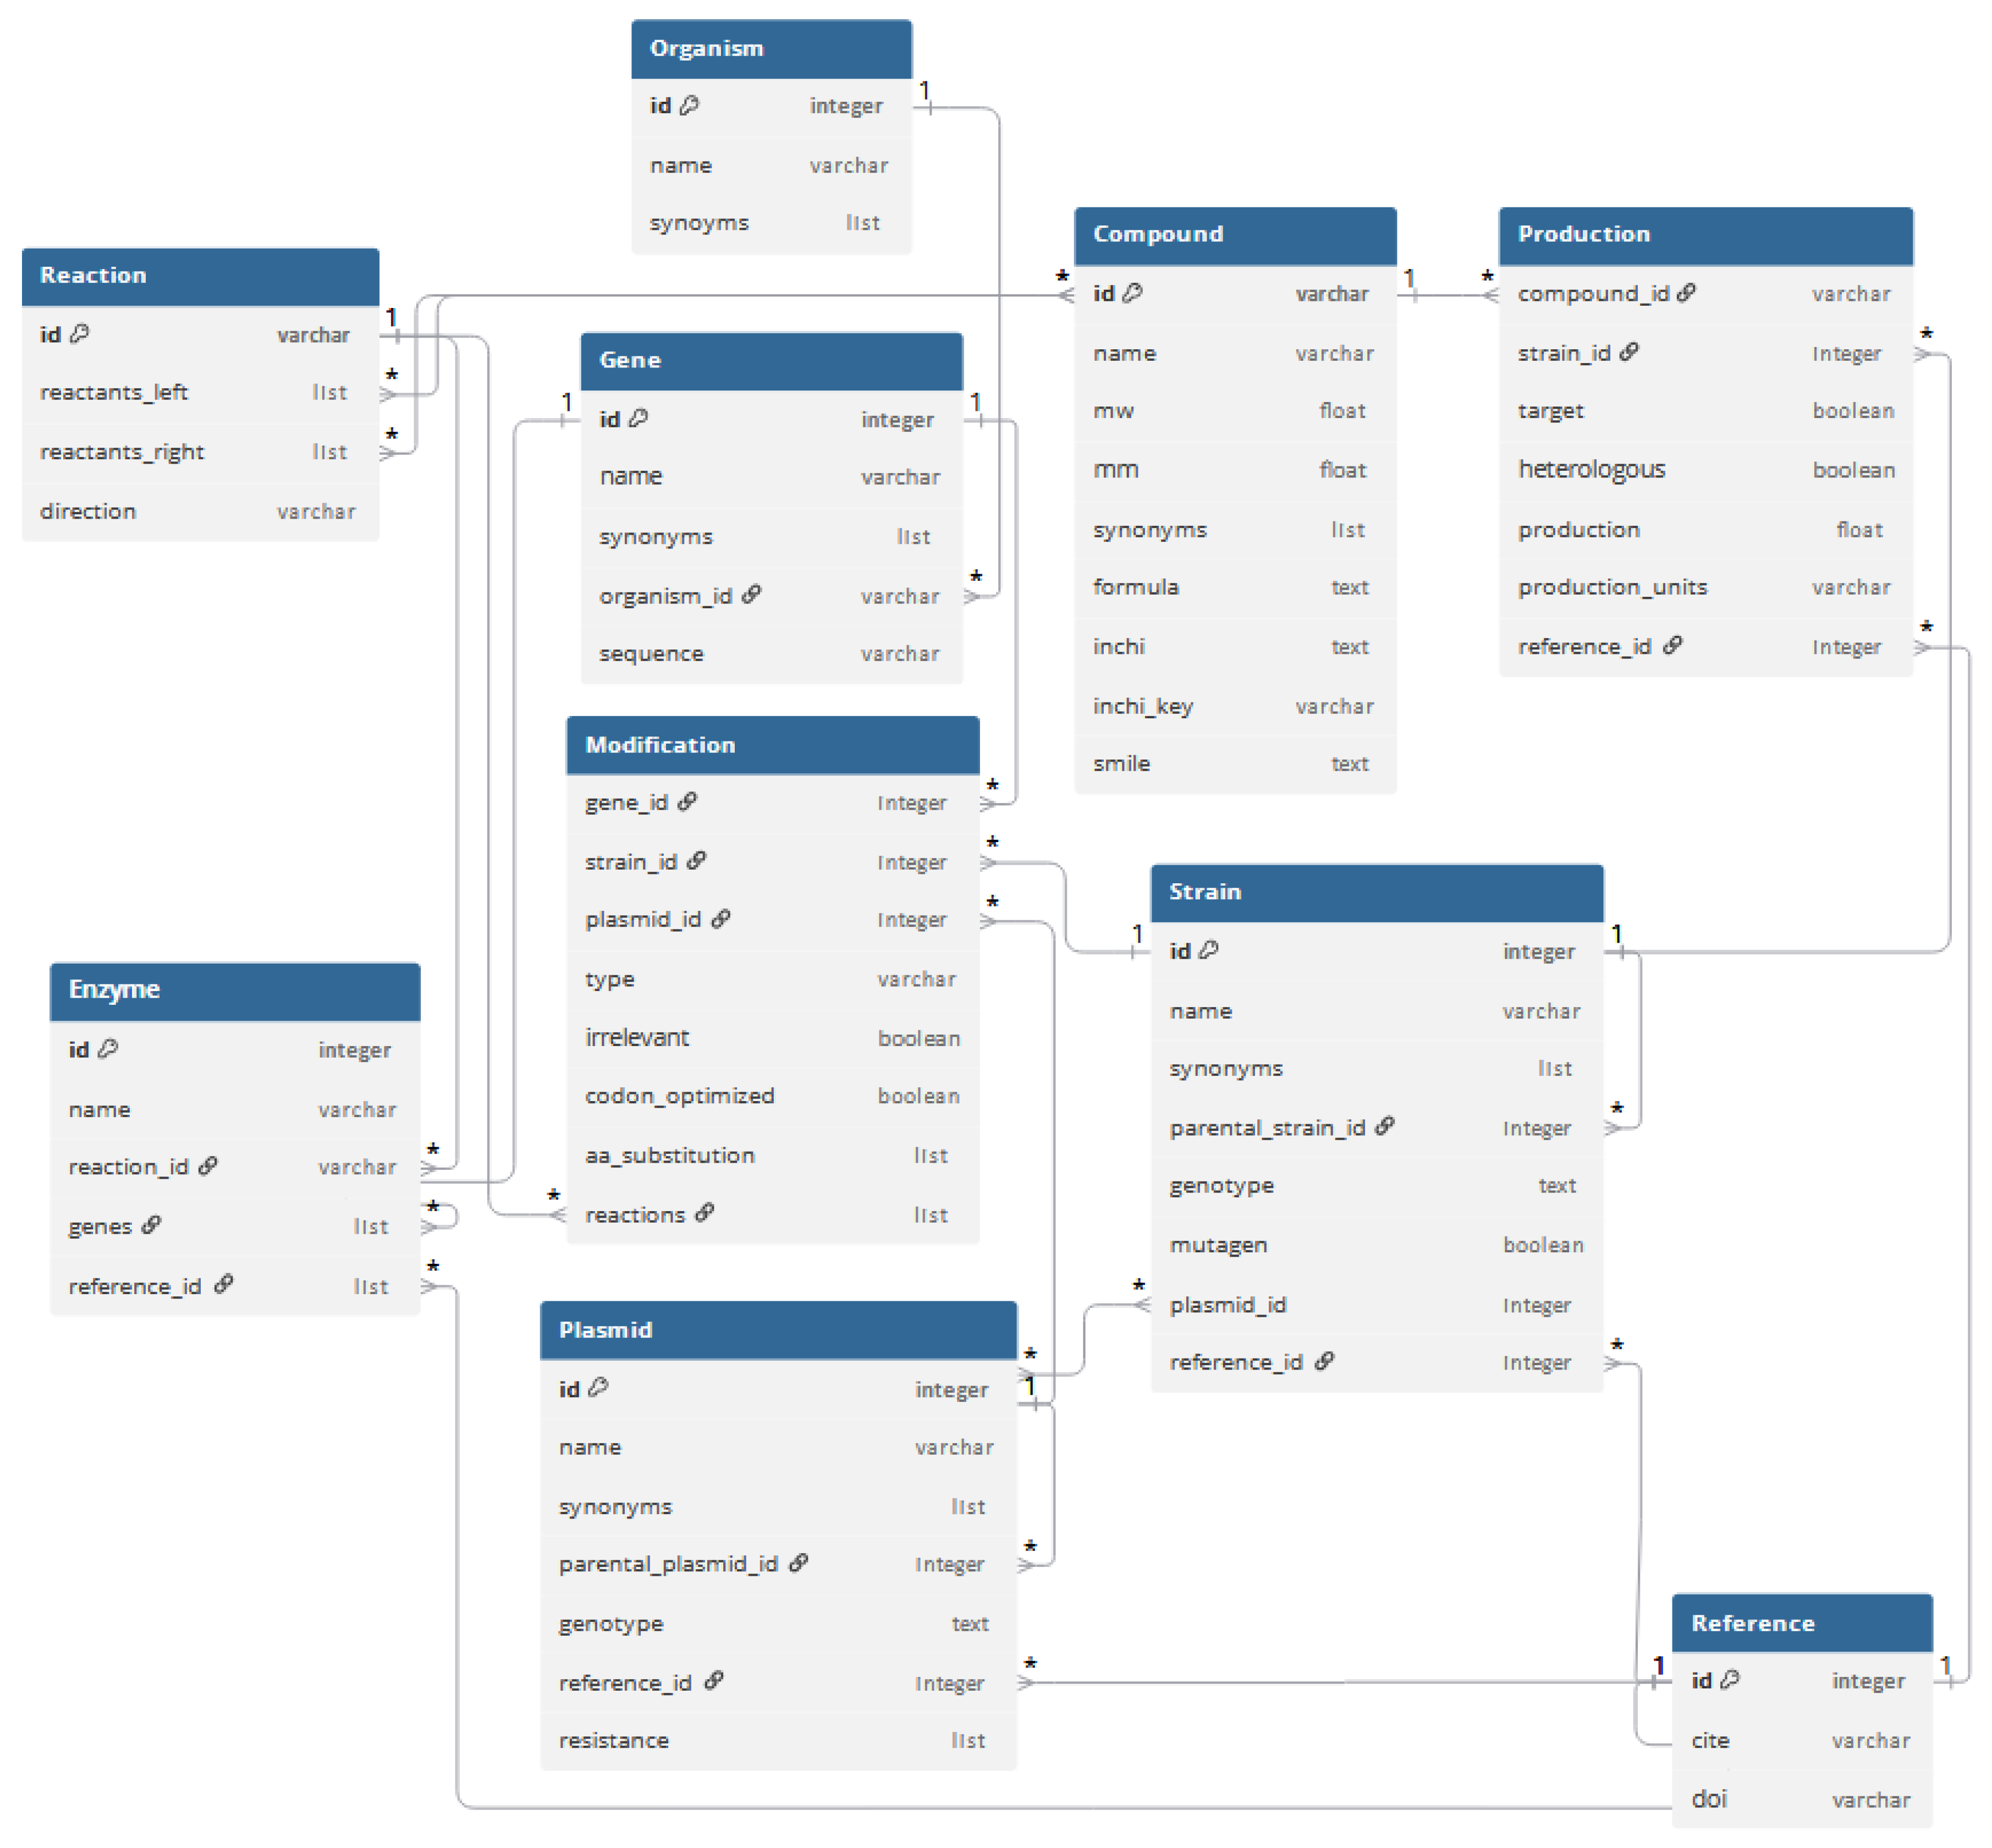

Table 1.
Null models for the leave-one-out overlap. The degree-preserving randomization holds both the frequency of each reaction and the number of reactions per metabolite fixed. It is therefore the appropriate null for a corpus in which central-metabolism reactions are annotated far more often than others.
Table 1.
Null models for the leave-one-out overlap. The degree-preserving randomization holds both the frequency of each reaction and the number of reactions per metabolite fixed. It is therefore the appropriate null for a corpus in which central-metabolism reactions are annotated far more often than others.
| Null model | Constraint preserved | Null mean ± SD (%) | Observed (%) | z | P |
|---|---|---|---|---|---|
| Uniform random sampling from iML1515 | Set size only | 14.78 ± 1.20 | 75.52 | +50.62 | < 0.001 |
| Degree-preserving (curveball) | Reaction frequency and set size | 76.94 ± 1.25 | 75.52 | -1.13 | 0.135 |
| Random filter of equal size (QPAML enrichment) | Filter size only | 3.86 ± 0.61 | 11.66 | +12.85 | < 0.001 |
| Random filter of equal size (QPAML enrichment—Centrality) |
Reaction popularity (centrality) |
10.20 ± 0.25 | 11.66 | +5.98 | < 0.001 |
Disclaimer/Publisher’s Note: The statements, opinions and data contained in all publications are solely those of the individual author(s) and contributor(s) and not of MDPI and/or the editor(s). MDPI and/or the editor(s) disclaim responsibility for any injury to people or property resulting from any ideas, methods, instructions or products referred to in the content. |
© 2026 by the authors. Licensee MDPI, Basel, Switzerland. This article is an open access article distributed under the terms and conditions of the Creative Commons Attribution (CC BY) license (http://creativecommons.org/licenses/by/4.0/).
Copyright: This open access article is published under a Creative Commons CC BY 4.0 license, which permit the free download, distribution, and reuse, provided that the author and preprint are cited in any reuse.