

Submitted:
10 September 2026
Posted:
15 September 2026
You are already at the latest version
Abstract
Freight corridors are widely assumed to be resilient when multiple route alternatives exist between key logistics nodes. However, route multiplicity—the existence of several candidate paths—does not guarantee structural redundancy in the graph-theoretic sense, where independent paths must not share critical intermediate nodes or edges [1,2]. Recent infrastructure disruptions in European logistics networks have exposed this assumption as operationally dangerous, motivating a rigorous structural analysis of apparent corridor alternatives [3,4]. A directed corridor graph was constructed from filtered road-network data covering the Benelux region and northern France. An expanded origin–destination audit was performed using nine anchor cities, generating 72 ordered OD pairs, or 71 after excluding one degenerate pair identified during data validation. For each pair, shortest paths, near-shortest alternatives, overlap metrics, bottleneck frequencies, and exact node connectivity were evaluated. Of the 71 corrected OD pairs, 28 were reachable and 27 exhibited at least two near-shortest alternatives. All retained candidate paths fell within 0.40% of the shortest-path cost, and the alternatives overlapped heavily, repeatedly traversing the same nodes and edges. Despite this multiplicity, exact connectivity validation across all 28 reachable pairs showed node connectivity equal to one for 27 of them, confirming dependence on single structural bottlenecks. The sole exception, Antwerp–Lille (k = 2), proved on closer inspection to be geographically fragile in its own right: its two formally independent paths converge within 60 metres of each other at the Lille motorway gateway. These findings have direct implications for infrastructure resilience auditing: route counting alone is insufficient to assess corridor robustness, and targeted structural investment in identified bottleneck locations is required to achieve meaningful redundancy.
Keywords:
freight corridors
; transport network resilience
; structural redundancy
; node connectivity
; bottleneck analysis
; route overlap
; graph theory
; OpenStreetMap
; European logistics networks
1. Introduction
Freight corridors are critical components of regional and international logistics systems. Large volumes of goods travel through a limited number of transport axes that connect major ports, distribution centres, and industrial regions. Disruptions along these corridors can, therefore, have disproportionate impacts on supply chains and regional economies.
The vulnerability of European freight corridors has been repeatedly underscored by recent disruptions. The 2018 Rhine low-water crisis reduced the inland waterway barge capacity by over 75% along the busiest freight corridor in Europe, diverting a massive load onto the road infrastructure that proved structurally ill-equipped to absorb it [5]. The COVID-19 pandemic subsequently revealed cascading dependencies within supply chains that planners had presumed were safeguarded by route diversity [6]. Port congestion events at Antwerp and Rotterdam, together handling over 30% of European container throughput, have repeatedly demonstrated that freight rerouting options converge on shared infrastructure [7]. Infrastructure failures of this kind, whether caused by accidents, weather events, or planned maintenance, can simultaneously disable several apparent route alternatives when those alternatives share structural bottlenecks. This paper examines that vulnerability systematically.
Transport networks are frequently considered resilient when several route alternatives appear available between important locations. However, in many practical situations, these alternatives may depend on the same underlying infrastructure. Routes that appear distinct at the map level may still converge on common nodes or links, meaning that a single disruption can disable several alternatives simultaneously.
Transport network resilience has been conceptualised through several complementary lenses. Holling’s (1973) foundational ecological framing defines resilience as the capacity of a system to absorb disturbance and reorganise while undergoing change [8]. Applied to infrastructure, Bruneau et al. (2003) characterise resilience across four dimensions: robustness, redundancy, resourcefulness, and rapidity. Of these, redundancy, which is the existence of independent, substitutable pathways, is most directly relevant to the present study [9]. Berdica (2002) defines network vulnerability as susceptibility to incidents that produce considerable reductions in serviceability [4], while Reggiani, Nijkamp & Lanzi (2015) distinguish resilience (adaptive capacity) from vulnerability (exposure), a distinction that grounds this paper’s focus on topological structure rather than operational response [3]. Within this framework, structural redundancy is a precondition for resilience: a network cannot recover from targeted failures if no structurally independent alternative paths exist.
A critical but often overlooked distinction separates route multiplicity from structural redundancy. ’Route multiplicity’ refers to the existence of multiple candidate paths between an origin-destination pair, a condition commonly evaluated using k-shortest path algorithms [10,11]. However, structural redundancy requires those paths to be internally node-disjoint or edge-disjoint. Specifically, they do not share any intermediate node or edge, ensuring that the failure of a single network component does not eliminate all available routing options [1,12]. This distinction is formalised through the concept of node connectivity k(u,v), defined as the minimum number of nodes whose removal disconnects nodes u and v [2]. A corridor exhibiting k=1 for an origin–destination pair depends structurally on a single intermediate node: its removal is sufficient to disconnect the pair entirely, regardless of how many apparent route alternatives exist. Existing transport resilience studies have not routinely applied this formal criterion to real corridor networks, instead inferring redundancy from the count of k-shortest paths [13,14]. This paper addresses that gap directly.
Existing studies on transport resilience often focus on accessibility loss, disruption scenarios, or travel-time impacts. While these approaches provide valuable insights into network performance, they do not necessarily establish whether alternative routes correspond to structurally independent pathways.
The objective of this study is therefore to examine the structural redundancy of a real freight corridor by analysing the relationship between route alternatives, network overlap, and connectivity constraints. The analysis focuses on a corridor spanning the Benelux region and northern France, an area characterised by dense infrastructure and significant freight activity.
This study makes three specific contributions. First, it applies formal node connectivity analysis to a real European freight corridor, establishing whether apparent route diversity translates into structural redundancy. Second, it introduces a bottleneck frequency audit that identifies the specific nodes and edges responsible for route convergence, providing spatially explicit targets for infrastructure investment. Third, it demonstrates through an expanded nine-city origin–destination matrix that k=1 is the dominant structural condition in this corridor, which means single-node failures can disconnect most key freight pairs, with Antwerp–Lille representing a notable higher-redundancy exception that merits a specific examination.
Three research questions guide the analysis:
- How common are alternatives to the near-shortest route within the corridor network?
- To what extent do these alternatives overlap on shared nodes and edges?
- Do key origin–destination pairs exhibit meaningful structural redundancy when evaluated using node connectivity?
By combining route enumeration, overlap analysis, bottleneck identification, and connectivity validation, the study aims to clarify whether apparent route diversity within a real corridor translates into meaningful structural resilience.
2. Literature Review
2.1. Transport Network Resilience
Transport network resilience has attracted growing academic attention following high-profile infrastructure disruptions, supply chain crises, and increasing awareness of critical infrastructure interdependencies [15,16]. Early conceptualisations drew on ecological systems theory, where Holling (1973) defined resilience as the capacity to absorb perturbation without shifting to a qualitatively different state [8]. This perspective was later adapted for engineered systems by Bruneau et al. (2003), who introduced a four-dimensional framework for resilience that encompasses robustness, redundancy, resourcefulness, and rapidity. This framework continues to be extensively referenced in infrastructure studies [9].
In the transport domain specifically, Berdica (2002) introduced a vulnerability-centered approach, defining road network vulnerability as susceptibility to incidents that cause significant serviceability reductions [4]. This was extended by Jenelius, Petersen & Mattsson (2006), who operationalised vulnerability through the concepts of importance (the consequence of a link’s failure) and exposure (the probability of disruption), applying these to the Swedish road network [13]. Reggiani, Nijkamp & Lanzi (2015) subsequently synthesised resilience and vulnerability frameworks, arguing that transport resilience must account for both the topology of the network and the behavioural responses of its users [3].
Freight-specific resilience has received comparatively less attention than passenger transport [17]. Lam & Yap (2011) examined port resilience in the context of hub competition, finding that even highly connected port systems exhibit structural dependencies that single-point failures can expose [7]. Ivanov (2020) documented cascading supply chain disruptions during the COVID-19 pandemic, demonstrating that apparent redundancy in logistics networks frequently masks correlated failure exposure [6] a phenomenon closely related to the structural bottleneck problem examined in this paper.
2.2. Route Alternatives and Network Redundancy
The assessment of route alternatives in transport networks has been approached primarily through the enumeration of the shortest-path and k-shortest-path. Yen’s (1971) algorithm for computing the k loopless shortest paths in a directed network remains a foundational tool, enabling the identification of multiple candidate routes between any origin–destination pair [10]. Eppstein (1998) extended this to near-linear time complexity, facilitating application to large-scale networks eppstein1998. These algorithmic tools have been widely applied in transport planning to assess routing flexibility.
However, the existence of k paths between two nodes does not establish that those paths are structurally independent. Scott et al. (2006) introduced the network robustness index to identify critical links in transport networks, showing that the removal of a small number of links could produce disproportionate accessibility losses [14], a finding consistent with the bottleneck concentration observed in the present study. Jenelius et al. (2006) similarly found that network vulnerability is highly concentrated on a small subset of links, rather than distributed uniformly [13].
The formal criterion for structural independence between paths is internal node-disjointness or edge-disjointness [1]. Menger’s theorem establishes that the maximum number of internally disjoint paths between two nodes equals the node connectivity k(u,v) – the minimum vertex cut separating them. Whitney (1932) formalised this connectivity measure as a global network property [2]. Ford & Fulkerson (1956) subsequently demonstrated the equivalence between maximum flow and minimum cut, providing a computationally tractable basis for connectivity evaluation [12]. Despite the theoretical clarity of these measures, their application to real transport corridor analysis remains limited. Most applied transport studies infer redundancy from path counts rather than path independence [18].
Crucitti, Latora & Porta (2006) demonstrated that urban street networks exhibit highly uneven distributions of centrality, with a small number of streets bearing disproportionate topological importance [19], a structural parallel to the freight corridor bottlenecks identified here. Cats (2017) applied network vulnerability methods to public transport, finding that the removal of individual stops could produce system-wide disruptions, a finding that underscores the relevance of connectivity-based analysis beyond road networks.
2.3. Network Abstraction and Corridor Modelling
The extraction of road networks from open geographic data has become standard practice in transport analysis. OpenStreetMap (OSM) provides freely available, globally consistent road network data that has been validated as sufficiently accurate for network-level analysis in well-mapped regions [20,21]. Haklay (2010) found OSM positional accuracy to be within 6 metres of Ordnance Survey data for 80% of roads in England, while completeness is consistently high for primary and motorway infrastructure in densely populated regions such as Benelux [21].
The OSMnx library (Boeing, 2017) enables systematic extraction, projection, and analysis of OSM road networks as directed NetworkX graphs, providing a reproducible infrastructure for the type of directed corridor graph analysis conducted here [22]. Boeing (2017) demonstrated the validity of this approach in 27 world cities, showing that OSM-derived graphs reproduce the structural properties of reference datasets with high fidelity. The directed nature of such graphs is critical for freight corridor analysis, as one-way infrastructure constraints are operationally significant at the macro level [23].
Corridor-level network abstraction necessarily involves filtering decisions about which road types to retain and can substantially affect graph topology. substantially affect graph topology. Studies using highway-level filtering (motorways, primary roads) produce sparser graphs that may yield more unreachable OD pairs but better represent the infrastructure used by heavy freight vehicles. Studies retaining secondary roads produce denser graphs with higher apparent reachability but more complex path overlap patterns. The appropriate level of abstraction depends on the research question; for the analysis of the freight corridor, a filter retaining motorways (highway = motorway) and primary roads (highway = trunk, primary) is standard [17,22].
2.4. Research Gap
Despite substantial literature on transport vulnerability, route alternatives, and network resilience, a specific gap remains: applied corridor studies rarely verify whether enumerated route alternatives correspond to structurally independent pathways in the graph-theoretic sense. Studies that implement k-shortest path enumeration typically report the number of alternatives without assessing their internal node-disjointness [10]. Vulnerability studies focus on accessibility loss and travel time degradation following link or node removal [13,14], rather than on whether alternative routes were structurally independent before the disruption occurred. Resilience frameworks identify system properties at an aggregate level [3,9] without decomposing those properties to specific origin–destination pair connectivity.
This gap is particularly consequential for the planning of the freight corridor, where infrastructure investment decisions depend on accurate assessments of effective redundancy. If route multiplicity is mistaken for structural independence, planners may conclude that corridors are more resilient than they actually are, a form of hidden fragility that only becomes visible when disruptions occur. This paper addresses that gap by combining route enumeration with exact node connectivity computation for a real European freight corridor, providing a replicable methodology for structural redundancy auditing that can be applied to other corridors and extended to incorporate demand weighting.
3. Data and Methods
3.1. Study Area
The analysis focuses on a freight corridor connecting major urban and logistics centers in the Benelux region and northern France.
Figure 1.
Directed corridor graph with anchor locations used in the OD redundancy audit.
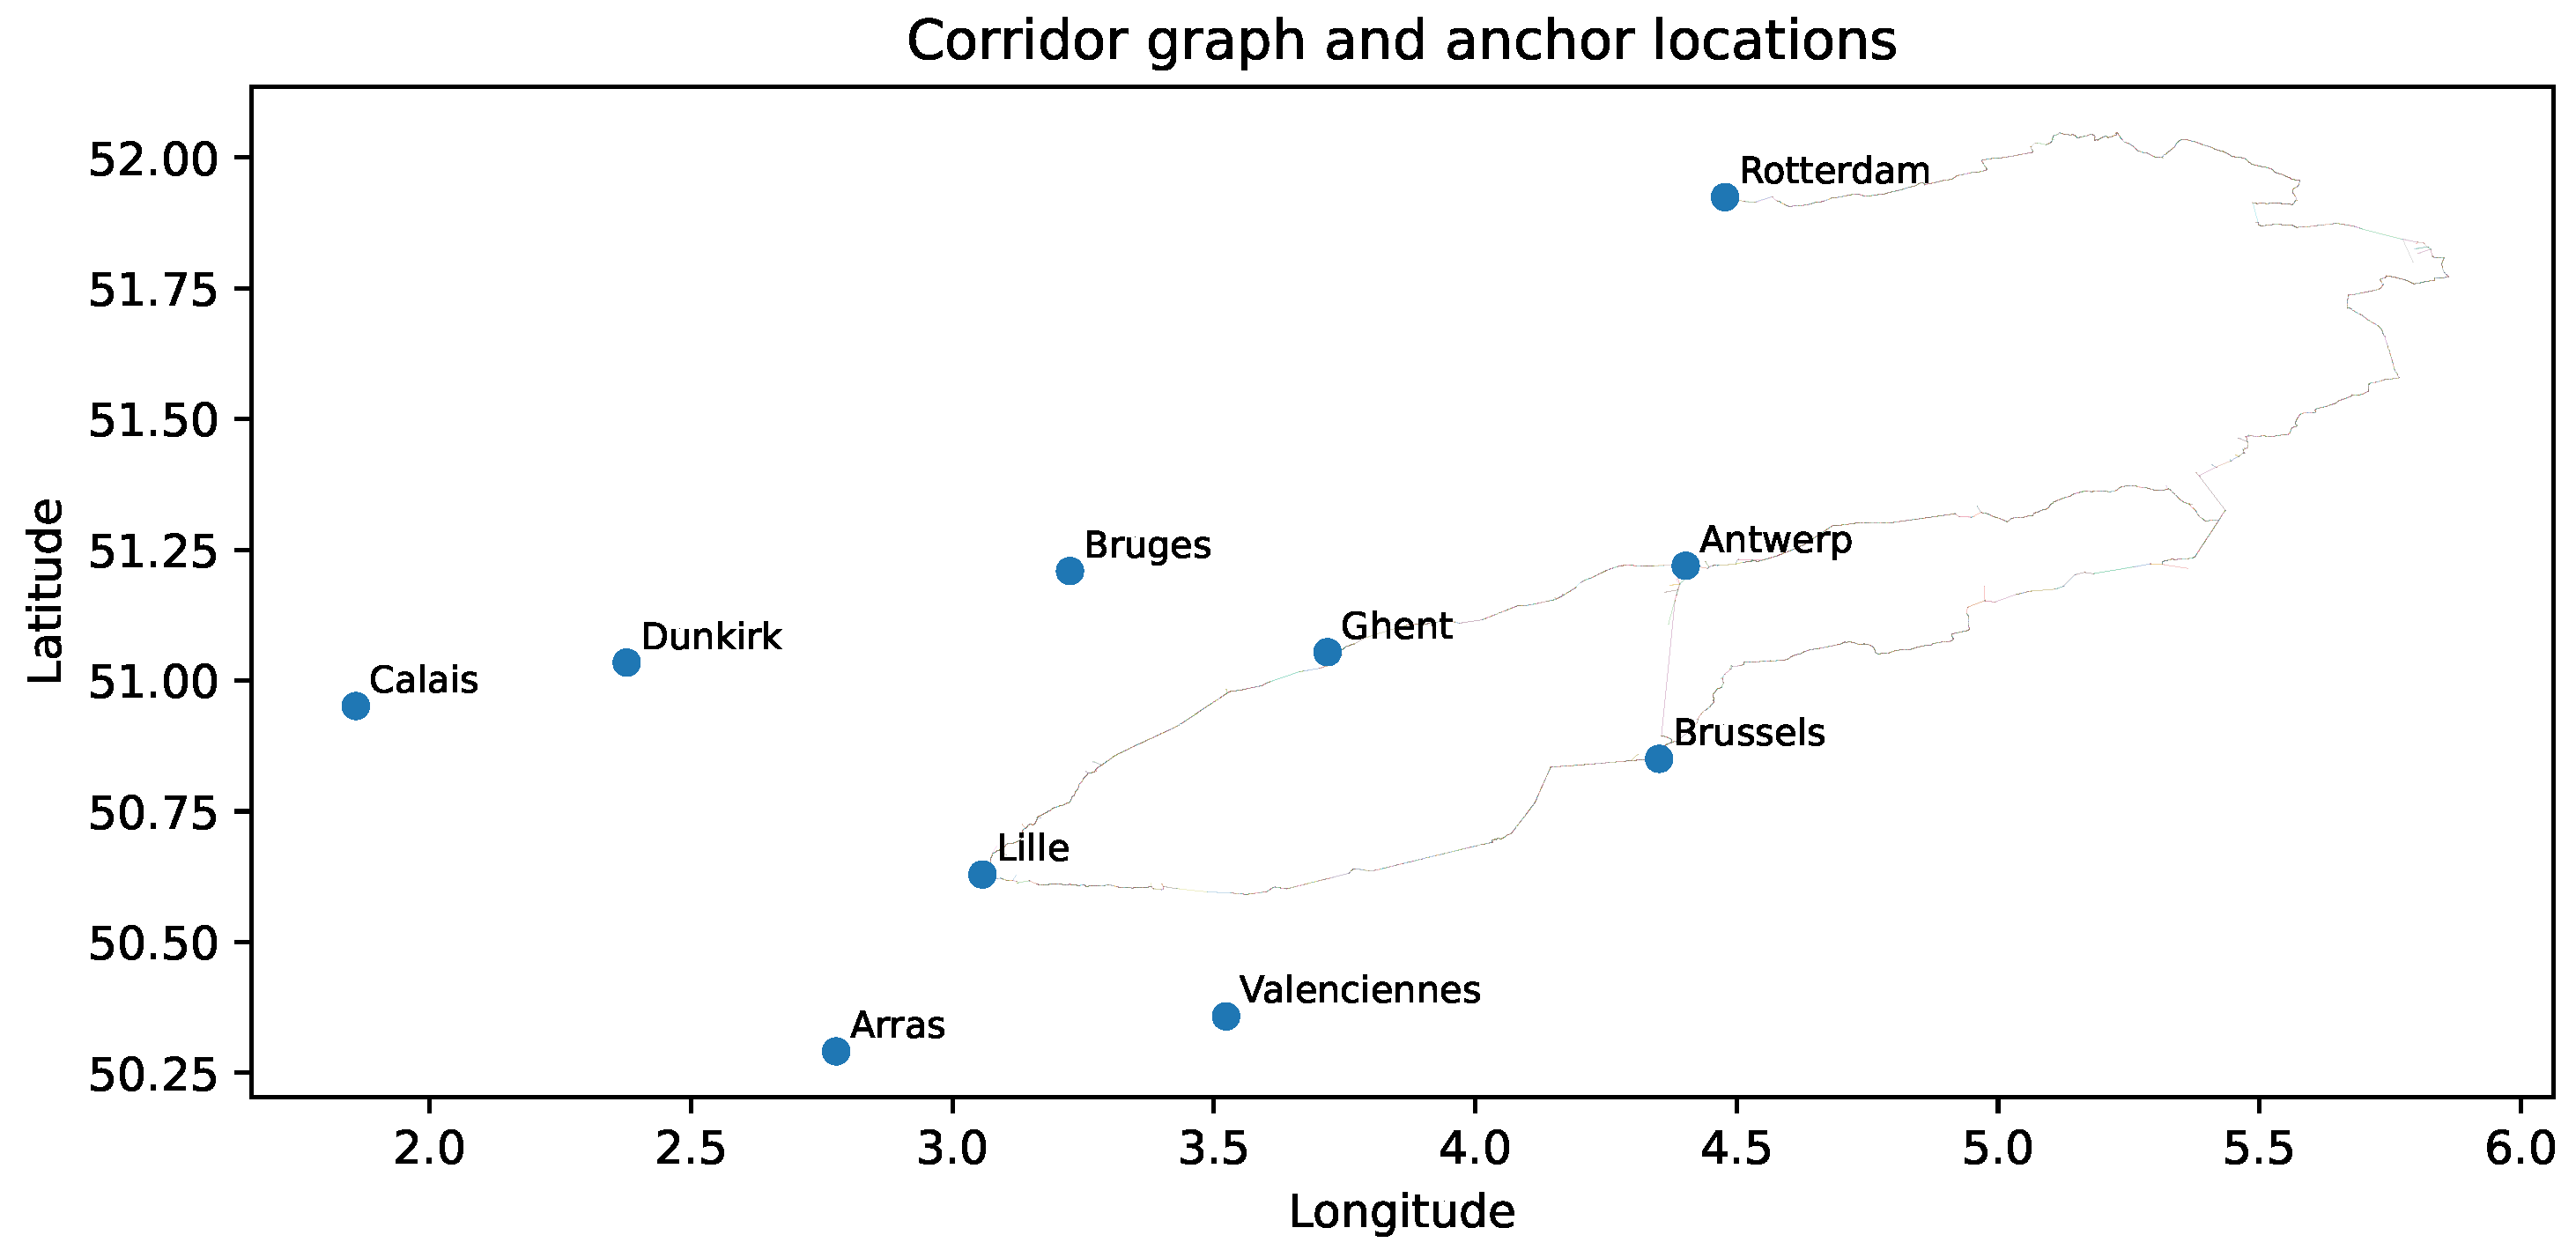
The Benelux–northern France corridor is among the highest-density freight zones in Europe, connecting the ports of Rotterdam and Antwerp together handling approximately 560 million tons of goods annually and serving as primary gateways for Northern European supply chains [24]. The corridor sits within the North Sea–Mediterranean TEN-T Core Network Corridor, formally designated by the European Union as critical freight infrastructure requiring resilience investment [25]. Its geographic compactness spanning approximately 250 km makes it an ideal laboratory for structural redundancy analysis: large enough to contain meaningful infrastructure variation, small enough for complete graph enumeration.
3.2. Network Construction
The road network was derived from OpenStreetMap data and filtered to retain corridor-relevant infrastructure. The resulting graph representation is directed and weighted by link length.
A directed graph representation was chosen because freight movement on motorway and trunk road infrastructure is subject to directionality constraints — one-way links, interchange geometries, and junction restrictions that make many nominally bidirectional routes asymmetric at the operational level [22,23]. A directed representation preserves these constraints, producing a more conservative and realistic estimate of reachability than an undirected simplification would permit.
3.3. Anchor Selection and Route Enumeration
Candidate alternative routes were generated using Yen’s (1971) k-shortest loopless paths algorithm [10], retaining the five shortest simple paths (k=5) per reachable OD pair. Rather than imposing an a priori detour length threshold, the retained candidate pool is characterized through its empirical detour ratio distribution. The detour ratio for candidate path i relative to OD pair (u,v) is defined as:
where L_SP is the graph-weighted cost of the shortest path and is the cost of the ith candidate path, both expressed in OSM link-length units. The empirical distribution of across all retained paths is reported in Table 1.
During data validation, one OD pair: Lille → Dunkirk, was identified as degenerate and excluded from the corrected analysis. Although the path between these anchors spans 45 edges and 46 nodes in the directed graph, the anchor node registered as "Dunkirk" (OSM node 251058778, lon 3.043, lat 50.629) was found during nearest-node snapping to resolve to a motorway access point located approximately 1.5 km from the Lille anchor within the Lille metropolitan area and not near the geographic city of Dunkirk (lon 2.377, lat 51.034). This occurred because the filtered directed graph does not contain a reachable node proximate to Dunkirk’s true coordinates at the motorway level filtering applied. The same node (251058778) was also identified as the nearest reachable node for the Calais anchor, confirming that both western coastal cities resolved to the same graph location during snapping. This pair is retained in the full dataset for completeness but excluded from all substantive analysis; its detour ratio of 50.979% is an artefact of anchor proximity rather than a real freight routing alternative.
After excluding the degenerate Lille → Dunkirk pair, all 108 retained candidate paths fall within 0.397% of their respective shortest-path costs, with a median detour of 0.006% (Table 1). The candidate pool therefore consists exclusively of operationally near-identical alternatives, paths that any routing system would treat as equivalent to the shortest path. This tight empirical distribution provides an independent methodological justification for the near-shortest framing and establishes that the high overlap statistics reported in Section 4.2 are not a consequence of a permissive detour threshold but of genuine structural network topology.
Ten initial anchor cities were selected to represent the major freight origins, destinations, and transit hubs of the corridor region (Table 2). During nearest-node snapping in the filtered directed graph, the geographic coordinates of both Calais (lon 1.859, lat 50.951) and Dunkirk (lon 2.377, lat 51.034) resolved to the same motorway access node (OSM ID 251058778, lon 3.043, lat 50.629), as neither city’s true coordinates fell within reach of a connected motorway-level node in the directed representation. Following deduplication, nine unique anchor nodes were retained, generating 9 × 8 = 72 ordered OD pairs for the full analysis, and 71 pairs in the corrected dataset after exclusion of the degenerate Lille→Dunkirk case.

Table 2.
Anchor cities used to construct origin–destination pairs in the corridor audit
| City | Node ID | Longitude | Latitude |
|---|---|---|---|
| Rotterdam | 12755368407 | 4.4777 | 51.9244 |
| Antwerp | 11463647940 | 4.4025 | 51.2194 |
| Brussels | 94597279 | 4.3517 | 50.8503 |
| Lille | 494563683 | 3.0573 | 50.6292 |
| Ghent | 36892129 | 3.7174 | 51.0543 |
| Bruges | 6808123232 | 3.2247 | 51.2093 |
| Dunkirk | 251058778 | 2.3768 | 51.0344 |
| Calais | 251058778 | 1.8587 | 50.9513 |
| Arras | 6267747834 | 2.7775 | 50.2910 |
| Valenciennes | 8184367142 | 3.5233 | 50.3579 |
3.4. Sensitivity Analysis
In this study, a formal sensitivity analysis was not conducted varying the number of shortest paths retained per OD pair (k = 3, 5, 10). The k=1 dominance result from exact node connectivity computation is independent of k, since node connectivity is a property of the full graph structure rather than of the enumerated path pool. The overlap statistics, however, are k-dependent in principle: a larger k might surface candidates that diverge more substantially from the shortest path. In the present study, the empirical detour distribution (maximum 0.397% for the corrected dataset) suggests that increasing k is unlikely to yield structurally independent alternatives within the corridor, since the network topology constrains all reasonable alternatives to the same corridor backbone. Systematic sensitivity testing across k values represents a recommended extension of this methodology.
3.5. Structural Metrics
The node connectivity k(u,v) for an ordered pair (u,v) is defined as the minimum number of internal nodes whose removal eliminates all the paths from u to v in the directed graph. By Menger’s theorem (1927), k(u,v) equals the maximum number of internally node-disjoint paths from u to v [1]. A value of k=1 indicates that a single intermediate node constitutes a minimum vertex cut: its removal disconnects the origin–destination pair. A value of indicates at least two structurally independent paths exist. Node connectivity was computed exactly using maximum-flow algorithms [12], as implemented in NetworkX [26].
To ensure the integrity of the reported results, a systematic validation procedure was applied to the processed graph, anchor node assignments, and OD redundancy report prior to analysis. This procedure comprised four steps.
First, anchor node snapping was audited by verifying the geographic coordinates of each resolved anchor node against the intended city location. This identified the Calais–Dunkirk duplication (Section 3.3) and the Lille → Dunkirk degenerate OD pair.
Second, graph connectivity for the degenerate pair was confirmed directly using NetworkX shortest-path computation, establishing that the 1,524m path consists of 45 genuine graph edges rather than a snapping artifact in the graph structure.
Third, the full distribution of the detour ratio was calculated for all retained KSP paths under both the full and corrected datasets, confirming the 0.397% maximum detour for the corrected pool.
Fourth, overlap statistics were recomputed under both dataset conditions, confirming stability of the mean shared internal node ratio (0.9994 corrected vs. 0.9994 full) and shared edge ratio (0.9984 corrected vs. 0.9982 full).
The robustness of the overlap result to the presence or absence of the degenerate pair confirms that the structural finding is not driven by the anomalous case.
4. Results
4.1. Reachability and Route Multiplicity
The corrected audit considered nine unique anchor nodes representing major cities within the corridor region, generating 71 ordered OD pairs after exclusion of the degenerate Lille → Dunkirk case (see Section 3.3 for full explanation; the complete 72-pair dataset yields identical structural conclusions).
Of the 71 corrected OD pairs, 28 were reachable under the directed network representation, while the remaining 43 did not have a feasible path within the extracted corridor graph. Among the 28 reachable OD pairs, 27 exhibited at least two near-shortest alternative routes.
Table 3.
OD Audit Summary (Corrected)
| Metric | Full dataset | Corrected (excl. Lille→Dunkirk) |
|---|---|---|
| Input anchor cities | 10 | 10 |
| Unique anchor nodes (after snapping) | 9 | 9 |
| Ordered OD pairs evaluated | 72 | 71† |
| Reachable OD pairs | 29 | 28 |
| Unreachable OD pairs | 43 | 43 |
| OD pairs with near-shortest routes | 28 | 27 |
| OD pairs with node-disjoint routes (KSP pool) | 0 | 0 |
† One pair (Lille→Dunkirk) excluded as degenerate due to anchor snapping artefact; see Section 3.3 for full explanation.
Figure 2.
Reachability and redundancy across ordered origin-destination pairs in the expanded corridor audit. White diagonal cells indicate identical origin and destination. Darker categories distinguish unreachable pairs from reachable pairs with overlapping alternatives and the limited cases of higher-order redundancy.
Figure 2.
Reachability and redundancy across ordered origin-destination pairs in the expanded corridor audit. White diagonal cells indicate identical origin and destination. Darker categories distinguish unreachable pairs from reachable pairs with overlapping alternatives and the limited cases of higher-order redundancy.
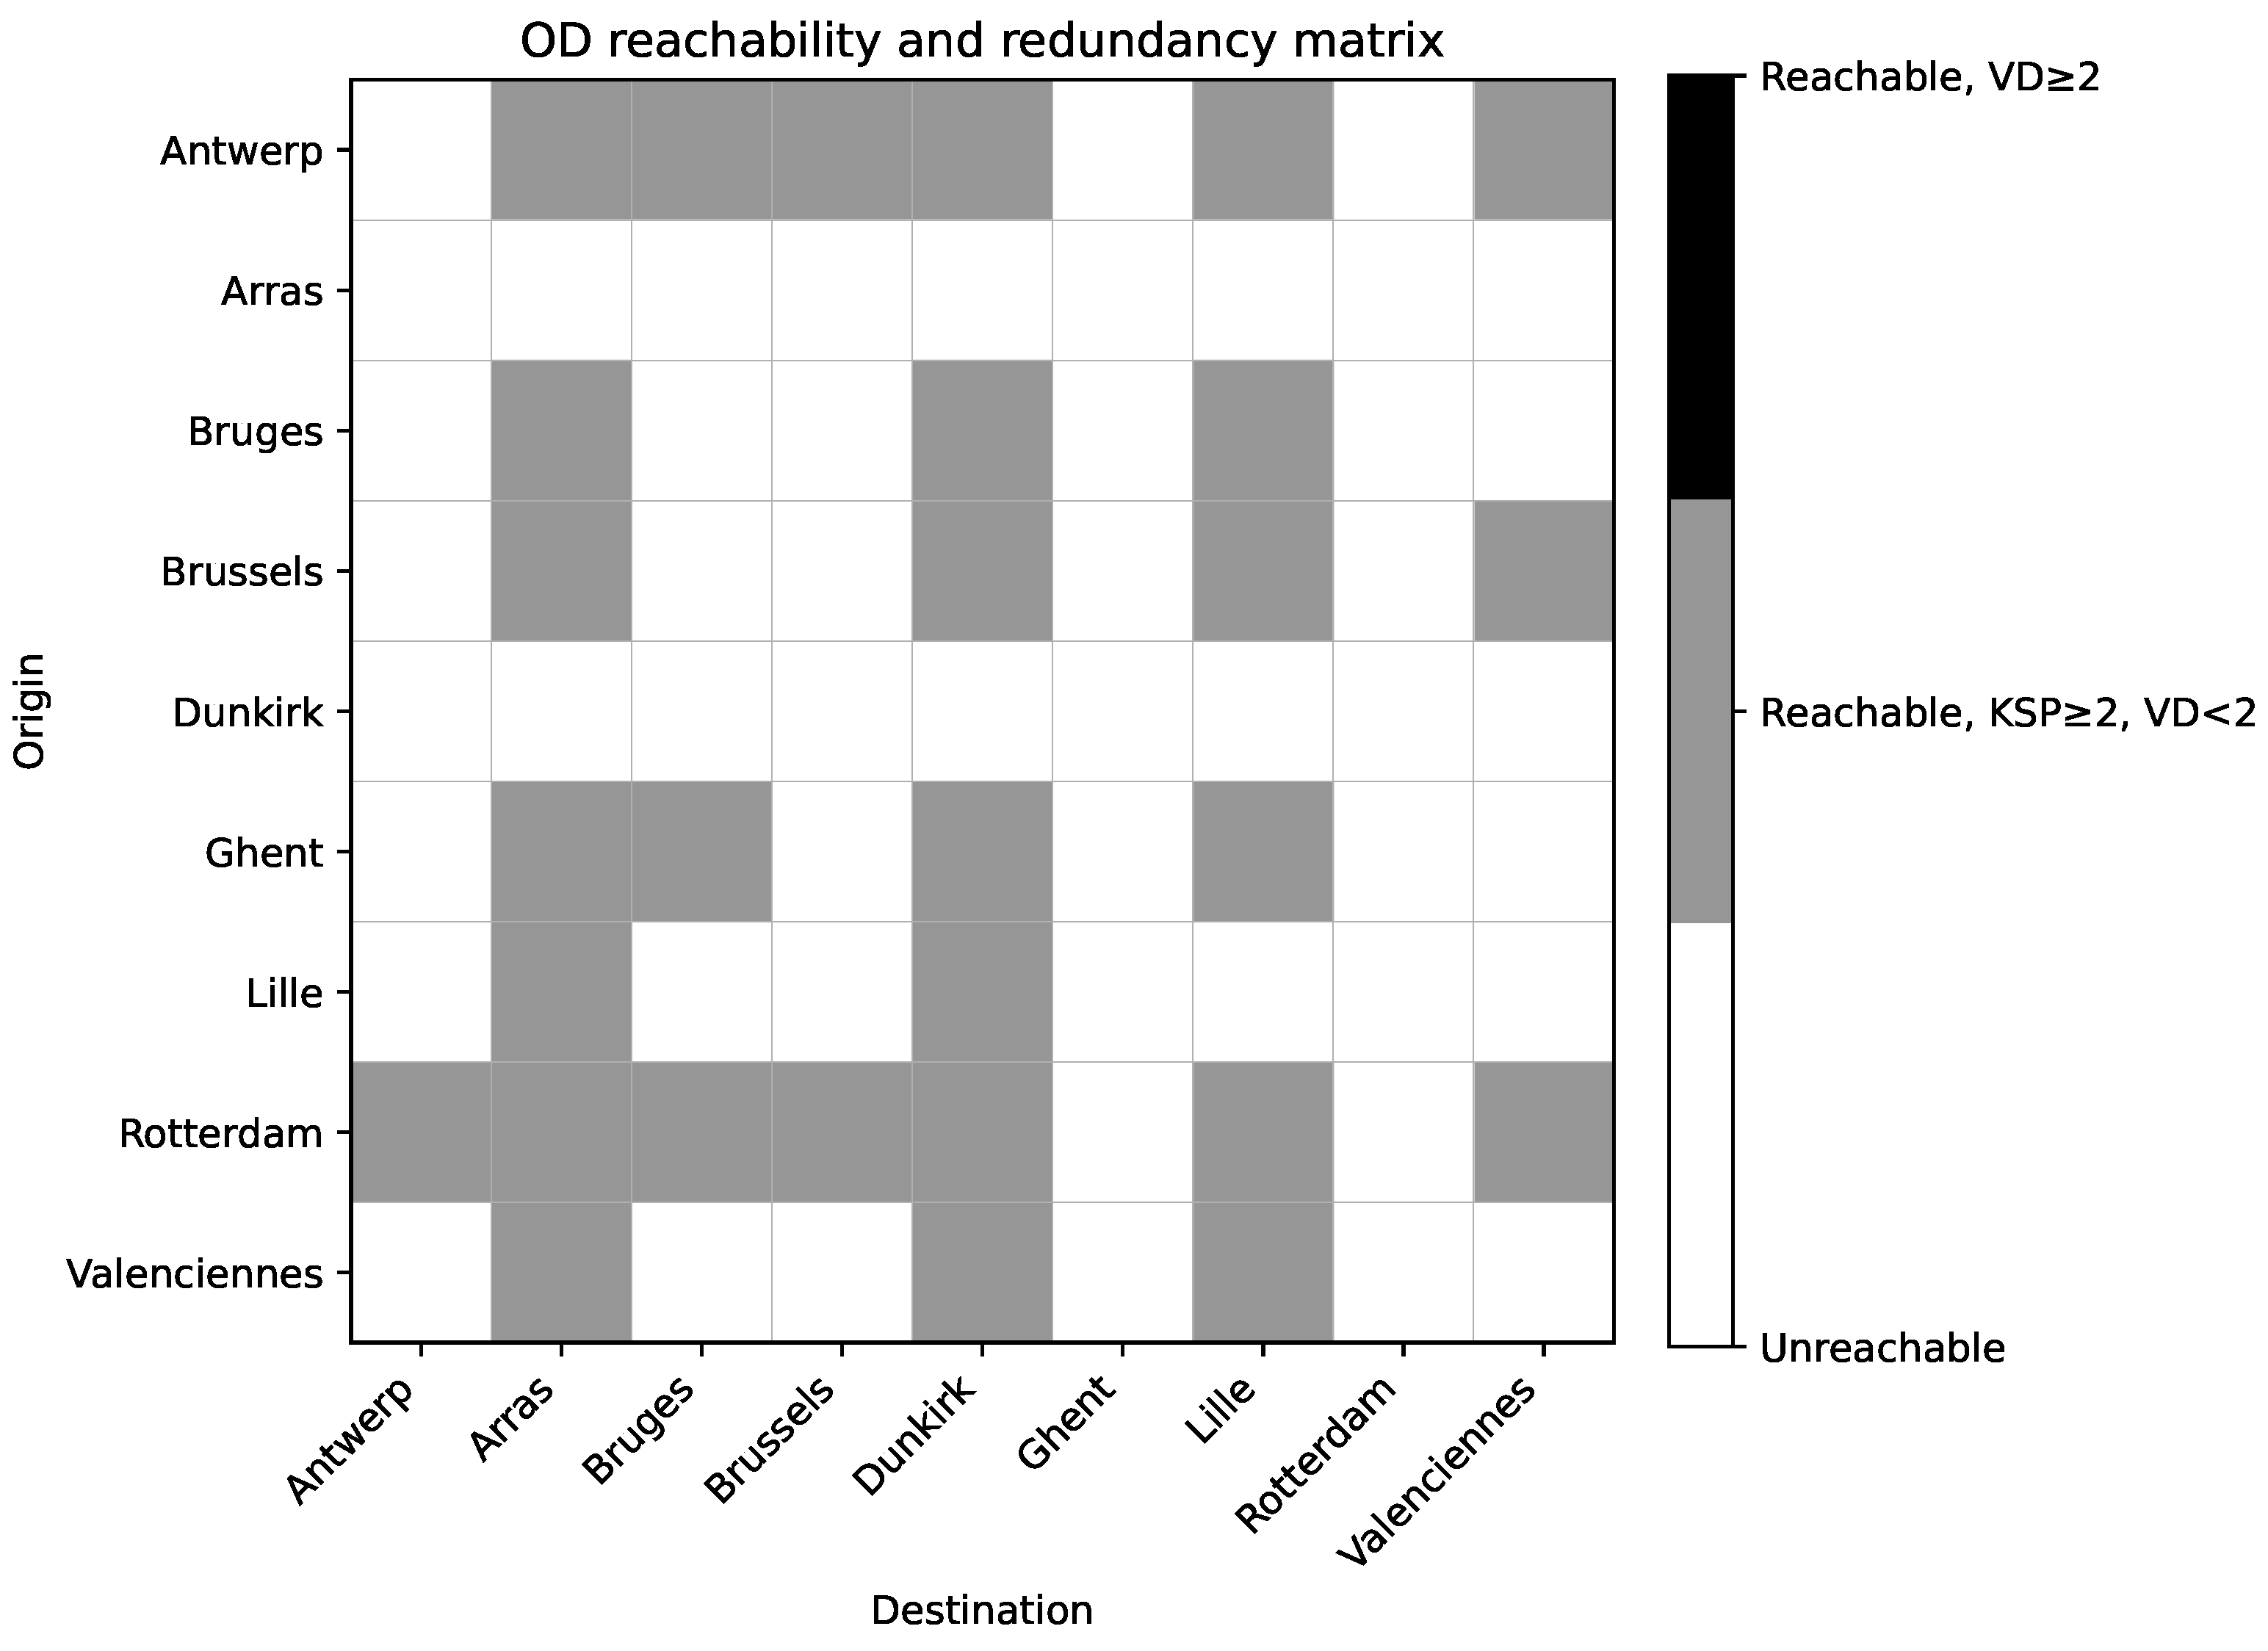
Despite the presence of multiple candidate routes for most reachable OD pairs, the analysis found no cases in which two disjoint node paths could be identified within the retained set of near-shortest alternatives. These findings confirm that route multiplicity is common within the corridor network but do not imply structural independence between routes.
4.2. Overlap of Alternative Routes
To evaluate the structural independence of alternative routes, pairwise overlap metrics were computed for the sets of near-shortest paths associated with each reachable OD pair. Two measures were considered: the proportion of shared internal nodes and the proportion of shared edges between routes.
Table 4.
Summary statistics for overlap between near-shortest route alternatives
| Metric | Mean | Median | P90 | P95 |
|---|---|---|---|---|
| Shared internal node ratio | 0.9994 | 1.0000 | 1.0000 | 1.0000 |
| Shared edge ratio | 0.9984 | 0.9992 | 0.9997 | 0.9997 |
Among the 108 corrected alternative paths, the overlap values were consistently extreme. The mean shared internal node ratio was 0.9994 (median 1.00), and the mean shared edge ratio was 0.9984 (median 0.999). In the vast majority of reachable OD pairs, all near-shortest alternatives pass through an identical set of intermediate nodes — a condition under which the existence of k alternative routes provides zero structural protection against the failure of the targeted node [27].
Figure 3.
Distribution of shared internal-node and shared-edge overlap ratios across near-shortest path alternatives.
Figure 3.
Distribution of shared internal-node and shared-edge overlap ratios across near-shortest path alternatives.
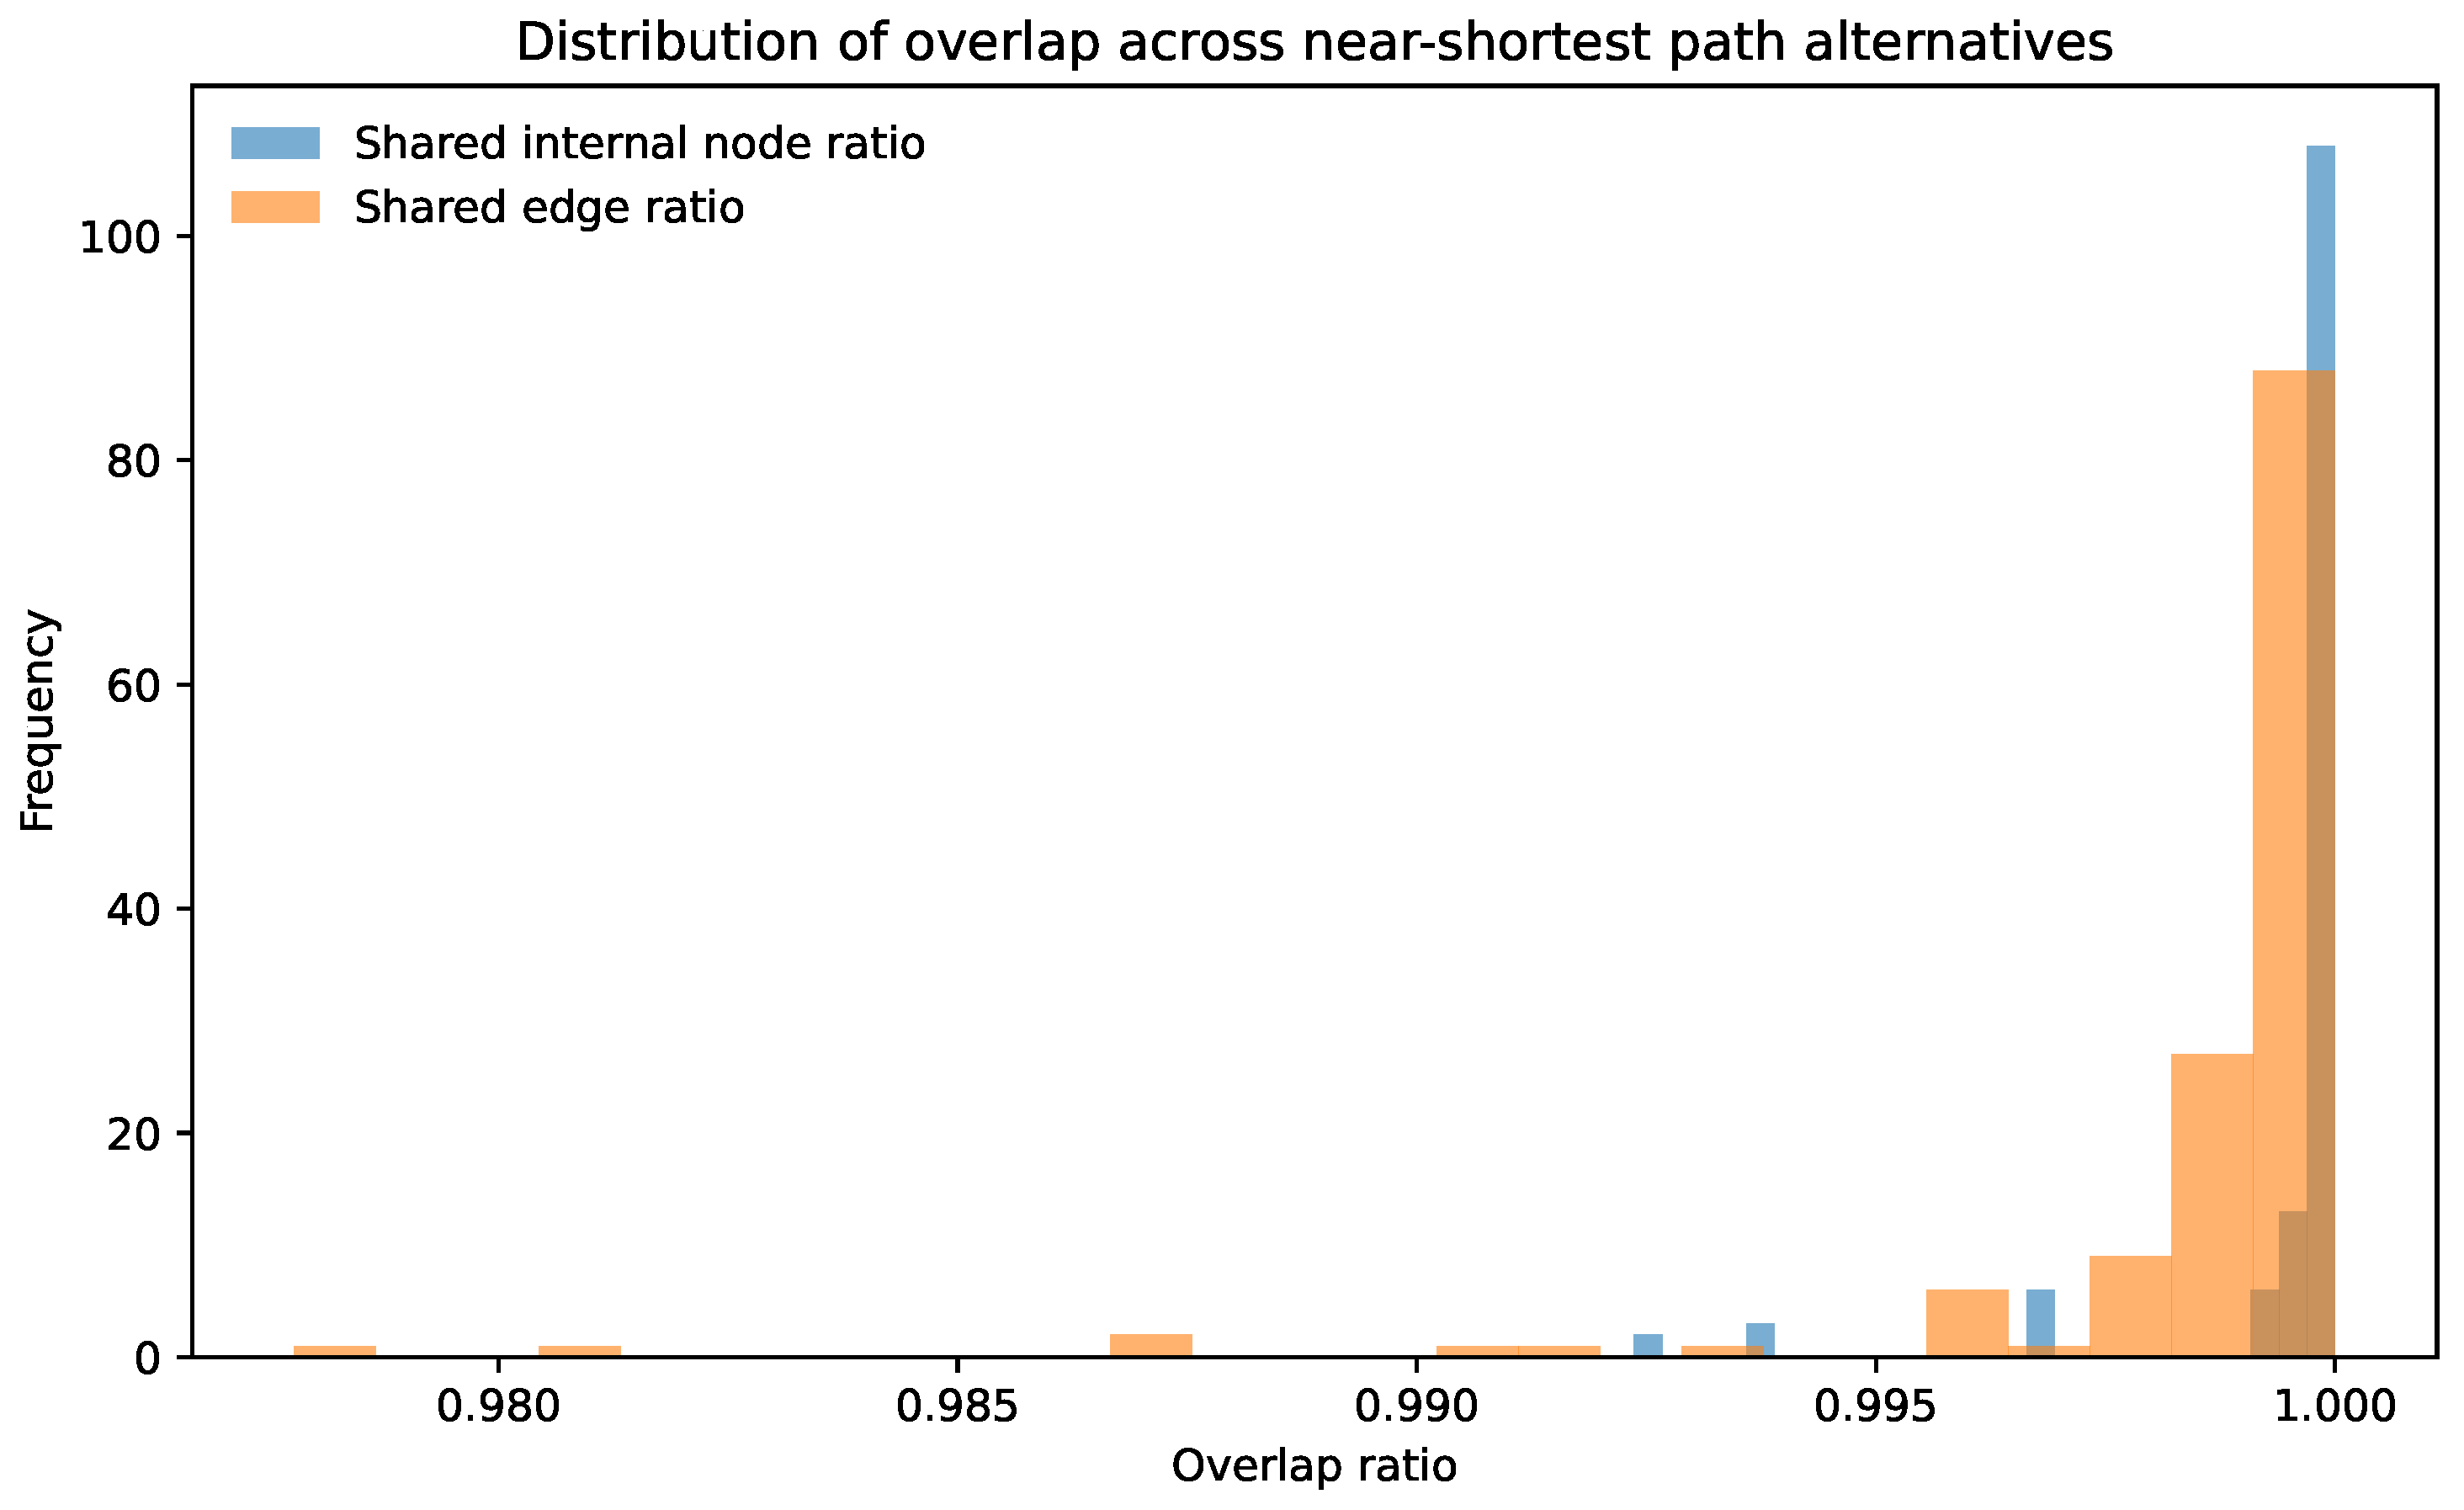
These values are robust to the exclusion of the degenerate Lille → Dunkirk pair: the full data set yields a mean shared node ratio of 0.9994 and a mean edge ratio of 0.9982, confirming that the overlap result is not sensitive to this correction.
4.3. Shared Bottlenecks
To identify the structural locations responsible for the convergence of the route, bottleneck frequencies were calculated for both the nodes and the edges. These metrics record how often each node or edge appears in the sets of near-shortest paths evaluated in the OD audit.
The analysis revealed that a small number of nodes appear repeatedly in many OD pairs. Table 5 lists the bottleneck nodes that occur most frequently. Several of these nodes occur in more than 60 path instances, indicating a high level of reuse within the corridor network.
Similarly, a parallel frequency analysis at the edge level confirmed the same geographic concentration observed in the node-frequency results. The highest-frequency edges clustered within the same Lille–Tournai zone identified in Table 5, traversing segments of the A27/E42 and A25/E42 motorway axes connecting the French and Belgian networks. The spatial coincidence of high-frequency nodes and high-frequency edges confirms that the structural bottleneck is a geographically connected corridor zone rather than a collection of isolated points. This is a finding with direct implications for the spatial scope of any bypass or redundancy investment. The complete tabulation of edge frequency is provided in Appendix B in Table A2. The recurrence of these edges in many pairs of OD suggests that the corridor contains specific structural choke points where traffic alternatives converge.
Figure 4.
Most frequently reused bottleneck nodes and edges identified across the near-shortest path pools.
Figure 4.
Most frequently reused bottleneck nodes and edges identified across the near-shortest path pools.
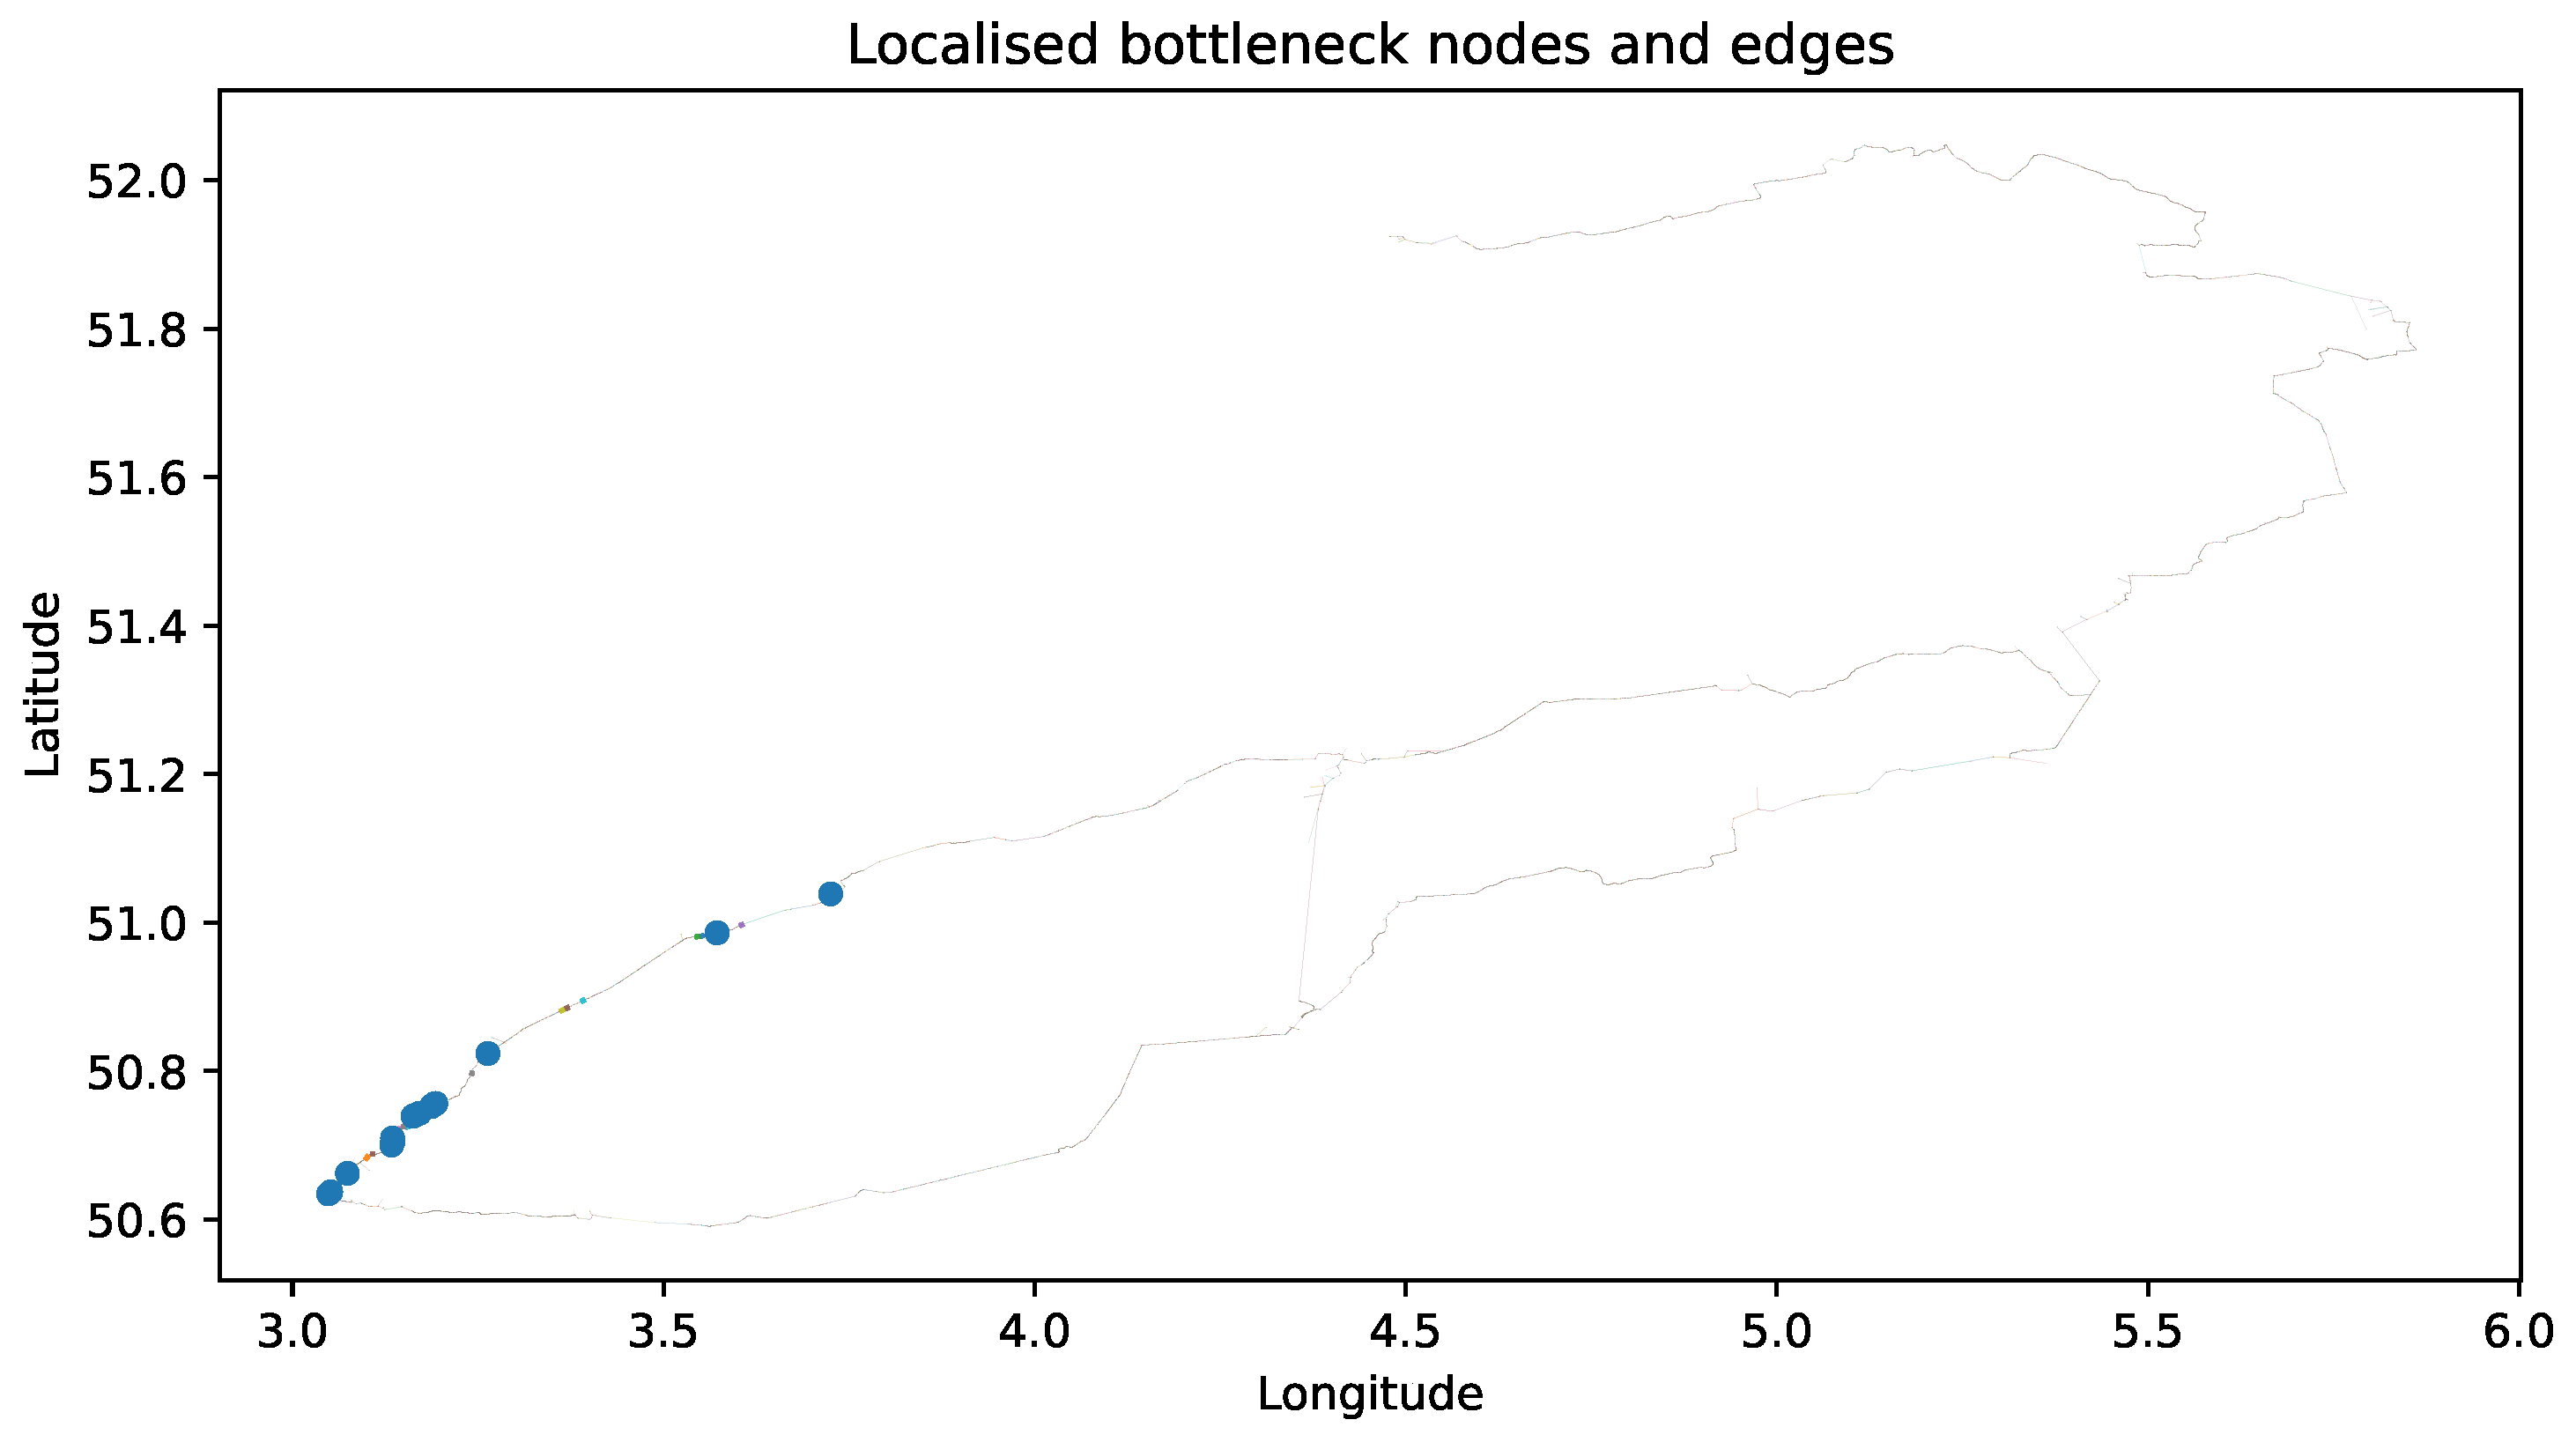
The spatial clustering of these bottlenecks indicates that the apparent diversity of the route is largely constrained by a small number of geographically concentrated network segments.
The spatial concentration of the bottleneck nodes around longitude 3.04–3.26 and latitude 50.63–50.83 corresponds geographically to the Lille–Tournai motorway corridor, specifically to interchange nodes along the A27/E42 and A25/E42 axes connecting the French and Belgian motorway networks. This geographic clustering suggests that the structural fragility of the corridor is not distributed randomly across the network but is concentrated at a specific cross-border interface. This cross-border concentration has particular policy significance, as it implies that a disruption in a relatively small geographic area could simultaneously impact freight flows between multiple pairs of national origin–destination [25].
4.4. Node Connectivity Validation
Although the OD audit provides evidence of overlap among near-shortest alternatives, an additional validation step was performed using exact node connectivity calculations. Node connectivity represents the maximum number of internally node-disjoint paths that can exist between two nodes, and was computed exactly, using maximum-flow algorithms, for all 28 reachable OD pairs in the corrected dataset (full results in Appendix A).
Twenty-seven of the twenty-eight pairs exhibit node connectivity k=1, which means that for the overwhelming majority of reachable freight relationships in this corridor, the removal of a single intermediate node is sufficient to completely disconnect the origin and destination. Table 6 reports this result for six pairs of particular importance to freight policy, those involving Rotterdam, Antwerp, and Brussels, but the pattern holds uniformly throughout the complete validated set.
The single exception is Antwerp–Lille, the only pair to reach k=2. The exact computation identified the minimum vertex cut as two nodes: OSM node 4417815641 (lon 3.058, lat 50.629) and OSM node 12951657474 (lon 3.058, lat 50.630). Located within 60 metres of each other and approximately 80 metres from the Lille anchor itself. Rather than sitting at a genuine divergence point between two distinct routing corridors, the cut falls at the single motorway gateway through which both nominally independent paths must pass before entering Lille.
This geography substantially qualifies what the k=2 result appears to promise. The graph-theoretic criterion for structural redundancy is technically satisfied. There are two internally node-disjoint paths, but both must transit the same 60-metre approach corridor before diverging into the city network. Bridge closure, access restriction, or interchange blockage at that gateway could disable both paths simultaneously, despite their formal independence. In this sense, Antwerp–Lille is not a counterexample to the central finding of the paper but rather a more subtle instance of it: even where node-disjoint paths exist on paper, their minimum cut can be concentrated in a geography small enough for a single incident to compromise both. Evaluating corridor resilience by connectivity value alone, without inspecting where the minimum cut actually lies, risks the same overestimation that this paper identifies for route counting in a more general way.
Five of the six evaluated OD pairs exhibit node connectivity equal to one, indicating that the removal of a single intermediate node would disconnect the origin and destination. These results confirm that many OD relationships within the corridor depend on single structural bottlenecks.
The Antwerp–Lille pair represents a structurally distinct case within the corridor, exhibiting node connectivity k=2 — the only pair in the validated set to exceed the minimum threshold of one. Table 6 summarises the connectivity results for six representative OD pairs within the corridor. The exact computation confirmed this result and identified the minimum vertex cut as two nodes: OSM node 4417815641 (lon 3.058, lat 50.629) and OSM node 12951657474 (lon 3.058, lat 50.630). Both nodes are located within 60 metres of each other and within approximately 80 metres of the Lille anchor node itself, placing the minimum vertex cut at the motorway gateway entering Lille from the north rather than at any junction point between the two routing alternatives between Antwerp and Lille.
This geographic finding qualifies the formal k=2 result in an operationally important way. While the graph-theoretic criterion for structural redundancy is satisfied, there are two internally node-disjoint paths; both paths must transit the same 60-metre geographic zone at the Lille motorway approach before diverging into the city network. A single physical disruption at this gateway, such as a bridge closure, access restriction, or interchange blockage on the northern approach to Lille, could simultaneously affect both formally independent paths. Therefore, the result k=2 reflects structural redundancy in the graph-theoretic sense while concealing geographic vulnerability that the formal measure does not capture.
This finding extends the central argument of the paper in a further dimension. The gap between apparent route diversity and structural redundancy, demonstrated throughout the study for pairs with k=1, is echoed at the higher-order level by the Antwerp–Lille case: even when formal node-disjoint paths exist, their minimum cut may be concentrated in a geography sufficiently small that a single physical incident could compromise both.
This underscores the importance of examining not only the value of k but also the geographic distribution of the minimum vertex-cut when evaluating the operational resilience of the corridor. These results demonstrate that higher-order structural redundancy is achievable within the corridor and confirm that the Antwerp–Lille sub-path provides formally stronger protection than the pairs of k = 1. However, the geographic concentration of the minimum cut at the Lille gateway suggests that the freight routing policies that direct Rotterdam–Lille traffic through Antwerp provide less operational resilience benefit than the k=2 value alone would imply.
5. Discussion
5.1. Route Diversity Versus Structural Redundancy
The results establish a systematic gap between visible route diversity and structural redundancy in this European freight corridor. Twenty-seven of twenty-eight reachable origin–destination pairs in the corrected dataset exhibit at least two near-shortest alternative routes, yet zero pairs contain two internally node-disjoint paths within the enumerated alternative pool. This finding operationalises a distinction that transport planning has not routinely enforced: that route multiplicity, the condition commonly used to assess corridor resilience, is a necessary but not sufficient condition for structural redundancy [1,12]. The node connectivity validation confirms the quantitative severity of this gap: five of six evaluated pairs exhibit k=1, indicating that single node failures suffice to disconnect them.
This finding has a specific policy implication that extends beyond this corridor. Infrastructure resilience assessments that evaluate corridor robustness by counting alternative routes, a practice common in transport planning and regulatory frameworks such as TEN-T corridor guidance [25], may systematically overestimate the effective redundancy of the network. If the alternatives being counted share structural bottlenecks, this can create a misleading sense of security regarding network redundancy. The methodology demonstrated here, combining near-shortest path enumeration with exact connectivity validation, provides a tractable correction that can be applied to any corridor for which a network graph can be constructed.
The tightness of the empirical detour distribution, median 0.006% and 95th percentile 0.32%, provides a further dimension to the structural redundancy finding. The near-shortest alternatives identified in this corridor are not merely structurally overlapping; they are geometrically near-identical to the shortest path. This means that apparent route alternatives in the corridor offer neither structural independence (confirmed by k=1 for most pairs) nor meaningful geographic diversity. The corridor’s fragility is therefore twofold: the alternatives share critical nodes, and they trace essentially the same geographic trajectory.
The Antwerp–Lille minimum vertex cut result further illustrates the limits of topological measures as proxies for operational resilience. Formal node connectivity k=2 satisfies the graph-theoretic criterion for path independence, yet the minimum cut nodes are co-located within 60 metres at the Lille motorway gateway, a geographic scale at which a single infrastructure event could effectively constitute a simultaneous disruption to both nominally independent paths. This case demonstrates that the gap between formal structural metrics and operational vulnerability extends beyond the k=1 versus distinction and warrants geographic inspection of minimum cut locations as a complement to connectivity values in any corridor resilience audit.
5.2. Shared Bottlenecks Within the Corridor
The bottleneck analysis indicates that a limited number of nodes and edges appear repeatedly across route alternatives. This concentration suggests that the corridor contains structural choke points through which a large fraction of traffic must pass.
The bottleneck concentration identified in this study has direct implications for cascading failure risk. When multiple origin–destination routes share a single intermediate node, a disruption at that node, whether from infrastructure failure, accident, extreme weather, or planned maintenance, simultaneously invalidates all apparent route alternatives for every OD pair that traverses it. Albert, Jeong & Barabási (2000) demonstrated in the context of complex networks that targeted removal of highly connected nodes produces disproportionate network fragmentation compared to random node removal [27]. The bottleneck nodes identified here, appearing in up to 72 of the near-shortest path instances evaluated, represent precisely the kind of targets whose failure would produce correlated, simultaneous disruption across many OD pairs. This correlated failure exposure is qualitatively distinct from independent link failures and requires different risk management approaches [6].
5.3. Directional Asymmetry
The high proportion of unreachable OD pairs (43 of 72) in the directed graph representation warrants careful interpretation. In an undirected representation of the same road network, the majority of these pairs would be reachable, since most road infrastructure is physically bidirectional at the local level. The directed representation preserves one-way constraints and junction geometries that are operationally significant for large freight vehicles. These vehicles cannot legally or practically reverse direction at most interchanges, making directionality a real rather than merely formal constraint [23]. The high unreachability rate also reflects the corridor-level graph filtering: by retaining only freight-relevant infrastructure, the graph is sparser than the full road network, and many origin–destination connections require infrastructure types excluded from the analysis. This is a methodological choice that prioritises fidelity to freight operations over completeness, and its implications for reachability should be acknowledged as a study scope constraint rather than a data deficiency.
5.4. Implications for Corridor Resilience
From a corridor governance perspective, three implications follow from these results.
Resilience auditing frameworks including those underpinning TEN-T corridor assessments should incorporate explicit connectivity validation rather than relying on route counts alone; the methodology demonstrated here is computationally tractable and reproducible with standard net- work analysis tools.
Infrastructure investment should be prioritised at the nodes identified as bottlenecks, particularly the Lille–Tournai interface nodes appearing in up to 72 path instances, where bypass infrastructure or improved interchange capacity would directly reduce the minimum vertex cut for the affected OD pairs. Rotterdam–Lille, given Rotterdam’s role as Europe’s largest port, is the most operationally significant of these k=1 pairs and should be the priority for targeted investment [24].
The Antwerp–Lille case warrants a different kind of attention. Rather than treating its k=2 result as a template to be replicated elsewhere, planners should recognise it as a caution: structural redundancy that converges at a single geographic gateway offers less protection than the connectivity value alone suggests. Any investment intended to replicate Antwerp–Lille’s path independence for currently k=1 pairs should explicitly target geographic, not merely topological, separation between alternative routes – ensuring that node-disjoint paths also diverge early enough to avoid sharing a common physical choke point near either endpoint.
5.5. Limitations
Several limitations constrain the generalisability of these findings:
- Analysis is restricted to road infrastructure. The Benelux–northern France corridor is also served by extensive rail freight links and inland waterways, including the Rhine–Scheldt canal system, which may provide structural redundancy not captured here. A multimodal analysis incorporating these alternatives would provide a more complete picture of corridor resilience.
- Corridor graph is static: it represents the topological structure of the network at a single point in time and does not account for temporal congestion, capacity constraints, or seasonal infrastructure closures that affect operational routing.
- Node connectivity as applied here is a worst-case topological measure: it identifies the minimum number of nodes whose removal could disconnect a pair but does not weight that risk by the probability of disruption at each node.
- Near-shortest path threshold — a key parameter determining which alternatives are considered, requires sensitivity testing to ensure that findings are robust to threshold choice.
6. Conclusion
This study examined the relationship between route multiplicity and structural redundancy within a freight corridor network spanning the Benelux region and northern France. Although multiple near-shortest routes were identified for most reachable origin-destination pairs, these alternatives frequently overlapped on the same nodes and edges.
More broadly, this study contributes a replicable structural redundancy audit methodology that fills a specific gap between topological resilience theory and applied corridor analysis. By combining k-shortest path enumeration with exact node connectivity computation and spatial bottleneck identification, the audit provides a diagnostic tool that is both theoretically grounded in Menger’s theorem and the max-flow/min-cut framework. And practically deployable using openly available road network data. The finding that route multiplicity systematically overestimates structural redundancy in this corridor should be understood not as specific to this geography, but as a likely property of most corridor networks in which infrastructure investment has concentrated mobility along a small number of dominant axes. Future work should extend the methodology to multimodal corridors, incorporate demand-weighted bottleneck scoring, and apply sensitivity analysis on the near-shortest path threshold to establish the robustness of k=1 dominance across parameter choices.
Data Availability Statement
The directed corridor graph, anchor-node specifications, origin-destination redundancy reports, overlap metrics, validation outputs, appendix tables, figures, and analysis scripts used in this study are publicly available in the accompanying reproducibility repository:

The files specific to this study are located under the repository subdirectory paper1_real_corridor/. Large raw OpenStreetMap extracts are not redistributed in the repository.
https://www.openstreetmap.org under the Open Database License (ODbL).
Appendix A. Full OD–Pair Connectivity Results for the Corridor Subgraph
Node connectivity for all 28 reachable OD pairs in the corrected dataset (excluding the degenerate Lille→Dunkirk pair; see Section 3.3). Values of indicate that the removal of a single intermediate node is sufficient to disconnect the origin–destination pair. No pair exceeds . The Antwerp–Lille result () is discussed in Section 4.4; its minimum cut nodes are geographically co–located within 60 metres of the Lille gateway (Appendix C).
Table A1.
Full OD–pair connectivity results for the corridor subgraph.
| Origin | Destination | KSP | Min cut | Min–cut node IDs | |
|---|---|---|---|---|---|
| Antwerp | Arras | 5 | 1 | 1 | 274897949 |
| Antwerp | Bruges | 5 | 1 | 1 | 1269598616 |
| Antwerp | Brussels | 5 | 1 | 1 | 94602598 |
| Antwerp | Dunkirk | 5 | 1 | 1 | 1845506036 |
| Antwerp | Lille | 5 | 2 | 2 | 4417815641; 12951657474 |
| Antwerp | Valenciennes | 5 | 1 | 1 | 8184367164 |
| Bruges | Arras | 5 | 1 | 1 | 274897949 |
| Bruges | Dunkirk | 5 | 1 | 1 | 1845506036 |
| Bruges | Lille | 5 | 1 | 1 | 12951657474 |
| Brussels | Arras | 5 | 1 | 1 | 274897949 |
| Brussels | Dunkirk | 5 | 1 | 1 | 1845506036 |
| Brussels | Lille | 5 | 1 | 1 | 4417815641 |
| Brussels | Valenciennes | 5 | 1 | 1 | 8184367164 |
| Ghent | Arras | 5 | 1 | 1 | 274897949 |
| Ghent | Bruges | 5 | 1 | 1 | 1269598616 |
| Ghent | Dunkirk | 5 | 1 | 1 | 1845506036 |
| Ghent | Lille | 5 | 1 | 1 | 12951657474 |
| Lille | Arras | 1 | 1 | 1 | 274897949 |
| Rotterdam | Antwerp | 5 | 1 | 1 | 361173442 |
| Rotterdam | Arras | 5 | 1 | 1 | 274897949 |
| Rotterdam | Bruges | 5 | 1 | 1 | 1269598616 |
| Rotterdam | Brussels | 5 | 1 | 1 | 94602598 |
| Rotterdam | Dunkirk | 5 | 1 | 1 | 1845506036 |
| Rotterdam | Lille | 5 | 1 | 1 | 1468332761 |
| Rotterdam | Valenciennes | 5 | 1 | 1 | 8184367164 |
| Valenciennes | Arras | 5 | 1 | 1 | 274897949 |
| Valenciennes | Dunkirk | 5 | 1 | 1 | 1845506036 |
| Valenciennes | Lille | 5 | 1 | 1 | 4417815641 |
Appendix B. Most Frequently Used Directed Edges Across the Computed K–Shortest Paths
Twenty most frequently occurring edges across near-shortest path pools in the corrected dataset. Coordinates refer to the start (u) and end (v) nodes of each directed edge. The geographic clustering of high-frequency edges within the longitude 3.04–3.26, latitude 50.63–50.83 zone corresponds to the Lille–Tournai motorway corridor identified in Section 4.3.
Table A2.
Most frequently used directed edges across the computed K-shortest paths.
| Rank | u | v | KSP freq. | u lon. | u lat. | v lon. | v lat. |
|---|---|---|---|---|---|---|---|
| 1 | 149374929 | 1845506036 | 61 | 3.051637 | 50.637399 | 3.048660 | 50.634475 |
| 2 | 310457351 | 310457825 | 60 | 3.266383 | 50.823965 | 3.265866 | 50.823843 |
| 3 | 5070713820 | 5070724723 | 60 | 3.605214 | 50.996922 | 3.605097 | 50.996871 |
| 4 | 4195581010 | 6696870777 | 60 | 3.108029 | 50.688339 | 3.107740 | 50.688339 |
| 5 | 660645864 | 6481707972 | 60 | 3.144383 | 50.722343 | 3.144370 | 50.722281 |
| 6 | 11908042593 | 11908042601 | 60 | 3.241790 | 50.797051 | 3.241780 | 50.796961 |
| 7 | 10601724209 | 13232272691 | 60 | 3.072756 | 50.652282 | 3.072745 | 50.652250 |
| 8 | 1682512805 | 3164346577 | 60 | 3.391402 | 50.894838 | 3.391177 | 50.894730 |
| 9 | 2984839113 | 6818210493 | 60 | 3.551720 | 50.981977 | 3.551637 | 50.981964 |
| 10 | 6566370846 | 708658314 | 60 | 3.133913 | 50.700502 | 3.133880 | 50.700463 |
| 11 | 11659440454 | 6157269938 | 60 | 3.546334 | 50.981153 | 3.545167 | 50.980977 |
| 12 | 6566370871 | 6566370873 | 60 | 3.130632 | 50.696725 | 3.130611 | 50.696628 |
| 13 | 6292898399 | 10601724209 | 60 | 3.072763 | 50.652304 | 3.072756 | 50.652282 |
| 14 | 261143727 | 3326115902 | 60 | 3.370172 | 50.884991 | 3.369954 | 50.884892 |
| 15 | 665236584 | 4829351814 | 60 | 3.150677 | 50.724846 | 3.150507 | 50.724863 |
| 16 | 2601391194 | 2601391195 | 60 | 3.149605 | 50.724946 | 3.149384 | 50.724969 |
| 17 | 2779049436 | 12823854408 | 60 | 3.363468 | 50.881891 | 3.362884 | 50.881618 |
| 18 | 12223159103 | 4829352080 | 60 | 3.156374 | 50.725158 | 3.156307 | 50.725138 |
| 19 | 2612020723 | 2566967708 | 60 | 3.081854 | 50.671798 | 3.081824 | 50.671771 |
| 20 | 674887448 | 6696870889 | 60 | 3.100858 | 50.684044 | 3.099827 | 50.682713 |
Appendix C. Individual Minimum-Cut Node Locations for Each Reachable OD Pair
Appendix C.1. Minimum Vertex Cut Node IDs and Geographic Coordinates for All Validated OD Pairs
For k=1 pairs the minimum cut consists of a single node; for the Antwerp–Lille pair (k=2) two cut nodes are listed. The geographic concentration of cut nodes within the Lille–Tournai zone (lon 3.04–3.26, lat 50.63–50.83) corroborates the bottleneck frequency analysis in Section 4.3.
Table A3.
Individual minimum-cut node locations for each reachable OD pair.
| Origin | Destination | Origin node | Destination node | Cut node | Cut lon. | Cut lat. | Dest. lon. | Dest. lat. | Distance to dest. (m) | |
|---|---|---|---|---|---|---|---|---|---|---|
| Antwerp | Arras | 11463647940 | 6267747834 | 1 | 274897949 | 3.067814 | 50.624369 | 3.050441 | 50.618562 | 1385.3 |
| Antwerp | Bruges | 11463647940 | 6808123232 | 1 | 1269598616 | 3.373851 | 50.886714 | 3.373725 | 50.886657 | 10.9 |
| Antwerp | Brussels | 11463647940 | 94597279 | 1 | 94602598 | 4.348939 | 50.857848 | 4.354974 | 50.856141 | 464.2 |
| Antwerp | Dunkirk | 11463647940 | 251058778 | 1 | 1845506036 | 3.048660 | 50.634475 | 3.043246 | 50.629172 | 702.5 |
| Antwerp | Lille | 11463647940 | 494563683 | 2 | 4417815641 | 3.058188 | 50.629447 | 3.057623 | 50.629748 | 52.1 |
| Antwerp | Lille | 11463647940 | 494563683 | 2 | 12951657474 | 3.057569 | 50.629777 | 3.057623 | 50.629748 | 5 |
| Antwerp | Valenciennes | 11463647940 | 8184367142 | 1 | 8184367164 | 3.546051 | 50.592678 | 3.543574 | 50.592886 | 176.4 |
| Bruges | Arras | 6808123232 | 6267747834 | 1 | 274897949 | 3.067814 | 50.624369 | 3.050441 | 50.618562 | 1385.3 |
| Bruges | Dunkirk | 6808123232 | 251058778 | 1 | 1845506036 | 3.048660 | 50.634475 | 3.043246 | 50.629172 | 702.5 |
| Bruges | Lille | 6808123232 | 494563683 | 1 | 12951657474 | 3.057569 | 50.629777 | 3.057623 | 50.629748 | 5 |
| Brussels | Arras | 94597279 | 6267747834 | 1 | 274897949 | 3.067814 | 50.624369 | 3.050441 | 50.618562 | 1385.3 |
| Brussels | Dunkirk | 94597279 | 251058778 | 1 | 1845506036 | 3.048660 | 50.634475 | 3.043246 | 50.629172 | 702.5 |
| Brussels | Lille | 94597279 | 494563683 | 1 | 4417815641 | 3.058188 | 50.629447 | 3.057623 | 50.629748 | 52.1 |
| Brussels | Valenciennes | 94597279 | 8184367142 | 1 | 8184367164 | 3.546051 | 50.592678 | 3.543574 | 50.592886 | 176.4 |
| Ghent | Arras | 36892129 | 6267747834 | 1 | 274897949 | 3.067814 | 50.624369 | 3.050441 | 50.618562 | 1385.3 |
| Ghent | Bruges | 36892129 | 6808123232 | 1 | 1269598616 | 3.373851 | 50.886714 | 3.373725 | 50.886657 | 10.9 |
| Ghent | Dunkirk | 36892129 | 251058778 | 1 | 1845506036 | 3.048660 | 50.634475 | 3.043246 | 50.629172 | 702.5 |
| Ghent | Lille | 36892129 | 494563683 | 1 | 12951657474 | 3.057569 | 50.629777 | 3.057623 | 50.629748 | 5 |
| Lille | Arras | 494563683 | 6267747834 | 1 | 274897949 | 3.067814 | 50.624369 | 3.050441 | 50.618562 | 1385.3 |
| Rotterdam | Antwerp | 12755368407 | 11463647940 | 1 | 361173442 | 4.404947 | 51.226957 | 4.404343 | 51.226969 | 42.1 |
| Rotterdam | Arras | 12755368407 | 6267747834 | 1 | 274897949 | 3.067814 | 50.624369 | 3.050441 | 50.618562 | 1385.3 |
| Rotterdam | Bruges | 12755368407 | 6808123232 | 1 | 1269598616 | 3.373851 | 50.886714 | 3.373725 | 50.886657 | 10.9 |
| Rotterdam | Brussels | 12755368407 | 94597279 | 1 | 94602598 | 4.348939 | 50.857848 | 4.354974 | 50.856141 | 464.2 |
| Rotterdam | Dunkirk | 12755368407 | 251058778 | 1 | 1845506036 | 3.048660 | 50.634475 | 3.043246 | 50.629172 | 702.5 |
| Rotterdam | Lille | 12755368407 | 494563683 | 1 | 1468332761 | 5.422432 | 51.307219 | 3.057623 | 50.629748 | 181913.3 |
| Rotterdam | Valenciennes | 12755368407 | 8184367142 | 1 | 8184367164 | 3.546051 | 50.592678 | 3.543574 | 50.592886 | 176.4 |
| Valenciennes | Arras | 8184367142 | 6267747834 | 1 | 274897949 | 3.067814 | 50.624369 | 3.050441 | 50.618562 | 1385.3 |
| Valenciennes | Dunkirk | 8184367142 | 251058778 | 1 | 1845506036 | 3.048660 | 50.634475 | 3.043246 | 50.629172 | 702.5 |
| Valenciennes | Lille | 8184367142 | 494563683 | 1 | 4417815641 | 3.058188 | 50.629447 | 3.057623 | 50.629748 | 52.1 |
Appendix D. Geographic Localisation of Minimum Vertex Cuts
Appendix D.1. Minimum Vertex Cuts Were Computed for All Reachable OD Pairs in the Corrected Dataset
The results show that many formally distinct paths remain geographically concentrated near destination gateway regions, particularly around Lille and the Lille–Tournai motorway interface.
This finding demonstrates that graph-theoretic disjointness alone may overestimate operational resilience when physically adjacent bottlenecks remain shared.
Figure A1.
Minimum vertex cut for the Antwerp–Lille OD pair (). The two cut nodes are located within approximately 60 metres of each other near the motorway gateway entering Lille from the north, despite the existence of formally node-disjoint paths.
Figure A1.
Minimum vertex cut for the Antwerp–Lille OD pair (). The two cut nodes are located within approximately 60 metres of each other near the motorway gateway entering Lille from the north, despite the existence of formally node-disjoint paths.
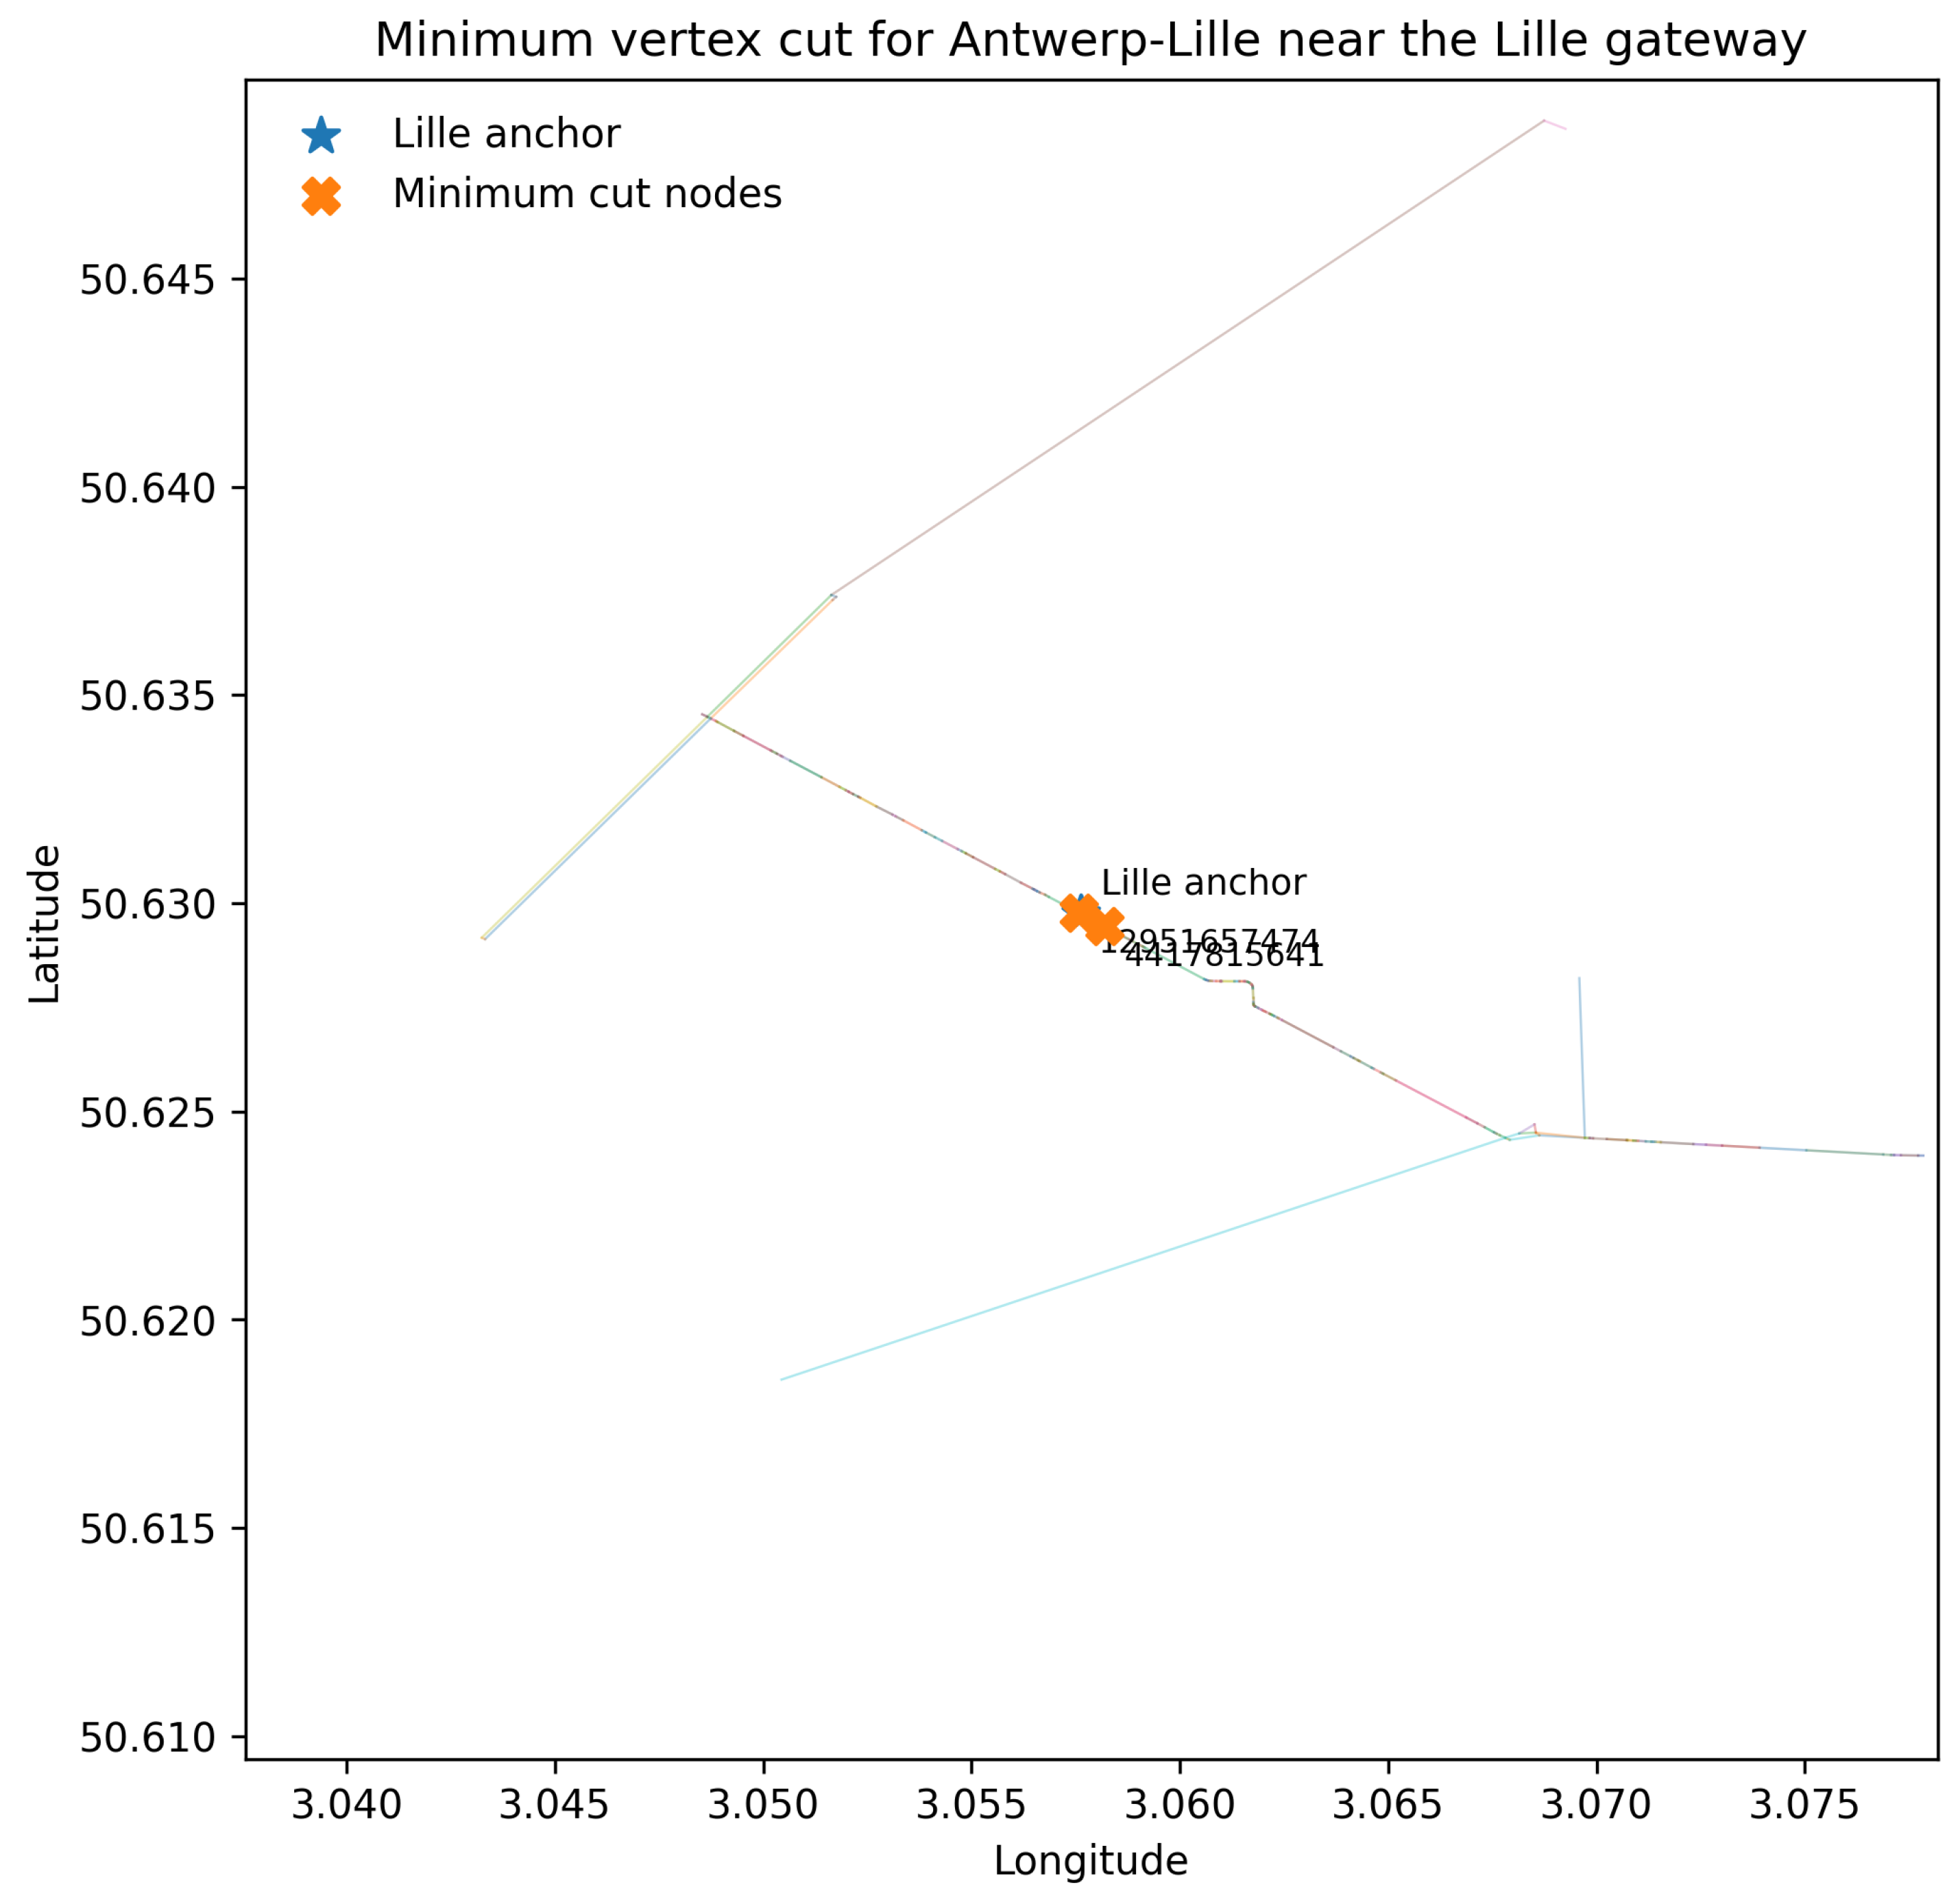
Table A4.
Minimum-cut summary statistics by OD pair.
| Origin | Destination | Cut size | Cut node IDs | Centroid lon. | Centroid lat. | Max cut-node dist. (m) | Min dest. dist. (m) | Max dest. dist. (m) | All within 100 m | All within 500 m | |
|---|---|---|---|---|---|---|---|---|---|---|---|
| Antwerp | Arras | 1 | 1 | 274897949 | 3.067814 | 50.624369 | 0 | 1385.3 | 1385.3 | No | No |
| Antwerp | Bruges | 1 | 1 | 1269598616 | 3.373851 | 50.886714 | 0 | 10.9 | 10.9 | Yes | Yes |
| Antwerp | Brussels | 1 | 1 | 94602598 | 4.348939 | 50.857848 | 0 | 464.2 | 464.2 | No | Yes |
| Antwerp | Dunkirk | 1 | 1 | 1845506036 | 3.048660 | 50.634475 | 0 | 702.5 | 702.5 | No | No |
| Antwerp | Lille | 2 | 2 | 4417815641 | 3.057879 | 50.629612 | 57 | 5 | 52.1 | Yes | Yes |
| Antwerp | Valenciennes | 1 | 1 | 8184367164 | 3.546051 | 50.592678 | 0 | 176.4 | 176.4 | No | Yes |
| Bruges | Arras | 1 | 1 | 274897949 | 3.067814 | 50.624369 | 0 | 1385.3 | 1385.3 | No | No |
| Bruges | Dunkirk | 1 | 1 | 1845506036 | 3.048660 | 50.634475 | 0 | 702.5 | 702.5 | No | No |
| Bruges | Lille | 1 | 1 | 12951657474 | 3.057569 | 50.629777 | 0 | 5 | 5 | Yes | Yes |
| Brussels | Arras | 1 | 1 | 274897949 | 3.067814 | 50.624369 | 0 | 1385.3 | 1385.3 | No | No |
| Brussels | Dunkirk | 1 | 1 | 1845506036 | 3.048660 | 50.634475 | 0 | 702.5 | 702.5 | No | No |
| Brussels | Lille | 1 | 1 | 4417815641 | 3.058188 | 50.629447 | 0 | 52.1 | 52.1 | Yes | Yes |
| Brussels | Valenciennes | 1 | 1 | 8184367164 | 3.546051 | 50.592678 | 0 | 176.4 | 176.4 | No | Yes |
| Ghent | Arras | 1 | 1 | 274897949 | 3.067814 | 50.624369 | 0 | 1385.3 | 1385.3 | No | No |
| Ghent | Bruges | 1 | 1 | 1269598616 | 3.373851 | 50.886714 | 0 | 10.9 | 10.9 | Yes | Yes |
| Ghent | Dunkirk | 1 | 1 | 1845506036 | 3.048660 | 50.634475 | 0 | 702.5 | 702.5 | No | No |
| Ghent | Lille | 1 | 1 | 12951657474 | 3.057569 | 50.629777 | 0 | 5 | 5 | Yes | Yes |
| Lille | Arras | 1 | 1 | 274897949 | 3.067814 | 50.624369 | 0 | 1385.3 | 1385.3 | No | No |
| Rotterdam | Antwerp | 1 | 1 | 361173442 | 4.404947 | 51.226957 | 0 | 42.1 | 42.1 | Yes | Yes |
| Rotterdam | Arras | 1 | 1 | 274897949 | 3.067814 | 50.624369 | 0 | 1385.3 | 1385.3 | No | No |
| Rotterdam | Bruges | 1 | 1 | 1269598616 | 3.373851 | 50.886714 | 0 | 10.9 | 10.9 | Yes | Yes |
| Rotterdam | Brussels | 1 | 1 | 94602598 | 4.348939 | 50.857848 | 0 | 464.2 | 464.2 | No | Yes |
| Rotterdam | Dunkirk | 1 | 1 | 1845506036 | 3.048660 | 50.634475 | 0 | 702.5 | 702.5 | No | No |
| Rotterdam | Lille | 1 | 1 | 1468332761 | 5.422432 | 51.307219 | 0 | 181913.3 | 181913.3 | No | No |
| Rotterdam | Valenciennes | 1 | 1 | 8184367164 | 3.546051 | 50.592678 | 0 | 176.4 | 176.4 | No | Yes |
| Valenciennes | Arras | 1 | 1 | 274897949 | 3.067814 | 50.624369 | 0 | 1385.3 | 1385.3 | No | No |
| Valenciennes | Dunkirk | 1 | 1 | 1845506036 | 3.048660 | 50.634475 | 0 | 702.5 | 702.5 | No | No |
| Valenciennes | Lille | 1 | 1 | 4417815641 | 3.058188 | 50.629447 | 0 | 52.1 | 52.1 | Yes | Yes |
Appendix E. Graph Construction Parameters and Software Environment
Appendix E.1. OpenStreetMap Network Specification
The corridor graph was constructed from OpenStreetMap road-network data using OSMnx and NetworkX. The graph extraction process retained only major freight-relevant road classes in order to approximate long-distance corridor routing behaviour while excluding local urban streets.
Table A5.
OpenStreetMap network extraction parameters.
| Parameter | Value |
|---|---|
| Data source | OpenStreetMap (openstreetmap.org) |
| License | Open Database License (ODbL) |
| Date of data retrieval | February 2026 |
| Extraction library | OSMnx v2.1.0 |
| Graph analysis library | NetworkX v3.6.1 |
| Network type | drive |
| Graph representation | Directed graph (DiGraph) |
| Road classes retained |
motorway motorway_link trunk trunk_link primary primary_link |
| retain_all | False |
| Simplification | Enabled |
| Edge weighting | Edge length (metres) |
| Study region | Benelux–Northern France corridor |
| Bounding box longitude | 3.0432462 to 5.8618143 |
| Bounding box latitude | 50.5908416 to 52.0479528 |
Appendix E.2. Graph Structural Statistics
Reports the principal structural characteristics of the directed corridor graph used throughout the analysis.
Table A6.
Summary graph statistics for the directed corridor subgraph.
| Metric | Value |
|---|---|
| Nodes | 12024 |
| Edges | 23361 |
| Density | 0.000161596 |
| Strongly Connected Components | 493 |
| Weakly Connected Components | 1 |
| Largest Scc Nodes | 1593 |
| Largest Scc Share | 0.1 |
| Largest Wcc Nodes | 12024 |
| Largest Wcc Share | 1 |
| Mean Total Degree | 3.9 |
| Mean In Degree | 1.9 |
| Mean Out Degree | 1.9 |
| Max Total Degree | 8 |
| Max In Degree | 4 |
| Max Out Degree | 4 |
Appendix E.3. Anchor Node Deduplication
Initial anchor selection identified ten candidate freight cities across the study corridor. During nearest-node snapping, the Calais and Dunkirk anchor coordinates both resolved to the same OpenStreetMap node (OSM ID 251058778), indicating that both city coordinates mapped to the same motorway-access node within the filtered directed graph.
The duplicate anchor was retained as a single effective network node. The resulting corrected dataset therefore contains nine unique anchor nodes generating 72 ordered OD pairs.
A subsequent integrity audit identified the Lille–Dunkirk OD pair as a degenerate case within the filtered graph representation. Although a shortest path formally existed, the route length was unrealistically short relative to the true inter-city separation due to graph snapping behaviour near the Lille gateway region. This pair was excluded from corrected near-shortest-path and overlap analyses.
Appendix E.4. Software Environment
All analyses were performed in Python 3.12 under a Linux environment.
The principal libraries used were:
- NetworkX v3.6.1
- OSMnx v2.1.0
- Pandas v1.1.2
- NumPy v2.4.2
- Matplotlib v3.10.8
The complete analysis pipeline, processed datasets, validation outputs, and figure-generation scripts are publicly archived in the accompanying reproducibility repository.
Appendix E.5. Reproducibility
All scripts used for graph construction, OD analysis, overlap computation, bottleneck localisation, and integrity validation are included in the public reproducibility repository accompanying this study.
The repository contains:
- processed graph files,
- anchor specifications,
- OD redundancy reports,
- overlap metrics,
- appendix-generation scripts,
- integrity validation outputs,
- and all figure-generation code.
References
- Menger, K. Zur allgemeinen Kurventheorie. Fundam. Math. 1927, 10, 96–115. [Google Scholar] [CrossRef]
- Whitney, H. Congruent graphs and the connectivity of graphs. Am. J. Math. 1932, 54, 150–168. [Google Scholar] [CrossRef]
- Reggiani, A.; Nijkamp, P.; Lanzi, D. Transport resilience and vulnerability: The role of frailty analysis. Transp. Res. Part A 2015, 81, 4–21. [Google Scholar]
- Berdica, K. An introduction to road vulnerability: what has been done, is done and should be done. Transp. Policy 2002, 9, 117–127. [Google Scholar] [CrossRef]
- Koetse, M.J.; Rietveld, P. The impact of climate change and weather on transport: An overview of empirical findings. Transp. Res. Part D. 2009, 14, 205–221. [Google Scholar] [CrossRef]
- Ivanov, D. Predicting the impacts of epidemic outbreaks on global supply chains. Transp. Res. Part E 2020, 136, 101922. [Google Scholar] [CrossRef]
- Lam, J.S.L.; Yap, W.Y. Dynamics of liner shipping network and port connectivity in supply chain systems. J. Transp. Geogr. 2011, 19, 1272–1281. [Google Scholar] [CrossRef]
- Holling, C.S. Resilience and stability of ecological systems. Annu. Rev. Ecol. Syst. 1973, 4, 1–23. [Google Scholar] [CrossRef]
- Bruneau, M.; Chang, S.E.; Eguchi, R.T.; Lee, G.C.; O’Rourke, T.D.; Reinhorn, A.M.; Shinozuka, M.; Tierney, K.; Wallace, W.A.; von Winterfeldt, D. A framework to quantitatively assess and enhance the seismic resilience of communities. Earthq. Spectra 2003, 19, 733–752. [Google Scholar] [CrossRef]
- Yen, J.Y. Finding the k shortest loopless paths in a network. Manag. Sci. 1971, 17, 712–716. [Google Scholar] [CrossRef]
- Eppstein, D. Finding the k shortest paths. SIAM J. Comput. 1998, 28, 652–673. [Google Scholar] [CrossRef]
- Ford, L.R.; Fulkerson, D.R. Maximal flow through a network. Can. J. Math. 1956, 8, 399–404. [Google Scholar] [CrossRef]
- Jenelius, E.; Petersen, T.; Mattsson, L.G. Importance and exposure in road network vulnerability analysis. Transp. Res. Part A 2006, 40, 537–560. [Google Scholar] [CrossRef]
- Scott, D.M.; Novak, D.C.; Aultman-Hall, L.; Guo, F. Network robustness index: A new method for identifying critical links and evaluating the performance of transportation networks. J. Transp. Geogr. 2006, 14, 215–227. [Google Scholar] [CrossRef]
- Faturechi, R.; Miller-Hooks, E. Measuring the performance of transportation infrastructure systems in disasters: A comprehensive review. J. Infrastruct. Syst. 2015, 21, 04014025. [Google Scholar] [CrossRef]
- Vugrin, E.D.; Warren, D.E.; Ehlen, M.A.; Camphouse, R.C. A framework for assessing the resilience of infrastructure and economic systems. In Sustainable and Resilient Critical Infrastructure Systems; Gopalakrishnan, K., Peeta, S., Eds.; Springer: Berlin, 2010; pp. 77–116. [Google Scholar]
- Tavasszy, L.; de Jong, G. Modelling Freight Transport; Elsevier: Amsterdam, 2014. [Google Scholar]
- Barthélemy, M. Spatial networks. Phys. Rep. 2011, 499, 1–101. [Google Scholar] [CrossRef]
- Crucitti, P.; Latora, V.; Porta, S. Centrality in networks of urban streets. Chaos 2006, 16, 015113. [Google Scholar] [CrossRef]
- Haklay, M. How good is volunteered geographical information? A comparative study of OpenStreetMap and Ordnance Survey datasets. Environ. Plan. B 2010, 37, 682–703. [Google Scholar] [CrossRef]
- Barrington-Leigh, C.; Millard-Ball, A. The world’s user-generated road map is more than 80% complete. PLoS ONE 2017, 12, e0180698. [Google Scholar] [CrossRef]
- Boeing, G. OSMnx: New methods for acquiring, constructing, analysing, and visualising complex street networks. Comput. Environ. Urban Syst. 2017, 65, 126–139. [Google Scholar] [CrossRef]
- Karduni, A.; Kermanshah, A.; Derrible, S. A protocol to convert spatial polyline data to network formats and applications to world urban road networks. Sci. Data 2016, 3, 160046. [Google Scholar] [CrossRef]
- Eurostat. Freight transport statistics — modal split, 2022; European Commission, Luxembourg.
- European Commission. Regulation (EU) No 1315/2013 of the European Parliament and of the Council on Union guidelines for the development of the trans-European transport network. In Official Journal of the European Union; 2013. [Google Scholar]
- Hagberg, A.A.; Schult, D.A.; Swart, P.J. Exploring network structure, dynamics, and function using NetworkX. In Proceedings of the Proceedings of the 7th Python in Science Conference, Pasadena, CA, 2008; pp. 11–15. [Google Scholar]
- Albert, R.; Jeong, H.; Barabási, A.L. Error and attack tolerance of complex networks. Nature 2000, 406, 378–382. [Google Scholar] [CrossRef]
Table 1.
Detour Distribution Summary
| Metric | Corrected dataset (108 paths) | Full dataset (109 paths) |
|---|---|---|
| Minimum detour | 0.000008% | 0.000008% |
| Median detour | 0.0058% | 0.0060% |
| Mean detour | 0.047% | 0.514% |
| 90th percentile | 0.192% | 0.211% |
| 95th percentile | 0.296% | 0.321% |
| 99th percentile | 0.394% | 0.396% |
| Maximum detour | 0.397% | 50.979%† |
† Maximum in full dataset driven by degenerate Lille→Dunkirk pair (see Section 3.3). All 108 corrected paths fall within 0.40% of the shortest-path cost.
Table 5.
Most frequently occurring bottleneck nodes in near-shortest paths
| Node ID | Frequency | Longitude | Latitude |
|---|---|---|---|
| 1845506036 | 72 | 3.04866 | 50.63448 |
| 149374929 | 61 | 3.05164 | 50.63740 |
| 619261880 | 60 | 3.19102 | 50.75556 |
| 145785 | 60 | 3.72518 | 51.03864 |
| 6174873970 | 60 | 3.57247 | 50.98627 |
| 742685040 | 60 | 3.13489 | 50.70959 |
| 742685038 | 60 | 3.13542 | 50.70430 |
| 1247295836 | 60 | 3.07411 | 50.66218 |
| 620108123 | 60 | 3.26346 | 50.82364 |
| 506769345 | 60 | 3.18741 | 50.75228 |
Table 6.
Exact node connectivity for selected origin–destination pairs
| Origin | Destination | Node Connectivity | Minimum Node Cut Size |
|---|---|---|---|
| Rotterdam | Lille | 1 | 1 |
| Rotterdam | Antwerp | 1 | 1 |
| Rotterdam | Brussels | 1 | 1 |
| Antwerp | Lille | 2 | 2 |
| Antwerp | Brussels | 1 | 1 |
| Brussels | Lille | 1 | 1 |
Disclaimer/Publisher’s Note: The statements, opinions and data contained in all publications are solely those of the individual author(s) and contributor(s) and not of MDPI and/or the editor(s). MDPI and/or the editor(s) disclaim responsibility for any injury to people or property resulting from any ideas, methods, instructions or products referred to in the content. |
© 2026 by the authors. Licensee MDPI, Basel, Switzerland. This article is an open access article distributed under the terms and conditions of the Creative Commons Attribution (CC BY) license (http://creativecommons.org/licenses/by/4.0/).
Copyright: This open access article is published under a Creative Commons CC BY 4.0 license, which permit the free download, distribution, and reuse, provided that the author and preprint are cited in any reuse.