

Submitted:
14 September 2026
Posted:
15 September 2026
You are already at the latest version
Abstract
Metro systems have become increasingly crucial components of sustainable urban mo-bility solutions. The effectiveness of metro systems, however, depends on station ca-pacity and passenger behaviour within stations is a recurring and constantly evolving challenge. Efficient crowd management in metro stations is therefore a critical chal-lenge for transport operators due to increasing passenger demand and the need to maintain safe and reliable operations. Using a combination of agent-based modelling and discrete-event simulation, this study develops an integrated simulation frame-work, and applies to two typical metro stations, De Ferrari Station in Genoa, Italy, and Serdica Station in Sofia, Bulgaria, using Simul8 – an event-based simulation modelling software. The models represent passenger and train interactions within station envi-ronments, including inbound, outbound and transferring passenger movements, ticket purchasing and validation activities, utilisation of stairways, escalators and elevators and train boarding and alighting processes. Passenger behaviour is modelled through a combination of specific routings, queuing and stochastic activity durations provided by data from metro operators, site observations and local knowledge. Validation was undertaken by comparing simulated passenger flows against observed data at key sta-tion locations, including entrances, platforms, concourses, and transfer areas. Results demonstrate a high level of accuracy, with simulated flows closely mirroring observed values for both stations. Findings confirm that the integrated simulation framework provides a robust and effective approach for analysing station operations, identifying congestion points, and supporting evidence-based decision-making for station design and crowd management improvements.
Keywords:
railway simulation modelling
; agent-based modelling
; event-based simulation
; passenger flow analysis
; crowd management
1. Introduction
Urban metro systems (as well as various types of railway systems) have become increasingly important components of sustainable urban mobility solutions considering their high-capacity, reliable, and environmentally efficient capabilities. In particular, metro systems are typically designed to serve densely populated urban corridors and major activity centres through high-frequency, high-speed services, and thus facilitating wider-scale accessibility and social equity, supporting sustainable urban development and reducing dependence on private passenger cars. Considering these characteristics and complicated system configurations, the effectiveness of metro and railway systems depends on the capacity and passenger behaviour within stations, which are recurring and constantly evolving challenges for system operators, transport planners and governing authorities. However, by utilising simulation modelling, this can provide insights into where potential bottlenecks, conflicting flow areas and where inventions may be required within a station. In this study, a hybrid agent-based discrete-event simulation approach is used to model two metro stations in Genoa, Italy and Sofia, Bulgaria.
1.1. Objectives
The objective of the current study is to develop metro station simulation models that simulate passenger flow dynamics within an individual metro station. The proposed integrated simulation modelling framework combines agent-based modelling (ABM) and discrete event simulation (DES) techniques to model passenger movements within metro stations. Whilst this framework is generally applicable to any metro stations, the current study focuses on its application to two typical stations, De Ferrari Station of AMT Genoa and Serdica Station of Metro Sofia. In this context, the models are developed with a specific focus on improving station crowd management through identifying critical bottlenecks (e.g., in-station passenger flow congestion locations) for any possible passenger circulation improvement and optimisations.
1.2. Structure of the Paper
Continuing forward, this paper will firstly present a literature review of modelling approaches, focusing on ABM and DES, and the major components involved. Section 3 will provide some context of the two modelled stations whilst Section 4 will explain the key processes modelled within the Simul8 environment. For example, simulating how (inbound/outbound/transfer between platforms) passengers navigate through the stations, including passenger vertical and horizontal movements, their interactions with in-station facilities, as well as the boarding and alighting of trains and passenger activities. In doing so, the following sections will explain how the key processes of passenger movements and train loading/unloading activities will be modelled in the Simul8 Station Models. Following this, later sections present the results collected and provide analysis of the results against key KPIs. Finally, this paper will illustrate the validation process and provide some applications of the proposed integrated agent-based discrete-event simulation framework to model and evaluate the performances of two real world metro stations.
2. Literature Review
2.1. Agent-Based Modelling (ABM)
ABM is a computational approach that simulates systems through the interactions of autonomous and heterogeneous agents operating within a shared environment [1]. In transportation research, ABM has been widely applied to transport policy, travel demand, public transport, urban logistics, and mode choice analysis [2]. By representing individual travellers, vehicles, or organisations as agents with distinct characteristics and behavioural rules, ABM enables the analysis of complex interactions and emergent transport system behaviours across multiple spatial scales. This approach offers considerable potential for evaluating urban transport systems and sustainability outcomes [3]. However, challenges remain in accurately incorporating accessibility, demographic factors, and travel costs within agent-based frameworks [4]. Recent advances in data availability, computational power, and modelling techniques have addressed many of these limitations, making ABM an increasingly effective tool for analysing the dynamic interactions between transport systems and urban environments.
2.2. Discrete-Event Simulation (DES)
DES involves the modelling, simulation, and analysis of systems using computational and mathematical techniques [5]. Its key strength lies in its flexibility and adaptability, enabling applications across diverse sectors, including healthcare, transport, warehousing, supply chains, defence, computer systems, and business process management [6,7]. DES allows organisations to test scenarios and evaluate operational changes before implementation.
Despite its advantages, DES has several limitations. Developing and validating simulation models can be complicated and time-consuming, particularly for large-scale systems that require extensive data and domain expertise. Traditional DES also relies on sequential algorithms, which can limit computational efficiency when modelling highly complicated systems [8]. Furthermore, model accuracy depends heavily on the validity of underlying assumptions, and continuous updates are often required to reflect changes in real-world operations.
Within a transport context, discrete-event modelling has been utilised in a variety of contexts, providing some interesting findings and proposals for future metro services. DES has been widely applied in railway and metro systems to evaluate operational performance, passenger movement, and service reliability. In railway operations, DES has been used to investigate delays, timetable performance, and traffic management, with studies demonstrating its effectiveness in identifying bottlenecks, testing delay mitigation strategies, and improving scheduling efficiency [9,10,11]. This approach has also been employed to analyse passenger flow within stations, enabling the assessment of congestion, passenger behaviour, and the impacts of external disruptions such as the COVID-19 pandemic, thereby supporting evidence-based station management and safety improvements [12]. Beyond conventional passenger operations, DES has also facilitated the evaluation of innovative urban logistics concepts, including the utilisation of metro and light rail systems for baggage and freight transport. Simulation studies have demonstrated the technical feasibility and operational benefits of integrating passenger and freight services, highlighting opportunities to utilise spare network capacity while reducing road congestion and emissions [13,14,15]. Furthermore, DES has been used to assess infrastructure utilisation and vehicle design adaptations, supporting the development of multimodal transport solutions and more efficient use of rail assets [16,17]. Collectively, these studies demonstrate that DES provides a flexible and powerful framework for modelling complex railway systems, allowing stakeholders to evaluate operational strategies, quantify performance improvements, and assess innovative transport solutions before implementation.
2.3. ABM and DES Hybrid Approaches
Hybrid simulation approaches have emerged in response to the increasing complexity of metro systems, which comprise interconnected infrastructure, operational processes, and passenger behaviours. By integrating multiple modelling paradigms, these approaches leverage the strengths of individual methods while mitigating the limitations associated with relying on a single technique. A previous study conducted a comprehensive assess of hybrid simulation practices, covering reviewed 139 peer-reviewed simulation studies published between 2000 and 2018 and revealed that combinations of two or three modelling approaches are increasingly common, reflecting the need to capture multiple system dimensions simultaneously [18]. Among these, the integration of ABM and DES emerged as the most widely adopted configuration, particularly for transport applications where both individual-level behaviours and system-level operational processes must be represented. The combination enables the modelling of autonomous passenger decision-making alongside the dynamics of transport operations, providing a more comprehensive representation of complex metro systems than either method can achieve independently.
2.4. Key Model Components and Validations
Studies of metro and railway station pedestrian flow typically incorporate inputs relating to passenger characteristics, demand levels, station facilities, and train operations, including arrival rates, walking speeds, capacity, headways, and dwell times [19,20,21]. Most models employ ABM, often combined with social force, network, or queuing models, to represent passenger movement, route choice, queuing behaviour, and interactions within station environments [19,22]. Common passenger activities modelled include station entry, ticket purchase, security screening, transfers, and waiting for trains. Outputs generally focus on operational and passenger performance measures, such as density, speed, travel time, queue length, service level, transfer capacity, and passenger delays, with recent studies also assessing resilience and in-station time reliability [22,23]. These metrics support the evaluation of metro station design and operations.
Model verification and validation (V&V) are essential for ensuring the accuracy and credibility of metro station simulation models [19]. Verification assesses whether the model has been correctly implemented, while validation evaluates how well it represents real-world operations. Common V&V metrics include queue length, passenger travel time, and platform crowding, which reflect station performance, passenger experience, and safety [21]. Model verification is typically undertaken by comparing simulated passenger flows with observed field data and calculating measures such as average relative error [19]. Validation often involves comparing simulated and observed boarding, alighting, and total journey times to assess model accuracy [24]. In addition, expert review by station managers is frequently used to ensure that model assumptions and outputs reflect operational reality [20]. Together, these approaches improve model reliability and support informed decision-making for metro station planning and management
2.5. Findings and Proposed Modelling Approach
As can be summarised from the above literature review, it is suggested that a hybrid approach should be employed, combining ABM and DES for effectively modelling metro system dynamics at an individual metro station level. ABM is suitable for capturing individual passenger behaviours, whilst DES is better used in modelling operational flows. The metro simulation model should consider the impact of various components of the station physical environment (e.g., station layout, entrances, platforms, corridors, escalators and ticket machines), as well as accurate modelling of passenger flow behaviours. Major input variables can be classified into four categories: passenger characteristics, facility attributes train operation plans and operational scenarios. The model should also be able to produce output evaluation metrics such as pedestrian flow metrics, facility performances, time consumption, and system efficiency metrics. The developed model should be validated and verified quantitatively against observable metrics, and qualitatively with feedback from operators.
3. Context for Station Model Development
Accurate modelling of metro operations requires a detailed understanding of the physical infrastructure of the network and stations. To support this, comprehensive maps and technical layouts have been collected and analysed for both Genoa and Sofia metro systems. These include floor plans, CAD drawings, and schematic representations of network topology.
The Sofia Metro (Figure 1) is one of the most modern and rapidly expanding urban transport systems in Eastern Europe. It currently consists of four operational lines (M1, M2, M3, and M4), covering over 52 kilometres and including approximately 47 stations. The network is operated by Metropoliten JSC (MetroS) and features increasing levels of automation and advanced technological systems. Lines 1 and 2 form the core structure of the network, intersecting at the central Serdica station, which serves as a key intermodal hub. Lines 3 and 4 are more recent additions, featuring sections with driverless technology (GoA3). For example, Line 3 is operating automatic train movements at GoA3 standard, with a train attendant onboard to operate the doors. The metro is designed to accommodate high passenger volumes, with train frequencies ranging from 3 to 13 minutes, depending on the time and day. Train types vary in capacity and configuration, tailored to the specific automation level of each line.
From an urban mobility perspective, the Sofia Metro plays a key role in reducing surface traffic congestion, providing fast connections between residential districts and the city centre. It is well integrated with other public transport modes, including buses and trams.
The Genoa Metro (Figure 2) is a light rapid transit system serving the city of Genoa, Italy. Currently, the network consists of a single line, running for approximately 7.1 kilometres and comprising 8 stations. Despite its limited extent, the metro plays a strategic role in the city’s mobility system, providing a fast and reliable alternative to road-based transport in a geographically constrained urban environment.
The line runs primarily underground and connects the Brin station in the north-western suburbs to Brignole station, a major railway and intermodal node in the city centre. Key intermediate stations include Dinegro, Principe, and De Ferrari, the latter being one of the central hubs of the network. The metro is fully integrated into the broader public transport system operated by AMT Genova, ensuring multimodal connectivity with buses, funiculars, and local trains.
In recent years, the Genoa Metro has been undergoing a significant expansion and modernisation programme, with planned extensions to both the west and east, as well as upgrades to signalling and automation systems (the current metro system is GoA2). These developments aim to increase network coverage, improve service frequency, and reduce waiting times.
For the Sofia Metro, a particular focus was placed on Serdica Station (Figure 3), which represents a complex multi-line interchange hub connecting Line 1 and Line 2. The station is structured on three underground levels:
- The upper level contains entrances, commercial spaces, and access points from street level.
- The middle level serves Line 1, with two side platforms for opposite directions.
- The lower level serves Line 2, which is aligned orthogonally to Line 1, with a central platform.
Multiple vertical circulation elements—including escalators, elevators, and staircases—connect the levels, enabling passenger transfer between lines. Interconnecting corridors between platforms are designed to manage large passenger flows.
In Genoa, De Ferrari Station (Figure 4) is one of the busiest and is strategically located in the historical and administrative centre of the city. The station is structured on three underground levels:
- The ticketing and access level, which connects to the surrounding pedestrian areas via multiple entrances.
- An intermediate level, where people split in two different flows based on the destination they aim to reach.
- The platform level, which includes a central island platform serving both directions.
Despite its relative simplicity, De Ferrari presents unique spatial constraints due to its location beneath historical infrastructure and narrow urban fabric. The limited platform width, combined with a stairway and a single escalator (for each platform), introduces challenges in managing boarding and alighting, especially during high-demand events in the city centre.
The specific parameters of the constructed high-fidelity simulation environment are summarised in and Table 1. These baseline parameter values were collected from and confirmed by the respective metro operators AMT and MetroS. Apart from these core parameters, some additional parameters such as passenger boarding/alighting time per train door and passenger vertical movement facility operational parameters (i.e., capacity, travel time, etc.) were determined according to relevant literature. These core sets of input parameters are served as the baseline conditions and are incorporated into the models to carry out model development and later, model validation.
4. Model Development and Design
4.1. Metro Station Modelling Logic Using Simul8
In this study the Simul8 simulation modelling software package is employed, where passengers and trains are modelled as two types of agents, Passenger Agents and Train Agents. Passenger Agents are to simulate passenger movements through the station whilst the Train Agent is to simulate train arrivals at stations, according to the scheduled timetable, to load/unload passengers, and their departure away from the stations. The modelling logics using Simul8 for the Passenger Agent and Train Agent are explained in the following sub-sections.
4.2. Passenger Agent Modelling
An essential step in creating the Station Models to analyse the effectiveness of crowd management in the metro stations is the use of the fundamental building blocks from Simul8 to model passenger movements across various areas and facilities in the station, to create a functional station simulation model. For the Passenger Agent, the overall modelling logic is illustrated in Figure 5.
In the model, four key building blocks are utilised:
- “Start Points”, acts as the arrival of passengers entering the station through multiple entry points.
- “Queue”, acts as a storage area enabling passengers to wait for the next activity in the simulation system.
- “Activity”, which serves multiple purposes by either a ticket machine or a human activity (i.e., ticket machines, or ticket office counters, ticket gates/barriers, and vertical movement facilities (such as stairways, escalators, elevators) connecting the multi-level station areas.
- “End Points”, serves as the completion point for passenger services in the simulation model (i.e., inbound passengers getting onboard of a train, or outbound passengers getting away from the ticket validation gates).
4.3. Passenger Types
In the Station Models, passengers are classified into three main types, inbound passengers with and without a pre-paid ticket, and outbound passengers. Different passengers are simulated using the “Label” attribute from Simul8 to identify the passengers’ direction of travel (inbound/outbound) and the types of tickets they are using (i.e., pre-paid ticket or purchasing a ticket) for inbound passengers. These are allocated as label values for two types of “Labels” in Simul8 as shown in Figure 6 and Figure 7.The use of “Labels” also helps to segregate the results at “End Points”, enabling a more efficient collection of model outputs.
For Serdica station, a fourth type of transfer passengers is included to model passengers transferring between the platforms for Line M2 (i.e., Platforms III and IV in the model) and the platforms for Lines M1/M4 (Platforms I and II in the model). The movements are simulated using two pairs of “Label” attributes as well. One pair is to simulate passengers unloading from trains arriving at Line M2 platforms, who will then navigate to one of the two platforms for transferring to Lines M1/M4 (Figure 8), and vice versa (Figure 9).
3.4. Start Point Properties
For the Passenger Agent, a number of properties need to be set to ensure the system estimates the appropriate number of passengers entering the simulation model. These include the daily arrival profiles estimated from the operator provided passenger demand data, and “Actions” with the use of labels. Figure 10 shows examples of such inbound/outbound Passenger Agent “Start Points”. Each “Start Point” is associated with an arrival schedule specifying the number of passengers arriving at a particular time period. For outbound and transfer “Start Points”, passenger flows would come along with the arrival schedule of trains on individual platforms. The estimates of inbound passenger distributions across various station entrances were informed by local knowledge, experiences and site observations. For transfer passenger profiles, a model was developed to provide a robust estimate of hourly passenger flows between platforms over a typical day.
3.5. Actions
For all “Start Points”, “Actions” are used to assign values to “Labels” to simulate individual passengers’ movement as well as facilitating the segregation of results at the end of the simulation. “Labels” need to be created beforehand (Figure 6 and Figure 7) in order to assign different types of passengers for each value in the “Actions”. The values given for the two types of “Labels” for inbound and outbound passengers are shown in Figure 6 and Figure 7, for example, for setting up the actions.
At all inbound and outbound passengers “Start Points” in the Station Model, the label values for Direction of Travel were set as fixed (1 for inbound; 2 for outbound) and shown in Figure 11 as an example, to ensure the correct “Label” is set. For inbound passengers, the values for a second “Label” are then then set according to a Ticket Type distribution calibrated by site observation and field data and shown in Figure 12 as an example.
For transfer passengers, the values of the two pairs of transfer “Labels” were also set according to a distribution calibrated by site observation and operator provided data. These label values will allow “Activities” representing key passenger flow decision points, where inbound, outbound and transfer passengers sharing common spaces (e.g., concourse areas), to accurately “Route Out” passengers to the appropriate direction by “Labels”.
4.6. Passenger Movement in the Station
Throughout the station models, “Activities” are the most commonly utilised. These “Activities” are employed when passengers interact with various in-station facilities. These include ticket machines/offices, ticket validation gates and vertical movement facilities (stairways, escalators, elevators). The distributions of the amount of time passengers interacting with these facilities are estimated based on site observations, local knowledge and experiences. Once the Passenger Agent finishes an “Activity”, they will move to the next “Activity”; however, there will be more than one “Activity” for the passenger to move from the previous “Activity”, as such a “Routing Out” option will be used. The “Routing Out” option allows for “Activities” to allocate passengers to the next process using the routing rules, which can be done based on “Label” values or percentage distributions among the available routing options.
For queueing system in the models, the “Queue” points are laid out after each “Start Point” and “Activity”. This ensures that the passengers are able to wait in the system where there is an “Activity” in use at full capacity. Hence, the queuing system in the Station Models provides useful data for the results at the end to analyse the effectiveness of crowd management.
4.6.1. Uses of Ticket Purchasing Facilities
Across the station models, there are two methods that passengers can utilise to purchase a ticket, if this is required, these are either automatic ticket machines or a manned ticket office. The numbers, groupings and distributions of ticket machines/offices in the selected stations are based on information in the station layout maps, which all are connected with a “Queue” in Simul8. For each group of ticket purchasing options in a certain location, the routing rule is set as “shortest queue” before the passengers start queuing for the ticket purchasing option using the “Routing Out” at the “towards ticket machines/office” Activity. It means that passengers must go towards the option with the lowest number of passengers in the queue. The time distribution for all ticket purchasing options is set as uniform to allow a random occurrence between the lower and the upper time values.
4.6.2. Ticket Validation Gates
After passengers have purchased tickets (or if they have a pre-paid ticket), they will go to the next “Activity” point, which might be the ticket validation gates (if any), or the vertical movement options. For the selection of which ticket gates to use, the logic will be the same as the selection of ticket purchasing option, which is based on a “shortest queue” setting.
4.6.3. Vertical Movement Options
As for the uses of vertical movement options, “Routing Out” settings will be used to model passengers’ preferences based on site observations and local understanding. The time distribution for the passengers to travel down each vertical movement option is set at an average value reflecting individual vertical travel option’s characteristics. Also, each option could accommodate more than one passenger at a time, when compared with other activities such as individual ticket purchasing option, which can only be utilised by one passenger at a time. The capacity of each vertical movement option is estimated according to its size and operations. To allow the model to accommodate up to the specified capacity on an individual movement option, this is done by setting the “Replicate” attribute from the Simul8’s properties, which means replicating the same Activity for once up to the number of times specified as capacity.
Passenger movement logics within the station are basically the same for both inbound and outbound Passenger Agents, but with opposite direction of travel that is identified using the routing out by Label option. This is particularly important for modelling passenger movements at station concourse areas and intermediate levels where inbound and outbound passengers share common spaces. This is done through the use of routing out by “Label” option, where the simulation system will allocate Passenger Agents to the next “Activity” based on their Direction of Travel “Label” values (Figure 13). For transfer passengers, who also share common spaces with inbound/outbound passengers, will be identified by the two pairs of transfer “Label” values, and be guided by the routing out by “Label” option as well to their destination platforms.
4.7. Passenger Boarding and Alighting Activities
Passenger boarding and alighting activities will be done in association with the activities of the Train Agent (i.e., the arrival and departure of a train and its unused capacity on arrival, which will be described later). These activities are only allowed when a train is present at the platform according to the train arrival schedule.
When inbound and transfer passengers arrive at their destination platform, they will join a platform “Queue” simulating the platform capacity constraints. The platform “Queue” is connected with a platform “Activity” that is used to simulate passenger boarding activities. This platform “Activity” will be used in association with the train arrival schedule specified in the “Resource” settings in Simul8.
When the platform “Activity” detects the arrival of a train (with its specified vacant capacity availability), passengers in the platform “Queue” will be allowed to get onboard in an orderly manner, according to the number and sizes of the train doors. This is done using the “Replicate” attribute from the Simul8 properties, which means multiple passengers will be allowed to get onboard simultaneously in an orderly manner. It is assumed that every train door will allow for 2 inbound/transfer passengers to get onboard at the same time roughly in about 1.8 secs, and all train doors will be in operation throughout the dwelling period. Once the boarding activity is finished, inbound/transfer passengers will be regarded to have completed their inbound/transfer services at the platform “End Points”.
As for the outbound passengers, the train arrived will unload passengers who are already onboard on their arrival. Unloaded passengers (outbound) will then join the platform “Queue” and navigate through the station in the same logic as described for the inbound passengers until they leave the station at the “End Points” completing their outbound services.
4.8. Train Agent Modelling
The Train Agent in the Station Models is constructed through the “Start Point” and “Resource” building blocks from Simul8 simulating the arrival of a train with the number of passengers already onboard (i.e., outbound passenger demand) and the train’s available vacant capacity on arrival (to receive inbound/transfer passengers waiting on the platform “Queue” through the platform “Activity”). The overview of the Simul8 modelling logic for the Train Agent is illustrated in Figure 14.
4.8.1. Train Arrival with Outbound Passenger Demand Onboard
The “Start Point” will act as the arrival point of a train entering the station and generates outbound/transfer passengers to be discharged from the train onto the station platform. Only one train is allowed to enter the platform at a time to ensure a real-world replication of the train arrival schedules. The actual train arrival schedule is used in the “Start Point” property settings, which comes with the number of passengers already onboard with the train who will then be discharged from the train onto the platform. Outbound and transfer passengers will then be unloaded from the train and join the platform “Queue” (i.e., generating outbound and transfer passengers into the simulation system) before the train departs away from the station according to the train departure schedules (i.e., within the period of dwelling). These outbound/transfer passengers will then follow the same rules, as described in the outbound/transfer Passenger Agent modelling logics, to find their ways to different exits of the station (for outbound passengers) or to their destination platforms (for transfer passengers). In short, the “Start Point” for the Train Agent controls when to unload outbound/transfer passengers onto the platforms from trains, and how many outbound/transfer passengers will be generating into the simulation system every time when a train has arrived.
4.8.2. Train Arrivals to receive Inbound Passengers
“Resource” is used, in association with the platform “Activity”, to indicate the arrival of trains for inbound/transfer passenger boarding operations, according to the specified train arrival schedules (Figure 15). This is done using the resources schedule (simulating the arrivals and departures of trains), and the number of passengers that the train can accommodate (i.e., the train’s available vacant passenger capacities). As described in the inbound/transfer Passenger Agent modelling logics, passenger boarding operations will be activated when the platform “Activity” for passenger services detects the presence of a train. In short, the “Resource” setting controls when to load inbound/transfer passengers from destination platforms onto trains and how many passengers could get onboard every time a train has arrived.
4.9. Station Models’ Measures of System Performances (MoPs)
Some important and commonly used measures of system performances will be produced as a result of the simulation runs. These include total number of passenger services completed at each “End Point” for the observed period, the queue length and queuing time at difference critical locations in the station (e.g., platform areas, concourse, etc.), the utilisation levels and utilisation rates of various components in the simulation system, and so on. Some example outputs are illustrated in Figure 16.
4.10. Station Models Implementation
Following the above-mentioned Simul8 modelling logic and building blocks, key metro operation processes are modelled using the agent-based discrete event simulation state-of-the-art modelling approach, as presented in Section 2. Examples of the developed Metro Station Models for each of the two metro systems are illustrated in Figure 17 and Figure 18.
The input parameters adopted in the Station Models, their purposes, and data sources are summarised in Table 2.
5. Modal Validations
Section 5 summarises and analyses the results produced by the two station models. Following the development of the models and calibration using the input parameters shown in Table 1 and Table 2, the models were run five times and then averaged to generate the final results.
The Simul8 Station Models’ validation exercise is to compare the number of observed and simulated inbound, outbound, and transfer passenger flows at some key check points within the two selected station.
To do this, the Simul8 model structure and logics were first checked thoroughly to ensure that they were built as expected to replicate the real-world operation of the two metro systems, using a three-layer checking process. First, a structured walkthrough was undertaken to check that the correct input parameters, data, assumptions, and the logics have been properly and accurately encoded. The model setup was checked against the conceptual model specifications to make sure that all elements were built consistently with the specifications. Secondly, the run-time animations were examined to visually validate model behaviours. Model runs were conducted slowly (with on-screen animations) to visually examine how each element of the model behaved. This was done repeatedly to identify and rectify any inappropriate or inaccurate model setups. A trace analysis was also carried out using the “Monitor Simulation” feature in Simul8 where each single “Work Items” in the model could be traced for their movements, routes and actions taken within the simulation system. This verified every process of the model was run properly as expected.
This three-layer checking process was undertaken and confirmed that the Simul8 model runs performed very well and the on-screen animations had also shown logical movements of the simulated trains and passengers. This reflects that, visually, the models could satisfactorily replicate the real-world operations of the two selected metro stations. Statistical outputs were then extracted from the models to further validate against corresponding observed metrics.
5.1. De Ferrari Station Model
5.1.1. Inbound Passenger Flows
De Ferrari station model validation first focused on the accuracy in simulating the passenger flows at the entrances and at the platforms, as well as the ticket types. The comparison between the simulated and observed inbound passenger flows (generated at the entrances and arrived at the platforms) and ticket types are summarised in Table 3 and Table 4. Table 3 shows that the passenger flows are accurately simulated at both the entrances and the platforms. The ticket types, 97% prepaid and 3% purchasing, have also been accurately simulated, as shown in Table 4.
5.1.2. Outbound Passenger Flows
As for outbound passenger flows, which are the passenger arriving at the station from the train and then navigating through to the station exits. The simulated and observed outbound passenger flows are summarised in Table 5. It shows that the model has accurately simulated the outbound passenger flows at the platforms, concourse and exit levels.
The above validation results demonstrate that the Simul8 station model could reliably replicate the passenger flows within the De Ferrari station, in terms of inbound and outbound passenger flows at various levels of the station.
5.2. Serdica Station Model
5.2.1. Inbound Passenger Flows
The Serdica Station Model validation focused on the accuracy in simulating the passenger flows at the entrances, as well as the ticket types.
The comparison between the simulated and observed inbound passenger flows generated at the entrances and the ticket types are summarised in Table 6 and Table 7. These results show that the passenger flows are accurately simulated to within 1.5% of the observed throughputs at both the entrances levels. The ticket types (of 97% prepaid to 3% purchasing) have also been accurately simulated as well.
5.2.2. Outbound and Transfer Passenger Flows
As for passengers arriving from trains (Lines 1, 2 and 4) at the Serdica station, it included passengers navigating through to the station exits (i.e., “Outbound Passengers”) as well as passengers transferring between platforms I & II (i.e., for Line 2) and platforms III & IV (for Lines 1 and 4)—i.e., “Transfer Passengers”. The simulated and observed outbound and transfer passenger arriving at the Serdica station are summarised in Table 8. It shows that the model has accurately simulated the outbound and transfer passenger flows to within 2% of the observed flows.
Looking at the combined outbound and transfer passengers arriving at Serdica station by each metro line, the flows are summarised in Table 9. Again, the model has accurately simulated the combined outbound and transfer passenger flows arriving from each metro lines to within 2% of the observed flows.
5.2.3. Passenger Boarding at Platforms
To check simulated passengers queuing at platforms and getting onboard trains, observed total number of passengers coming from entrances (i.e., inbound passengers) and transferred between metro lines were compiled and summarised in Table 10. Again, it shows that the model could accurately simulate to within 1% of the observed total number of passengers at platforms waiting to board.
The above validation results demonstrate that the Simul8 station model could reliably replicate the passenger flows at Serdica station, in terms of inbound, outbound and transfer passenger flows at various levels of the station.
6. Model Applications and Findings
This section will adopt a crowd management lens to reveal impacts at individual station level passenger movements due to various scenarios, using results from metro station simulation models developed for the two selected stations at De Ferrari for AMT and Serdica for MetroS. The evaluation is organised according to five time periods during a typical operational day (Table 11). As the nature of the two selected stations (De Ferrari and Serdica) and their corresponding metro network complexity are quite different from each other, the aspects and model output metrics to be used for crowd management level evaluations will be slightly different as well.
6.1. De Ferrari Station Evaluations
The De Ferrari station serves the one-and-only-one metro line of the AMT metro network, where the passenger volume and characteristics are much simpler. Table 12 shows the platform level model output statistics, including the average number of passengers, passenger in-station time, average queue length, and average queue time.
Examining the performance of the current metro system at the De Ferrari station (Scenarios 1A, 1C, 2A, and 2C), the following key observations could be revealed:
- The “to Brin” direction is clearly much busier than the “to Brignole” direction with a significantly higher passenger volume as reflected in the number of passengers using the platform per hour.
- The afternoon peak (i.e., Scenario 1C: 16:00-20:00) is the most critical period across the whole range of metrics summarised.
- There are on average more than 350 passengers using the “To Brin” platform, which is 2.5 times of the morning peak. This represents an over-crowded condition comparing the available platform capacity of 200 passengers (i.e., a load factor of about +160%)
- The afternoon peak scenario revealed a significantly longer queue and queuing time than any other scenarios from the station model. It indicates that the afternoon peak period is the most congested period across the day where the longest queue (40.0) and queuing time (up to 8.9 minutes) are observed.
- The next busiest period is the inter-peak period (Scenario 2C: 10:00 to 16:00) where the average queue length was 24.4, and the queuing time was 8.1 minutes which was similar to that for the afternoon peak.
- On average, passengers will be able to get served on the platform (i.e., get on board of the train) within 15 minutes during the peak period, and within 5 to 10 minutes most of the time outside the peak.
The above revealed that the current system at De Ferrari station has performed satisfactorily in serving passengers during most of the time on typical day. The most critical period has been the afternoon peak period (16:00-20:00) where the station might be operating at an over-crowded condition. Passengers would be able to get served within 15 minutes during the peak period, and within 5 to 10 minutes during most of the time outside the peak.
6.2. Serdica Station Evaluations
The Serdica station serves multiple metro lines of the MetroS network. It is located at the heart of the Sofia, which is a major passenger interchange station between Lines 1 and 4, and Line 2, with significantly large volume of passenger flows. Table 13 shows the platform level model output statistics, including the average number of passengers, passenger in-station time, average queue length, and average queue time.
Examining the performance of the current metro system at the De Ferrari station (Scenarios 1B, 1D, 2B, and 2D), the following key observations could be revealed:
- The afternoon peak (i.e., Scenario 1D: 16:00-20:00) is the most critical period across all three metro lines with respect to the whole range of metrics summarised.
- There are on average more than 3000 passengers using the platform for Line 2 during the afternoon peak, which is slightly busier than the morning peak. This represents an over-crowded condition comparing the available platform capacity of 3520 (i.e., 1760x2) passengers (i.e., a load factor of around +174%)
- As for Lines 1 and 4, there are on average more than 6200 passengers using the shared platform during the afternoon peak. This represents a close to capacity congested condition (i.e., around 86% of the available platform capacity of 7200).
- The afternoon peak scenario revealed a significantly longer queue and queuing time than any other scenarios. It indicates that the afternoon peak period is the most congested period across the day where the longest queue (166 for Line 2, around 80 for Line 1 and 4).
- The next busiest period is the morning peak (Scenario 1B: 07:00-10:00) where the average queue length was around 80 for Line 2, and around 25 to 40 for Lines 1 and 4.
- As for the average queue time, non-peak periods generally have longer queue time, probably due to the longer train headways outside the peak periods.
- On average, passengers will be able to get served on the platform (i.e., get on board of the train) in no more than 12 minutes.
- The above revealed that the current system at the Serdica station has performed satisfactorily in serving passengers during most of the time for a typical day. The most critical period has been the afternoon peak period (16:00-20:00) where the station might be operating at an over-loaded condition. On average, passengers would be able to get served in no more than 12 minutes.
7. Conclusions
This research has demonstrated the successful development and validation of two metro station simulation models using agent-based discrete-event simulation modelling. Key findings illustrate that the models effectively and reliably replicate passenger movements and train operations at both De Ferrari and Serdica Stations, capturing the complex interactions between passengers, station facilities, and metro services. Validation results showed close correlation between observed and simulated passenger flows across all key station areas, confirming the accuracy and reliability of using simulation modelling. Furthermore, the models generated a range of operational performance indicators, including passenger travel times, queueing times, and facility utilisation, allowing potential bottlenecks and areas of congestion to be identified, providing valuable insights for metro operators.
It has been demonstrated that the proposed integrated agent-based discrete-event simulation modelling framework can be successfully applied to model two different real-world metro stations. Results from Section 6 indicated that both De Ferrari and Serdica stations generally perform satisfactorily under existing operating conditions. However, the afternoon peak period (16:00-20:00) consistently represents the most critical period, with the highest passenger volumes, queue lengths, and waiting times. While overcrowding conditions may occur during peak times, overall passenger service levels remain acceptable, suggesting that targeted crowd management measures during peak periods would provide the greatest operational benefit.
Overall, this study illustrates that simulation modelling for passenger flow analysis and crowd management within railway and metro stations is an effective tool for supporting metro station crowd management and operational planning, whilst no simulation model can perfectly mirror real-life movements within a station, results illustrate that differences between the observed data and simulated results were typically within 1%.
Some future research may focus on solving some of the limitations of this study, for example, in this study, passenger numbers are unchanged on a day-by-day basis, therefore, the models could be exploited to present how the station may perform when an increase in passenger demand is expected. Similarly, the study also presents all trains as on time, a future study may focus on passenger flow if train services are disrupted or there is industrial action resulting in a reduced service.
Author Contributions
Conceptualization, H.Y.T and M.M.; methodology, H.Y.T and P.B.; software, H.Y.T. and P.B.; validation, H.Y.T and P.B.; formal analysis, H.Y.T. and P.B.; investigation, H.Y.T. and P.B.; resources, M.M. and H.Y.T.; data curation, H.Y.T. and P.B.; writing—original draft preparation, H.Y.T. and P.B.; writing—review and editing, H.Y.T. and M.M.; visualization, H.Y.T. and P.B.; supervision, H.Y.T. and M.M.; project administration, M.M. and H.Y.T.; funding acquisition, M.M. and H.Y.T. All authors have read and agreed to the published version of the manuscript.
Funding
This research was co-funded by the European Union, grant number 101177985”.
Institutional Review Board Statement
The study was conducted in compliance with EU requirements and approved by the Ethics Advisor of the NEXUS project.
Data Availability Statement
Restrictions apply to the availability of these data. Data were obtained from the two metro operators and are available subject to their permission.
Acknowledgments
The authors would like to sincerely thank the two metro operators in providing the necessary information (including the station layout map, metro operational data and passenger demand data) for the modelling work of the NEXUS project described in this paper.
Conflicts of Interest
The authors declare no conflict of interest. The funders had no role in the design of the study; in the collection, analyses, or interpretation of data; in the writing of the manuscript; or in the decision to publish the results. Co-funded by the European Union. Views and opinion expressed are however those of the author(s) only and do not necessarily reflect those of the European Union or the Europe’s Rail Joint Undertaking. Neither the European Union nor the granting authority can be held responsible for them. The project ‘NEXUS’ is supported by the Europe’s Rail Joint Undertaking and its mem-bers.UK participants in this project are funded by the UKRI.
References
- Salgado, M.; Gilbert, N. Agent Based Modelling. In Handbook of Quantitative Methods for Educational Research; Brill, 2013; pp. 247–265. [Google Scholar]
- Bastarianto, F.F.; Hancock, T.O.; Choudhury, C.F.; Manley, E. Agent-Based Models in Urban Transportation: Review, Challenges, and Opportunities. Eur. Transp. Res. Rev. 2023, 15, 19. [Google Scholar] [CrossRef]
- Maggi, E.; Vallino, E. Understanding Urban Mobility and the Impact of Public Policies: The Role of the Agent-Based Models. Res. Transp. Econ. 2016, 55, 50–59. [Google Scholar] [CrossRef]
- Wise, S.; Crooks, A.; Batty, M. Transportation in Agent-Based Urban Modelling. In Agent Based Modelling of Urban Systems; Wise, S., et al., Eds.; Springer: Berlin/Heidelberg, Germany, 2017; pp. 129–148. [Google Scholar]
- Babulak, E.; Wang, M. Discrete Event Simulation. In Discrete Event Simulations; Goti, A., Ed.; Sciyo: Rijeka, Croatia, 2010. [Google Scholar]
- Robinson, S. Discrete-Event Simulation: From the Pioneers to the Present, What Next? J. Oper. Res. Soc. 2005, 56, 619–629. [Google Scholar] [CrossRef]
- Caro, J.J.; Möller, J. Advantages and Disadvantages of Discrete-Event Simulation for Health Economic Analyses. Expert Rev. Pharmacoeconomics Outcomes Res. 2016, 16, 327–329. [Google Scholar] [CrossRef] [PubMed]
- Misra, J. Distributed Discrete-Event Simulation. ACM Comput. Surv. (CSUR) 1986, 18, 39–65. [Google Scholar] [CrossRef]
- Wales, J.; Marinov, M. Analysis of Delays and Delay Mitigation on a Metropolitan Rail Network Using Event-Based Simulation. Simul. Model. Pract. Theory 2015, 52, 52–77. [Google Scholar] [CrossRef]
- Screen, D.; Parkinson, J.; Shilton, C.; Rjabovs, A.; Marinov, M. Data Analysis to Study Sub-Threshold Delays Incurred by Tyne and Wear Metro Trains. Urban Rail Transit 2020, 6, 93–103. [Google Scholar] [CrossRef]
- Farhi, N. A Discrete-Event Model of the Train Traffic on a Linear Metro Line. Appl. Math. Model. 2021, 96, 523–544. [Google Scholar] [CrossRef]
- Lee, J.; Marinov, M. Analysis of Rail Passenger Flow in a Rail Station Concourse Prior to and During the COVID-19 Pandemic Using Event-Based Simulation Models and Scenarios. Urban Rail Transit 2022, 8, 99–120. [Google Scholar] [CrossRef] [PubMed]
- Brice, D.; Marinov, M.; Rüger, B. A Newly Designed Baggage Transfer System Implemented Using Event-Based Simulations. Urban Rail Transit 2015, 1, 194–214. [Google Scholar] [CrossRef]
- Motraghi, A.; Marinov, M.V. Analysis of Urban Freight by Rail Using Event Based Simulation. Simul. Model. Pract. Theory 2012, 25, 73–89. [Google Scholar] [CrossRef]
- Dampier, A.; Marinov, M. A Study of the Feasibility and Potential Implementation of Metro-Based Freight Transportation in Newcastle upon Tyne. Urban Rail Transit 2015, 1, 164–182. [Google Scholar] [CrossRef]
- Kelly, J.; Marinov, M. Innovative Interior Designs for Urban Freight Distribution Using Light Rail Systems. Urban Rail Transit 2017, 3, 238–254. [Google Scholar] [CrossRef]
- Potti, P.; Marinov, M. Evaluation of Actual Timetables and Utilization Levels of West Midlands Metro Using Event-Based Simulations. Urban Rail Transit 2020, 6, 28–41. [Google Scholar] [CrossRef]
- Brailsford, S.C.; Eldabi, T.; Kunc, M.; Mustafee, N.; Osorio, A.F. Hybrid Simulation Modelling in Operational Research: A State-of-the-Art Review. Eur. J. Oper. Res. 2019, 278, 721–737. [Google Scholar] [CrossRef]
- Liu, L.; Chen, H. Microscopic Simulation-Based Pedestrian Distribution Service Network in Urban Rail Station. Transp. Res. Interdiscip. Perspect. 2021, 9, 100313. [Google Scholar] [CrossRef]
- Zhang, H.; He, B.; Lu, G.; Zhu, Y. A Simulation and Machine Learning Based Optimisation Method for Integrated Pedestrian Facilities Planning and Staff Assignment Problem in the Multi-Mode Rail Transit Transfer Station. Simul. Model. Pract. Theory 2022, 115, 102449. [Google Scholar] [CrossRef]
- Zhang, J.; Ai, Q.; Ye, Y.; Deng, S. Dynamic Flow Analysis and Crowd Management for Transfer Stations: A Case Study of Suzhou Metro Public Transport; 2024. [Google Scholar] [CrossRef]
- Xu, P.-C.; Lu, Q.-C.; Feng, T.; Li, J.; Li, G.; Xu, X. Resilience Analysis of Metro Stations Integrating Infrastructures and Passengers. Reliab. Eng. Syst. Saf. 2024, 252, 110467. [Google Scholar] [CrossRef]
- Loo, B.P.Y.; Wang, H. Dynamics of In-Station Time within Metro Systems: Measurement and Determining Factors. Tunn. Undergr. Space Technol. 2024, 153, 106006. [Google Scholar] [CrossRef]
- Li, Z.; Lo, S.M.; Ma, J.; Luo, X.W. A Study on Passengers’ Alighting and Boarding Process at Metro Platform by Computer Simulation. Transp. Res. Part A Policy Pract. 2020, 132, 840–854. [Google Scholar] [CrossRef]
- Metropolitan Sofia (n.d.) Serdica. Available online: https://www.metropolitan.bg/en/scheme/operating-metro/serdica.
Figure 1.
Illustrative Metro Sofia Route Map.

Figure 2.
Illustrative Metro Genoa Route Map.

Figure 3.
Serdica Metro Station Scheme [25].
Figure 3.
Serdica Metro Station Scheme [25].
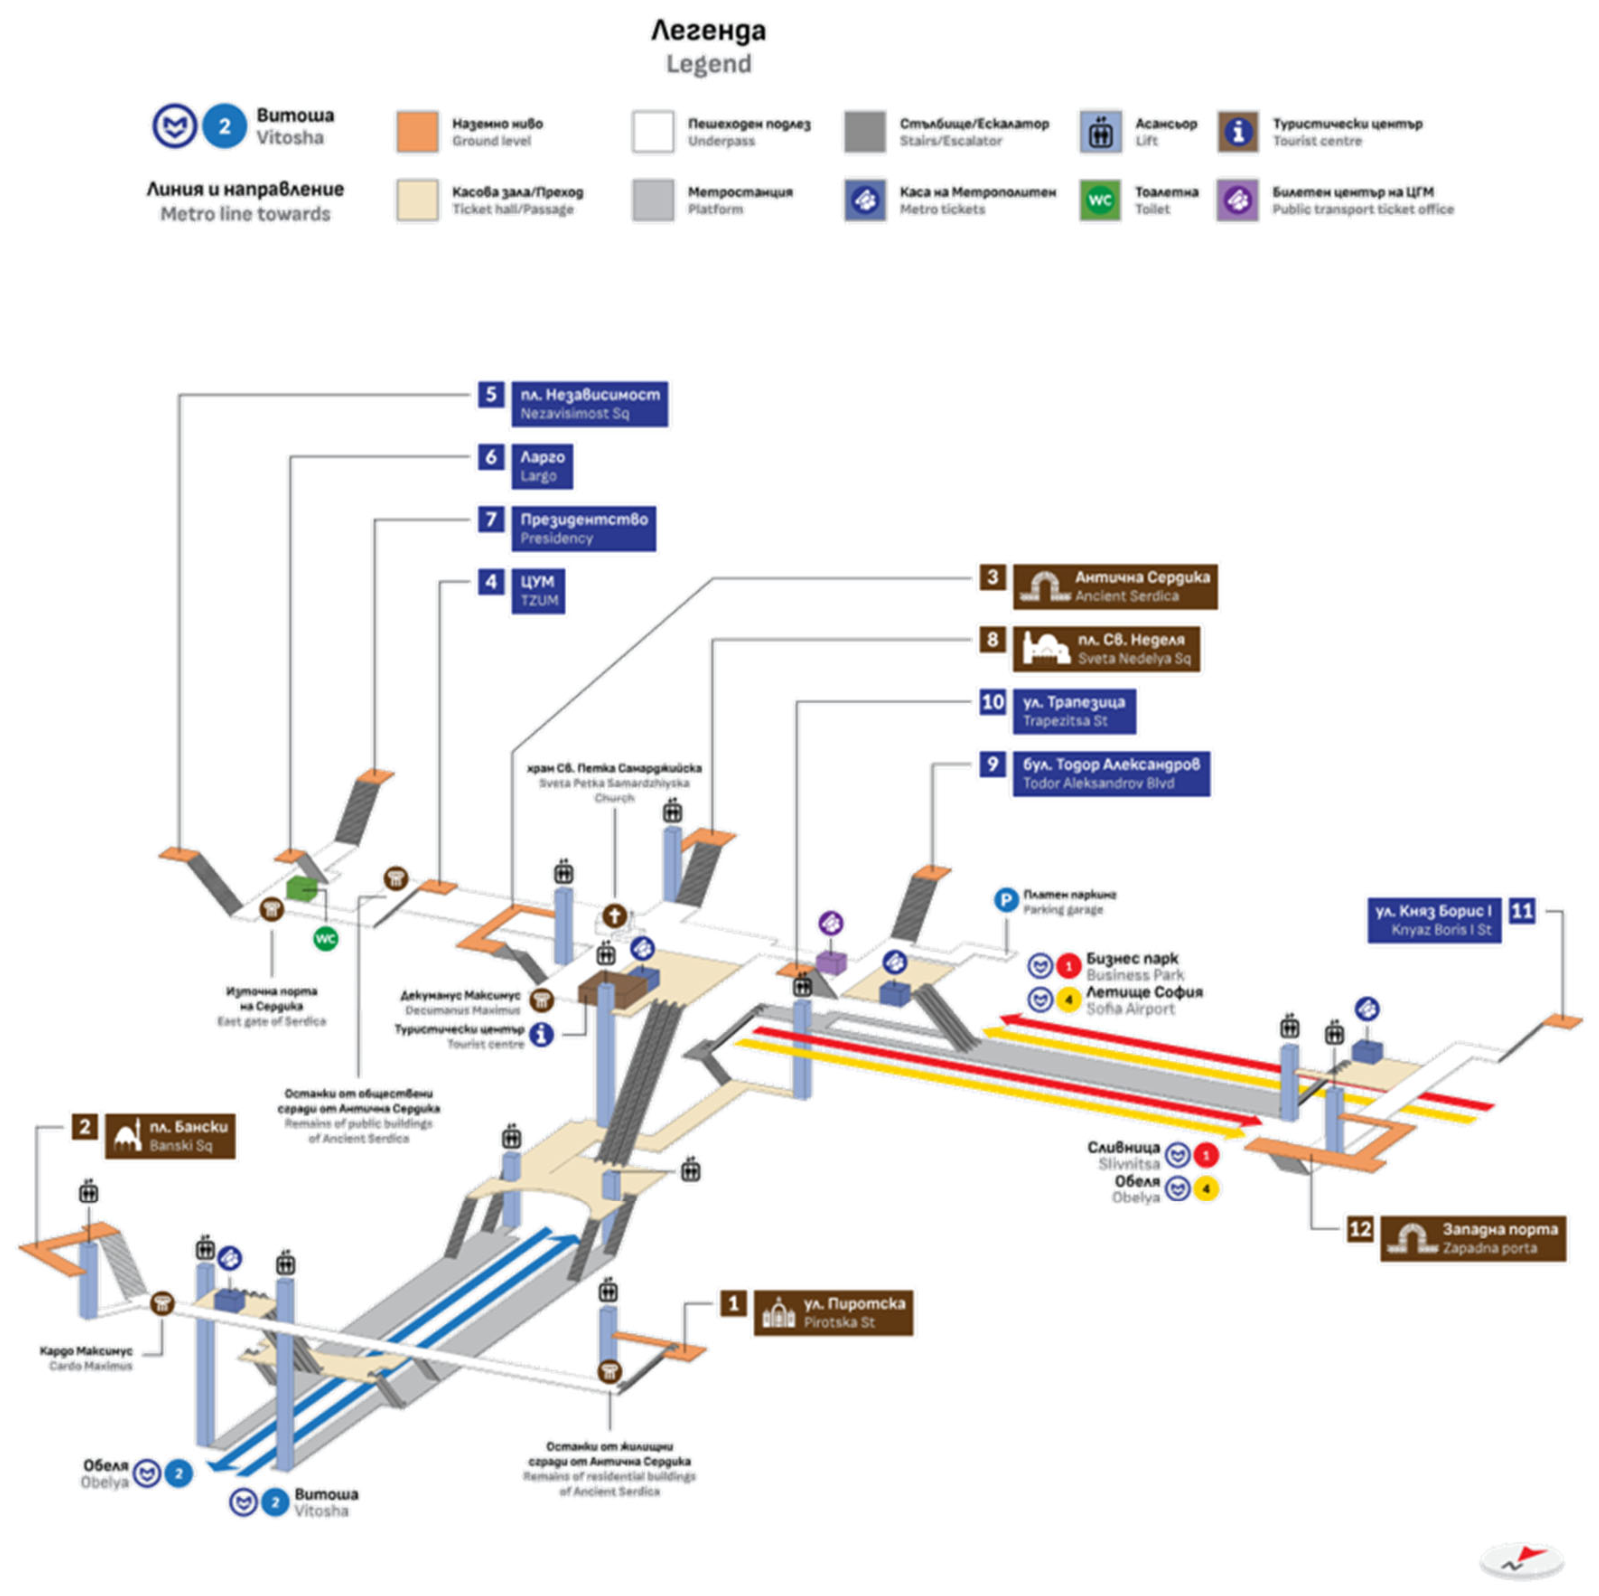
Figure 4.
Overview of Passenger Agents Modelling Logics in Simul8 for Metro Station Models.
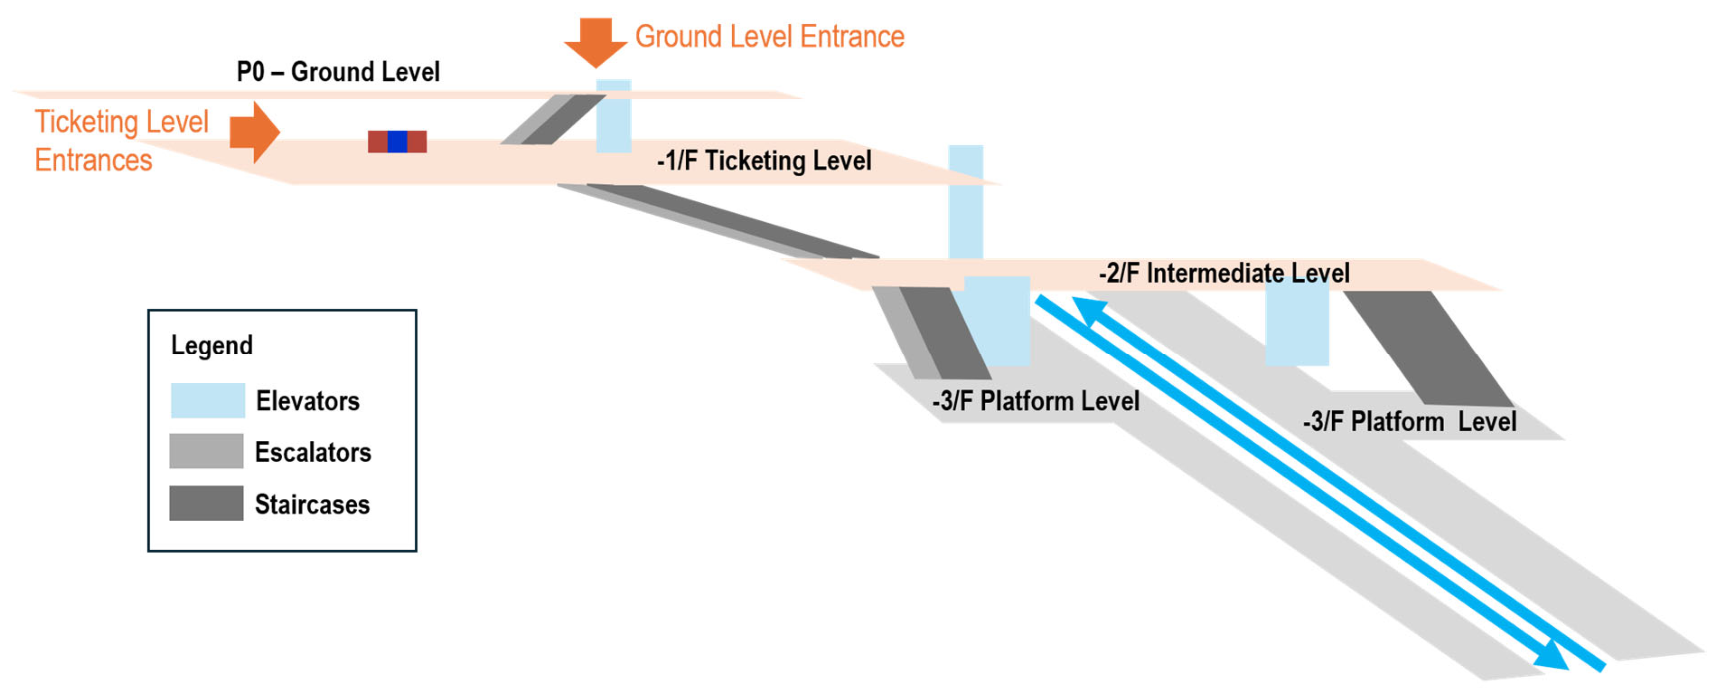
Figure 5.
Overview of Passenger Agents Modelling Logics in Simul8 for Metro Station Models.
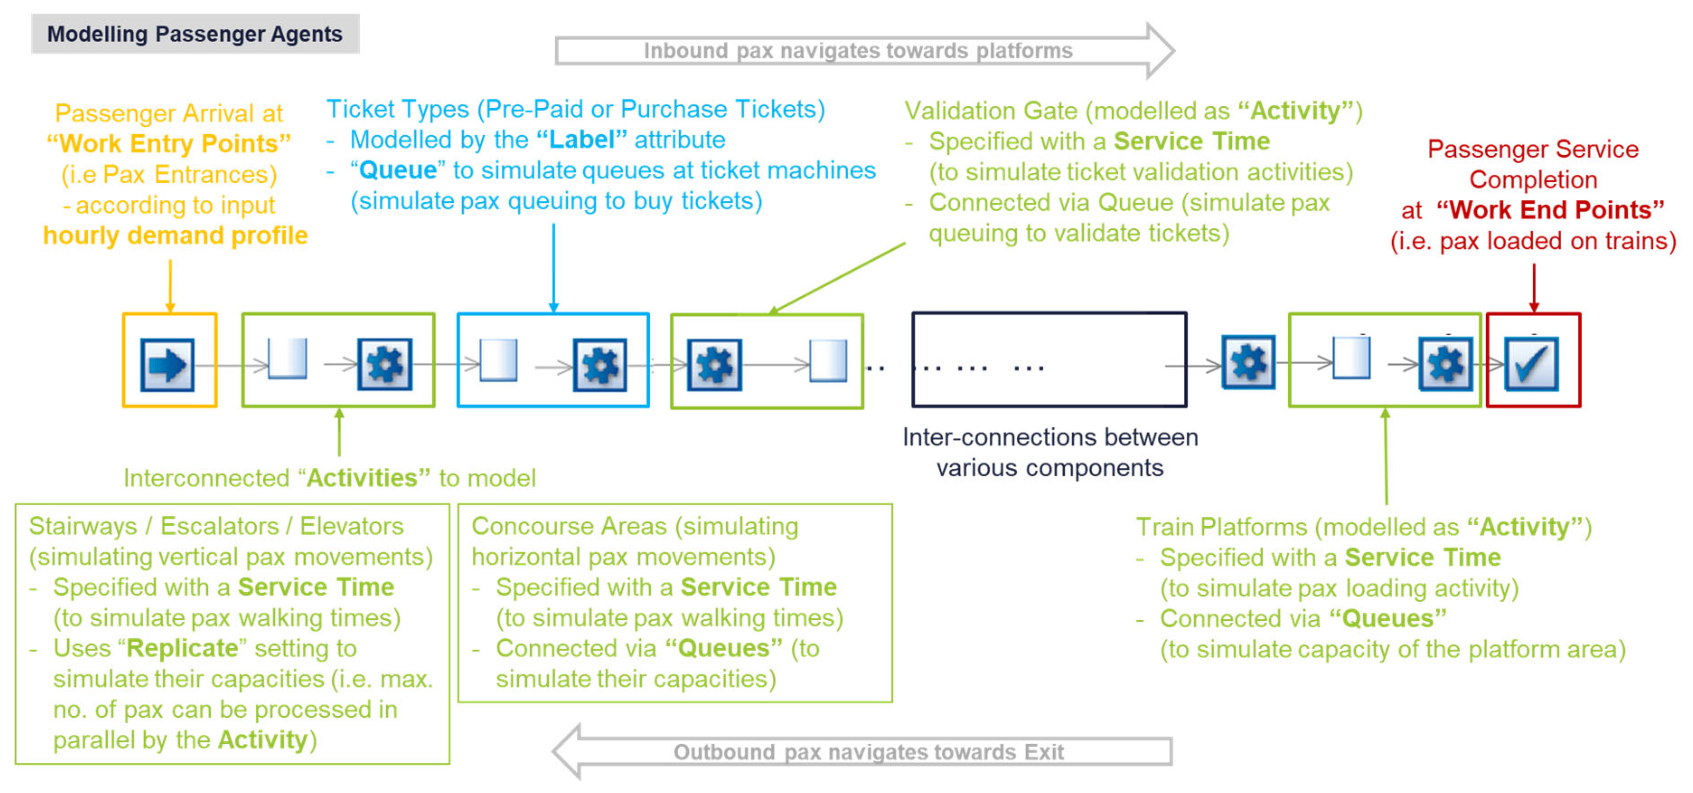
Figure 6.
Labelling of Direction of Travel (Inbound/Outbound).
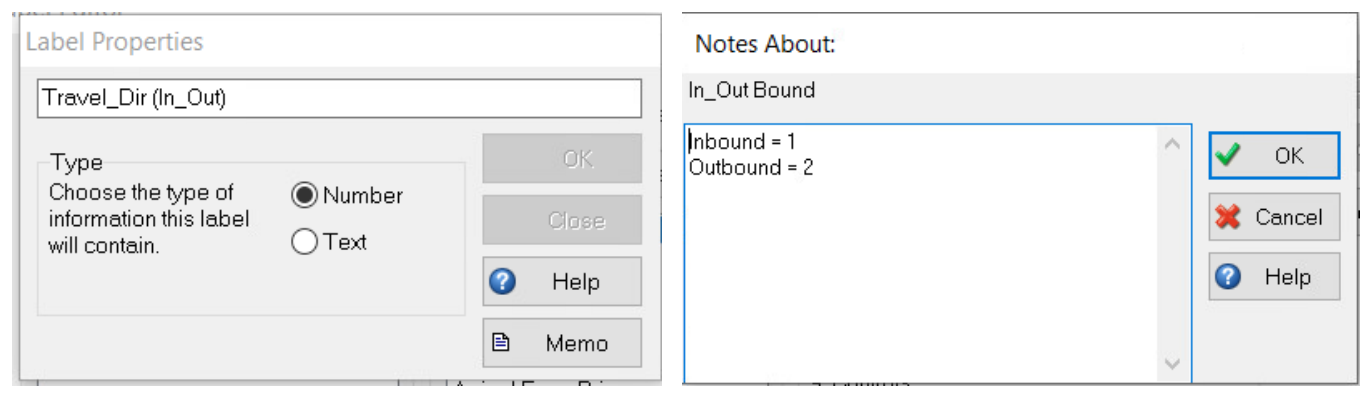
Figure 7.
Labelling of Ticket Types (with and without a Prepaid Ticket).
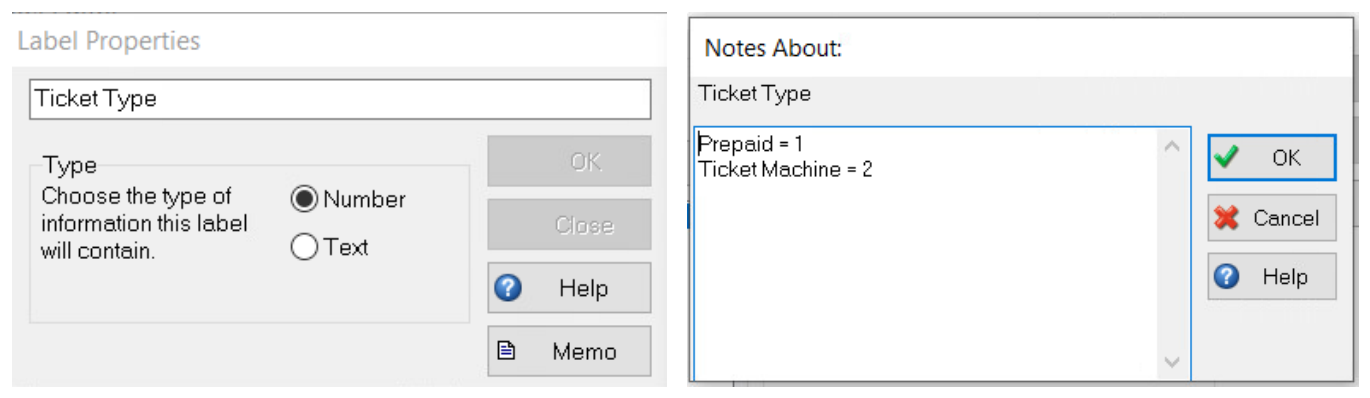
Figure 8.
Labelling of Transfer Passengers (from M2 to M1/M4).
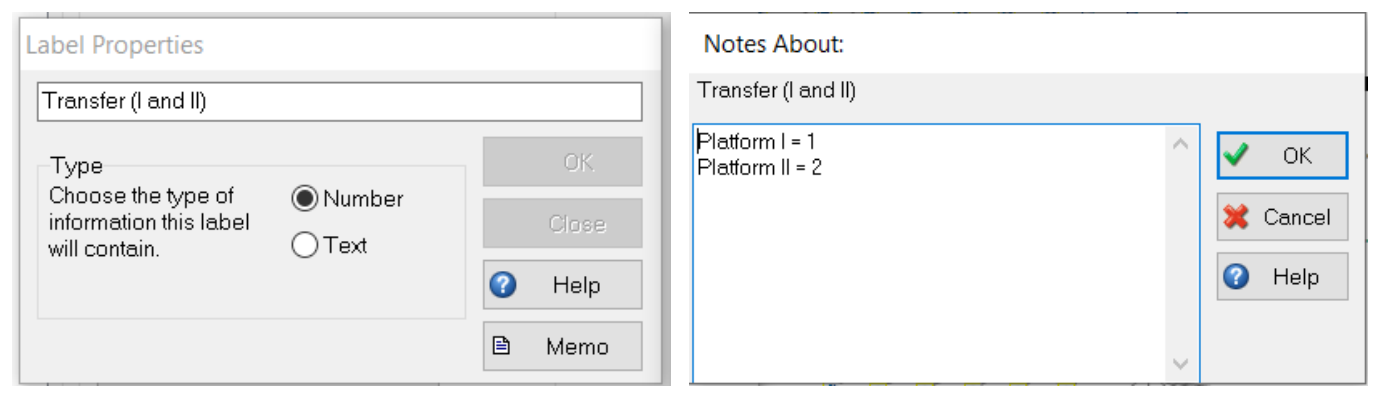
Figure 9.
Labelling of Transfer Passengers (from M1/M4 to M2).
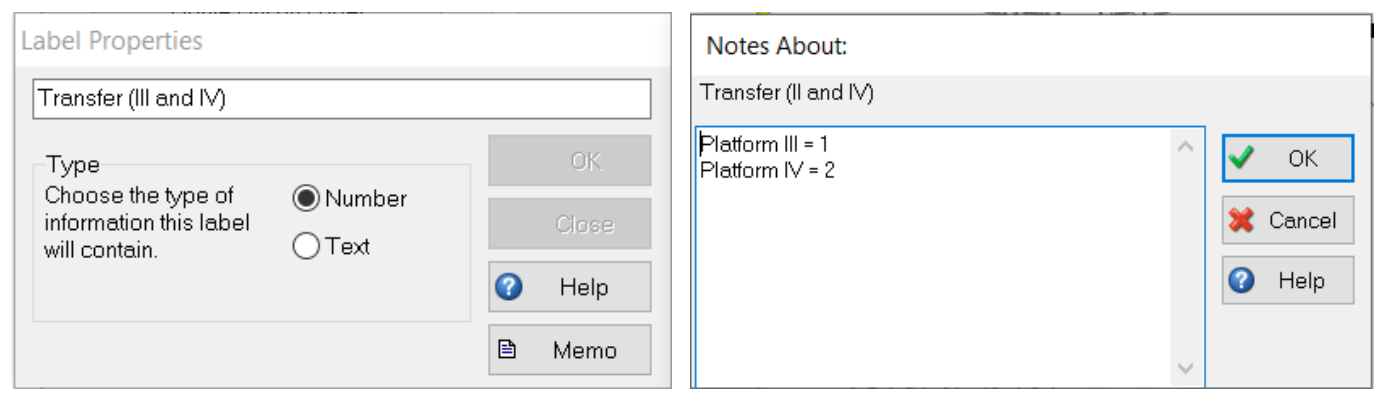
Figure 10.
Start Point Properties for the De Ferrari Stations (2 inbound and 2 outbound).
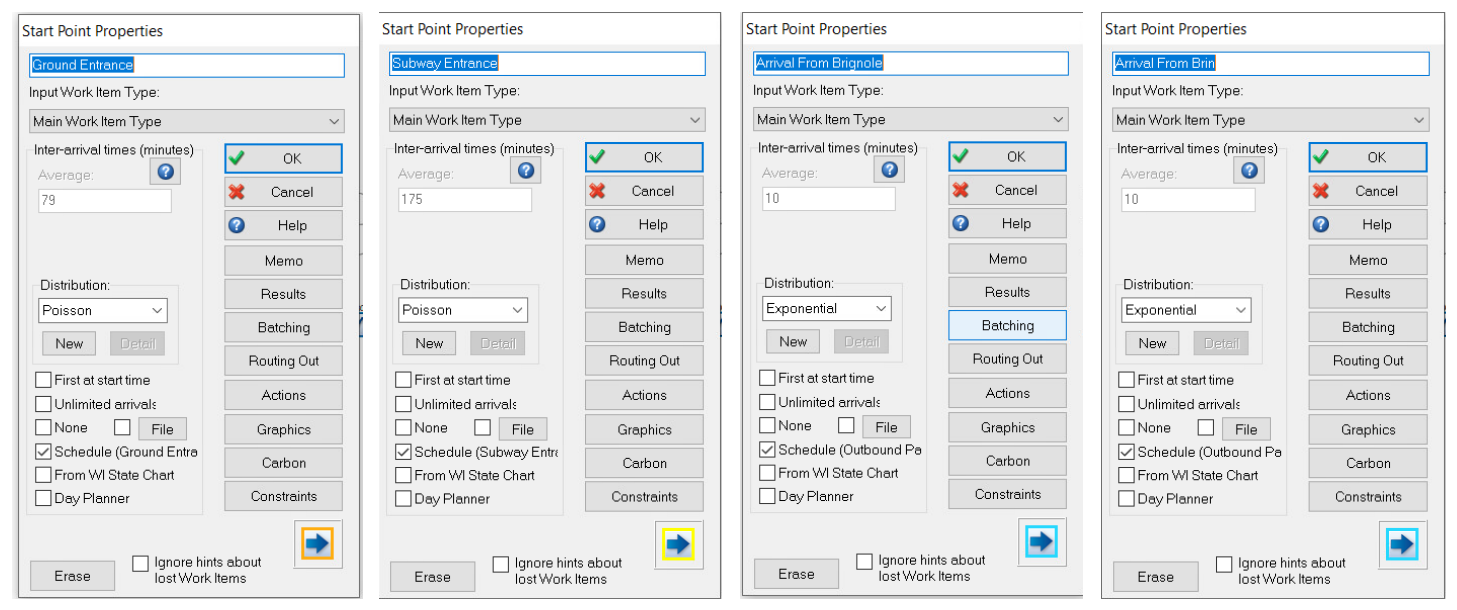
Figure 11.
Configuring the Label Value for Passenger’s Direction of Travel with the “Actions” Setting.
Figure 11.
Configuring the Label Value for Passenger’s Direction of Travel with the “Actions” Setting.
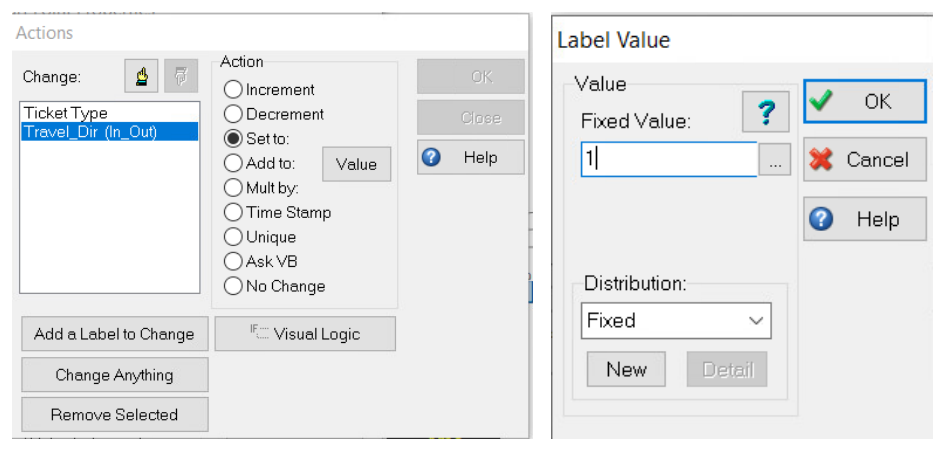
Figure 12.
Configuring the Label Value for Inbound Passenger Ticket Types with the “Actions” Setting.
Figure 12.
Configuring the Label Value for Inbound Passenger Ticket Types with the “Actions” Setting.
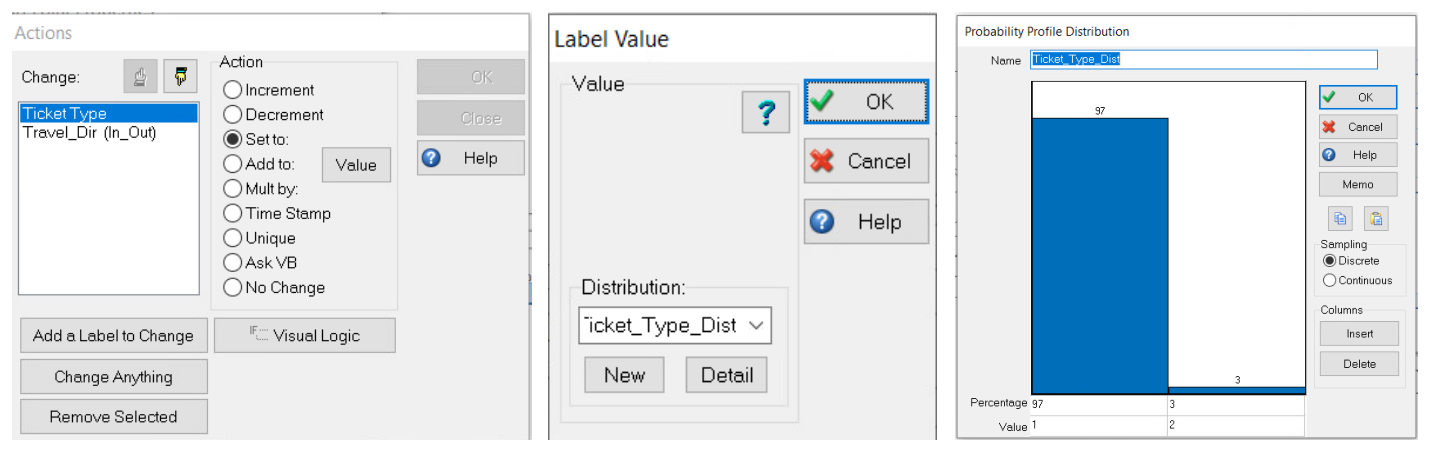
Figure 13.
Routing Out by Label Option for the Intermediate Level Area Activity Point.
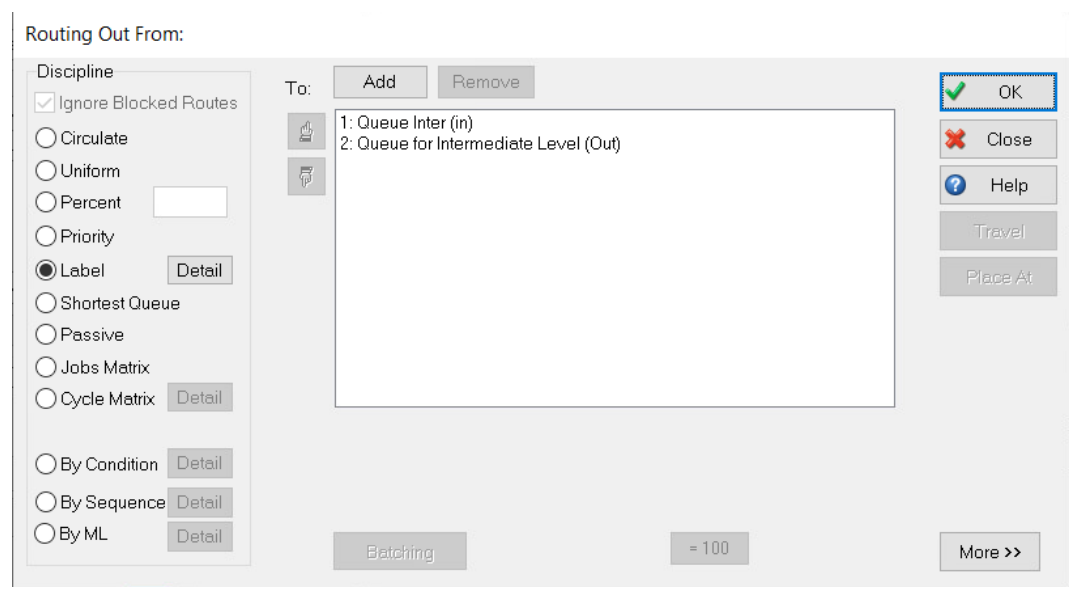
Figure 14.
Overview of Train Agents Modelling Logic for Metro Station Models.
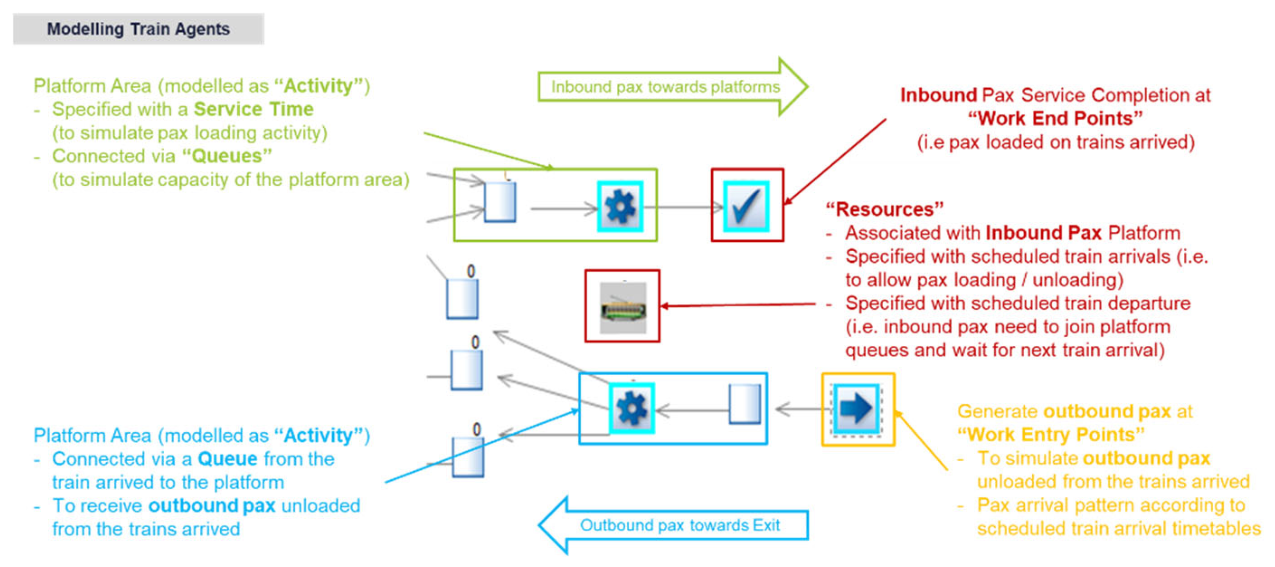
Figure 15.
Configuration of Platform “Activity” and the associated Train “Resource”.
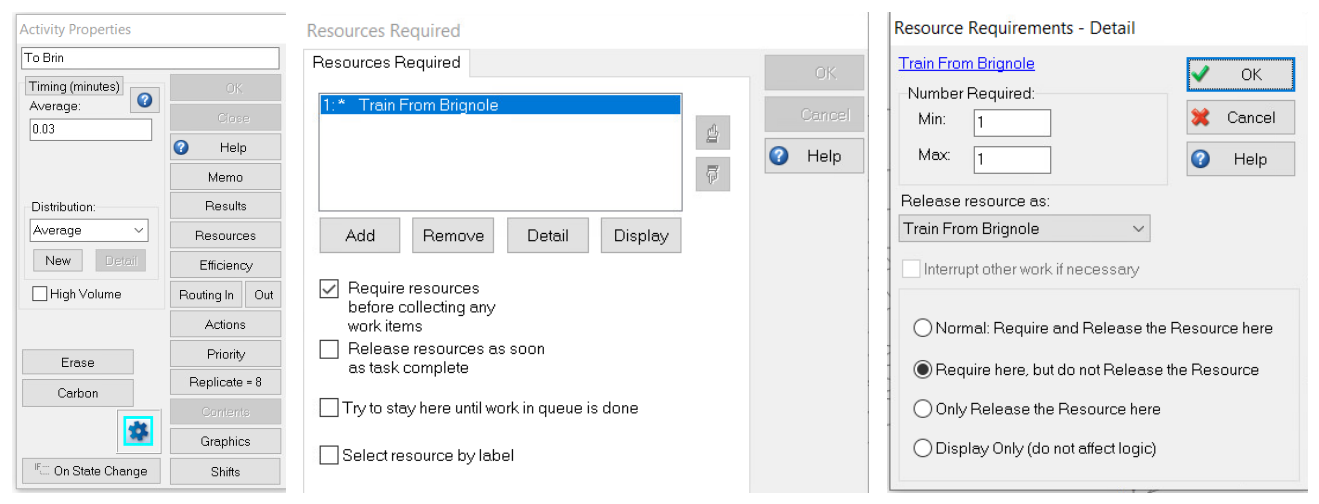
Figure 16.
Example Simul8 Metro Station Model Outputs.
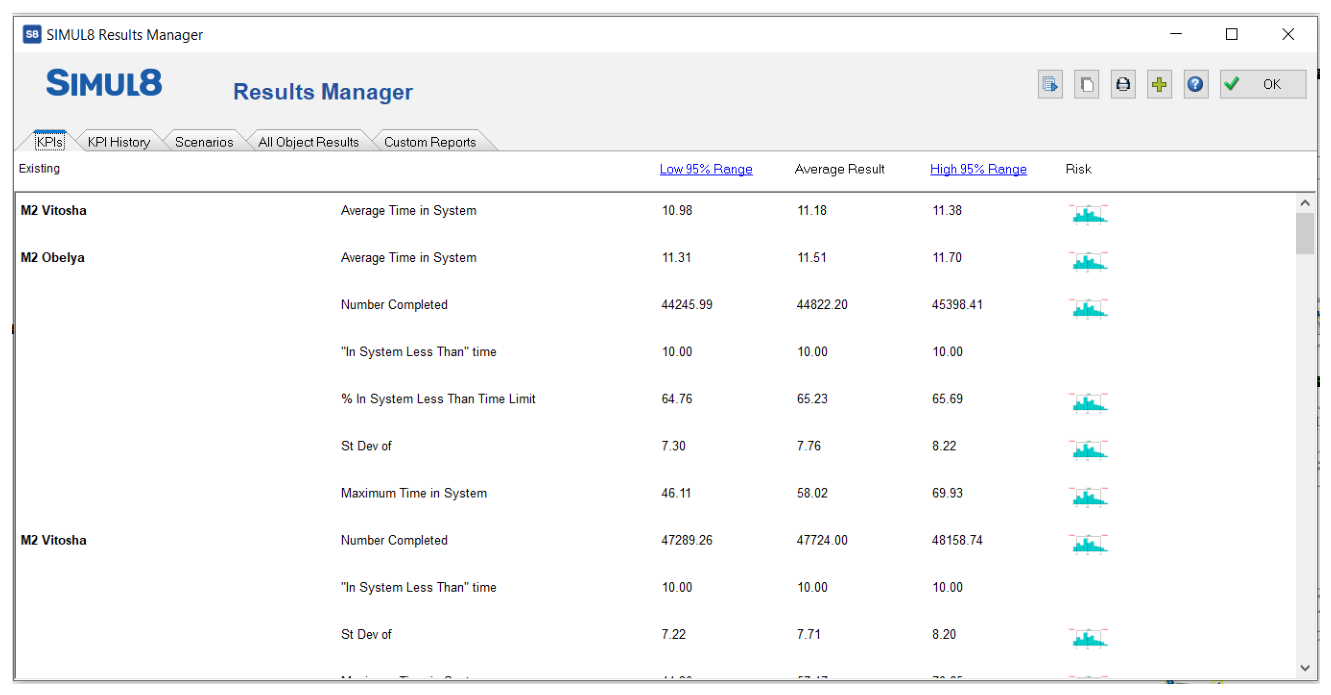
Figure 17.
De Ferrari Station Model Developed for AMT using Simul8.
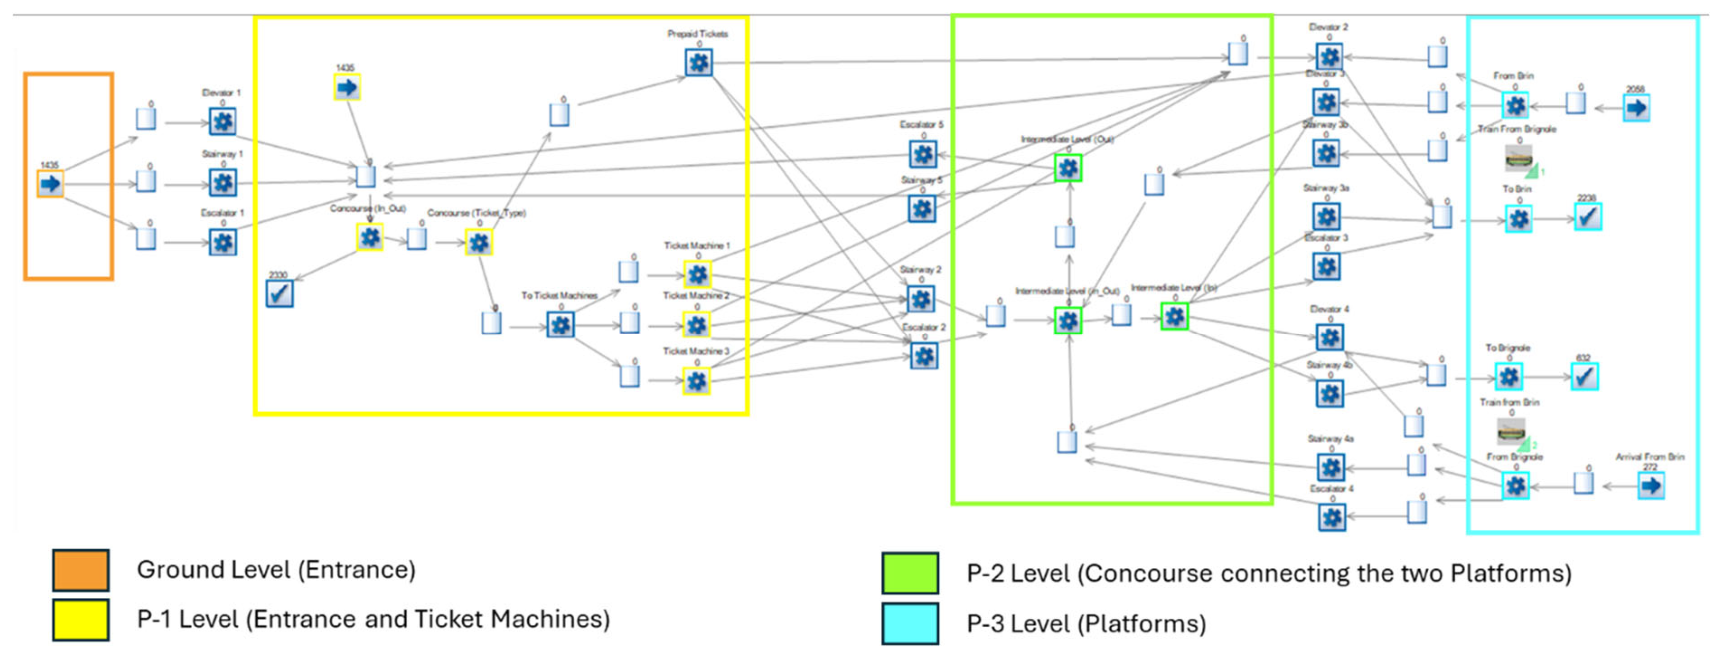
Figure 18.
Serdica Station Model Developed for MetroS using Simul8.
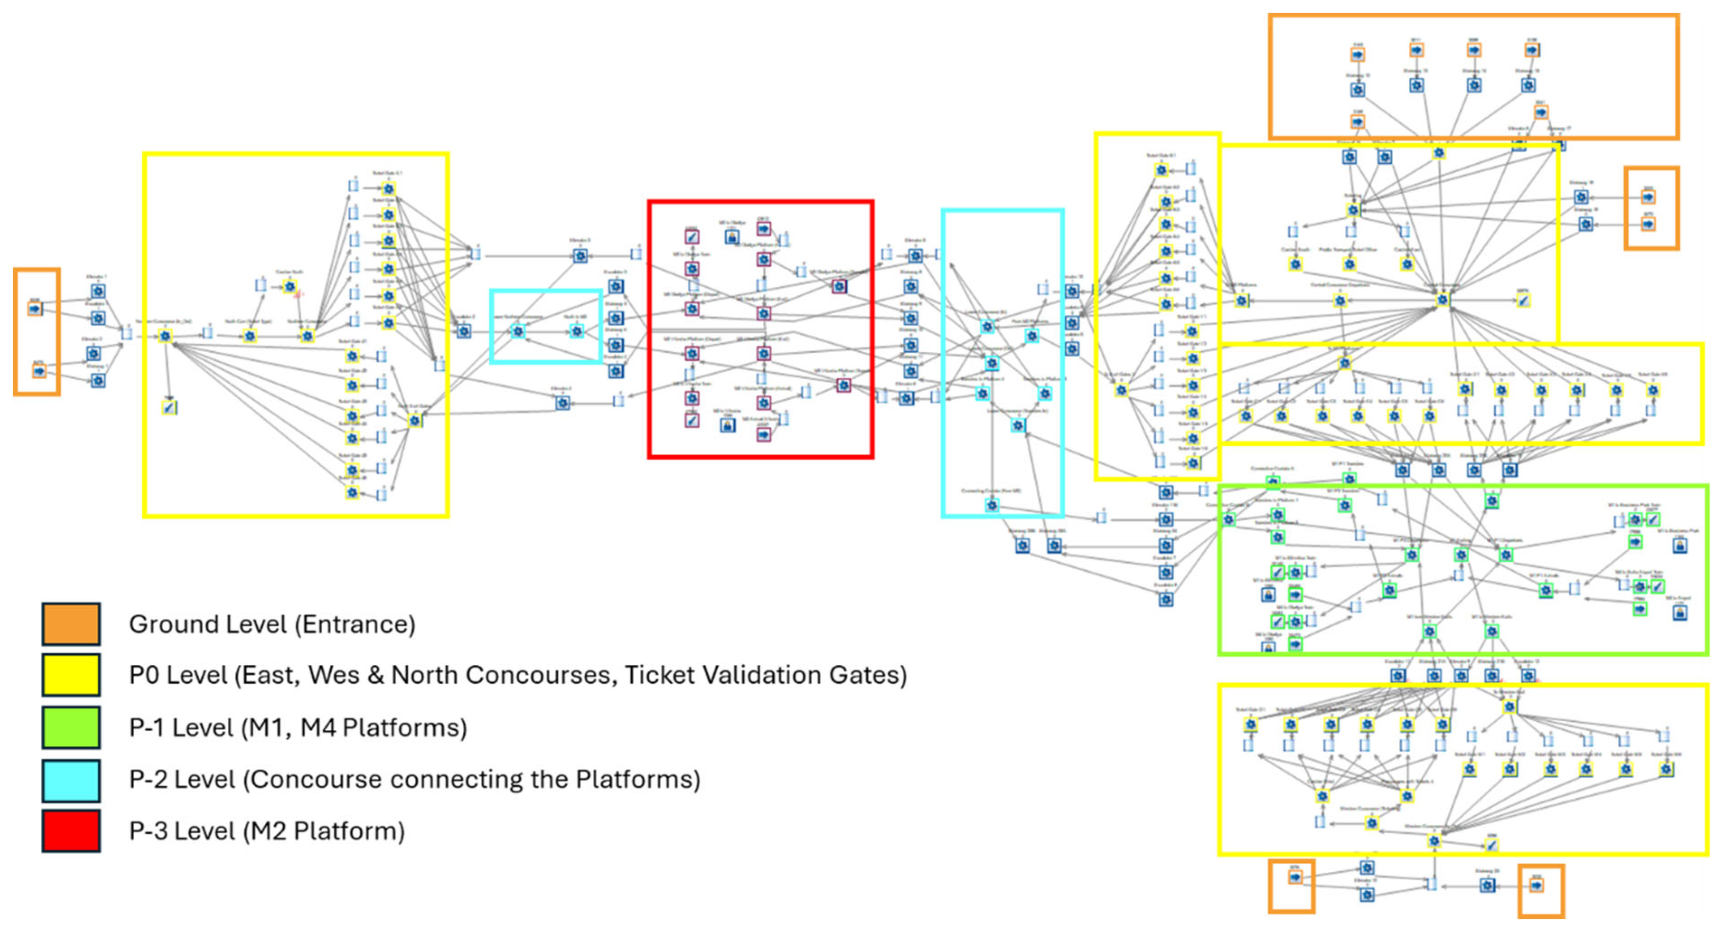

Table 1.
Metro Station Model Core Baseline Parameters.
| Parameter Category | Specific Parameters | AMT | MetroS |
|---|---|---|---|
| Location | Station Name | De Ferrari Station | Serdica Station |
| Layout | Number of Levels | 4 (G/F to -3/F) | 5 (G/F to -4/F) |
| Number of Entrances/Exits | 2 | 12 | |
| Number of Platforms | 2 | 4 | |
| Platform Capacity | 500 passengers | 1500 passengers | |
| Operational Parameters | Train Departure Schedules | Derived from GTFS data (with minimum headway of 6 mins) | Official daily timetable (with minimum headway of 3 mins) |
| Dwell Time | 22 seconds (Fixed) | 35 seconds (Fixed) | |
| Number of Lines Served | 1 | 3 (L1, L2 and L4) | |
| Train Capacity | Old: 420 pax/train New: 290 pax/train |
1226 pax/train | |
| Number of Train Doors | Old: 3 per car New: 3 per car |
5 per car for 1st and last carriage; 6 per car for intermediate carriage |
|
| Passenger Flow | Baseline OD Demand | Approximately 11,000 passenger visits/day | Approximately 80,000 passenger visits/day |
| Peak Hour Percentage | 15%-16% of daily total | 18% of daily total |
Table 2.
Major Station Model Input Parameters.
| Input Parameters | Modelling Purpose | Data Source | |
|---|---|---|---|
| Genoa | Sofia | ||
| Station Layout | To construct the basic structure of the station | Information in the Station Layout Map on operators’ website and site visit | Information in the Station Layout Map on operators’ website and site visit |
| Train Departure Schedules | To generate outbound passenger flow into the simulation system | Derived from GTFS data provided by the operator | Detailed schedules provided by the operator |
| Station Dwell Time | To simulate length of time trains stopped at the stations for loading/unloading passengers | A rough estimate informed by the operator | Detailed values provided by the operator |
| Daily Passenger Demand Profile | To model passenger arrivals to the station and passenger unloading from trains arrived at the station; and model validation | Informed by data provided by the operator, site visits, local knowledge, and field data collection | Informed by data provided by the operator, site visits, local knowledge, and field data collection |
| Distribution of Passenger Ticket Types | To model passenger movement behaviours; and model validation | Informed by site visits, local knowledge, and field data collection | Informed by site visits, local knowledge, and field data collection |
| Station Facilities Characteristics, and Utilisations | To model passengers’ dynamics; and model validation | Informed by site visits, local knowledge, and field data collection | Informed by site visits, local knowledge, and field data collection |
Table 3.
Observed and simulated inbound passenger flows at De Ferrari Station (Simul8).
| Entrances | Observed | Simulated | Platforms | Simulated |
|---|---|---|---|---|
| Grand Entrance | 2242 | 2242 | To Brin | 3318 |
| Subway Entrance | 2242 | 2242 | To Brignole | 1166 |
| Total | 4484 | 4484 | Total | 4484 |
Table 4.
Observed and simulated inbound passenger ticket types at De Ferrari Station (Simul8).
| Observed | Simulated | |||
|---|---|---|---|---|
| Prepaid Tickets | 4349 | 97.0% | 4346 | 96.9% |
| Ticket Machines | 135 | 3.0% | 138 | 3.1% |
| Total | 4484 | 100.0% | 4484 | 100.0% |
Table 5.
Observed and simulated outbound passenger flows at De Ferrari Station (Simul8).
| Observed | Simulated | |||
|---|---|---|---|---|
| Platforms | Platforms | Concourse | Exit | |
| From Brignole | 4307 | 4307 | – | – |
| From Brin | 1869 | 1869 | – | – |
| Total | 6176 | 6176 | 6176 | 6176 |
Table 6.
Observed and simulated inbound passenger flows at Serdica Station.
| North Entrances | East Entrances | West Entrances | Total | ||||||||||
| 1 | 2 | 3 | 4 | 5 | 6 | 7 | 8 | 9 | 10 | 11 | 12 | ||
| Observed | 6339 | 6339 | 2734 | 2734 | 2734 | 2734 | 2734 | 2734 | 2734 | 2734 | 2734 | 2734 | 40018 |
| Simulated | 6319 | 6357 | 2758 | 2771 | 2734 | 2732 | 2727 | 2730 | 2746 | 2720 | 2756 | 2771 | 40121 |
| % Diff | 0.3% | -0.3% | -0.9% | -1.4% | 0.0% | 0.1% | 0.3% | 0.1% | -0.4% | 0.5% | -0.8% | -1.4% | -0.3% |
Table 7.
Observed and simulated inbound passenger ticket types at Serdica Station.
| North Entrances | East Entrances | West Entrances | |||||||
|---|---|---|---|---|---|---|---|---|---|
| Observed | Simulated | % | Observed | Simulated | % | Observed | Simulated | % | |
| Prepaid Tickets | 12298 | 12298 | 97% | 21216 | 21216 | 97% | 5304 | 5357 | 97% |
| Ticket Machines | 380 | 377 | 3% | 656 | 656 | 3% | 164 | 170 | 3% |
Table 8.
Observed and simulated outbound and transfer passenger flows at Serdica Station.
| Observed | Simulated | Differences | ||||||||
|---|---|---|---|---|---|---|---|---|---|---|
| Outbound | Transfer | Total | Outbound | Transfer | Total | Outbound | Transfer | Total | ||
| East & West | Platform I | 12211 | 21561 | 33772 | 12183 | 21645 | 33828 | 0.2% | -0.4% | -0.2% |
| Platform II | 12211 | 26074 | 38285 | 12196 | 26123 | 38319 | 0.1% | -0.2% | -0.1% | |
| North | Platform III | 7291 | 27367 | 34658 | 7291 | 27375 | 34666 | 0.0% | 0.0% | 0.0% |
| Platform IV | 7291 | 24218 | 31509 | 7272 | 24242 | 31514 | 0.3% | -0.1% | 0.0% | |
| Total | 138224 | 138327 | -0.1% | |||||||
Table 9.
Observed and simulated outbound and transfer passenger flows arriving by metro lines at Serdica Station.
Table 9.
Observed and simulated outbound and transfer passenger flows arriving by metro lines at Serdica Station.
| Line 2 to Vitosha | Line 2 to Obelya | Line 1 to Slivnitsa | Line 4 to Obelya | Line 4 to Sofia Airport | Line 1 to Business Park | Total | |
|---|---|---|---|---|---|---|---|
| Observed | 31509 | 34658 | 19142.5 | 19142.5 | 16886 | 16886 | 138224 |
| Simulated | 31514 | 34666 | 19164 | 19155 | 16949 | 16879 | 138327 |
| % Diff | -0.02% | -0.02% | -0.11% | -0.07% | -0.37% | 0.04% | -0.07% |
Table 10.
Observed and simulated passenger boarding at platforms at Serdica Station.
| Line 2 to Vitosha | Line 2 to Obelya | Line 4 to Obelya | Line 4 to Sofia Airport | Line 1 to Slivnitsa | Line 1 to Business Park | Total | |
|---|---|---|---|---|---|---|---|
| Simulated | 36040 | 35069 | 15080 | 18920 | 15133 | 18884 | 139126 |
| Transferred | 24284 | 23351 | 11002 | 14791 | 11002 | 14791 | 99221 |
| Inbound | 11807 | 11807 | 4101 | 4101 | 4101 | 4101 | 40018 |
| Observed Total | 36091 | 35158 | 15103 | 18892 | 15103 | 18892 | 139239 |
| % Diff | -0.14% | -0.25% | -0.15% | 0.15% | 0.20% | -0.04% | -0.08% |
Table 11.
Summary of Scenario Specifications.
| Description | Scenario ID | Specifications | Metro System |
|---|---|---|---|
| Peak | Scenario 1A | 07:00 -10:00 on a typical day | AMT |
| Scenario 1B | 07:00–10:00 on a typical day | MetroS | |
| Scenario 1C | 16:00–20:00 on a typical day | AMT | |
| Scenario 1D | 16:00–20:00 on a typical day | MetroS | |
| Off-Peak | Scenario 2A | 05:00–07:00 on a typical day | AMT |
| Scenario 2B | 05:00–07:00 on a typical day | MetroS | |
| Scenario 2C | 10:00 -16:00 on a typical day | AMT | |
| Scenario 2D | 10:00 -16:00 on a typical day | MestroS | |
| Scenario 2E | 20:00–24:00 on a typical day | AMT | |
| Scenario 2F | 20:00–24:00 on a typical day | MetroS |
Table 12.
De Ferrari Station KPI Results Summary.
| 1A | 1C | 2A | 2C | 2E | |
|---|---|---|---|---|---|
| Direction: To Brin | |||||
| Ave No. of Pax/hour | 127.7 | 319.3 | 1.1 | 263.2 | 17.7 |
| Time in Station (min) | 7.6 | 14.2 | 5.1 | 12.1 | 7.1 |
| Ave Queue Time (min) | 4.5 | 8.9 | 2.1 | 8.1 | 4.0 |
| Ave Queue Length (# pax.) | 4.0 | 40.0 | 0.4 | 24.4 | 7.5 |
| Direction: To Brignole | |||||
| Ave No. of Pax/hour | 33.8 | 137.8 | 10.0 | 79.8 | 5.7 |
| Time in Station (min) | 5.2 | 8.9 | 5.0 | 6.2 | 9.7 |
| Ave Queue Time (min) | 2.1 | 4.2 | 2.0 | 2.6 | 6.5 |
| Ave Queue Length (# pax.) | 0.5 | 9.7 | 0.1 | 2.4 | 1.7 |
Table 13.
Serdica Station KPI Results Summary.
| 1B | 1D | 2B | 2D | 2F | |
|---|---|---|---|---|---|
| Direction: Line 2 (to Vitosha) | |||||
| Ave No. of Pax/hour | 2794 | 2949 | 593 | 1923 | 740 |
| Time in Station (min) | 6.8 | 7.4 | 7.7 | 7.4 | 7.9 |
| Ave Queue Time (min) | 2.7 | 3.3 | 3.5 | 3.5 | 4.0 |
| Ave Queue Length | 64.8 | 137.1 | 13.2 | 90.1 | 56.6 |
| Direction: Line 2 (to Obelya) | |||||
| Ave No. of Pax/hour | 2625 | 3175 | 513 | 1841 | 756 |
| Time in Station (min) | 7.4 | 7.6 | 11.6 | 7.5 | 8.0 |
| Ave Queue Time (min) | 3.3 | 3.5 | 7.5 | 3.6 | 4.1 |
| Ave Queue Length | 80.3 | 165.9 | 24.0 | 93.9 | 67.3 |
| Direction: Line 4 (to Obelya) | |||||
| Ave No. of Pax/hour | 968 | 1409 | 215 | 799 | 395 |
| Time in Station (min) | 7.5 | 7.2 | 11.3 | 7.4 | 8.6 |
| Ave Queue Time (min) | 2.7 | 3.0 | 6.8 | 3.2 | 4.9 |
| Ave Queue Length | 26.0 | 62.0 | 8.7 | 36.7 | 35.4 |
| Direction: Line 4 (to Sofia Airport) | |||||
| Ave No. of Pax/hour | 1351 | 1718 | 291 | 1015 | 489 |
| Time in Station (min) | 7.0 | 8.2 | 7.9 | 9.0 | 9.5 |
| Ave Queue Time (min) | 1.9 | 3.5 | 3.3 | 4.5 | 5.5 |
| Ave Queue Length | 24.0 | 84.7 | 5.9 | 58.7 | 46.8 |
| Direction: Line 1 (to Silv) | |||||
| Ave No. of Pax/hour | 990 | 1421 | 198 | 811 | 381 |
| Time in Station (min) | 8.3 | 8.1 | 10.7 | 8.4 | 7.2 |
| Ave Queue Time (min) | 3.6 | 3.8 | 6.8 | 4.3 | 3.5 |
| Ave Queue Length | 33.2 | 78.5 | 8.9 | 47.9 | 27.9 |
| Direction: Line 1 (to Business Park) | |||||
| Ave No. of Pax/hour | 1349 | 1659 | 261 | 1018 | 461 |
| Time in Station (min) | 8.7 | 7.6 | 11.1 | 8.5 | 9.0 |
| Ave Queue Time (min) | 3.6 | 2.9 | 6.5 | 4.0 | 5.0 |
| Ave Queue Length | 44.0 | 73.0 | 12.1 | 56.3 | 45.4 |
Disclaimer/Publisher’s Note: The statements, opinions and data contained in all publications are solely those of the individual author(s) and contributor(s) and not of MDPI and/or the editor(s). MDPI and/or the editor(s) disclaim responsibility for any injury to people or property resulting from any ideas, methods, instructions or products referred to in the content. |
© 2026 by the authors. Licensee MDPI, Basel, Switzerland. This article is an open access article distributed under the terms and conditions of the Creative Commons Attribution (CC BY) license (http://creativecommons.org/licenses/by/4.0/).
Copyright: This open access article is published under a Creative Commons CC BY 4.0 license, which permit the free download, distribution, and reuse, provided that the author and preprint are cited in any reuse.