
Submitted:
13 September 2026
Posted:
15 September 2026
You are already at the latest version
Abstract
Background: MpMRI-integrated risk calculators have been developed to improve individualized prediction of clinically significant prostate cancer (csPCa) before biopsy. Although these models have demonstrated good predictive performance in previous validation studies, their performance and clinical utility may vary across patient populations and diagnostic pathways. This study externally validated the mpMRI-based prostate cancer risk calculators developed by Radtke et al. (Radtke-RC) and Alberts et al. (Alberts-RC) in a contemporary pre-biopsy mpMRI population and directly compared both models within the same patient population. Methods: We retrospectively included patients undergoing pre-biopsy mpMRI followed by combined MRI-targeted and systematic prostate biopsy. Predicted probabilities of clinically significant prostate cancer (csPCa; ISUP Grade Group ≥ 2) were calculated using the Radtke and Alberts MRI-integrated risk calculators. Discrimination was assessed using receiver operating characteristic analysis and compared using DeLong’s test. Clinical utility was evaluated using decision curve analysis across a range of threshold probabilities, with thresholds of 12%, 20%, and 30% used for descriptive interpretation of net benefit and potential reductions in unnecessary biopsies. Results: Of 171 screened patients, 164 were eligible for validation of the Radtke-RC, including 62 (37.8%) with csPCa. Complete data for both calculators were available in 114 patients, of whom 41 (36.0%) had csPCa. In the head-to-head cohort, discrimination was acceptable for both calculators (AUC 0.785 for Radtke-RC vs. 0.767 for Alberts-RC; DeLong p=0.318). Decision curve analysis demonstrated threshold-dependent clinical utility. The Radtke-RC provided greater net benefit than biopsy-all from approximately 9% to 69%, whereas the Alberts-RC provided greater net benefit from approximately 18% to 56%. At 12%, incremental benefit over biopsy-all was marginal for the Radtke-RC and absent for the Alberts-RC. At 20%, the Radtke-RC and Alberts-RC reduced unnecessary biopsies by 7.9 and 4.4 per 100 patients, respectively, corresponding to numbers needed to assess of approximately 13 and 23 to avoid one unnecessary biopsy. At 30%, the corresponding reductions were 12.9 and 10.8 per 100 patients, with numbers needed to assess of approximately 8 and 9, respectively. Conclusions: Both the Radtke and Alberts MRI-integrated risk calculators demonstrated acceptable and comparable discrimination for csPCa, with neither model showing a clear overall advantage. Clinical utility was strongly threshold-dependent, with limited incremental benefit over biopsy-all at low thresholds but increasing potential to reduce unnecessary biopsies at higher thresholds. These findings suggest that the principal value of MRI-integrated risk calculators in an already MRI-selected population lies in supporting individualized biopsy decisions. Threshold selection should therefore reflect the clinical trade-off between avoiding unnecessary biopsy and minimizing missed csPCa. Further prospective multicentre validation is warranted to define clinically appropriate thresholds.
Keywords:
prostate cancer
; multiparametric MRI
; risk calculator
; external validation
; clinically significant prostate cancer
; decision curve analysis
1. Introduction
Prostate cancer (PCa) is the second most frequently diagnosed malignancy among men worldwide and remains a leading cause of cancer-related mortality. [1] Although prostate-specific antigen (PSA) testing has facilitated earlier cancer detection, its limited specificity results in unnecessary biopsies, overdiagnosis of clinically insignificant disease, and overtreatment, highlighting the need for more accurate pre-biopsy risk stratification. [2,3]
Over the past decade, multiparametric magnetic resonance imaging (mpMRI) has fundamentally transformed prostate cancer diagnostics. [3,4] By combining anatomical and functional imaging with standardized lesion assessment using the Prostate Imaging Reporting and Data System (PI-RADS), mpMRI improves the detection of clinically significant prostate cancer (csPCa) while reducing unnecessary biopsies. [3,4] However, MRI findings alone cannot reliably distinguish clinically significant from insignificant disease and should therefore be interpreted together with established clinical risk factors. [5]
To improve individualized risk estimation, several multivariable prediction models have been developed. [6,7,8,9] Earlier calculators, including the Prostate Cancer Prevention Trial (PCPT) and European Randomized Study of Screening for Prostate Cancer (ERSPC) models, combine routinely available clinical variables to estimate prostate cancer risk before biopsy. [6,7] Although these models performed well in their development cohorts, external validation studies demonstrated variable performance across different clinical settings. [8,9]
The integration of mpMRI into multivariable prediction models has led to MRI-based risk calculators with improved discrimination for csPCa. [10,11] Among the best validated models are the MRI-based risk calculator developed by Radtke et al. (Radtke-RC) and the MRI-integrated Rotterdam ERSPC risk calculator developed by Alberts et al. (Alberts-RC). [10,11,12,13,14] Both models combine PI-RADS assessment with established clinical variables and have demonstrated predictive performance across multiple external validation studies. [12,13,14]
A recent systematic review and meta-analysis confirmed that MRI-based risk calculators consistently improve individualized risk prediction compared with clinical models alone, although their clinical impact depends on patient selection and the diagnostic pathway in which they are applied. [15]
Both the Radtke-RC and Alberts-RC have demonstrated good predictive performance in previous external validation studies. [12,13,14] However, direct comparison of their discriminative performance and clinical utility within the same cohort of patients selected for biopsy after pre-biopsy mpMRI may provide further insight into their relative performance in clinical practice.
The aim of the present study was to externally validate the Radtke-RC and Alberts-RC in a contemporary single-centre cohort of patients undergoing pre-biopsy mpMRI and subsequent prostate biopsy.
2. Materials and Methods
This retrospective single-centre study was conducted at the Department of Urology, Paracelsus Medical University Salzburg, Austria. The study was approved by the Ethics Committee of the Federal State of Salzburg (approval number: 1081/2025) and was conducted in accordance with the Declaration of Helsinki. Consecutive patients who underwent pre-biopsy multiparametric magnetic resonance imaging (mpMRI) followed by prostate biopsy between October 2023 and September 2025 were retrospectively identified. Clinical, radiological, and pathological data were extracted from the institutional electronic medical records and pseudonymized before analysis.
Collected variables included age, pre-biopsy serum prostate-specific antigen (PSA), prostate volume, digital rectal examination (DRE) findings, previous negative biopsy status, and PI-RADS score. Histopathological data included biopsy outcome and Gleason score/ISUP Grade Group.
Patients were eligible if clinical, radiological, and pathological data required for risk calculation and outcome assessment were available. Patients with missing predictor variables or pathological outcomes were excluded. Complete-case cohorts were defined separately for the Radtke-RC and Alberts-RC according to the predictor variables required by each model.
All mpMRI examinations were interpreted by experienced radiologists, and suspicious lesions were classified according to PI-RADS version 2.1.4 For patients with multiple lesions, the highest PI-RADS score was used for subsequent analyses. All patients underwent combined MRI-targeted and systematic fusion-guided prostate biopsy via a transperineal or transrectal approach according to institutional practice. Histopathological evaluation was performed according to the International Society of Urological Pathology (ISUP) grading system of 2019. [16]
The primary endpoint was clinically significant prostate cancer (csPCa), defined as ISUP Grade Group ≥2 on prostate biopsy, consistent with the outcome definition used in the original model studies.10,11 ISUP Grade Group 1 tumors were classified as clinically insignificant prostate cancer. Biopsy histopathology served as the reference standard for outcome classification, irrespective of subsequent radical prostatectomy findings.
Predicted probabilities of csPCa were calculated using the MRI-integrated risk calculators developed by Radtke et al. [10] and Alberts et al. [11] The Radtke-RC was implemented according to the published logistic regression equation.10 For the Alberts-RC, predicted probabilities were obtained using the publicly available online Rotterdam ERSPC risk calculator provided by the Prostate Cancer Research Foundation (Stichting Wetenschappelijk Onderzoek Prostaatkanker [SWOP]). [11] The Alberts-RC was therefore evaluated as a black-box prediction model because the underlying regression coefficients were not publicly available.
Continuous variables are presented as mean ± standard deviation (SD), and categorical variables as frequencies and percentages. Discrimination was assessed using receiver operating characteristic (ROC) analysis, and the area under the ROC curve (AUC) with corresponding 95% confidence intervals (CI) was calculated. The discriminative performance of the Radtke-RC and Alberts-RC was directly compared using DeLong’s test for paired ROC curves in the complete-case cohort (n = 114). [17]
Clinical utility was assessed using decision curve analysis (DCA) across the evaluated range of threshold probabilities by comparing the net benefit of each risk calculator with the default strategies of biopsying all patients and performing no biopsy. [18] Net-reduction curves were additionally used to quantify the potential reduction in unnecessary biopsies relative to a biopsy-all strategy. For descriptive interpretation, threshold probabilities of 12%, 20%, and 30% were evaluated, with the 12% threshold additionally included to facilitate comparison with the previous external validation by Pallauf et al. [19] The corresponding number needed to assess (NNA) was calculated to express the number of patients who would need to be assessed using the risk calculator to avoid one unnecessary biopsy. For complementary interpretation, incremental net benefit relative to the biopsy-all strategy was also expressed as net true-positive equivalents per 100 patients. The reciprocal of the incremental net benefit was used to derive the number needed to assess to obtain one additional net true-positive equivalent; these values represent decision-analytic equivalents rather than additionally detected csPCa cases. The selected thresholds were used for descriptive interpretation and were not considered prespecified clinical biopsy cut-offs.
Statistical analyses were performed using R version 4.4.0, and statistical significance was defined as a two-sided p value <0.05. Given that no adjustment for multiple testing was performed, inferential results should be interpreted as exploratory and hypothesis-generating.
3. Results
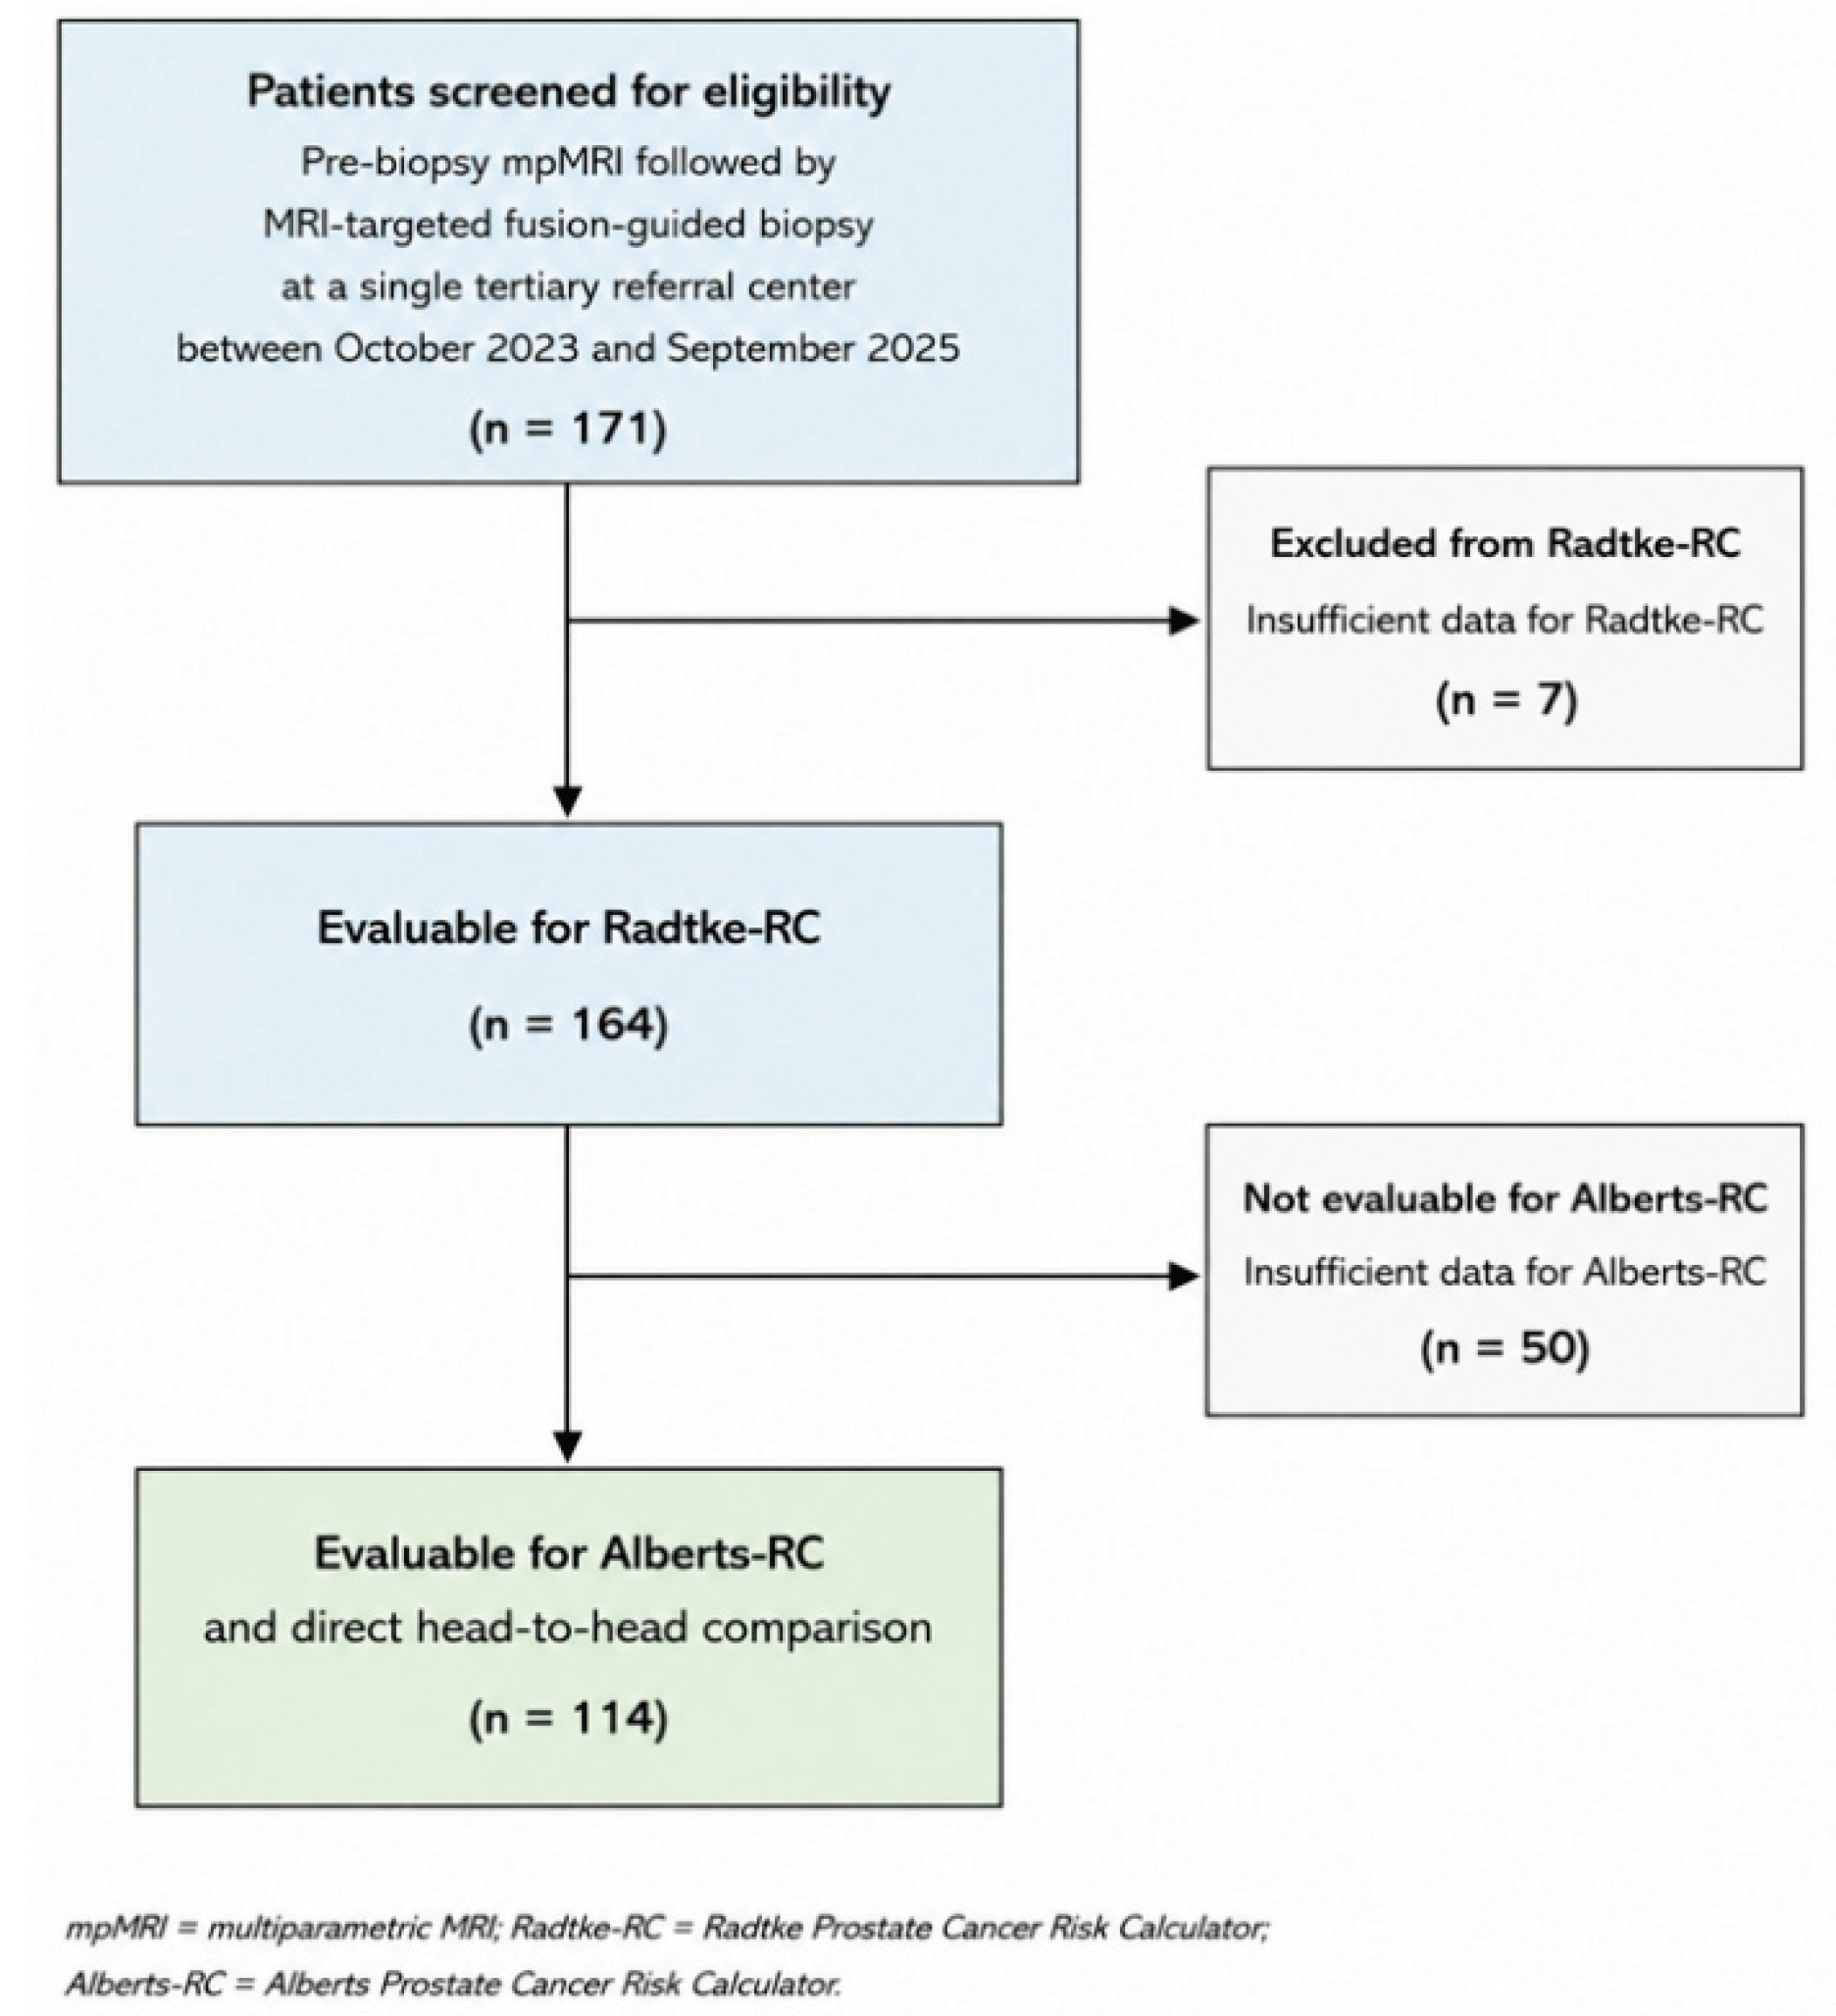
A total of 171 patients were screened for eligibility. Of these, 164 patients had sufficient data for external validation of the Radtke-RC and constituted the Radtke-RC validation cohort. Within this cohort, 114 patients additionally had complete predictor data required for validation of the Alberts-RC and therefore constituted the Alberts-RC validation cohort. Thus, 7 of 171 patients were not evaluable for the Radtke-RC. For the Alberts-RC, an additional 50 patients lacked the required predictor data, resulting in a total of 57 patients who were not evaluable and 114 patients who were included in the Alberts-RC validation. The 114 patients with complete data for both models also constituted the cohort used for direct head-to-head comparison. Baseline characteristics according to model availability are presented in Table 1.
Figure 1.
Flowchart of patient selection and formation of the model-specific analysis cohorts: Of 171 patients screened for eligibility, 164 had sufficient data for validation of the Radtke-RC. Among these, 114 patients had complete predictor data required for validation of the Alberts-RC and constituted the complete-case cohort used for direct head-to-head comparison of both models. Abbreviations: RC, risk calculator.
Figure 1.
Flowchart of patient selection and formation of the model-specific analysis cohorts: Of 171 patients screened for eligibility, 164 had sufficient data for validation of the Radtke-RC. Among these, 114 patients had complete predictor data required for validation of the Alberts-RC and constituted the complete-case cohort used for direct head-to-head comparison of both models. Abbreviations: RC, risk calculator.
Clinically significant prostate cancer (csPCa) was detected in 62 of 164 patients (37.8%) evaluable for the Radtke-RC and in 41 of 114 patients (36.0%) evaluable for the Alberts-RC. Among patients evaluable for the Radtke-RC, csPCa detection rates were 23.5% (4/17) for PI-RADS 3, 29.0% (27/93) for PI-RADS 4, and 59.6% (31/52) for PI-RADS 5. Corresponding rates among patients evaluable for the Alberts-RC were 28.6% (4/14), 25.4% (17/67), and 62.5% (20/32), respectively.
Among the 62 patients diagnosed with csPCa, biopsy-specific detection could be evaluated in 57 (91.9%). Of these, csPCa was detected by both MRI-targeted and systematic biopsy in 37 patients (64.9%), exclusively by MRI-targeted biopsy in 10 patients (17.5%), and exclusively by systematic biopsy in 10 patients (17.5%). In the remaining five patients, biopsy-specific detection could not be reliably determined.
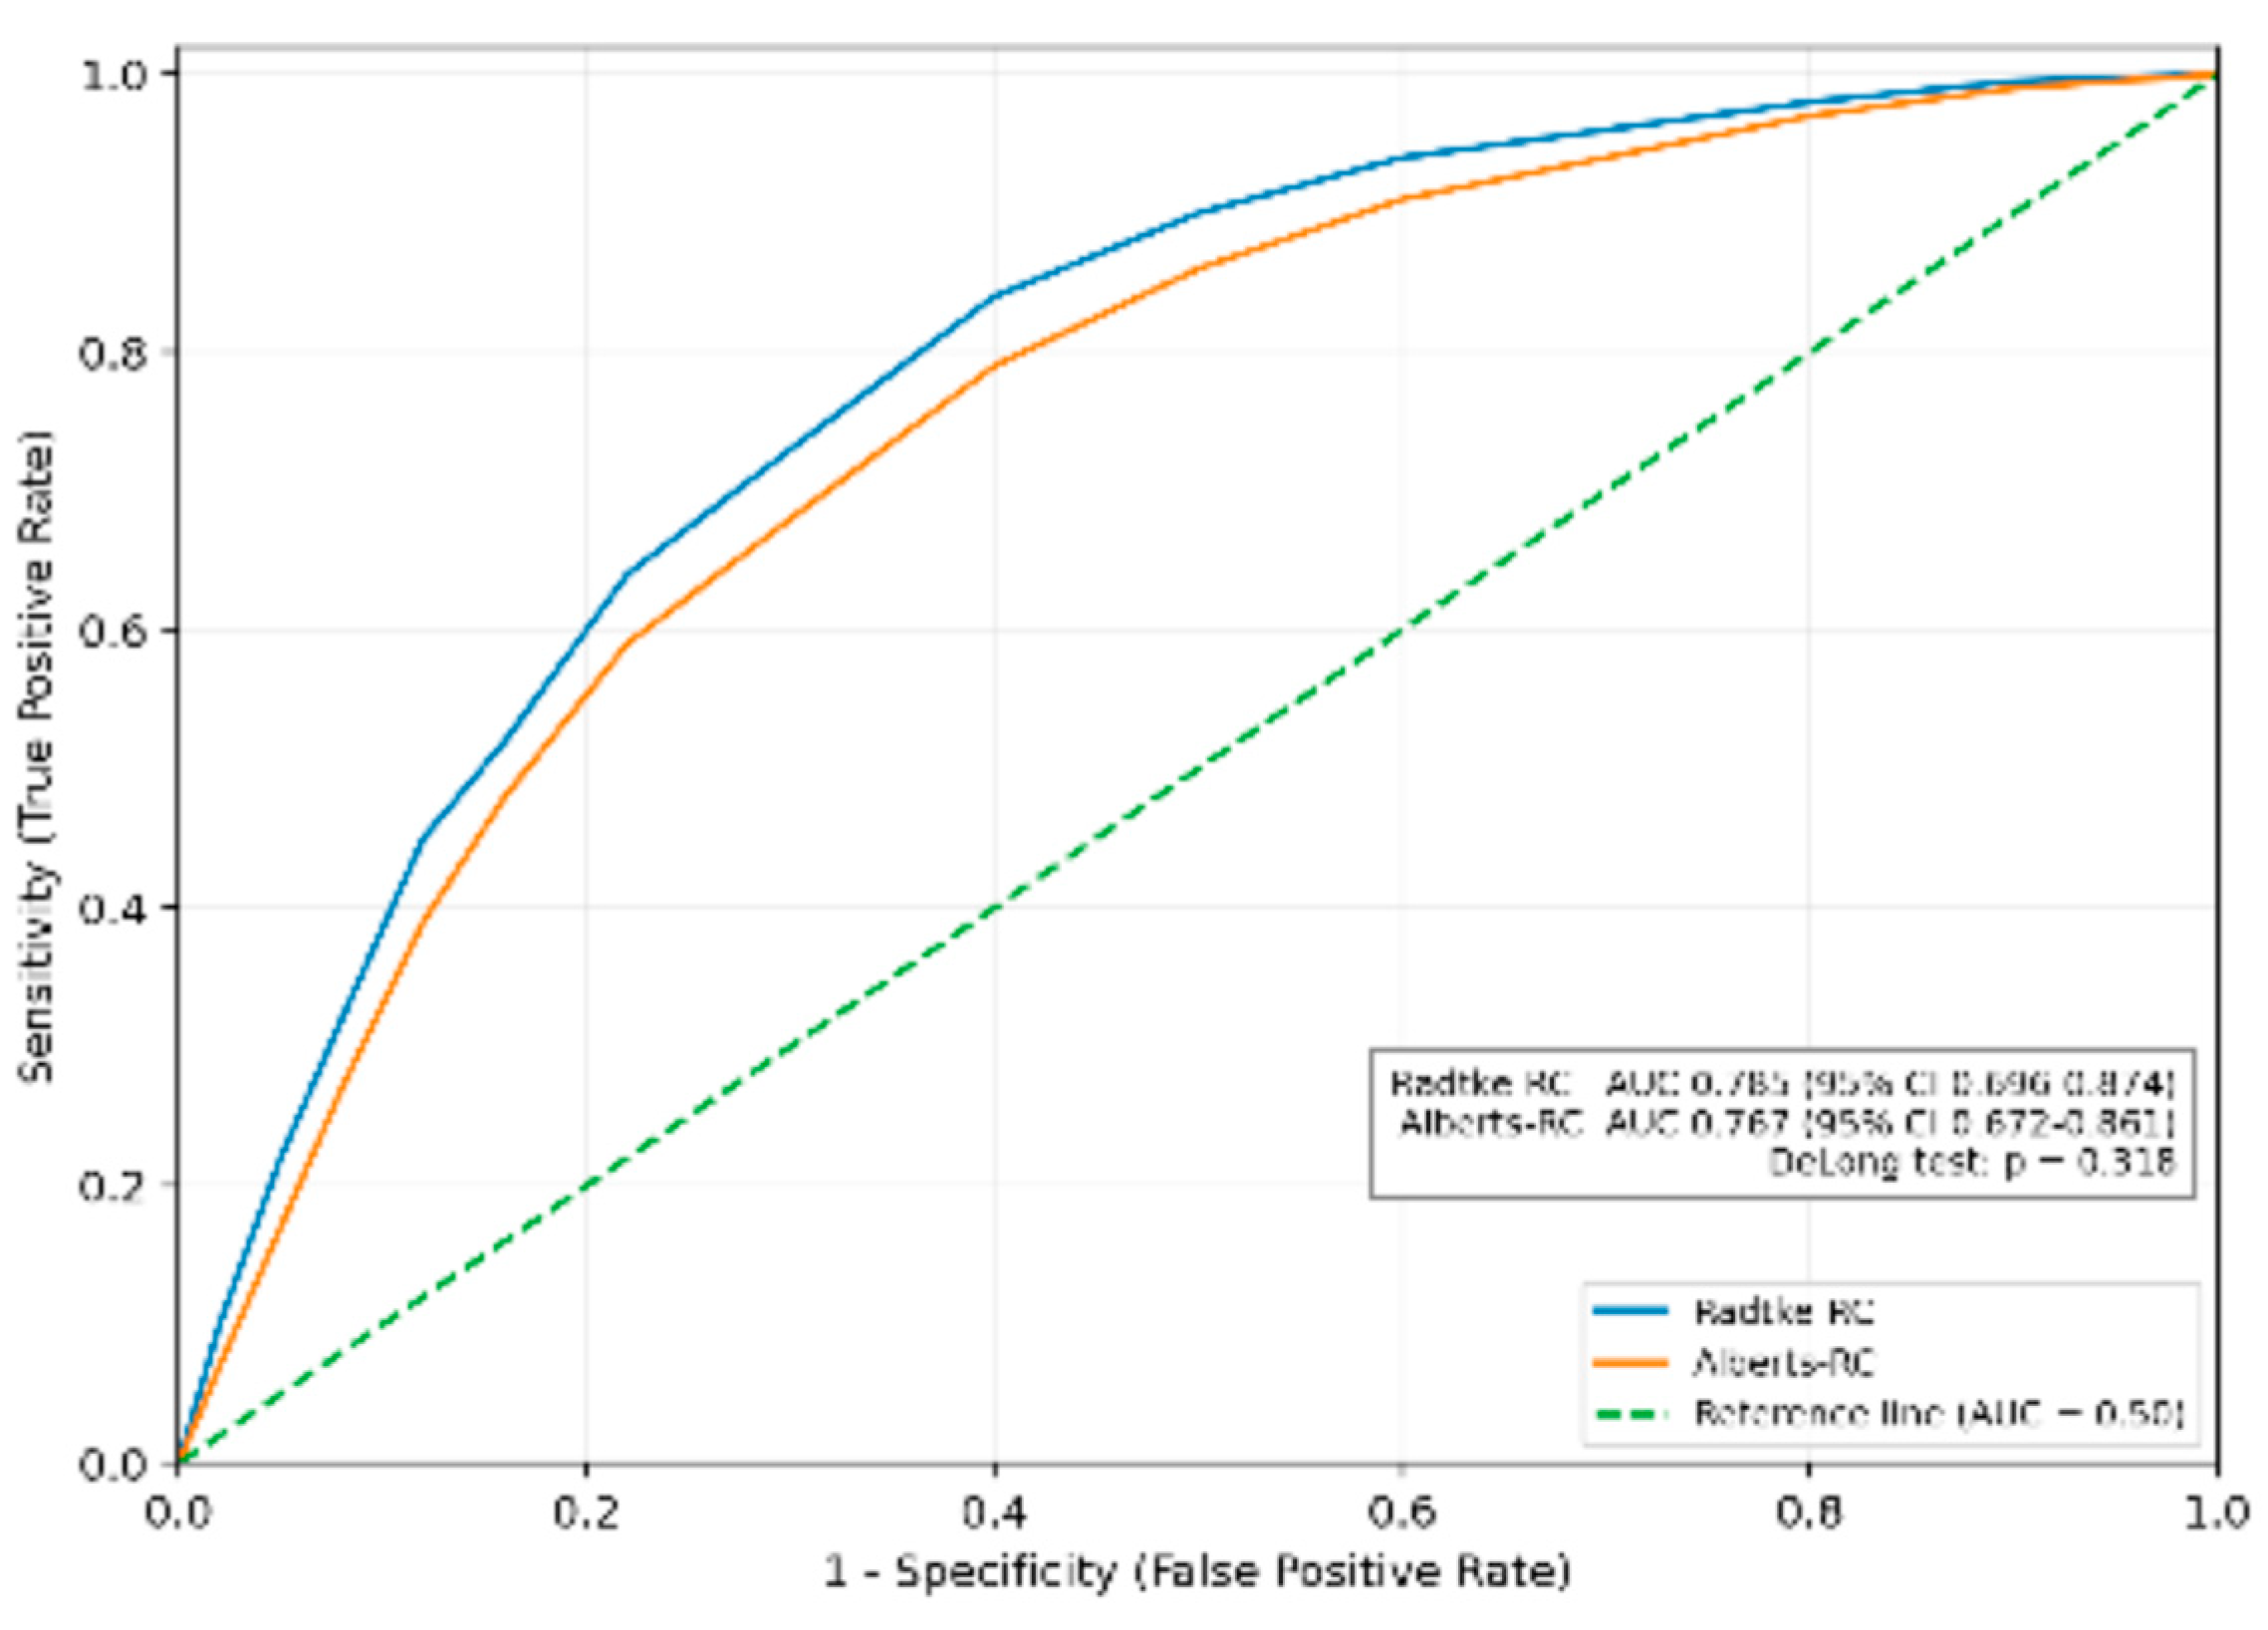
In the full Radtke-RC validation cohort (n = 164), the Radtke-RC achieved an AUC of 0.777 (95% CI 0.702–0.852). In the complete-case cohort used for direct head-to-head comparison (n = 114), the Radtke-RC achieved an AUC of 0.785 (95% CI 0.696–0.874), compared with 0.767 (95% CI 0.672–0.861) for the Alberts-RC. Direct comparison using DeLong’s test demonstrated no statistically significant difference in discriminative performance between the two models (p = 0.318).
Figure 2.
Receiver operating characteristic curves for the head-to-head comparison of the Radtke-RC and Alberts-RC for prediction of clinically significant prostate cancer: Both curves are based on the complete-case cohort (n = 114). The Radtke-RC achieved an AUC of 0.785 (95% CI 0.696–0.874) and the Alberts-RC an AUC of 0.767 (95% CI 0.672–0.861). The models were compared using the paired DeLong test (p = 0.318). The diagonal reference line represents no discriminative ability (AUC = 0.50). Abbreviations: ROC, receiver operating characteristic; AUC, area under the curve; CI, confidence interval; csPCa, clinically significant prostate cancer; RC, risk calculator.
Figure 2.
Receiver operating characteristic curves for the head-to-head comparison of the Radtke-RC and Alberts-RC for prediction of clinically significant prostate cancer: Both curves are based on the complete-case cohort (n = 114). The Radtke-RC achieved an AUC of 0.785 (95% CI 0.696–0.874) and the Alberts-RC an AUC of 0.767 (95% CI 0.672–0.861). The models were compared using the paired DeLong test (p = 0.318). The diagonal reference line represents no discriminative ability (AUC = 0.50). Abbreviations: ROC, receiver operating characteristic; AUC, area under the curve; CI, confidence interval; csPCa, clinically significant prostate cancer; RC, risk calculator.
Decision curve analysis demonstrated threshold-dependent clinical utility for both MRI-integrated risk calculators. The Radtke-RC provided greater net benefit than the biopsy-all strategy from a threshold probability of approximately 9% and remained superior up to approximately 69%, whereas the Alberts-RC exceeded biopsy-all from approximately 18% to 56%.
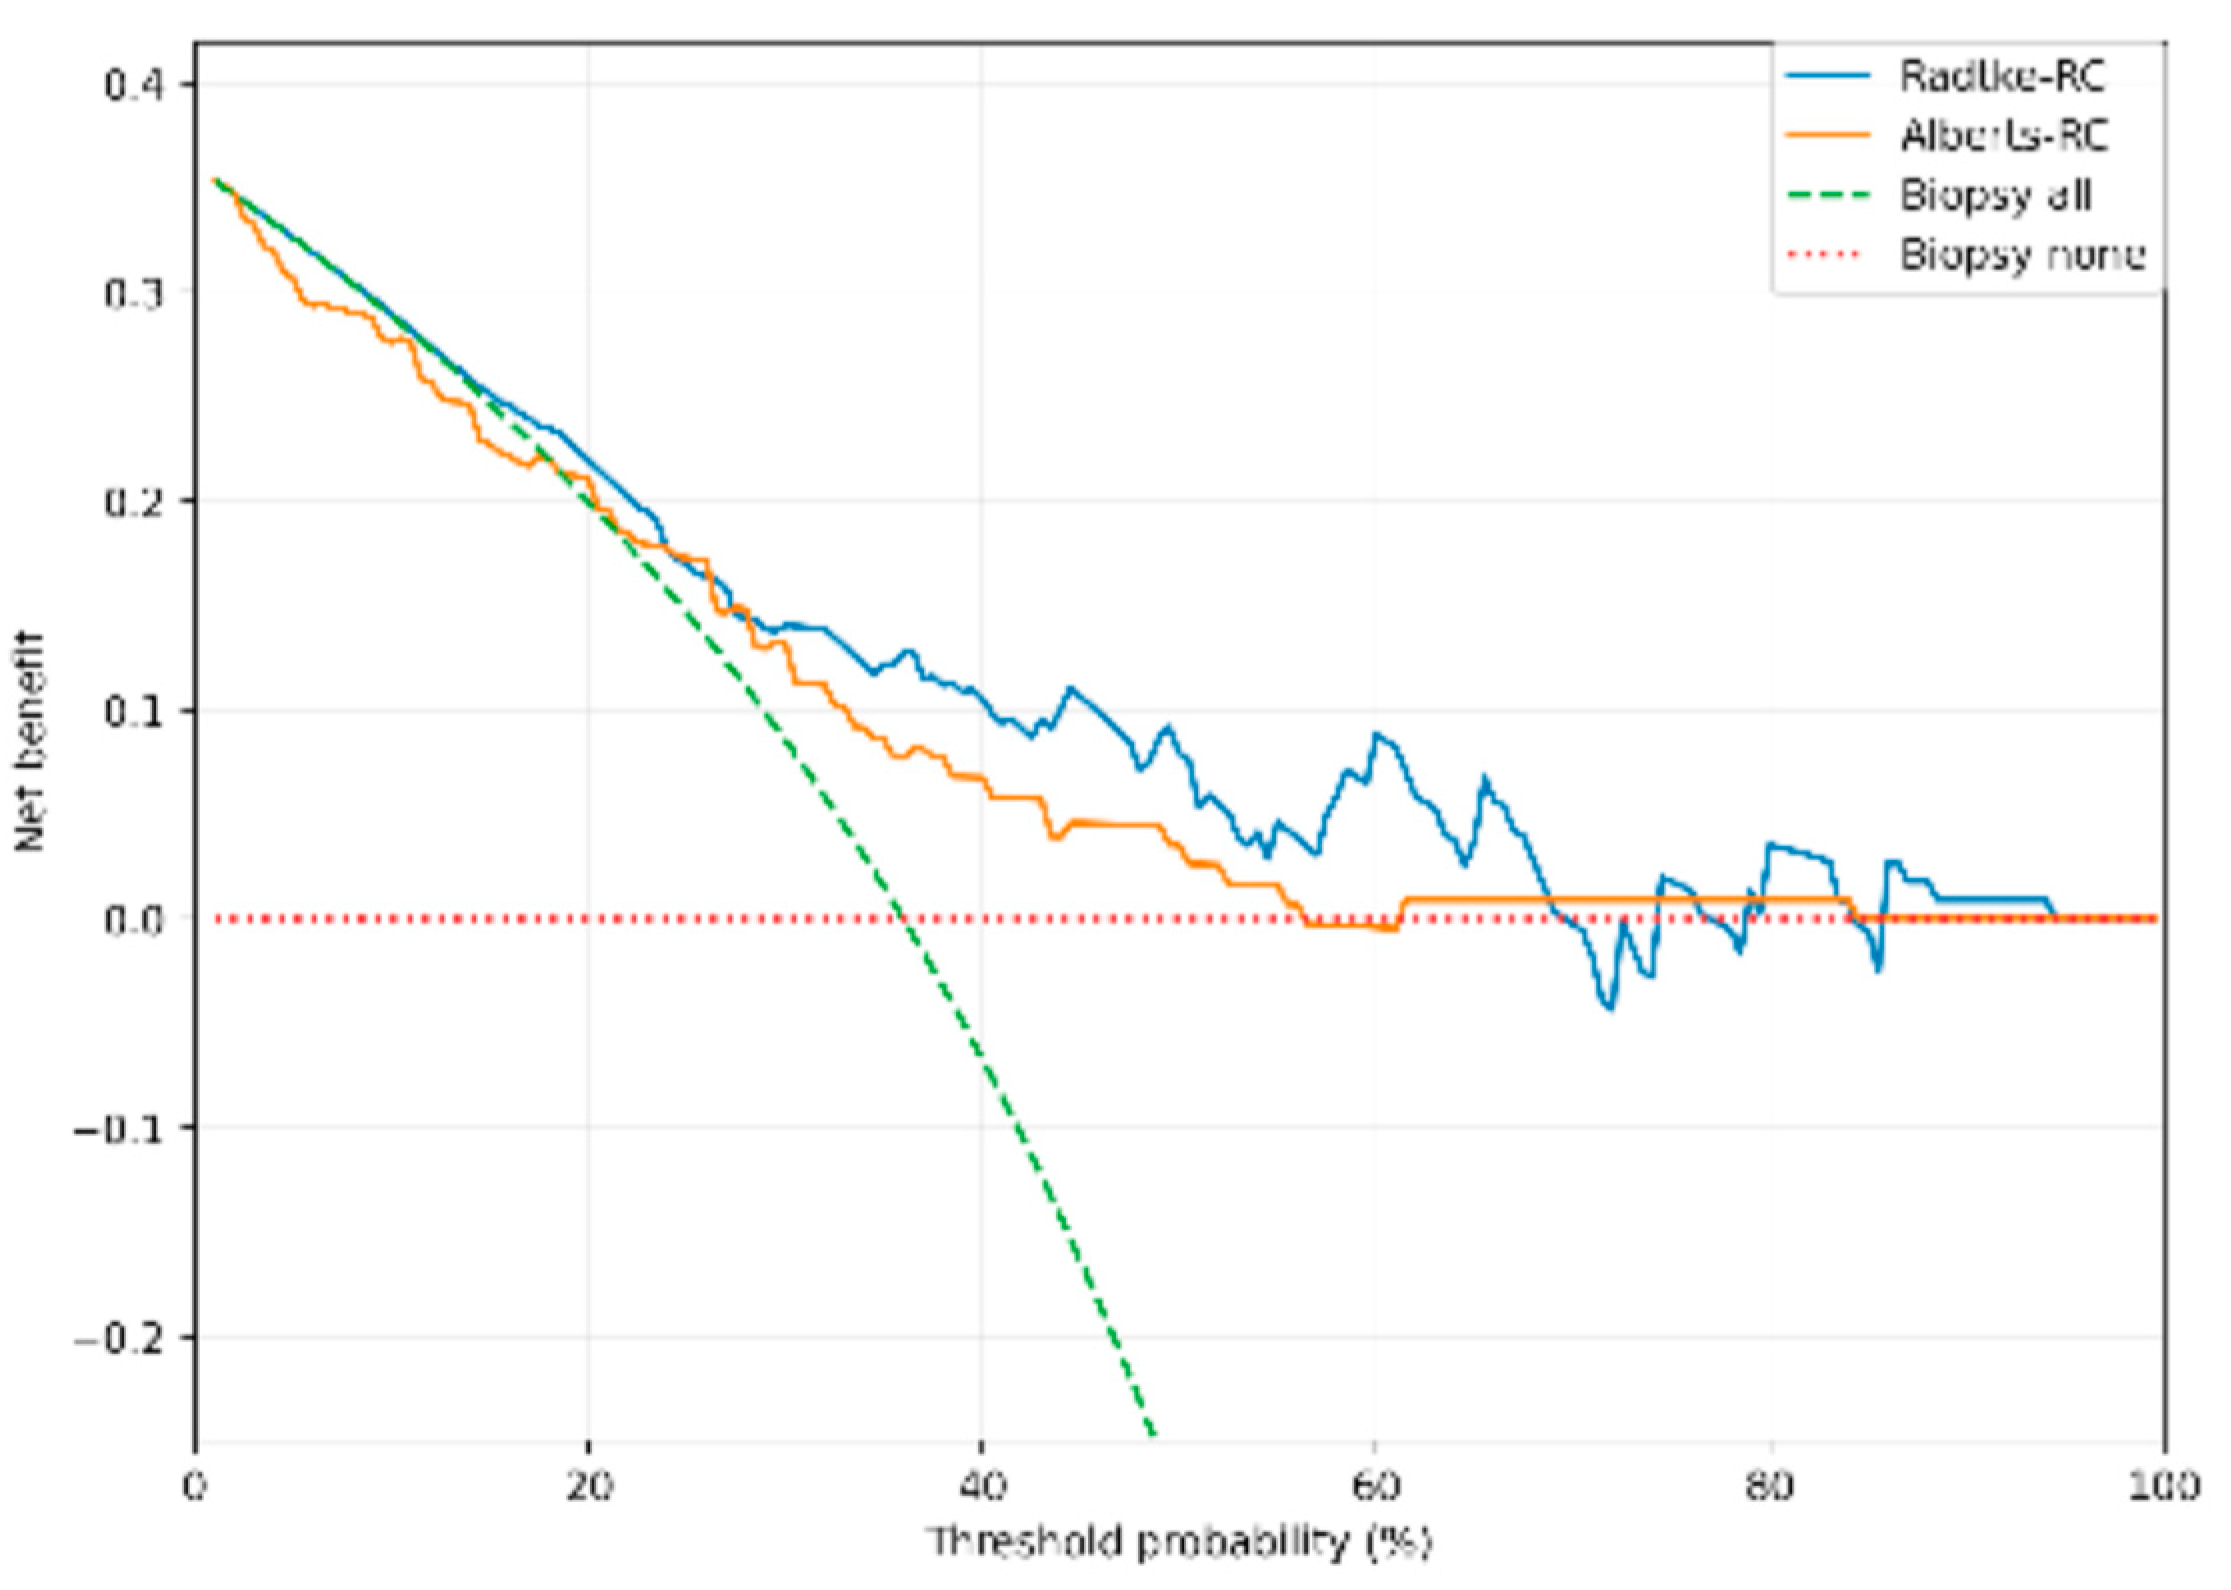
At a risk threshold of 12%, corresponding to weighting the consequences of missing csPCa approximately 8 times more strongly than those of performing an unnecessary biopsy, the net benefit of the Radtke-RC was 0.274 compared with 0.272 for biopsy-all. This absolute net-benefit gain of 0.0012 was equivalent to approximately 0.12 additional net true-positive outcomes per 100 patients, or approximately 836 patients needing to be assessed to obtain one additional net true-positive equivalent. The corresponding net reduction was 0.9 unnecessary biopsies per 100 patients, equivalent to approximately 114 patients needing to be assessed to avoid one unnecessary biopsy. At the same threshold, the Alberts-RC had a lower net benefit than biopsy-all (0.256 vs. 0.272) and therefore provided no clinical benefit over the biopsy-all strategy.
At a threshold probability of 20%, where the consequences of missing csPCa are weighted four times more strongly than those of an unnecessary biopsy, both calculators provided greater net benefit than biopsy-all. Net benefit was 0.219 for the Radtke-RC and 0.211 for the Alberts-RC, compared with 0.200 for biopsy-all. These differences corresponded to approximately 2.0 and 1.1 additional net true-positive equivalents per 100 patients, respectively, or approximately 51 and 91 patients needing to be assessed to obtain one additional net true-positive equivalent. The corresponding net reductions were 7.9 and 4.4 unnecessary biopsies per 100 patients, translating into approximately 13 and 23 patients, respectively, needing to be assessed to avoid one unnecessary biopsy.
At a threshold probability of 30%, corresponding to weighting the consequences of missing csPCa approximately 2 times more strongly than those of an unnecessary biopsy, the net benefit was 0.140 for the Radtke-RC and 0.132 for the Alberts-RC, compared with 0.085 for biopsy-all. This represented approximately 5.5 and 4.6 additional net true-positive equivalents per 100 patients, respectively, corresponding to approximately 18 and 22 patients needing to be assessed to obtain one additional net true-positive equivalent. The respective net reductions were 12.9 and 10.8 unnecessary biopsies per 100 patients, equivalent to approximately 8 and 9 patients needing to be assessed to avoid one unnecessary biopsy.
Overall, clinical utility was strongly dependent on the selected threshold probability. At the lower threshold of 12%, additional benefit over biopsy-all was minimal for the Radtke-RC and absent for the Alberts-RC. At thresholds of 20% and 30%, both calculators provided greater net benefit than biopsy-all, with clinically more tangible gains in terms of avoiding unnecessary biopsies. The Radtke-RC showed numerically greater net benefit than the Alberts-RC at both representative thresholds.
Figure 3.
Decision curve analysis of net benefit: Curves are based on the complete-case cohort (n = 114) and compare the Radtke-RC and Alberts-RC with the default strategies of biopsying all patients and performing no biopsy. Threshold probabilities are displayed across the full 0–100% axis; decision-curve quantities were calculated from 1% to 99%, as the weighting term pₜ/(1−pₜ) is undefined at 100%. Abbreviations: RC, risk calculator; csPCa, clinically significant prostate cancer.
Figure 3.
Decision curve analysis of net benefit: Curves are based on the complete-case cohort (n = 114) and compare the Radtke-RC and Alberts-RC with the default strategies of biopsying all patients and performing no biopsy. Threshold probabilities are displayed across the full 0–100% axis; decision-curve quantities were calculated from 1% to 99%, as the weighting term pₜ/(1−pₜ) is undefined at 100%. Abbreviations: RC, risk calculator; csPCa, clinically significant prostate cancer.
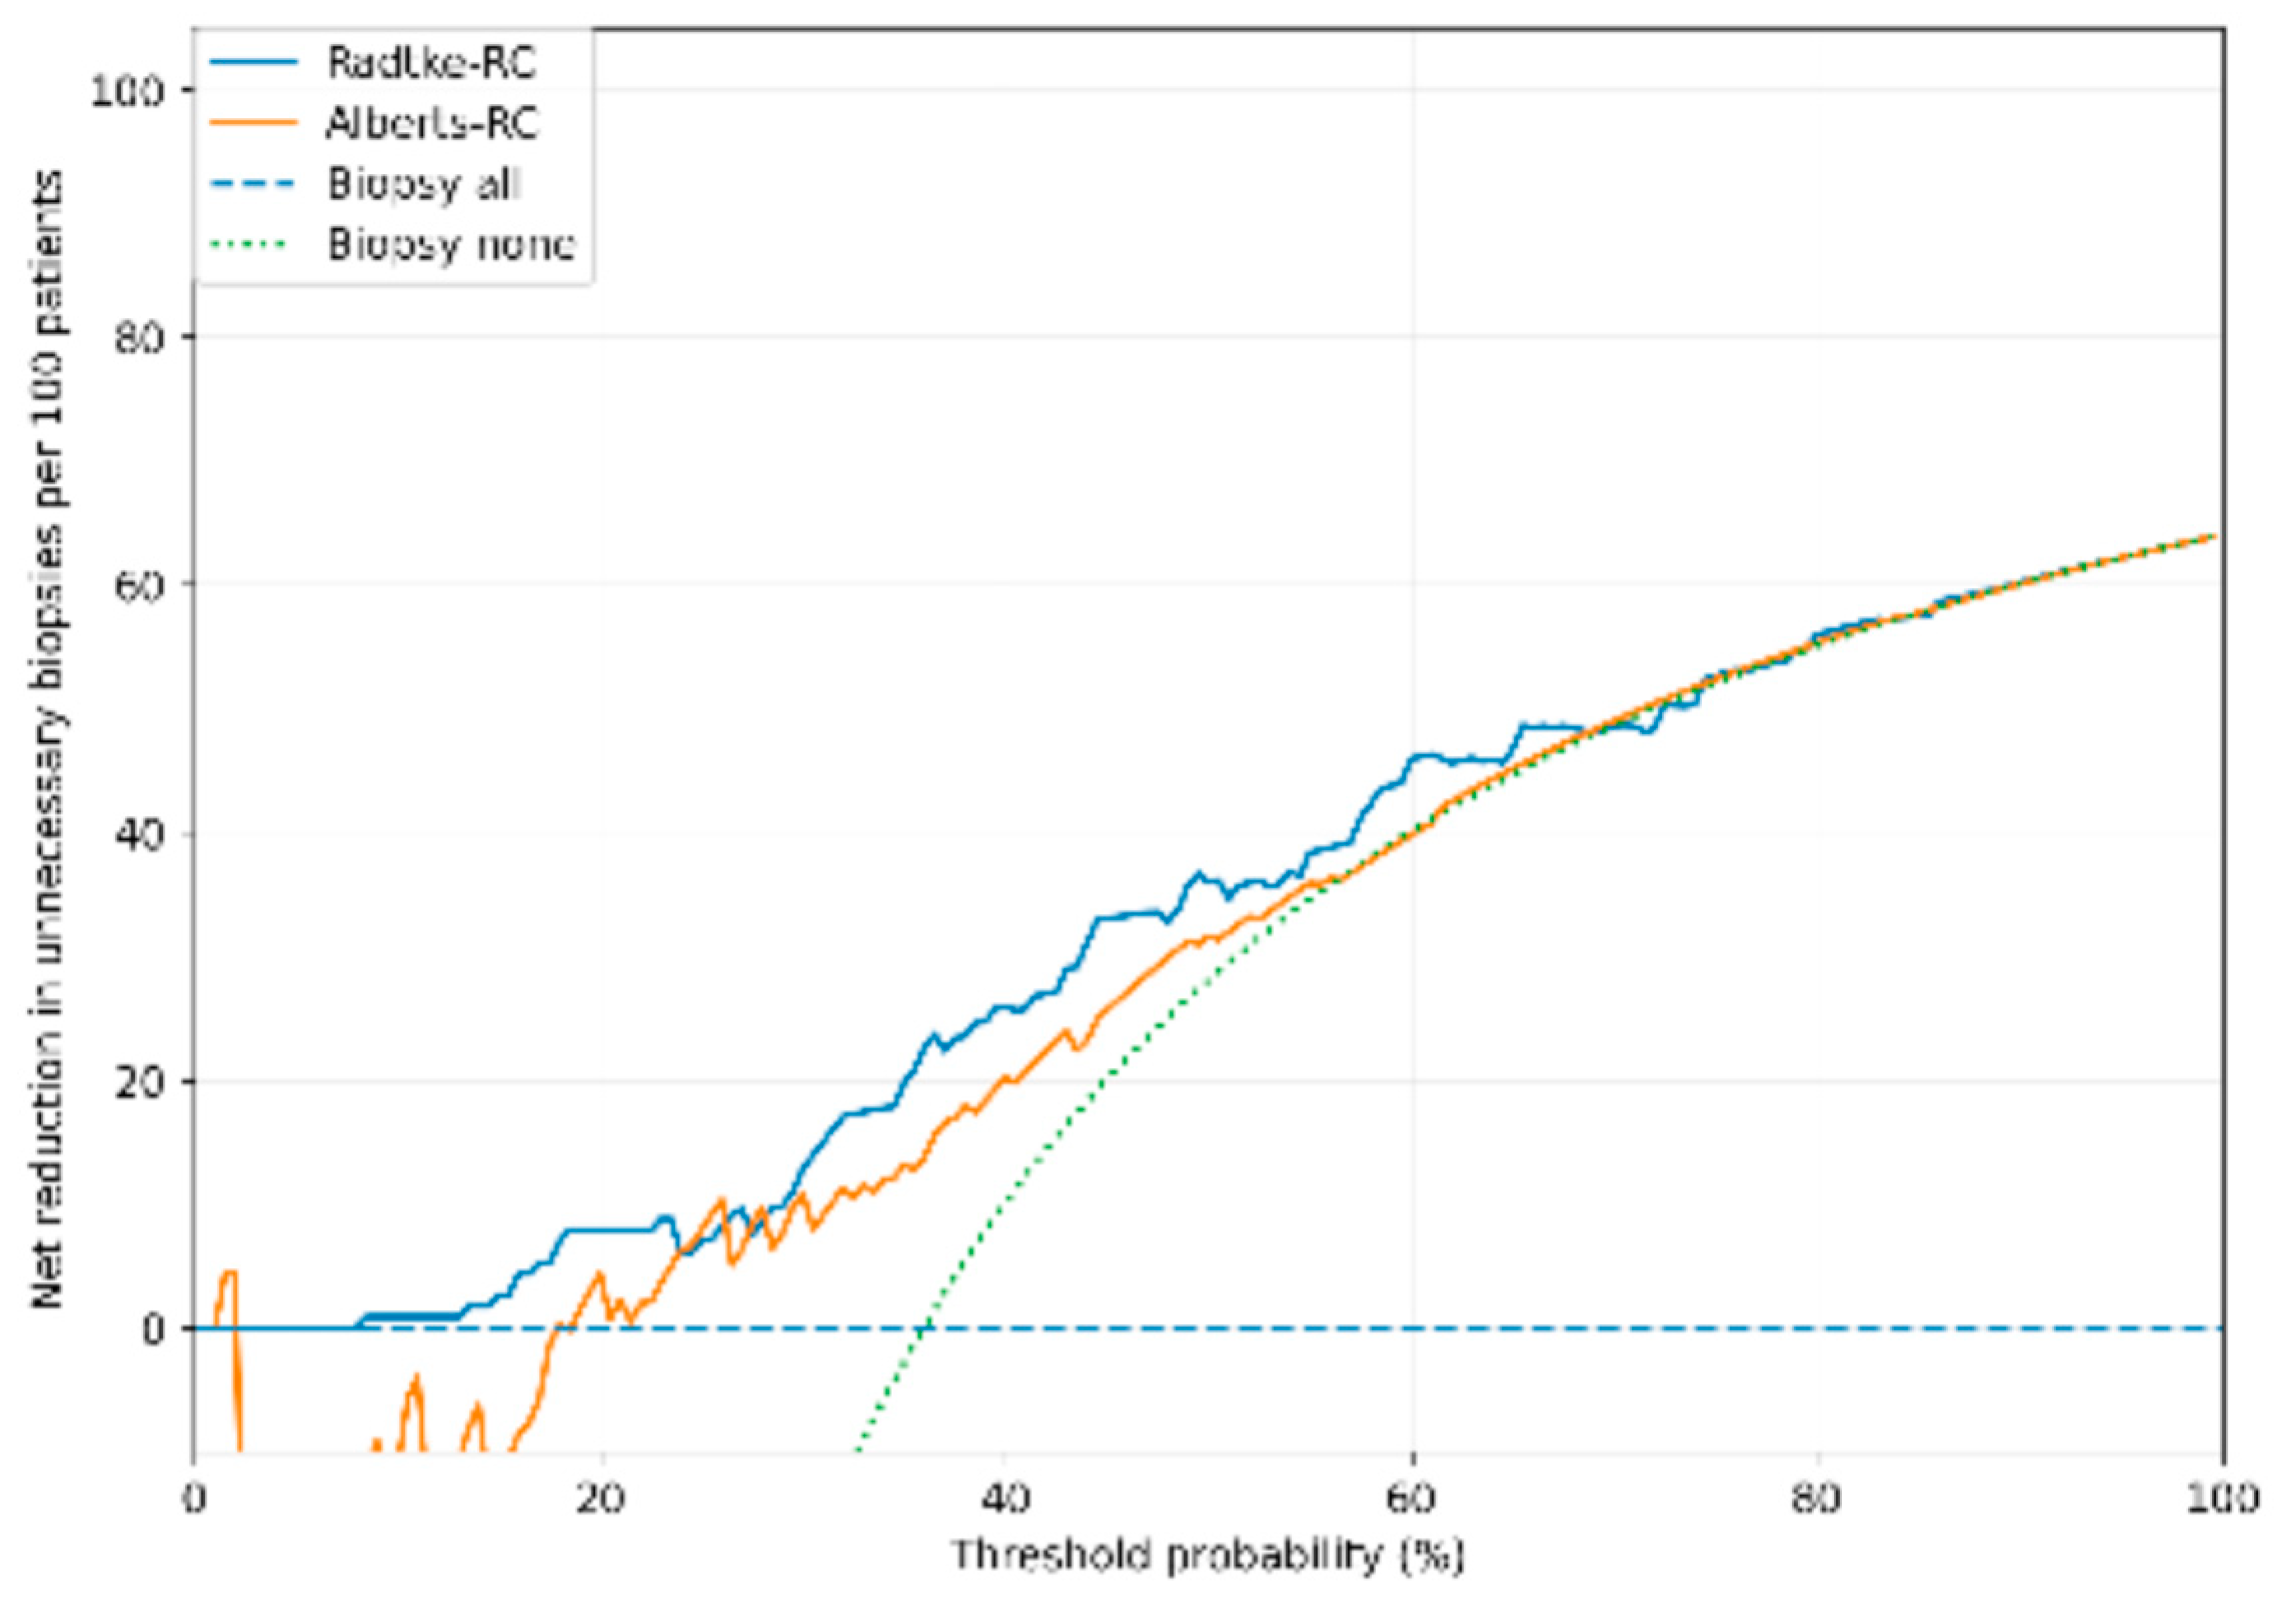
Figure 4.
Decision curve analysis of net reduction in unnecessary biopsies: Net reduction is shown relative to the biopsy-all strategy and is expressed as the number of unnecessary biopsies avoided per 100 patients based on the corresponding difference in net benefit. The biopsy-all strategy has a net reduction of zero by definition; the biopsy-none strategy is additionally shown. Both model curves are based on the complete-case cohort (n = 114). Threshold probabilities are displayed across the full 0–100% axis; calculations were performed from 1% to 99%, as the decision-curve weighting term is undefined at 100%. Abbreviations: RC, risk calculator; csPCa, clinically significant prostate cancer.
Figure 4.
Decision curve analysis of net reduction in unnecessary biopsies: Net reduction is shown relative to the biopsy-all strategy and is expressed as the number of unnecessary biopsies avoided per 100 patients based on the corresponding difference in net benefit. The biopsy-all strategy has a net reduction of zero by definition; the biopsy-none strategy is additionally shown. Both model curves are based on the complete-case cohort (n = 114). Threshold probabilities are displayed across the full 0–100% axis; calculations were performed from 1% to 99%, as the decision-curve weighting term is undefined at 100%. Abbreviations: RC, risk calculator; csPCa, clinically significant prostate cancer.
4. Discussion
The present study externally validated two established MRI-integrated prostate cancer risk calculators in a contemporary cohort of patients undergoing pre-biopsy mpMRI and yielded three principal findings. First, both the Radtke and Alberts Prostate Cancer Risk Calculators demonstrated acceptable discriminative performance for predicting clinically significant prostate cancer (csPCa), with no statistically significant difference between the two models. According to the AUC classification applied by Blas et al., AUC values between 0.7 and <0.8 indicate acceptable discrimination; accordingly, the observed AUCs of 0.785 for the Radtke-RC and 0.767 for the Alberts-RC in the head-to-head cohort fall within this range. [20] Second, decision curve analysis demonstrated threshold-dependent clinical utility for both calculators, with both models providing greater net benefit than a biopsy-all strategy across substantial parts of the evaluated threshold range. Third, neither calculator consistently outperformed the other in terms of clinical utility, emphasizing the importance of the selected decision threshold when applying these models in clinical practice. [18]
The discriminative performance observed in the present study is consistent with the original development studies of both MRI-integrated risk calculators. [10,11] Radtke et al. demonstrated that combining PI-RADS assessment with established clinical variables improved prediction of csPCa compared with clinical parameters alone, whereas Alberts et al. reported similar improvements following integration of mpMRI into the Rotterdam ERSPC risk model. [10,11] Subsequent external validation studies evaluated these prediction models across different patient populations and biopsy strategies. [12,13,14] Our findings therefore further support the generalizability of both MRI-integrated risk calculators in contemporary clinical practice. [10,11,12,13,14,15]
An important characteristic of the present study is its selected pre-biopsy mpMRI population. All patients underwent pre-biopsy mpMRI followed by combined MRI-targeted and systematic fusion-guided prostate biopsy, reflecting an MRI-based diagnostic pathway in which biopsy decisions had already been influenced by MRI findings before application of the risk calculators. This preselection may have affected the additional clinical utility of MRI-integrated prediction models and should be considered when interpreting the threshold-dependent net benefit observed in the present study. [5,15]
Our findings should therefore be interpreted as complementary rather than contradictory to previous validation studies. [12,13,14,15] Of particular relevance, Pallauf et al. externally validated the same two MRI-integrated risk calculators in a cohort consisting exclusively of men with a previous negative systematic biopsy and similarly demonstrated that the clinical value of the calculators depended strongly on the selected risk threshold. [19] However, their cohort differed substantially from the present population with respect to previous biopsy status, PI-RADS distribution, and csPCa prevalence. [19] Whereas all patients in the Pallauf cohort had undergone a previous negative biopsy, our cohort predominantly comprised patients with suspicious MRI findings undergoing MRI-targeted biopsy. Such differences in case mix and disease prevalence are particularly relevant for external validation and may explain differences in both discrimination and decision-analytic performance across studies. [15,19]
These findings are supported by previous comparative studies demonstrating that several MRI-integrated risk calculators achieve similar discriminative performance when evaluated in contemporary MRI-based diagnostic pathways. [5,21] Furthermore, the recently published systematic review and meta-analysis by O’Toole et al. confirmed that MRI-based risk calculators consistently improve individualized prediction of csPCa compared with clinical models alone, although their clinical impact depends on patient selection and the diagnostic pathway in which they are applied. [15] Our findings support this evidence by demonstrating that both calculators retained acceptable discriminative performance while their clinical utility varied according to the selected decision threshold.
From a clinical perspective, the present decision curve analysis illustrates why discrimination alone is insufficient to determine the usefulness of a prediction model. [18] The threshold probability incorporates the relative consequences assigned to missing csPCa and performing an unnecessary biopsy. Thus, at a threshold of 20%, missing one csPCa is weighted four times more strongly than performing an unnecessary biopsy, whereas at 30% this relative weighting decreases to approximately 2.3:1. At the lower threshold of 12%, where missing csPCa is weighted approximately 7.3 times more strongly, the incremental net benefit of the Radtke-RC over biopsy-all was marginal, while the Alberts-RC provided no incremental benefit. In contrast, at 20%, both models provided positive incremental net benefit and reduced unnecessary biopsies by 7.9 and 4.4 per 100 patients for the Radtke-RC and Alberts-RC, respectively. At 30%, these reductions increased to 12.9 and 10.8 per 100 patients. Accordingly, approximately 13 and 23 patients would need to be assessed at the 20% threshold, and approximately 8 and 9 patients at the 30% threshold, to avoid one unnecessary biopsy using the Radtke-RC and Alberts-RC, respectively.
These results highlight the central trade-off underlying application of the calculators. At low threshold probabilities, where avoiding missed csPCa is prioritized strongly, a biopsy-all strategy is difficult to improve upon because nearly all patients are considered candidates for biopsy. As the threshold increases and greater relative importance is assigned to avoiding unnecessary biopsy, the risk calculators provide progressively more opportunity for risk stratification. This pattern is conceptually consistent with the findings of Pallauf et al., who likewise observed limited additional true-positive benefit at low thresholds but substantially greater potential for identifying patients in whom biopsy might be avoided. [19] Importantly, however, higher thresholds necessarily imply a greater willingness to accept missed csPCa. The increasing reduction in unnecessary biopsies should therefore not be interpreted as evidence that higher thresholds are inherently preferable, but rather as illustrating the trade-off between cancer detection and biopsy avoidance captured by decision curve analysis. [18,19]
Taken together, these findings suggest that the principal clinical contribution of MRI-integrated risk calculators in an already MRI-selected biopsy population may not be a substantial increase in csPCa detection, but rather improved identification of patients in whom biopsy could reasonably be reconsidered. The choice of threshold may consequently be at least as important as the choice between the two calculators themselves. Because neither model consistently dominated the other across the evaluated threshold range, our findings do not support a universally preferable calculator or a single optimal biopsy threshold. Instead, threshold selection should reflect the clinical context and the relative importance assigned by patients and clinicians to avoiding unnecessary biopsy versus minimizing the risk of missed csPCa. [18] MRI-integrated risk calculators should therefore be regarded as complementary decision-support tools for individualized and shared biopsy decision-making rather than as stand-alone determinants of biopsy indication. [15,18]
Several limitations should be acknowledged. First, this was a retrospective single-centre study, which may limit the generalizability of the findings. Second, the relatively small sample size, particularly within the complete-case cohort used for direct comparison of both models, may have limited statistical power to detect small differences between the prediction models. Third, no centralized re-review of MRI examinations was performed. Finally, the study included a highly selected population of patients who underwent pre-biopsy mpMRI followed by prostate biopsy. This selection limits the generalizability of our findings to unselected screening or pre-MRI populations and may have influenced both model performance and estimates of clinical utility. [5,15]
5. Conclusions
Both the Radtke and Alberts MRI-integrated risk calculators demonstrated acceptable and comparable discrimination for csPCa, with neither model showing a clear overall advantage. Clinical utility was strongly threshold-dependent, with limited incremental benefit over biopsy-all at low thresholds but increasing potential to reduce unnecessary biopsies at higher thresholds. These findings suggest that the principal value of MRI-integrated risk calculators in an already MRI-selected population lies in supporting individualized biopsy decisions. Threshold selection should therefore reflect the clinical trade-off between avoiding unnecessary biopsy and minimizing missed csPCa. Further prospective multicentre validation is warranted to define clinically appropriate thresholds.
Author Contributions
Hubert Grießner: Conceptualization, Methodology, Data curation, Formal analysis, Writing, review & editing; Sarah Luck: Data curation, Investigation, Writing; Julia K. Peters: Review & editing; Kathrin Olesch: Review & editing; Manuel Schlachter: Review & editing; Lukas Oberhammer: Formal analysis, Methodology, review & editing; Maximilian Pallauf: Methodology, Supervision, review & editing; Lukas Lusuardi: Conceptualization, Supervision, Project administration; Philipp N. Haid: Conceptualization, Data curation, Formal analysis, Investigation, Visualization, Writing. All authors read and approved the final manuscript.
Funding
This research received no external funding.
Institutional Review Board Statement
This retrospective single-centre study was conducted at the Department of Urology, Paracelsus Medical University Salzburg, Austria. The study was approved by the Ethics Committee of the Federal State of Salzburg (approval number 1081/2025, date of approval 27 March 2026) and was conducted in accordance with the Declaration of Helsinki.
Informed Consent Statement
Patient consent was waived due to the retrospective nature of the study and the use of pseudonymized data. No additional examinations, interventions, or study-specific procedures were performed for the purpose of this study.
Consent for Publication
Not applicable, as no identifiable patient information is included in the manuscript.
Data Availability Statement
The datasets generated during the current study are available from the corresponding author on reasonable request.
Acknowledgments
During the preparation of this manuscript, artificial intelligence was used to assist with language editing and optimization of R code for statistical analyses. All statistical analyses were performed, verified, and interpreted by the authors. The authors critically reviewed all AI-generated content and take full responsibility for the final manuscript.
Conflicts of Interest
The authors declare no competing interests.
Abbreviations
AUC — Area under the receiver operating characteristic curve
CI — Confidence interval
csPCa — Clinically significant prostate cancer
DCA — Decision curve analysis
DRE — Digital rectal examination
ERSPC — European Randomized Study of Screening for Prostate Cancer
ISUP — International Society of Urological Pathology
mpMRI — Multiparametric magnetic resonance imaging
MRI — Magnetic resonance imaging
NNA — Number needed to assess
PCa — Prostate cancer
PCPT — Prostate Cancer Prevention Trial
PI-RADS — Prostate Imaging Reporting and Data System
PSA — Prostate-specific antigen
RC — Risk calculator
ROC — Receiver operating characteristic
SD — Standard deviation
SWOP — Stichting Wetenschappelijk Onderzoek Prostaatkanker
Alberts-RC — Alberts Prostate Cancer Risk Calculator
Radtke-RC — Radtke Prostate Cancer Risk Calculator
References
- Bray, F.; Laversanne, M.; Sung, H.; et al. Global cancer statistics 2022: GLOBOCAN estimates of incidence and mortality worldwide for 36 cancers in 185 countries. CA Cancer J. Clin. 2024, 74(3), 229–263. [Google Scholar] [CrossRef]
- Loeb, S.; Bjurlin, M.A.; Nicholson, J.; et al. Overdiagnosis and overtreatment of prostate cancer. Eur. Urol. 2014, 65(6), 1046–1055. [Google Scholar] [CrossRef]
- Drost, F.H.; Osses, D.F.; Nieboer, D.; et al. Prostate MRI, with or without MRI-targeted biopsy, and systematic biopsy for detecting prostate cancer. Cochrane Database Syst. Rev. 2019, 4. [Google Scholar] [CrossRef]
- Turkbey, B.; Rosenkrantz, A.B.; Haider, M.A.; et al. Prostate Imaging Reporting and Data System Version 2.1: 2019 update of Prostate Imaging Reporting and Data System Version 2. Eur. Urol. 2019, 76(3), 340–351. [Google Scholar] [CrossRef]
- Deniffel, D.; Healy, G.M.; Dong, X.; et al. Avoiding unnecessary biopsy: MRI-based risk models versus a PI-RADS and PSA density strategy for clinically significant prostate cancer. Radiology 2021, 300(2), 369–379. [Google Scholar] [CrossRef]
- Thompson, I.M.; Ankerst, D.P.; Chi, C.; et al. Assessing prostate cancer risk: results from the Prostate Cancer Prevention Trial. J. Natl. Cancer Inst. 2006, 98(8), 529–534. [Google Scholar] [CrossRef]
- Roobol, M.J.; Steyerberg, E.W.; Kranse, R.; et al. A risk-based strategy improves prostate-specific antigen-driven detection of prostate cancer. Eur. Urol. 2010, 57(1), 79–85. [Google Scholar] [CrossRef]
- Trottier, G.; Roobol, M.J.; Lawrentschuk, N.; et al. Comparison of risk calculators from the Prostate Cancer Prevention Trial and the European Randomized Study of Screening for Prostate Cancer in a contemporary Canadian cohort. BJU Int. 2011, 108 8 Pt 2, E237–E244. [Google Scholar] [CrossRef]
- Louie, K.S.; Seigneurin, A.; Cathcart, P.; Sasieni, P. Do prostate cancer risk models improve the predictive accuracy of PSA screening? A meta-analysis. Ann. Oncol. 2015, 26(5), 848–864. [Google Scholar] [CrossRef]
- Radtke, J.P.; Wiesenfarth, M.; Kesch, C.; et al. Combined clinical parameters and multiparametric magnetic resonance imaging for advanced risk modeling of prostate cancer: Patient-tailored risk stratification can reduce unnecessary biopsies. Eur. Urol. 2017, 72(6), 888–896. [Google Scholar] [CrossRef]
- Alberts, A.R.; Roobol, M.J.; Verbeek, J.F.M.; et al. Prediction of high-grade prostate cancer following multiparametric magnetic resonance imaging: Improving the Rotterdam European Randomized Study of Screening for Prostate Cancer risk calculators. Eur. Urol. 2019, 75(2), 310–318. [Google Scholar] [CrossRef]
- Liu, H.J.; Lavallée, A.; Yang, X.Y.; et al. External validation and comparison of magnetic resonance imaging-based predictive models for clinically significant prostate cancer. Urol. Oncol. 2021, 39(11), 830.e1–830.e10. [Google Scholar] [CrossRef]
- Saba, K.; Wettstein, M.S.; Lieger, L.; et al. External validation and comparison of prostate cancer risk calculators incorporating multiparametric magnetic resonance imaging for prediction of clinically significant prostate cancer. J. Urol. 2020, 203(4), 719–726. [Google Scholar] [CrossRef]
- Püllen, L.; Radtke, J.P.; Wiesenfarth, M.; et al. External validation of novel magnetic resonance imaging-based models for prostate cancer prediction. BJU Int. 2020, 125(3), 367–373. [Google Scholar] [CrossRef]
- O’Toole, C.; Boakye, N.F.; Hannigan, A.; Jalali, A. Clinical impact of MRI-based risk calculators for prostate cancer diagnosis: a systematic review and meta-analysis. Prostate Cancer Prostatic Dis. 2025. [Google Scholar] [CrossRef]
- van Leenders, G.J.L.H.; van der Kwast, T.H.; Grignon, D.J.; et al. The 2019 International Society of Urological Pathology (ISUP) Consensus Conference on Grading of Prostatic Carcinoma. Am. J. Surg. Pathol. 2020, 44(8), e87–e99. [Google Scholar] [CrossRef]
- DeLong, E.R.; DeLong, D.M.; Clarke-Pearson, D.L. Comparing the areas under two or more correlated receiver operating characteristic curves: a nonparametric approach. Biometrics 1988, 44(3), 837–845. [Google Scholar] [CrossRef]
- Vickers, A.J.; van Calster, B.; Steyerberg, E.W. A simple, step-by-step guide to interpreting decision curve analysis. Diagn. Progn. Res. 2019, 3, 18. [Google Scholar] [CrossRef]
- Pallauf, M.; Steinkohl, F.; Zimmermann, G.; et al. External validation of two mpMRI-risk calculators predicting risk of prostate cancer before biopsy. World J. Urol. 2022, 40(10), 2451–2457. [Google Scholar] [CrossRef]
- Blas, L.; Shiota, M.; Nagakawa, S.; et al. Validation of user-friendly models predicting extracapsular extension in prostate cancer patients. Asian J. Urol. 2023, 10(1), 81–88. [Google Scholar] [CrossRef]
- Doan, P.; Graham, P.; Lahoud, J.; et al. A comparison of prostate cancer prediction models in men undergoing both magnetic resonance imaging and transperineal biopsy: Are the models still relevant? BJU Int. 2021, 128 (Suppl 3), 36–44. [Google Scholar] [CrossRef]

Table 1.
Baseline characteristics of the study cohorts: Data are presented as mean ± standard deviation (SD) for continuous variables and as number (percentage) for categorical variables.
Table 1.
Baseline characteristics of the study cohorts: Data are presented as mean ± standard deviation (SD) for continuous variables and as number (percentage) for categorical variables.
 |
Abbreviations: PSA, prostate-specific antigen; DRE, digital rectal examination; PI-RADS, Prostate Imaging Reporting and Data System; csPCa, clinically significant prostate cancer; ISUP, International Society of Urological Pathology; RC, risk calculator.
Disclaimer/Publisher’s Note: The statements, opinions and data contained in all publications are solely those of the individual author(s) and contributor(s) and not of MDPI and/or the editor(s). MDPI and/or the editor(s) disclaim responsibility for any injury to people or property resulting from any ideas, methods, instructions or products referred to in the content. |
© 2026 by the authors. Licensee MDPI, Basel, Switzerland. This article is an open access article distributed under the terms and conditions of the Creative Commons Attribution (CC BY) license (http://creativecommons.org/licenses/by/4.0/).
Copyright: This open access article is published under a Creative Commons CC BY 4.0 license, which permit the free download, distribution, and reuse, provided that the author and preprint are cited in any reuse.