

Submitted:
14 September 2026
Posted:
15 September 2026
You are already at the latest version
Abstract
Winter’s lack of sunshine often leads to seasonal affective disorder, and insufficient morning light exposure can likewise provoke insomnia or even precipitate depression. To address these issues, light therapy has been introduced. However, certain light‐therapy protocols can cause ocular discomfort; in particular, overexposure to blue-rich white light is known to induce photoretinitis. Consequently, there is an urgent need for approaches that balance retinal safety with therapeutic efficacy. To date, no quantitative studies have tackled this dual requirement. Here, we propose a novel model that, under the constraint of retinal friendliness, maximizes the effectiveness of light therapy. Our model quantifies therapeutic efficacy via melatonin suppression sensitivity (MSS) and sets the retinal permissible exposure limit (MPE) as the upper bound on treatment duration. Under these parameters, a 6.5-hour light therapy session can achieve up to 79 % of the maximal effect, requiring an illuminance of 2,240 lx. Alternatively, a 1.5-hour targeted treatment using 1,000 lx of 620 nm orange light yields 59 % efficacy. Furthermore, continuous home illumination at 1,700 K for 6.5 hours produces 77 % of the maximal therapeutic effect.
Keywords:
OLED
; light therapy
; melatonin suppression
; retinal safety
; blue-light hazard
; seasonal affective disorder
1. Introduction
Long-term insufficient sunlight exposure can give rise to a variety of health and psychological problems. In high-latitude regions, the sun-deprived winter season often precipitates seasonal affective disorder (SAD) [1,2,3,4,5,6,7]. Moreover, inadequate morning light may disrupt circadian rhythms [8,9], thereby inducing insomnia symptoms [1,10,11] and even exacerbating the risk of depressive or mood-disorder episodes [12,13]. As a non-invasive intervention, light therapy has been shown to alleviate these conditions with minimal side effects, earning growing attention as a therapeutic modality [14,15,16,17,18,19,20,21,22].
However, most existing light-therapy devices rely on blue or white light enriched in blue wavelengths, which—when used at high intensity or for prolonged durations—can damage the eyes, causing discomfort and raising the risk of photoretinitis [23,24,25,26]. Studies have reported that patients undergoing light therapy for mood disorders frequently experience adverse effects such as headache, eye fatigue, irritability, and nausea [27,28,29,30,31]. Furthermore, blue light may harm retinal pigment epithelial cells [32,33] and increase the likelihood of retinal photochemical injury [34], potentially accelerating the progression of macular degeneration [35,36] and even contributing to serious vision conditions like cataracts with long-term exposure [37].
Terman et al. investigated the ocular safety of light-therapy sources and their associated risk factors [31], while Brouwer et al. reviewed past light-therapy studies and highlighted safety concerns for patients with preexisting eye diseases or heightened photosensitivity [38]. Yet, no quantitative research has addressed how to optimize light therapy for both retinal safety and clinical efficacy.
In response, this study proposes a theoretical calculation model for light therapy predicated on retinal friendliness. The model employs melatonin suppression sensitivity (MSS) as the metric for therapeutic efficacy [38] and uses the retinal permissible exposure limit (MPE) as the upper bound for treatment duration [39]. For each given light source, the model identifies the maximal achievable efficacy along with the corresponding exposure time and illuminance. According to our calculations, the optimal therapeutic wavelength is 589 nm yellow light: a 6.5-hour home treatment yields up to 79 % efficacy at 2,240 lx, whereas a 1.5-hour session reaches a maximum of 69 % efficacy at 9,700 lx.
Building on this theoretical framework, we developed a series of retina-friendly light-therapy components and compared their performance with that of commercially available fixtures. Under 1,000 lx exposure for 6.5 hours, our 620-nm orange-light module and a 1,700 K orange-LED both achieved 77 % and 81 % efficacy, respectively; for a 1.5-hour treatment, they delivered 59 % and 63 % efficacy.
2. Theory
2.1. Melatonin Suppression Sensitivity (MSS)
Melatonin suppression sensitivity of any given light source can be calculated by using the action spectrum of melatonin suppression per photon quanta, SPQ, which was first proposed by Jou’s group [39]. The resultant formula can be expressed as follows.
where SPQ (λ) is defined as the suppression power per quanta of a monochromatic light, λ, relative to that of the reference light, λr, and C is a fitting constant. The chosen reference light is 480 nm blue light in this study.
To make practically meaningful, the above formula is converted into lux, with a unit of lx, which is shown below.
where SL (λ) is the action spectrum of melatonin suppression sensitivity per lux, and V(λ) is the photopic luminosity function.
For polychromatic light sources, the correlated suppression power per lux, SLC(λ), can be expressed as follows.
where SI (λ) is measured spectrum of a given light source.
Figure 1 shows the melatonin-suppression action spectrum. It depicts, for all visible wavelengths, the relative efficacy of melatonin suppression per photon compared to that of 480 nm blue light. All original data were obtained from References [40,41,42].
From the per-photon perspective, the degree of suppression increases exponentially as wavelength decreases, indicating that high-energy, short-wavelength light exerts a stronger melatonin-suppressive effect. For example, the suppression efficacy of 400 nm violet light is approximately 850 times greater than that of 620 nm orange light, whereas 460 nm blue light exhibits a suppression efficacy roughly 135 times that of the same orange light.
Figure 2 shows the melatonin-suppression efficacy of various visible wavelengths at equal illuminance. The results indicate that, at the same photopic illuminance, 620 nm orange light exhibits the lowest melatonin-suppressive efficacy. For nighttime lighting, spectra that support melatonin secretion—such as around 620 nm—should be prioritized, whereas for phototherapy applications, wavelengths with higher melatonin-suppression efficacy should be used. For example, at identical illuminance, 460 nm deep-blue light suppresses melatonin with an efficacy approximately 900 times that of 620 nm orange light, while 760 nm deep-red light exhibits about 86 times the efficacy of the same orange light.
Our view is that an optimal phototherapy light source should primarily employ wavelengths between 460 and 620 nm, rather than those between 620 and 760 nm. This recommendation rests on two factors: first, the 460–620 nm range achieves far greater melatonin-suppression efficacy; second, it offers substantially higher luminous efficacy.
2.2. Maximum Permissible Retina Exposure Limit (MPE)
According to the International Commission on Non-Radiation Protection Council (ICNIRP), the maximum permissible retinal exposure limit (MPE) with a unit of second (s) can be calculated as follows [43]:
where EB is blue light weighted radiation, with a unit of Wm−2, and the value can be obtained by the following formula:
where Eλ represents the luminance (cd/m2); B(λ) represents the blue light hazard function (Wm−2sr−1); and λ represents the light wavelength (nm).
3. Theoretical Model
Pons et al. investigated whether ultraviolet radiation is absorbed by artificial intraocular lenses in cataract patients by exposing them to intense light sources. The retinal irradiance–hazard function, also called the blue-light hazard function, is employed to establish the maximum permissible exposure limit for the human retina under a given illumination. This function was obtained by adjusting the rhesus-monkey retinal damage data from Ham et al. experiments according to the spectral transmission characteristics of the human crystalline lens.
Figure 3.
(a) Retinal irradiance–hazard action spectrum from rhesus-monkey experiments [44], (b) spectral transmission of the human crystalline lens [45], and (c) blue-light hazard function [46], obtained by multiplying the original data in (a) by the transmission curve in (b).
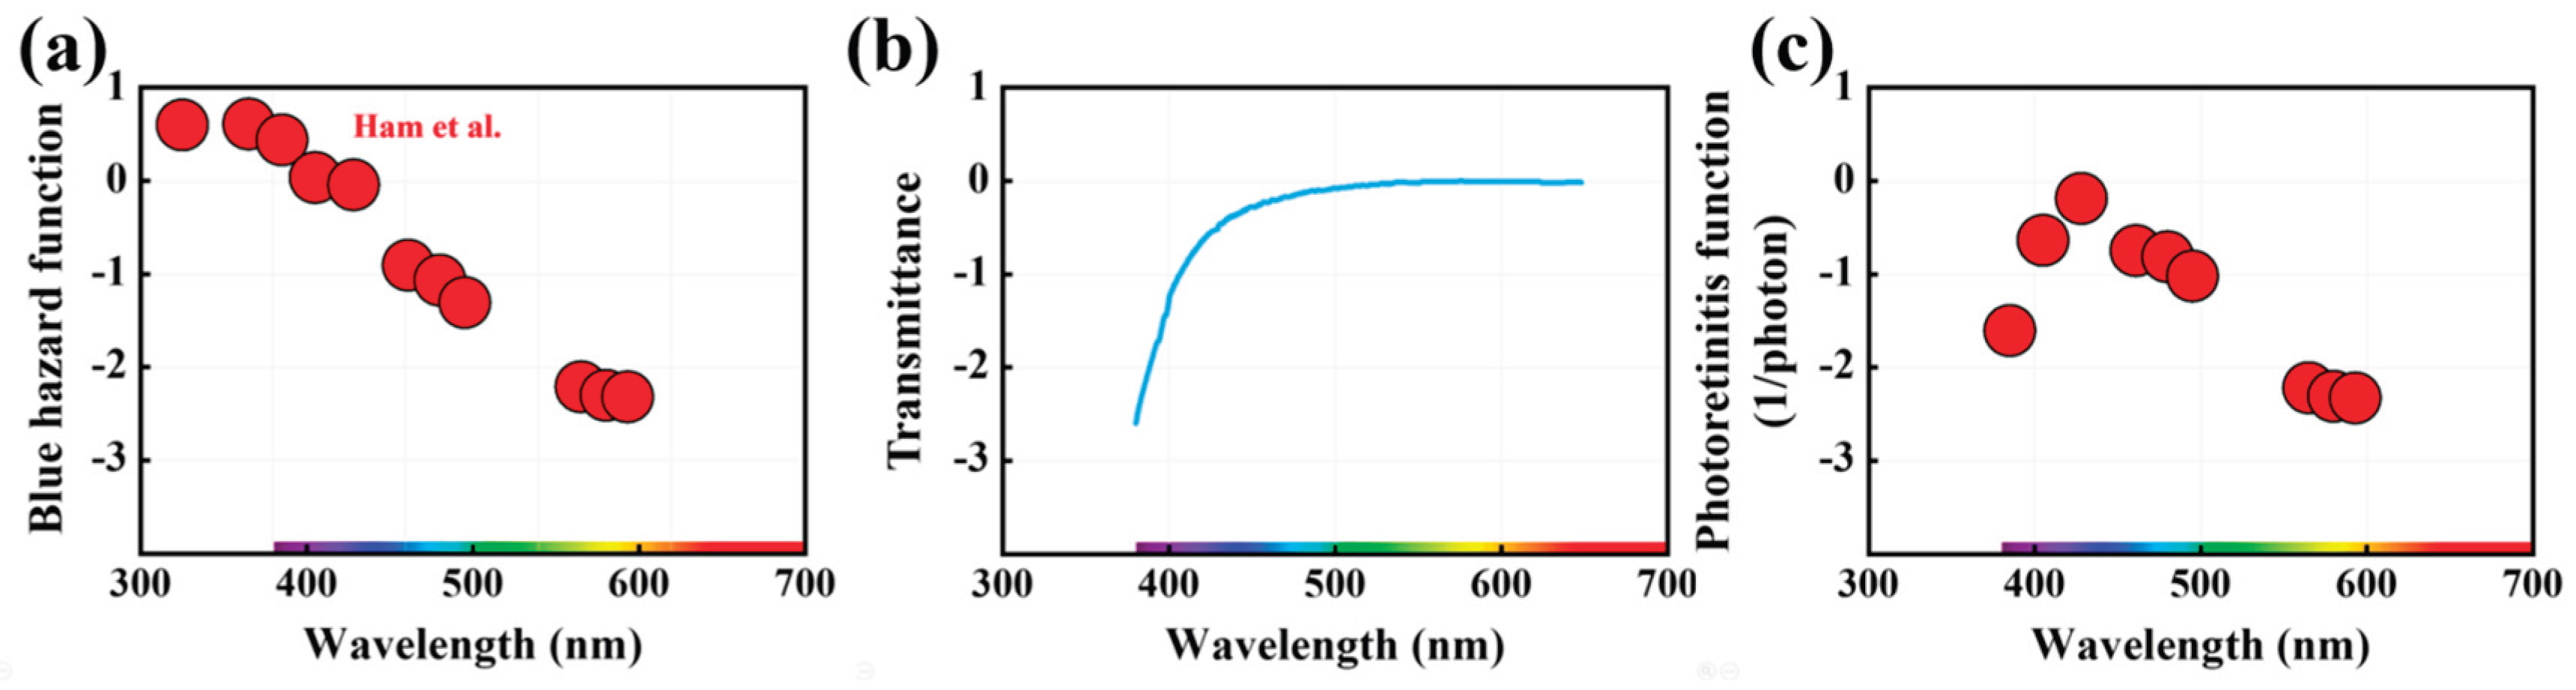
Figure 4 displays (a) the blue-light hazard function, (b) the human eye’s spectral luminous efficiency (also known as the photopic luminosity function), and (c) the blue-light hazard function normalized per unit illuminance.
Since the intensity of light entering the eye is commonly expressed in terms of illuminance, whose unit is lux (lx) or lumens per square meter (lm/m²), in order to elucidate the hazard effectiveness of each visible wavelength on the retina per unit illuminance, we divide the blue-light hazard function in (a) by the photopic luminosity function in (b), thus obtaining the blue-light hazard function per unit illuminance, as shown in Figure 4(c).
Although this spectral weighting function is generally referred to as the blue-light hazard function, the hazard effectiveness of violet light on the retina is far greater than that of blue light. Relative to the most retina-friendly yellow light at 589 nm, the hazard effectiveness of the 460 nm blue light is 309 times greater, while that of the 420 nm violet light is 3,890 times greater.
By combining the above functions, the melatonin-suppression action spectrum (a) is divided by the blue-light hazard function (b) to quantify phototherapeutic efficacy per unit retinal hazard. The data show that 589 nm yellow light achieves the highest phototherapy efficiency without inducing retinitis, making it the optimal phototherapy wavelength in this model, as illustrated in Figure 5(c).
4. Device Fabrication
Glass-ITO substrates were cleaned by scrubbing both sides twice using a 1:3 mixture of neutral detergent and deionized water. Mica substrates with ITO were rinsed only with acetone before ultrasonication to avoid ITO delamination. Cleaning proceeded in ultrasonic baths of acetone (30 min) and 2-propanol (60 min), then substrates were exposed to ultraviolet ozone for 15 min.
Host and guest materials were weighed to the target weight ratio, dissolved in tetrahydrofuran (THF), transferred into a clean quartz crucible, and baked in a vacuum oven at 60 °C for 60 min. After complete solvent removal, the resulting premixed powder was used for deposition.
Figure 6 shows the energy level diagram of the retina-friendly phototherapeutic OLED. The anode is ITO (transparent); the cathode is Al. The emissive layer comprises 4,4-N,N'-Dicarbazole-1,1'-biphenyl (CBP) as host, doped with 3wt% red emitter tris(2-phenylquinoline)iridium(III) (Ir(2-phq)₃), and 3 wt% yellow dopant JJYD-01.
Ir(2-phq)₃:JJYD-01, JJYD-01, and Ir(dmphibq)₂(acac).
5. Characterization
A Keithley 2400 electrometer and a Minolta CS-100 luminance meter were employed to measure the device’s current–voltage characteristics, power efficiency, and luminance. The Commission Internationale de l’Éclairage (CIE) color coordinates and electroluminescence (EL) spectra were recorded using a Photo Research PR-655 spectrascan photometer.
6. Methods
Based on the following formula, the saturation value of melatonin suppression under a specific light therapy duration can be calculated. For example, to determine the maximum achievable effect after half an hour of light therapy, the calculation is as follows:
According to this formula, we can determine that the saturation level of melatonin suppression reaches approximately 11% during a 30-minute light therapy session.
Using this method, we can determine the saturation level of melatonin suppression for standard clinical treatment durations (0.5, 0.75, 1, and 1.5 hours), as well as the maximum achievable melatonin saturation level for at-home therapy (6.5 hours).
Subsequently, by applying the calculated melatonin suppression saturation values to the equation below,
we obtain the following formulas for melatonin suppression levels under different treatment durations:
Thus, the above formulas enable the calculation of the relationship between irradiance exposure and melatonin suppression for a specific wavelength (λ) at given treatment durations. The results are illustrated in Figure 9.
To ensure retinal safety during light therapy sessions, we incorporated the previously defined retinal maximum permissible exposure (MPE) (Equation 1 and Equation 2) as the reference standard for determining therapeutic light dosage.
For instance, in a 30-minute treatment session, the following formula can be derived:
Consequently, the maximum permissible irradiance (Eλ) for a given wavelength (λ) under this treatment protocol can be determined.
7. Results
Figure 7 shows the effect of the retina-friendly series of dyes on the light color and color temperature of light therapy components, with the daylight color trajectory indicated by white dots. The emitter dyes, from top left to bottom right, are: Ir(2-phq)₃, a 1:1 mixture of Ir(2-phq)₃ and JJOD-01, JJOD-01, and Ir(dmphibq)₃(acac). It can be observed that the light source formed by the mixture of Ir(2-phq)₃ and JJOD-01 lies on the line connecting the chromaticity coordinates of the two emitters, indicating that producing accurate and reproducible light-emitting components through multiple emitter doping is both feasible and practical. The figure also shows that all four light colors are close to the blackbody radiation curve, aligning more closely with natural light, and are therefore more suitable for daily human use and medical lighting applications.
Figure 8 illustrates the response curve of melatonin suppression sensitivity (MSS) relative to the duration of nighttime exposure to 460 nm blue light. Data points at 1.5 hours (70% suppression) and 6.5 hours (90% suppression) are derived from experimental results reported in references [40,49], respectively. The fitted response curve exhibits a coefficient of determination (R²) of 0.99, indicating a high degree of correlation between exposure duration and melatonin suppression efficacy.
Figure 9 illustrates the impact of nighttime light exposure duration on melatonin suppression, with light sources ranging from 460 nm deep blue to 760 nm deep red. The saturation levels of melatonin suppression after exposures of 30, 45, 60, and 90 minutes were 11%, 29%, 48%, and 71%, respectively. Notably, achieving a 50% suppression required exposure durations exceeding one hour. The data for 90-minute exposure were sourced from reference 41, as previously mentioned; the remaining data points were derived from the fitted response curves discussed earlier.
According to Figure 2, the melatonin suppression per unit illuminance reaches its lowest value at 617 nm orange light. This is because, at wavelengths longer than 620 nm, red light requires more photons to achieve the same illuminance, thereby increasing melatonin suppression. Consequently, to achieve the same level of suppression, lower illuminance is needed beyond 620 nm.
As shown in the figure, short-wavelength light can achieve the same level of melatonin suppression at relatively lower illuminance. For example, to achieve 50% melatonin suppression during a 90-minute exposure, 460 nm deep blue light requires only 3 lx, while 760 nm deep red light requires 20 lx, and 617 nm orange light requires 1000 lx.
Figure 10 shows the effect of the color temperature of light therapy on melatonin suppression. Here, the light source is a blackbody, and the exposure time is 90 minutes. As shown, high color temperature light can achieve the same level of suppression at relatively lower illuminance. For example, to achieve 50% melatonin suppression, 8000 K blue-white light requires only 25 lx, while 1500 K orange light requires 120 lx.
Figure 11 shows the effect of light source color temperature and light therapy duration on melatonin suppression. The light source illuminance is set to the highest illuminance within the retinal permissible exposure limit. The results indicate that, without compromising retinal health, low color temperature light sources significantly enhance melatonin suppression. Specifically, at therapy durations of 90 and 60 minutes, the lower the color temperature, the more pronounced the melatonin suppression. However, at therapy durations of 45 and 30 minutes, the effect of color temperature on melatonin suppression is less evident.
Figure 12 shows the effect of light source color temperature and light therapy duration on melatonin suppression, where the highest illuminance within the retinal permissible exposure limit is used for a 6.5-hour home treatment. The results indicate that longer home treatment durations require lower illuminance, leading to significantly lower melatonin suppression compared to 90-minute institutional treatments. However, if the illuminance used in home treatment is applied for a 90-minute institutional treatment, melatonin suppression is further reduced. Additionally, regardless of whether it is institutional or home treatment, low color temperature light sources result in greater melatonin suppression than high color temperature light sources.
Melatonin suppression is higher than 40% compared to the suppression amount produced by 90-minute institutional treatments. If the illuminance used in home treatment is applied to institutional treatment, the melatonin suppression will be even lower (35%). Additionally, low color temperature light sources result in greater melatonin suppression in both institutional and home treatments compared to high color temperature light sources. Therefore, low color temperature light, such as candlelight, is more suitable for both institutional and home treatments.
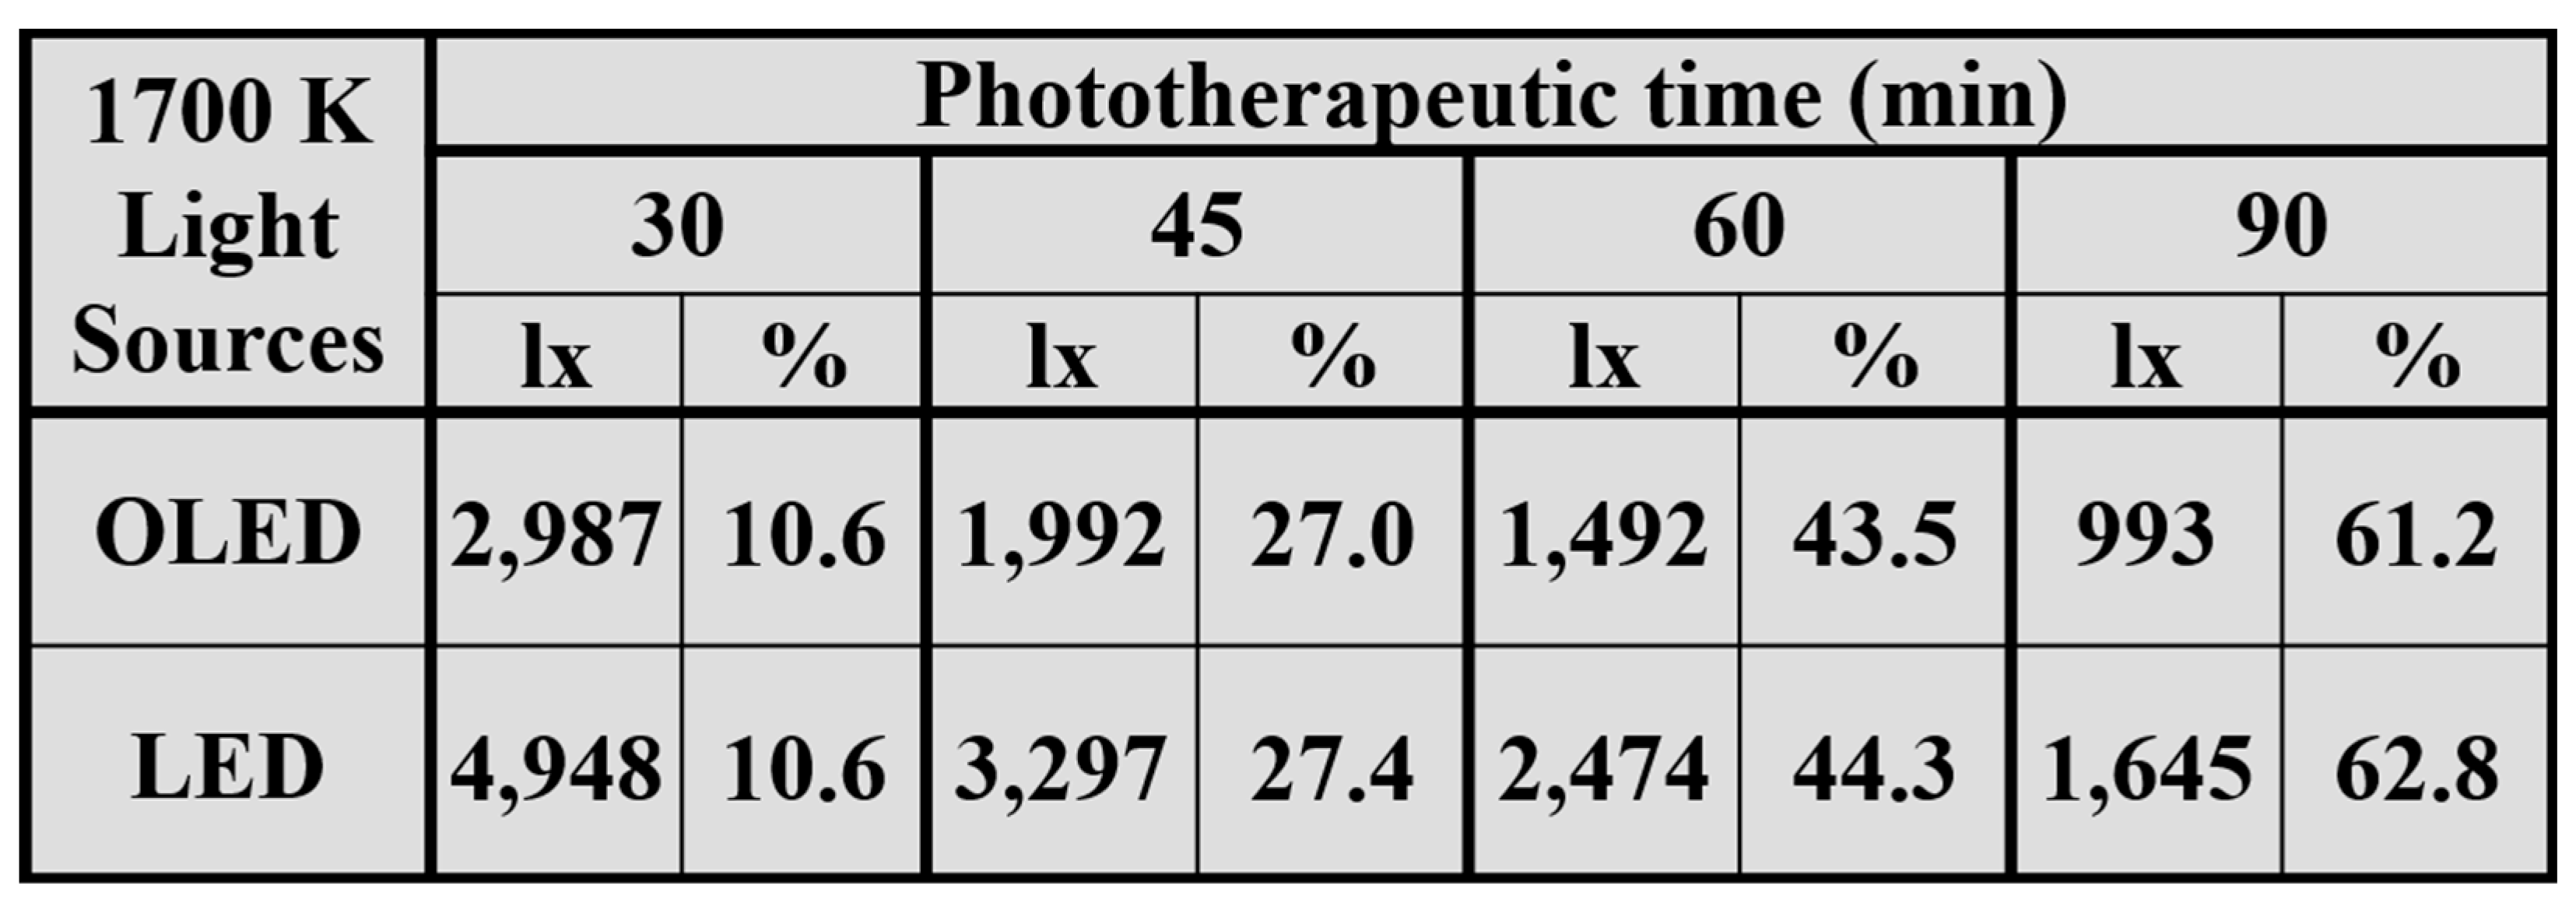
Table 1 shows the maximum efficacy and required illuminance for institutional treatments ranging from 30 to 90 minutes, with light sources being 1,700 K candlelight LED and OLED. The data indicates that compared to OLED, LED allows for higher illuminance or achieves better therapeutic efficacy. This can be attributed to the spectral differences between the 1700 K LED and OLED, as shown in Figure 13.
In other words, this candlelight LED requires a lower illuminance to achieve the same suppression effect. Lower illuminance, in turn, allows for longer exposure times. If the exposure time is fixed, higher illuminance can be used, as mentioned earlier, leading to better therapeutic efficacy. Specifically, in a 90-minute treatment, the candlelight LED shows a 62.8% suppression effect, slightly higher than the 61.2% suppression effect of the OLED.
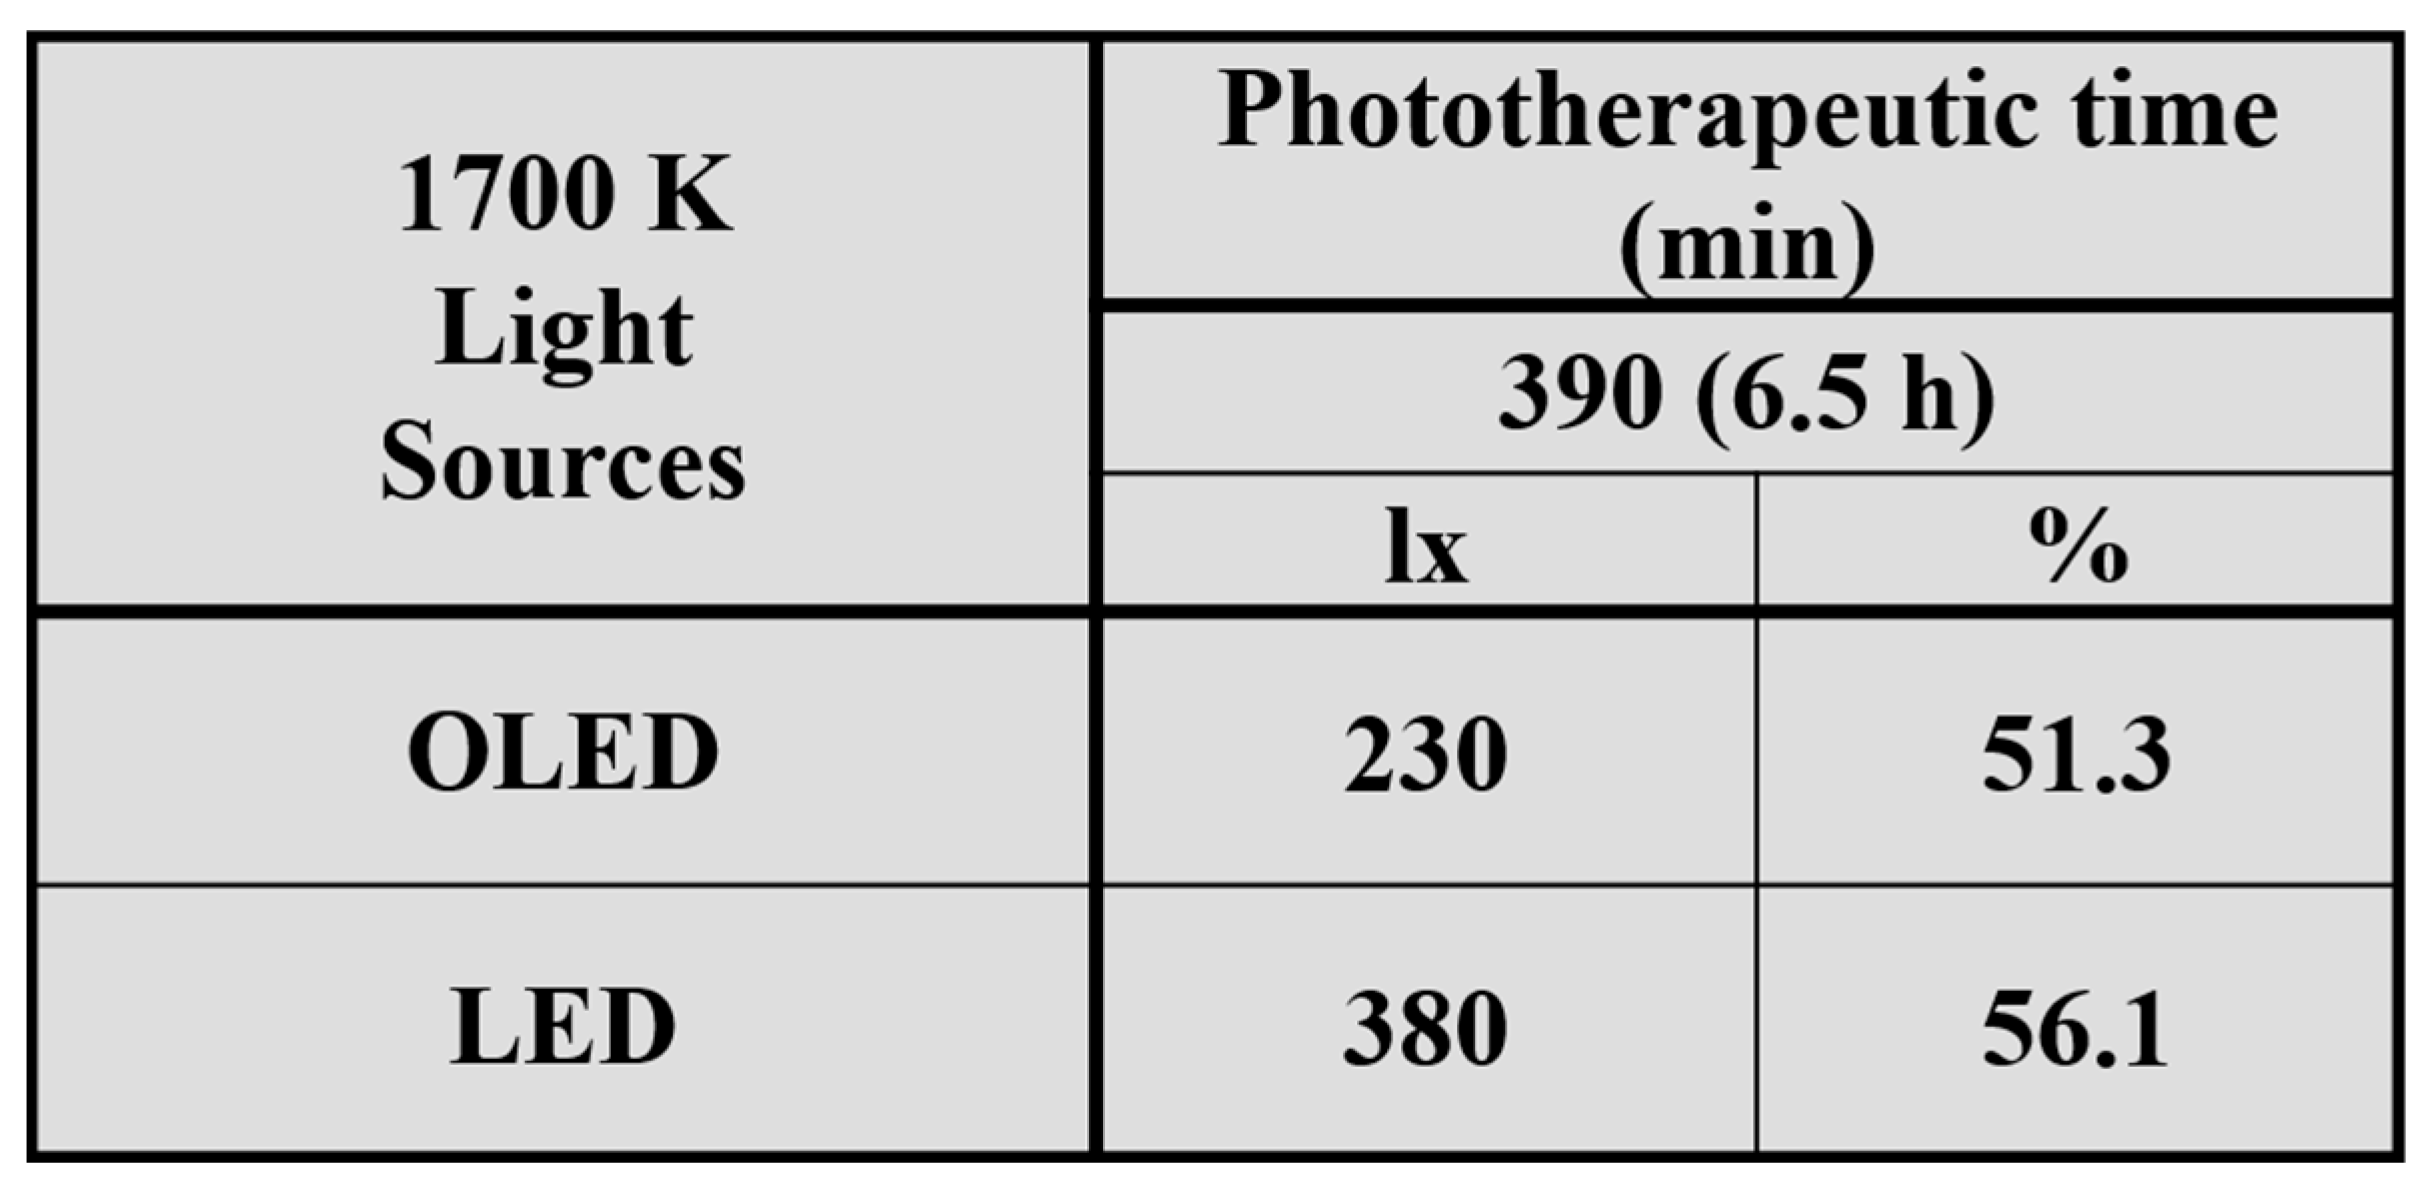
Table 2 shows the maximum efficacy and required illuminance for long-duration (6.5 hours) home light therapy, with light sources being 1,700 K candlelight LED and OLED. To avoid exceeding the retinal permissible exposure limit, the light sources need to be adjusted to lower illuminance for long-term home exposure. The data indicates that the 1,700 K OLED and LED light sources can be used at illuminances of 230 lx and 380 lx, respectively, achieving efficacy levels of 51% and 56%. Since the LED allows relatively higher illuminance, its suppression effect is greater than that of the OLED.
Figure 13 shows the spectra of candlelight OLED and candlelight LED, both with a color temperature of 1,700 K. Despite having the same color temperature, their spectra differ significantly. Due to the stronger emission of the candlelight LED at 589 nm, the yellow light region that is most beneficial for retinal-friendly light therapy, its melatonin suppression effect is better at the same illuminance.
In other words, the candlelight LED requires a lower illuminance to achieve the same suppression effect. The lower illuminance also allows for longer exposure times. If the exposure time is fixed, higher illuminance can be used, as mentioned earlier, leading to better therapeutic efficacy. Specifically, in a 90-minute treatment, the candlelight LED shows a 62.8% suppression effect, slightly higher than the 61.2% suppression effect of the OLED.
However, the OLED, which essentially provides uniform plane light, still has practical advantages, especially when used at close distances, as it is less likely to cause issues with uneven brightness or glare. In contrast, the LED offers advantages of high brightness and lower cost.
Figure 14 shows the new generation of circadian lighting can simulate sunlight, releasing varying brightness and light color according to the time of day. We found that such light color (color temperature) has a significant impact on melatonin suppression, as shown in Figure 14. Among them, low color temperature light sources are more effective in suppressing melatonin than high color temperature light, especially when the therapy duration increases from 30 to 90 minutes.
For a 90-minute light exposure, the 1,700 K candlelight LED at 600 lx can produce a 57% optimal suppression effect. In contrast, the 5,500 K pure white light, at its optimal illuminance of 28 lx, can only suppress melatonin by 47%.
Figure 15 compares the efficacy of short-duration (90 min) institutional treatment and long-duration (6.5 h) home treatment. The light therapy source used here is circadian lighting, capable of emitting color temperatures ranging from 1,700 to 5,500 K.
According to the 2014 report by the International Energy Agency [50], we know that light can cause retinal damage either through high illuminance over a short period or low illuminance over a long period. Therefore, for long-duration home light therapy, the illuminance must be kept relatively low. Conversely, for short-duration institutional treatment, higher illuminance can be used.
As shown in the figure, using the same 5,500 K white light, a 6.5-hour home treatment can achieve only 24.5% effectiveness, as it can use a maximum illuminance of only 6 lx. In contrast, a 1.5-hour institutional treatment can use up to 28 lx, resulting in a 47% suppression effect.
When using 1,700 K blue-free candlelight, a similar trend is observed. Home treatment can use a maximum illuminance of 115 lx, achieving a 38.5% suppression effect; institutional treatment, on the other hand, can use up to 600 lx, resulting in a 57% effect.
Figure 16 shows the spectrum of an innovative circadian lighting fixture, which can mimic the sun’s changing light color throughout the day from sunrise to sunset. Its color temperature can vary from 1,700 K to 5,500 K.
As shown in the figure, the 1,700 K red-orange light and the 1,900 K orange light contain very little blue-violet light, allowing them to be used at higher illuminance levels for the same exposure duration without causing photoretinitis. Additionally, they contain relatively more retinal-friendly and therapeutically effective wavelengths—specifically, greater emission at or near 589 nm. Therefore, under the same exposure duration, their melatonin suppression is greater than that of 5,500 K white light and 3,000 K yellow light.
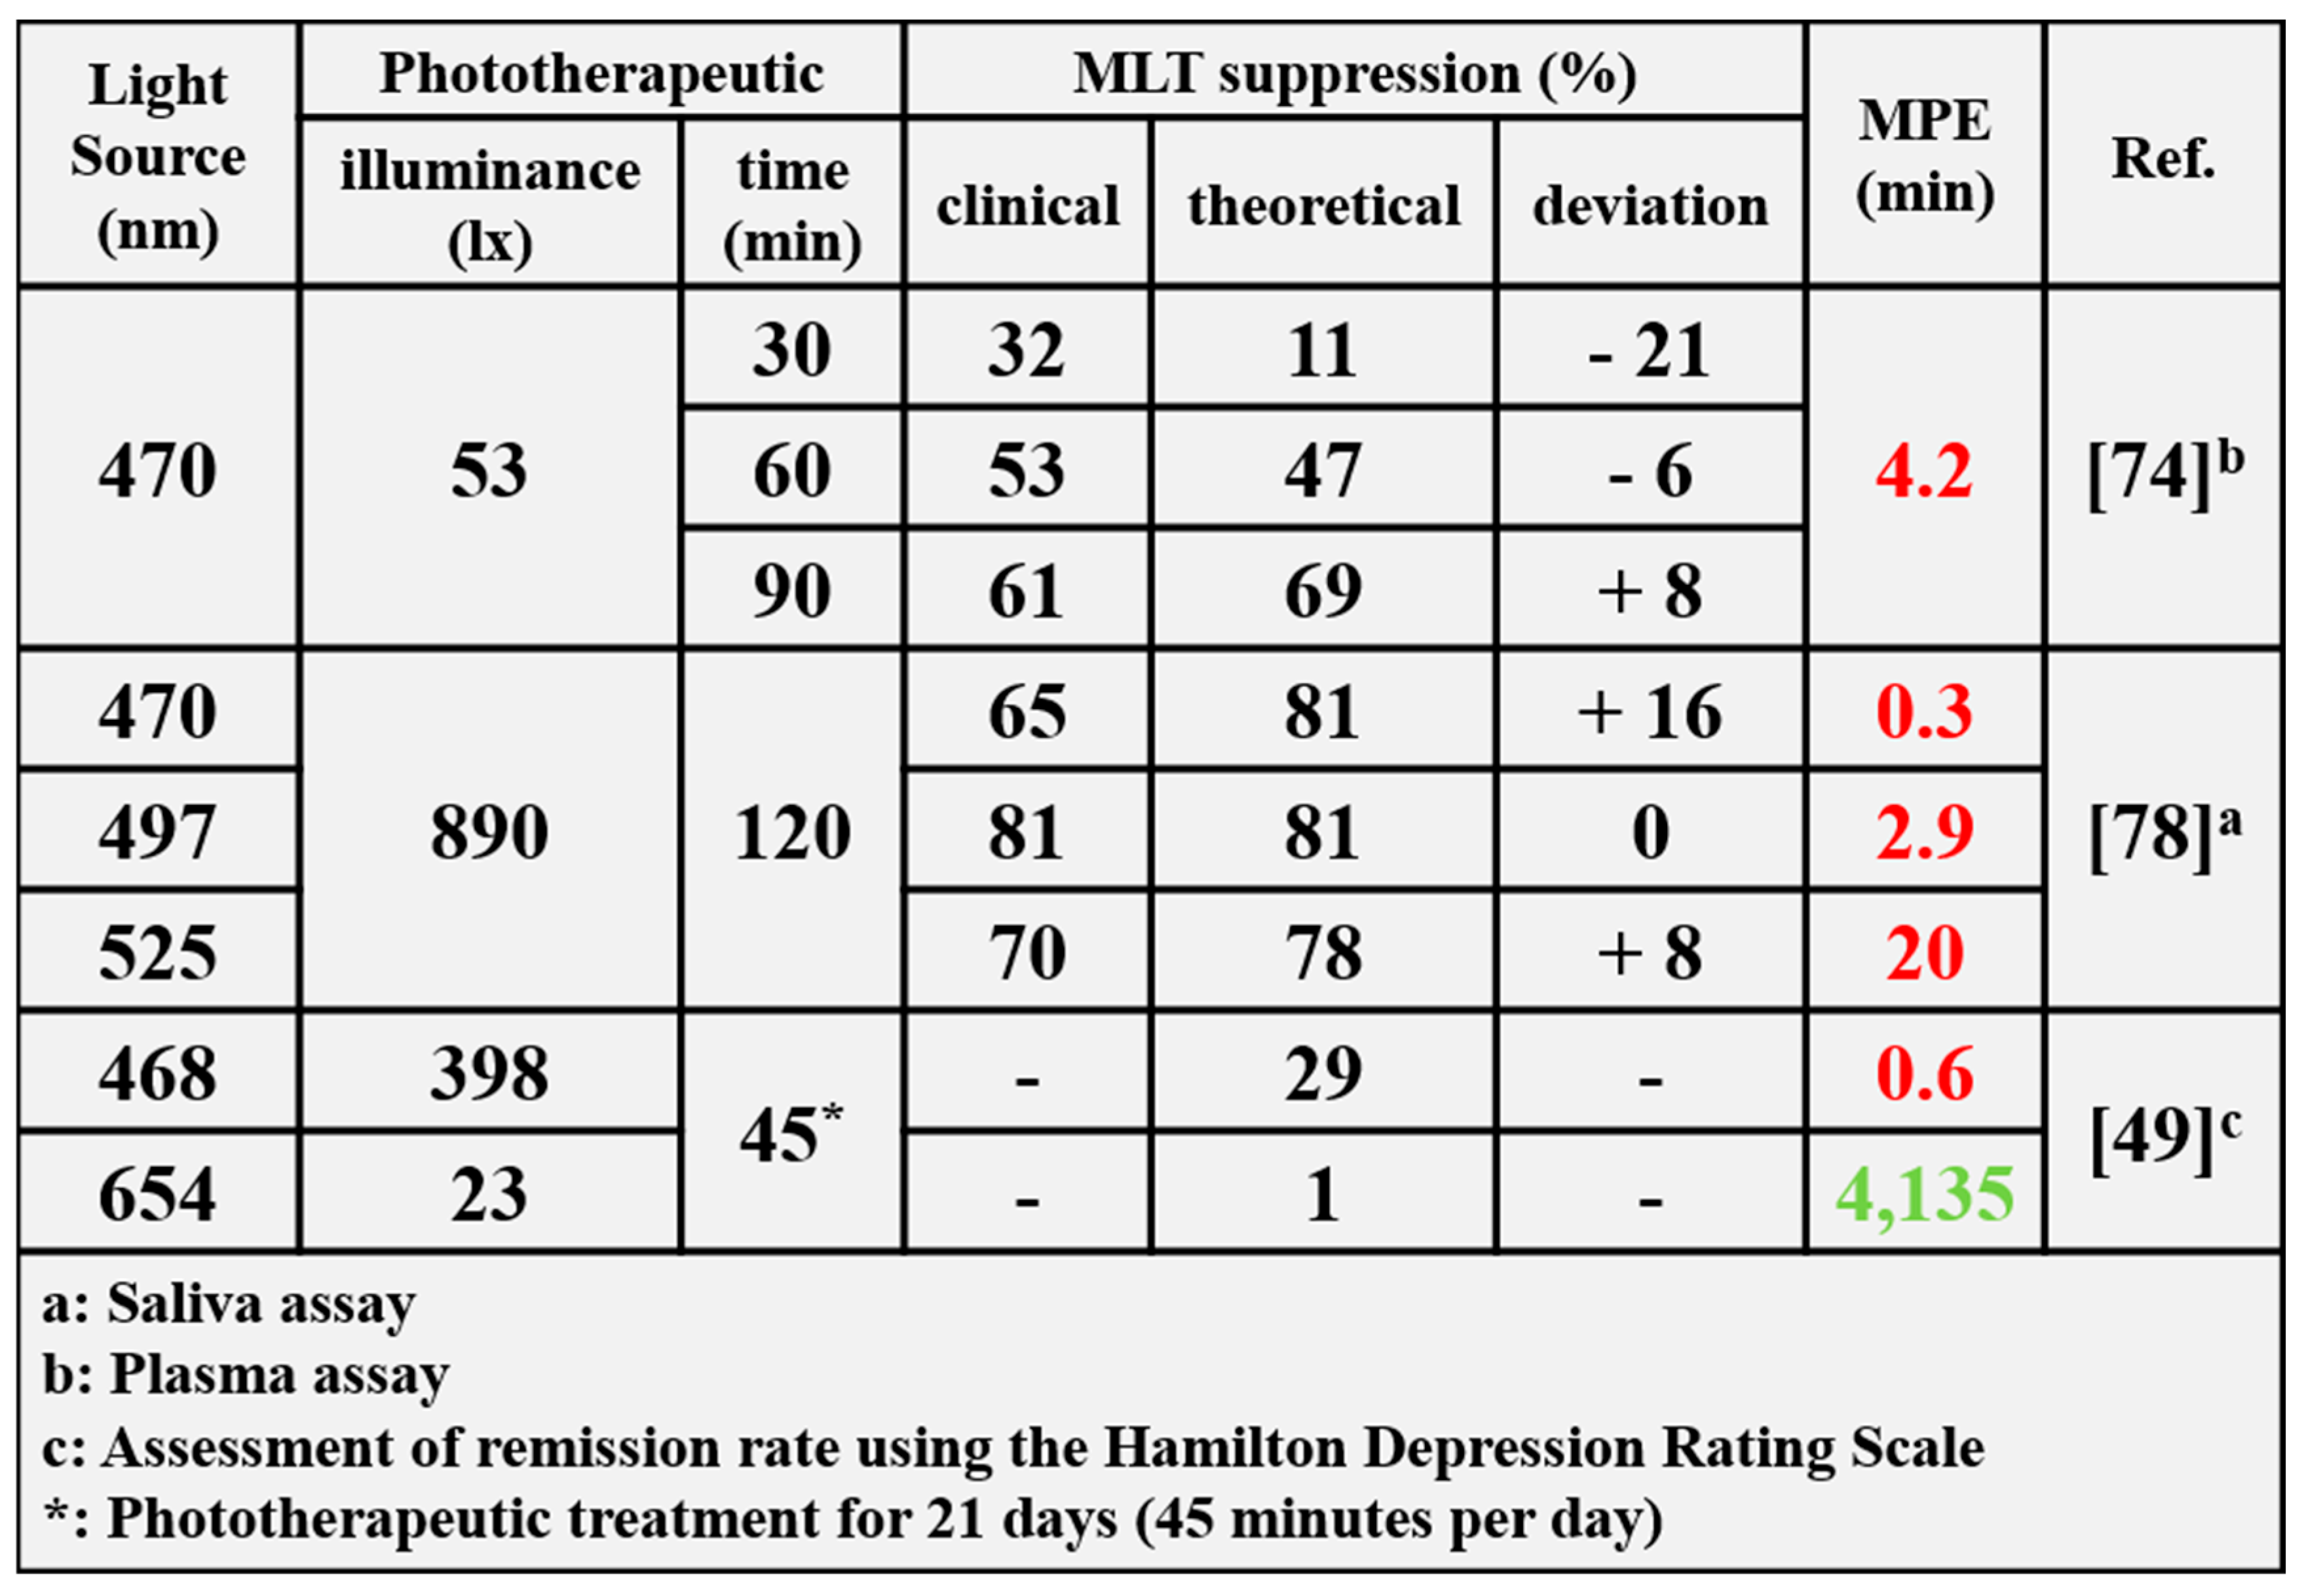
Table 3 summarizes the clinical efficacy of light therapy using monochromatic light from previous studies, compared with theoretical values; it also quantifies the retina-friendly nature of these therapies. Notably, the clinical data in the table comes from various testing methods, including saliva tests, plasma tests, and the Hamilton Depression Rating Scale.
As shown in the table, the efficacy predictions derived from the theoretical model align perfectly with the corresponding clinical experimental values in some cases, showing zero difference, while the largest difference is 21%. This indicates that the theoretical model proposed is credible.
However, among the eight experimental groups, only one group (Group 8) had conditions that were considered retina-friendly, meaning its 45-minute light therapy duration did not exceed the retinal permissible exposure limit (4,000 minutes). The seven groups that exceeded this limit primarily used shorter wavelength light, particularly in the 450 to 490 nm range. The retinal phototoxicity associated with these wavelengths is much higher than the efficacy of light therapy, raising concerns about potential retinal damage.
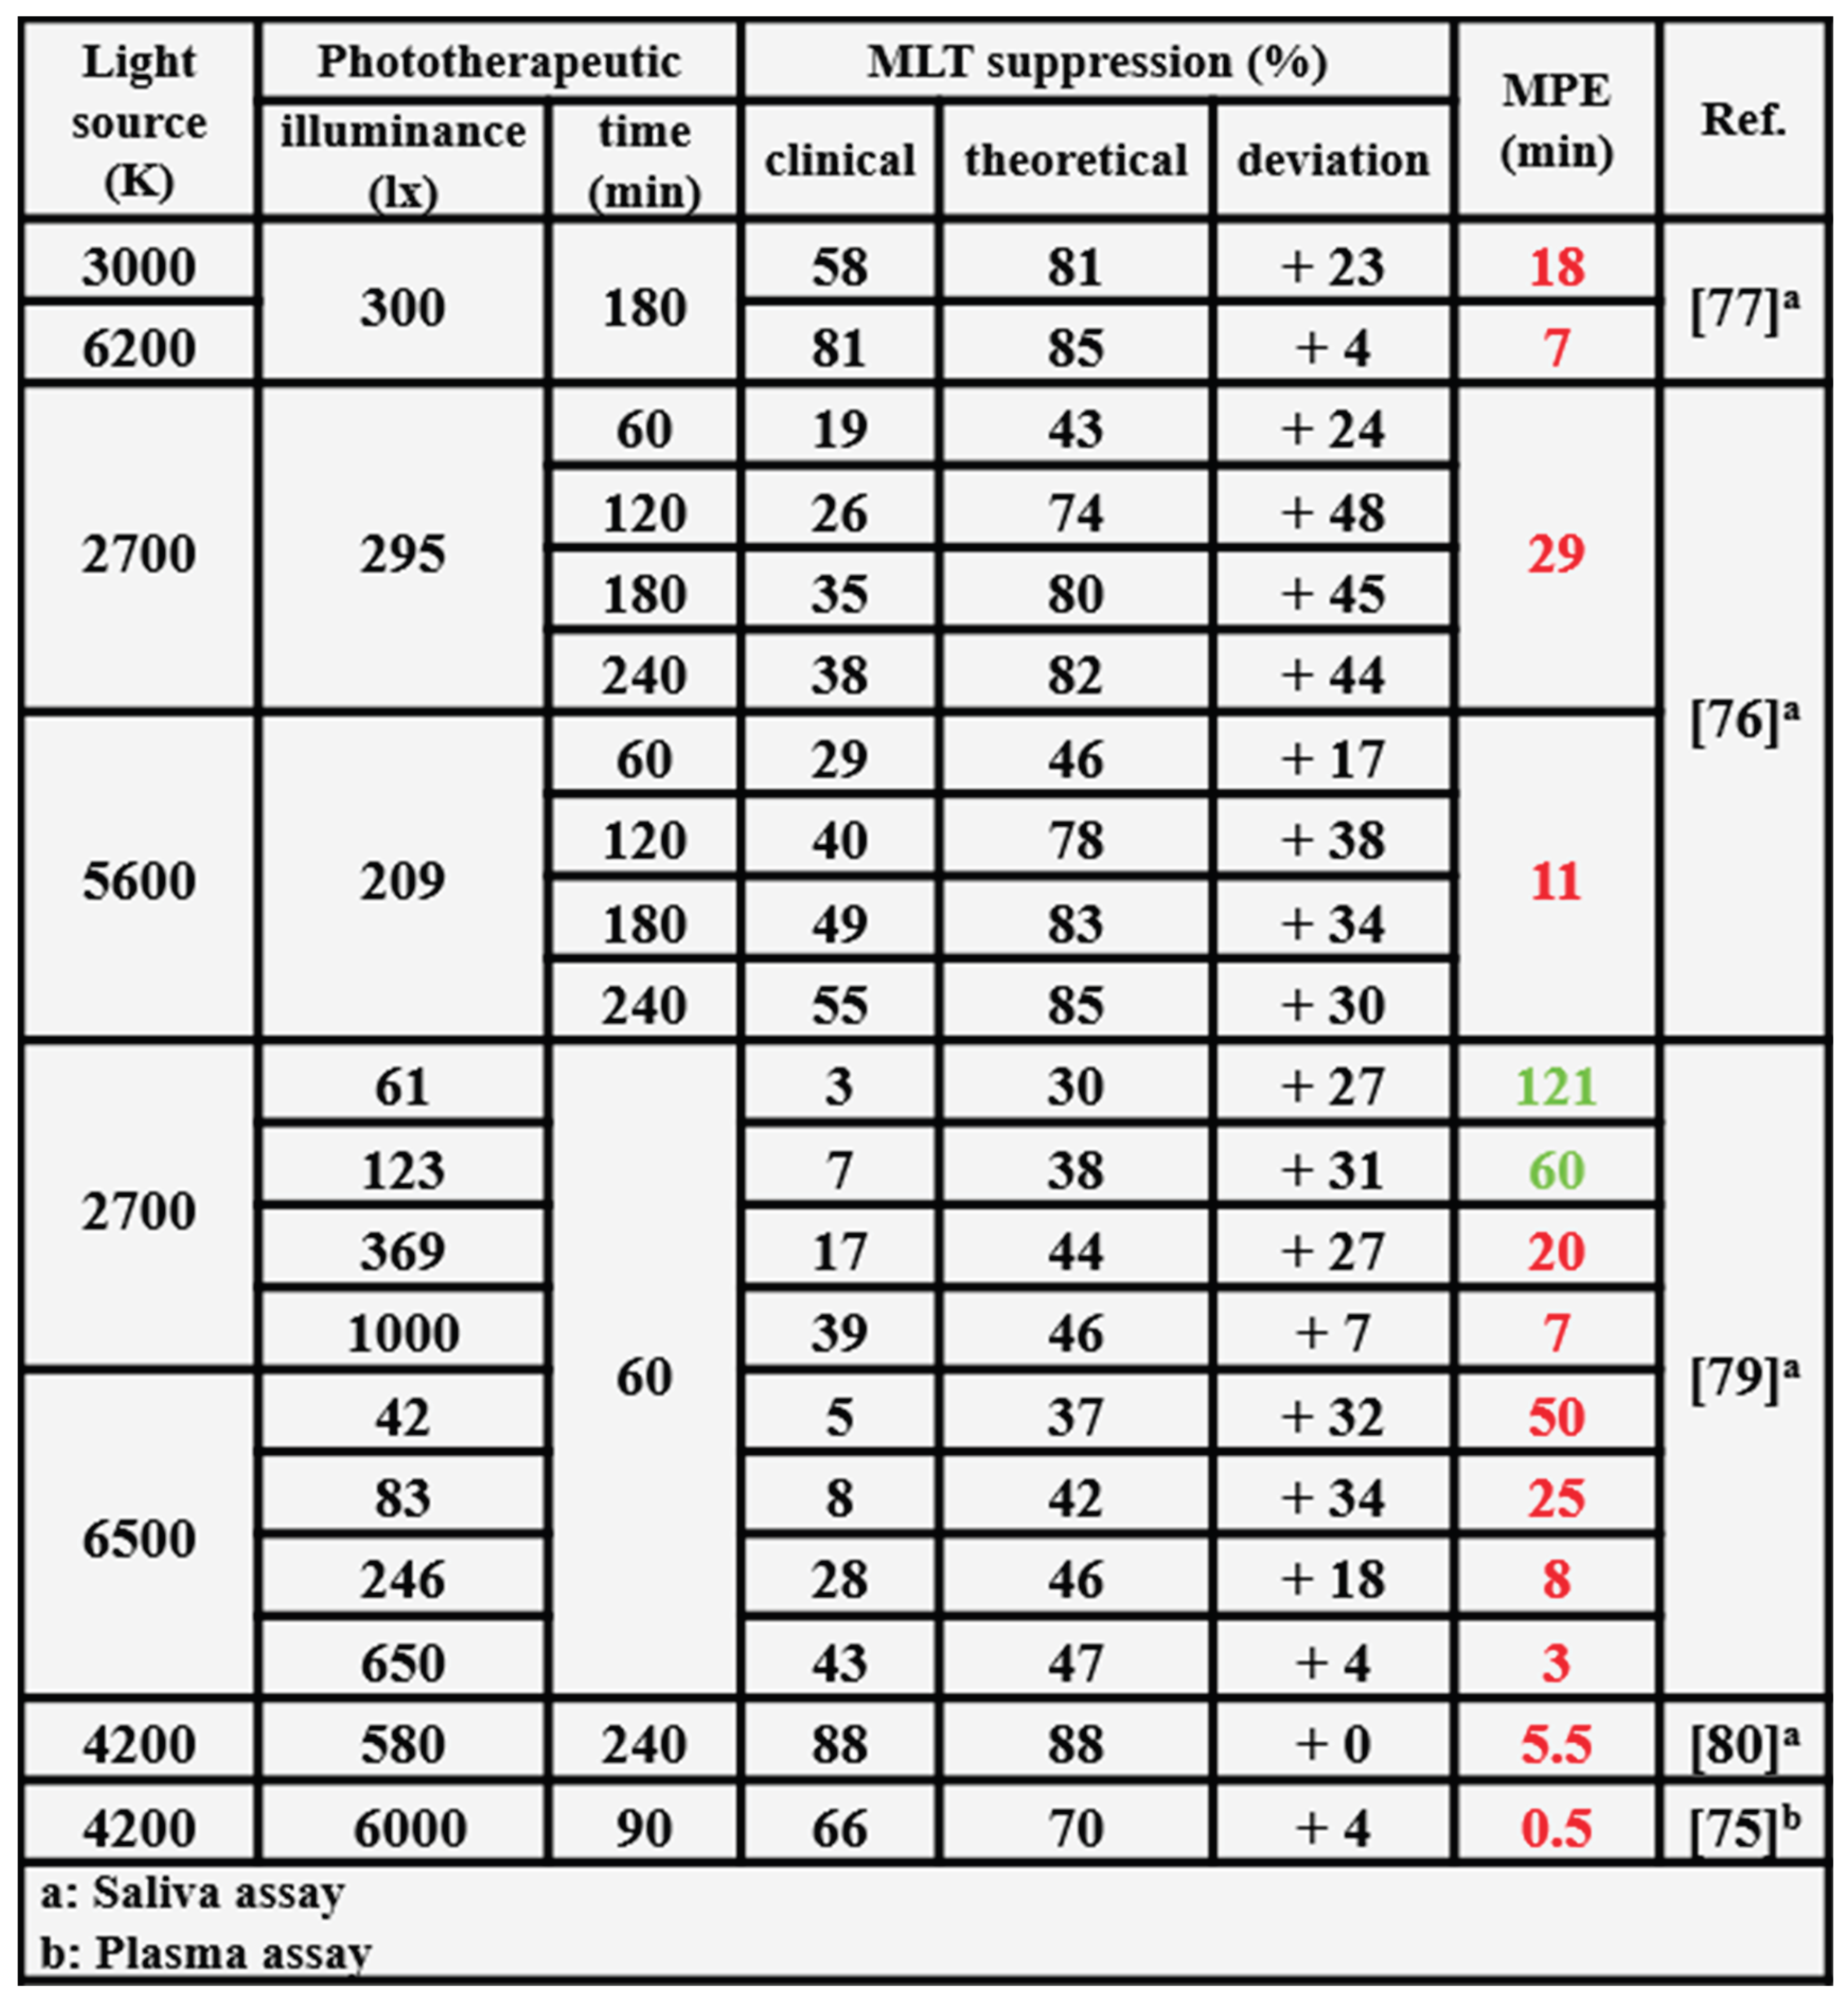
Table 4 summarizes the therapeutic efficacy of prior studies using multiband light sources for phototherapy and compares the results with theoretical values, also evaluating retinal safety.
It cites clinical data from various studies using different test methods, including saliva assays, plasma assays, and the Hamilton Depression Rating Scale.
Overall, the discrepancy between model-predicted values and clinical results ranged from 0% to 48%.
Among 20 experimental settings, only two stayed within permissible retinal exposure limits; the other 18 exceeded those limits, mostly due to excessive illuminance or high color temperatures (blue-rich light).
Both clinical and theoretical data show that efficacy increases significantly with longer exposure time and higher color temperature. Moreover, extending exposure time was much more effective than increasing light intensity. For example, in studies 75 and 80—both using 4,200 K slightly yellow-white light—exposure to 580 lx for 240 minutes achieved 88% efficacy, significantly higher than the 66% efficacy from 6,000 lx for 90 minutes.
8. Discussion
Although blue (450–490 nm) and violet (400–450 nm) light wavelengths are highly effective in suppressing melatonin, they are not the most suitable for phototherapy due to their significant potential for retinal damage. As illustrated in Figure 5, these wavelengths exhibit the highest melatonin-suppression efficacy; however, they also correspond to elevated levels of retinal hazard. Specifically, the retinal hazard efficacy for blue and violet light is approximately 18,903 and 190,824 times greater, respectively, compared to longer wavelengths. Consequently, their phototherapeutic efficacy per unit of retinal hazard is relatively low, at 2.1 and 2.7, respectively.
In contrast, 589 nm yellow light demonstrates a superior balance between efficacy and safety. It achieves the highest phototherapeutic efficacy per unit of retinal hazard, with a value of 35.2—surpassing blue and violet light by factors of 17 and 13, respectively. This indicates that, under conditions that avoid inducing retinitis, 589 nm yellow light offers the most efficient and retina-friendly option for phototherapy within this model.
In the past, general lighting primarily utilized high color temperature white light or medium to low color temperature yellow light. With the advent and mass production of candlelight lamps, ultra-low color temperature lighting has become increasingly prevalent. Encouragingly, such ultra-low color temperature candlelight illumination is suitable not only for short-term institutional therapy but also for extended at-home treatment. This suitability stems from the candlelight lamp's composition, which includes a higher proportion of retina-friendly and phototherapeutically effective light, particularly when compared to medium and high color temperature light sources.
As illustrated in Figure 15, regardless of whether the treatment is a 90-minute institutional session or a 6.5-hour at-home session, the orange-red candlelight (1,700 K) consistently demonstrates the highest suppression effect. Specifically, during a 90-minute treatment, candlelight achieves a 57% suppression effect, surpassing white light by 10%. After 6.5 hours of exposure, the effect of candlelight reaches 38.5%, which is 14% higher than the 24.5% achieved by blue-white light.
Prolonged phototherapy sessions can lead to diminished therapeutic efficacy due to the necessity of reducing illuminance to stay within the retina's Maximum Permissible Exposure (MPE) limits. Exceeding these limits increases the risk of retinal damage, necessitating lower light intensities and consequently reducing the effectiveness of melatonin suppression.
For instance, utilizing candlelight at 1,700 K, a 1.5-hour exposure at 600 lx achieves a 57% suppression effect. However, extending the exposure to 6.5 hours requires reducing the illuminance to 115 lx to prevent retinal phototoxicity, resulting in a decreased suppression effect of 38.5%.
9. Conclusions
In this study, we propose a theoretical model for phototherapy light sources that balances retinal safety with therapeutic efficacy. The model quantifies therapeutic effectiveness using melatonin suppression sensitivity (MSS) and sets the maximum permissible exposure (MPE) as the upper limit for safe retinal exposure.
According to this model, light at a wavelength of 589 nm offers optimal phototherapeutic effects. Specifically, a 90-minute exposure yields a 68% melatonin suppression rate, while a 6.5-hour exposure achieves a 78% suppression rate, all within safe exposure limits that prevent retinal phototoxicity.
Furthermore, our analysis of existing phototherapy methods reveals that many may pose risks to retinal safety. These methods, while effective in suppressing melatonin, have the potential to cause retinal damage.
We recommend improving the spectral composition and intensity control of current phototherapy devices to ensure they deliver effective treatment without compromising retinal health. Future work aims to apply this theoretical model in clinical trials to validate its efficacy, ultimately contributing to healthier lighting solutions in modern life.
Author Contributions
Conceptualization, J.-H.J.; Methodology, W.-Z.L. and J.-H.J.; Investigation, W.-Z.L. and C.-W.C.; Data Curation, W.-Z.L.; Resources, P.-T.Y.; Writing – Original Draft Preparation, T.-H.L. and Z.-C.L.; Writing – Review & Editing, Y.-B.G., J.-C.C., P.-T.Y. and C.-W.H.; Project Administration, C.-W.H.; Supervision, J.-H.J. All authors have read and agreed to the published version of the manuscript.
Funding
This research received no external funding.
Institutional Review Board Statement
Not applicable.
Informed Consent Statement
Not applicable.
Data Availability Statement
All data generated or analysed during this study are included in this published article.
Conflicts of Interest
The authors declare no conflicts of interest.
References
- American Psychiatric Association. Diagnostic and statistical manual of mental disorders, 5th ed.; American Psychiatric Publishing: Arlington, VA, 2013. [Google Scholar]
- Arendt, J. Biological Rhythms During Residence in Polar Regions. Chronobiol. Int. 2012, 29, 379–394. [Google Scholar] [CrossRef] [PubMed]
- Mc Mahon, B.; Andersen, S. B.; Madsen, M. K.; Hjordt, L. V.; Hageman, I.; Dam, H.; Svarer, C.; da Cunha-Bang, S.; Baaré, W. F. C.; Madsen, J.; Hasholt, L.; Frokjær, V.; Knudsen, G.M. Patients with seasonal affective disorder show seasonal fluctuations in their cerebral serotonin transporter binding. Abstract from 27th ECNP Congress, Berlin, Germany, 2014. [Google Scholar]
- Magnusson, A.; Boivin, D. Seasonal affective disorder: an overview. Chronobiol. Int. 2003, 20, 189–207. [Google Scholar] [CrossRef] [PubMed]
- Quera Salva, M.A.; Hartley, S.; Barbot, F.; C. Alvarez, J.; Lofaso, F.; Guilleminault, C. Circadian rhythms, melatonin and depression. Curr. Pharm. Des. 2011, 17, 1459–1470. [Google Scholar] [CrossRef] [PubMed]
- Vasey, C.; McBride, J.; Penta, K. Circadian rhythm dysregulation and restoration: the role of melatonin. Nutrients 2021, 13, 3480. [Google Scholar] [CrossRef] [PubMed]
- Kim, K.; Kim, J.; Jung, S.; Kim, H.-W.; Kim, H.-S.; Son, E.; Ko, D. S.; Yoon, S.; Kim, B. S.; Kim, W. K.; Lim, C.; Kim, K.; Lee, D.; Kim, Y. H. Global prevalence of seasonal affective disorder by latitude: A systematic review and meta-analysis. J. Affect. Disord. 2025, 390, 119807. [Google Scholar] [CrossRef] [PubMed]
- Cajochen, C.; Chellappa, S.; Schmidt, C. What keeps us awake?—the role of clocks and hourglasses, light, and melatonin. Int. Rev. Neurobiol. 2010, 93, 57–90. [Google Scholar] [CrossRef] [PubMed]
- Matz, C. J.; Stieb, D. M.; Davis, K.; Egyed, M.; Rose, A.; Chou, B.; Brion, O. Effects of age, season, gender and urban-rural status on time-activity: Canadian Human Activity Pattern Survey 2 (CHAPS 2). Int. J. Environ. Res. Public Health 2014, 11, 2108–2124. [Google Scholar] [CrossRef] [PubMed]
- Dryden-Edwards, R. Seasonal Affective Disorder (SAD): Symptoms, Treatment, Statistics. MedicineNet. 2 January 2024. Available online: https://www.medicinenet.com/seasonal_affective_disorder_sad/article.htm.
- de Menezes-Júnior, L. A. A.; Sabião, T. S.; Carraro, J. C. C.; Machado-Coelho, G. L. L.; Meireles, A. L. The role of sunlight in sleep regulation: analysis of morning, evening and late exposure. BMC Public Health 2025, 25, 3362. [Google Scholar] [CrossRef] [PubMed]
- Rosenthal, N. E.; Sack, D. A.; Gillin, J. C.; Lewy, A. J.; Goodwin, F. K.; Davenport, Y.; Mueller, P.S.; Newsome, D.A.; Wehr, T. A. Seasonal affective disorder: a description of the syndrome and preliminary findings with light therapy. Arch. General. Psychiatry 1984, 41, 72–80. [Google Scholar]
- Feng, J.; Tian, F.; Zhang, J.; Huang, Z.; Chen, G.; Qian, Z.; Wang, Y.; Stamatakis, K. A.; Howard, S. W.; Zheng, G.; Wang, C.; Lin, H. Sunshine Duration, Genetic Predisposition, and Incident Depression: Findings from a Prospective Cohort. Green Health 2025, 1, 13. [Google Scholar] [CrossRef]
- Golden, R. N.; Gaynes, B. N.; Ekstrom, R. D.; Hamer, R. M.; Jacobsen, F. M.; Suppes, T.; Wisner, K.L.; Nemeroff, C.B. The efficacy of light therapy in the treatment of mood disorders: a review and meta-analysis of the evidence. Am. J. Psychiatry 2005, 162, 656–662. [Google Scholar] [CrossRef] [PubMed]
- Mårtensson, B.; Pettersson, A.; Berglund, L.; Ekselius, L. Bright white light therapy in depression: a critical review of the evidence. J. Affect. Disord. 2015, 182, 1–7. [Google Scholar] [CrossRef] [PubMed]
- Eastman, C. I.; Young, M. A.; Fogg, L. F.; Liu, L.; Meaden, P. M. Bright light treatment of winter depression: a placebo-controlled trial. Arch. General. Psychiatry 1998, 55, 883–889. [Google Scholar] [CrossRef] [PubMed]
- Jiang, L.; Zhang, S.; Wang, Y.; So, K. F.; Ren, C.; Tao, Q. Efficacy of light therapy for a college student sample with non-seasonal subthreshold depression: an RCT study. J. Affect. Disord. 2020, 277, 443–449. [Google Scholar] [CrossRef] [PubMed]
- Zhou, T. H.; Dang, W. M.; Ma, Y. T.; Hu, C. Q.; Wang, N.; Zhang, G. Y.; Wang, G.; Shi, C.; Zhang, H.; Guo, B.; et al. Clinical efficacy, onset time and safety of bright light therapy in acute bipolar depression as an adjunctive therapy: a randomized controlled trial. J. Affect. Disord. 2018, 227, 90–96. [Google Scholar] [CrossRef] [PubMed]
- Geoffroy, P. A.; Schroder, C. M.; Reynaud, E.; Bourgin, P. Efficacy of light therapy versus antidepressant drugs, and of the combination versus monotherapy, in major depressive episodes: A systematic review and meta-analysis. Sleep Med. Rev. 2019, 48, 101213. [Google Scholar] [CrossRef] [PubMed]
- Rosenthal, N. E.; Joseph-Vanderpool, J. R.; Levendosky, A. A.; Johnston, S. H.; Allen, R.; Kelly, K. A.; Souetre, E.; Schultz, P.M.; Starz, K. E. Phase-shifting effects of bright morning light as treatment for delayed sleep phase syndrome. Sleep 1990, 13, 354–361. [Google Scholar] [CrossRef]
- Watanabe, T.; Kajimura, N.; Kato, M.; Sekimoto, M.; Takahashi, K. Effects of phototherapy in patients with delayed sleep phase syndrome. Psychiatry Clin. Neurosci. 1999, 53, 231–233. [Google Scholar] [CrossRef] [PubMed]
- Menegaz de Almeida, A.; Aquino de Moraes, F. C.; Cavalcanti Souza, M. E.; Cavalcanti Orestes Cardoso, J. H.; Tamashiro, F.; Miranda, C.; Fernandes, L.; Kreuz, M.; Alves Kelly, F. Bright Light Therapy for Nonseasonal Depressive Disorders: A Systematic Review and Meta-Analysis. JAMA Psychiatry 2025, 82, 38–46. [Google Scholar] [PubMed]
- Munsamy, A. J.; Moodley, M.; Khan, Z.; Govender, K.; Nkwanyana, M.; Cele, S.; Radebe, M. Evidence on the effects of digital blue light on the eye: A scoping review. Afr. Vis. Eye Health 2022, 81, 685. [Google Scholar] [CrossRef]
- Wu, J.; Seregard, S.; Algvere, P. V. Photochemical damage of the retina. Surv. Ophthalmol. 2006, 51, 461–481. [Google Scholar] [CrossRef] [PubMed]
- Zeller, K.; Mühleisen, S.; Shanmugarajah, P.; Fehler, N.; Haag, R.; Hessling, M. Influence of visible violet, blue and red light on the development of cataract in porcine lenses. Medicina 2022, 58, 721. [Google Scholar] [CrossRef] [PubMed]
- Hong, W. Mitigating Blue-Light Risk in Display-Based Digital Therapeutics: A Practical Framework to Support Clinical Efficacy. J. Clin. Med. 2026, 15, 1371. [Google Scholar] [CrossRef] [PubMed]
- Botanov, Y.; Ilardi, S. S. The acute side effects of bright light therapy: a placebo-controlled investigation. PLoS ONE 2013, 8, e75893. [Google Scholar] [CrossRef] [PubMed]
- Oren, D. A.; Shannon, N. J.; Carpenter, C. J.; Rosenthal, N. E. Usage patterns of phototherapy in seasonal affective disorder. Compr. Psychiatry 1991, 32, 147–152. [Google Scholar] [CrossRef] [PubMed]
- Labbate, L. A.; Lafer, B.; Thibault, A.; Sachs, G. S. Side effects induced by bright light treatment for seasonal affective disorder. J. Clin. Psychiatry 1994, 55, 189–191. [Google Scholar] [PubMed]
- Kogan, A. O.; Guilford, P. M. Side effects of short-term 10,000-lux light therapy. Am. J. Psychiatry 1998, 155, 293–294. [Google Scholar] [CrossRef] [PubMed]
- Terman, M.; Terman, J. S. Light therapy for seasonal and nonseasonal depression: efficacy, protocol, safety, and side effects. CNS Spectr. 2005, 10, 647–663. [Google Scholar] [CrossRef] [PubMed]
- Chamorro, E.; Bonnin-Arias, C.; Pérez-Carrasco, M. J.; de Luna, J. M.; Vázquez, D.; Sánchez-Ramos, C. Effects of light-emitting diode radiations on human retinal pigment epithelial cells in vitro. Photochem. Photobiol. 2013, 89, 468–473. [Google Scholar] [CrossRef] [PubMed]
- Yan, Y.; Wu, Y.; Zhao, Y.; Yang, Y.; An, G.; Liu, Z.; Qi, D. A review on eye diseases induced by blue light: pathology, model, active ingredients and mechanisms. Front. Pharmacol. 2025, 16, 1513406. [Google Scholar] [CrossRef] [PubMed]
- Ham, W. T., Jr.; Mueller, H. A.; Sliney, D. H. Retinal sensitivity to damage from short wavelength light. Nature 1976, 260, 153–155. [Google Scholar] [CrossRef] [PubMed]
- Margrain, T. H.; Boulton, M.; Marshall, J.; Sliney, D. H. Do blue light filters confer protection against age-related macular degeneration? Prog. Retin. Eye Res. 2004, 23, 523–531. [Google Scholar] [CrossRef] [PubMed]
- Algvere, P. V.; Marshall, J.; Seregard, S. Age-related maculopathy and the impact of blue light hazard. Acta Ophthalmol. Scand. 2006, 84, 4–15. [Google Scholar] [CrossRef] [PubMed]
- Zhao, Z. C.; Zhou, Y.; Tan, G.; Li, J. Research progress about the effect and prevention of blue light on eyes. Int. J. Ophthalmol. 2018, 11, 1999. [Google Scholar] [CrossRef] [PubMed]
- Brouwer, A.; Nguyen, H. T.; Snoek, F. J.; van Raalte, D. H.; Beekman, A. T. F.; Moll, A. C.; Bremmer, M. A. Light therapy: is it safe for the eyes? Acta Psychiatr. Scand. 2017, 136, 534–548. [Google Scholar] [CrossRef] [PubMed]
- Jou, J.-H. Melatonin Suppression Extent Measuring Device. U.S. Patent No. 8,812,242 B2; U.S. Patent and Trademark Office, 2014. [Google Scholar]
- Brainard, G. C.; Hanifin, J. P.; Greeson, J. M.; Byrne, B.; Glickman, G.; Gerner, E.; Rollag, M. D. Action spectrum for melatonin regulation in humans: evidence for a novel circadian photoreceptor. J. Neurosci. 2001, 21, 6405–6412. [Google Scholar] [CrossRef] [PubMed]
- Thapan, K.; Arendt, J.; Skene, D. J. An action spectrum for melatonin suppression: evidence for a novel non-rod, non-cone photoreceptor system in humans. J. Physiol. 2001, 535, 261–267. [Google Scholar] [CrossRef] [PubMed]
- Blask, D. E.; Dauchy, R. T.; Brainard, G. C.; Hanifin, J. P. Circadian stage-dependent inhibition of human breast cancer metabolism and growth by the nocturnal melatonin signal: consequences of its disruption by light at night in rats and women. Integr. Cancer Ther. 2009, 8, 347–353. [Google Scholar] [CrossRef] [PubMed]
- International Commission on Non-Ionizing Radiation Protection. Guidelines on limits of exposure to ultraviolet radiation of wavelengths between 180 nm and 400 nm (incoherent optical radiation). Health Phys. 2004, 87, 171–186. [Google Scholar] [CrossRef] [PubMed]
- Sliney, D. H.; Bitran, M. The ACGIH action spectra for hazard assessment: The TLV's. Measurements of Optical Radiation Hazards. 1998; pp. 241–259. [Google Scholar]
- Pons, A.; Delgado, D.; Campos, J. Determination of the action spectrum of the blue-light hazard for different intraocular lenses. J. Opt. Soc. Am. A 2007, 24, 1545–1550. [Google Scholar] [CrossRef] [PubMed]
- Jou, J. H.; Chen, J. H.; Lin, J. T.; Cheng, M. H. An easy-to-apply method for determining permissible exposure limit of retina to light. Heliyon 2022, 8. [Google Scholar] [CrossRef] [PubMed]
- Sharpe, L. T.; Stockman, A.; Jagla, W.; Jägle, H. A luminous efficiency function, V*(λ), for daylight adaptation. J. Vis. 2005, 5, 3–3. [Google Scholar] [CrossRef] [PubMed]
- Jou, J. H.; Dubey, D. K.; Swayamprabhaa, S. S. P-145: Blue Light Hazards and Methods of Quantification. In SID Symposium Digest of Technical Papers; 2019; Vol. 50, pp. 1771–1774. [Google Scholar]
- Hack, L. M.; Lockley, S. W.; Arendt, J.; Skene, D. J. The effects of low-dose 0.5-mg melatonin on the free-running circadian rhythms of blind subjects. J. Biol. Rhythm. 2003, 18, 420–429. [Google Scholar] [CrossRef] [PubMed]
- IEA 4E Solid State Lighting Annex Health aspects of solid state lighting products; International Energy Agency, 2014.
Figure 1.
Melatonin-suppression action spectrum, showing the melatonin-suppressive efficacy per photon relative to 480 nm blue light. Original data were sourced from References 40, 41, and 42.
Figure 1.
Melatonin-suppression action spectrum, showing the melatonin-suppressive efficacy per photon relative to 480 nm blue light. Original data were sourced from References 40, 41, and 42.
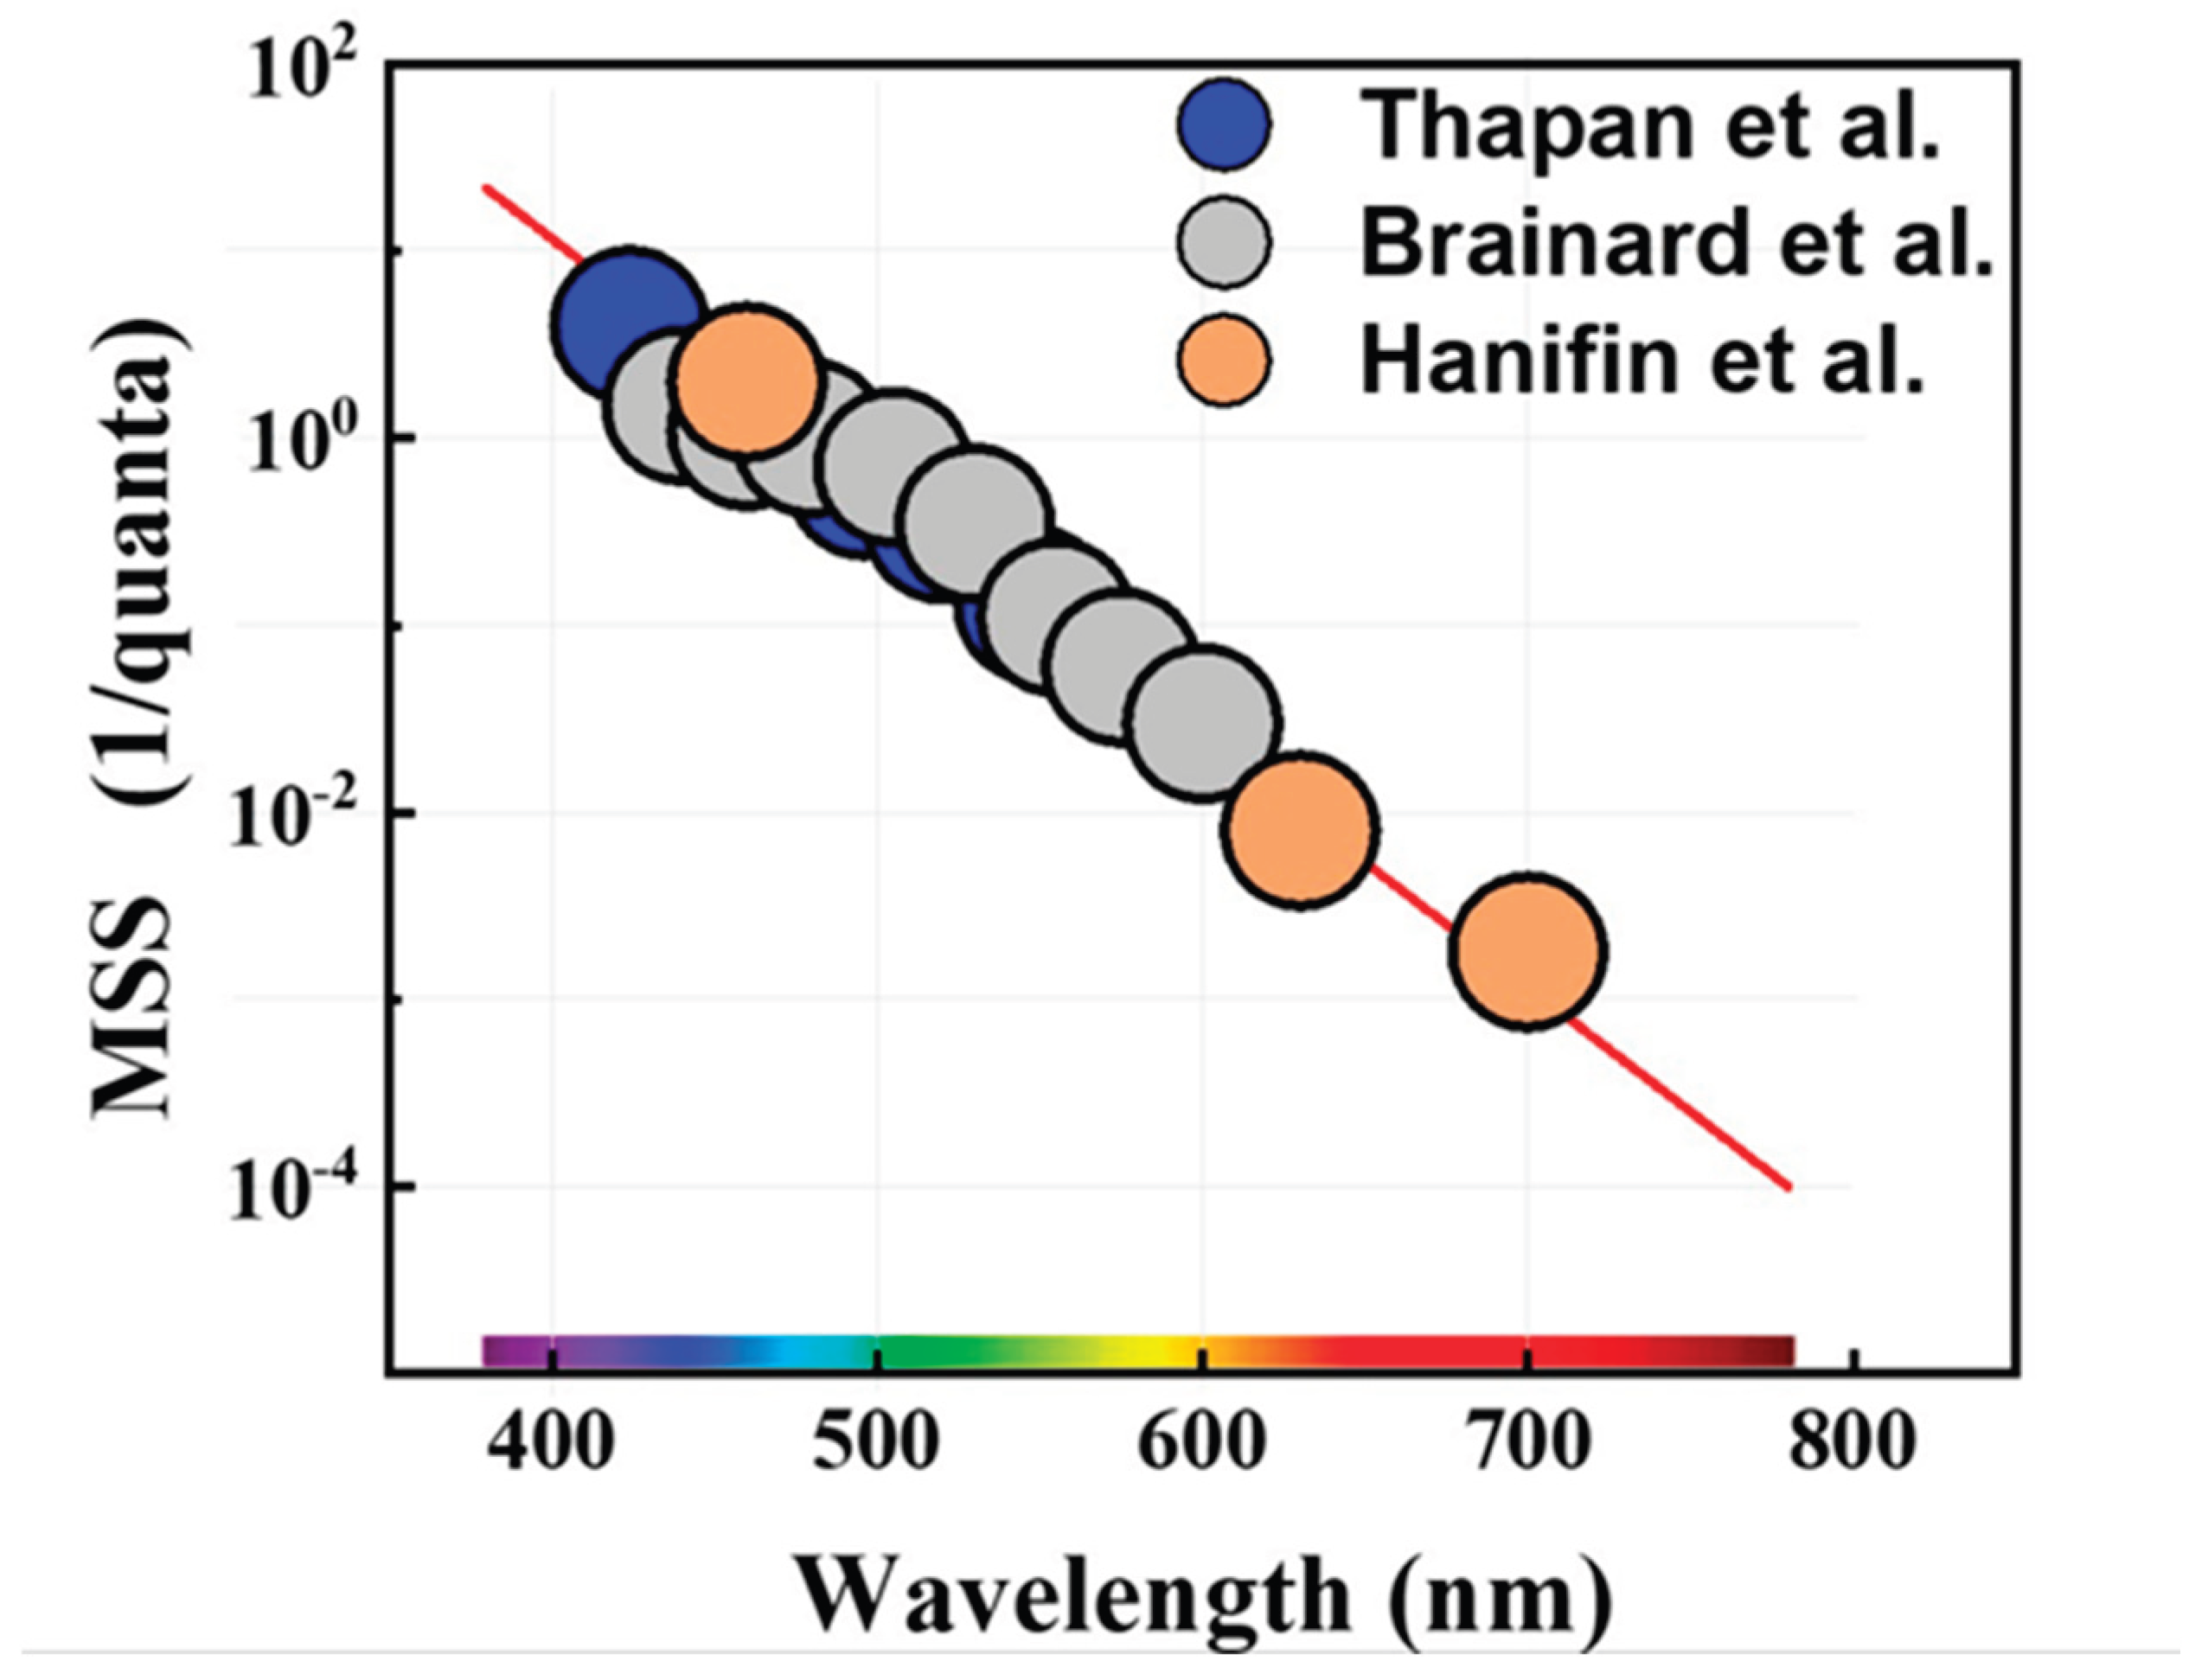
Figure 2.
Melatonin-suppression action spectrum, presenting the efficacy of various visible wavelengths in suppressing melatonin at unit illuminance.
Figure 2.
Melatonin-suppression action spectrum, presenting the efficacy of various visible wavelengths in suppressing melatonin at unit illuminance.
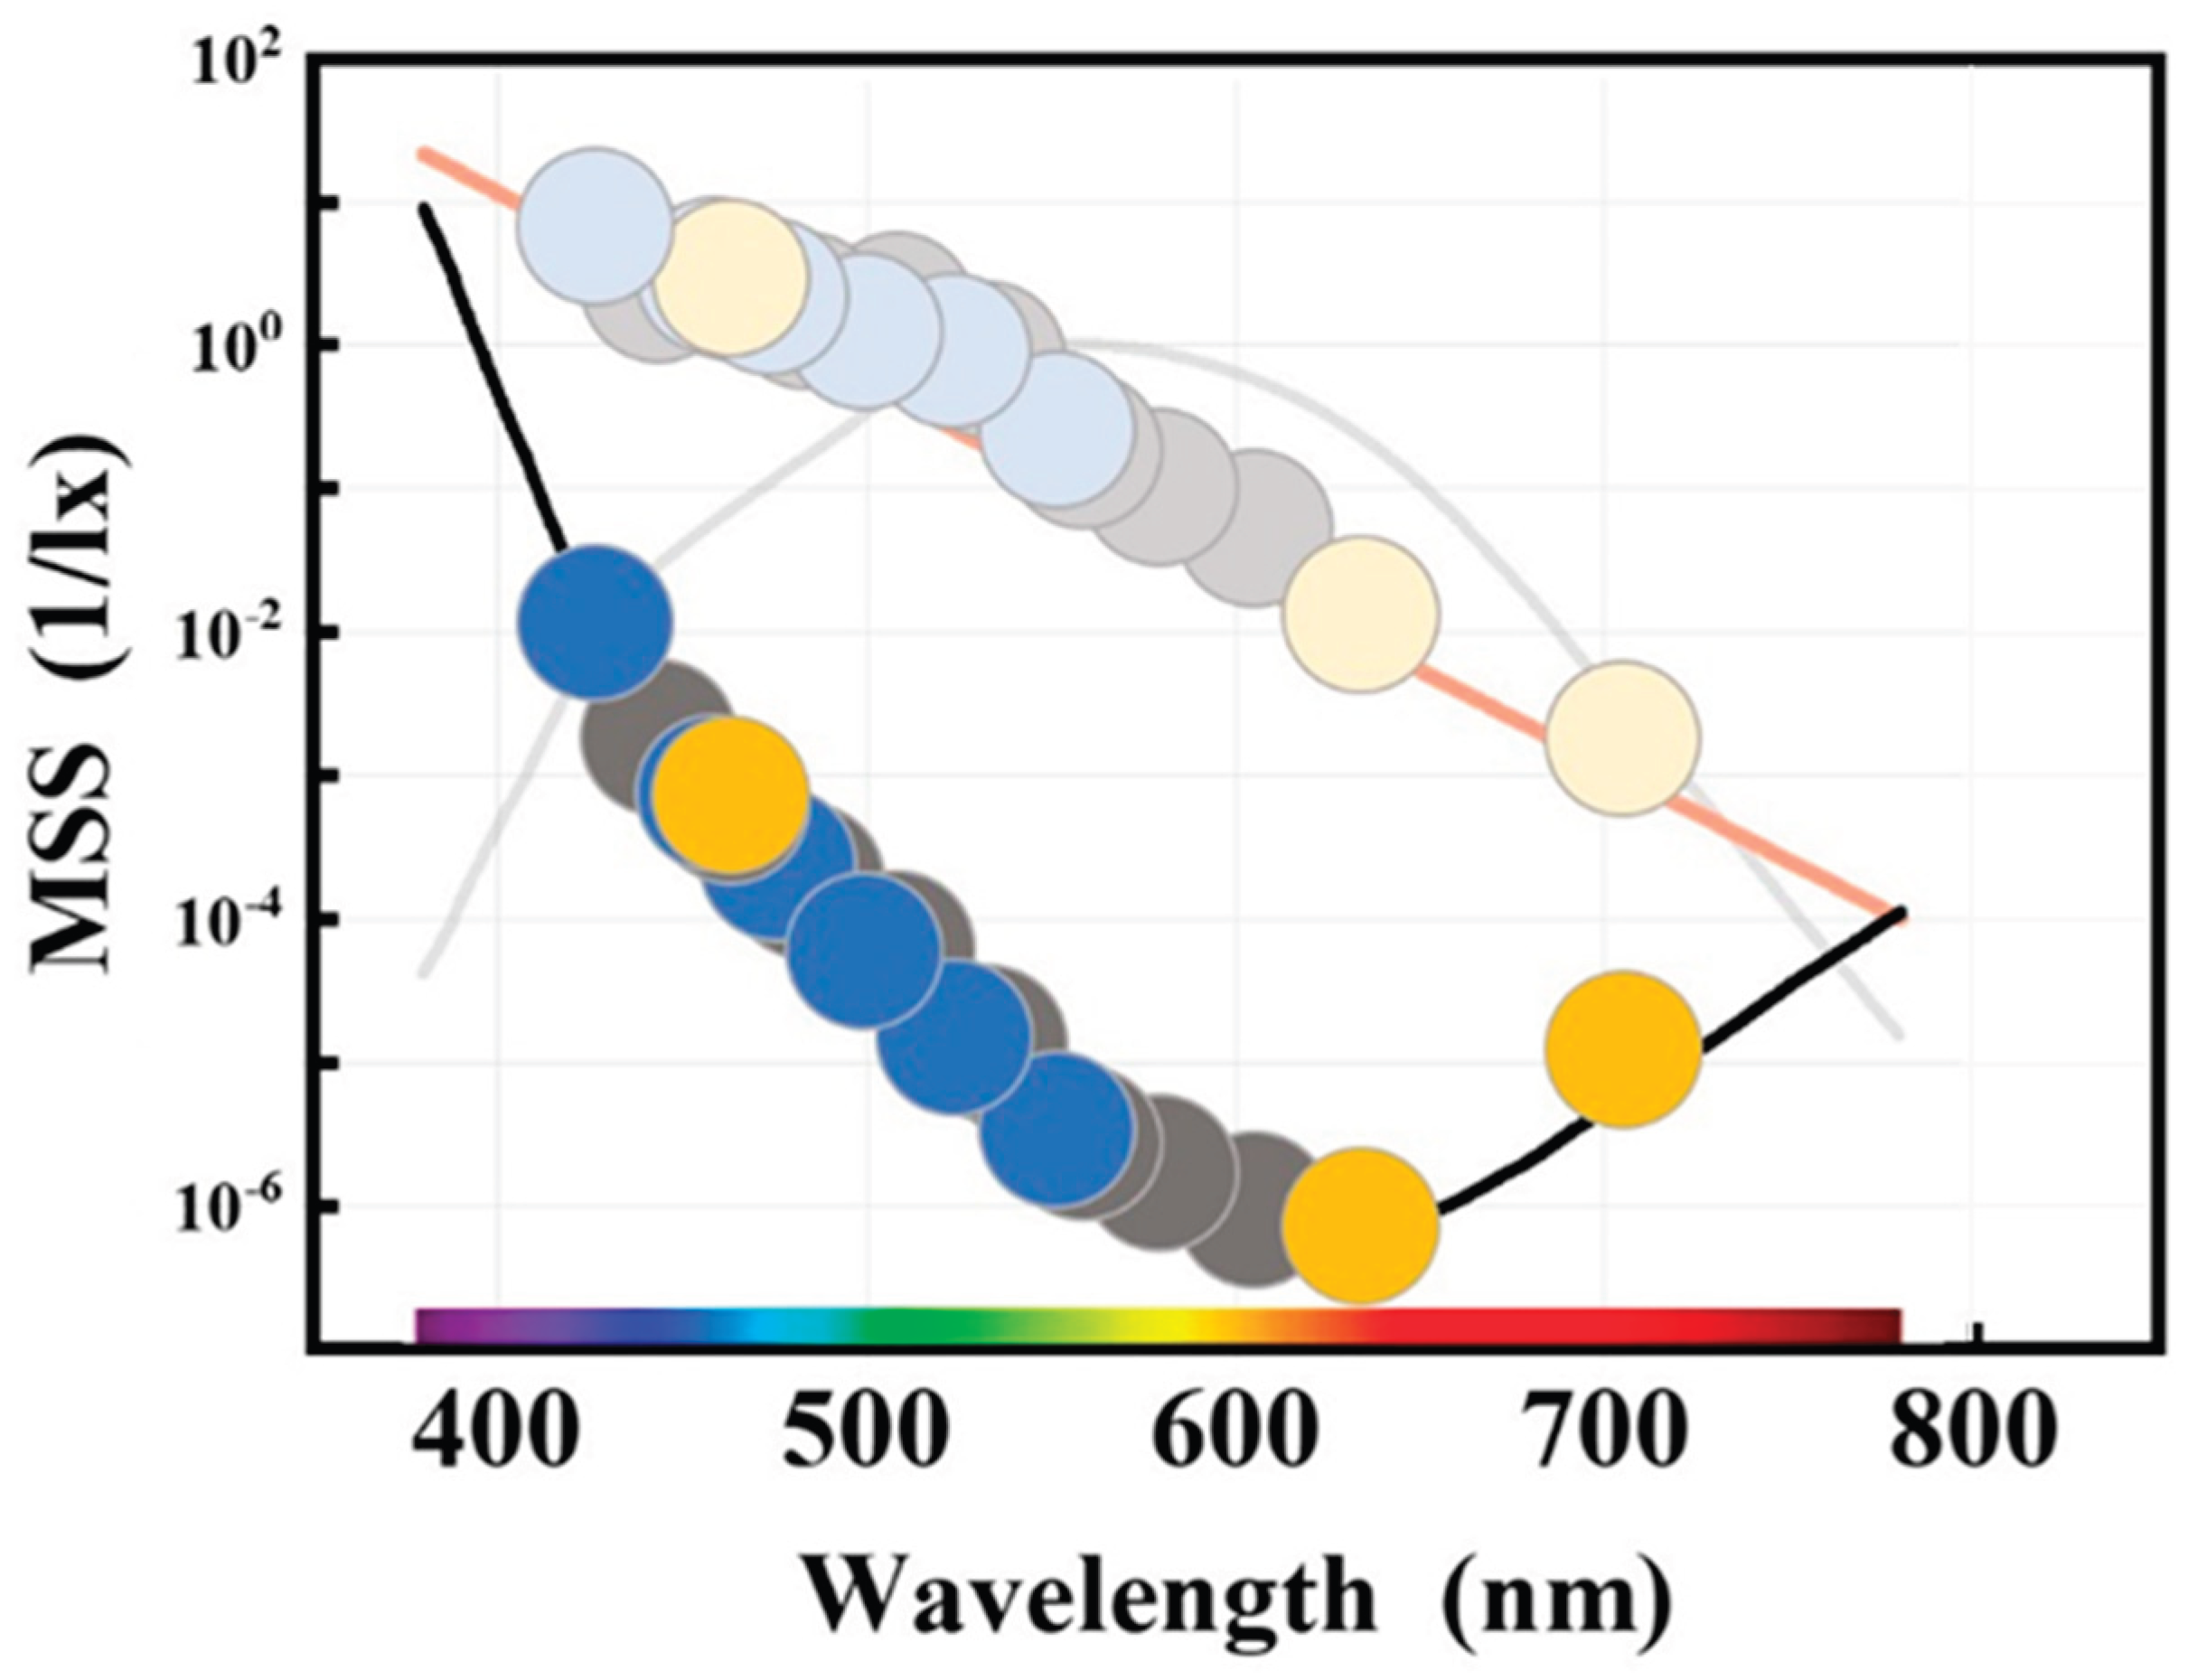
Figure 4.
(a) Blue-light hazard function [46], (b) human visual sensitivity to light, also known as the photopic luminous-efficiency function V(λ) [47], and (c) blue-light hazard function per unit illuminance [48], obtained by dividing the original data in (a) by the curve in (b).
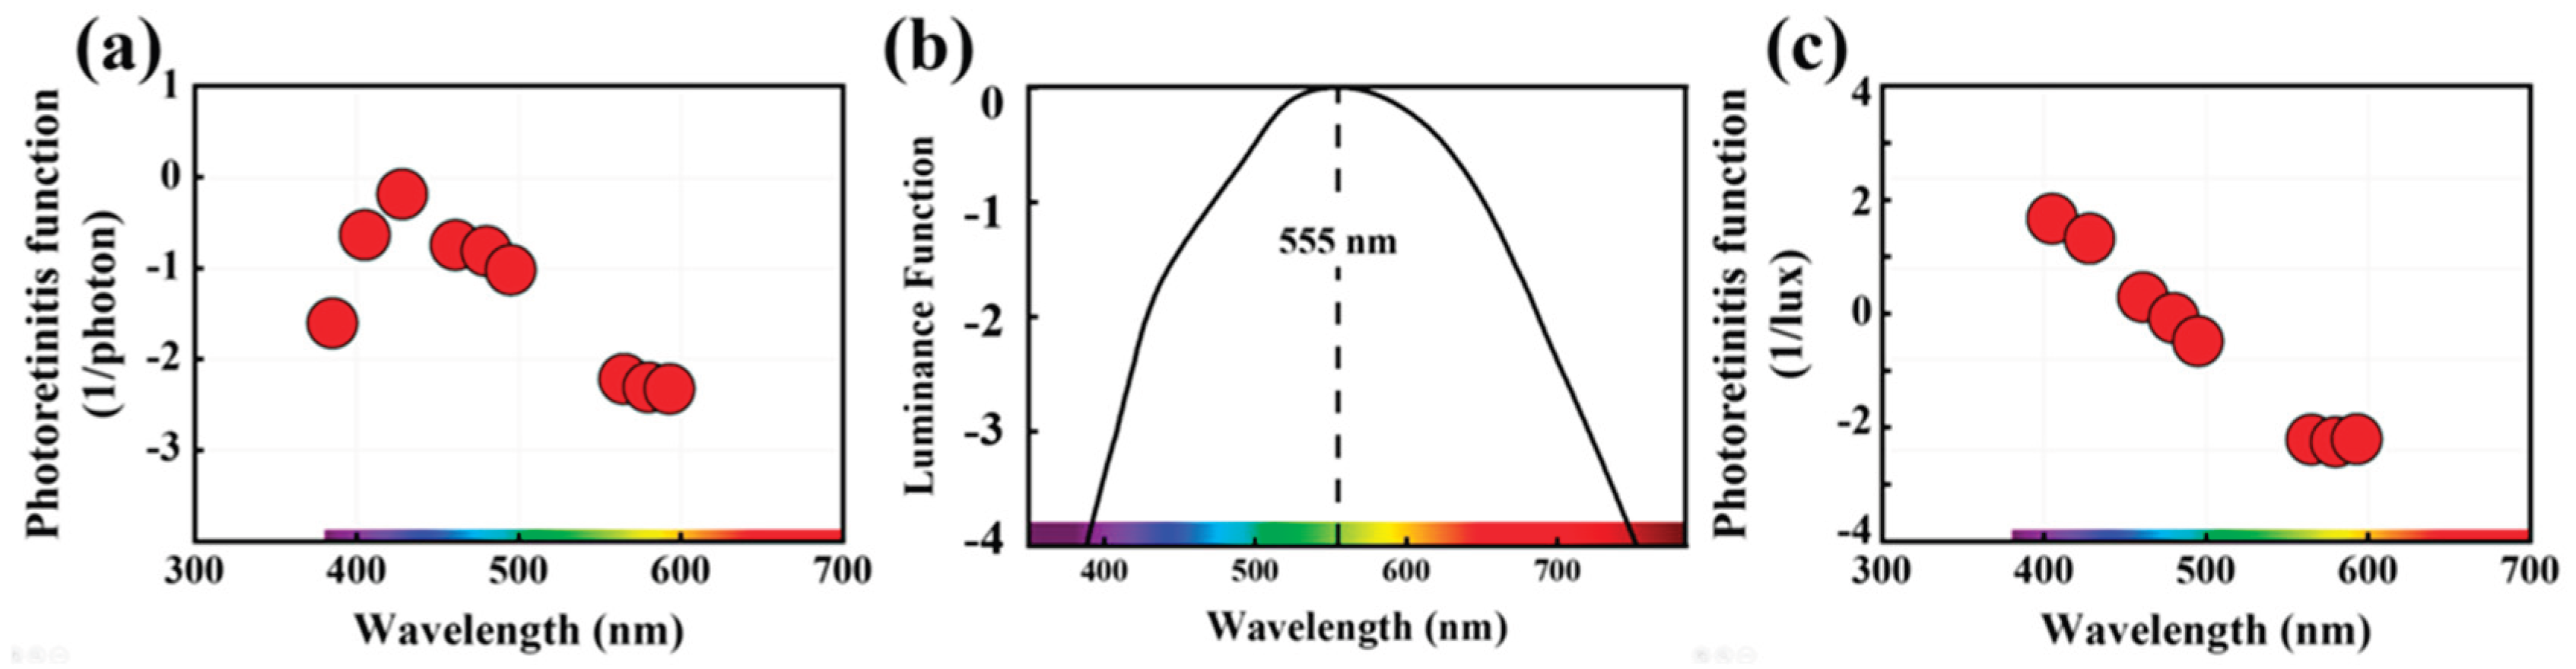
Figure 5.
(a) Melatonin-suppression action spectrum per unit illuminance, (b) blue-light hazard function [48], and (c) retinal-friendly phototherapeutic efficacy spectrum, obtained by dividing the data in (a) by that in (b); 589 nm yellow light exhibits the optimal phototherapeutic effect per unit retinal hazard.
Figure 5.
(a) Melatonin-suppression action spectrum per unit illuminance, (b) blue-light hazard function [48], and (c) retinal-friendly phototherapeutic efficacy spectrum, obtained by dividing the data in (a) by that in (b); 589 nm yellow light exhibits the optimal phototherapeutic effect per unit retinal hazard.
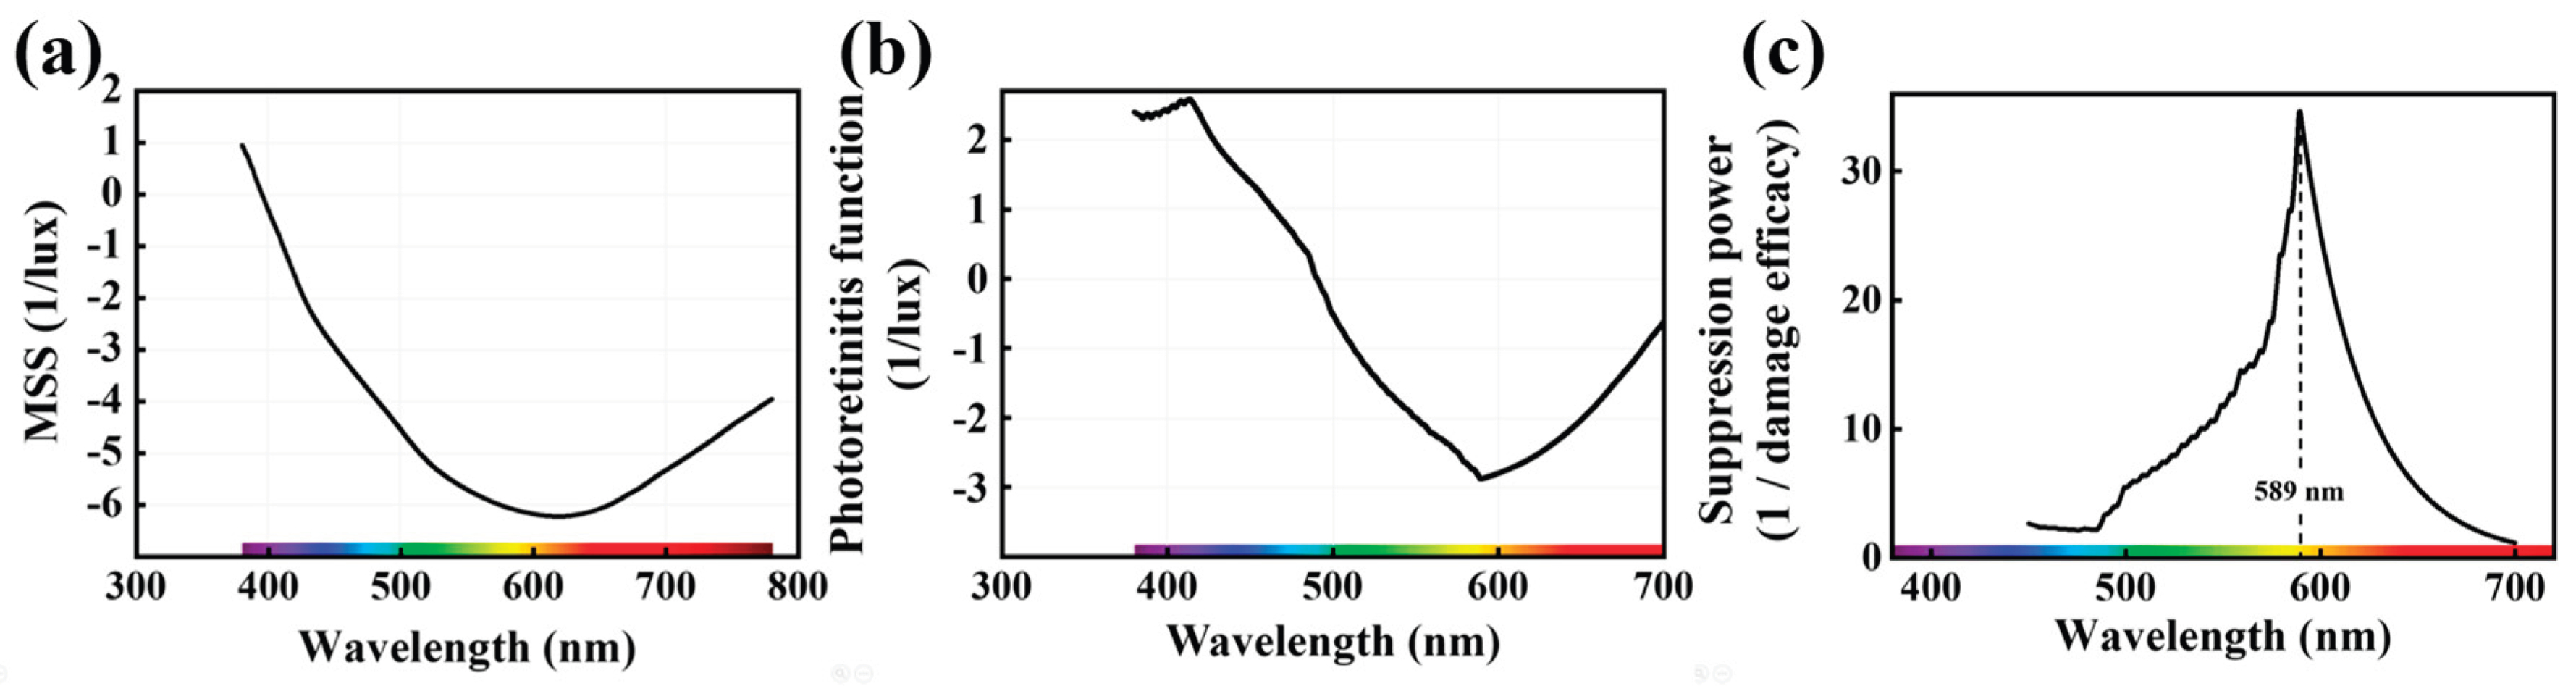
Figure 6.
Schematic diagram of the retinal-friendly phototherapy device, employing the following guest dyes: Ir(2-phq)₃, a 1:1 blend of.
Figure 6.
Schematic diagram of the retinal-friendly phototherapy device, employing the following guest dyes: Ir(2-phq)₃, a 1:1 blend of.
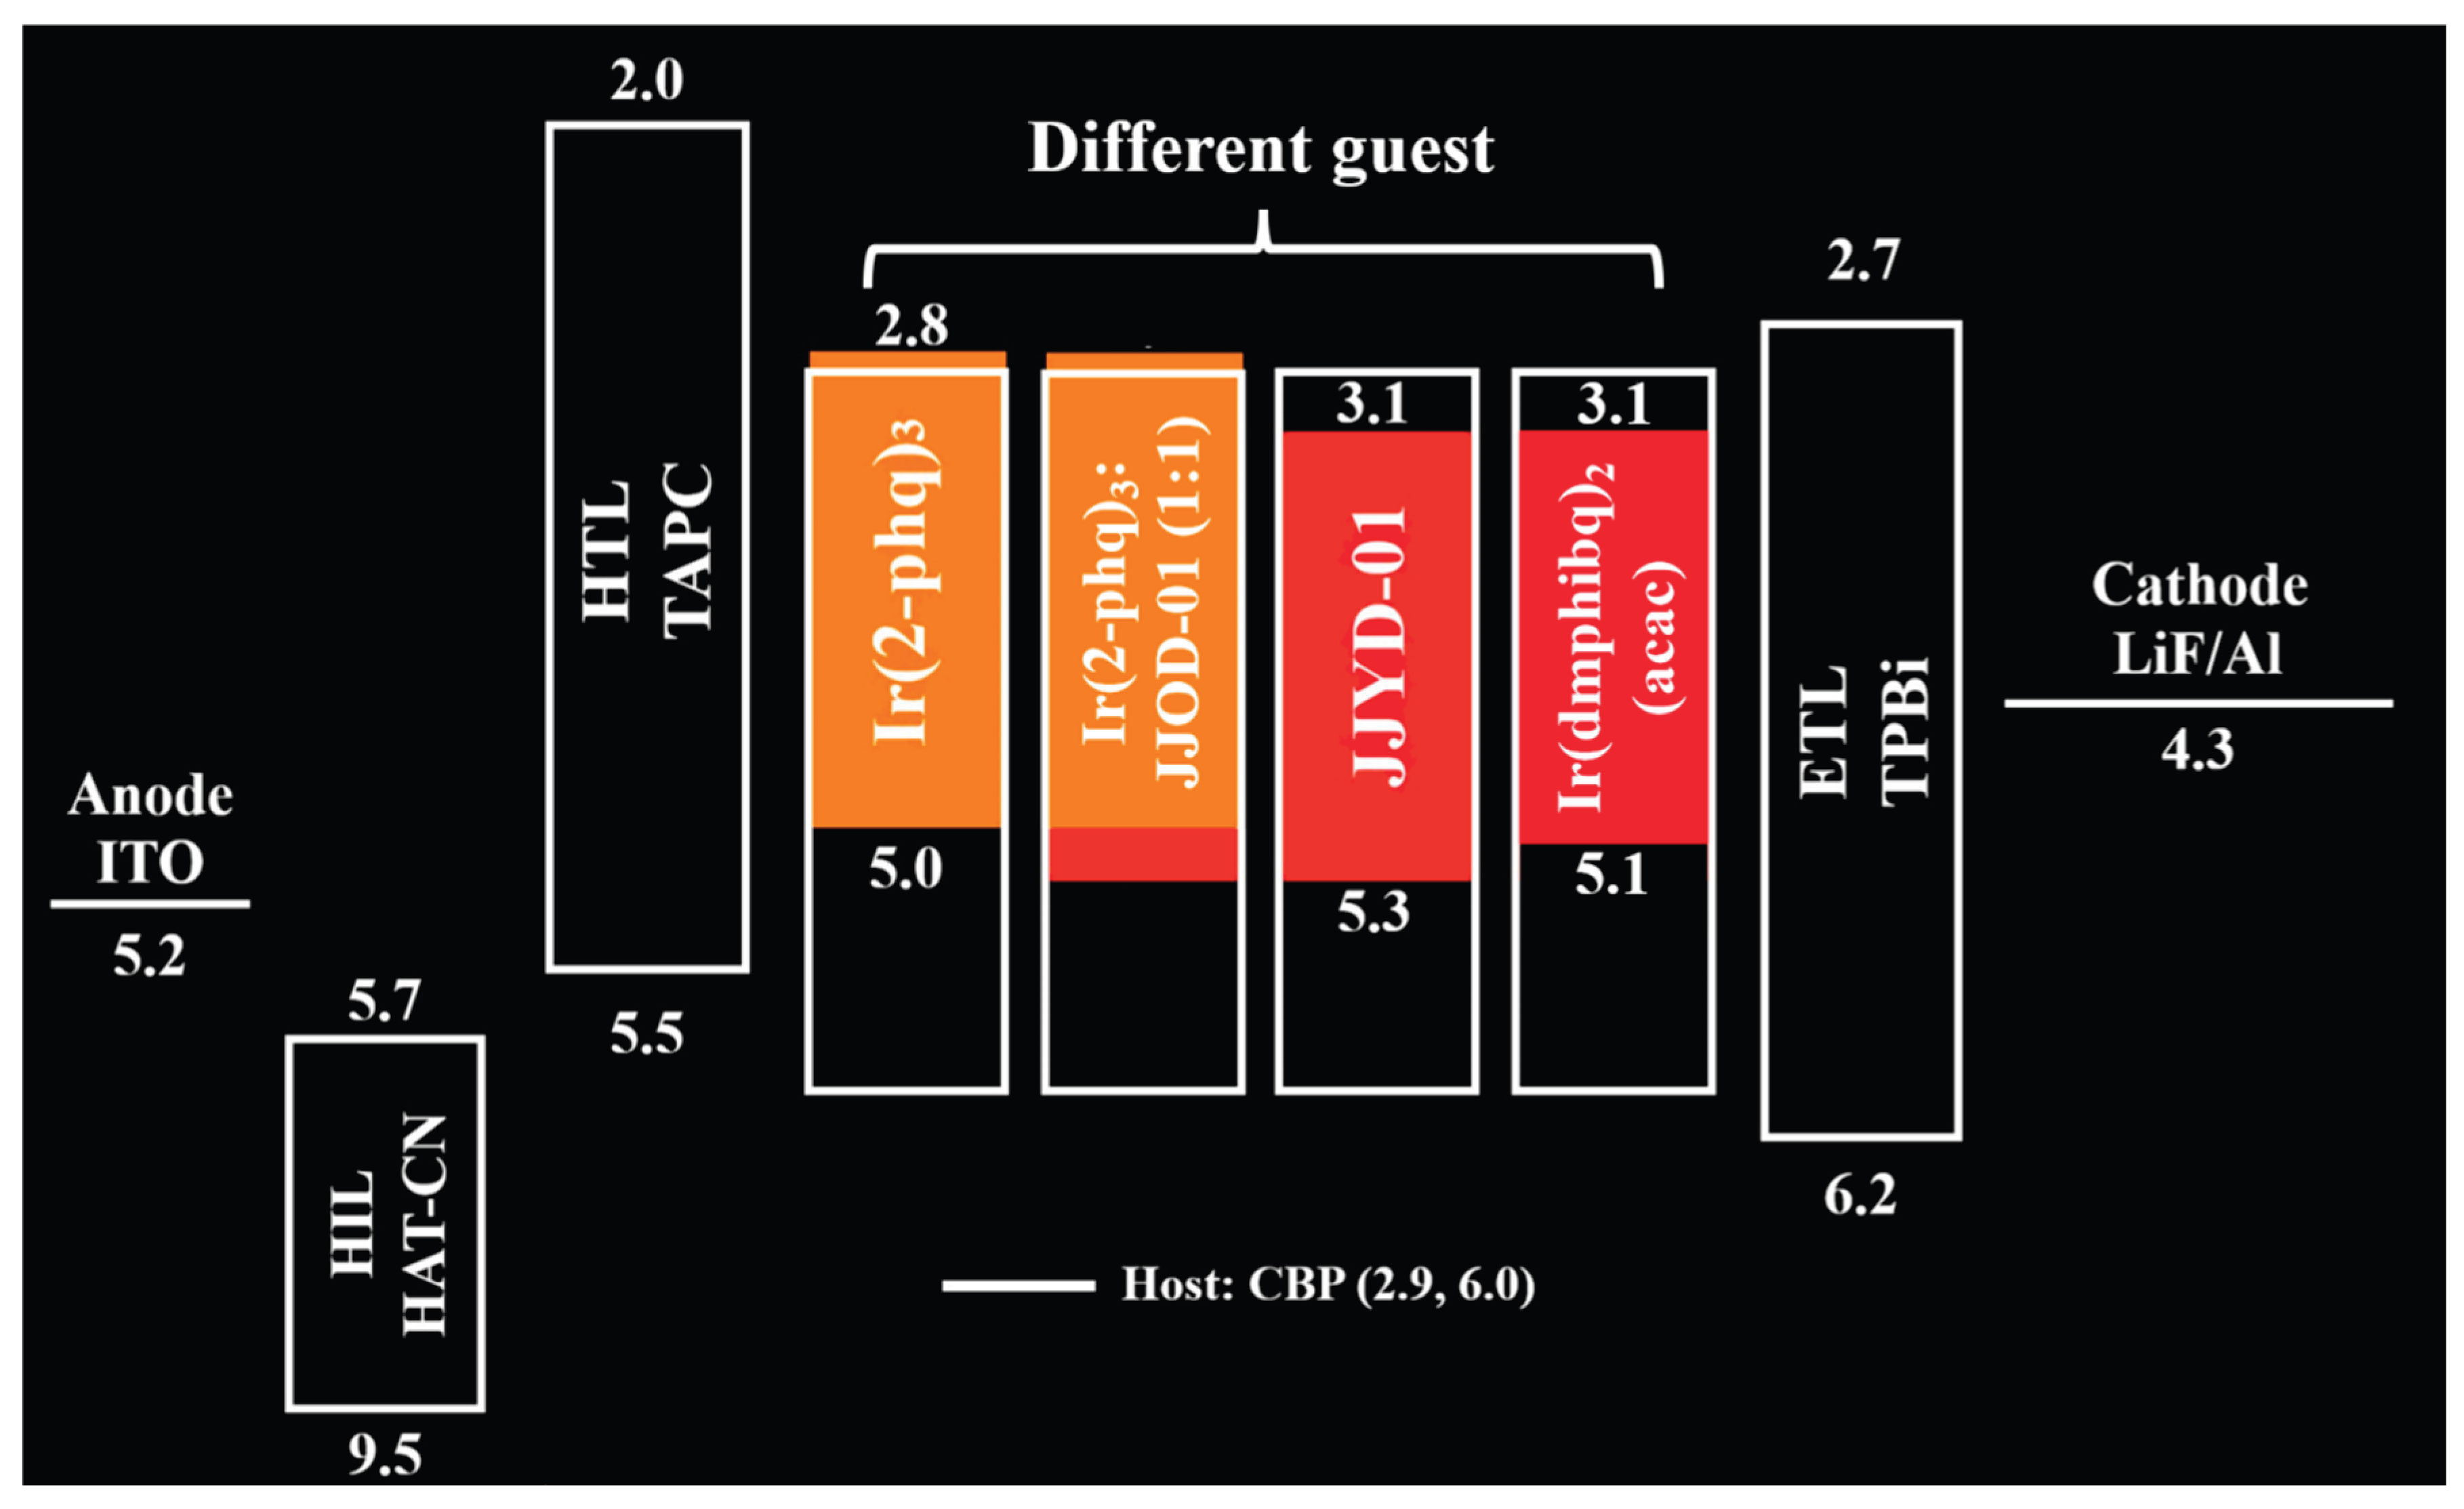
Figure 7.
The effect of retina-friendly dye series on the light color and color temperature of light therapy components.
Figure 7.
The effect of retina-friendly dye series on the light color and color temperature of light therapy components.
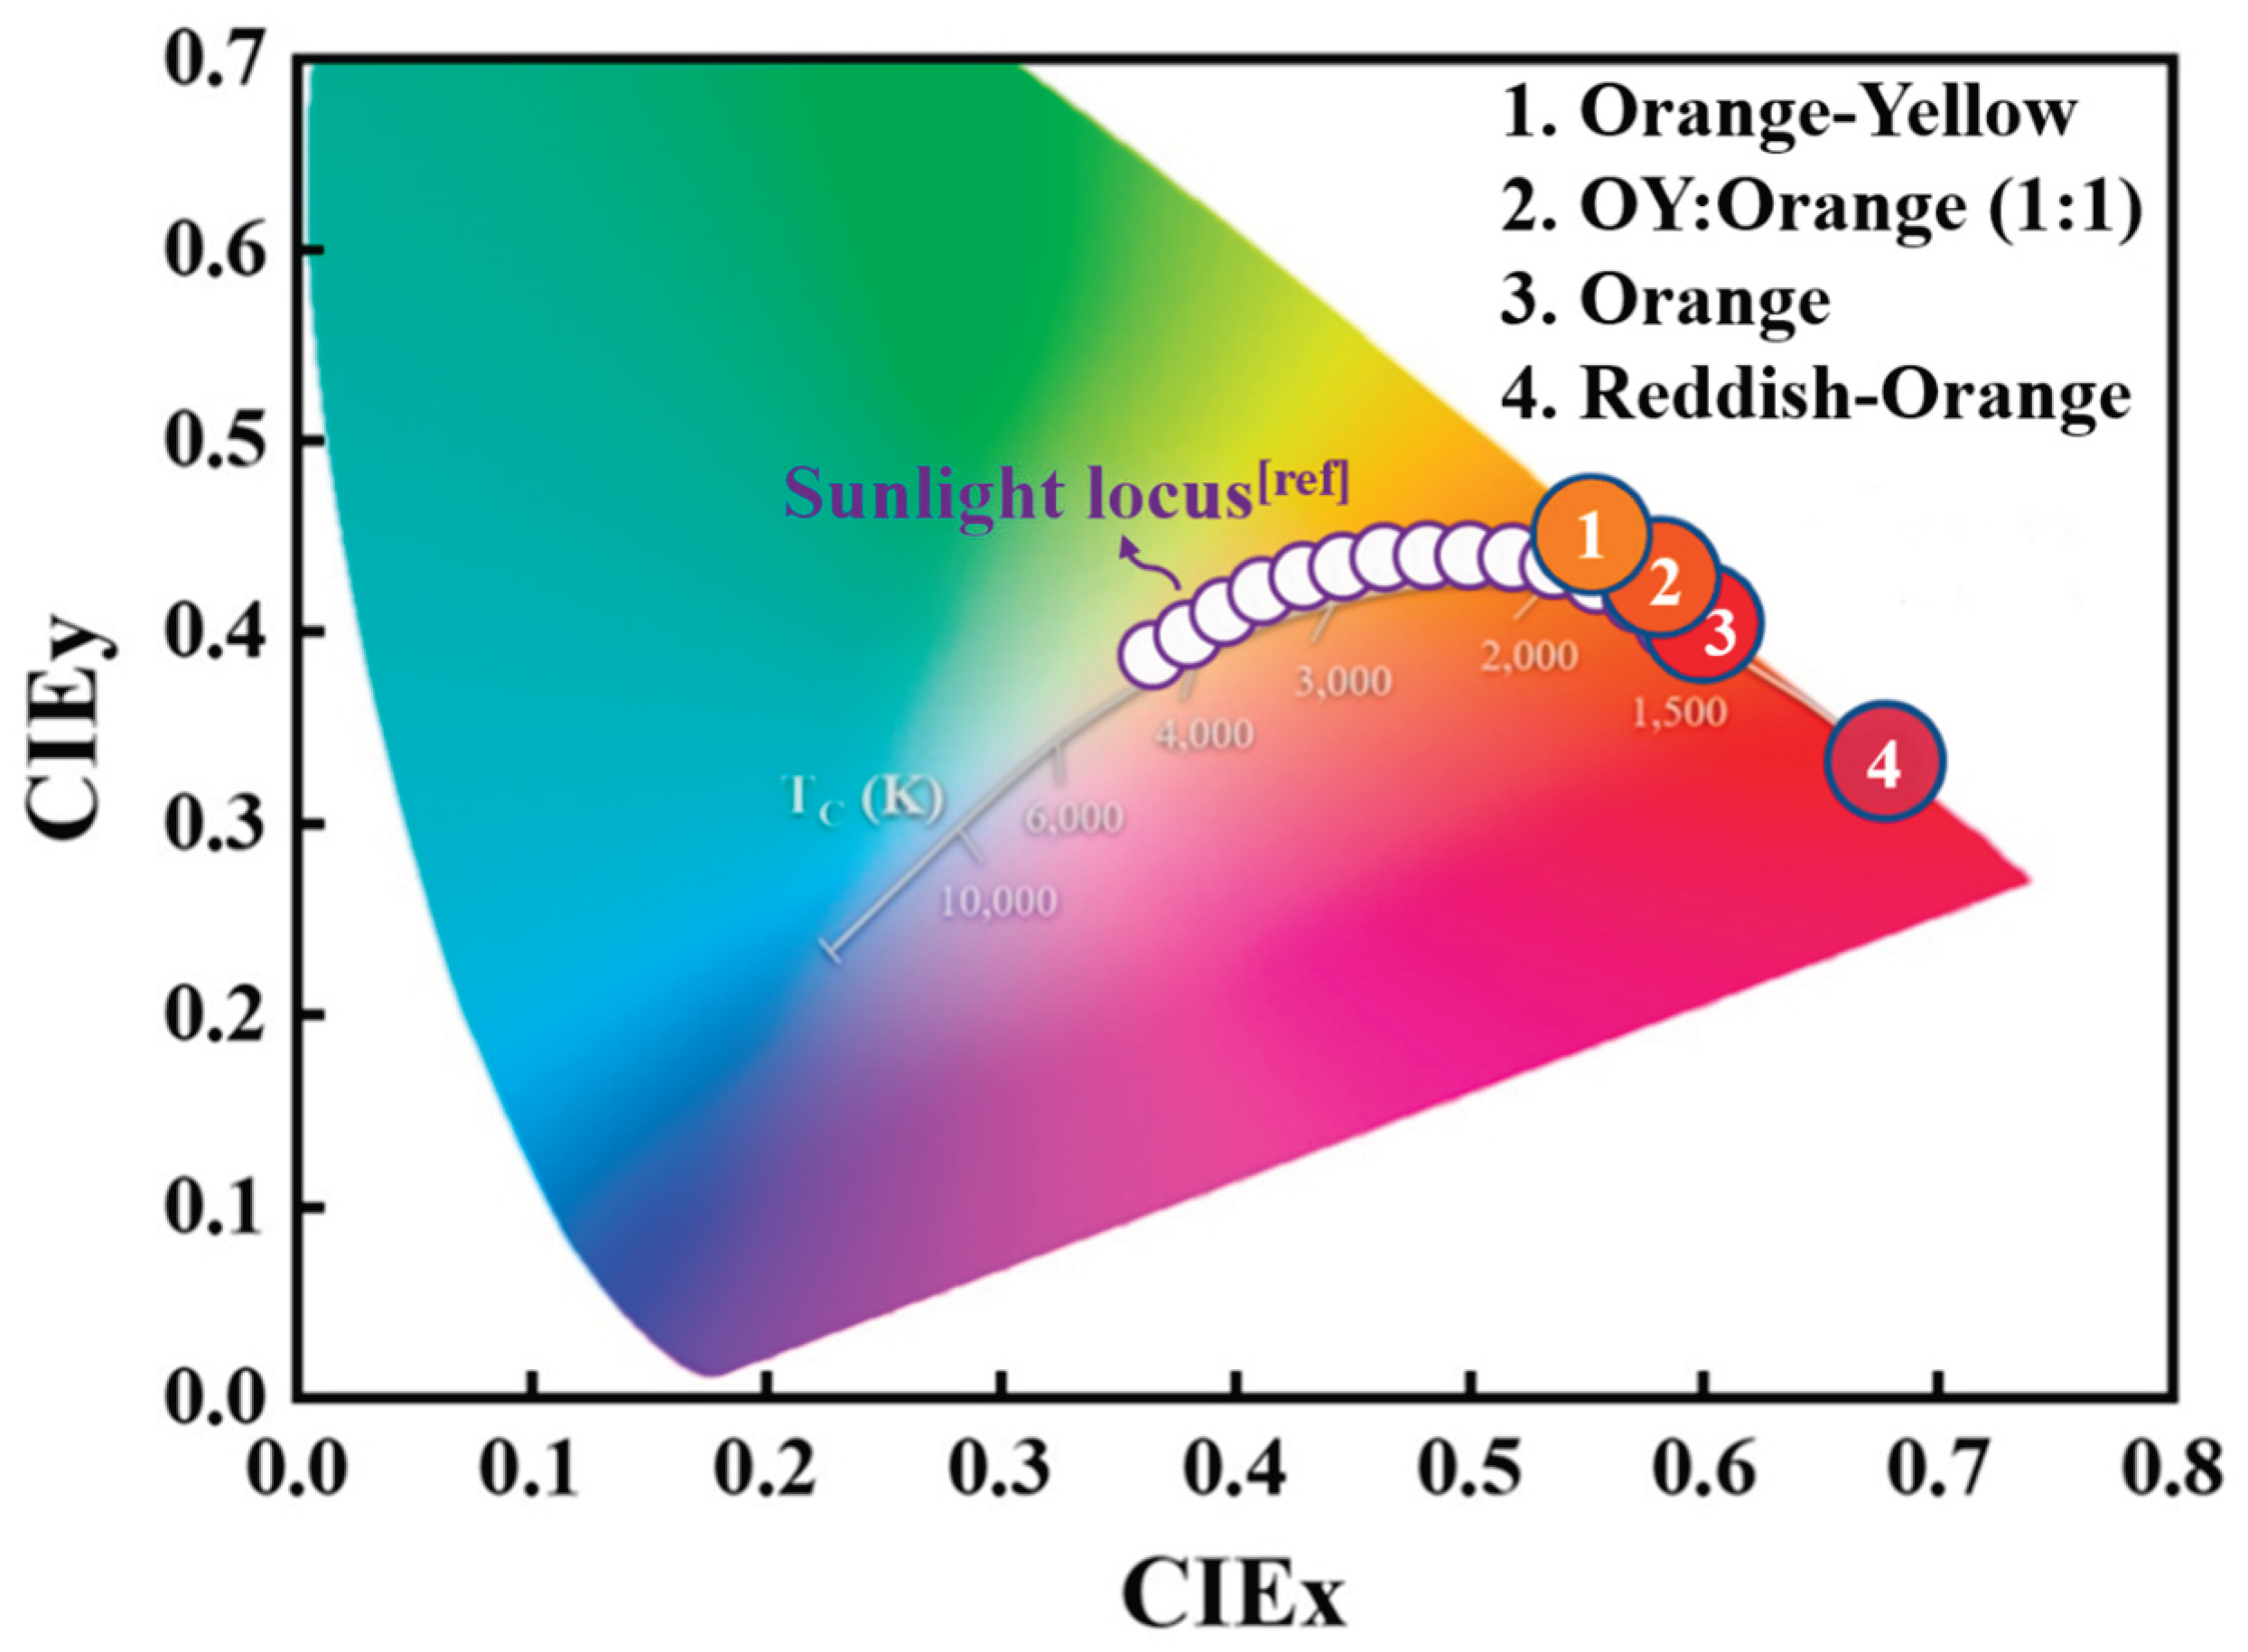
Figure 8.
Response curve of melatonin suppression sensibility with respect to the exposure time of blue light (460nm) at night, wherein the experimental data at 1.5 and 6.5 h are adopted from references 1 and 10, respectively.
Figure 8.
Response curve of melatonin suppression sensibility with respect to the exposure time of blue light (460nm) at night, wherein the experimental data at 1.5 and 6.5 h are adopted from references 1 and 10, respectively.
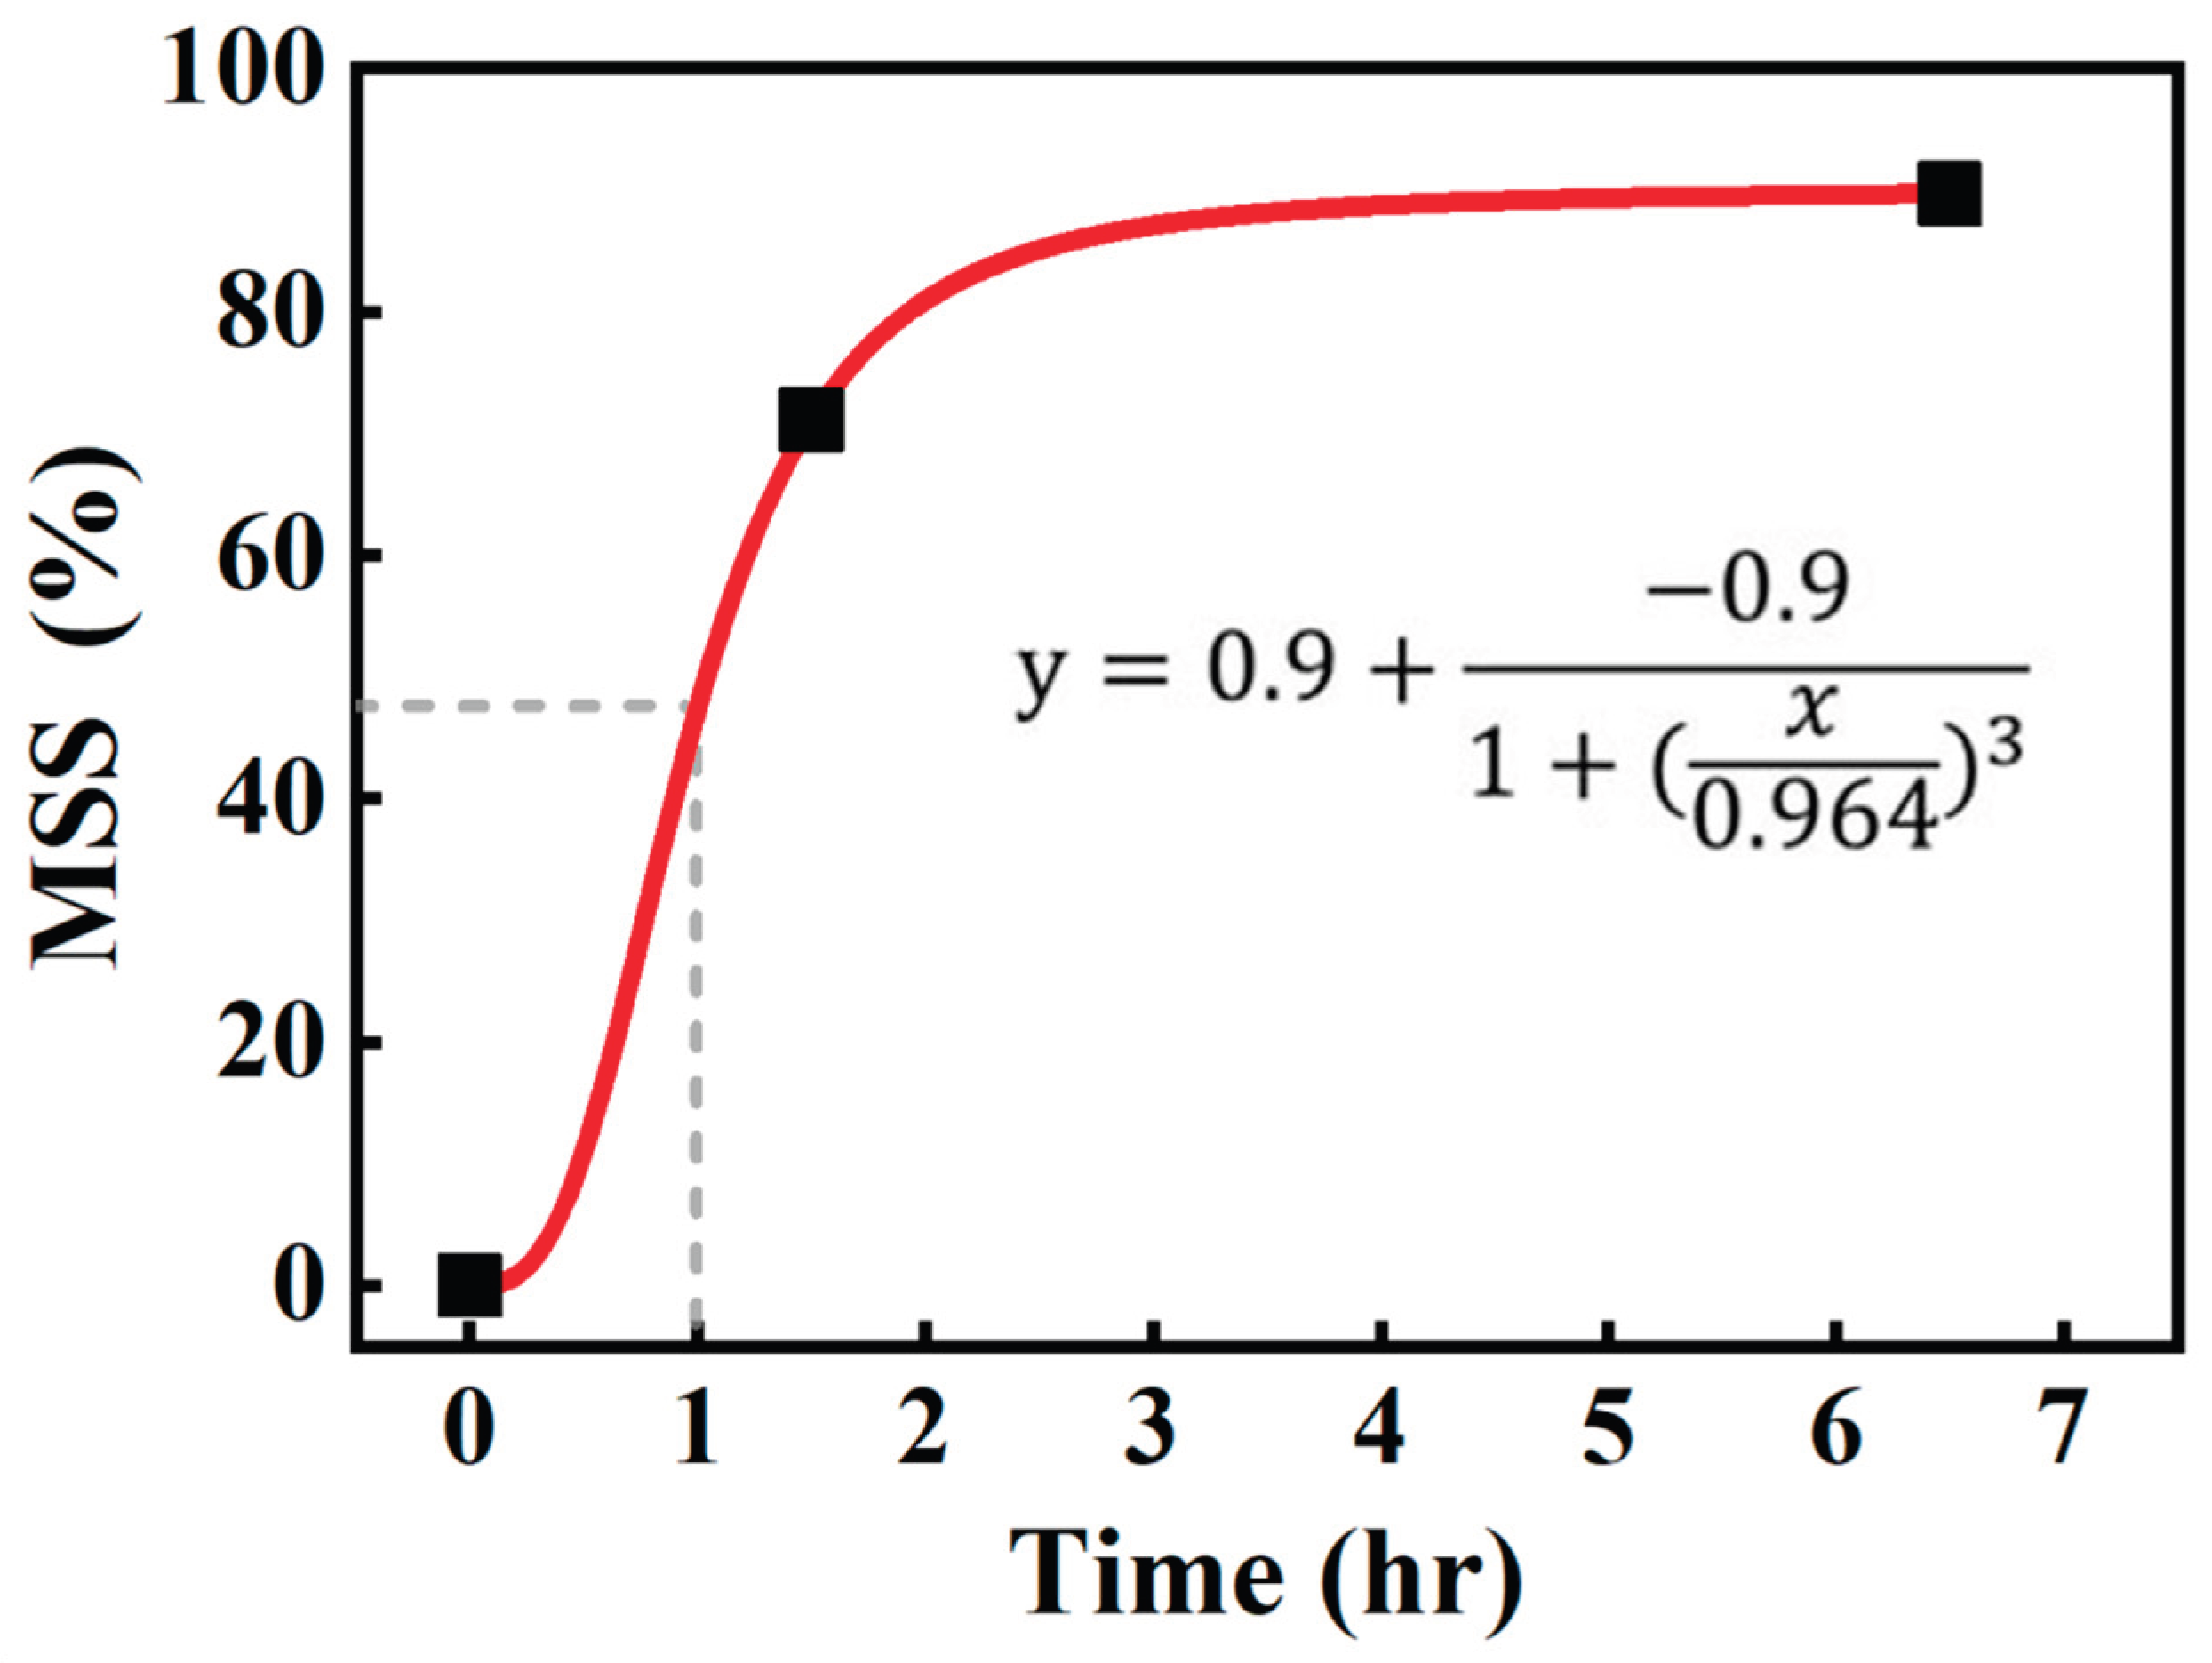
Figure 9.
The effect of light exposure time on melatonin suppression, with light source consisting of monochromatic light with wavelengths ranging from 460 to 760 nm.
Figure 9.
The effect of light exposure time on melatonin suppression, with light source consisting of monochromatic light with wavelengths ranging from 460 to 760 nm.
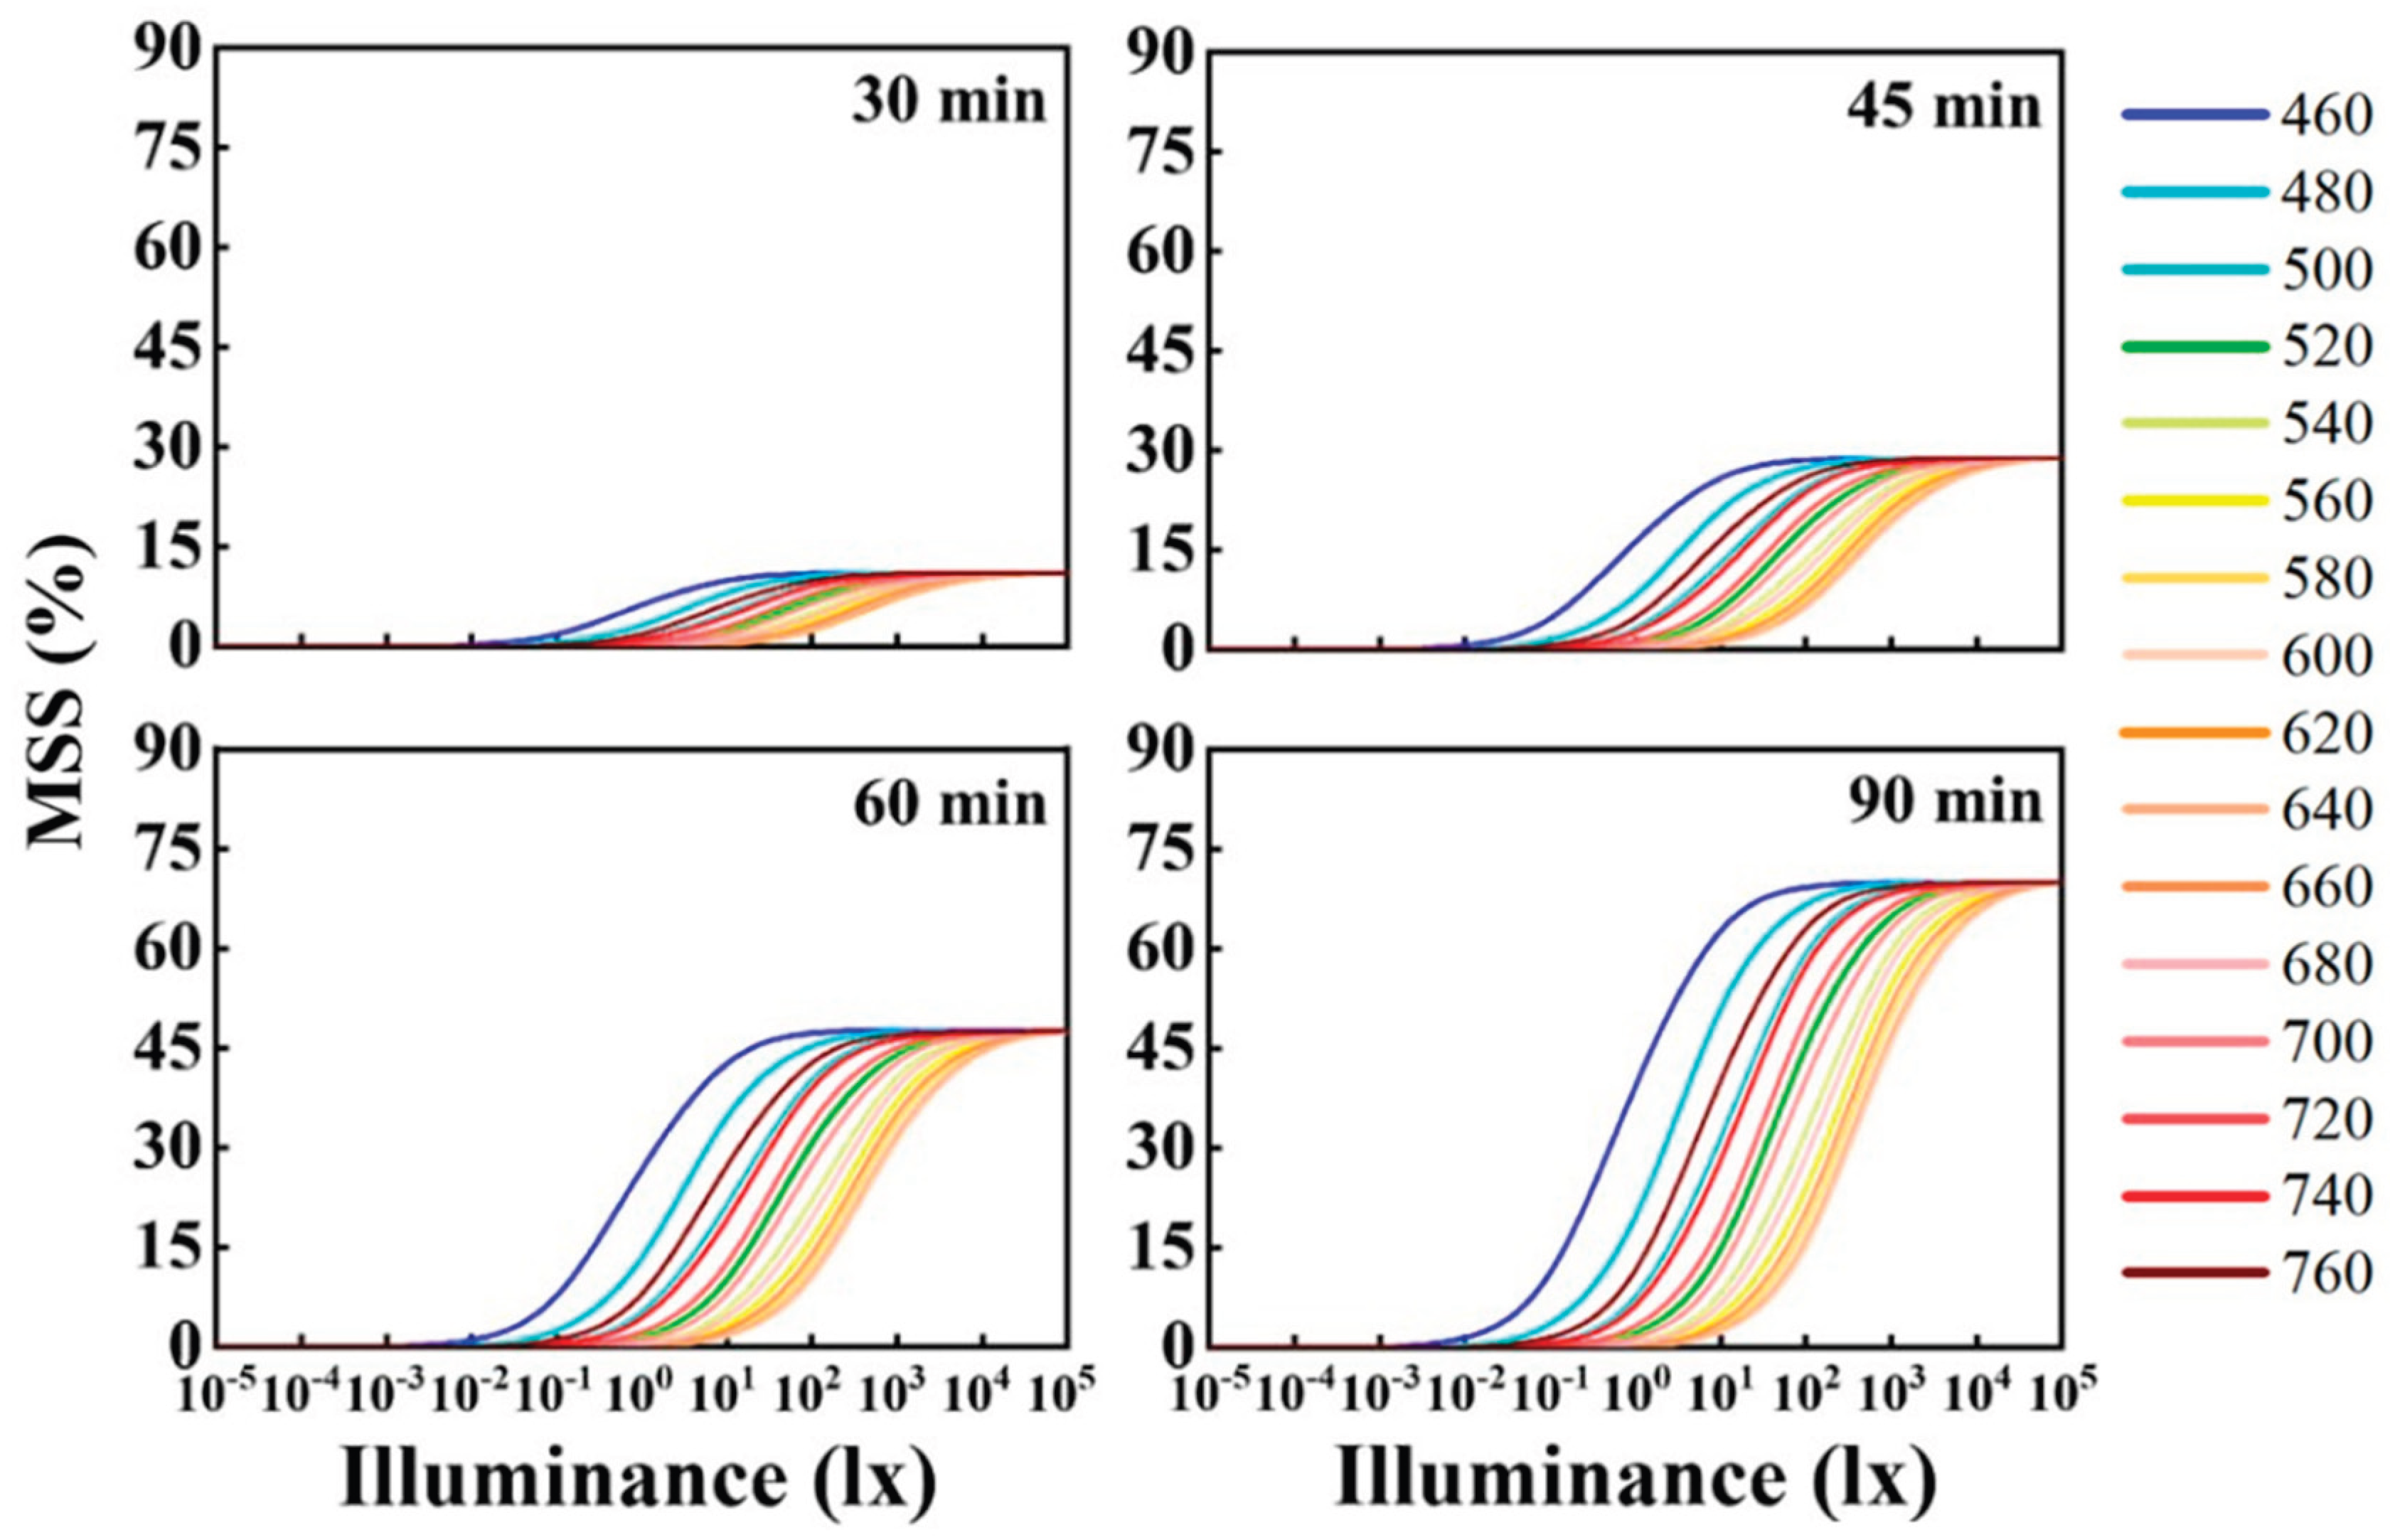
Figure 10.
The effect of light therapy light source color temperature on melatonin suppression. Here, the light source is a blackbody, and the exposure time is 90 minutes.
Figure 10.
The effect of light therapy light source color temperature on melatonin suppression. Here, the light source is a blackbody, and the exposure time is 90 minutes.
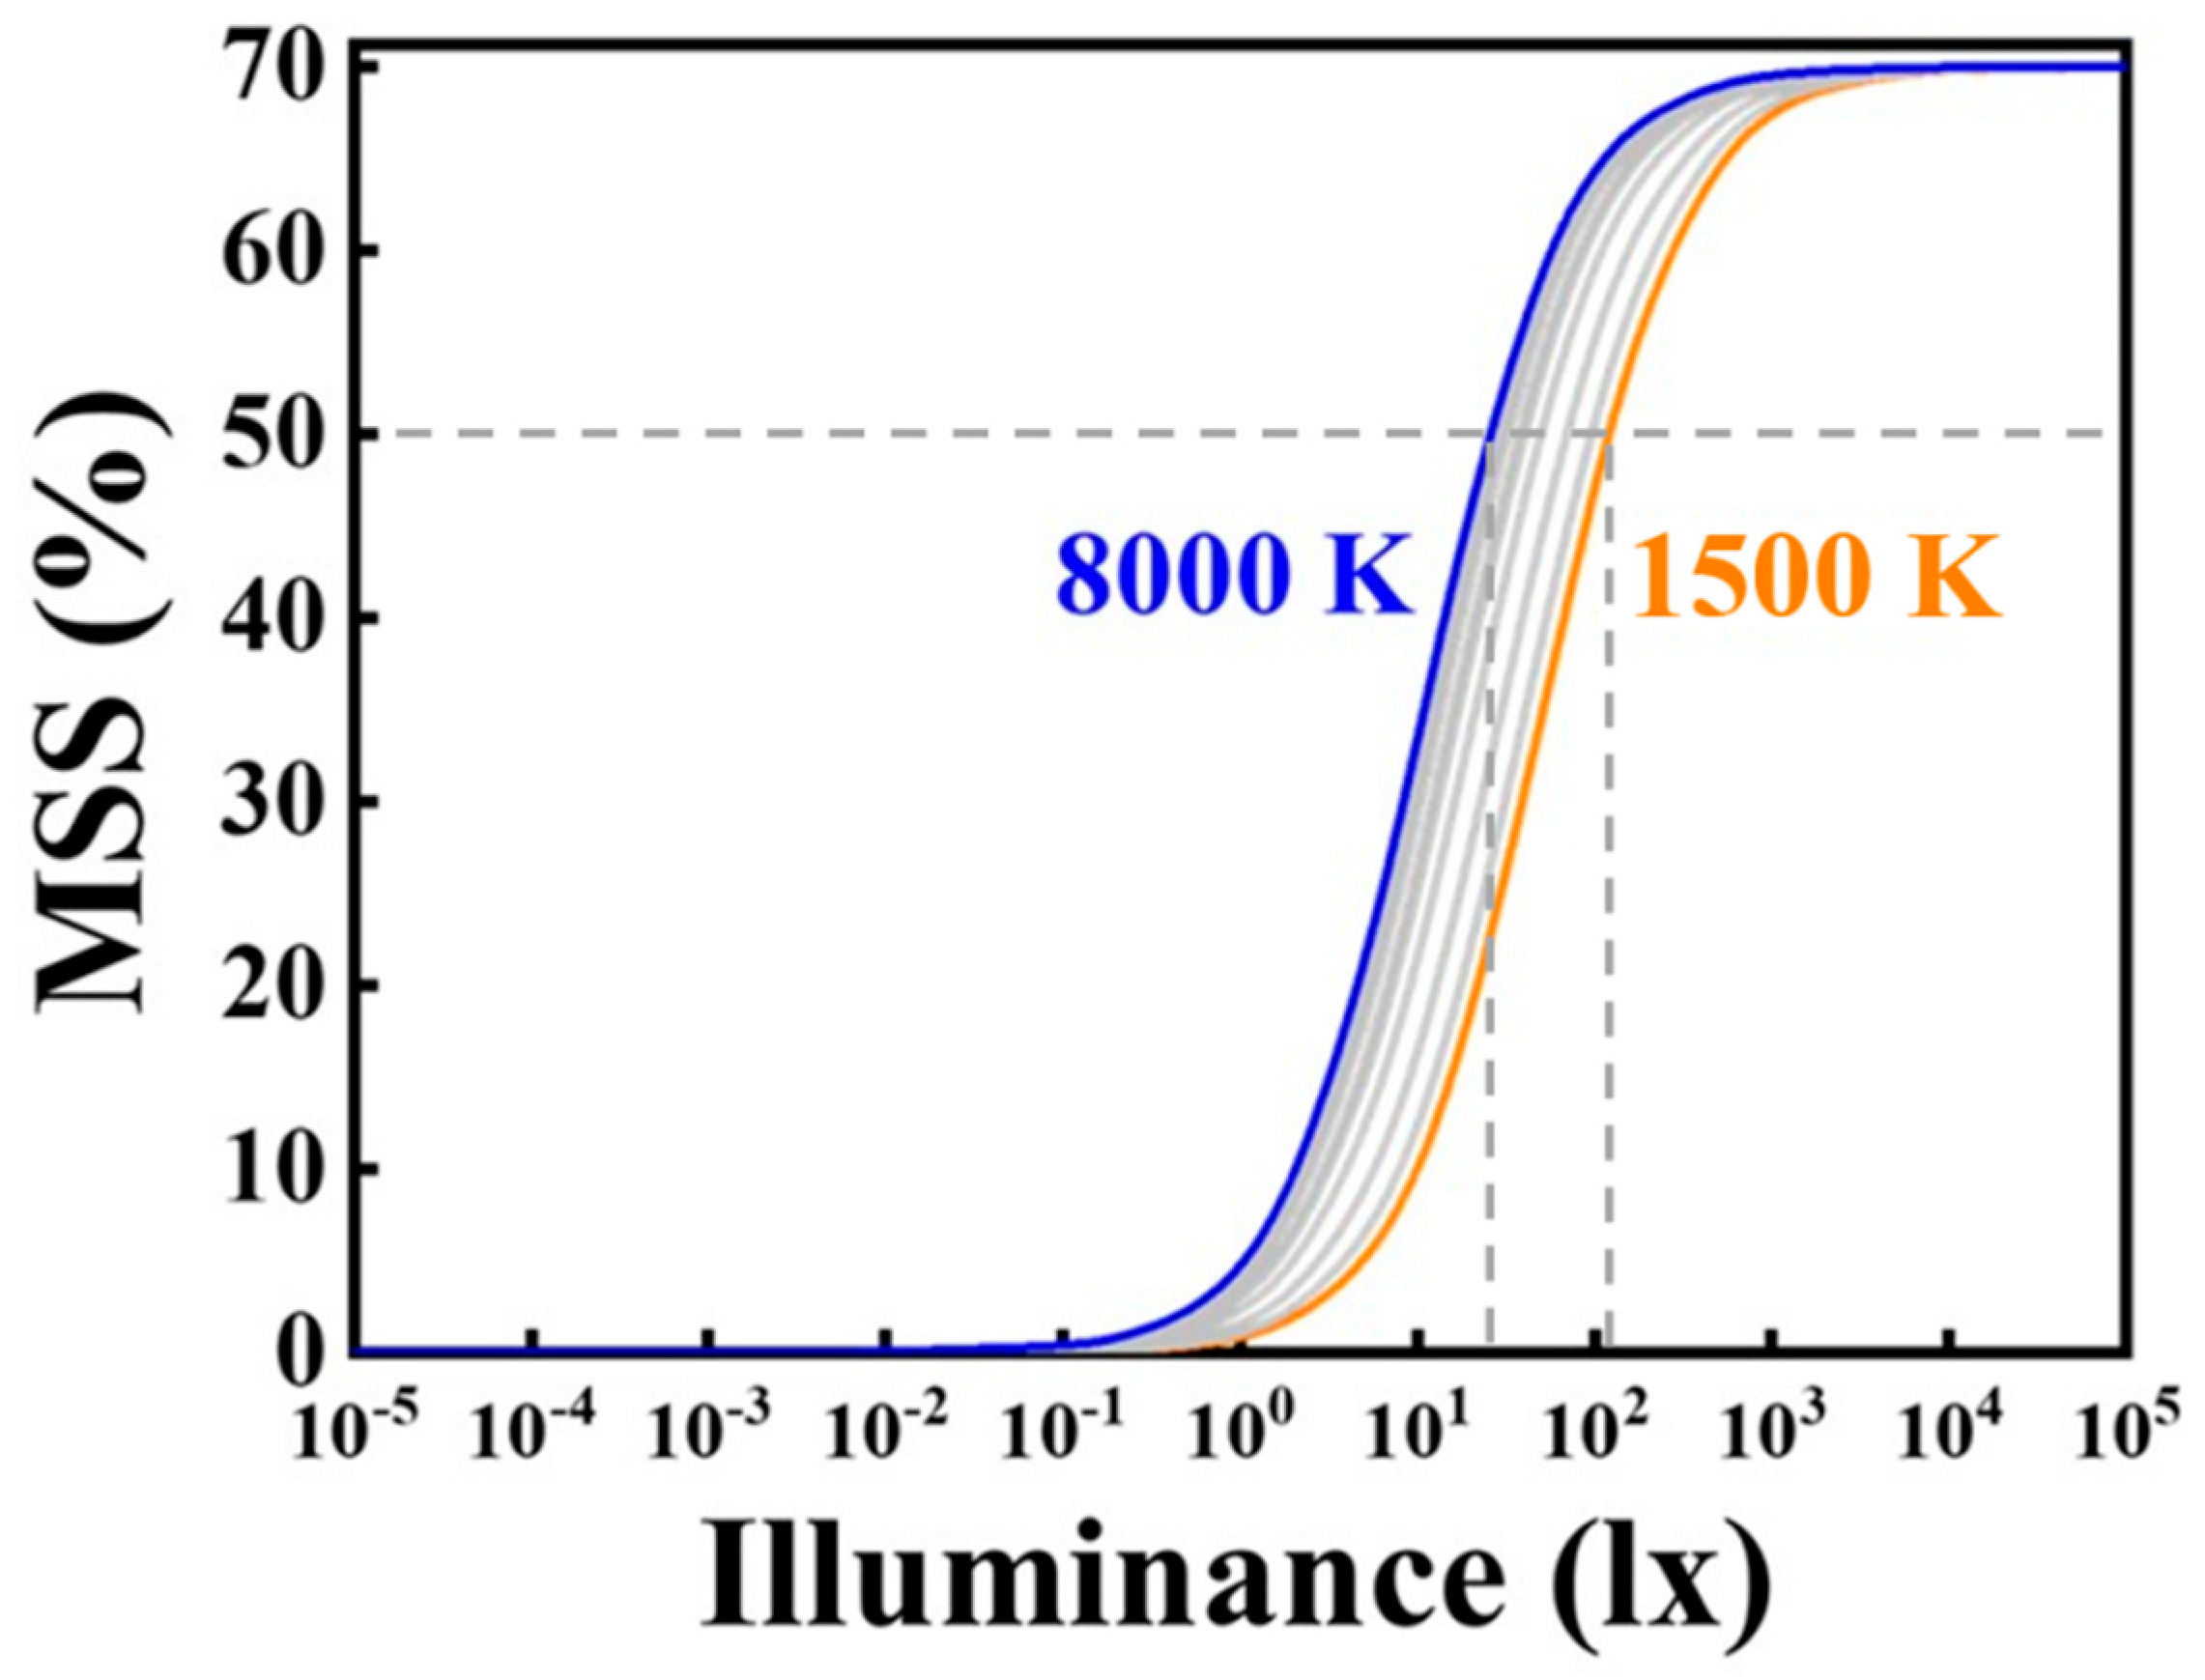
Figure 11.
The effect of light source color temperature and light therapy duration on melatonin suppression, with the condition that the highest illuminance within the retinal permissible exposure limit is selected.
Figure 11.
The effect of light source color temperature and light therapy duration on melatonin suppression, with the condition that the highest illuminance within the retinal permissible exposure limit is selected.
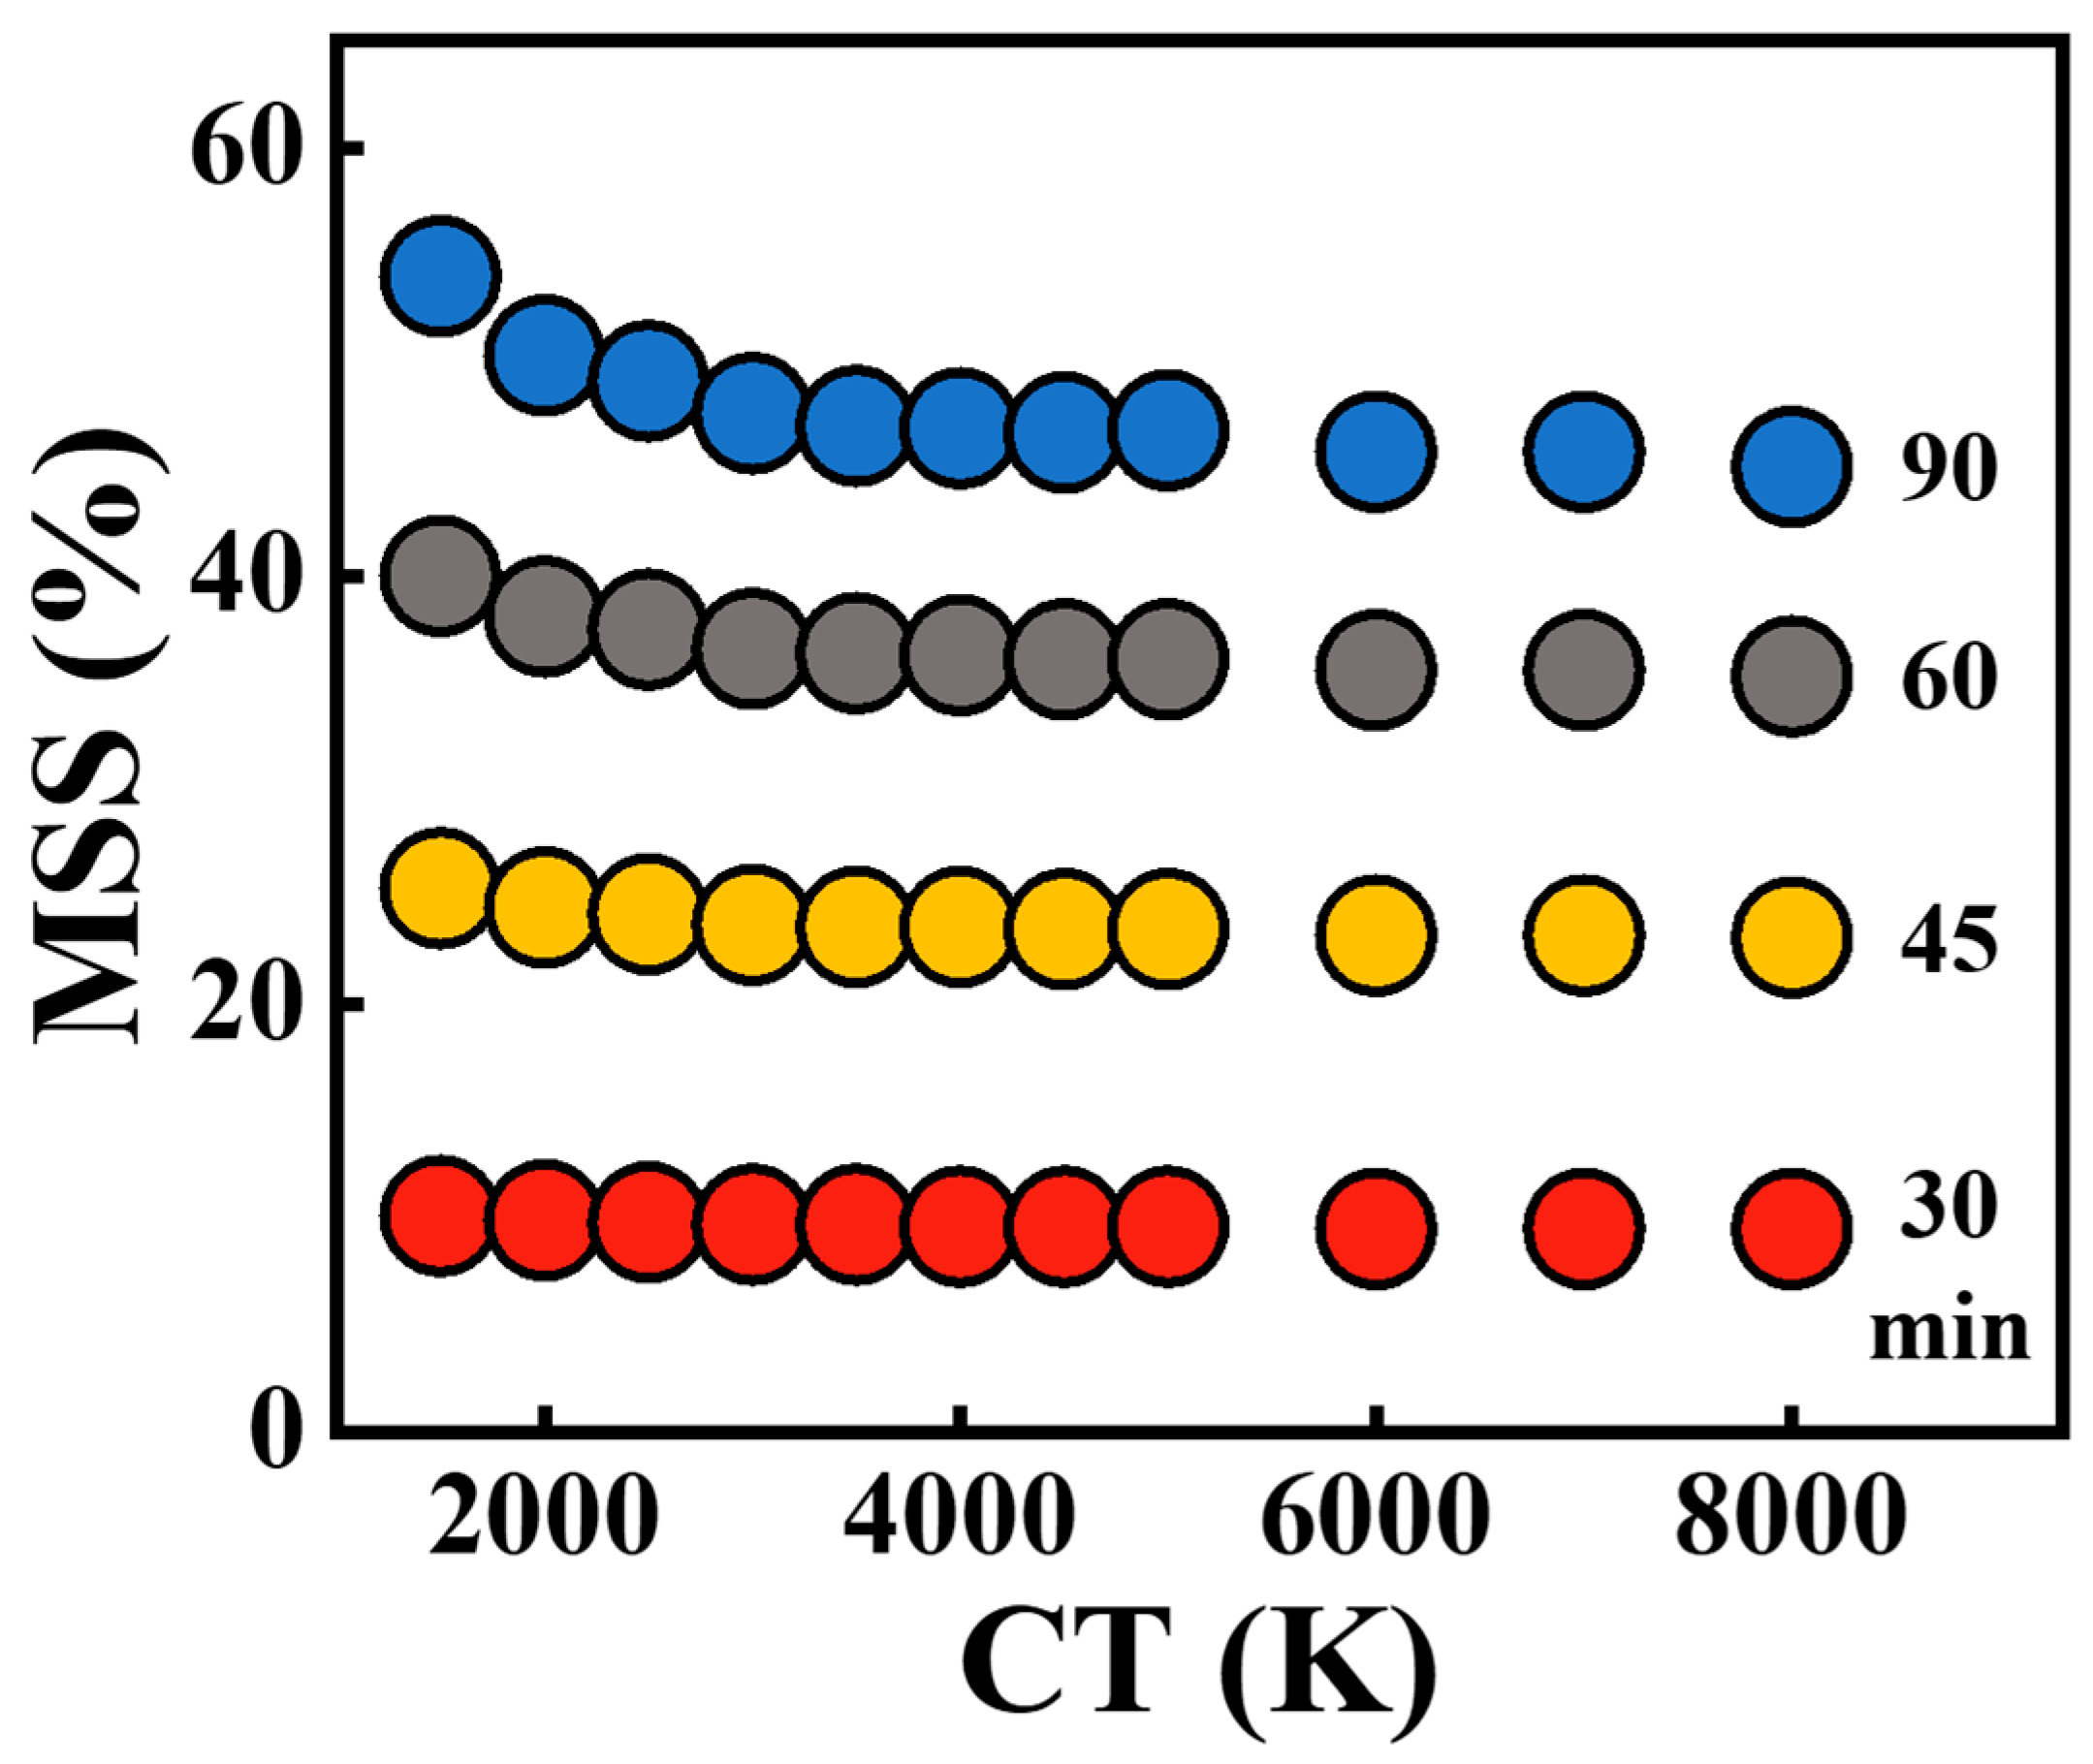
Figure 12.
The effect of light source color temperature on melatonin suppression, with the condition that home treatment uses the highest illuminance within the retinal permissible exposure limit.
Figure 12.
The effect of light source color temperature on melatonin suppression, with the condition that home treatment uses the highest illuminance within the retinal permissible exposure limit.
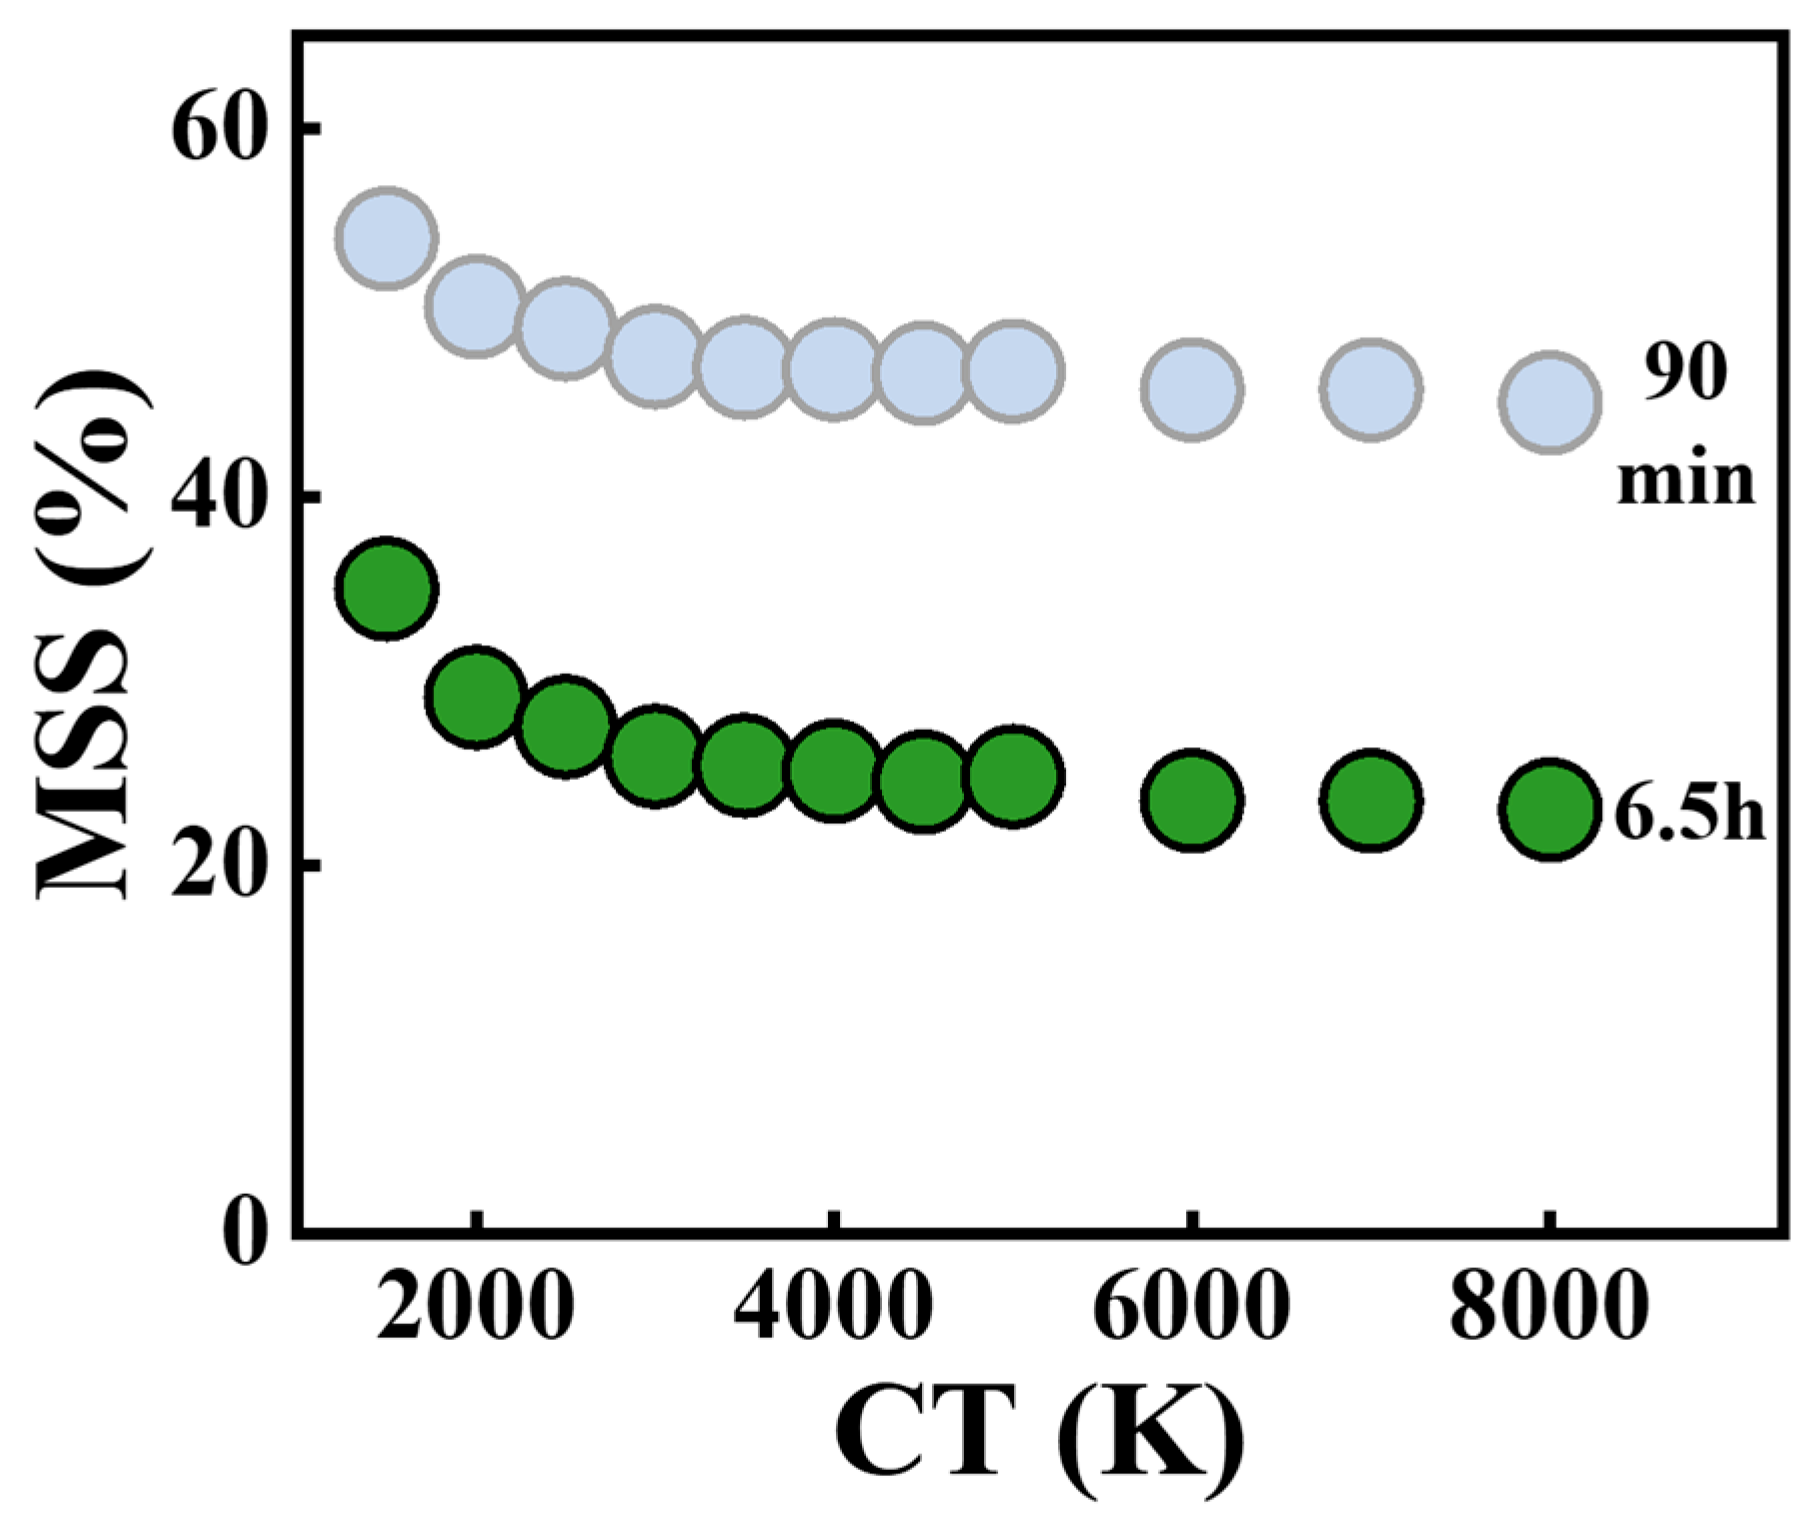
Figure 13.
The spectra of candlelight OLED and candlelight LED, both with a color temperature of 1,700 K.
Figure 13.
The spectra of candlelight OLED and candlelight LED, both with a color temperature of 1,700 K.
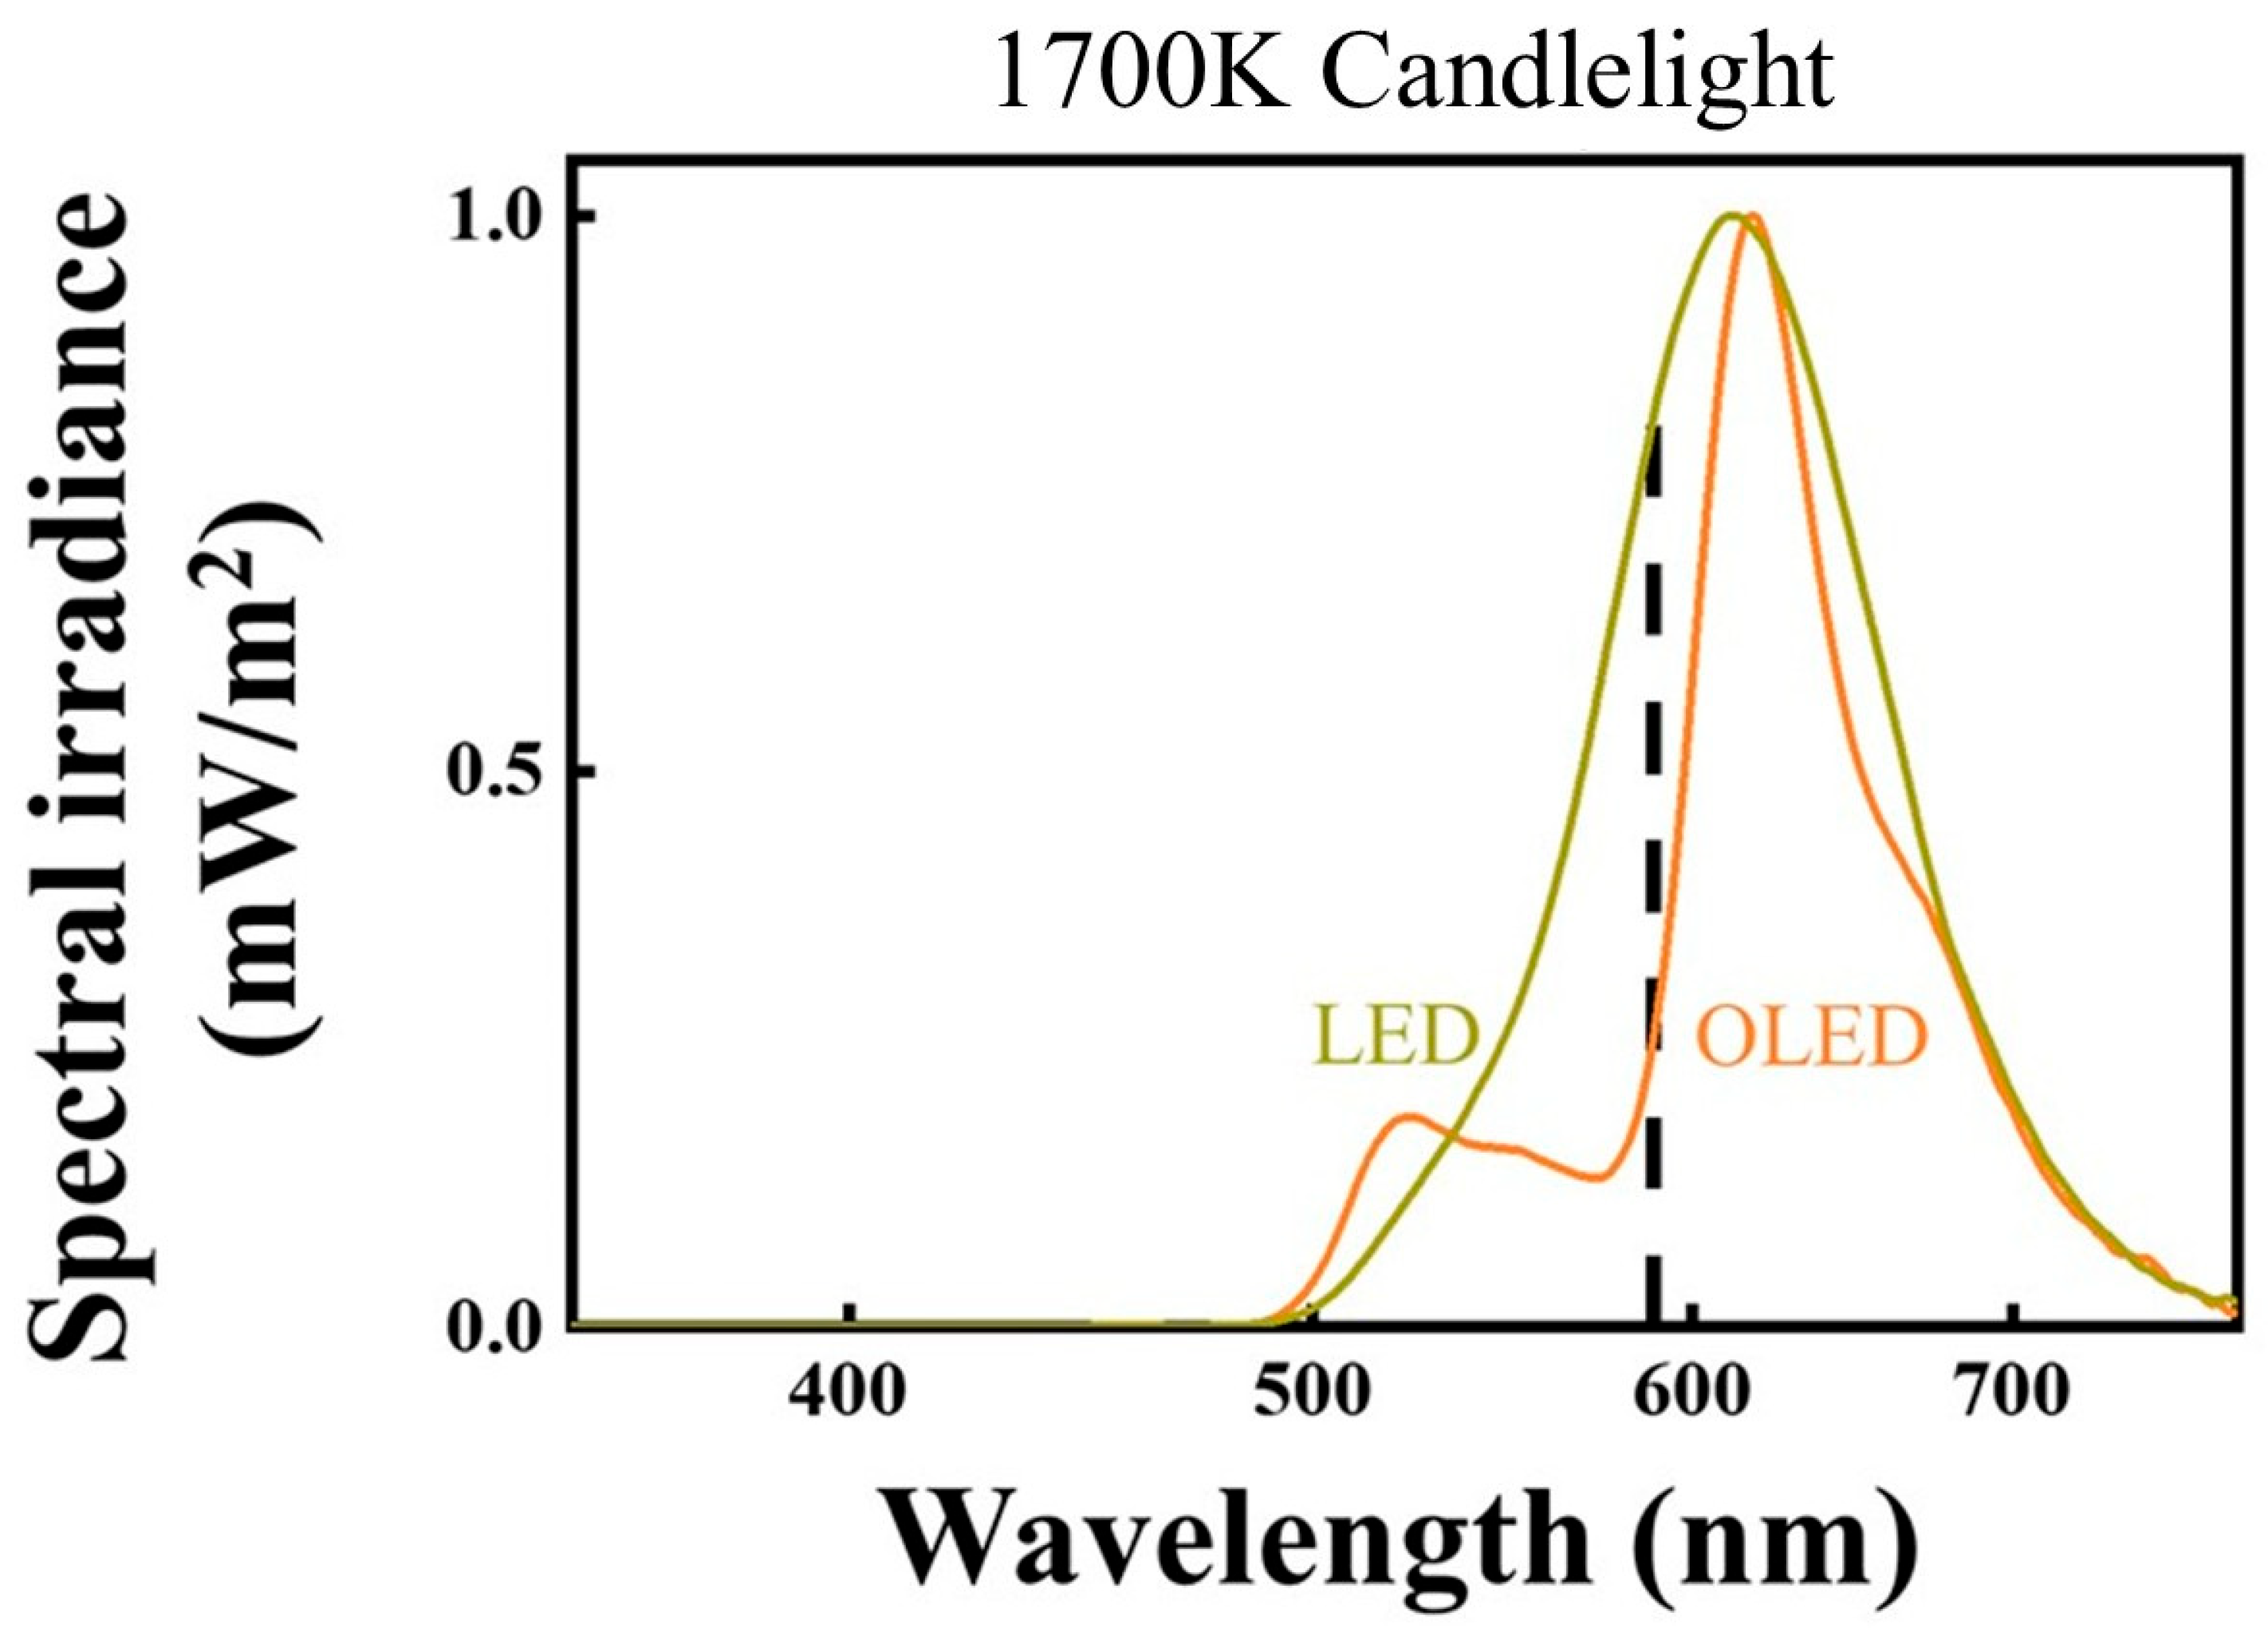
Figure 14.
The effect of color temperature of circadian lighting sources on melatonin suppression, with light exposure durations ranging from 30 to 90 minutes.
Figure 14.
The effect of color temperature of circadian lighting sources on melatonin suppression, with light exposure durations ranging from 30 to 90 minutes.
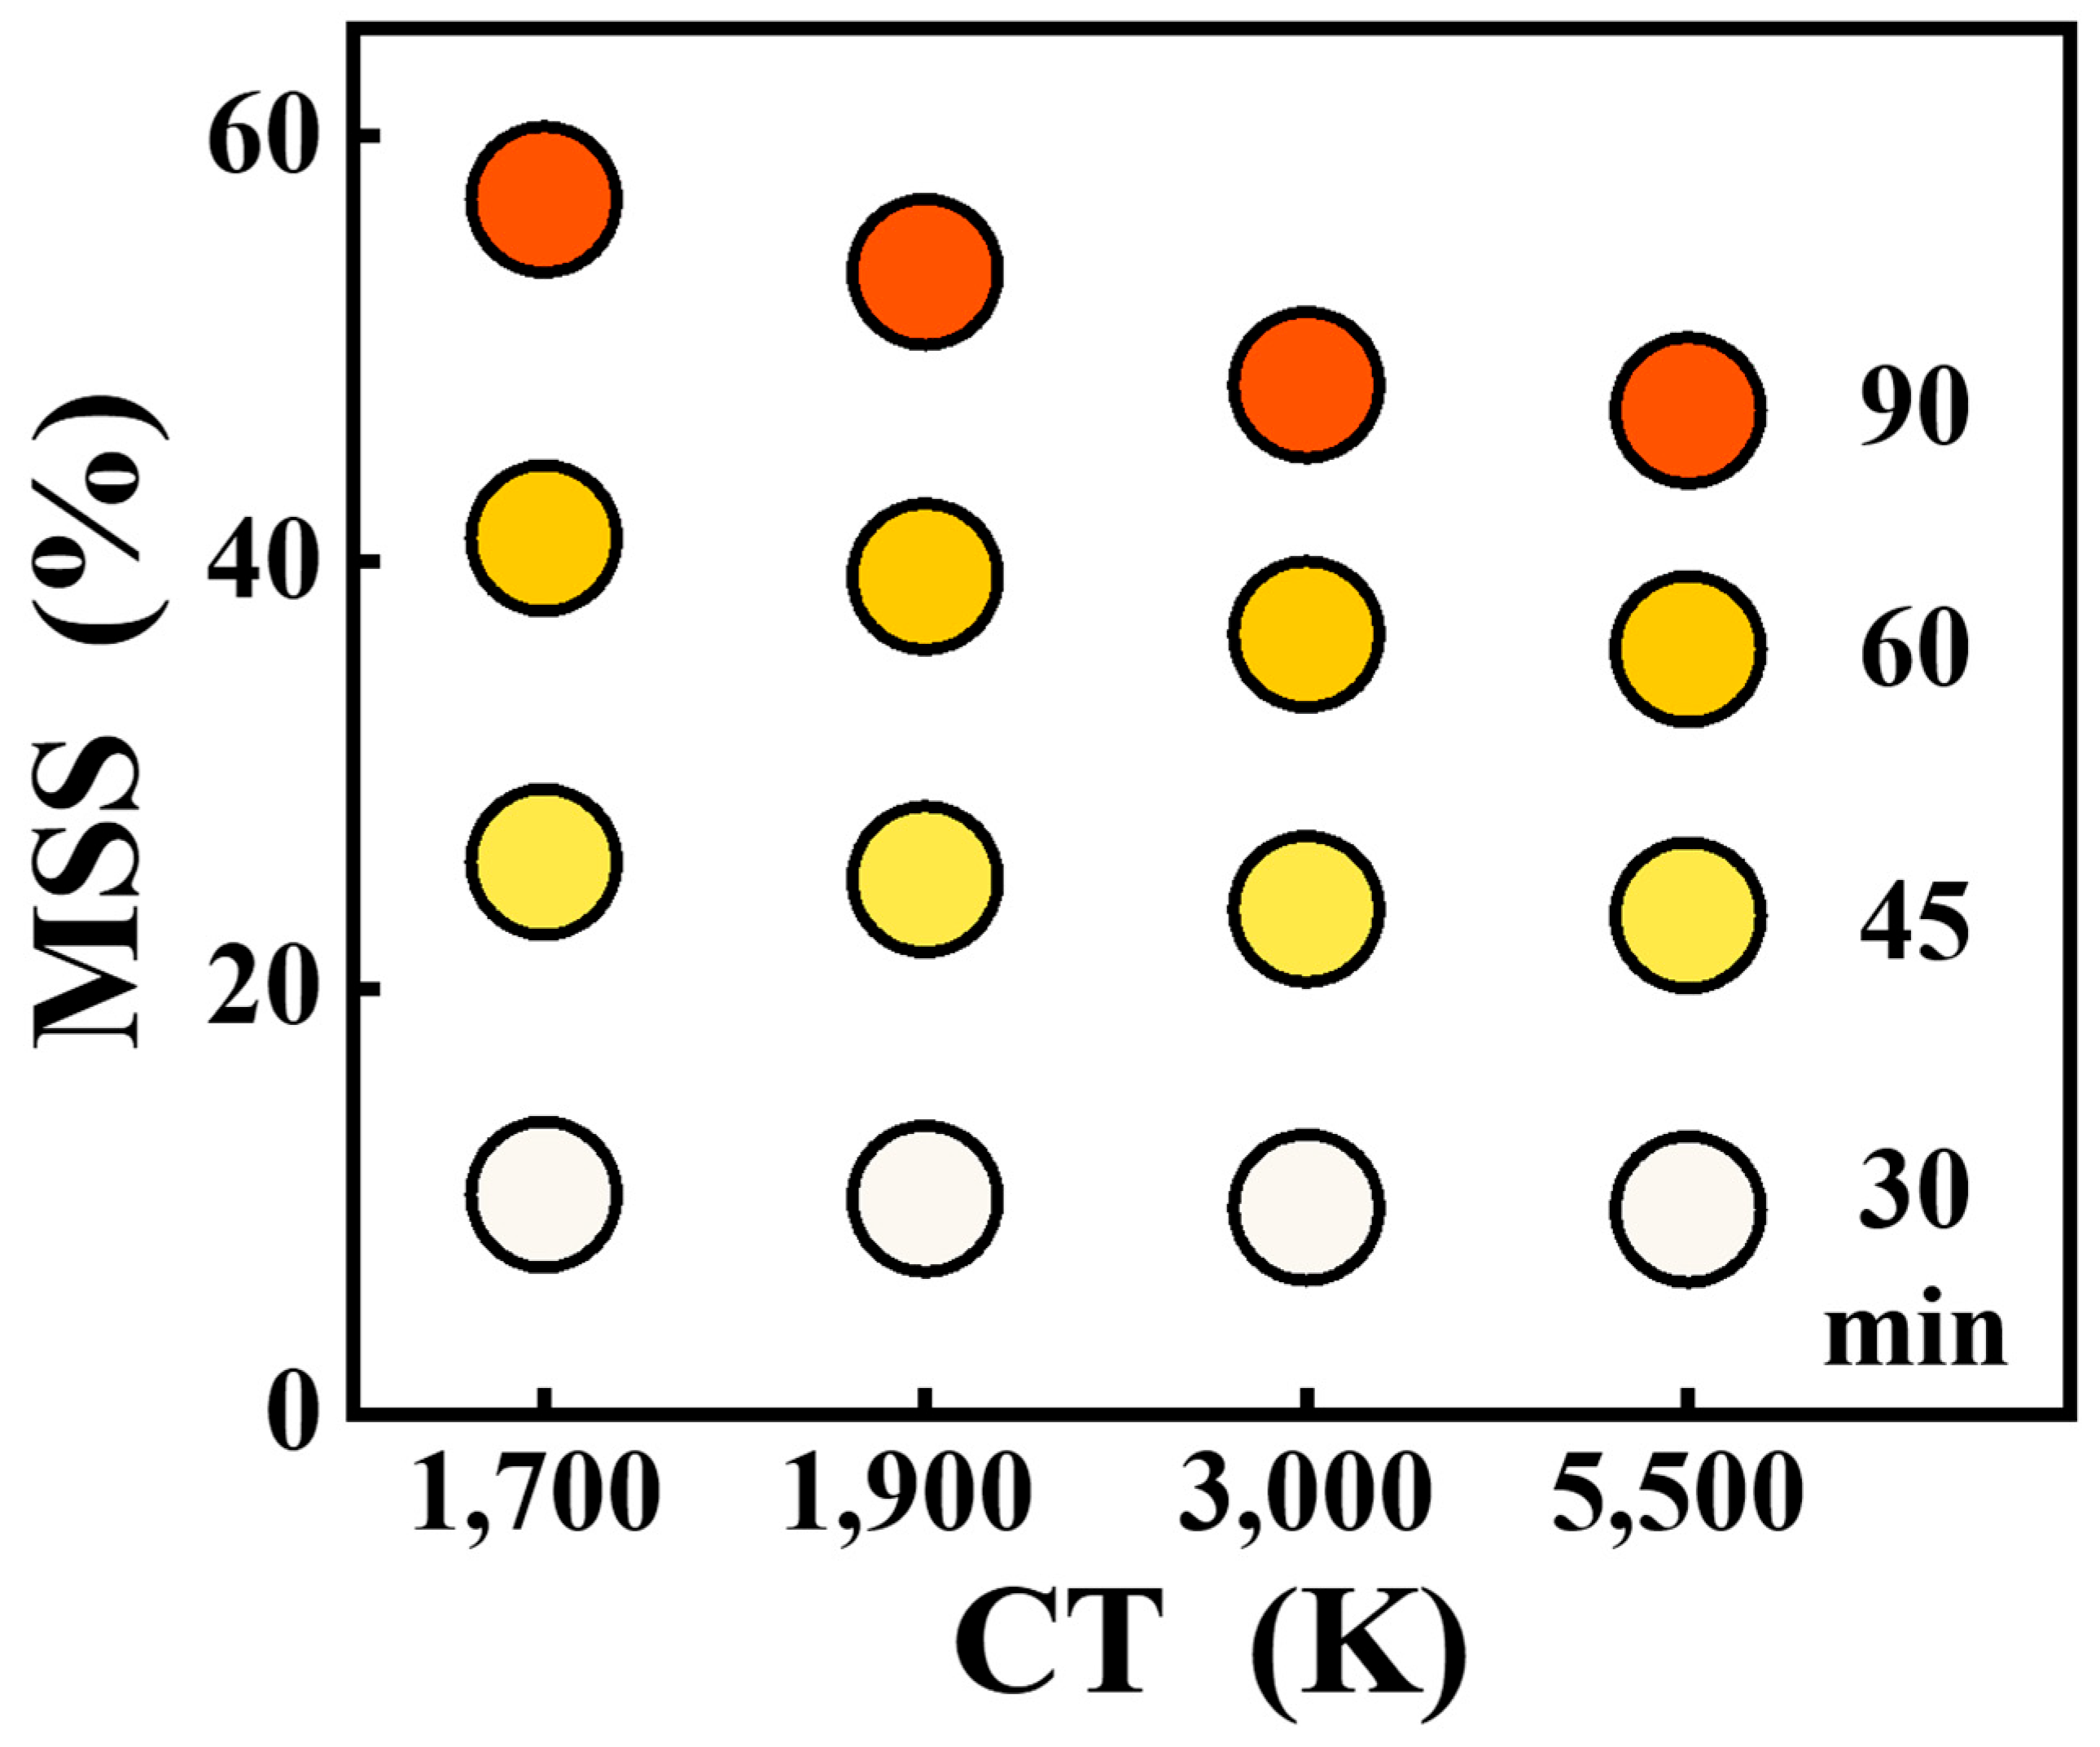
Figure 15.
Comparison of the efficacy of short-term (90 minutes) institutional therapy and long-term (6.5 hours) at-home therapy using circadian lighting sources with color temperatures ranging from 1,700 K to 5,500 K.
Figure 15.
Comparison of the efficacy of short-term (90 minutes) institutional therapy and long-term (6.5 hours) at-home therapy using circadian lighting sources with color temperatures ranging from 1,700 K to 5,500 K.
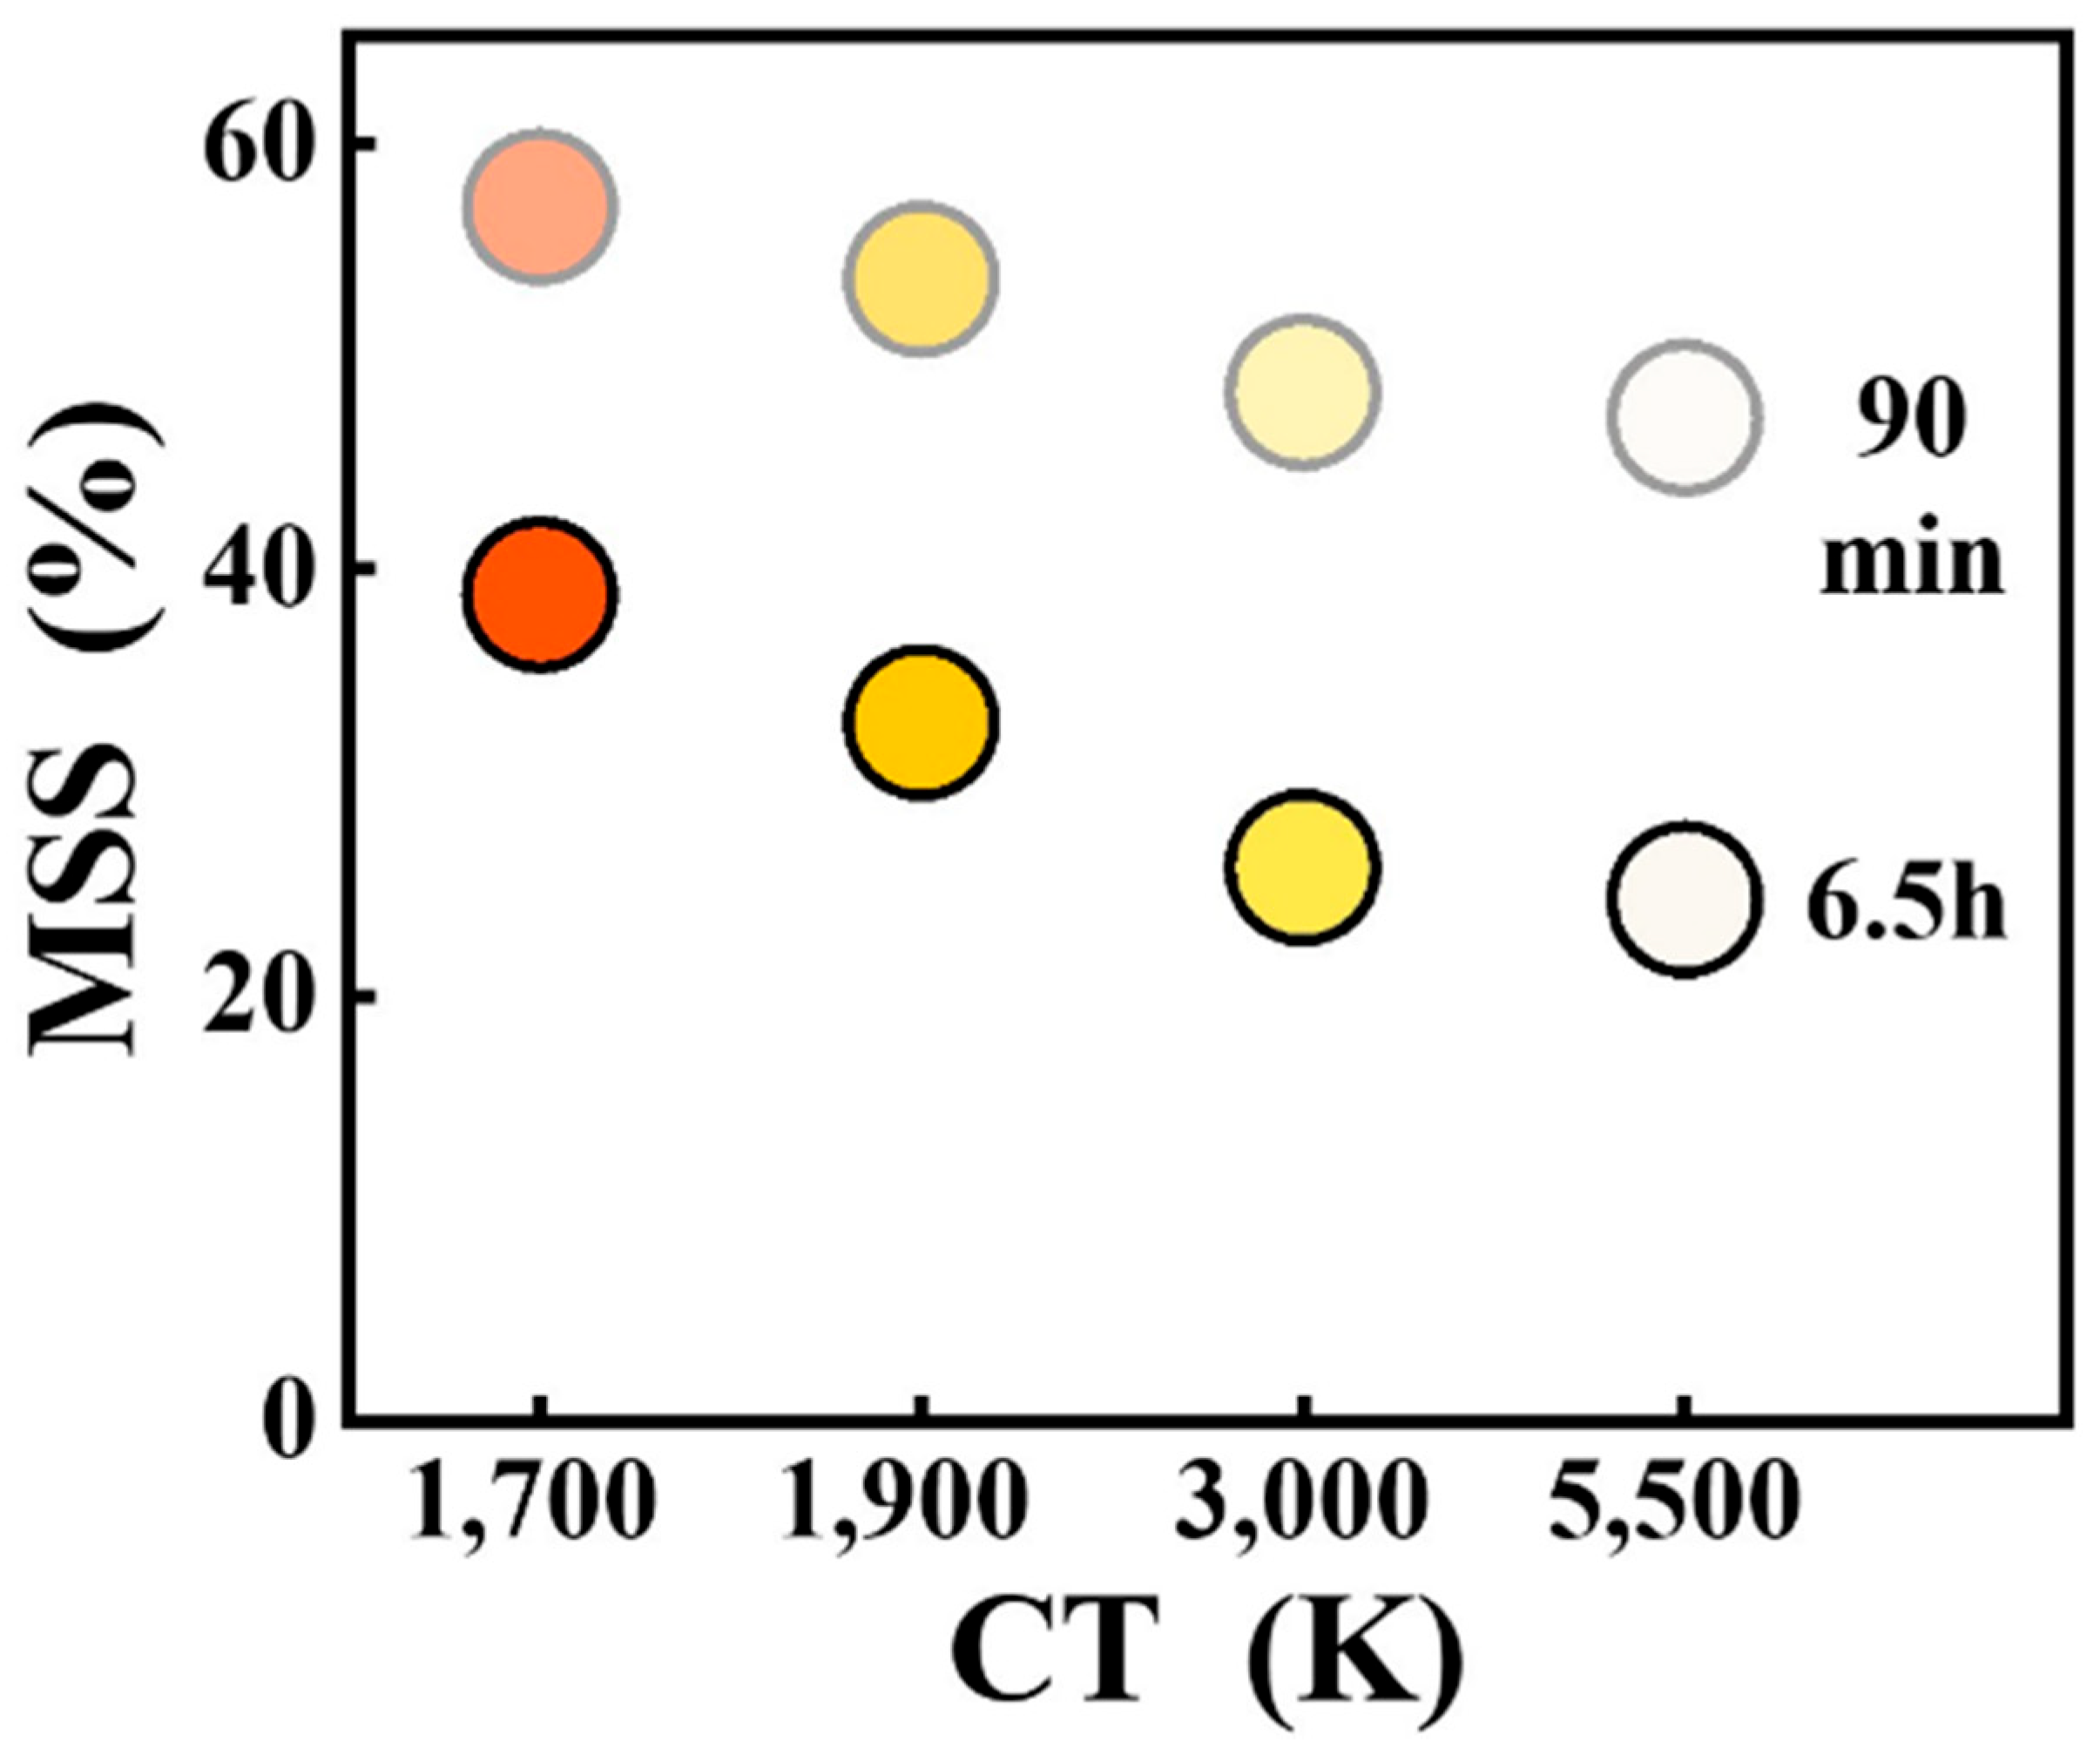
Figure 16.
Spectral diagram of LED circadian lighting.
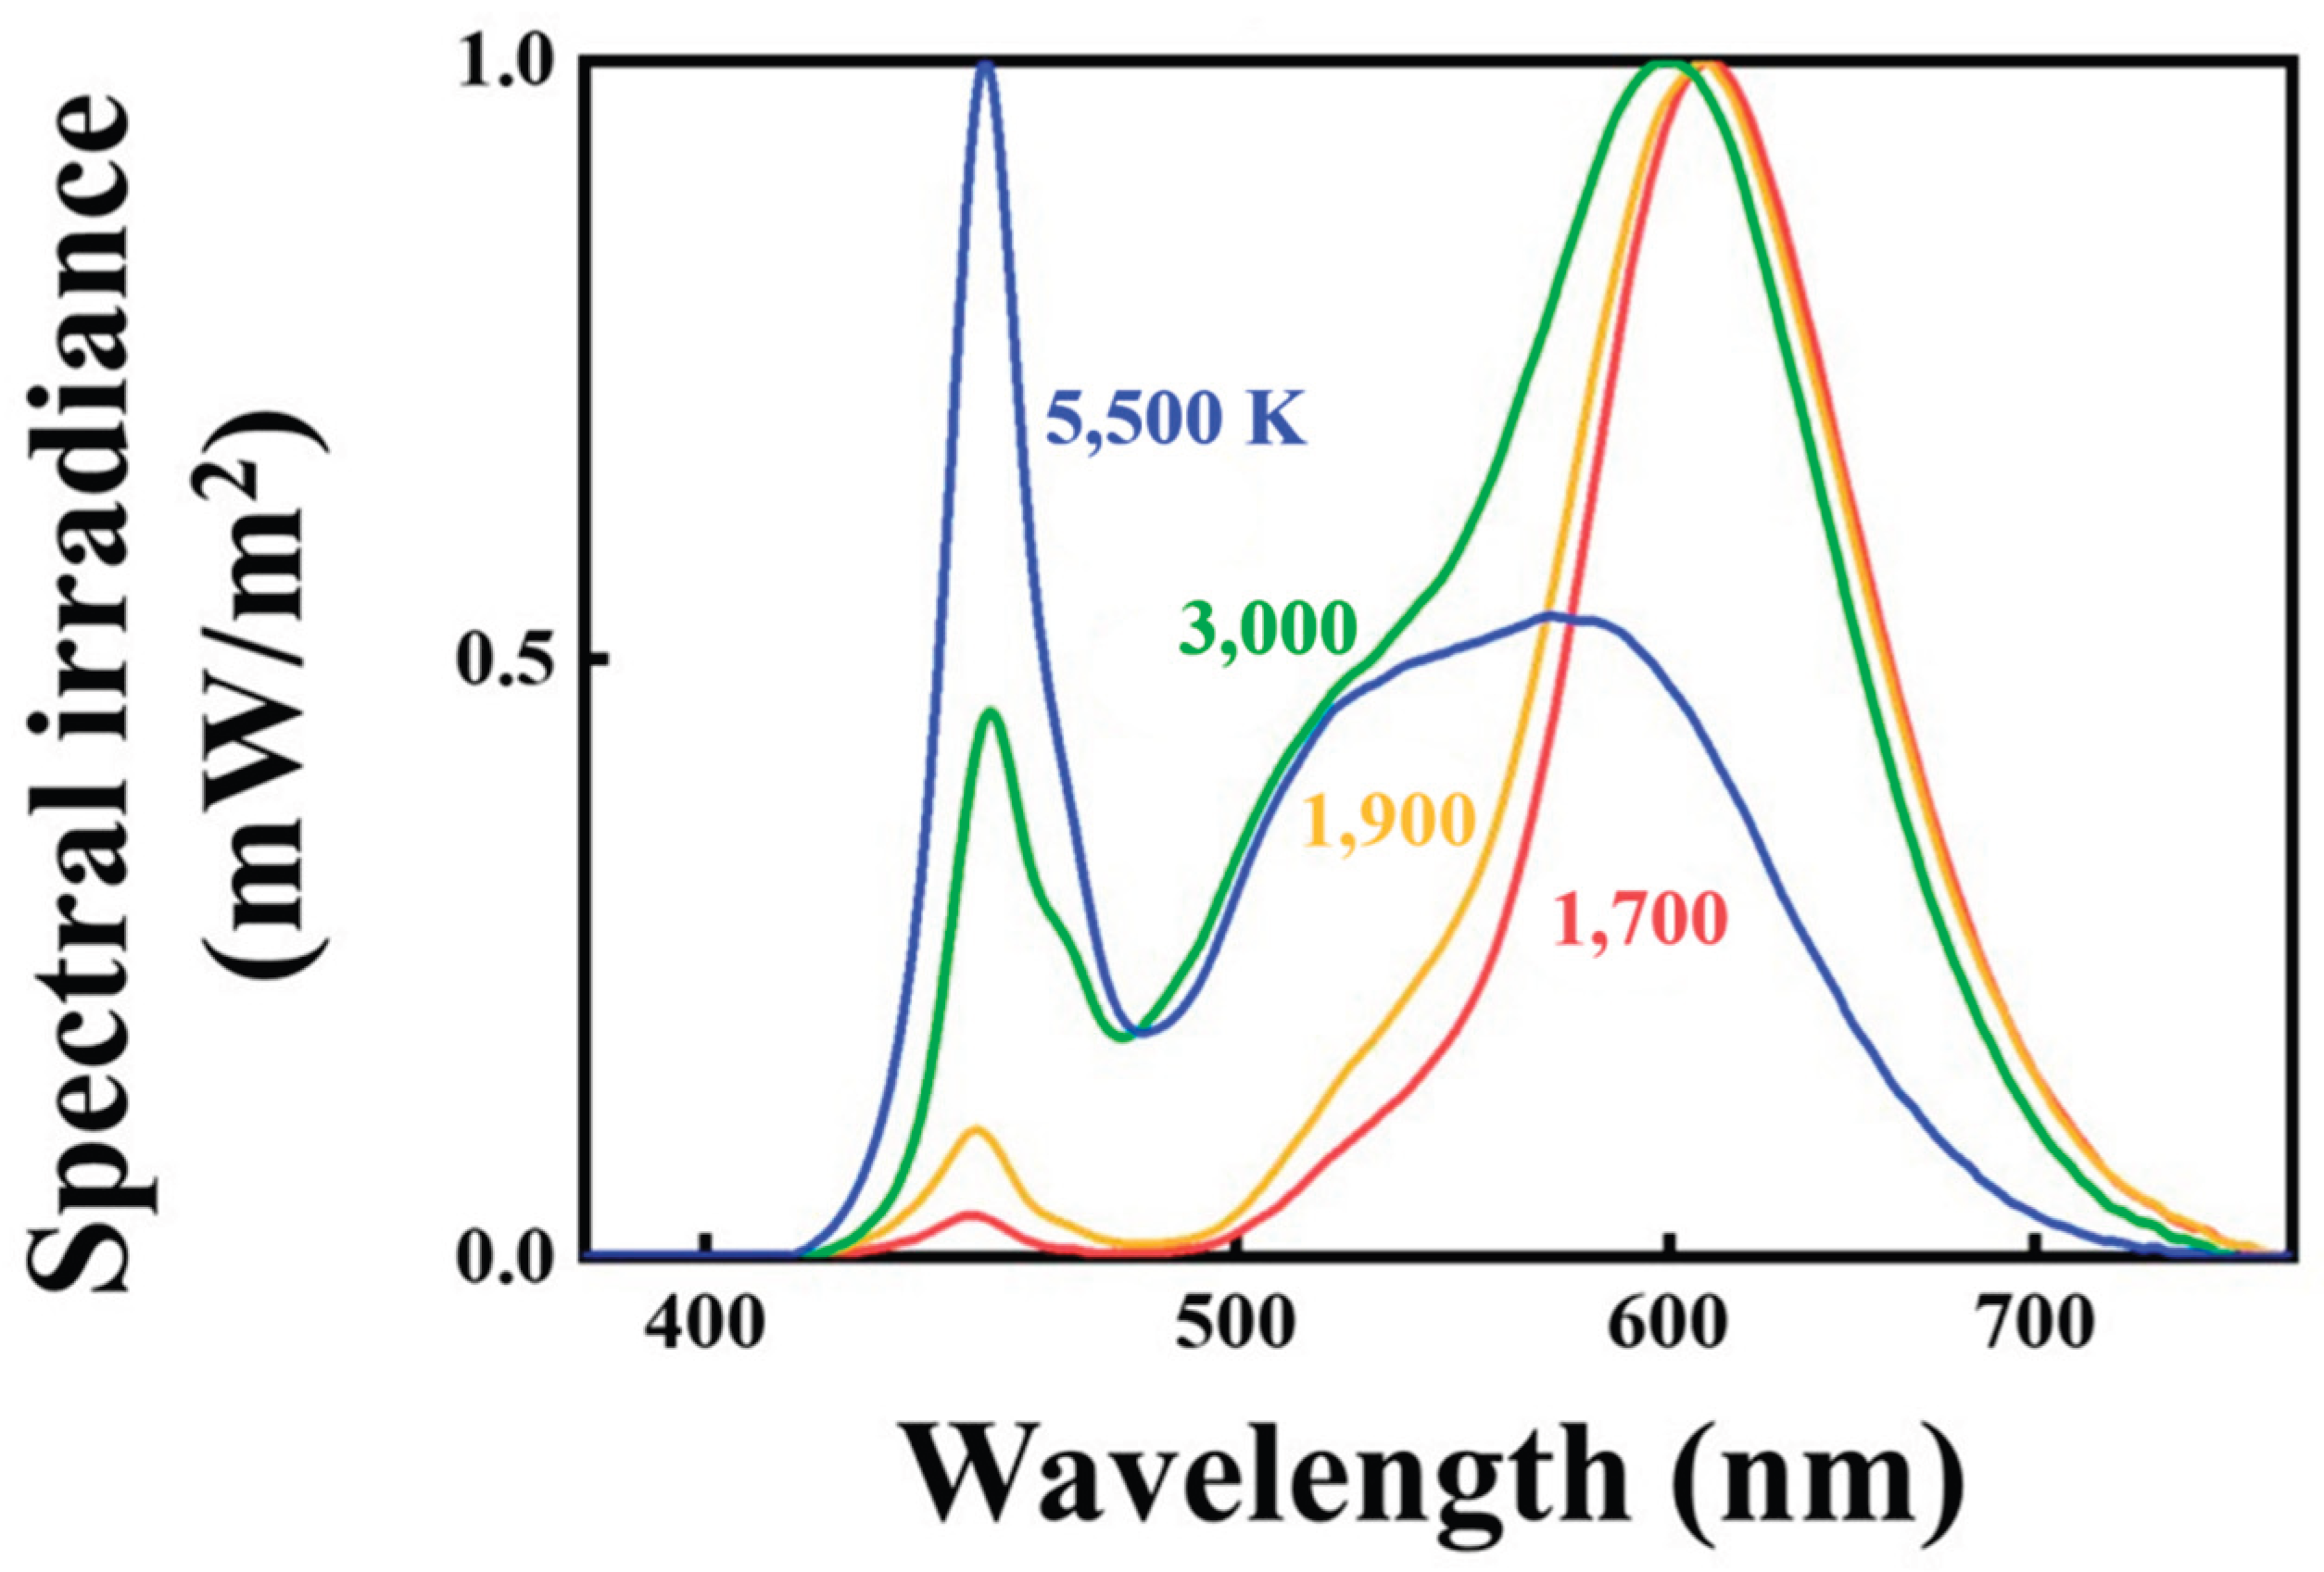

Table 1.
The required illuminance and achievable melatonin suppression level at varying phototherapeutic time by using 1,700K candlelight style LED and OLED.
Table 1.
The required illuminance and achievable melatonin suppression level at varying phototherapeutic time by using 1,700K candlelight style LED and OLED.
 |
|---|
Table 2.
The required illuminance and achievable melatonin suppression level with a phototherapeutic time of 6.5 h by using 1,700K candlelight style LED and OLED.
Table 2.
The required illuminance and achievable melatonin suppression level with a phototherapeutic time of 6.5 h by using 1,700K candlelight style LED and OLED.
 |
|---|
Table 3.
Retina-friendly nature and efficacy evaluation of previous monochromatic light therapy sources.
Table 3.
Retina-friendly nature and efficacy evaluation of previous monochromatic light therapy sources.
 |
|---|
Table 4.
Comparison of clinical experiment results and theoretical model calculations using multi-band light sources for light therapy, along with their retina-friendly nature evaluation.
Table 4.
Comparison of clinical experiment results and theoretical model calculations using multi-band light sources for light therapy, along with their retina-friendly nature evaluation.
 |
|---|
Disclaimer/Publisher’s Note: The statements, opinions and data contained in all publications are solely those of the individual author(s) and contributor(s) and not of MDPI and/or the editor(s). MDPI and/or the editor(s) disclaim responsibility for any injury to people or property resulting from any ideas, methods, instructions or products referred to in the content. |
© 2026 by the authors. Licensee MDPI, Basel, Switzerland. This article is an open access article distributed under the terms and conditions of the Creative Commons Attribution (CC BY) license (http://creativecommons.org/licenses/by/4.0/).
Copyright: This open access article is published under a Creative Commons CC BY 4.0 license, which permit the free download, distribution, and reuse, provided that the author and preprint are cited in any reuse.