

Submitted:
11 September 2026
Posted:
15 September 2026
You are already at the latest version
Abstract
We study the topology-dependent performance of scheduling-aware multipath routing in capacitated networks subject to congestion, node throughput constraints, downstream storage limits, and structural failure. We evaluate four routing strategies: shortest-path routing (SP), k-shortest paths (KSP), vertex-disjoint routing (VD), and a spillback-aware scheduling heuristic (VDSched). Experiments are conducted across five canonical synthetic topologies: grid, Erdős–Rényi random, scale-free, small-world, and spatial random networks, and four stress scenarios: baseline, random edge failure, targeted edge failure, and capacity degradation. The primary suite uses target n = 400-node networks, 50 origin–destination pairs per instance, 20 instances per topology across four graph-generation seeds, yielding 400 seed–instance realisations and 12,800 primary simulation runs. Statistical comparisons use paired Wilcoxon signed-rank tests with Holm correction.VDSched reduces peak blocked mass in every topology–scenario combination tested, with reductions of 36.5–87.0% relative to SP in the primary η = 5 suite. Its effect on mean delivery time, however, is strongly topology dependent. VDSched reduces mean delivery time by 18.9–23.6% in Erdős–Rényi random networks and by 31.6–36.7% in spatial random networks. In scale-free networks, it reduces delivery time by 9.8–10.4% under baseline, random-failure, and capacity-degradation scenarios, but provides no significant benefit under targeted removal of structurally important edges. In small-world networks, delivery-time gains are weaker and scenario-dependent, with the clearest benefit under capacity degradation.Grid networks reveal the opposite regime: VDSched increases mean delivery time by 1.5–3.4% relative to SP despite reducing peak blocked mass by 68.4–77.6%. This exposes a latency–congestion trade-off in topologies where alternative routes are geometrically inefficient. A storage-sensitivity analysis across η ∈ {3, 5, 8} confirms that these topology-dependent performance regimes are robust to variation in node storage capacity, with topology remaining the dominant moderator of delivery-time performance across all storage settings. These findings establish that VDSched is a robust congestion-suppression mechanism whose latency benefit depends on whether the topology provides efficient alternative routes.
Keywords:
scheduling-aware routing
; multipath routing
; capacitated networks
; network resilience
; congestion control
; spillback
; graph topology
; discrete-time simulation
; systems and control
; performance evaluation
1. Introduction
Efficient routing in capacitated networks is a foundational problem in the design of communication systems, transportation networks, and distributed computing infrastructures [1,2]. Traditional routing approaches prioritise path optimality under static assumptions, directing flow along shortest or lowest-cost paths. In networks operating near capacity, however, congestion dynamics introduced by competing flows render shortest-path strategies suboptimal: flow concentration on minimal-distance routes creates bottlenecks that propagate across the network, increasing delivery latency and reducing effective throughput [3,4].
Multipath routing addresses this by distributing flow across alternative routes, reducing load concentration. K-shortest-path strategies [5,6] and vertex-disjoint routing [7] provide principled approaches to path diversification, offering robustness to both congestion and link failure. Scheduling-aware approaches extend multipath routing by coordinating flow allocation over time, pre-empting simultaneous bottleneck formation [8,9]. Despite their intuitive appeal, it remains unclear under which structural conditions these strategies provide consistent benefits over simpler baselines.
A critical but underexplored dimension of routing performance is the interaction between algorithm design and network topology. Scale-free networks, characterised by heavy-tailed degree distributions and hub nodes [10], exhibit radically different failure profiles from regular lattice or spatially embedded networks [2,11]. Small-world networks combine high clustering with short path lengths [12], creating routing environments distinct from both random and structured topologies. Existing evaluations of routing strategies are commonly conducted on a single topology class, leaving systematic cross-topology comparative assessments largely absent from the literature.
This paper addresses that gap through a large-scale controlled simulation study. We evaluate four routing strategies across five canonical synthetic topologies and four stress scenarios, using a discrete-time flow simulation with node throughput and spillback constraints. Our goal is to characterise the structural conditions under which scheduling-aware routing provides measurable advantages, and those under which simpler approaches remain competitive. This characterisation enables topology-aware routing strategy selection without exhaustive empirical benchmarking.
Our main contributions are:
- 1.
- We demonstrate that VDSched reduces peak blocked mass by 36.5 to 87.0% relative to SP across all five topology classes and all four scenarios (all corrected , ), establishing spillback-aware dispatch as a robust and topology independent congestion suppression mechanism.
- 2.
- We show that VDSched’s delivery-time benefit is strongly topology-dependent. Large improvements occur in random (18.9–23.6%) and spatial random networks (31.6–36.7%); VDSched is consistently slower than SP in grid networks (1.5–3.4%, : 1.01–2.17, all large effects), despite reducing congestion in those same instances.
- 3.
- We identify the congestion latency decoupling: VDSched can simultaneously reduce peak blocked mass and increase mean delivery time when alternative routes are geometrically inefficient, demonstrating that congestion reduction and latency reduction are independent effects that cannot be assumed to occur together.
- 4.
- We confirm the structural fragility prediction of Albert, Jeong and Barabási [11] in a flow-simulation context: VDSched loses its delivery-time advantage in scale-free networks under targeted removal of structurally important edges (, negligible effect, ), while retaining a meaningful advantage under diffuse failure.
2. Related Work
2.1. Routing in Capacitated Networks
The routing of flows in networks with finite edge or node capacity traces to the foundational work of Ford and Fulkerson on maximum flow [13] and Menger’s theorem on vertex-disjoint paths [14]. Shortest-path routing, implemented via Dijkstra’s algorithm [15], remains the dominant operational baseline in link-state routing protocols such as OSPF and IS-IS [16]. However, shortest-path routing concentrates traffic on minimal-cost routes, creating bottlenecks under heterogeneous or heavy demand [3].
Multipath extensions distribute flow across several routes simultaneously. Yen’s k-shortest-paths algorithm [5] and Eppstein’s more efficient variant [6] enable traffic splitting across near-optimal paths. Vertex-disjoint routing [7], derived from max-flow decomposition, selects routes that share no intermediate nodes, increasing structural independence and robustness to individual component failures. Oblivious routing [17] provides worst-case competitive bounds for load balancing without demand knowledge, a result relevant to the fixed-demand setting used in this study. Traffic engineering formulations cast routing as a multi-commodity flow optimisation problem [18]; Fortz and Thorup [3] demonstrated that OSPF weights can be tuned to approximate optimal solutions but remain sensitive to demand fluctuations.
2.2. Congestion-Aware and Scheduling-Aware Routing
Congestion-aware strategies extend static multipath approaches by incorporating real-time or predictive load information. In data-centre networks, equal-cost multipath (ECMP) hashing distributes flows across parallel paths but suffers from hash collisions under heavy traffic [19]. Hedera [20] addresses this through centralised elephant-flow detection and rerouting; CONGA [8] achieves per-flowlet load balancing using distributed congestion feedback; and HULA [21] extends this to probe-free path quality inference in programmable data planes. Wang and Crowcroft [22] introduced early formulations of multipath routing with load-sensitive path selection, establishing the principle that path diversity provides congestion relief only when path selection is responsive to observed load.
Scheduling-aware routing, as studied in this paper, connects to the broader network control literature. Tassiulas and Ephremides [9] established that MaxWeight scheduling is throughput-optimal under adversarial arrivals; subsequent work extended this to wireline networks [23]. The VDSched heuristic evaluated here shares the motivation of these policies — coordinating flow over time in response to queue state — but operates as a local greedy heuristic rather than a provably optimal scheduler. In the transport simulation literature, spillback-aware flow propagation has been studied extensively under the cell transmission model [24] and its extensions [25], providing the conceptual framework for the node throughput and storage constraints used in our simulator.
2.3. Topology Effects on Routing Performance and Resilience
The structural properties of a network fundamentally determine routing efficiency and failure resilience. Watts and Strogatz [12] showed that many real-world networks lie in a small-world regime — high clustering combined with short average paths — which concentrates inter-cluster traffic on bridge edges. Barabási and Albert [10] demonstrated that preferential attachment produces scale-free degree distributions with a small number of high-degree hub nodes that serve as routing concentrators.
Albert, Jeong and Barabási [11] established the asymmetry that is directly replicated in our results: scale-free networks are robust to random component failures but acutely vulnerable to targeted attacks on hub nodes. Newman [1] reviews the broader landscape of complex network structure and dynamic processes. Barthélemy [2] demonstrates that spatial constraints reduce redundancy and increase vulnerability to localised failures, motivating our inclusion of the spatial random topology. In transport, Berdica [26] formalised road network vulnerability as susceptibility to serviceability-reducing incidents, and Jenelius, Petersen and Mattsson [27] developed systematic importance and exposure metrics for network vulnerability assessment. Reggiani, Nijkamp and Lanzi [28] demonstrate that path diversity and structural redundancy are the primary determinants of transport network resilience under demand stress — a proposition our results empirically validate across five topology classes.
3. Methods
3.1. Problem Setting
We model a capacitated network as a directed graph
where:
V is a finite set of nodes,
is the set of directed edges, and
assigns a positive integer capacity to each edge.
defines the maximum flow volume a node may process per timestep (node throughput), and
defines the maximum queue length at each node (node storage).
Node throughput is defined as
and node storage is given by
with
A set of origin-destination pairs
defines the routing demand. Each pair is assigned demand
flow units, with
pairs per instance.
Discrete-time flow propagation.
Simulation proceeds in discrete timesteps
with maximum horizon
At each step, each node processes up to units of queued flow, forwarding it along selected outgoing edges subject to edge capacity . Flow that cannot proceed due to insufficient downstream storage or node throughput is queued at the sending node, up to storage limit .
When a node’s queue reaches , no further incoming flow is accepted. A spillback condition in which downstream congestion prevents upstream movement.
Edge travel time is defined as
where:
is edge length, and,
.
Edge capacity is drawn independently from
The objective is to minimise total delivery time
where:
is the timestep at which the final unit of demand reaches destination node .
3.2. Routing Strategies
We compare four routing strategies under identical demand, capacity, and topology conditions.
Shortest Path (SP).
Each OD pair is routed along a single minimum-cost path computed by Dijkstra’s algorithm [15]. All demand is injected simultaneously at timestep . No load balancing or congestion response is performed.
K-Shortest Paths (KSP).
Up to loopless shortest paths are enumerated via Yen’s algorithm [5], and demand is distributed proportionally across them. This provides limited path diversity without structural disjointness guarantees.
Vertex-Disjoint Routing (VD).
Scheduling-Aware Routing (VDSched).
VDSched is a spillback-aware dispatch heuristic that uses the same vertex-disjoint candidate paths as VD but coordinates the timing of flow injection across timesteps. At each timestep, queued flow is prioritised by downstream storage availability, outgoing edge capacity, existing blocked flow, and remaining travel time.
Flow is held at the source when the downstream node’s storage is exhausted and the outgoing edge contains blocked flow. VDSched introduces local congestion awareness without solving a global time-expanded minimum-cost flow optimisation; it is a scalable greedy heuristic rather than an optimal scheduler.
VDSched differs from VD only during simulation dispatch. Both methods use the same vertex-disjoint candidate path set, but VDSched changes the order in which queued units are released from nodes. Rather than dispatching queued units in arrival order, VDSched prioritises movements that have downstream storage available, sufficient edge capacity, shorter remaining travel time, and lower blocked-exit pressure. It also prevents dispatch into a downstream node that is already full when the corresponding edge has blocked exit flow. Thus, VDSched is a local spillback-aware scheduling heuristic, not a global time-expanded optimisation method.
For each queued unit q, VDSched computes a local priority score for its next movement. If the next edge is , the score is:
where is the capacity of the next edge, is the currently available storage at the downstream node w, is the remaining travel time along the assigned path, and is the number of units currently blocked at the exit of edge e. Units with higher scores are dispatched first.
Algorithm 1 describes the dispatch-ordering substep used by VDSched at each node queue. This substep replaces the default arrival-order dispatch rule in the common simulation update described in Appendix C1. All other simulation steps, including edge-pipeline advancement, node storage checks, edge-capacity constraints, blocked-exit discharge, and metric updates, are shared across all routing strategies.
| Algorithm 1 VDSched dispatch-ordering substep |
|
Algorithm 1 presents the VDSched dispatch-ordering substep used during node-level queue dispatch.
3.3. Network Topologies
We evaluate five canonical synthetic topology classes. Each was generated with target size
and converted to a directed graph by bidirecting all undirected edges. The largest strongly connected component was retained.
Grid.
A directed regular lattice (400 nodes, directed edges, mean out-degree ), generated as nx.grid_2d_graph(20, 20). The regular structure and near-uniform degree distribution provide minimal path diversity: any vertex-disjoint alternative path requires a Manhattan-distance detour.
Random.
Erdős-Rényi random graphs with
for [1]. A representative processed instance retains 391 nodes ( directed edges, mean out-degree ) after connectivity filtering.
Scale-free.
Barabási-Albert preferential attachment graphs with
for [10]. Representative statistics: 400 nodes, directed edges, mean out-degree .
The heavy-tailed degree distribution produces a small number of high-degree hub nodes that serve as routing concentrators.
Small-world.
Watts-Strogatz graphs with
and rewiring probability
[12]. Representative statistics: 400 nodes, directed edges, mean out-degree .
Small-world networks combine high local clustering with short average path lengths.
Spatial random.
Random geometric graphs with connection radius
for [2].
If the generated graph was disconnected, the radius was increased to
and the graph regenerated.
The mean out-degree spans 3.80 (grid) to 13.32 (spatial random), providing a structural range from low-redundancy to high-redundancy routing environments. Representative processed graph statistics are reported in Table 1.
3.4. Failure and Stress Scenarios
Baseline.
No failures; all edges operate at assigned capacities.
Random edge failure.
A fraction of directed edges is removed uniformly at random. Five independent failure realisations per seed-instance combination (seeds 2026–2030) were evaluated to account for stochastic variation in failed-edge selection.
Targeted edge failure.
The same fraction of edges is removed by ranking edges according to an approximate shortest-path edge betweenness score.
For each source node, shortest paths to reachable targets are computed, and each traversed edge accumulates one unit of score. The top-ranked of edges are removed.
This operationalises the targeted attack regime studied by Albert et al. [11], concentrating disruption on structurally important routing infrastructure.
Capacity degradation.
All directed edge capacities are multiplied by , with capacities constrained to remain at least one unit. No edges are removed.
3.5. Experimental Design
For each of four graph-generation seeds (42, 123, 999, 2024), 20 instances were generated per topology class, yielding 80 seed-instance realisations per topology.
Deterministic scenarios (baseline, capacity degradation, targeted edge failure) were evaluated once per realisation, giving 80 simulation runs per topology-algorithm-scenario cell.
Random edge failure was evaluated over five independently sampled failure realisations per realisation, giving 400 runs per cell for that scenario.
The merged dataset contains 12,800 simulation rows computed as:
Repeating the full suite for and adds a further runs, for simulation rows in total across the three storage conditions .
Due to connectivity filtering, not all OD pairs had a connecting path in every instance. Planned demand was 5,000 units per run, and reachable demand ranged from to . All delivered fraction metrics are normalised by reachable demand. Statistical comparisons for the sensitivity runs follow the same paired Wilcoxon procedure described in Section 3.7, using the same explicit failure seed pairing convention as the primary analysis.
3.6. Evaluation Metrics
Five metrics are recorded per simulation run. Lower values are better for all metrics except delivered fraction.
- Mean delivery time: mean timesteps required to deliver each demand unit.
- Delivered fraction: proportion of reachable demand delivered by the end of the simulation.
- Peak blocked mass: maximum total flow blocked at any timestep.
- Peak queue: maximum queue length at any single node.
- Peak saturated nodes: maximum number of nodes simultaneously operating at storage capacity.

Table 2.
Experimental design and simulation parameters. The primary results are reported for ; storage-sensitivity analyses repeat the full design for .
Table 2.
Experimental design and simulation parameters. The primary results are reported for ; storage-sensitivity analyses repeat the full design for .
| Parameter | Value |
|---|---|
| Topology classes | Grid, Erdos-Rényi random, scale-free, small-world, spatial random |
| Target graph size | nodes |
| Graph-generation seeds | 42, 123, 999, 2024 |
| Instances per topology-seed pair | 20 |
| Seed-instance realisations | 400 |
| Origin-destination pairs per instance | 50 |
| Demand per OD pair | 100 flow units |
| Total demand per instance | 5,000 flow units |
| Routing strategies | SP, KSP, VD, VDSched |
| Candidate path limit | |
| Stress scenarios | Baseline, random edge failure, targeted edge failure, capacity degradation |
| Random edge-failure fraction | 5% of directed edges |
| Random edge-failure seeds | 2026, 2027, 2028, 2029, 2030 |
| Targeted edge-failure fraction | 5% of directed edges |
| Capacity-degradation factor | 0.5 |
| Primary node-storage multiplier | |
| Primary node storage | |
| Storage-sensitivity multipliers | |
| Primary simulation rows | 12,800 |
| Total rows including storage sensitivity | 38,400 |
| Run-level files in explicit merge | 9,600 |
3.7. Statistical Analysis
Because all algorithms were evaluated on matched seed-instance-scenario units, algorithm comparisons were treated as paired comparisons.
The primary inferential comparison is VDSched versus SP, because SP represents the operational shortest-path baseline and VDSched is the proposed spillback-aware scheduling heuristic. The primary lower-is-better outcomes are mean delivery time and peak blocked mass. Peak queue and peak saturated-node counts are reported as secondary diagnostics.
[29]. Effect magnitudes are classified as negligible (), small (), medium (), or large () following Cohen [29].
For the random edge-failure scenario, five stochastic failure realisations were evaluated per seed-instance combination using failure seeds 2026–2030. During result merging, the failure seed was extracted from the run-level filename and retained as an explicit pairing identifier. Paired tests were therefore conducted on matched graph-seed, instance, topology, scenario, and failure-seed units, ensuring that SP, KSP, VD, and VDSched were compared under the same graph realisation, OD set, and disruption draw. Deterministic scenarios were assigned a single failure identifier. The final explicit-pairing dataset contains 38,400 simulation rows, 9,600 run files, and complete paired units across , with no incomplete algorithm sets.
For the primary suite, paired differences were computed for each topology–scenario cell. Statistical significance was assessed using two-sided Wilcoxon signed-rank tests, and Holm correction was applied across the primary test family.
4. Results
4.1. Overall Performance: Dominant Algorithm by Topology and Scenario
Figure 1 presents the dominant routing algorithm across all topology-scenario combinations. VDSched dominates in random, scale-free (except targeted failure), and spatial random topologies across all scenarios. SP dominates in grid networks across all four scenarios and in scale-free networks under targeted edge failure. Small-world networks show mixed dominance: SP is competitive under baseline and targeted-failure conditions, while VDSched is significantly better only under capacity degradation. These patterns motivate the pairwise analysis in the following subsections.
4.2. Congestion Suppression: A Universal and Robust Finding
VDSched reduces peak blocked mass relative to SP in every topology-scenario combination tested. All 20 pairwise comparisons yield with large effect sizes (). Table A1 in the appendix reports the complete results; key values are summarised here and illustrated in Figure 2.
In random networks, VDSched reduces peak blocked mass by 79.3 to 81.9% across all four scenarios, with (–). In small-world and spatial random networks, reductions are 85.3 to 87.0% and 84.7 to 86.0% respectively, with (–). Even in grid networks, where VDSched provides no delivery time advantage, it reduces peak blocked mass by 68.4 to 77.6%, with (–). The smallest reductions occur in scale free networks, ranging from 36.5% under capacity degradation to 50.8% under targeted edge failure, with (–).
The relatively smaller congestion reduction in scale free networks reflects the hub concentrated topology. With fewer but higher capacity paths, spillback events are less frequent but individually larger.
These results establish that the primary and most reliable effect of VDSched is congestion suppression. Whether this congestion reduction translates into reduced delivery time depends on topology, as the following subsection shows.
4.3. Delivery Time: A Topology-Dependent Finding
Figure 3 presents the paired mean delivery-time difference (VDSched - SP) with 95% confidence intervals across all topology-scenario cells. Negative values indicate VDSched reduces delivery time; positive values indicate SP is faster. Table 3 reports the complete pairwise statistics.
Spatial random networks: strongest VDSched advantage.
The largest delivery-time improvements occur in spatial random networks. VDSched reduces mean delivery time by 32.6% under baseline conditions (SP: 19.74 timesteps, VDSched: 13.30; ), 32.1% under random edge failure the improvement is 31.6% (SP: 19.81, VDSched: 13.56; ). Under targeted edge failure the improvement is also 31.6% (SP: 21.51, VDSched: 14.72; ). Under capacity degradation the improvement reaches 36.7% (SP: 20.78, VDSched: 13.15; ). All four comparisons are highly significant () with large effect sizes.
The spatial embedding of these networks with nodes connected only to geographic neighbours creates dense local routing alternatives without systematic route-length penalties, providing the structural conditions under which spillback-aware scheduling most efficiently reduces latency.
Erdős–Rényi networks deliver consistent gains regardless of scenario.
In Erdos Renyi random networks, VDSched delivers consistent delivery time reductions across all scenarios. The improvement is 20.1% under baseline, (SP: 12.84, VDSched: 10.26, ). Under capacity degradation the improvement reaches 23.6%, (SP: 13.51, VDSched: 10.32, ). Under random edge failure the improvement is 19.6%, , and under targeted edge failure it is 18.9%, . All four comparisons are significant at with large effect sizes.
The moderate, uniform path diversity of Erdős-Rényi graphs allows spillback avoidance to reduce queuing without forcing geometrically costly detours.
Scale-free networks: scenario-dependent, medium effects.
Scale free networks exhibit nuanced behaviour. VDSched provides medium effect delivery time improvements under three of four scenarios. The improvement is 9.9% under baseline, (SP: 23.69, VDSched: 21.36, . Under random edge failure the improvement is 9.8%, , and under capacity degradation it is 10.4%, (SP: 23.89, VDSched: 21.40, .
Under targeted edge failure, however, the difference reverses direction and is negligible. SP achieves 19.39 timesteps versus VDSched’s 19.60, a difference of 0.21 timesteps, , at . This reversal is consistent with Albert, Jeong and Barabasi’s prediction that scale free networks are acutely vulnerable to targeted attack on hub nodes [11]. Removal of the top 5 percent of highest betweenness edges disproportionately destroys the hub connectivity on which VDSched’s multipath scheduling depends, collapsing its advantage.
Small-world networks: conditional and asymmetric improvements.
Small-world networks show a complex pattern. VDSched provides a significant, large effect improvement only under capacity degradation, SP at 25.67 versus VDSched at 23.58, an improvement of 8.1%, , . Under random edge failure, the improvement is statistically significant but small in magnitude, 1.9%, .
Under baseline conditions and under targeted failure, VDSched and SP are statistically indistinguishable. The baseline difference is 2.3% in VDSched’s favour but does not survive Holm correction, , . Targeted failure shows a difference of 0.9%, , at .
This pattern suggests that in small-world networks, VDSched’s scheduling benefit materialises only when network stress, whether from reduced capacity or from diffuse failure pressure under random edge loss, creates congestion sufficient for spillback aware dispatch to provide measurable latency relief, and that this benefit does not reach statistical significance under ordinary operating conditions.
Grid networks: the congestion-latency trade-off.
Grid networks produce the most unexpected finding of this study. VDSched increases mean delivery time relative to SP in all four scenarios. The penalty is 2.7% under baseline, SP at 137.46 versus VDSched at 141.18, . Under random edge failure the penalty is 3.3%, . Under targeted edge failure it is 3.4%, . Under capacity degradation it is 1.5%, SP at 139.44 versus VDSched at 141.58, .
All four differences are statistically significant at with large effect sizes.
Despite cutting peak blocked mass by 68.4 to 77.6% in the same grid instances, VDSched still arrives later on average, which shows that congestion reduction and delivery time reduction are not co-incident effects. The mechanism is addressed in Section 5.
4.4. Delivered Fraction
Across all topology-scenario-algorithm combinations, delivered fraction was close to unity. In the parameter regime studied (planned demand 5,000 units, reachable demand 4,600–5,000 units, maximum horizon 50,000 timesteps), all algorithms eventually route all reachable demand to its destination.
Congestion manifests primarily as delivery delay rather than delivery failure, making mean delivery time and peak blocked mass the key discriminating metrics.
4.5. Sensitivity to Node Storage Capacity
The primary experiments used . To test whether the topology-dependent performance regimes depend on this storage assumption, we repeated the full simulation suite for (tight storage) and (relaxed storage).
Figure 4 presents VDSched delivery-time improvement relative to SP across all three storage conditions. The qualitative topology-dependent pattern is stable. VDSched remains consistently slower than SP in grid networks for all eta, with the penalty ranging from to across all storage and scenario conditions). In spatial random networks, VDSched remains strongly beneficial across all , with delivery-time improvements of approximately 29– regardless of storage setting. Random networks also show consistently positive gains of 19– across all values of .
The scale-free targeted-failure exception persists: VDSched’s delivery-time advantage over SP remains negligible or absent under targeted removal of structurally important edges for all three storage multipliers, confirming that this is a structural rather than storage-dependent effect. Small-world networks remain mixed, with the capacity-degradation benefit ( at ) present but varying in magnitude across storage settings.
These results demonstrate that the topology-dependent regimes are robust to variation in node storage capacity. Storage multiplier affects the magnitude of effects but does not change the qualitative classification of topology-dependent performance.
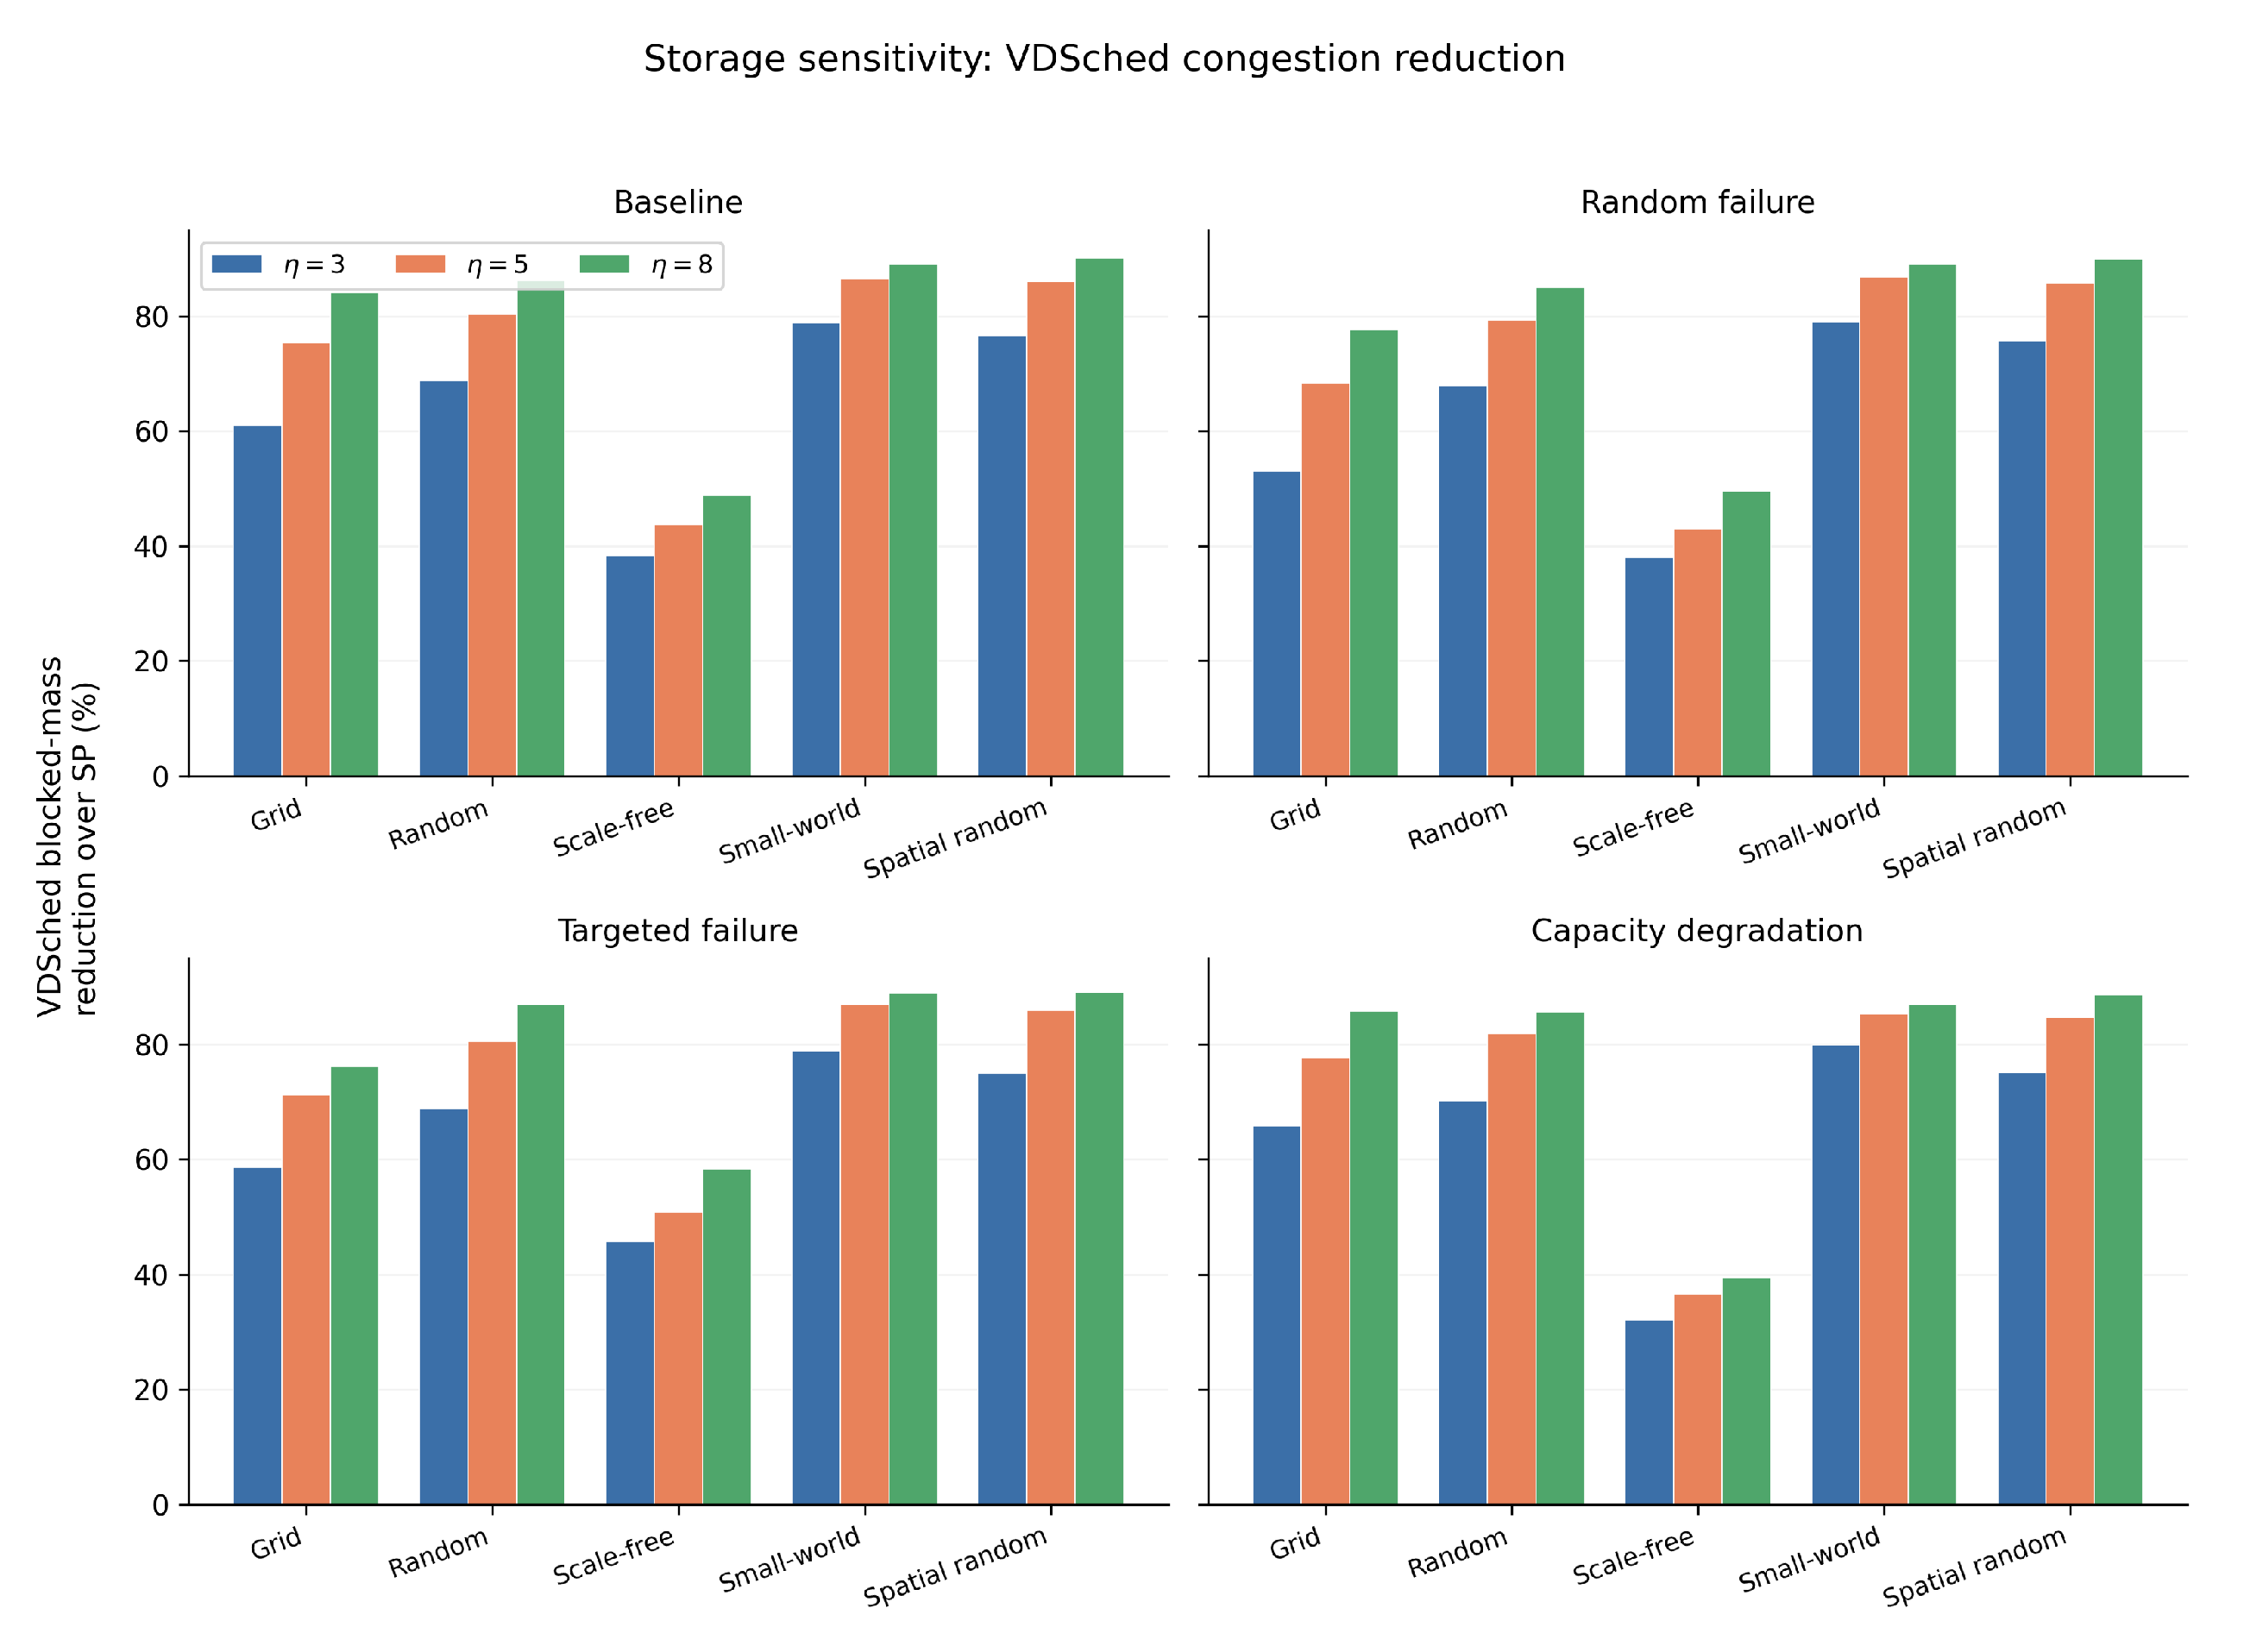
Figure A1 shows the blocked-mass sensitivity. VDSched reduces peak blocked mass under all topology, scenario, and storage combinations. The percentage reduction is generally largest under relaxed storage (): when nodes can accumulate larger queues before saturation, SP produces substantially higher absolute blocked mass that VDSched’s spillback-aware dispatch can more effectively offset.
Under tight storage (), all strategies experience stronger congestion pressure, compressing the relative reduction achievable by local scheduling, though VDSched retains its universal congestion-suppression advantage in absolute terms.
These findings qualify the storage dependence of VDSched. Its relative congestion suppression benefit is largest when storage is more relaxed rather than tighter. Spillback frequency and downstream saturation pressure both scale with storage tightness, but they pull SP and VDSched in different directions, and the net effect favors VDSched more under relaxed storage than under tight storage.
4.6. Summary of Findings
Four findings hold across all experiments. VDSched reduces peak blocked mass everywhere, from 36.5% to 87.0%, which confirms that congestion suppression is the mechanism’s main effect and that it does not depend on topology. Its delivery-time benefit, however, is topology-dependent rather than universal. That benefit only shows up where the topology offers efficient alternative routes, producing large gains in random networks, 18.9% to 23.6%, and spatial random networks, 31.6% to 36.7%, while grid networks and scale free networks under targeted failure see no real benefit at all. Congestion reduction and delivery-time reduction are separable outcomes.. Grid networks make this clearest. VDSched cuts blocked mass there while making delivery slower, so reducing peak load does not automatically mean reducing latency. Put together, these results say that how well scheduling aware routing performs depends jointly on topology and failure type, not on the algorithm by itself.
5. Discussion
5.1. The Congestion-Latency Trade-Off in Grid Networks
The simultaneous reduction of peak blocked mass (68.4–77.6%) and increase in mean delivery time (1.5–3.4%) produced by VDSched in grid networks is the most theoretically informative finding of this study. It demonstrates that congestion suppression and latency minimisation are independent effects, not co-incident consequences of scheduling-aware dispatch.
In a directed lattice (mean out-degree 3.80), vertex-disjoint alternative paths between any two nodes necessarily involve a Manhattan-distance detour: any path that avoids shared intermediate nodes must traverse additional edges. VDSched’s spillback-aware dispatch defers injection on the primary path when congestion is detected and redirects flow along these longer detours.
While this reduces the instantaneous peak of blocked flow; explaining the large congestion reduction, it increases the total path length traversed by delivered demand units. In the regular grid, the variance in alternative route lengths is low: detours offer no geometric shortcut, and the gain from spillback avoidance does not compensate for the delay penalty of the longer route. The result is that VDSched achieves peak-load reduction at the cost of latency.
The trade-off carries a direct operational implication for infrastructure resembling regular lattice topologies, urban arterial road grids, regular mesh communication fabrics, structured data-centre interconnects scheduling-aware multipath routing may be appropriate when the priority is peak-load reduction (infrastructure protection, queue management) but counterproductive when the priority is minimum delivery latency (time-sensitive logistics, interactive communication).
Notably, scale-free networks under targeted failure also exhibit a version of this decoupling: peak blocked mass is reduced by 50.8% under targeted failure (the highest scale-free reduction), while delivery time is statistically indistinguishable from SP (). With hub edges removed, VDSched can still route flow along the surviving vertex-disjoint paths, reducing individual congestion events, but the collapse of hub connectivity prevents these paths from offering meaningfully shorter routes than SP’s single shortest path.
5.2. Scale-Free Networks and the Structural Fragility Prediction
The scenario-dependent behaviour of scale-free networks provides a clean empirical validation of the theoretical predictions of Albert, Jeong and Barabási [11]. Under baseline, random failure, and capacity-degradation conditions, the heavy-tailed degree distribution of scale-free graphs (mean out-degree 9.88) provides rich hub-mediated routing alternatives that VDSched exploits, yielding medium effect delivery time improvements of 9.8–10.4% (: 0.70–0.72).
Under targeted removal of the 5% of edges with highest approximate betweenness centrality, hub connections are disproportionately removed. Hub edges carry the majority of vertex-disjoint paths between OD pairs; with these edges absent, VDSched’s candidate path sets collapse, and the heuristic degenerates toward single-path routing. The result , directly validates the asymmetry identified by Albert et al.: scale-free networks are robust to diffuse failure but fragile to targeted hub attack. Our results extend this prediction from node-removal robustness to routing-algorithm effectiveness, showing that the structural fragility under targeted attack also eliminates the scheduling advantage that hub redundancy normally provides.
5.3. Random and Spatial Random Networks: Efficient Alternative Routes
The strongest delivery-time gains occur in topologies where alternative routes are both vertex-disjoint and geometrically competitive with the shortest path.
In Erdős-Rényi random graphs with average degree , the absence of geometric constraints means alternative paths are available in multiple directions without systematic length penalties. In spatial random networks (, mean out-degree 13.32), the dense local clustering creates multiple short competing paths between nearby nodes, providing the richest supply of geometrically efficient alternatives in the dataset.
The scale of spatial random improvements, (31.6 to 36.7%), is particularly notable under stress conditions. The 36.7% delivery time reduction under capacity degradation (), indicates that VDSched’s advantage compounds when the base network is constrained. When edge capacities are halved, the shortest path becomes more likely to saturate, and VDSched’s ability to identify and redirect to uncongested alternatives becomes correspondingly more valuable. Dense urban wireless meshes and high utilisation freight road networks [28] are exactly this kind of spatial network operating near capacity, and the results here suggest scheduling aware routing would provide its greatest relative benefit in exactly those settings.
5.4. Small-World Networks: A Conditional and Stress-Amplified Benefit
The small-world results are asymmetric in a telling way. Improvement only reaches a large effect under capacity degradation, while the other three scenarios show negligible differences, and that gap points to a threshold effect. Small-world networks combine high local clustering with short average paths [12], creating inter-cluster bridge edges that carry concentrated traffic. Under nominal conditions, this concentration is insufficient to trigger the spillback cascade that VDSched’s defer-and-redirect logic is designed to mitigate. Under capacity degradation (edges at 50% capacity), the same concentrated traffic exceeds the reduced capacity threshold, activating the spillback mechanism and enabling VDSched to provide a 8.1% delivery-time improvement (). Whether scheduling-aware routing pays off in small-world infrastructure therefore depends critically on the network’s operating point relative to its capacity ceiling, not on the topology alone.
5.5. Practical Routing Strategy Selection
The experimental results support the following topology-aware decision rule:
- Prefer VDSched when the network exhibits usable path diversity and geometrically competitive alternative routes — conditions observed in Erdős–Rényi random topologies (mean out-degree ≈ 4) and spatial random topologies (mean out-degree 13.32) in this study — and when failures, if anticipated, are diffuse rather than targeted at high-centrality nodes.
- Prefer SP when the topology is regular or near-regular (grid-like, low degree variance; mean out-degree ), or when targeted infrastructure failures are anticipated that selectively destroy hub connectivity.
- Evaluate context in small-world and scale-free networks with diffuse failure: VDSched provides medium-effect delivery improvements (7.0–9.3%), but only SP is guaranteed competitive performance under targeted attack.
This decision rule can be operationalised by computing the mean vertex-disjoint path count for a representative OD sample, a polynomial-time computation, as a proxy for the structural redundancy on which scheduling-aware routing depends. Networks where this count is consistently along geometrically competitive routes are candidates for VDSched deployment.
5.6. Limitations and Future Work
Three limitations warrant mention. First, this study used node storage multiplier as the primary setting. A storage-sensitivity analysis across confirms that the topology-dependent performance regimes are qualitatively stable: grid networks favour SP and random or spatial random networks favour VDSched under all three storage conditions. However, the analysis reveals an asymmetry in storage sensitivity between the two main effects. VDSched’s congestion-suppression advantage in percentage terms is largest under relaxed storage (), where SP can accumulate larger queues that VDSched’s local dispatch avoids. The delivery-time benefit, by contrast, is only mildly storage-sensitive and remains primarily determined by topology. The relationship between storage and scheduling benefit turns out to be more nuanced than a simple spillback frequency account would predict. Spillback frequency rises as storage tightens, but downstream saturation pressure rises with it too, and the two effects do not move VDSched’s advantage in the same direction. The result is that relaxed storage, not tight storage, produces the largest relative gain. Full storage-sensitivity results are reported in Appendix B.
Second, demand is fixed per OD pair. Variable or stochastic demand may change the congestion dynamics and alter VDSched’s advantage in intermediate topologies (small-world, scale-free), particularly under load spikes.
Third, VDSched is a local heuristic; its performance relative to a globally optimal time-expanded minimum-cost flow scheduler remains unknown. Establishing this optimality gap and assessing whether it is topology-dependent in the same way as the VDSched-SP gap would bound the headroom for improvement beyond the current heuristic.
6. Conclusions
We evaluated four routing strategies: SP, KSP, VD, and VDSched across five canonical synthetic topologies and four failure scenarios in a discrete-time capacitated flow simulation (12,800 simulation runs). Our results yield two central findings.
First, VDSched is a robust congestion suppression mechanism. It reduces peak blocked mass by 36.5 to 87.0% relative to SP in every topology and scenario tested, (all , ). This result is not topology dependent. Even in grid networks, where VDSched provides no delivery time benefit, it substantially reduces instantaneous congestion.
Second, VDSched’s delivery time benefit is strongly topology dependent and governed by the geometric efficiency of available alternative routes. It provides large delivery time improvements in spatial random networks, 31.6–36.7%, and random networks, 18.9–23.6%, medium improvements in scale free networks under diffuse failure, 9.8–10.4%, and no significant benefit in scale free networks under targeted failure of structurally important edges or in grid networks. In grids, VDSched simultaneously reduces congestion and increases delivery time, demonstrating that these are independent effects.
These findings establish that effective routing strategy selection requires alignment between algorithm design, network topology, and anticipated failure mode. VDSched is not a universally superior routing strategy; it is a congestion-control mechanism that provides latency benefits only when the underlying topology offers efficient routing alternatives that single-path strategies fail to exploit.
Data Availability Statement
Simulation code, synthetic graph inputs, processed graph instances, origin-destination files, merged result files, statistical analysis scripts, storage-sensitivity outputs, figures, and table-generation scripts used in this study are publicly available in the accompanying reproducibility repository: Eluwah, N. (2026). Network Resilience Routing: Code and Data for Structural Redundancy and Topology-Dependent Multipath Routing Studies. Zenodo. https://doi.org/10.5281/zenodo.20801055. The files specific to this study are located under the repository subdirectory paper2_synthetic_topologies/. The shared Go implementation of the capacitated discrete-time routing simulator is provided under shared/go_simulator/. The archived repository includes the run-level manifest and explicit failure-seed pairing files used to reproduce the paired statistical comparisons for the random edge-failure scenario.
Appendix A. Complete Statistical Results
Table A1 reports the complete paired comparison between VDSched and SP for peak blocked mass across all topology-scenario combinations. VDSched reduces peak blocked mass in every cell tested. All comparisons yield .
Table A1.
Paired comparison of VDSched and SP for peak blocked mass (flow units) across all topology-scenario cells. All improvements are positive, indicating lower blocked mass under VDSched in every case. All .
Table A1.
Paired comparison of VDSched and SP for peak blocked mass (flow units) across all topology-scenario cells. All improvements are positive, indicating lower blocked mass under VDSched in every case. All .
| Topology | Scenario | SP | VDSched | Diff. | Reduction | |
|---|---|---|---|---|---|---|
| Grid | Baseline | 295.80 | 73.25 | −222.55 | +75.2% | -2.865 |
| Grid | Random failure | 295.55 | 93.49 | −202.05 | +68.4% | -2.632 |
| Grid | Targeted failure | 268.44 | 77.26 | −191.18 | +71.2% | -2.720 |
| Grid | Capacity degradation | 270.09 | 60.52 | −209.56 | +77.6% | -2.708 |
| Random | Baseline | 925.34 | 182.10 | −743.24 | +80.3% | -4.638 |
| Random | Random failure | 940.59 | 194.76 | −745.83 | +79.3% | -4.465 |
| Random | Targeted failure | 901.46 | 175.11 | −726.35 | +80.6% | -4.325 |
| Random | Capacity degradation | 872.12 | 158.00 | −714.12 | +81.9% | -4.428 |
| Scale-free | Baseline | 1504.19 | 846.84 | −657.35 | +43.7% | -2.909 |
| Scale-free | Random failure | 1542.60 | 880.08 | −662.52 | +42.9% | -2.824 |
| Scale-free | Targeted failure | 974.10 | 479.40 | −494.70 | +50.8% | -2.254 |
| Scale-free | Capacity degradation | 1268.75 | 805.12 | −463.62 | +36.5% | -2.063 |
| Small-world | Baseline | 724.14 | 98.01 | −626.12 | +86.5% | -3.546 |
| Small-world | Random failure | 737.51 | 97.58 | −639.93 | +86.8% | -3.615 |
| Small-world | Targeted failure | 751.64 | 98.08 | −653.56 | +87.0% | -3.616 |
| Small-world | Capacity degradation | 589.31 | 86.62 | −502.69 | +85.3% | -3.108 |
| Spatial random | Baseline | 1229.86 | 171.97 | −1057.89 | +86.0% | -6.061 |
| Spatial random | Random failure | 1214.97 | 173.87 | −1041.10 | +85.7% | -5.827 |
| Spatial random | Targeted failure | 1186.30 | 166.85 | −1019.45 | +85.9% | -6.060 |
| Spatial random | Capacity degradation | 952.16 | 145.70 | −806.46 | +84.7% | -4.201 |
Appendix B. Storage Sensitivity Results
This appendix reports the complete delivery-time and congestion results for the storage-sensitivity analysis (. The primary results ( are reported in the main text; and results are reported here. Table A2 presents VDSched delivery-time improvement relative to SP for all storage conditions. Table A3 presents the corresponding blocked-mass reductions.
Table A2.
VDSched delivery-time improvement (%) relative to SP across storage multipliers , topology, and scenario. Positive values indicate VDSched reduces delivery time; negative values indicate VDSched is slower than SP. Values are rounded to two decimal places.
Table A2.
VDSched delivery-time improvement (%) relative to SP across storage multipliers , topology, and scenario. Positive values indicate VDSched reduces delivery time; negative values indicate VDSched is slower than SP. Values are rounded to two decimal places.
| Topology | Scenario | Regime | |||
|---|---|---|---|---|---|
| Grid | Baseline | −2.02% | −2.71% | −2.97% | SP better |
| Grid | Random failure | −2.44% | −3.25% | −3.52% | SP better |
| Grid | Targeted failure | −3.33% | −3.43% | −3.69% | SP better |
| Grid | Capacity degradation | −0.87% | −1.53% | −1.82% | SP better |
| Random | Baseline | +22.69% | +20.06% | +20.89% | VDSched better |
| Random | Random failure | +22.89% | +19.60% | +19.87% | VDSched better |
| Random | Targeted failure | +22.16% | +18.94% | +20.65% | VDSched better |
| Random | Capacity degradation | +26.29% | +23.59% | +23.70% | VDSched better |
| Scale-free | Baseline | +9.95% | +9.86% | +8.79% | VDSched better |
| Scale-free | Random failure | +10.51% | +9.80% | +9.85% | VDSched better |
| Scale-free | Targeted failure | −1.27% | −1.06% | −2.02% | SP better |
| Scale-free | Capacity degradation | +14.45% | +10.43% | +7.15% | VDSched better |
| Small-world | Baseline | +1.52% | +2.33% | +2.72% | Weak VDSched benefit |
| Small-world | Random failure | +1.51% | +1.91% | +2.87% | Weak VDSched benefit |
| Small-world | Targeted failure | +1.88% | +0.89% | +2.09% | Weak VDSched benefit |
| Small-world | Capacity degradation | +9.10% | +8.15% | +6.33% | VDSched better |
| Spatial random | Baseline | +31.09% | +32.63% | +32.31% | VDSched better |
| Spatial random | Random failure | +30.19% | +31.56% | +31.64% | VDSched better |
| Spatial random | Targeted failure | +28.98% | +31.56% | +30.97% | VDSched better |
| Spatial random | Capacity degradation | +37.49% | +36.75% | +33.75% | VDSched better |
Table A3.
VDSched peak blocked-mass reduction (%) relative to SP across storage multipliers , topology, and scenario. All values are positive, indicating that VDSched reduces congestion in every topology-scenario-storage cell. Values are rounded to two decimal places.
Table A3.
VDSched peak blocked-mass reduction (%) relative to SP across storage multipliers , topology, and scenario. All values are positive, indicating that VDSched reduces congestion in every topology-scenario-storage cell. Values are rounded to two decimal places.
| Topology | Scenario | Direction | |||
|---|---|---|---|---|---|
| Grid | Baseline | +60.93% | +75.24% | +84.11% | largest |
| Grid | Random failure | +53.03% | +68.37% | +77.67% | largest |
| Grid | Targeted failure | +58.64% | +71.22% | +76.29% | largest |
| Grid | Capacity degradation | +65.74% | +77.59% | +85.75% | largest |
| Random | Baseline | +68.71% | +80.32% | +86.23% | largest |
| Random | Random failure | +67.85% | +79.29% | +85.01% | largest |
| Random | Targeted failure | +68.83% | +80.57% | +86.86% | largest |
| Random | Capacity degradation | +70.14% | +81.88% | +85.64% | largest |
| Scale-free | Baseline | +38.39% | +43.70% | +48.78% | largest |
| Scale-free | Random failure | +37.94% | +42.95% | +49.47% | largest |
| Scale-free | Targeted failure | +45.76% | +50.79% | +58.30% | largest |
| Scale-free | Capacity degradation | +32.14% | +36.54% | +39.35% | largest |
| Small-world | Baseline | +78.76% | +86.46% | +88.96% | largest |
| Small-world | Random failure | +78.93% | +86.77% | +89.02% | largest |
| Small-world | Targeted failure | +78.81% | +86.95% | +88.93% | largest |
| Small-world | Capacity degradation | +79.89% | +85.30% | +86.89% | largest |
| Spatial random | Baseline | +76.54% | +86.02% | +90.09% | largest |
| Spatial random | Random failure | +75.62% | +85.69% | +89.81% | largest |
| Spatial random | Targeted failure | +74.98% | +85.94% | +89.00% | largest |
| Spatial random | Capacity degradation | +75.05% | +84.70% | +88.69% | largest |
Positive values indicate lower peak blocked mass under VDSched relative to SP. In every cell, VDSched reduces blocked mass; the largest percentage reduction occurs at .
Figure A1.
Sensitivity of VDSched peak blocked-mass reduction to node storage multiplier , by topology and scenario. All values are positive, confirming that VDSched reduces peak congestion in every topology, scenario, and storage condition. The percentage reduction is generally largest for (relaxed storage): when nodes can accumulate larger queues before saturation, SP generates substantially higher absolute blocked mass that VDSched’s local dispatch avoids. Under tight storage (), all strategies experience stronger congestion pressure, compressing the relative reduction.
Figure A1.
Sensitivity of VDSched peak blocked-mass reduction to node storage multiplier , by topology and scenario. All values are positive, confirming that VDSched reduces peak congestion in every topology, scenario, and storage condition. The percentage reduction is generally largest for (relaxed storage): when nodes can accumulate larger queues before saturation, SP generates substantially higher absolute blocked mass that VDSched’s local dispatch avoids. Under tight storage (), all strategies experience stronger congestion pressure, compressing the relative reduction.
Appendix C
Appendix C.1. Discrete-Time Capacitated Simulation Update
Algorithm A1 describes the common discrete-time simulation loop used by all routing strategies. The routing strategies differ in path assignment and, for VDSched, in the ordering of queued dispatches. SP, KSP, and VD use the same capacity, storage, pipeline, and spillback rules but do not apply the VDSched priority score during node-level dispatch.
| Algorithm A1 Discrete-time capacitated simulation update |
|
Appendix C.2. Targeted Edge-Failure Selection
Algorithm A2 gives the targeted-failure procedure used in the experiments. The score is an approximate shortest-path edge-betweenness measure based on shortest-path traversal counts, using one shortest-path per reachable source-target pair. It is used to identify structurally important directed edges for disruption. In the final experiments, the removed fraction was .
| Algorithm A2 Targeted edge-failure selection |
|
Appendix D. Software Environment and Reproducibility
Appendix D.1. Code and Reproducibility
All simulation code, processed inputs, run manifests, merged result files, statistical-analysis scripts, and figure-generation scripts are archived with the accompanying Zenodo release. The repository includes the explicit run-level manifest used to reconstruct the final merged dataset. In the random edge-failure scenario, the random-failure seed was extracted from each run-level filename and retained as an explicit pairing identifier, allowing paired statistical comparisons to be reproduced on matched graph-seed, instance, topology, scenario, and failure-seed units. The repository also includes the , , and storage-sensitivity outputs used in the appendix tables and figures.
Appendix D.2. Software Environment
Graph generation, result processing, statistical analysis, and figure generation were performed using Python 3 with standard scientific computing libraries, including pandas, NumPy, SciPy, NetworkX, and Matplotlib. Discrete-time routing simulations were implemented in Go. The archived repository includes the Go simulator source code, Python analysis scripts, and dependency specifications required to reproduce the reported results.
References
- Newman, M.E.J. The structure and function of complex networks. SIAM Rev. 2003, 45, 167–256. [Google Scholar] [CrossRef]
- Barthélémy, M. Spatial networks. Phys. Rep. 2011, 499, 1–101. [Google Scholar] [CrossRef]
- Fortz, B.; Thorup, M. Internet traffic engineering by optimizing OSPF weights. Proc. IEEE INFOCOM; 2000; pp. 519–528. [Google Scholar]
- Kelly, F.P.; Maulloo, A.K.; Tan, D.K.H. Rate control for communication networks: shadow prices, proportional fairness and stability. J. Oper. Res. Soc. 1998, 49, 237–252. [Google Scholar] [CrossRef]
- Yen, J.Y. Finding the k shortest loopless paths in a network. Manag. Sci. 1971, 17, 712–716. [Google Scholar] [CrossRef]
- Eppstein, D. Finding the k shortest paths. SIAM J. Comput. 1998, 28, 652–673. [Google Scholar] [CrossRef]
- Suurballe, J.W. Disjoint paths in a network. Networks 1974, 4, 125–145. [Google Scholar] [CrossRef]
- Alizadeh, M.; Edsall, T.; Dharmapurikar, S.; et al. CONGA: Distributed congestion-aware load balancing for datacenters. In Proceedings of the Proc. ACM SIGCOMM, 2014; pp. 503–514. [Google Scholar]
- Tassiulas, L.; Ephremides, A. Stability properties of constrained queueing systems and scheduling policies. IEEE Trans. Autom. Control 1992, 37, 1936–1948. [Google Scholar] [CrossRef]
- Barabási, A.L.; Albert, R. Emergence of scaling in random networks. Science 1999, 286, 509–512. [Google Scholar] [CrossRef] [PubMed]
- Albert, R.; Jeong, H.; Barabási, A.L. Error and attack tolerance of complex networks. Nature 2000, 406, 378–382. [Google Scholar] [CrossRef] [PubMed]
- Watts, D.J.; Strogatz, S.H. Collective dynamics of `small-world’ networks. Nature 1998, 393, 440–442. [Google Scholar] [CrossRef] [PubMed]
- Ford, L.R.; Fulkerson, D.R. Maximal flow through a network. Can. J. Math. 1956, 8, 399–404. [Google Scholar] [CrossRef]
- Diestel, R. Graph Theory, 4th ed.; Springer, 2010. [Google Scholar]
- Dijkstra, E.W. A note on two problems in connexion with graphs. Numer. Math. 1959, 1, 269–271. [Google Scholar] [CrossRef]
- Moy, J. OSPF version 2. RFC 2328. 1998.
- Räcke, H. Optimal hierarchical decompositions for congestion minimization in networks. In Proceedings of the Proc. ACM STOC, 2008; pp. 255–264. [Google Scholar]
- Awduche, D.; Berger, L.; Gan, D.; Li, T.; Srinivasan, V.; Swallow, G. Overview and principles of Internet traffic engineering. 2002. [Google Scholar] [CrossRef]
- Raiciu, C.; Barre, S.; Pluntke, C.; et al. Improving datacenter performance and robustness with multipath TCP. In Proceedings of the Proc. ACM SIGCOMM, 2011; pp. 266–277. [Google Scholar]
- Al-Fares, M.; Radhakrishnan, S.; Raghavan, B.; et al. Hedera: Dynamic flow scheduling for data center networks. In Proceedings of the Proc. USENIX NSDI, 2010. [Google Scholar]
- Katta, N.; Hira, M.; Kim, C.; Sivaraman, A.; Rexford, J. HULA: Scalable load balancing using programmable data planes. In Proceedings of the Proc. ACM SOSR, 2016. [Google Scholar]
- Wang, Z.; Crowcroft, J. Synthesis of multicast protocols. IEEE/ACM Trans. Netw. 1996, 4, 535–546. [Google Scholar]
- Neely, M.J. Stochastic Network Optimization with Application to Communication and Queueing Systems; Morgan & Claypool, 2010. [Google Scholar]
- Daganzo, C.F. The cell transmission model: A dynamic representation of highway traffic consistent with the hydrodynamic theory. Transp. Res. Part B 1994, 28, 269–287. [Google Scholar] [CrossRef]
- Newell, G.F. A simplified theory of kinematic waves in highway traffic. Transp. Res. Part B 1993, 27, 281–313. [Google Scholar] [CrossRef]
- Berdica, K. An introduction to road vulnerability: what has been done, is done and should be done. Transp. Policy 2002, 9, 117–127. [Google Scholar] [CrossRef]
- Jenelius, E.; Petersen, T.; Mattsson, L.G. Importance and exposure in road network vulnerability analysis. Transp. Res. Part A 2006, 40, 537–560. [Google Scholar] [CrossRef]
- Reggiani, A.; Nijkamp, P.; Lanzi, D. Transport resilience and vulnerability: The role of connectivity. Transp. Res. Part A 2015, 81, 4–15. [Google Scholar] [CrossRef]
- Cohen, J. Statistical Power Analysis for the Behavioral Sciences, 2nd ed.; Lawrence Erlbaum Associates: Hillsdale, NJ, 1988. [Google Scholar]
Figure 1.
Dominant routing algorithm across topology-scenario combinations, determined by lowest mean delivery time. VDSched dominates in random, scale-free (under baseline, random failure, and capacity degradation), and spatial random topologies. SP dominates in all grid scenarios and in scale-free networks under targeted edge failure. Small-world networks show mixed dominance.
Figure 1.
Dominant routing algorithm across topology-scenario combinations, determined by lowest mean delivery time. VDSched dominates in random, scale-free (under baseline, random failure, and capacity degradation), and spatial random topologies. SP dominates in all grid scenarios and in scale-free networks under targeted edge failure. Small-world networks show mixed dominance.
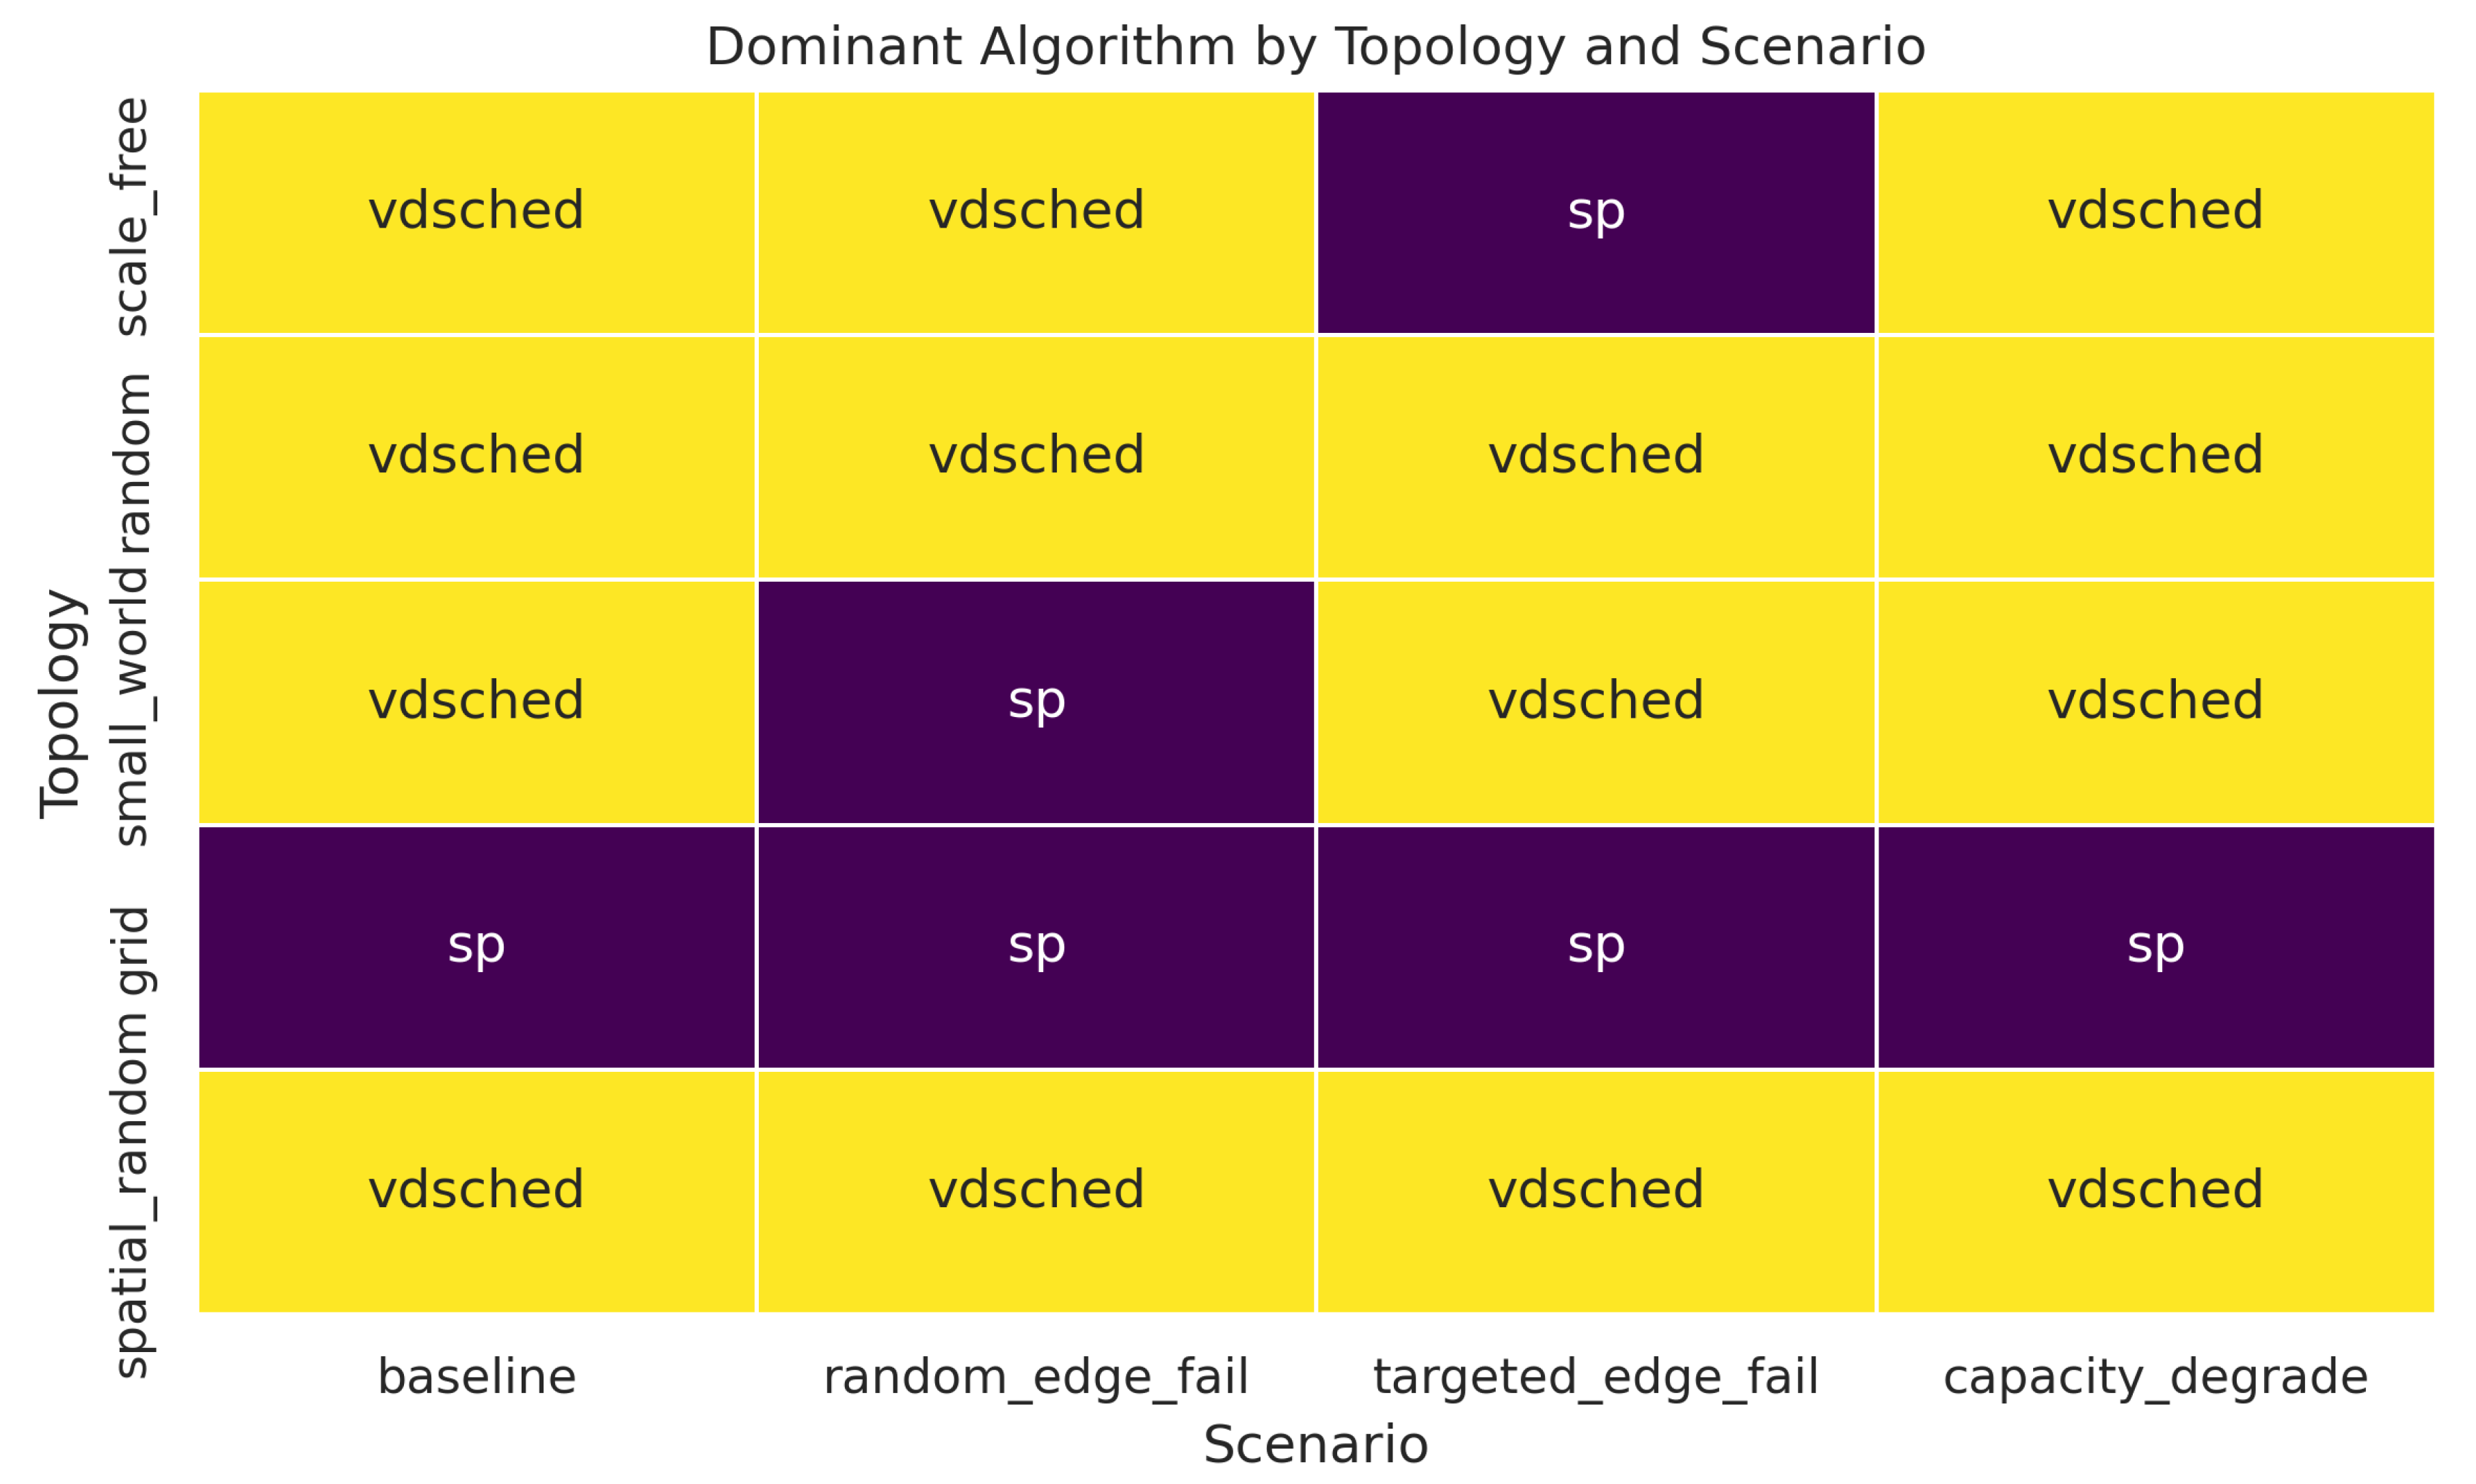
Figure 2.
Percentage reduction in peak blocked mass achieved by VDSched relative to SP, by topology and scenario. Positive values indicate VDSched reduces congestion relative to SP. VDSched reduces peak blocked mass in every topology-scenario combination (all ). The smallest reductions occur in scale-free networks (36.5 to 50.8%), reflecting the hub-concentrated path structure of preferential-attachment graphs. The largest reductions occur in small-world and spatial random networks (84.7 to 87.0%).
Figure 2.
Percentage reduction in peak blocked mass achieved by VDSched relative to SP, by topology and scenario. Positive values indicate VDSched reduces congestion relative to SP. VDSched reduces peak blocked mass in every topology-scenario combination (all ). The smallest reductions occur in scale-free networks (36.5 to 50.8%), reflecting the hub-concentrated path structure of preferential-attachment graphs. The largest reductions occur in small-world and spatial random networks (84.7 to 87.0%).
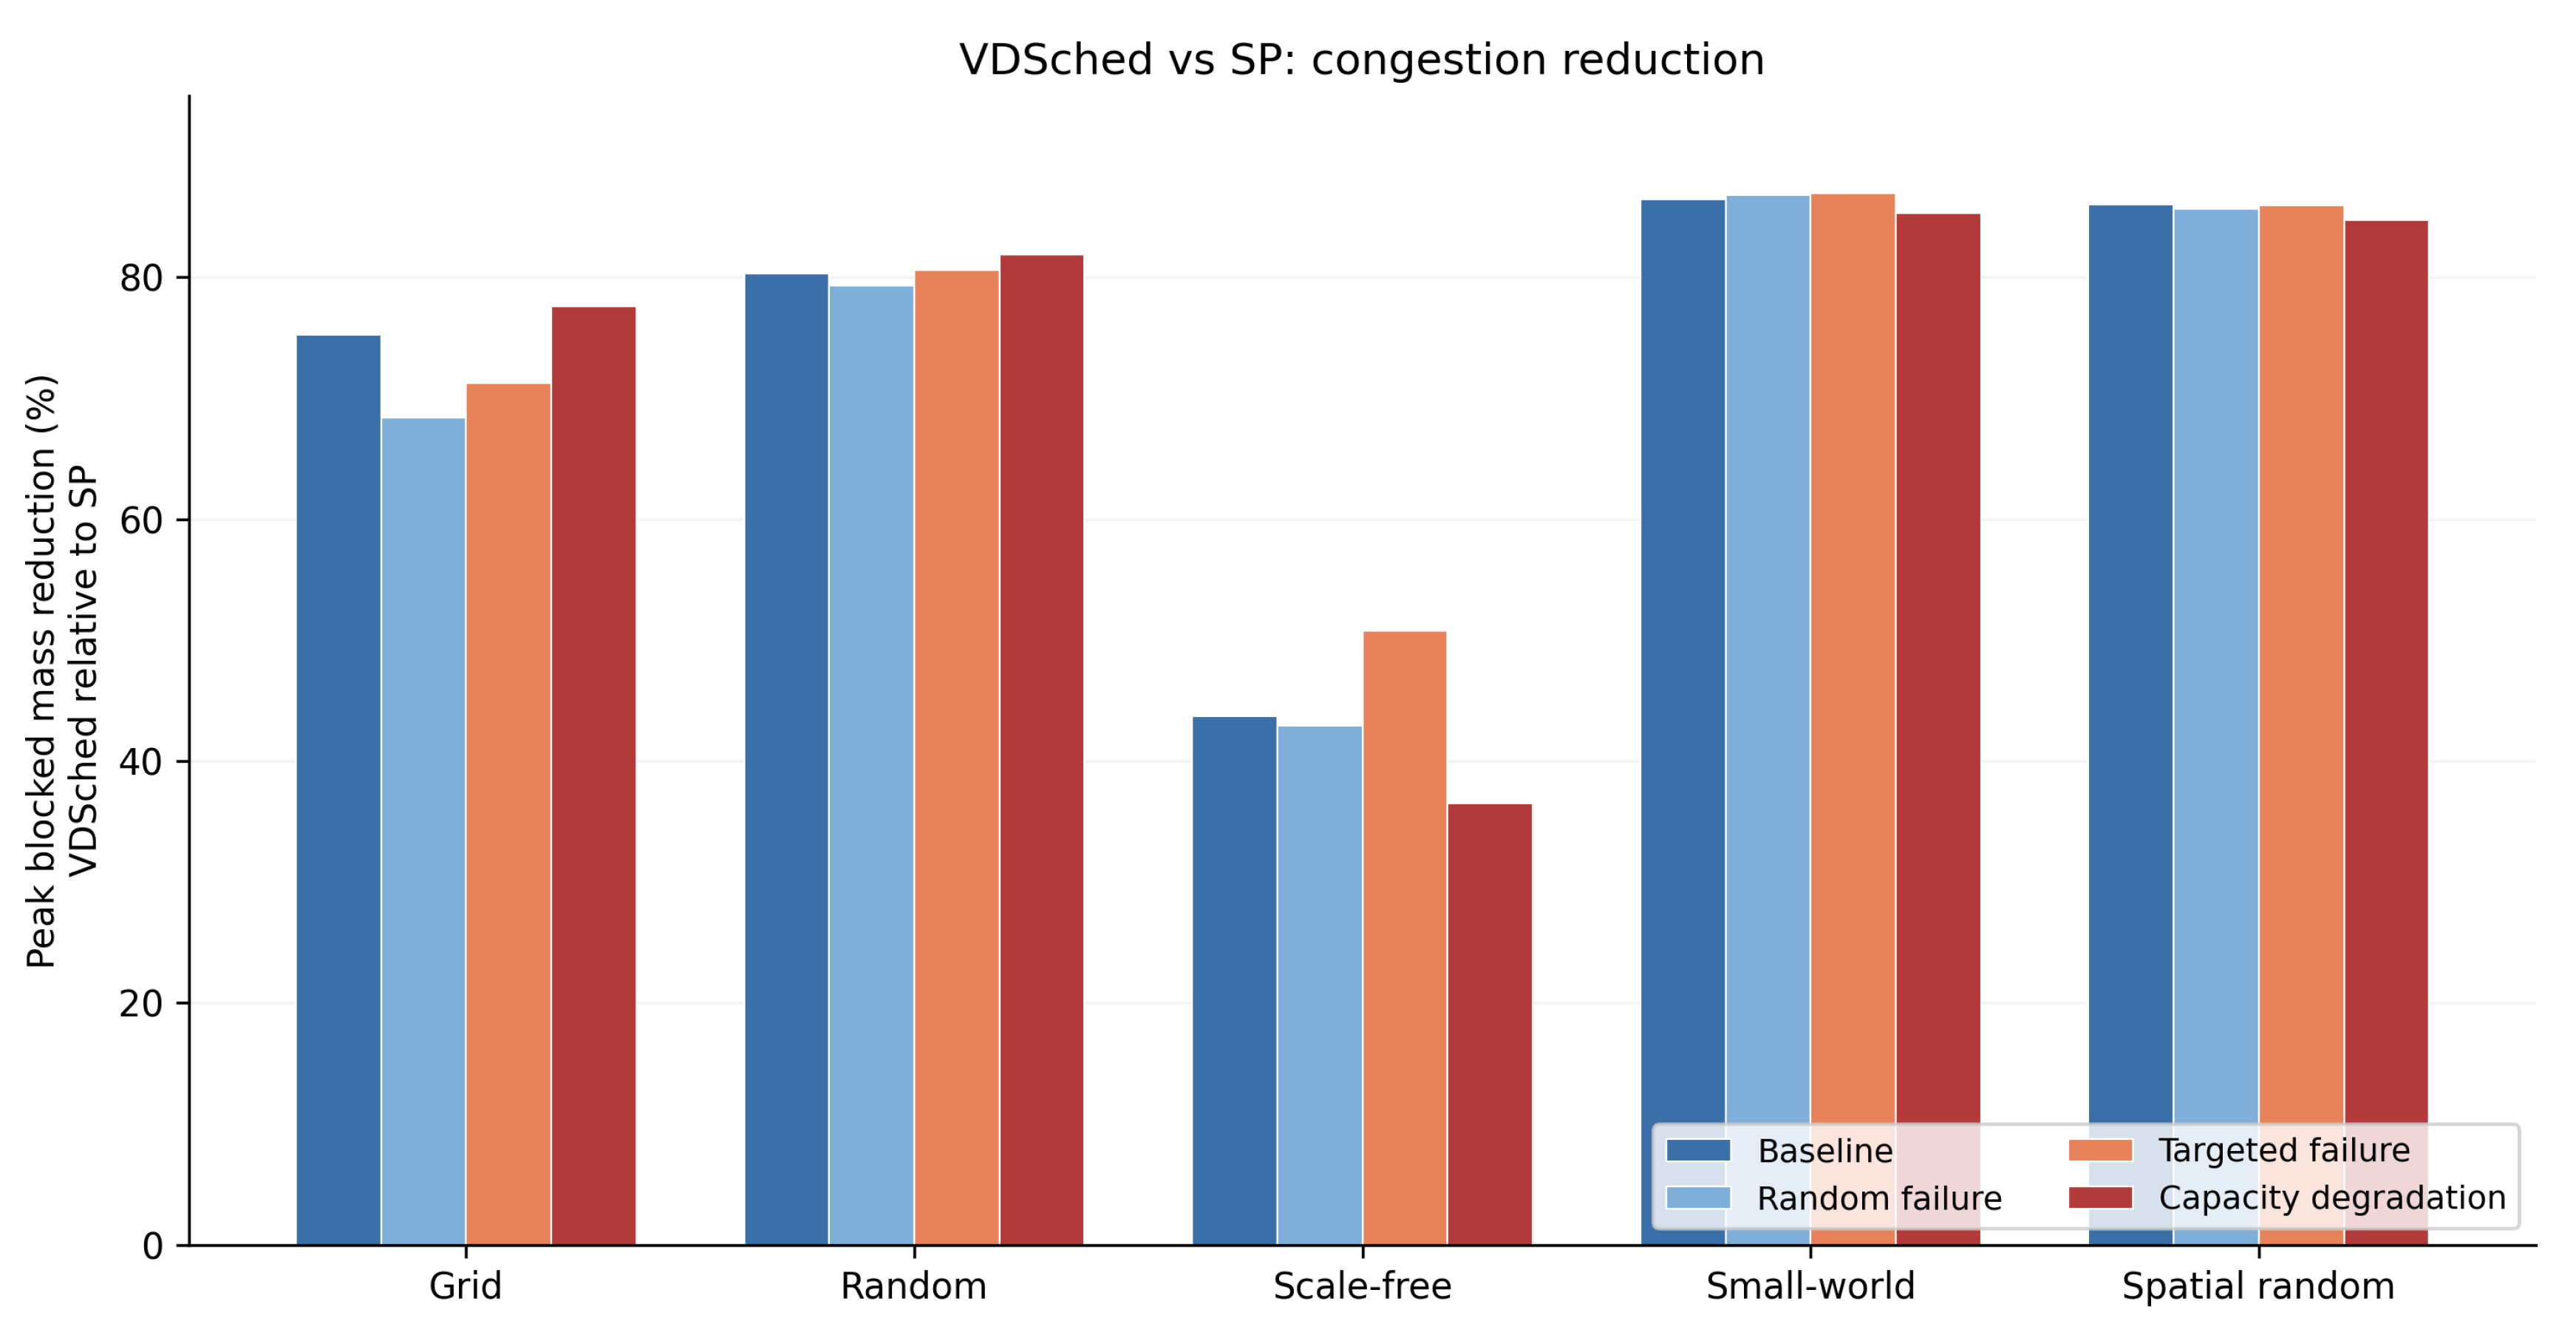
Figure 3.
Paired mean delivery-time difference (VDSched - SP) with 95% confidence intervals, by topology and scenario. Negative values (bars below zero) indicate VDSched reduces delivery time; positive values indicate SP is faster. Grid networks show consistently positive differences across all scenarios, while random and spatial random networks show strongly negative differences. Small-world bars are near zero in three of four scenarios, reflecting negligible effect sizes except under capacity degradation (), the only scenario where VDSched provides a large delivery-time benefit in small-world networks. Scale-free targeted failure is the only non-grid cell where VDSched is statistically indistinguishable from SP.
Figure 3.
Paired mean delivery-time difference (VDSched - SP) with 95% confidence intervals, by topology and scenario. Negative values (bars below zero) indicate VDSched reduces delivery time; positive values indicate SP is faster. Grid networks show consistently positive differences across all scenarios, while random and spatial random networks show strongly negative differences. Small-world bars are near zero in three of four scenarios, reflecting negligible effect sizes except under capacity degradation (), the only scenario where VDSched provides a large delivery-time benefit in small-world networks. Scale-free targeted failure is the only non-grid cell where VDSched is statistically indistinguishable from SP.
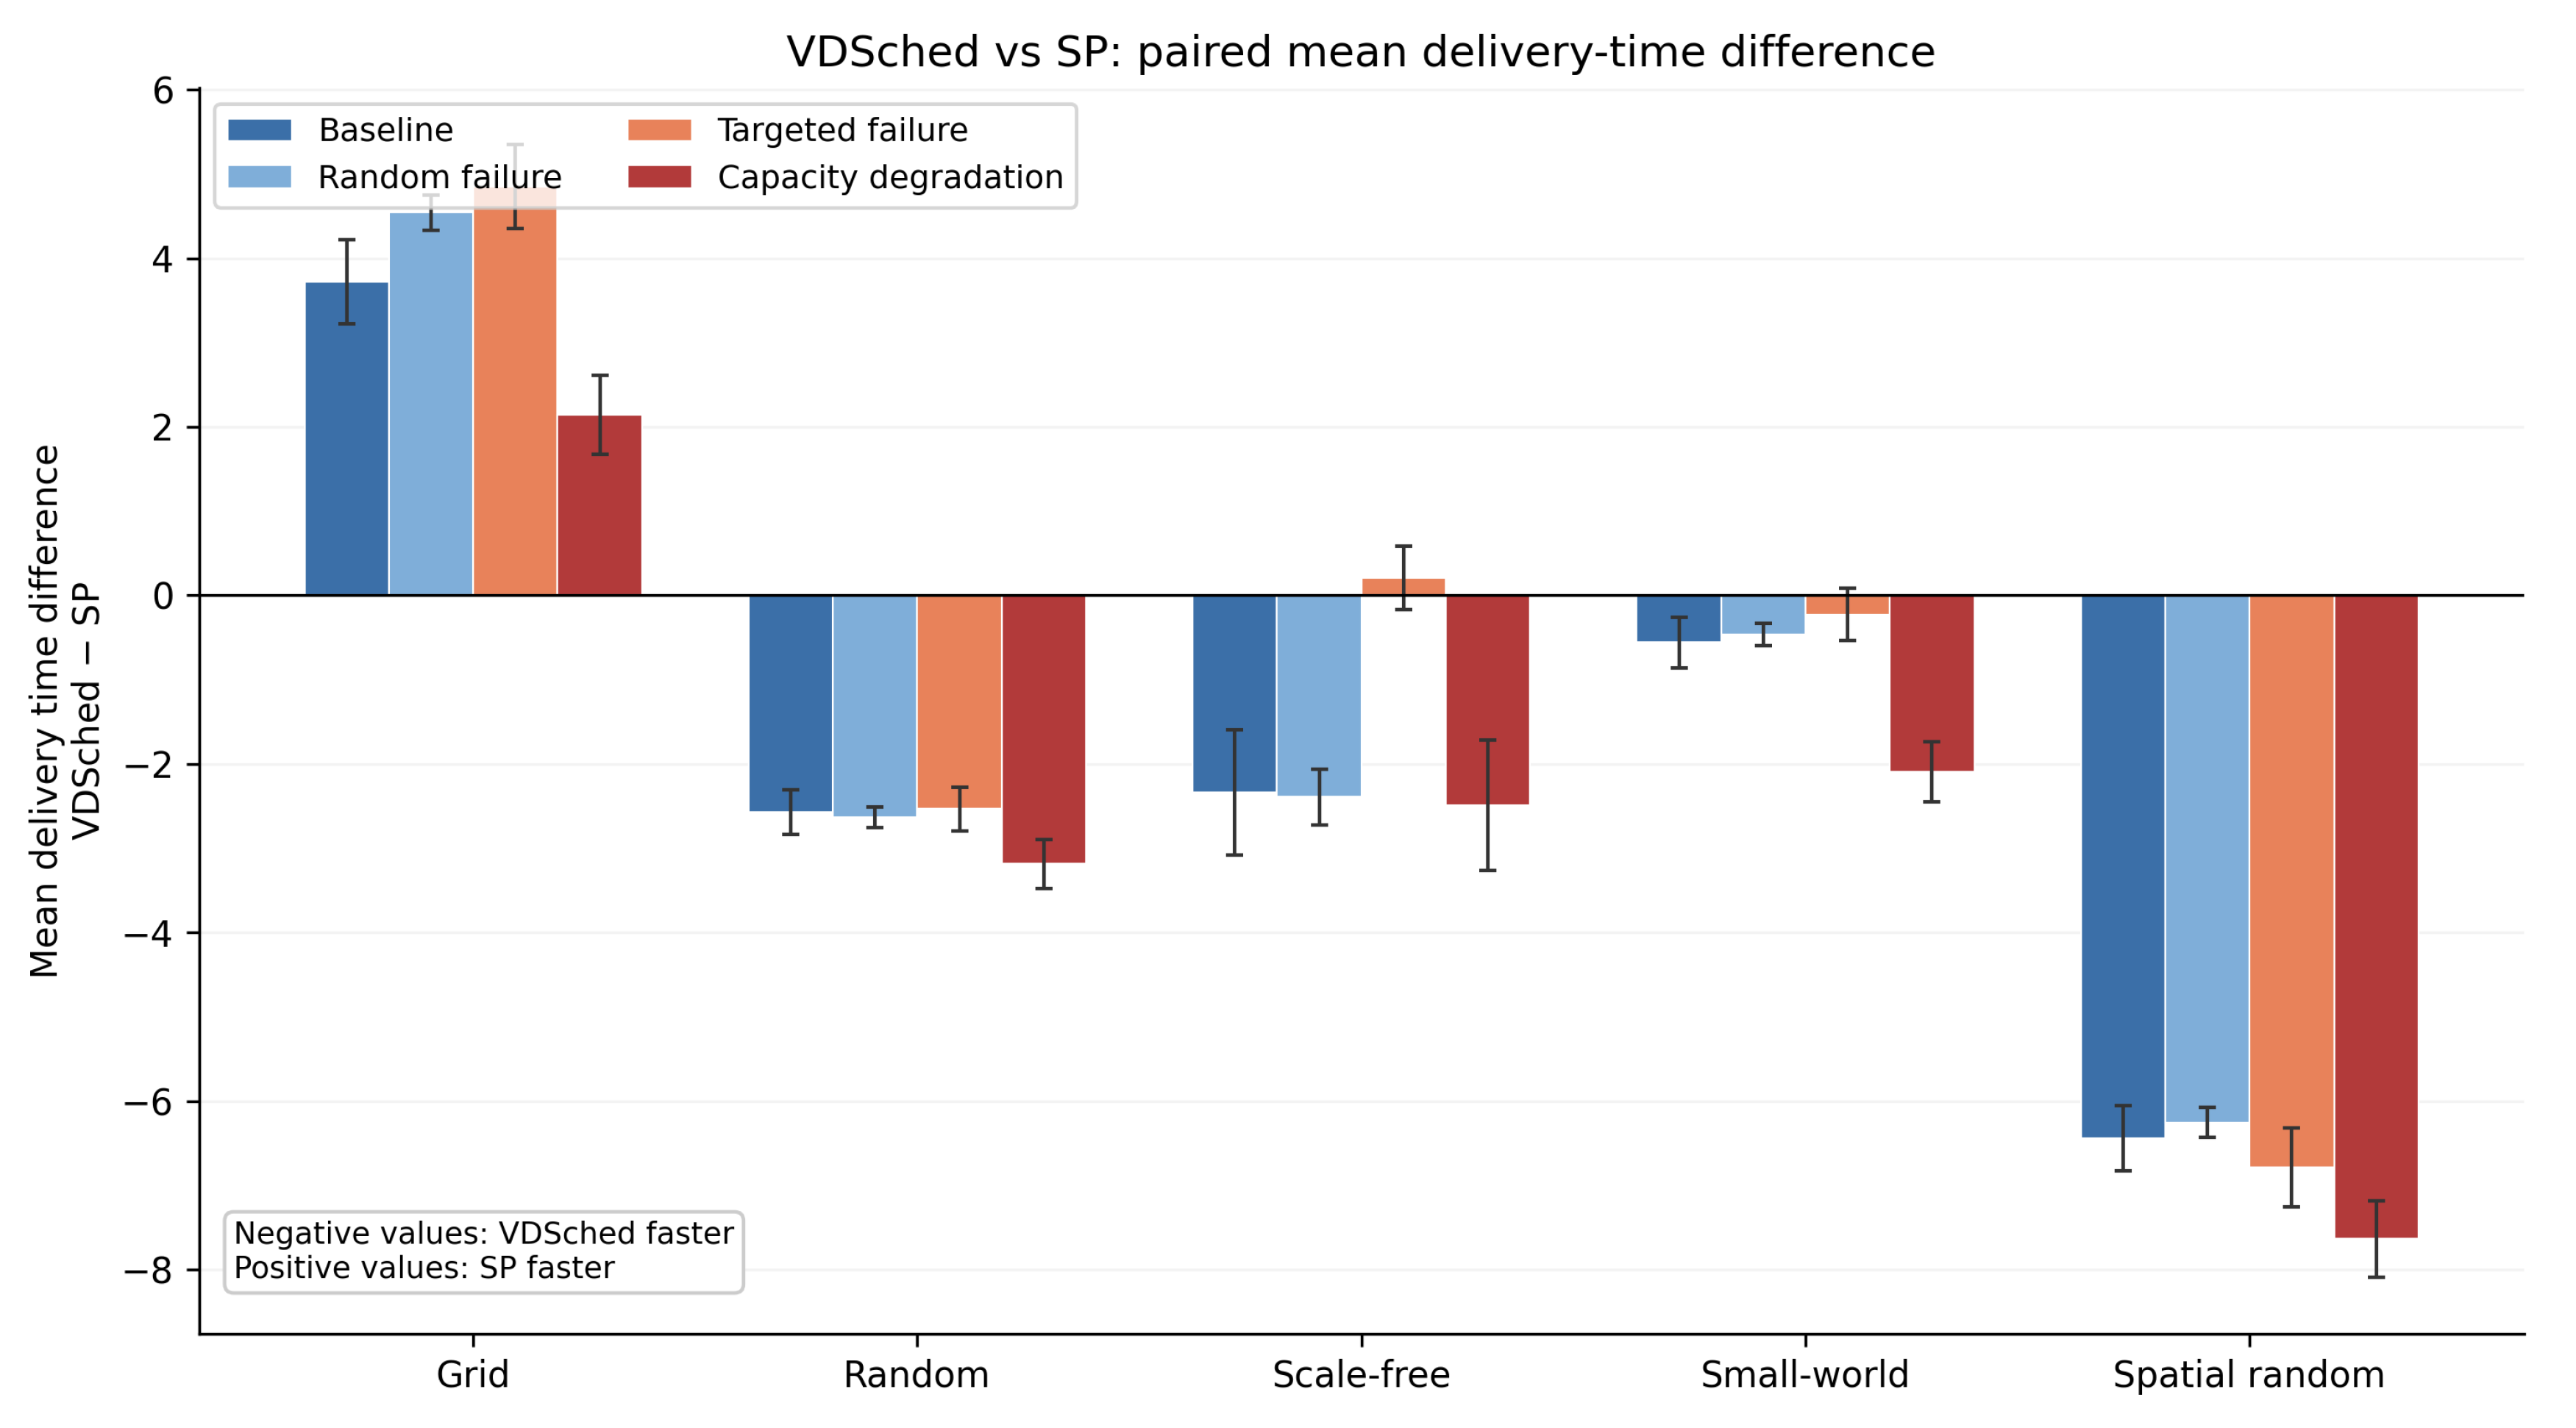
Figure 4.
Sensitivity of VDSched delivery-time improvement relative to SP to node storage multiplier , by topology and scenario. Positive values indicate VDSched reduces mean delivery time; negative values indicate VDSched is slower than SP. The qualitative topology-dependent pattern is stable across storage settings: VDSched is consistently beneficial in random and spatial random networks, consistently slower in grid networks, and scenario-dependent in scale-free and small-world networks. Storage multiplier affects effect magnitude but does not reverse any topology-dependent regime.
Figure 4.
Sensitivity of VDSched delivery-time improvement relative to SP to node storage multiplier , by topology and scenario. Positive values indicate VDSched reduces mean delivery time; negative values indicate VDSched is slower than SP. The qualitative topology-dependent pattern is stable across storage settings: VDSched is consistently beneficial in random and spatial random networks, consistently slower in grid networks, and scenario-dependent in scale-free and small-world networks. Storage multiplier affects effect magnitude but does not reverse any topology-dependent regime.
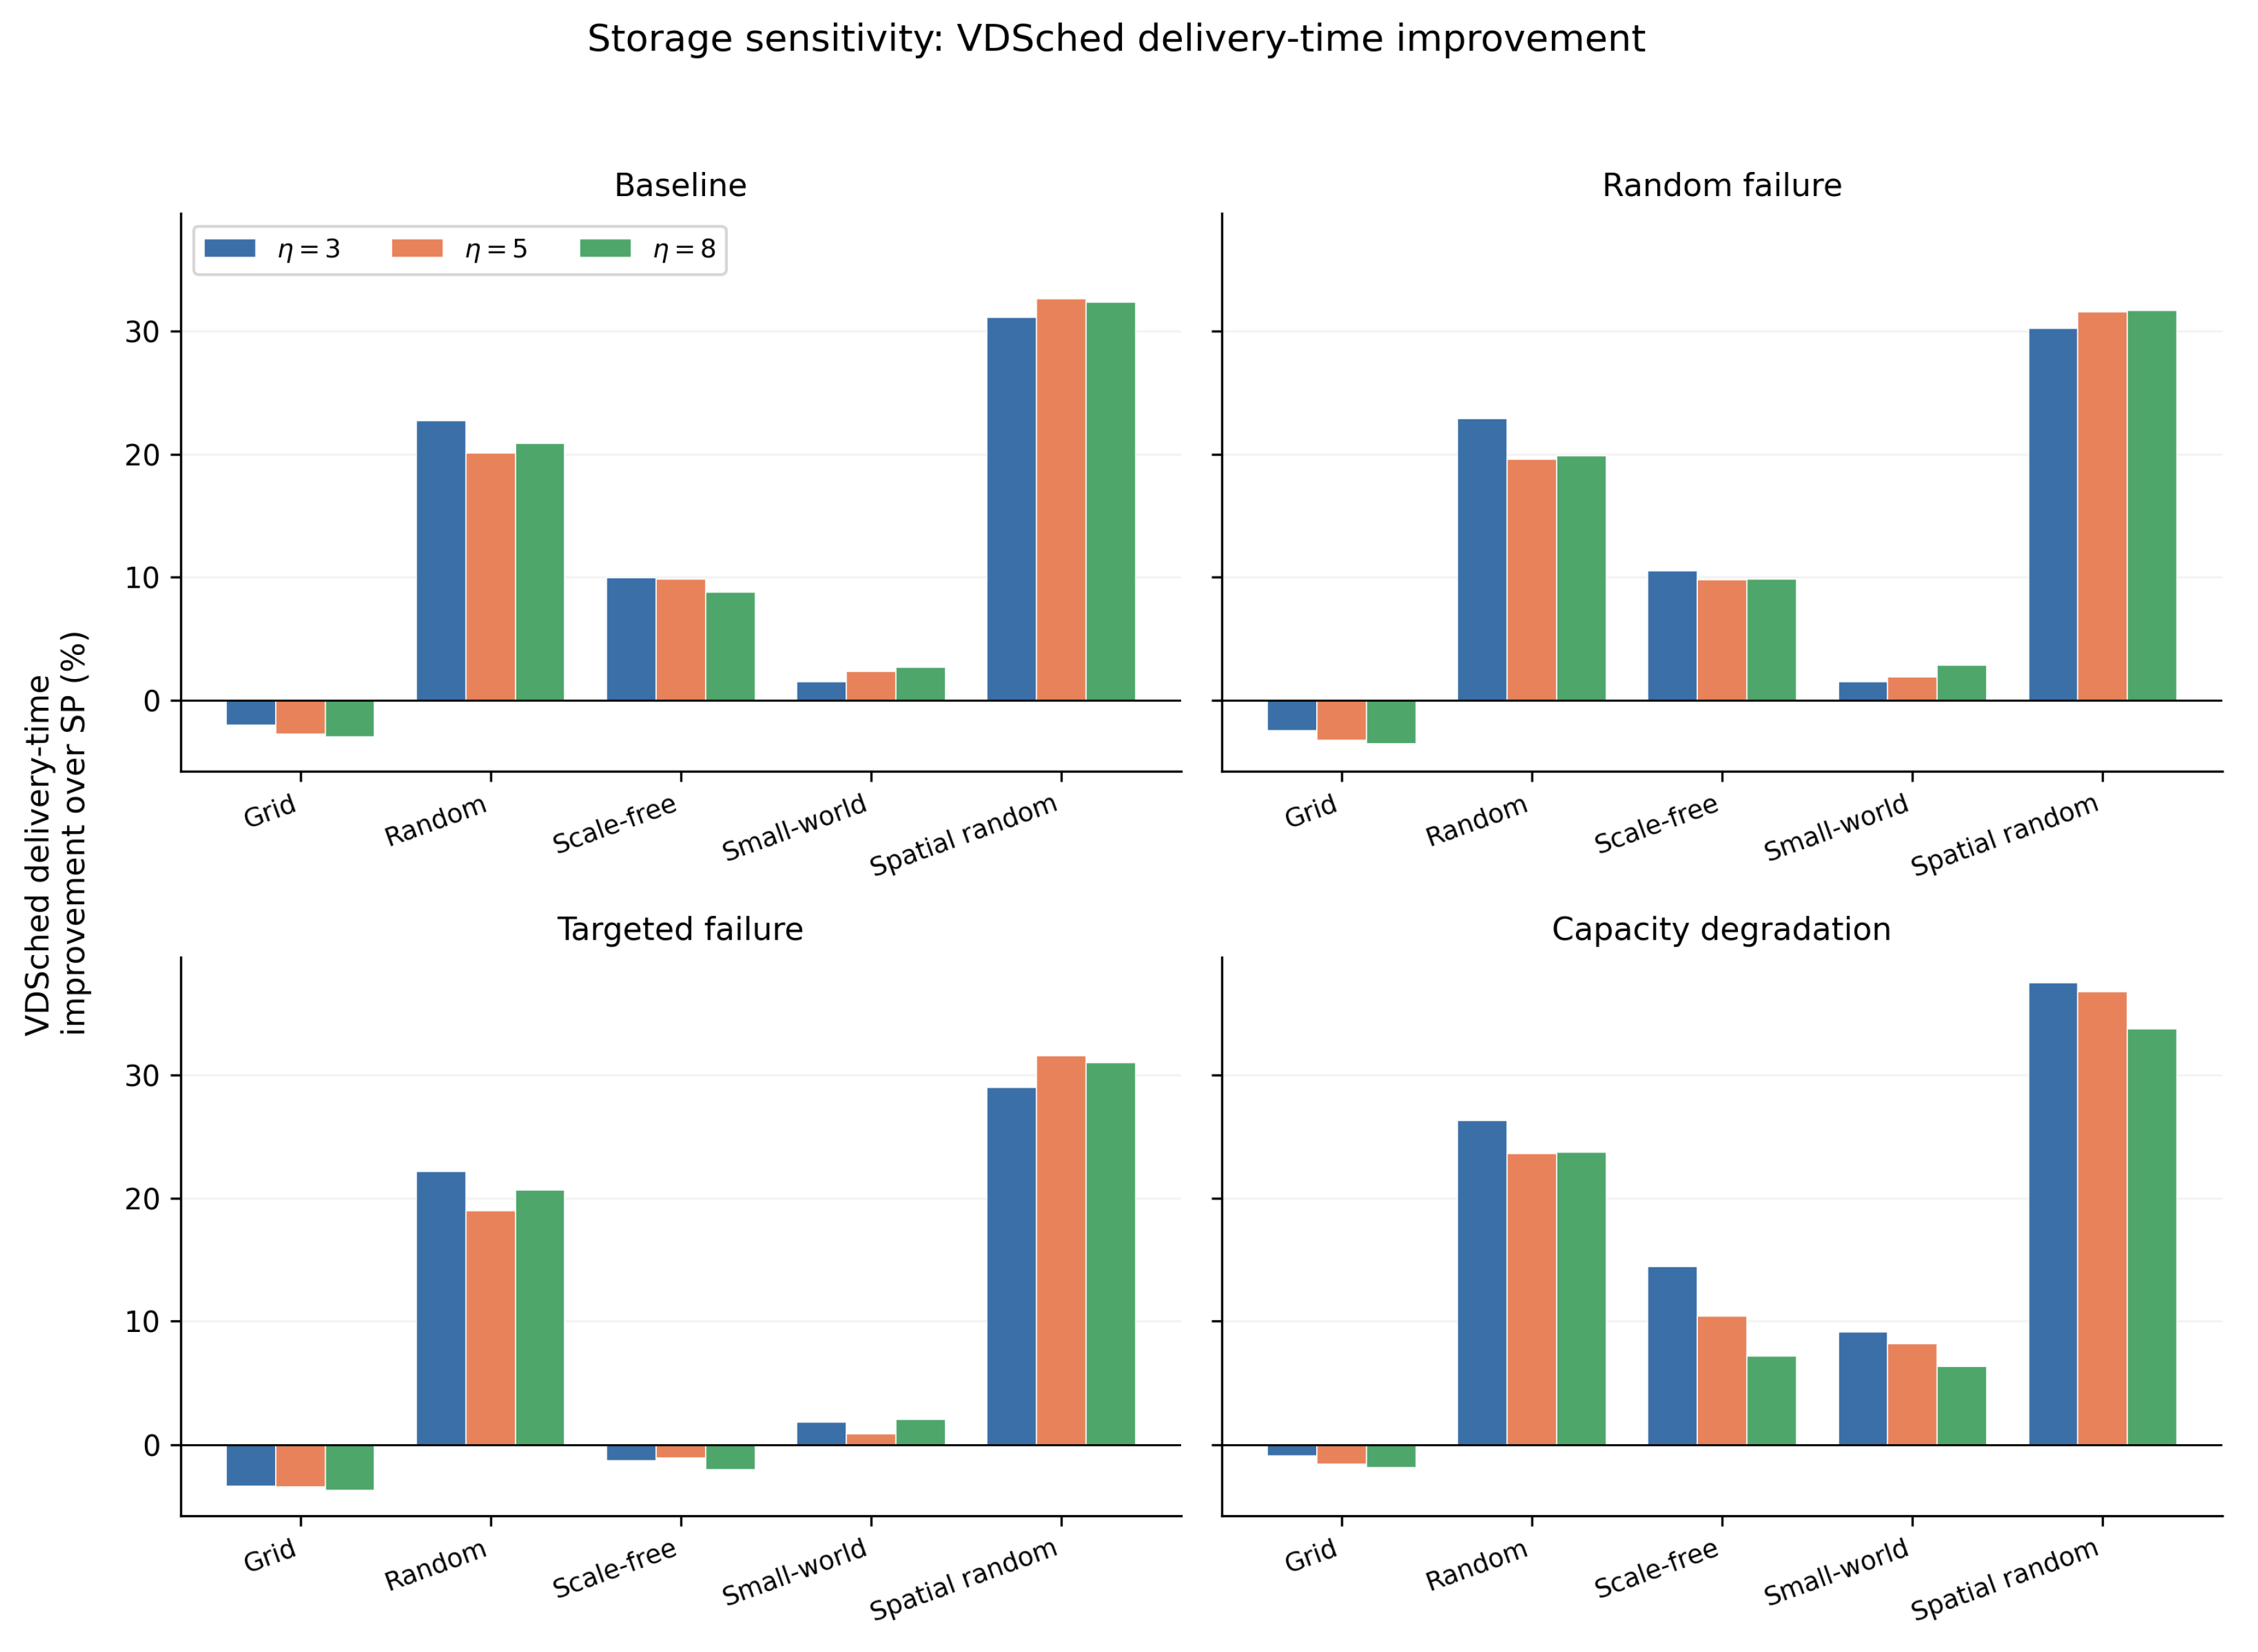
Table 1.
Representative processed graph statistics by topology class.
| Topology | Nodes | Directed edges | Mean out-degree |
|---|---|---|---|
| Grid | 400 | 1,520 | 3.80 |
| Random | 391 | 1,572 | 4.02 |
| Scale-free | 400 | 3,950 | 9.88 |
| Small-world | 400 | 2,400 | 6.00 |
| Spatial random | 400 | 5,328 | 13.32 |
Table 3.
Paired comparison of VDSched and SP for mean delivery time. Positive improvement values indicate that VDSched reduces delivery time relative to SP; negative values indicate that VDSched is slower.
Table 3.
Paired comparison of VDSched and SP for mean delivery time. Positive improvement values indicate that VDSched reduces delivery time relative to SP; negative values indicate that VDSched is slower.
| Topology | Scenario | SP mean | VDSched mean | VDSched − SP | VDSched improvement | Cohen | Holm p |
|---|---|---|---|---|---|---|---|
| Grid | Baseline | 137.46 | 141.18 | 3.72 | −2.7% | 1.667 | |
| Grid | Random failure | 139.68 | 144.23 | 4.54 | −3.3% | 2.155 | |
| Grid | Targeted failure | 141.43 | 146.28 | 4.85 | −3.4% | 2.172 | |
| Grid | Capacity degradation | 139.44 | 141.58 | 2.14 | −1.5% | 1.014 | |
| Random | Baseline | 12.84 | 10.26 | −2.58 | +20.1% | −2.168 | |
| Random | Random failure | 13.46 | 10.82 | −2.64 | +19.6% | −2.139 | |
| Random | Targeted failure | 13.38 | 10.84 | −2.53 | +18.9% | −2.167 | |
| Random | Capacity degradation | 13.51 | 10.32 | −3.19 | +23.6% | −2.452 | |
| Scale-free | Baseline | 23.69 | 21.36 | −2.34 | +9.9% | −0.701 | |
| Scale-free | Random failure | 24.39 | 22.00 | −2.39 | +9.8% | −0.708 | |
| Scale-free | Targeted failure | 19.39 | 19.60 | 0.21 | −1.1% | 0.122 | 1.000 |
| Scale-free | Capacity degradation | 23.89 | 21.40 | −2.49 | +10.4% | −0.715 | |
| Small-world | Baseline | 24.04 | 23.48 | −0.56 | +2.3% | −0.411 | 0.129 |
| Small-world | Random failure | 24.45 | 23.98 | −0.47 | +1.9% | −0.345 | |
| Small-world | Targeted failure | 25.57 | 25.34 | −0.23 | +0.9% | −0.161 | 1.000 |
| Small-world | Capacity degradation | 25.67 | 23.58 | −2.09 | +8.1% | −1.298 | |
| Spatial random | Baseline | 19.74 | 13.30 | −6.44 | +32.6% | −3.714 | |
| Spatial random | Random failure | 19.81 | 13.56 | −6.25 | +31.6% | −3.507 | |
| Spatial random | Targeted failure | 21.51 | 14.72 | −6.79 | +31.6% | −3.251 | |
| Spatial random | Capacity degradation | 20.78 | 13.15 | −7.64 | +36.7% | −3.757 |
Disclaimer/Publisher’s Note: The statements, opinions and data contained in all publications are solely those of the individual author(s) and contributor(s) and not of MDPI and/or the editor(s). MDPI and/or the editor(s) disclaim responsibility for any injury to people or property resulting from any ideas, methods, instructions or products referred to in the content. |
© 2026 by the authors. Licensee MDPI, Basel, Switzerland. This article is an open access article distributed under the terms and conditions of the Creative Commons Attribution (CC BY) license (http://creativecommons.org/licenses/by/4.0/).
Copyright: This open access article is published under a Creative Commons CC BY 4.0 license, which permit the free download, distribution, and reuse, provided that the author and preprint are cited in any reuse.