

Submitted:
06 September 2026
Posted:
14 September 2026
You are already at the latest version
Abstract
Kernel-bypass storage designs built on Linux io_uring’s IORING_SETUP_SQPOLL mode are motivated by a simple argument: a dedicated kernel polling thread removes the per-operation syscall that blocking and non-polling asynchronous I/O interfaces pay, so on modern NVMe hardware, where flash latency is no longer the bottleneck, SQPOLL should win on throughput. We built ringio, a header-only C++20 storage engine around this argument, and tested it against libaio and plain io_uring (no SQPOLL) on a virtualized cloud NVMe device across two machine sizes (4 and 16 vCPUs) and a swept queue-depth and thread-count matrix, alternating 4KB random reads and writes. The argument does not hold once the device itself saturates: at matched thread count and queue depth, SQPOLL does not beat the syscall-based baselines on raw IOPS at either machine size once concurrency is high enough to reach the device’s roughly 200K-IOPS ceiling, ruling out core oversubscription as the explanation for that plateau. Below the plateau, at a single thread, the gap is starker still: libaio reaches more than double SQPOLL’s throughput on the same hardware, a gap that widens rather than narrows on the wider box. SQPOLL’s tail latency also degrades under more available cores rather than improving. What SQPOLL does deliver is a large reduction in kernel entries per completed operation, roughly an order of magnitude fewer than plain io_uring at high queue depth, at the cost of that added tail latency. Reading this alongside two recent studies that do report SQPOLL wins in CPU-bound settings, our results are consistent with a resolution neither we nor they test directly: SQPOLL’s advantage is conditional on the CPU or syscall path being the bottleneck, and it disappears once a saturated device becomes the limit first. A sweep of sq_thread_idle across four orders of magnitude leaves throughput, tail latency, and kernel entries per operation unchanged, ruling that parameter out as the explanation: the poller never reaches its idle timeout under this workload. We report the full methodology, including a page-cache measurement defect that invalidated an earlier round of results, and discuss what this suite’s data does and does not establish about the underlying cause.
Keywords:
io_uring
; SQPOLL
; kernel-bypass I/O
; NVMe
; storage engine
; asynchronous I/O
; benchmarking
1. Introduction
Asynchronous storage interfaces on Linux have moved through several generations: blocking read/write, POSIX AIO, libaio, and now io_uring. Each generation targets the same cost: a syscall is a mode switch, and a mode switch is expensive relative to the latency of an NVMe device, whose flash media now services a random 4KB operation in tens of microseconds. io_uring’s IORING_SETUP_SQPOLL mode goes further than reducing the number of syscalls per operation; run with a dedicated kernel polling thread, submitting a request can become a plain memory write with no syscall at all, as long as that polling thread has not gone idle.
This is the design bet behind ringio, a header-only C++20 asynchronous storage engine we built around SQPOLL: a lock-free multi-producer multi-consumer ring feeds fixed, pre-registered buffers into an SQPOLL io_uring instance, with completions harvested and correlated back to requests by an opaque token. The design followed directly from the argument above. We report here what testing it against real hardware actually found, which is not what the argument predicts.
Three findings structure this paper. First, an SQPOLL kernel poller is not free: it busy-spins continuously and costs a full CPU core by itself, so an SQPOLL ring is a two-core commitment, not one, and a naive one-ring-per-thread design collapses once thread count approaches the machine’s core count. Sharing one poller across many rings fixes this specific collapse. Second, once that fix is in place and the benchmark harness is corrected to bypass the page cache and pipeline requests to a real queue depth, SQPOLL still does not win on raw IOPS against libaio or plain io_uring at any matched thread count and queue depth we tested, on either a 4-vCPU or a 16-vCPU machine. Third, the widening of libaio’s lead and the growth in SQPOLL’s tail latency when we moved from 4 to 16 vCPUs rules out core oversubscription as the explanation for the second finding, leaving the actual cause unresolved by this suite’s data.
We present the full experimental record, including a page-cache measurement defect in an early version of the harness that produced DRAM-speed numbers mislabeled as disk I/O, because the defect and its fix are as much a part of what this work establishes as the final results are.
2. Background
2.1. io_uring and SQPOLL
io_uring exposes two ring buffers shared between user space and the kernel: a submission queue (SQ) and a completion queue (CQ). In its default mode, a thread still issues io_uring_enter to tell the kernel new submission queue entries (SQEs) are ready, and to wait for completion queue entries (CQEs); this call is a syscall, though one call can carry many requests, unlike read/write pairs.
IORING_SETUP_SQPOLL changes this: the kernel spawns a dedicated thread that polls the SQ continuously. As long as that thread has not gone idle for longer than a configurable sq_thread_idle window, writing a new SQE and advancing the SQ tail is enough for the kernel poller to pick it up. No io_uring_enter call is required on the submission side. Waiting for completions can still avoid a syscall if the caller polls the CQ head non-blockingly instead of waiting on it.
2.2. Libaio and Plain io_uring Without SQPOLL
libaio is the older Linux asynchronous I/O interface, backed by io_submit/io_getevents. Both are syscalls, but each call can carry a batch of operations, so the per-operation cost is amortized across the batch size rather than eliminated. Plain io_uring, used here without SQPOLL, has the same syscall-per-round-trip structure as libaio but through io_uring_enter instead: it batches submission and completion but still crosses into the kernel to do either.
2.3. O_DIRECT and the Page Cache
Every I/O interface discussed here can be measured incorrectly if the target file is not opened with O_DIRECT. Without it, the kernel serves reads from the page cache once a block has been read once, and buffers writes in the page cache before flushing them to the device later. A benchmark against a small working set on a machine with enough RAM to hold it will then measure DRAM bandwidth and latency, not the storage device’s. O_DIRECT requires the buffer address, transfer length, and file offset to all be aligned to the device’s logical block size (4096 bytes on the hardware used here); an unaligned request fails with EINVAL.
3. System Design
ringio is built from three components, added in dependency order. A lock-free multi-producer multi-consumer ring (MpmcRing, and a single-producer variant, SpscRing) carries trivially copyable request structs from worker threads into the submission path. A buffer pool (BufferPool) allocates a fixed set of page-aligned buffers via posix_memalign, locks them with mlock, and registers them with the kernel once via io_uring_register_buffers, so I/O against them avoids per-request page pinning. SqpollEngine owns one SQPOLL io_uring instance, registers fixed file descriptors once via io_uring_register_files, drains a batch of requests from either ring type into real SQEs, and harvests finished CQEs non-blockingly into a completion ring, matching each one back to its request by a 64-bit token.
3.1. The Two-Core Cost of a Poller
An SQPOLL kernel thread busy-spins for as long as it stays awake, which means it occupies a full CPU core regardless of how much work is actually arriving. One SqpollEngine is therefore a two-core commitment: one core for the poller, one for whatever application thread feeds it. A design that gives every worker thread its own engine, which is what "one ring per thread" naturally suggests, runs out of core budget at half the machine’s thread count. We found this directly: on a 4-vCPU machine, independent rings collapsed from 157K IOPS at 2 threads to 71K at 8 threads.
SqpollEngine’s constructor takes an optional attach_to parameter. When set, the new engine shares attach_to’s kernel poller via IORING_SETUP_ATTACH_WQ instead of spawning its own; each attached engine still owns its own SQ/CQ ring pair, but the kernel services all of them from one polling thread. N engines sharing one poller then cost cores instead of . On the same 4-vCPU machine, threads sharing one poller climbed to 248K IOPS at 8 threads and had not plateaued, instead of collapsing.
3.2. Completion-Side Backoff
The first version of the shared-poller benchmark undersold this fix: its worker threads harvested completions in a flat busy-spin loop, so every application thread burned a full core on top of the one core the shared poller itself occupies, reintroducing a collapse from the application side even though the kernel mechanism no longer had one. Replacing the flat spin with a three-tier backoff (fast retries, then bounded pause-instruction spinning, then a scheduler yield) let a waiting thread give cycles back to the scheduler instead of denying it, which the poller needs to actually run. This did not create CPU capacity that was not there; the shared-poller numbers still peaked at 2 threads on the 4-vCPU box and declined afterward, since 4 vCPUs means 1 core for the poller and 3 for application threads. What backoff fixed was the collapse being disproportionate to that oversubscription: at 8 threads, throughput before the fix fell to 46K IOPS; after it, the same configuration held 112K.
4. Methodology
We benchmark five backends against the same workload: 4KB random reads and writes, alternating, against a 1 GiB working set, on a scratch file opened with O_DIRECT. The five backends are POSIX pread/pwrite, libaio, plain io_uring without SQPOLL, SqpollEngine with one independent poller per thread, and SqpollEngine with every thread past the first attached to a single shared poller. Each backend uses its own file descriptor, buffers, and (where applicable) ring per thread; concurrent io_uring_submit calls against one shared SQ ring from multiple threads are not safe without locking ringio does not provide, so per-thread instances are the correct comparison rather than a shortcut. SqpollEngine’s buffers are pre-registered, page-locked, and addressed as fixed buffers, matching how the design is meant to run; the three baselines use heap memory aligned only as far as O_DIRECT requires. Each backend is measured at its own best practice, not with identical buffer handling forced across all five.
4.1. Queue-Depth Pipelining
libaio, plain io_uring, and both SqpollEngine variants keep a configurable number of requests, the queue depth, in flight at once: submit a batch, reap completions as they land, and resubmit immediately, rather than the submit-one-block-wait-one loop an earlier version of this harness used. We sweep queue depth over . POSIX pread/pwrite has no queue-depth axis: it is a blocking syscall with nothing to submit ahead of, and its thread-count sweep already covers the concurrency dimension a synthetic queue-depth parameter on a blocking call would otherwise duplicate.
4.2. Thread-Count Sweep and Its Bound
POSIX runs the full thread sweep, since it costs nothing extra and has no queue-depth axis to cross it against. The four pipelined backends are swept at threads against the full queue-depth set; crossing the full 1–32 thread range against the full queue-depth range for four backends would be 30 combinations each, more provisioned-VM time than the question needs. was chosen specifically to test whether a result changes as thread count moves from well under to well past a small machine’s core budget, which is the question Section V-D exists to answer.
4.3. calls_per_op is an Upper Bound for the io_uring-Based Backends
We report a calls_per_op counter alongside IOPS and latency: submit calls plus reap calls, divided by completed operations. For POSIX and libaio this is an exact syscall count, since pread, pwrite, io_submit, and io_getevents are unconditionally syscalls. For the io_uring-based backends it is not: io_uring_submit only issues a real io_uring_enter syscall when the SQPOLL poller has gone idle, a check against a flag in the shared ring that is not visible from user space. We report this figure as an upper bound on kernel entries for the three io_uring-based backends, not a confirmed syscall count.
4.4. Hardware
We provisioned short-lived GCE spot VMs for every run, one Local SSD NVMe device (interface=NVME) bind-mounted over the benchmark’s scratch directory, formatted ext4, so O_DIRECT reaches real flash rather than network-attached persistent disk or, worse, a filesystem (tmpfs) that rejects O_DIRECT outright. Two machine sizes were used: an n2-standard-4 (4 vCPUs) for the initial redesign and its results, and an n2-standard-16 (16 vCPUs, two Local SSD devices) for the wider-core rerun in Section V-D. Both ran at a fixed 2.8 GHz per vCPU with frequency scaling disabled. Every VM was deleted immediately after its run.
4.5. Reproducibility
The engine, the benchmark harness, and the phase-by-phase record of the runs reported here are at https://github.com/sinhaparth5/ringio. Both machine sizes ran the same image, ubuntu-2204-lts, kernel 6.8, with liburing 2.1 as packaged by that image’s apt repository. SqpollEngine sets only two io_uring setup flags, IORING_SETUP_SQPOLL and, for the shared-poller variant, IORING_SETUP_ATTACH_WQ; IORING_SETUP_SINGLE_ISSUER, IORING_SETUP_COOP_TASKRUN, and IORING_SETUP_DEFER_TASKRUN are not set anywhere in this codebase. sq_thread_idle is 1000 ms throughout the main matrix, and swept separately in Section V-D. Neither the SQPOLL kernel thread nor any application thread was pinned to a specific core. NVMe queue count and IOMMU configuration on the underlying GCE Local SSD device were not recorded and are not user-controllable on this instance type as far as we are aware.
5. Results
5.1. The Page-Cache Measurement Defect
An earlier version of this harness opened its scratch file without O_DIRECT against a 64 MiB working set. On a VM with far more RAM than that, every backend’s I/O after the first pass was served from the page cache, not the NVMe device. POSIX pread/pwrite reached 698K–1.3M IOPS in that run, which is DRAM bandwidth, not disk I/O; none of the baselines in that round of results had touched the drive the suite claimed to measure. We report this because a benchmark suite that silently measures the wrong subsystem is a common and under-reported failure mode in storage system evaluation, not because the number itself is otherwise interesting.
5.2. 4 vCPUs, O_DIRECT, and Queue-Depth Pipelining
With O_DIRECT and pipelining both in place, every backend’s ceiling dropped to roughly 200K IOPS, a plausible figure for a virtualized NVMe device rather than DRAM speed. At matched thread count and queue depth, plain io_uring and libaio matched or beat both SqpollEngine variants on raw IOPS. At 4 threads, plain io_uring and libaio both plateaued around 199–200K IOPS from queue depth 8 upward; SqpollEngine’s best result at 4 threads was 135K (shared poller, queue depth 128). The independent-ring variant did worse still, and reproduced the exact core-budget collapse from Section III-A at queue depth 1: 11.6K IOPS at 4 threads, down from 23.4K at 1 thread, the same effect now visible across the queue-depth axis as well as the thread-count axis.
Figure 1.
Round trips per completed operation at 4 threads, queue depth 128. Bars for libaio and plain io_uring plot the midpoint of their reported 1.3–4.3 range; Table 1 has the exact figures.
Figure 1.
Round trips per completed operation at 4 threads, queue depth 128. Bars for libaio and plain io_uring plot the midpoint of their reported 1.3–4.3 range; Table 1 has the exact figures.
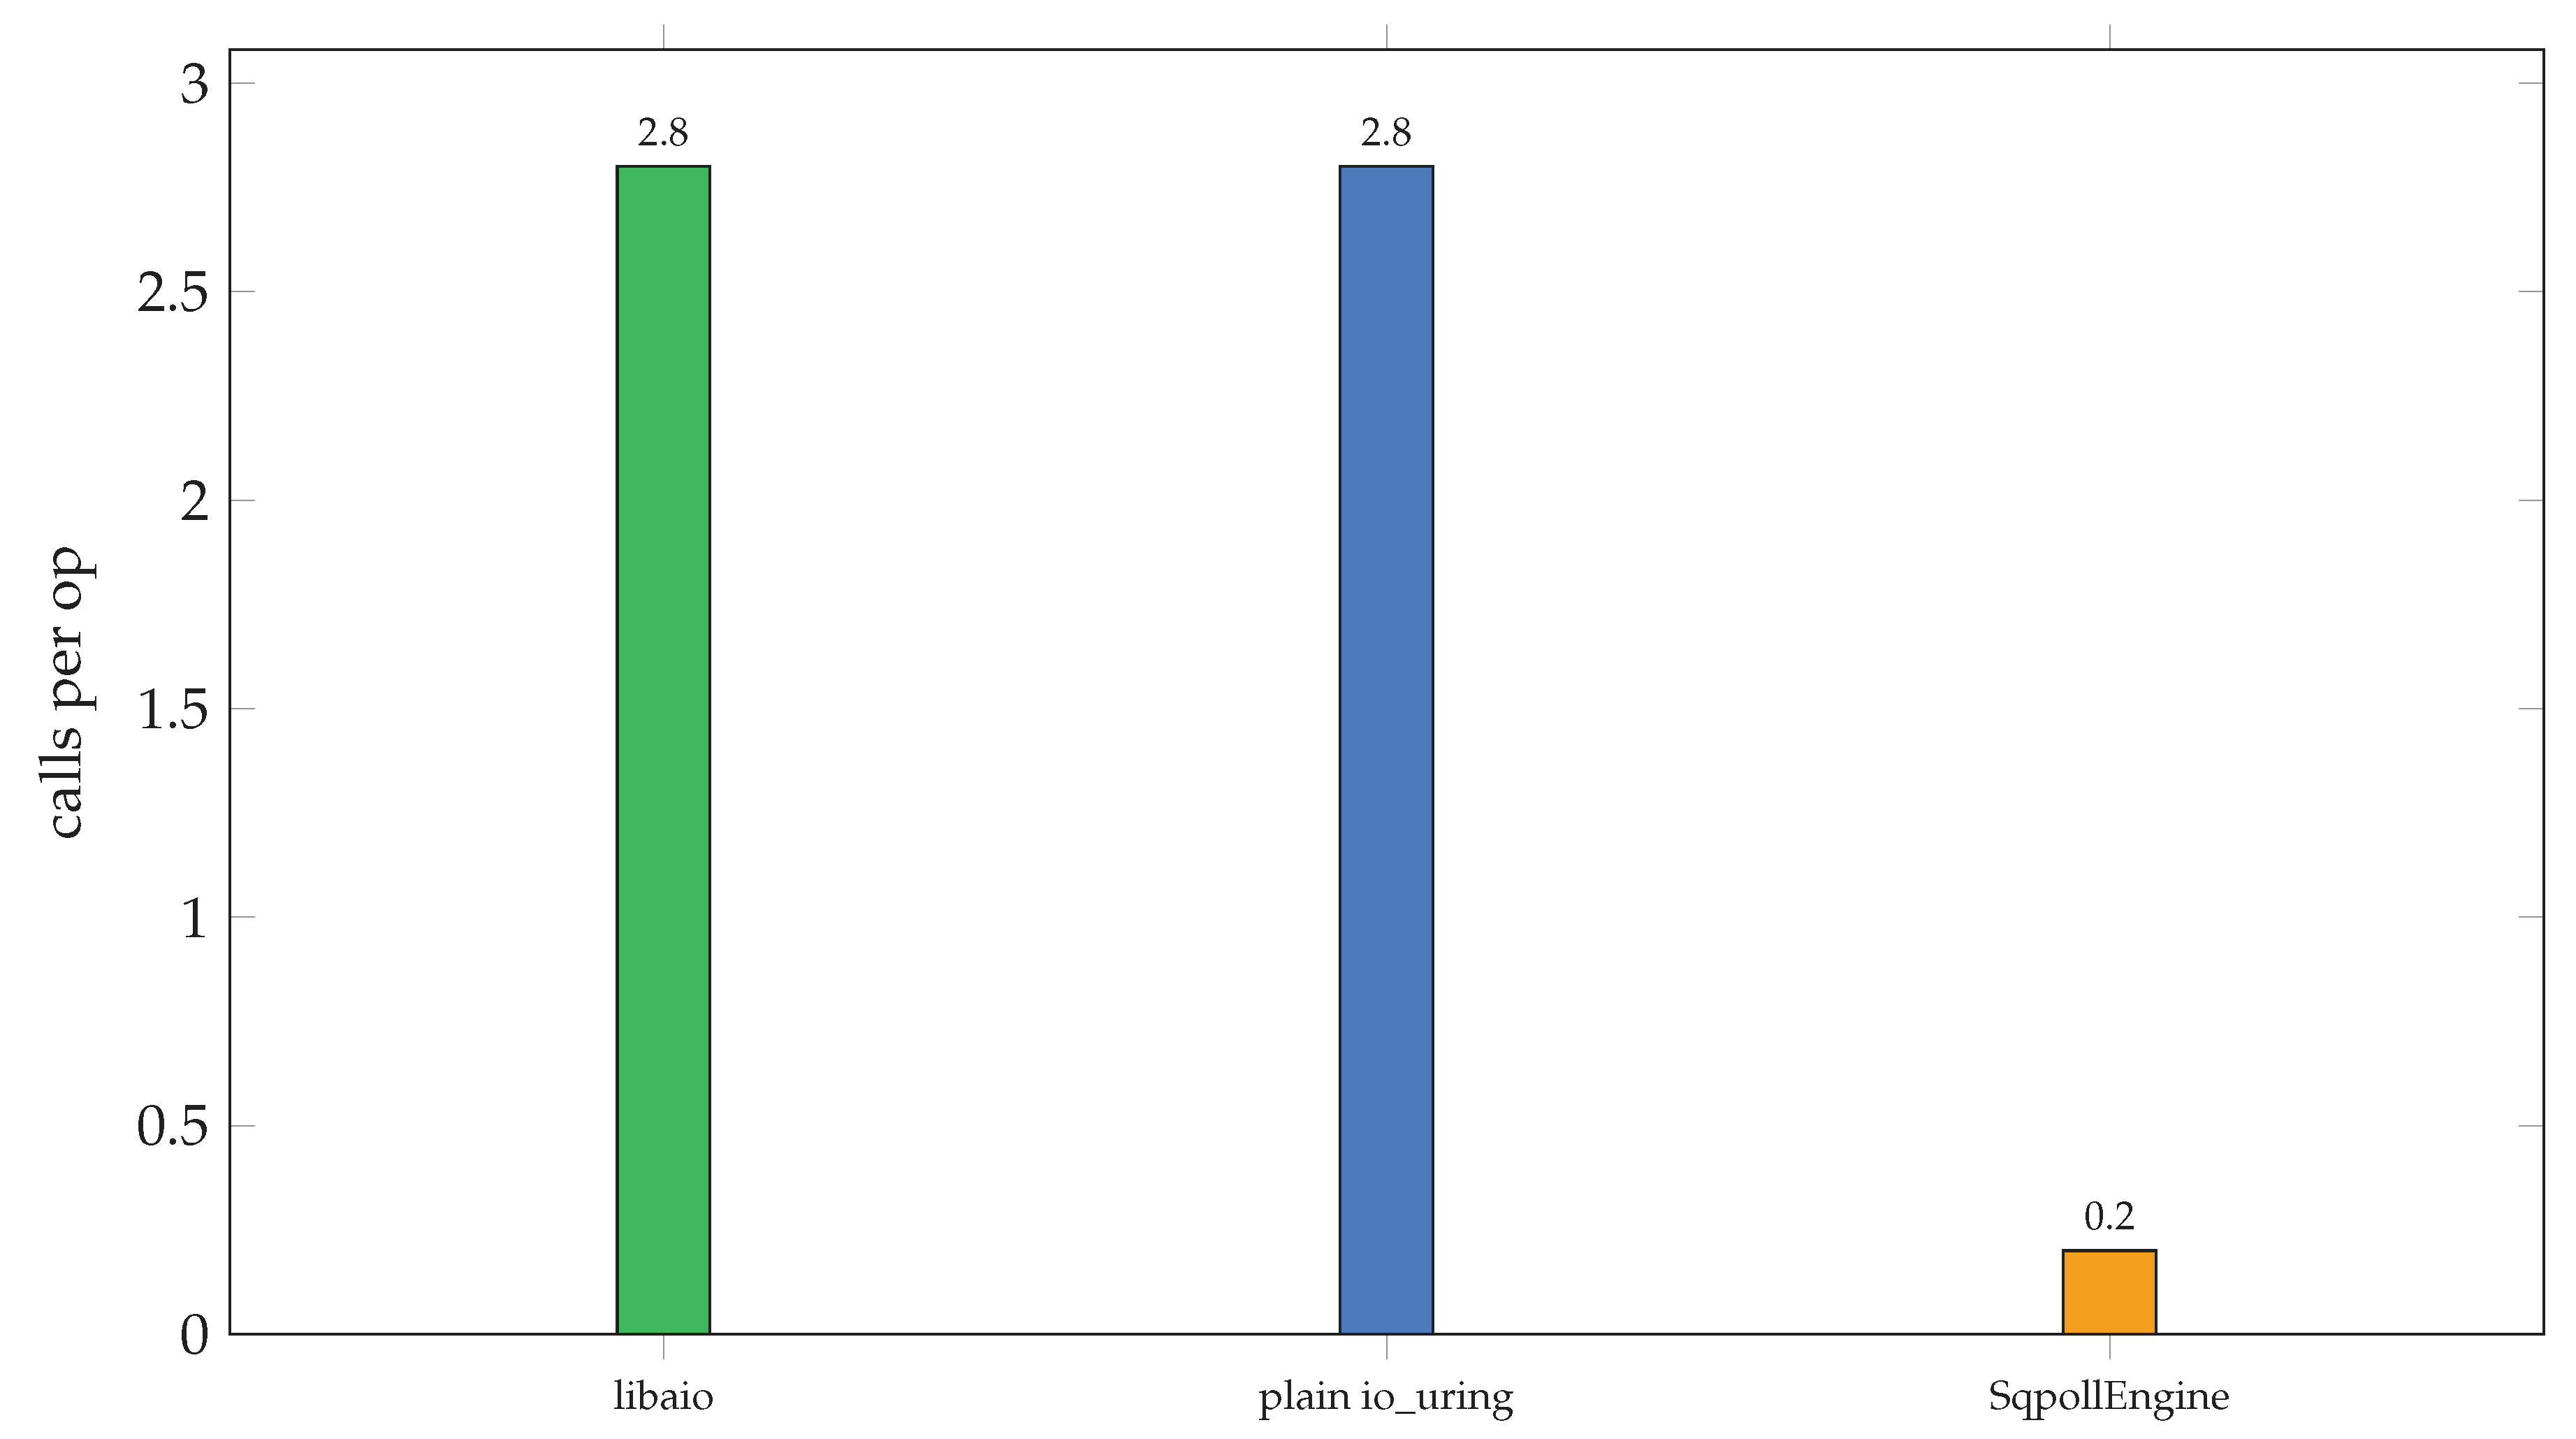
Table 1 shows where SQPOLL’s design does pay off: at queue depth 128, SqpollIops needs roughly an order of magnitude fewer round trips per completed operation than plain io_uring at the same setting. This is the batching mechanism working as designed. It comes at a tail-latency cost: at 4 threads and queue depth 128, SqpollIops’s p99 latency is 23.5 ms, worse than plain io_uring’s 15.0 ms or libaio’s 14.3 ms at the identical setting. SQPOLL is spending fewer syscalls but queuing completions longer before a harvesting thread picks them up.
The finding this round of data supports is narrower than "SQPOLL wins": fewer round trips per operation, not more throughput, and worse tail latency at depth, on this hardware. Whether that is inherent to the design or an artifact of this box’s poller-versus-worker core split, 4 worker threads and 1 poller thread contending for 4 physical cores, was open at this point in the investigation.
5.3. 16 vCPUs: Ruling out Core Oversubscription
To separate those two explanations, we widened the thread-count sweep to and reran the full matrix on an n2-standard-16, giving every configuration up to 8 worker threads plus the SQPOLL poller thread room across 16 vCPUs, instead of contending for 4.
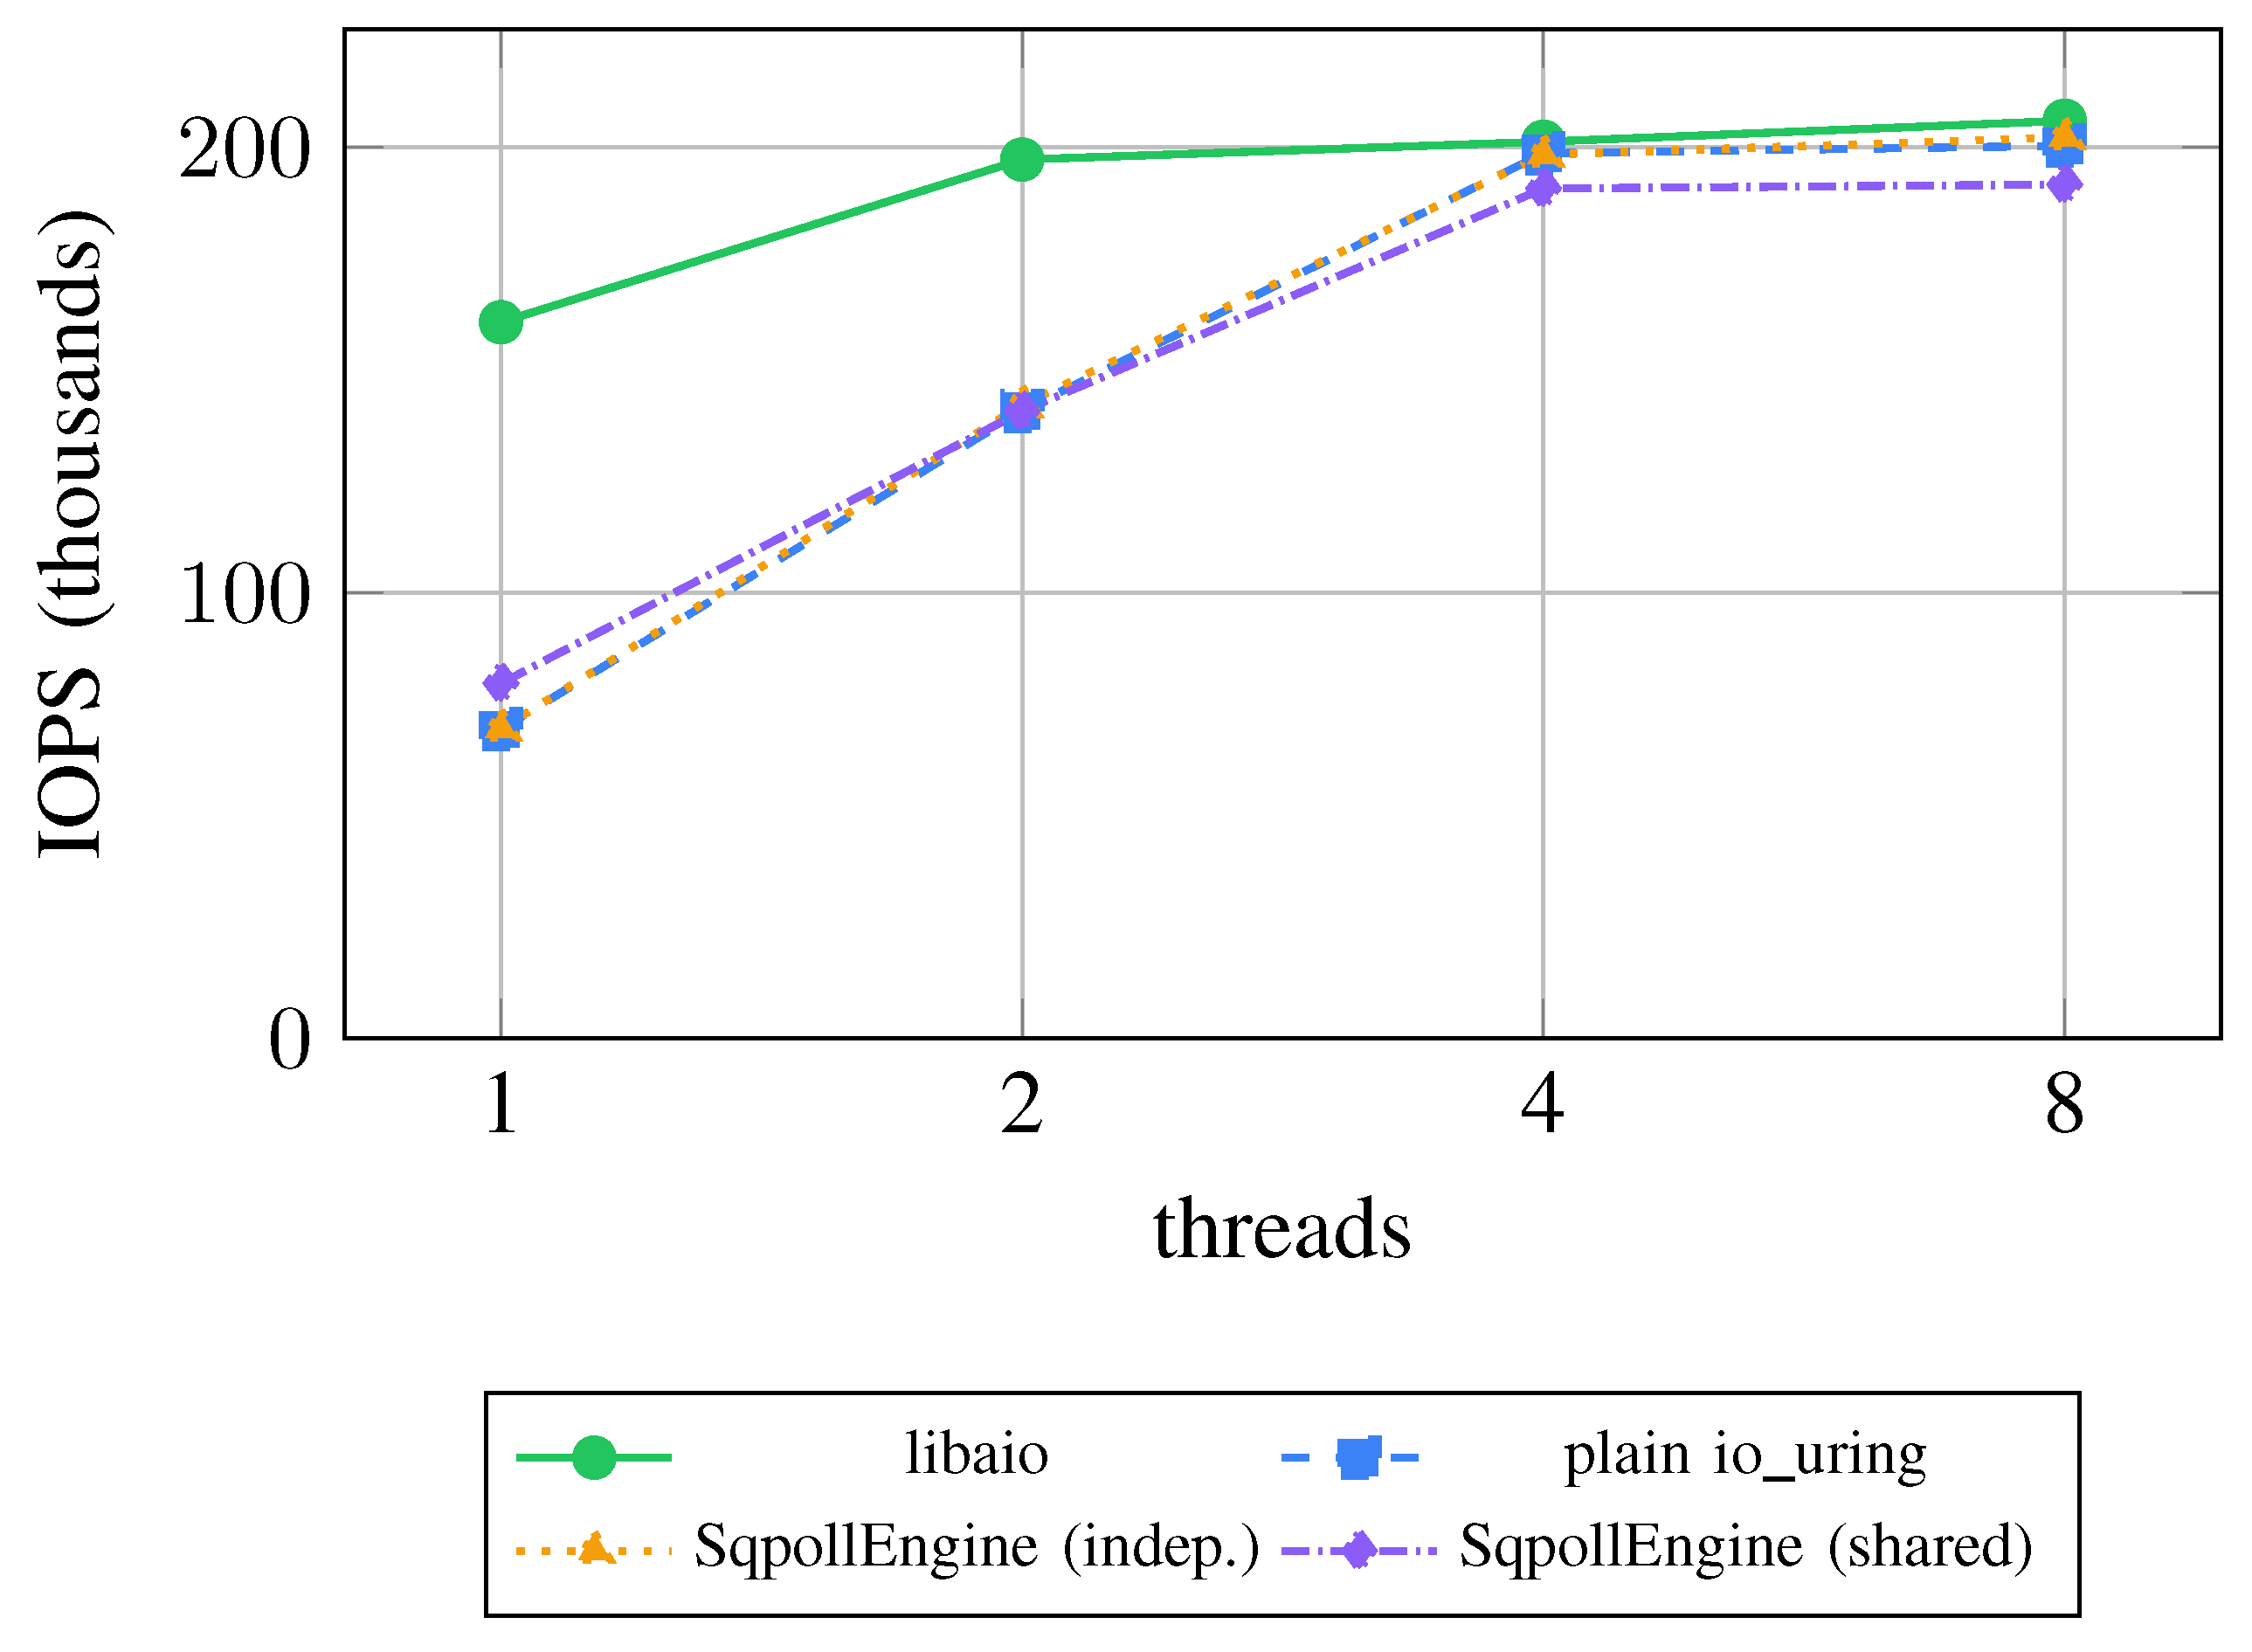
Core oversubscription does not explain the gap. At every matched thread count and queue depth on the 16-vCPU box, SqpollEngine still does not beat plain io_uring or libaio on raw IOPS, even with the poller holding a dedicated core the whole time. Table 2 shows the queue-depth-32 row in full: libaio’s lead over the other three backends is largest, not smallest, at low thread count, 160.7K versus 69–80K IOPS at a single thread, a gap the 4-vCPU run never showed because thread count, not queue depth, was the scarcer resource there. At 4 and 8 threads, every backend converges to roughly 200–207K IOPS regardless of queue depth; that plateau is the NVMe device’s ceiling, the same one the O_DIRECT fix surfaced in Section V-B, and it is reached by every backend once there is enough concurrency to reach it, not a property of any one backend’s design.
That plateau is also why the single-thread row of Table 2 is the more informative one, not the 4- and 8-thread rows this section led with. Once the device is saturated, no submission path can raise IOPS further, so a comparison at the plateau measures the device, not the interface. Below it, at 1 thread and queue depth 32, libaio reaches 160.7K IOPS while every io_uring-based backend, SQPOLL included, is stuck at 69–80K: more than double the throughput from the same single thread, before the device becomes the limit. That gap, not the shared plateau, is where an interface-level difference is actually visible in this data.
Figure 2.
IOPS versus thread count at queue depth 32, 16 vCPUs (Table 2). libaio’s lead is widest at a single thread; every backend converges near the device ceiling by 4 threads.
Figure 2.
IOPS versus thread count at queue depth 32, 16 vCPUs (Table 2). libaio’s lead is widest at a single thread; every backend converges near the device ceiling by 4 threads.
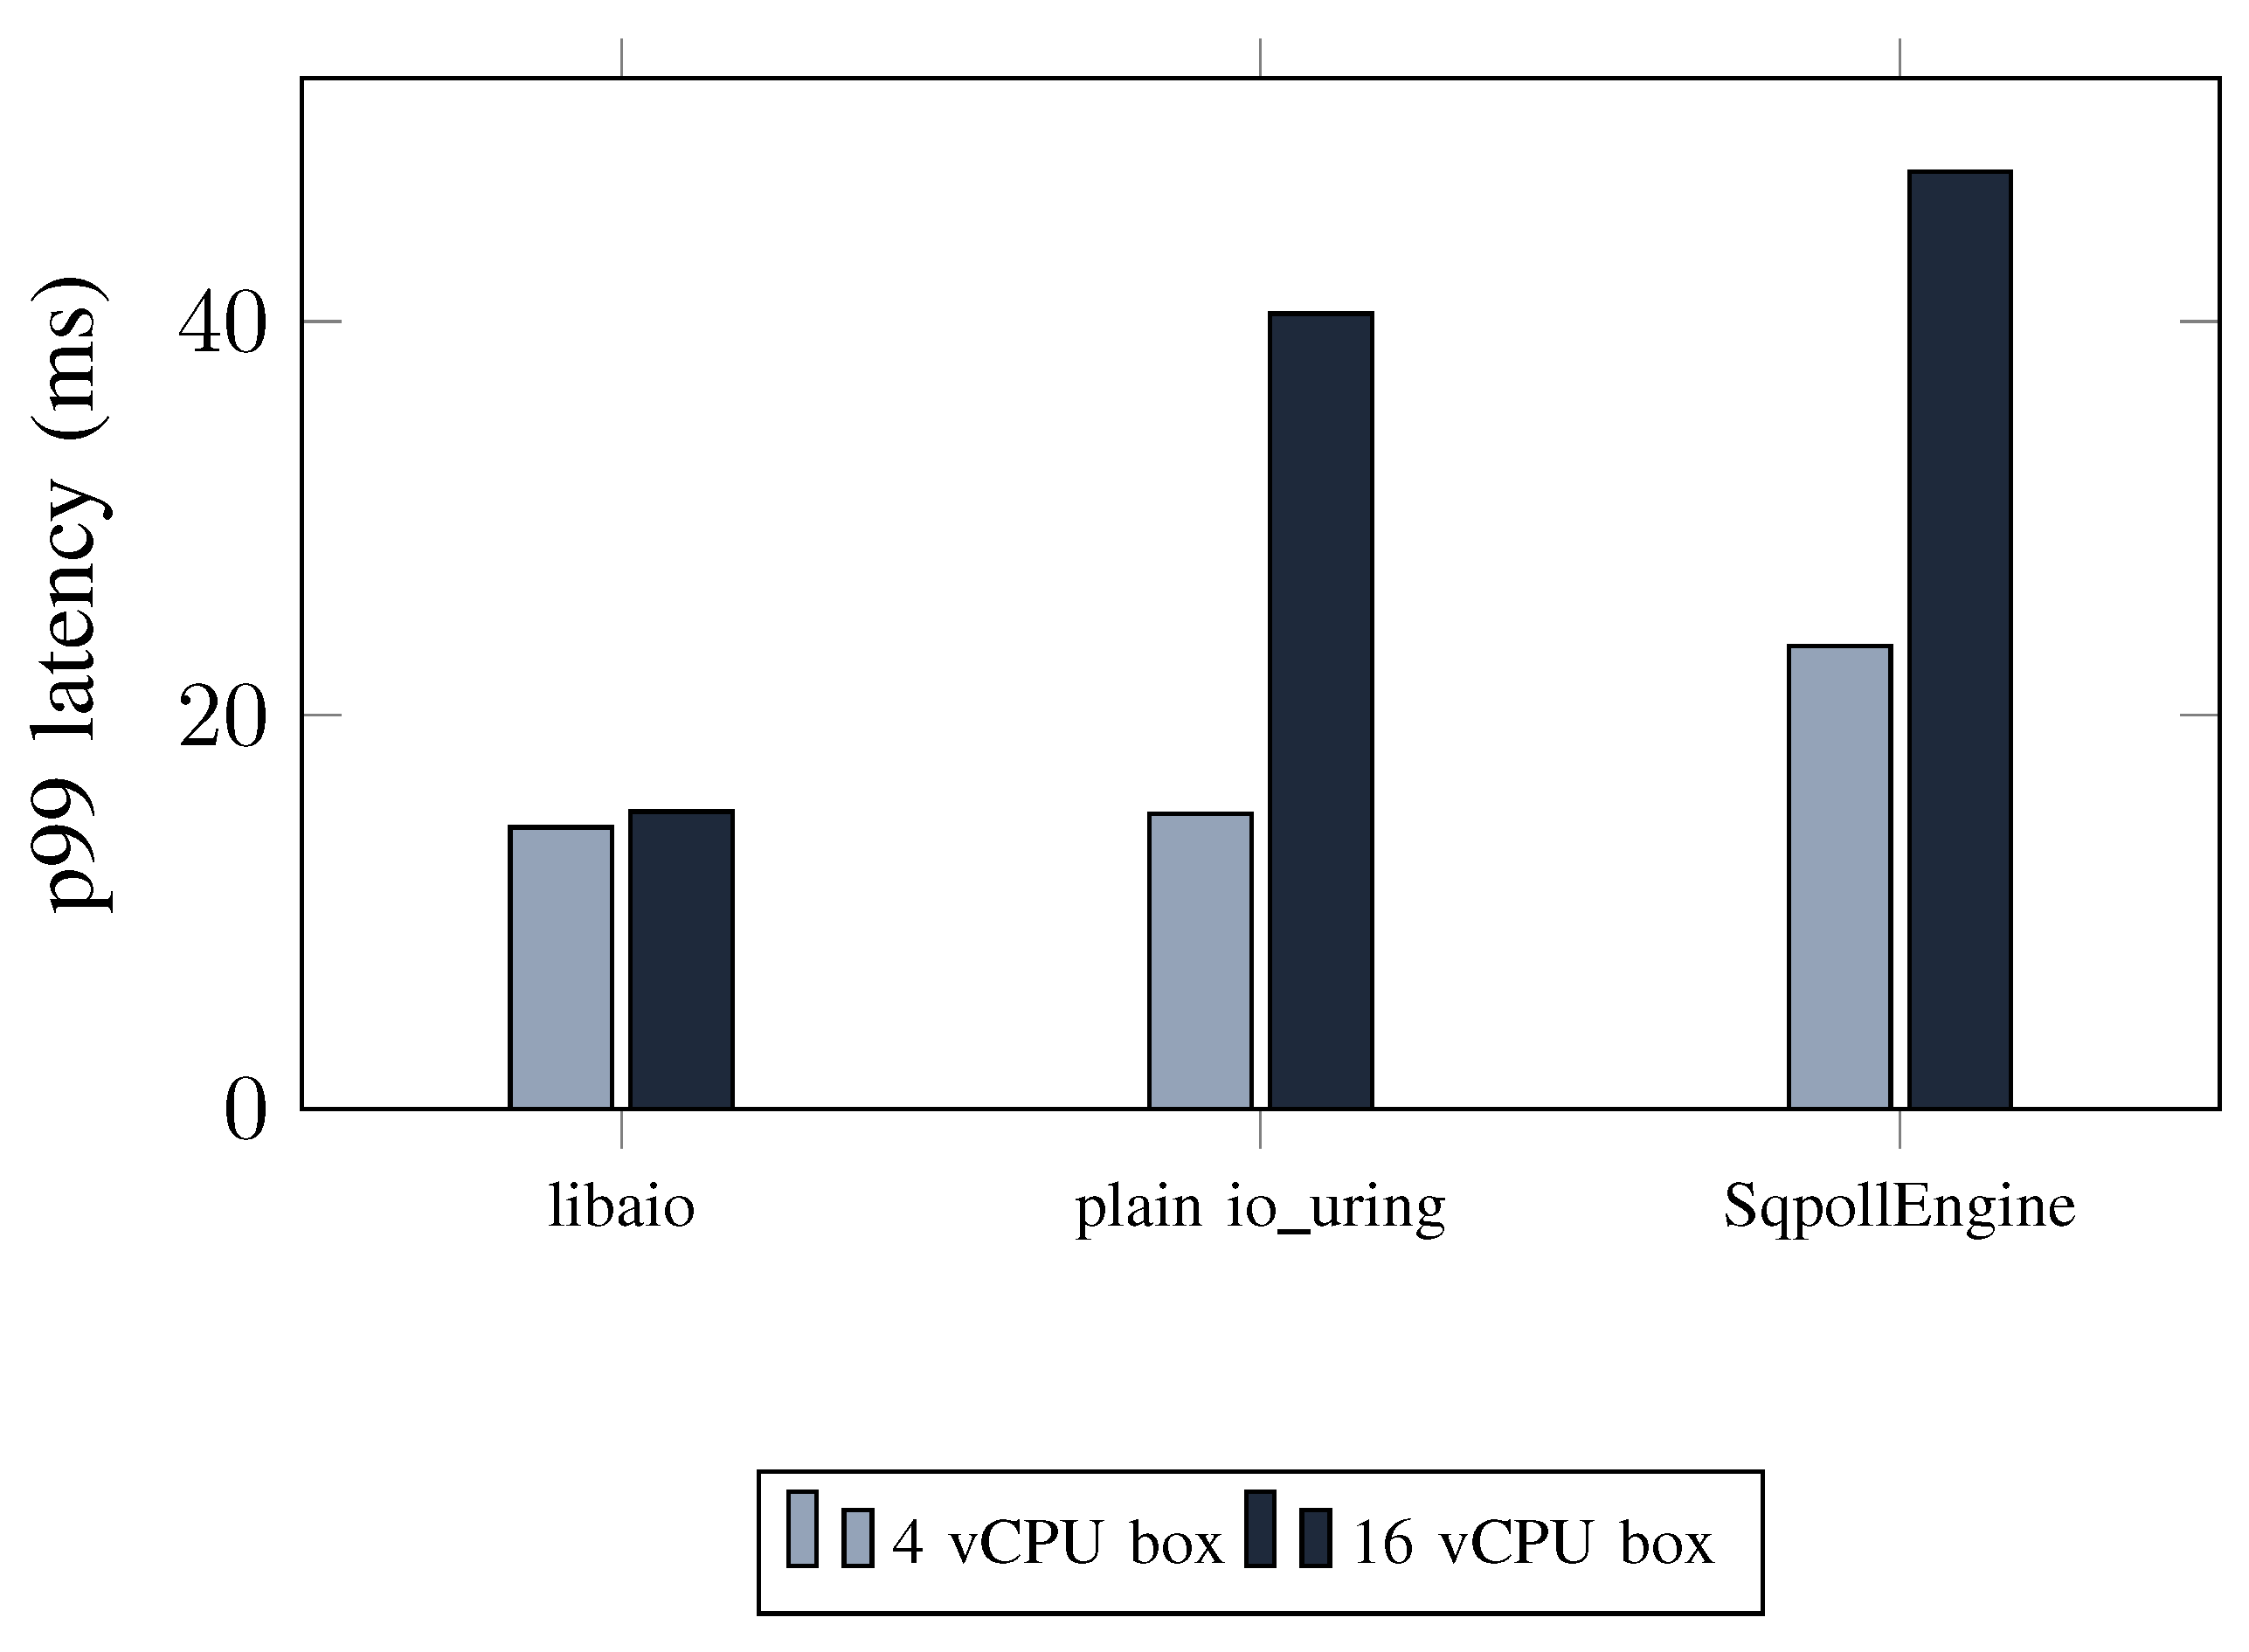
Tail latency moves the wrong way for the wider box to be a simple fix. Table 3 compares the same 4-thread, queue-depth-128 configuration across both machine sizes: SqpollEngine’s shared-poller p99 latency is worse on 16 vCPUs (47.6 ms) than on 4 (23.5 ms), and plain io_uring’s p99 grew substantially as well (15.0 ms to 40.4 ms), while libaio’s stayed close to unchanged (14.3 ms to 15.1 ms). More available cores did not reduce the time a completion waits before it is harvested; if anything, it increased it for both io_uring-based paths.
Figure 3.
p99 latency at 4 threads, queue depth 128, 4-vCPU versus 16-vCPU box (Table 3). libaio’s tail barely moves; both io_uring-based backends get worse on the wider machine.
Figure 3.
p99 latency at 4 threads, queue depth 128, 4-vCPU versus 16-vCPU box (Table 3). libaio’s tail barely moves; both io_uring-based backends get worse on the wider machine.
5.4. sq_thread_idle Sensitivity
The one SQPOLL parameter this study had left fixed is sq_thread_idle, the window the kernel poller spins with no work before sleeping. A poller that sleeps costs a wake-up syscall on the next submission, so an idle window mistuned for the workload is a plausible source of both lost throughput and added latency. We swept it across four orders of magnitude, 1 ms to 10,000 ms, on a second n2-standard-16 with Local SSD, holding everything else at the configuration of Table 3 (4 threads, queue depth 128) and adding queue depth 1, where a shallow pipeline gives the poller the most opportunity to time out. Each point is the median of 7 repetitions; libaio, which the parameter cannot affect, runs in every round as a drift control.

Table 4.
sq_thread_idle sweep at 4 threads, queue depth 128, 16 vCPUs: p99 latency (ms), shared-poller round trips per operation, and the libaio drift control. Medians of 7 repetitions.
Table 4.
sq_thread_idle sweep at 4 threads, queue depth 128, 16 vCPUs: p99 latency (ms), shared-poller round trips per operation, and the libaio drift control. Medians of 7 repetitions.
| SQPOLL p99 (ms) | shared | libaio | ||
|---|---|---|---|---|
| idle (ms) | indep. | shared | calls_per_op | p99 (ms) |
| 1 | 35.6 | 27.9 | 0.961 | 12.7 |
| 10 | 24.5 | 30.3 | 0.960 | 13.5 |
| 100 | 27.9 | 29.4 | 0.962 | 13.2 |
| 1000 | 24.3 | 39.5 | 0.959 | 13.3 |
| 10000 | 22.2 | 40.4 | 0.959 | 12.4 |
The parameter is inert at every operating point we measured. Throughput does not move: the shared-poller backend holds 190.8–191.5K IOPS across the whole sweep, a 0.4% spread, and the independent-ring backend 197.6–198.7K. The p99 column moves more, 22–40 ms, but its own per-point coefficient of variation across repetitions runs 3–27%, so that spread is inside the run-to-run noise rather than a trend, and it is not monotonic in the parameter; the libaio control sits at 12.4–13.5 ms throughout, confirming the device itself was not drifting between rounds.
calls_per_op is what makes this a mechanism rather than a null measurement. If the poller were sleeping and being woken, the kernel entries per operation would rise as the idle window shortened, since a shorter window means more sleeps. It does not move at all: 0.959–0.962 for the shared poller across a range of the parameter, and at queue depth 1, where the pipeline is shallowest, exactly 1.000 for the shared poller and 4.000 for the independent-ring variant at every setting tested, with p99 flat at 0.14–0.15 ms. The poller never times out in this workload even when given a 1 ms window, because the submission queue is never empty for that long. A parameter whose effect is gated on an event that does not occur cannot explain the tail latency, and we accordingly withdraw it as a candidate.
6. Discussion
The open question from Section V-B is answered in the negative: SQPOLL’s IOPS shortfall against libaio and plain io_uring is not a core-budget artifact of the smaller test machine, since widening the core count did not close it and in libaio’s case widened it. What remains open is why.
One candidate explanation is that SqpollEngine’s completion-harvesting path, a non-blocking peek of the CQ followed by application-side backoff when it finds nothing, scales worse than libaio’s blocking io_getevents or plain io_uring’s io_uring_wait_cqe_nr at higher core counts, because a busy-waiting or backoff-looping application thread and a busy-spinning kernel poller thread contend for shared cache lines on the completion ring more as more cores are involved. This is a plausible mechanism, consistent with the tail-latency data in Table 3, but this suite did not instrument cache-coherence traffic, memory-controller counters, or per-core cycle accounting, so we report it as a hypothesis this data is consistent with, not as a confirmed cause. A second candidate was that the SQPOLL tuning constants used throughout this study, fixed informally against the 4-vCPU box and never retuned for 16, were simply wrong for the wider machine. The sweep in Section V-D closes half of that: sq_thread_idle does not affect throughput, tail latency, or kernel entries per operation anywhere in the range tested, because the poller never reaches its idle timeout under this workload at any of the tested windows. The completion-side backoff constants (Section IV-D) remain unswept, and are the one tuning avenue still open.
We do not treat the contention hypothesis as established. The honest summary of what this suite’s data supports is: SQPOLL trades throughput and tail latency for a large reduction in kernel entries per operation, and that trade does not improve, and by one measure gets worse, on a machine with more spare cores.
7. Limitations and Threats to Validity
All measurements were taken on GCE Local SSD NVMe devices behind a virtualization layer; absolute IOPS and latency figures reflect that layer as well as the underlying flash, and should not be read as characterizing bare-metal NVMe performance. Every VM used n2-standard machine types at a single vendor and a single fixed clock; we did not test other cloud providers, other NVMe generations, or bare-metal hardware. The thread-count sweep for the four pipelined backends was bounded to rather than the full range POSIX uses, an explicit cost-versus-coverage trade-off; a gap between 8 and higher thread counts, where the 4-vCPU box’s independent-ring collapse first became severe, is not directly re-tested at 16 vCPUs beyond 8 threads. calls_per_op is an exact syscall count for POSIX and libaio but only an upper bound for the three io_uring-based backends, as discussed in Section IV-C; the true syscall counts for those backends may be lower than reported. Each backend was measured at its own best-practice buffer handling (SqpollEngine’s fixed, pre-registered buffers against the baselines’ aligned heap memory), which is the intended comparison but is not an identical-conditions comparison in the buffer-handling dimension. The discussion in Section VI is explicitly not settled by this data; the cross-core contention hypothesis has not been tested with hardware performance counters, and the completion-side backoff constants (Section IV-D) were not swept; sq_thread_idle was (Section V-D), and the sweep in that section was run at 4 threads and queue depths 1 and 128 only, not across the full matrix. Finally, this study compares only SQPOLL, plain io_uring, libaio, and POSIX; it does not measure IORING_SETUP_IOPOLL (completion-side polling against a driver configured for it), NVMe passthrough via IORING_OP_URING_CMD, or SPDK, all of which target the same per-operation overhead from different angles and are the natural next comparison points.
8. Related Work
Kernel-bypass and reduced-syscall I/O designs have a long history outside the storage stack specifically. Arrakis [1] and IX [2] moved network I/O out of the kernel’s control-plane path entirely, arguing, as we do here for storage, that per-operation kernel crossings dominate cost once device latency drops far enough. The Storage Performance Development Kit [3] takes this further for NVMe specifically, running the entire driver in user space with no kernel involvement in the data path at all, a stronger design point than SQPOLL, which still routes I/O through the kernel’s block layer but removes the per-operation syscall. io_uring itself, and the SQPOLL mode this paper evaluates, are described in Axboe’s original design document [4]; libaio’s interface is documented in the Linux man-pages project [5].
Two more recent studies bear directly on this paper’s negative result. Didona et al. [6] ran one of the first systematic comparisons of libaio, SPDK, and io_uring and found that io_uring’s polling design has a large effect on performance, that it can approach SPDK given enough CPU cores, and that scaling across cores and devices needs a hybrid approach rather than one polling strategy applied uniformly, consistent with this paper’s finding that adding cores did not close SQPOLL’s gap on its own. Jasny et al. [7] evaluate io_uring inside a database buffer manager and report SQPOLL as one of several incremental wins, roughly 32% throughput at their operating point, alongside registered buffers, IORING_SETUP_IOPOLL, and NVMe passthrough, in a workload built to keep the CPU, not the device, as the bottleneck. Both studies point at the same resolution this paper’s data supports without directly testing it: SQPOLL’s win condition is a CPU- or syscall-bound workload, and it disappears once something else, a saturated device in our case, becomes the limit first. The Linux io_uring_sqpoll(7) manual page states this directly, that SQPOLL "is not universally beneficial and each use case should be benchmarked to determine if it provides value," and specifically warns against it on CPU-constrained systems and bursty workloads with long idle gaps [8]. Where this paper differs from all three is in reporting where an implementation built around the opposite assumption, that SQPOLL should win outright, actually lands empirically once that assumption is tested against a device-saturated rather than CPU-saturated setup, including a negative result on raw throughput and the measurement pitfalls that produced misleading numbers along the way.
9. Conclusions
We built ringio around the argument that an SQPOLL kernel poller, by removing the per-operation syscall other asynchronous I/O interfaces still pay, should win on IOPS against libaio and plain io_uring on a real NVMe device. Measured across two machine sizes and a swept thread-count and queue-depth matrix against a virtualized cloud SSD, it does not, once that device saturates. libaio matches or beats every SQPOLL configuration we tested on raw IOPS at every point in the matrix, its advantage is largest, not smallest, below the device’s throughput ceiling, and it grows, not shrinks, on a wider-core machine, ruling out core oversubscription as the explanation. SQPOLL’s actual advantage, an order-of-magnitude reduction in kernel entries per completed operation at high queue depth, comes with a tail-latency cost that also grows on the wider machine rather than shrinking. Reading this against Didona et al. [6] and Jasny et al. [7], who report SQPOLL winning in CPU-bound settings this study’s device-bound one does not reach, points at a resolution this paper does not test directly: SQPOLL’s value is conditional on where the bottleneck sits, not a fixed property of the mechanism. The underlying mechanism for the tail-latency growth remains open, though a sweep of sq_thread_idle excludes the poller’s idle window as the cause, and this study does not compare against IORING_SETUP_IOPOLL, NVMe passthrough, or SPDK; this paper reports what was measured against the four interfaces it did test and separates that plainly from what it did not.
Funding
This work received no external funding. Cloud instances were self-funded.
Data Availability Statement
The engine, the benchmark harness, and the phase-by-phase record of every run reported here, including the configurations behind each table, are at https://github.com/sinhaparth5/ringio. Raw Google Benchmark JSON output is not archived; the harness regenerates it from the commands given in Section IV.
Conflicts of Interest
The author declares no conflict of interest.
Use of AI Tools
Claude Code was used for the benchmark harness implementation, run orchestration, and manuscript preparation. The author verified all reported measurements and takes responsibility for the content.
References
- Peter, S.; Li, J.; Zhang, I.; Ports, D. R. K.; Woos, D.; Krishnamurthy, A.; Anderson, T.; Roscoe, T. Arrakis: The operating system is the control plane. ACM Trans. Comput. Syst. 2015, vol. 33(no. 4). [Google Scholar]
- Belay, A.; Prekas, G.; Klimovic, A.; Grossman, S.; Kozyrakis, C.; Bugnion, E. IX: A protected dataplane operating system for high throughput and low latency. In Proceedings of the 11th USENIX Symposium on Operating Systems Design and Implementation (OSDI), 2014. [Google Scholar]
- Storage Performance Development Kit (SPDK), Intel Corporation and SPDK contributors. Available online: https://spdk.io.
- Axboe, J. “Efficient IO with io_uring,” Linux kernel documentation. Available online: https://kernel.dk/io_uring.pdf.
- Linux man-pages project, io_submit(2), io_getevents(2), and io_uring_enter(2) manual pages. Available online: https://man7.org.
- Didona, D.; Pfefferle, J.; Ioannou, N.; Metzler, B.; Trivedi, A. Understanding modern storage APIs: a systematic study of libaio, SPDK, and io_uring. In Proceedings of the 15th ACM International Conference on Systems and Storage (SYSTOR), 2022; pp. 120–127. [Google Scholar]
- Jasny, M.; El-Hindi, M.; Ziegler, T.; Leis, V.; Binnig, C. io_uring for high-performance DBMSs: when and how to use it. arXiv 2025, arXiv:2512.04859. [Google Scholar]
- io_uring_sqpoll(7) manual page, liburing project. Available online: https://manpages.debian.org/testing/liburing-dev/io_uring_sqpoll.7.en.html.
Table 1.
4 vCPUs, 4 threads, queue depth 128: round trips per operation (calls_per_op) and p99 latency.
Table 1.
4 vCPUs, 4 threads, queue depth 128: round trips per operation (calls_per_op) and p99 latency.
| Backend | calls_per_op | p99 (ms) |
|---|---|---|
| libaio | 1.3–4.3 | 14.3 |
| Plain io_uring | 1.3–4.3 | 15.0 |
| SqpollEngine (independent) | 0.1–0.3 | 23.5 |
Table 2.
16 vCPUs, queue depth 32: IOPS (thousands) by backend and thread count.
| Backend | 1 thr | 2 thr | 4 thr | 8 thr |
|---|---|---|---|---|
| libaio | 160.7 | 197.2 | 201.2 | 205.9 |
| Plain io_uring | 69.3 | 140.8 | 198.6 | 200.3 |
| SqpollEngine (independent) | 69.4 | 142.1 | 198.3 | 202.2 |
| SqpollEngine (shared poller) | 79.6 | 140.7 | 190.7 | 191.6 |
Table 3.
4 threads, queue depth 128: p99 latency (ms), 4 vCPUs vs. 16 vCPUs. aindependent-ring variant; bshared-poller variant.
Table 3.
4 threads, queue depth 128: p99 latency (ms), 4 vCPUs vs. 16 vCPUs. aindependent-ring variant; bshared-poller variant.
| Backend | 4 vCPU box | 16 vCPU box |
|---|---|---|
| libaio | 14.3 | 15.1 |
| Plain io_uring | 15.0 | 40.4 |
| SqpollEngine | 23.5a | 47.6b |
Disclaimer/Publisher’s Note: The statements, opinions and data contained in all publications are solely those of the individual author(s) and contributor(s) and not of MDPI and/or the editor(s). MDPI and/or the editor(s) disclaim responsibility for any injury to people or property resulting from any ideas, methods, instructions or products referred to in the content. |
© 2026 by the authors. Licensee MDPI, Basel, Switzerland. This article is an open access article distributed under the terms and conditions of the Creative Commons Attribution (CC BY) license (http://creativecommons.org/licenses/by/4.0/).
Copyright: This open access article is published under a Creative Commons CC BY 4.0 license, which permit the free download, distribution, and reuse, provided that the author and preprint are cited in any reuse.