

Submitted:
11 September 2026
Posted:
14 September 2026
You are already at the latest version
Abstract
This paper presents a prospective multivariate analysis of Angola’s electricity sector from 2024 to 2050, assessing the economic, demographic, and environmental impacts of three energy transition pathways: Baseline (BS), Green Transition (GTS), and Restricted Development (RDS). Using energy system optimization models supported by parametric robustness tests, the analysis projects rapid electricity demand growth driven by population expansion to approximately 86 million inhabitants by 2050. Under the GTS scenario, electricity demand reaches 283 TWh, with per capita consumption increasing to 3,350 kWh/person. Although large-scale hydropower remains the backbone of the electricity system, supplying 37–51% of generation, solar photovoltaics become the dominant expansion technology, representing up to 33% of installed capacity while achieving the lowest Levelized Cost of Electricity (19.2–25.5 EUR/MWh). In contrast, diesel generation and new hydropower plants exhibit substantially higher generation costs. For isolated rural grids, diesel–solar hybrid systems reduce electricity production costs by more than 50% and significantly lower carbon intensity. Sensitivity analysis reveals that system costs are highly influenced by discount rate and macroeconomic assumptions but remain comparatively resilient to technological uncertainties. The findings demonstrate that large-scale solar deployment and decentralized hybrid systems are key strategies for achieving a cost-effective and low-carbon electricity transition in Angola.
Keywords:
lowest-cost planning
; diesel-solar hybrid systems
; Angola
; green hydrogen
; multi-scenario modeling
1. Introduction
The electricity sector in Angola has been undergoing a period of rapid transformation, marked by rising demand for electricity, the need to diversify the generation mix, and the rehabilitation and expansion of infrastructure inherited from the period of conflict—particularly hydroelectric power plants and transmission and distribution networks [1]. Hydroelectric power plants remains the main source of electricity generation, supplemented by fossil-fuel-fired thermal power plants and a still-small share of new renewable energy sources, such as solar and wind power [1,2]. The sustainable expansion of Angola’s energy system is essential to balancing security of supply, universal access to energy, and the reduction of energy poverty with the need to limit CO₂ emissions and align with global climate change mitigation goals [1,3]. Electric power planning studies for specific regions of Angola, such as Namibe Province, show that combining increased hydroelectric capacity with the integration of solar, wind, and natural gas sources can reduce generation costs and greenhouse gas emissions, while increasing the reserve margin and system reliability [2].
The energy transition in emerging economies faces specific challenges: heavy reliance on fossil fuels, institutional and regulatory constraints, financial constraints, gaps in technical capacity, and the need to ensure a just and inclusive transition [4,5]. In this context, long-term energy planning plays a central role, using generation expansion planning (GEP) models to determine the optimal mix of technologies, minimizing total cost subject to technical, environmental, and security-of-supply constraints [6,7,8]. Recent reviews show that these models are rapidly evolving to incorporate high penetrations of renewables, energy storage, and interactions with carbon markets [6,7,8,9,10,11,12]. In the case of Angola, the literature has focused primarily on life-cycle analyses of the electric power system and on regional scenario studies using tools such as Long-range Energy Alternatives Planning System (LEAP) [1,2], highlighting the need to more explicitly integrate econometric demand modeling with long-term capacity expansion models. The main objective of this study is to develop a hybrid model that combines an econometric demand projection module with a capacity expansion model, analyzing the evolution of Angola’s electric power system under different development scenarios through 2050. The model assesses implications in terms of required additional capacity, generation mix composition, system costs, emission factors, and carbon intensity, thereby contributing to Angola’s sustainable energy planning. Electricity demand projection is fundamental to long-term energy planning, especially in developing countries [13,14]. In many models, demand is treated as an exogenous variable, derived from the growth trajectories of Gross Domestic Product (GDP), population, and energy prices [15,16], without adequately taking into account structural changes in the economy, the diffusion of technology, and improvements in energy efficiency [13,17]. The lack of long and reliable time series data limits the sophistication of demand models in transition economies; it is common to find planning studies in Africa that extrapolate demand based on historical trends, without rigorously calibrating the econometric parameters [17,18,19]. Most planning practices in low- and middle-income countries use relatively simple econometric models with limited parameter calibration [16,20], which reduces the ability to evaluate alternative scenarios and introduces uncertainty into long-term assessments [14,17]. Recent literature highlights the importance of hybrid approaches that link demand modeling to power expansion models [13,19], which have yet to be fully explored in the African context.
The challenge facing GEP—determining the type, size, location, and installation schedule of new power plants—has evolved from minimum-cost approaches to multi-objective models that incorporate uncertainty regarding resource availability, fuel prices, and demand [6,7,8,11]. The need to model system operations with temporal detail led to the development of models with high hourly resolution, capable of handling variable renewable generation and storage technologies to enable decarbonization scenarios [9,12,22]. In the specific case of Angola, existing studies focus on life-cycle analyses assessments of the electric power system [1] and in regional scenario analyses using LEAP [2]. However, there is still no comprehensive assessment of Angola’s electricity system that combines demand, optimal capacity, costs, and emissions through 2050, nor is there a robust analysis of macroeconomic and technological uncertainties. This study addresses these gaps through a hybrid model with sensitivity analysis applied to the 2024–2050 horizon.
2. Characterization of Energy Resources
2.1. Solar Resource
Figure 1a) and 1b) show the spatial distribution of global horizontal irradiation (GHI) and photovoltaic power potential in Angola. Both indicators increase from the northwestern coast toward the central and southern regions, with annual irradiation ranging from 1,607 to 2,433 kWh/m² and photovoltaic power potential from 1,241 to 1,972 kWh/kWp. The highest values are concentrated in Namibe, Cunene, Huíla, Cuando and Cubango, confirming their excellent suitability for utility-scale photovoltaic deployment, whereas the northwestern coastal region, particularly Cabinda, presents comparatively lower solar potential due to maritime influences.
2.2. Water Resources
Angola’s hydropower resources are estimated at approximately 18 GW, corresponding to an annual generation potential of about 72 TWh [24]. Around 86% of this potential is concentrated in the Kwanza, Queve, Catumbela, and Cunene, river basins, with nearly 100 identified sites, several exceeding 10 MW [24]. Figure 2 shows the spatial distribution of hydropower potential, confirming the dominance of these river basins, whereas the southern regions exhibit comparatively lower potential.
2.3. Biomass Energy
Biomass resources in Angola are mainly derived from forest residues and the sugar industry, with an estimated potential of up to 170 MW in some locations, particularly in the central and eastern regions [23]. The Ministry of Energy and Water identified 42 biomass projects totalling 3.7 GW, including 3.3 GW from forest biomass and more than 350 MW from sugarcane residues [23]. Figure 3 shows the spatial distribution of land cover, highlighting the concentration of forested areas in the northern and central regions, which confirms their greater biomass resource potential.
2.4. Wind Energy
Wind energy potential in Angola is concentrated along the Atlantic coast, particularly in the southwest, where average wind speeds at 80 m exceed 6 m/s [23]. The Ministry of Energy and Water identified 13 wind projects with a total potential capacity of 3.9 GW; several located near existing transmission infrastructure with up to 604 MW of grid connection capacity [23]. Figure 4 shows the spatial distribution of wind resources, confirming that Namibe has the highest wind potential, while most inland and northern regions remain below 5 m/s, making the southwestern coast the most suitable area for large-scale onshore wind development.
3. Materials and Methods
The proposed methodology projects the development of the Angolan electricity sector through the year 2050. The model assesses the expansion of installed capacity, technical electricity generation, carbon dioxide emissions, and changes in economic costs using life-cycle indicators. The simulations are based on historical data series from 2010 to 2024, as well as on the strategic energy planning targets established by the Government of Angola [24,26,27]. The overall methodological procedure is outlined in Figure 6. Numerical processing, econometric calibration, and the solution of dynamic algorithms were performed in the MATLAB technical computing environment, using a platform equipped with an Intel® Core™ i7-5500U processor (2.40 GHz), 16 GB of RAM, and the 64-bit Windows 11 Pro operating system.
3.1. Data Sources and Technical Parameter
The model is based on historical time series for installed capacity, electricity generation, GDP, and population for the period 2010–2024, presented in Table 1, which were used to calibrate and validate the dynamics of the Angolan energy system. The technical, economic, and environmental parameters by technology are presented in Table 2, including CAPEX, OPEX, useful life, capacity factors, and operational and life-cycle emission factors, compiled from scientific literature and international sources. The assumed capacity factors reflect typical operating conditions; for biomass, a range of 60–75% was considered, based on resource availability and subject to sensitivity analysis [23]. Monetary variables were harmonized in euros using an exchange rate of 0.92 EUR/USD (Bank of Portugal, May 20, 2026), ensuring consistency in the economic evaluation of the LCOE and Levelized Cost of Hydrogen (LCOH) indicators.
Figure 5.
Methodology used.
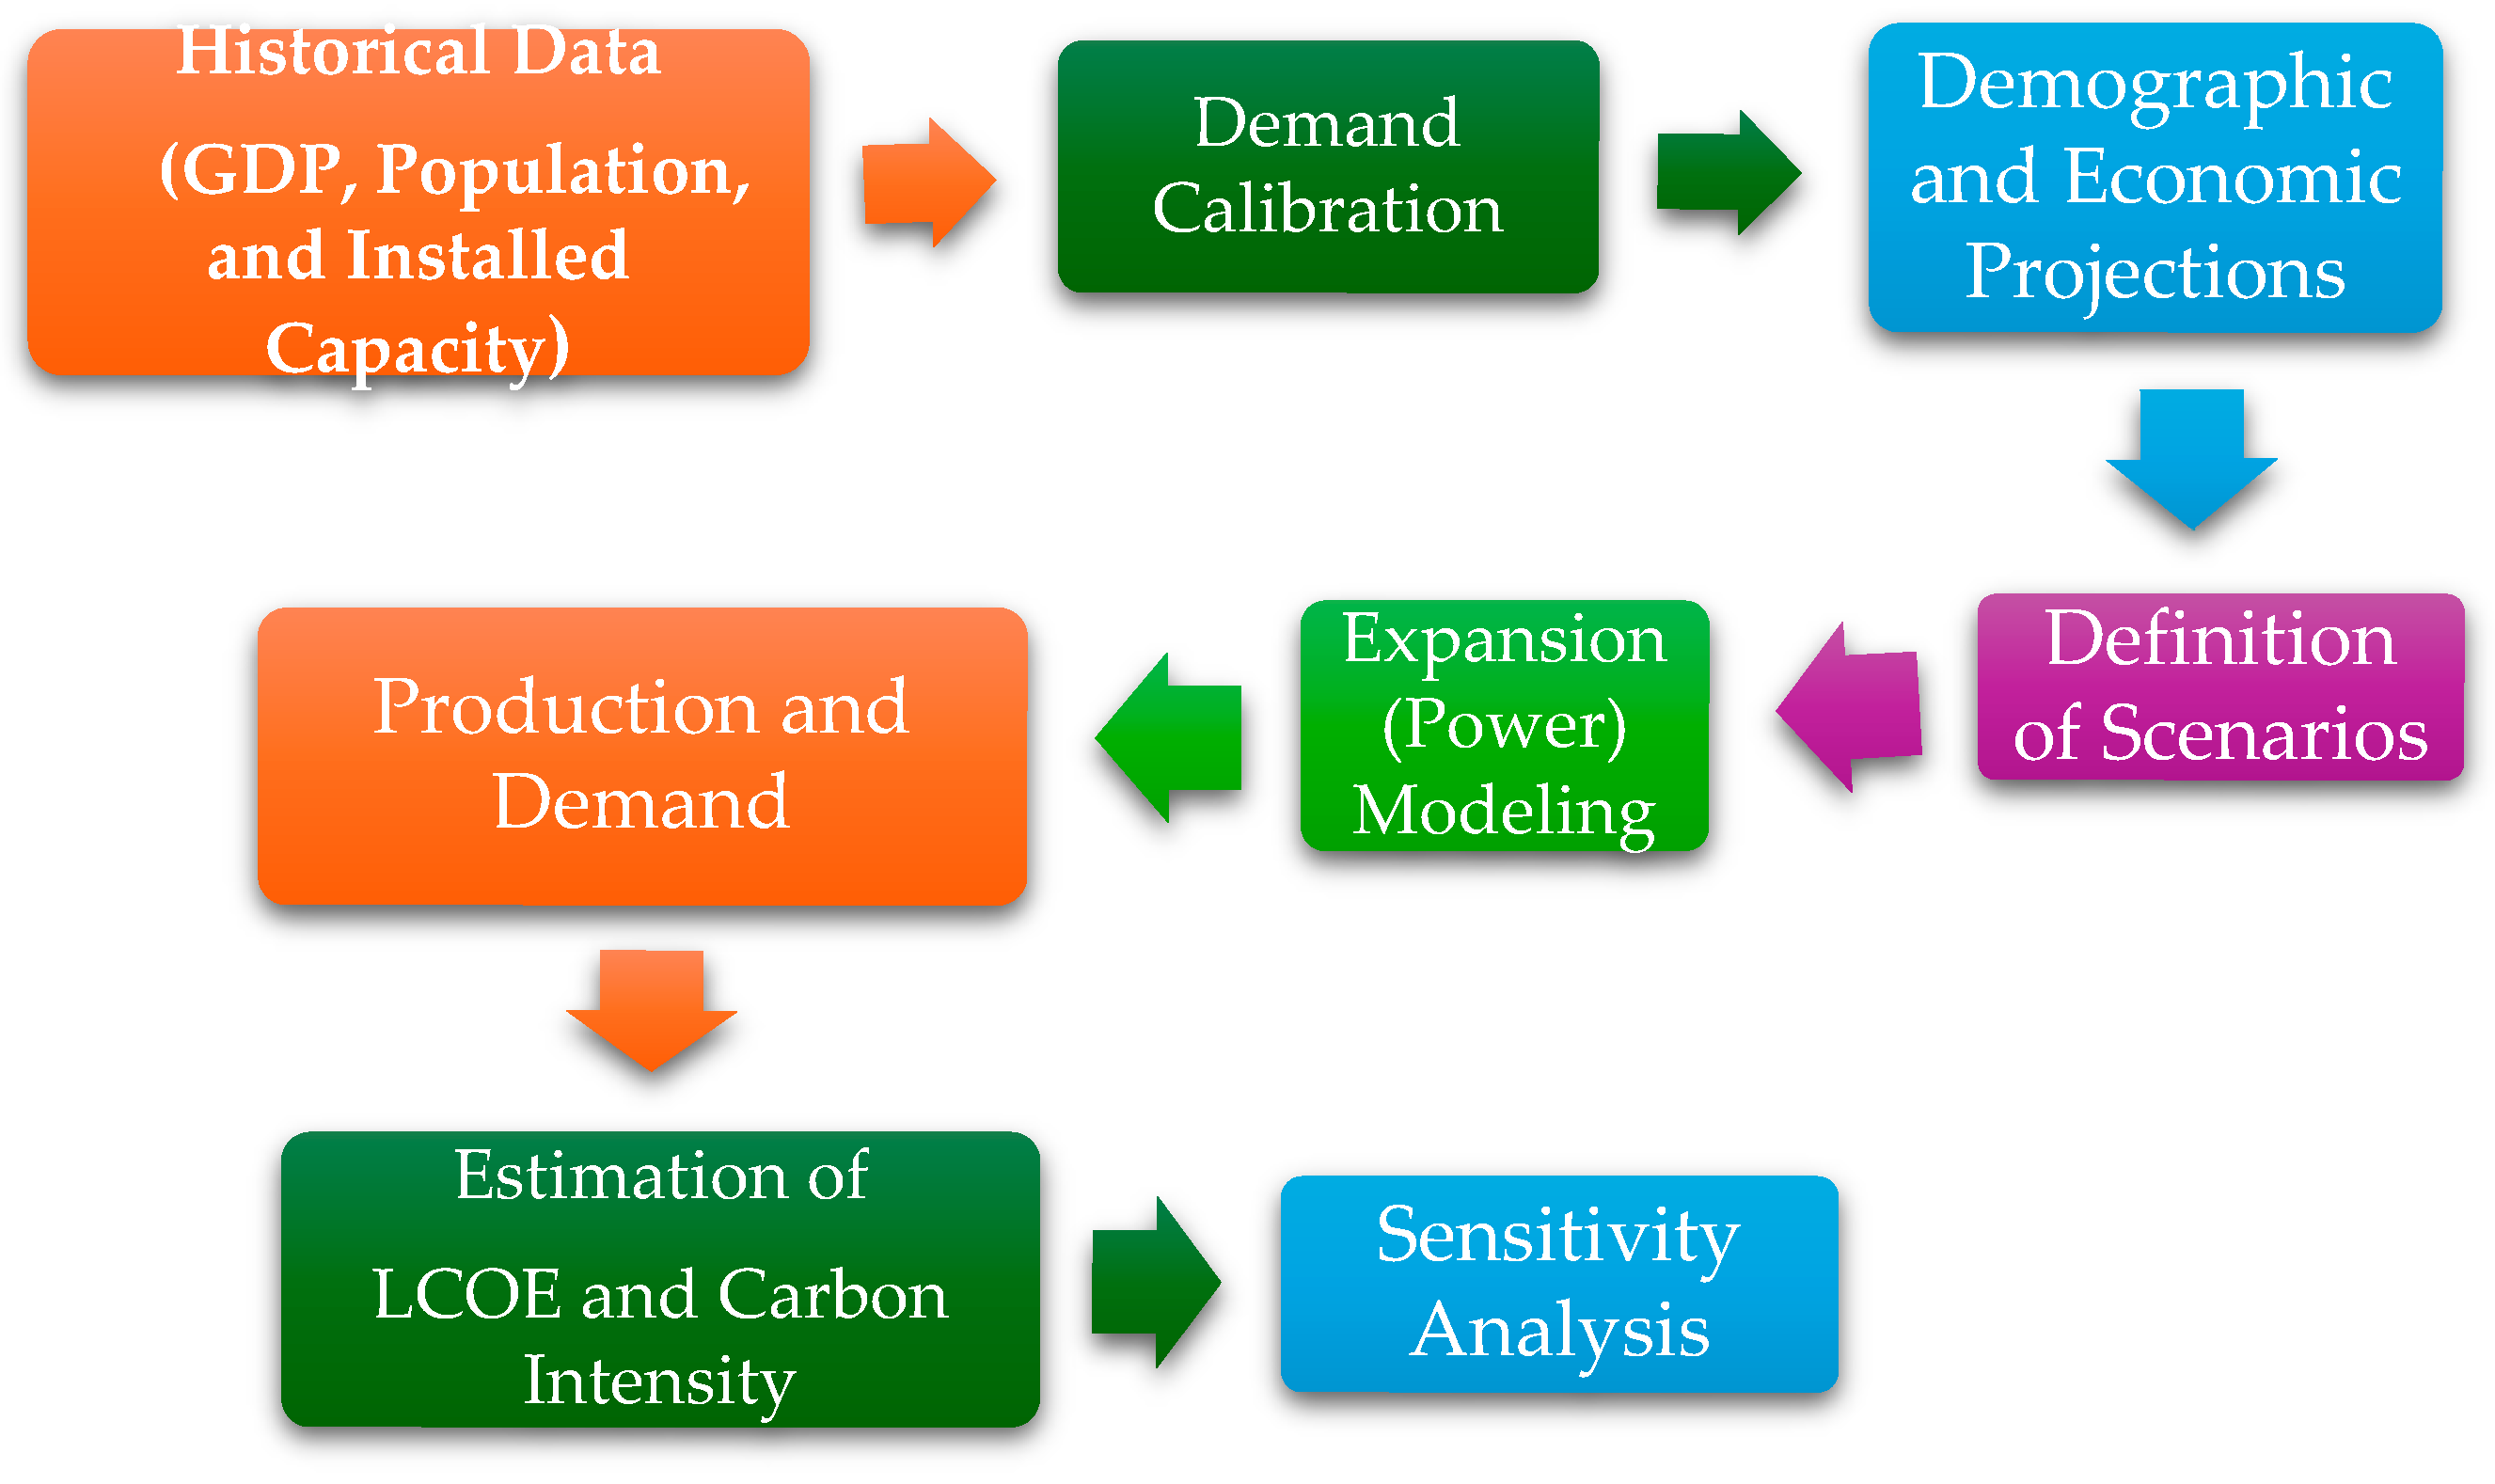
Table 3 summarizes the model’s overall parameters, including the discount rate, technological learning, fuel prices, and scenario assumptions for the 2024–2050 horizon. In the diesel–solar hybrid system, CAPEX was estimated by weighting the costs of the photovoltaic and diesel subsystems.
3.2. Historical Calibration and Demand Elasticity (2010–2024)
The model is calibrated using the observed time series from 2010 to 2024, employing a multiple linear regression based on natural logarithms to estimate the elasticity coefficients of Gross Domestic Product (GDP) and installed capacity. The econometric model adopted from Grimaldo et al. [50], and Omotola et al, [51], described by the Equation (1).
where: ln(Ghist,t), ln(PIBreal,t) e ln(CapGW,t) express the variables in natural logarithms; β1 model intersection; β2 Historical Elasticity of Demand Relative to GDP; β3 historical elasticity of demand relative to installed capacity; β4 Impact Coefficient of Structural Expansion; PIBreal,t real GDP at constant prices; CapGW,t total installed capacity. The dummy variable Dexpansion ,t reflects the structural shift in electricity supply (2017–2021) associated with Laúca and Cambambe II. The statistical validation of the calibration is assessed through R2 and MAPE. The R2 measures the explained variance, according to the equation (2) [52]:
where: R2 coefficient of determination; SSres represents the sum of the squares of the residuals and SStot defines the sum of the squares around the sample mean . In addition, the absolute magnitude of the residual error was quantified using the MAPE, calculated according to the equation (3) [52]:
where: MAPE mean absolute percentage error, and in Equations (1.2) and (1.3), yi actual historical value of demand; fi value estimated by the model and N = 15 total number of observations. Figure 7 shows the results of the historical calibration and statistical validation of the model.
ln(Ghist,t) = β1 + β2ln(PIBreal,t) + β3ln(CapGW,t) + β4Dexpansion,t
Figure 6.
Historical calibration and validation of the electrical model for Angola (2010–2024): a) comparison between actual generation [G] and model generation [m]; b) statistical validation (R²) and (MAPE).
Figure 6.
Historical calibration and validation of the electrical model for Angola (2010–2024): a) comparison between actual generation [G] and model generation [m]; b) statistical validation (R²) and (MAPE).
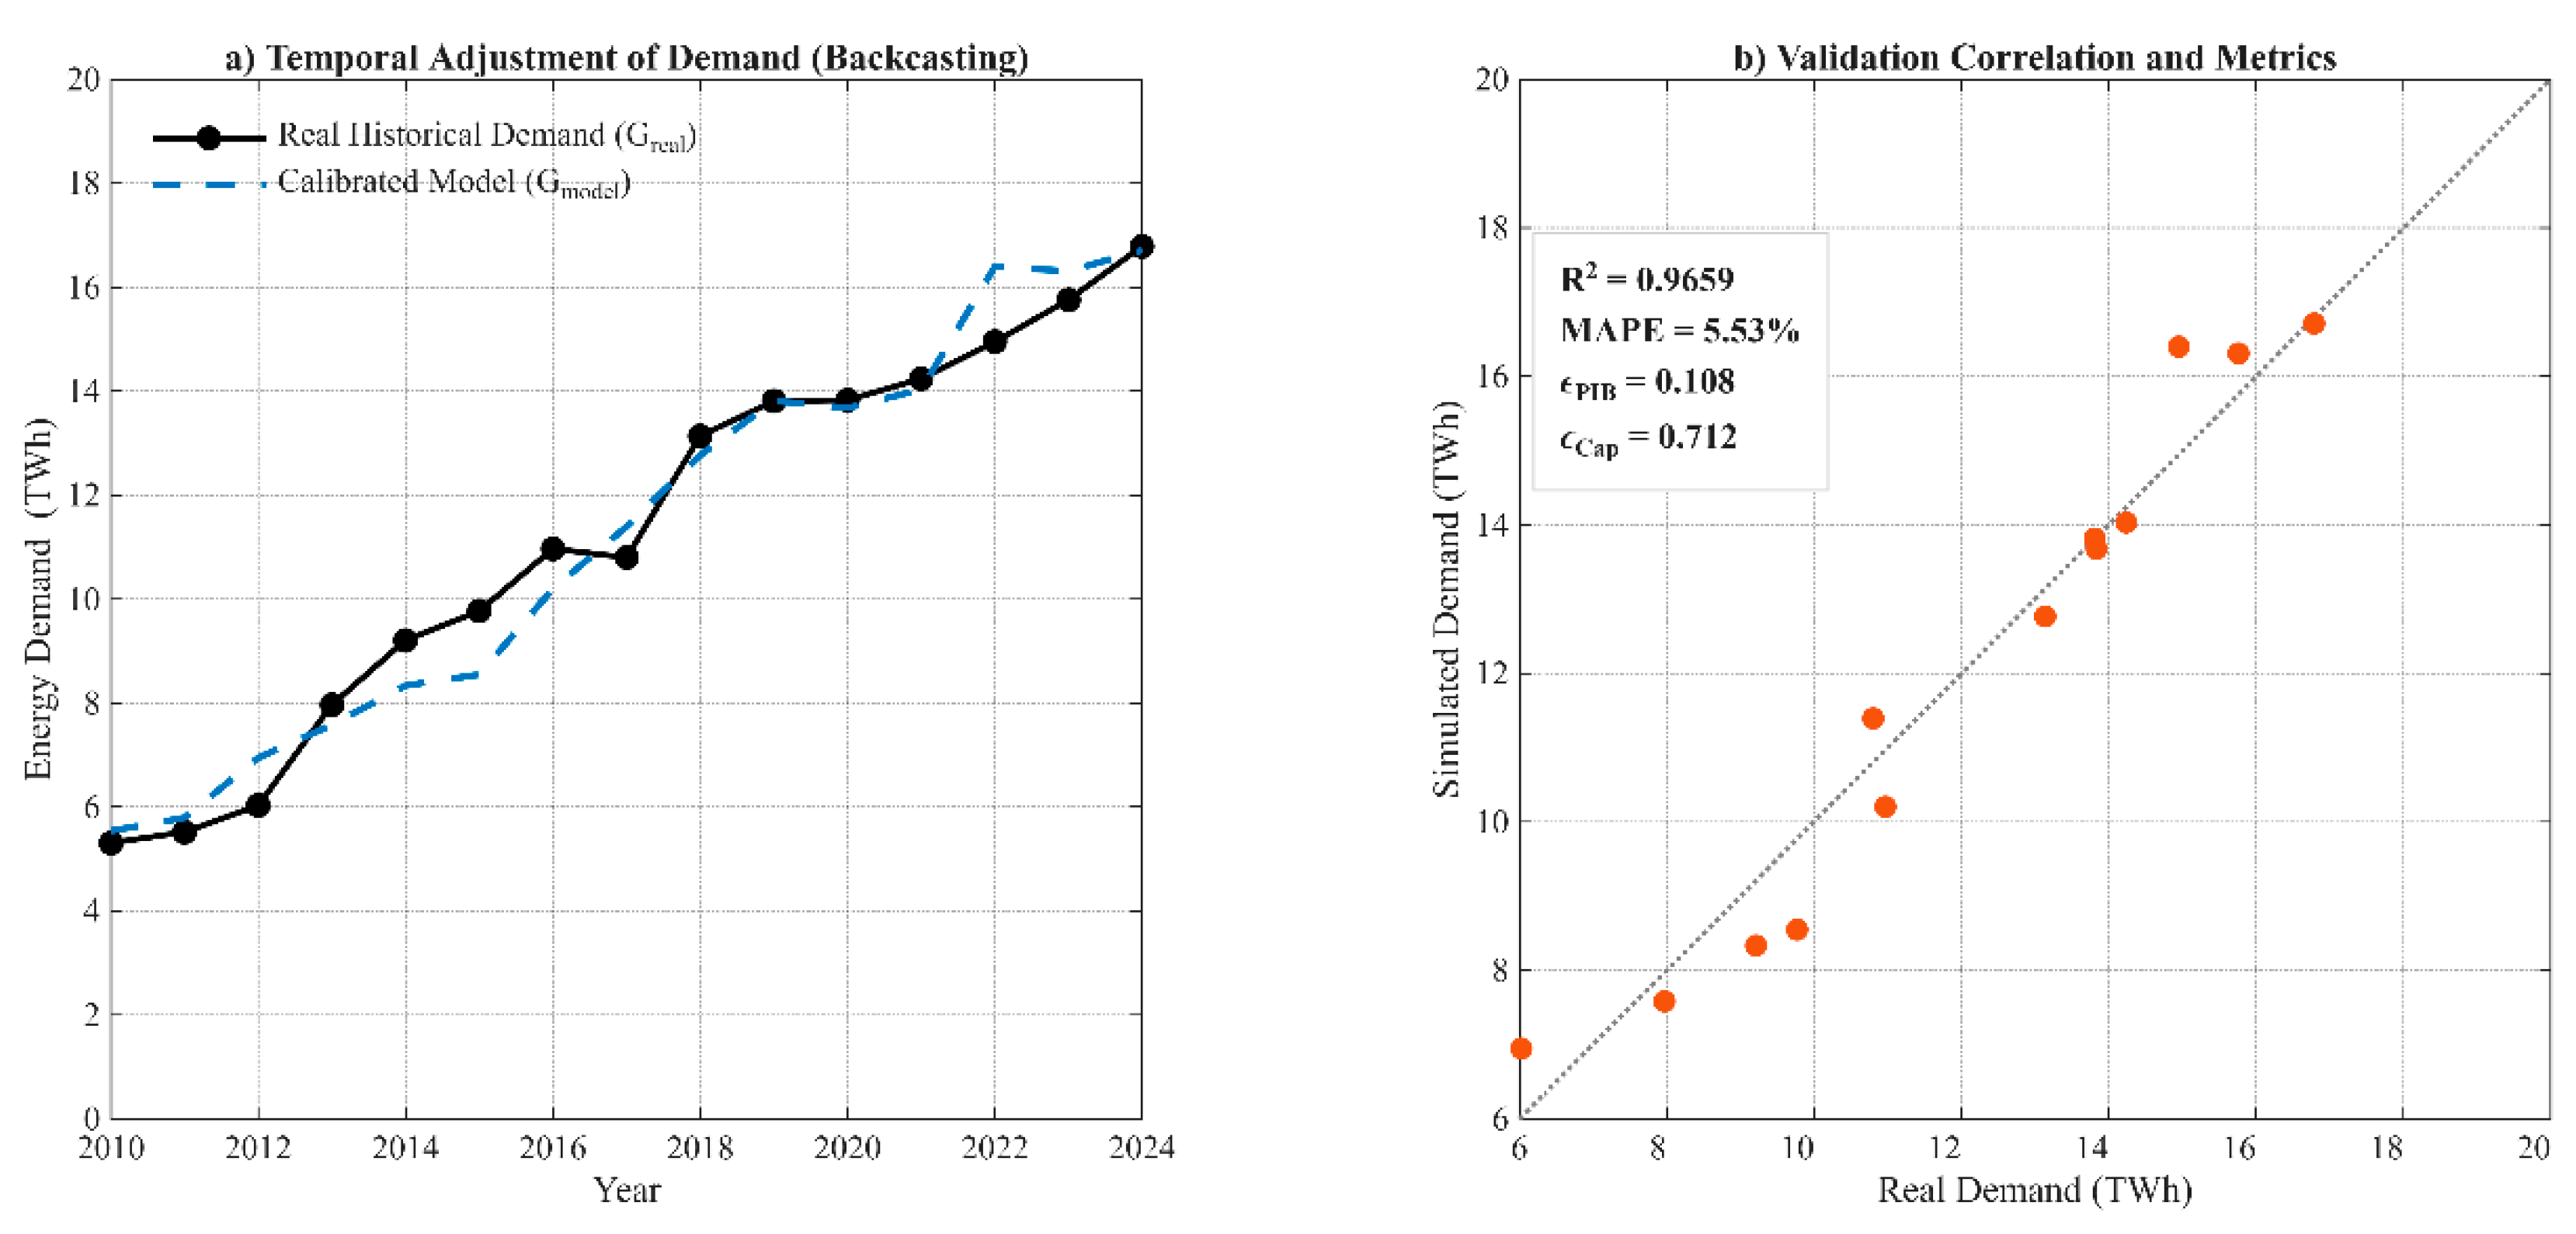
The model exhibits high fit to the historical data, with an R-squared value of 0.9659 and a MAPE of 5.53%. These results confirm the model’s predictive robustness and the validity of the calibration for the BS, GTS, and RDS scenarios, falling below the 10% threshold commonly accepted in the energy planning literature.
3.3. Demographic Trends and Projected Macroeconomic Elasticity (2024–2050)
For the 2024–2050 period, the population and GDP grow annually at the exogenous rates specified for each scenario. To project these variables, we adopt the approach proposed by Kitessa et al. [53], as expressed in Equations (4) and (5):
where: Popt is the population for the year t; Popt−1 the previous population; GRPop,t−1 population growth rate; GDPPt is the GDP for the year t ; GRPIB,t−1 the rate of economic growth and GDPt−1 the initial value. The elasticity of demand follows a dynamic, nonlinear trajectory linked to GDP per capita (GDPpc,t = GDPPt/Popt), adopting the generalized logistic function of Khalili et al. [54], as given by Equation (6):
where: εdin,t dynamic elasticity over the time period t; εmin = 0.85 e εmax = 1.45 are the lower and upper operational limits of elasticity; GDPpc,t It is GDP per capita in dollars (USD/capita) that drives the energy transition; GDPref = 8695.65 USD corresponds to the reference income level at which elasticity reaches half of its transition; e αpc = 2173.91 USD is the model's dimensional scale constant.
Popt = Popt−1 + (GRPop,t−1× Popt−1)
GDPPt =GDPPt−1 + (GRPIB,t−1× GDPPt−1)
The value of GDPref it was set above the all-time high recorded in Angola (6,378.59 USD per capita in 2014), ensuring a gradual transition in elasticity between emerging and mature economies. Thus, total electricity demand is dynamically projected by coupling effective rates and energy efficiency, based on the methodological approaches of Liddle et al. [55] and Khalifa et al. [56], as shown in Equation (7):
where: Gt is the estimated electricity demand for year t (TWh); Gt−1 demand observed in the previous year (TWh); GRGDPt−1 GDP growth rate for each scenario and ηeffective = 0.02 the energy efficiency factor.
3.4. Definition of Scenarios
Three distinct energy scenarios were defined to assess different development trajectories:
Baseline Scenario (BS) – continuation of current trends, with moderate expansion of renewables and a significant share of conventional thermal sources; Green Transition Scenario (GTS) – high penetration of renewables (solar, wind, and green hydrogen), aligned with decarbonization. Includes 2.8% hydrogen by 2050, contingent on the pace of investment and technology transfer; and Restricted Development Scenario (RDS) – a conservative scenario with limited expansion of installed capacity due to economic and institutional constraints.
3.5. Logistics Trajectory of Total Installed Capacity
The expansion of the Angolan power system’s total installed capacity follows a logistic saturation curve, limited by a structural ceiling, according to the model proposed by Nakicenovic et al. [57] and applied by George et al. [58] and Akaev et al. [59]. The parameterization by Harijan et al. [60] is adopted, as shown in Equation (8):
where: Ptotal,t is total installed capacity in year t (GW); K the maximum capacity of the scenario (44.40, or 38 GW); rlog = 0,15 the intrinsic logistic growth rate; t simulation year; t0 = 2038 the turning point in the expansion of power.
3.6. Learning Dynamics and CAPEX Trends for Emerging Technologies
To estimate the reduction in capital costs for emerging technologies (solar photovoltaics, onshore wind, and green hydrogen) as a function of cumulative installed capacity, we adopted a framework that combines Wright’s Law [61], with the minimum cost threshold from the IMACLIM-R model [62], as shown in Equation (9):
where: CAPEXdin,j,t the dynamic investment cost of technology j in year t; CAPEXinitial,j e Pinitial, j define, respectively, the initial cost and the initial cumulative power; Pacum,t corresponds to the cumulative installed capacity; CAPEXmin, j asymptotic minimum cost limit; bj it is the index of technological learning elasticity.
This framework combines Wright’s Law [61] with a minimum cost threshold inspired by the IMACLIM-R model [62], ensuring progressive reductions in CAPEX without converging to economically unrealistic values. The learning exponent (bj) is determined endogenously from the learning rate ((LRj), as shown in Equation (10) [63]:
3.7. Leveled Cost Structure for Electricity and Hydrogen
3.7.1. Levelized Cost of Electricity (LCOE) Excluding Fuel
The Levelized Cost of Electricity (LCOE) for renewable technologies without direct fuel consumption (solar photovoltaic, onshore wind, and biomass) is calculated using Equation (11). The equation is based on the general LCOE model proposed in Ref. [64] and has been adapted to represent only capital and operating costs, under the assumption of tax neutrality (unit tax factor, Tax Factor = 1):
where: CAPEXj,t represents the cost of invested capital; CRFj,t constitutes the Capital Recovery Factor used to annualize the investment; OPEXj,t It is the cost of operation and maintenance e Eannual,j annual energy production generated by technology j. The Capital Recovery Factor it is calculated based on the financial discount rate r, which is equal to 0.08, and the asset's useful life nj, according to Equation (12) [62,63]:
Annual operating and maintenance costs are indexed to the invested capital using a fixed percentage (OPEX%,j) calculated as a function of CAPEX, according to Equation (13) [63]:
OPEXj,t = OPEX% × CAPEXdin,j,t
3.7.2. Levelized Cost of Electricity (LCOE) by Fuel Type
For systems based on the combustion of fossil fuels (gas-fired CCGTs and pure or hybrid diesel generators), the Levelized Cost of Electricity (LCOE) explicitly includes the annualized fuel cost component. This formulation is based on the general LCOE model with indexed operating costs set forth in Ref. [67], according to Equation (14) [67]:
where: CAPEXdin,j,t it is dynamic investment capital; CRFj,t constitutes the Capital Recovery Factor used to annualize the investment; OPEXj,t fixed and variable operating and maintenance costs (excluding fuel); Cj,t it is the total annualized cost of the fuel consumed e Eannual,j,t corresponds to annual electricity production. The estimate of the annual dynamic fuel cost incorporates changes in fuel prices, modeled using an annual escalation rate, as described by Short et al. [68]. Fuel energy conversion is modeled based on thermal efficiency and lower heating value, as proposed by Duffie and Beckman [69] and Kaabeche and Ibtiouen [70]. The annual fuel cost results from integrating these parameters with annual electricity production, as shown in Equation (15):
where: Cj,t annual fuel cost (EUR/year); Pbase fuel price in the base year; αt annual price escalation rate; ηj thermal efficiency of the technology; PCI lower heating value and the Dj,t annual dispatch factor.
3.7.3. Levelized Cost of Green Hydrogen (LCOH)
The estimate of the levelized cost of hydrogen (LCOHt), in €/kg, includes the annualized investment and operating costs, as well as the electrolysis conversion efficiency [71,72]. Capital costs are annualized using the Capital Recovery Factor (CRF), while the conversion of electricity to hydrogen is modeled by the ratio of hydrogen's lower heating value () and the efficiency of the electrolyzer (ηeletr) [72,73]. Integrating these parameters with annual hydrogen production yields Equation (16):
3.8. Carbon Footprint and CO₂ Emissions Inventory
Environmental accounting distinguishes between operational emissions and life-cycle emissions [74]. The former refer to the direct combustion of fossil fuels, while the latter encompass the entire life cycle of energy technologies [74]. Both inventories are calculated as the product of the electricity generated (Eannual,j) and the corresponding emission factors, as shown in Equations (17) and (18)) [74]:
where: Eop,t represents operational emissions e ELCA,t life-cycle emissions; EFop,j corresponds to the operational emission factor for technology j (gCO₂/kWh) and EFLCA,j to the corresponding life-cycle emission factor j.
3.9. Sensitivity Analysis
A univariate sensitivity analysis was performed (Table 4), in which the main parameters were varied individually to identify the primary sources of uncertainty. A Monte Carlo analysis was not applied at this stage due to the lack of robust empirical distributions; it will be reserved for future work.
4. Results
4.1. Trends in Macroeconomic Demand and Demographic Transition (2024–2050)
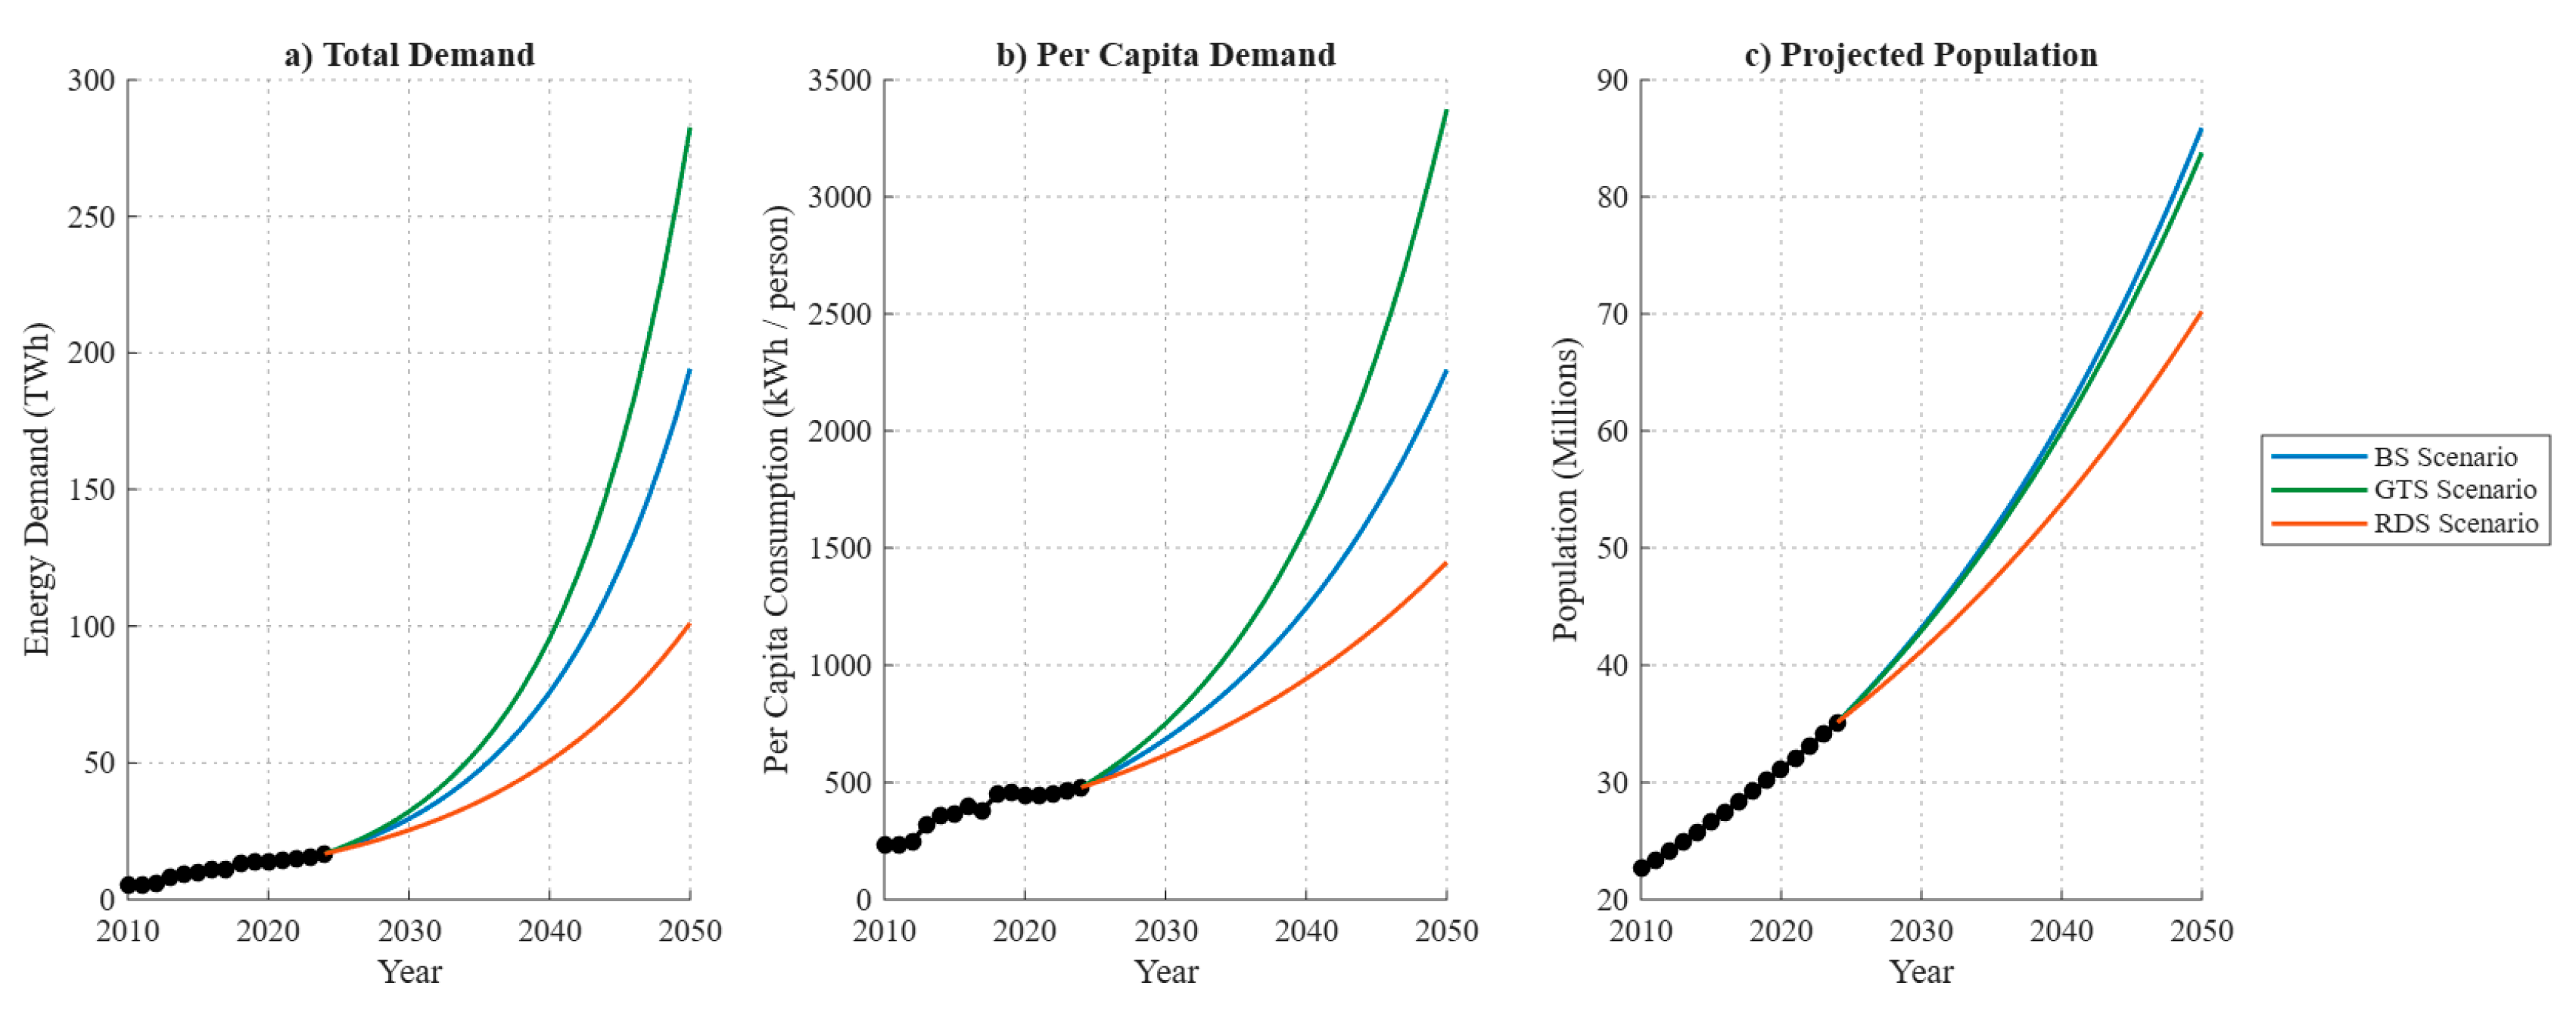
The validation of the Angolan electricity sector’s trajectories was based on the baseline (BS), green transition (GTS), and restricted development (RDS) scenarios, revealing structural divergences after 2024 compared to the stability observed between 2010 and 2024, as illustrated in Figure 8. Electricity demand shows a sharp acceleration, reaching 283 TWh in 2050 under the green transition scenario (GTS), 194 TWh under the baseline scenario, and 101 TWh under the restricted development scenario (RDS), reflecting different dynamics of economic growth and electrification rates, as shown in Figure 7a). Per capita consumption ranges from less than 500 kWh/capita to 3,350 kWh/capita (GTS), 2,250 kWh/capita (BS), and 1,430 kWh/capita (RDS). At the same time, the total population is projected to range between 84 and 86 million in the GTS and BS scenarios, and 70 million in the RDS scenario, directly influencing the pressure on the global energy system, as illustrated in Figure 7b) and 7c).
Figure 7.
Long-term projections of electricity demand and demographic trends in Angola (2010–2050) under the BS, GTS, and RDS scenarios: a) total electricity demand (TWh); b) per capita electricity consumption (kWh/capita); c) population trends (millions of inhabitants). Historical data (2010–2024) are indicated by discrete markers.
Figure 7.
Long-term projections of electricity demand and demographic trends in Angola (2010–2050) under the BS, GTS, and RDS scenarios: a) total electricity demand (TWh); b) per capita electricity consumption (kWh/capita); c) population trends (millions of inhabitants). Historical data (2010–2024) are indicated by discrete markers.
4.2. Optimal Power Expansion and Evolution of the Technology Mix
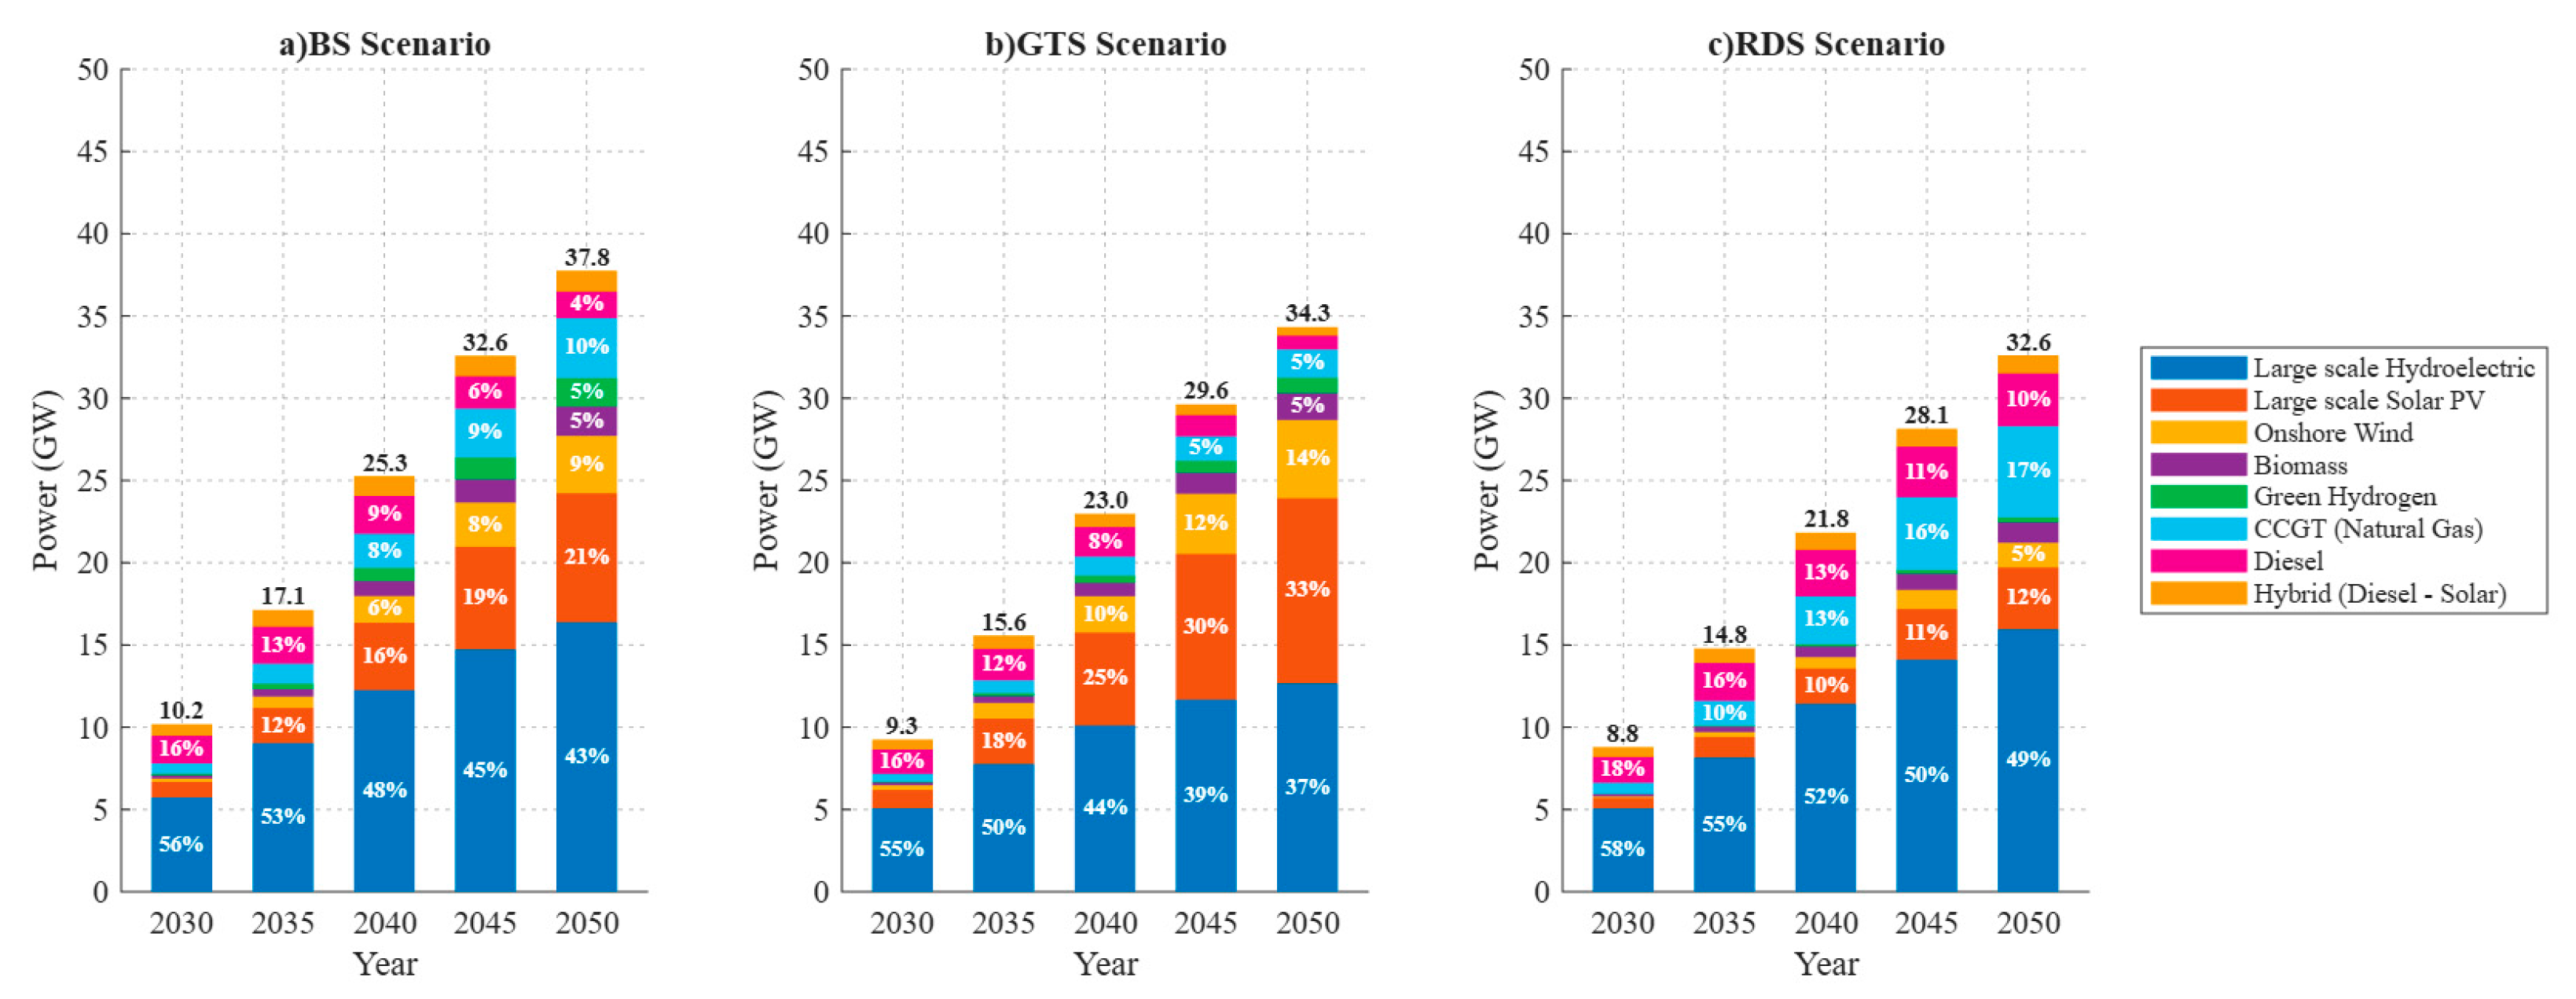
The installed capacity mix reflects a profound structural transition between 2030 and 2050, with marked differences among the scenarios analyzed. In the BS scenario, total installed capacity expands from 10.2 GW to 37.8 GW; the share of hydropower declines from 56% to 43%, while solar power rises to 21% and onshore wind power reaches 9%.
Natural gas (CCGT) stabilizes at 10%, diesel drops to 4%, biomass remains at a negligible level, and hybrid systems settle at 4% in 2050 (Figure 8a)). In the GTS scenario, total installed capacity reaches 34.3 GW. Reliance on hydropower declines from 55% to 37%, offset by strong penetration of solar (33%) and wind (14%). Natural gas combined-cycle power plants (CCGT) and diesel generator sets are limited to 5% in aggregate, green hydrogen reaches a 5% share, biomass remains marginal, and hybrid technology stands at 3% (Figure 8b)).
Finally, in the RDS scenario, total installed capacity amounts to 32.6 GW. Large-scale hydropower plants remains dominant in the sector (though its share declines slightly from 58% to 49%), solar photovoltaic reaches 12%, and wind power stands at 5%. Natural gas-fired thermal power expands to 17% and diesel to 10%, with biomass accounting for a negligible share, virtually no development of hydrogen, and a 3% share for hybrid systems (Figure 8c)).
Figure 8.
Optimal power expansion and evolution of the energy mix in Angola (2030–2050) under the following scenarios: a) BS; b) GTS; c) RDS, broken down by generation technology.
Figure 8.
Optimal power expansion and evolution of the energy mix in Angola (2030–2050) under the following scenarios: a) BS; b) GTS; c) RDS, broken down by generation technology.
4.3. Electricity Generation Mix and Decarbonization Pathway on the Supply Side
Electricity generation reflects the capacity expansion guidelines, showing a significant divergence in trends across the scenarios, as illustrated in Figure 9. In the BS scenario, annual production grows from 30 TWh to 194 TWh. The contribution from hydropower decreases from 60% to 47%, while solar and onshore wind account for 11% and 9%, respectively. Natural gas (CCGT) and green hydrogen account for 12% and 6% of the mix, respectively, while diesel declines to 3%. In the GTS scenario, total generation amounts to 283 TWh. Hydropower reduces its share to 44%, while solar photovoltaic accounts for 19% and wind power for 14%. Green hydrogen accounts for 9% of total generation and biomass for 5%, limiting natural gas to 7% and diesel to 2%. In the RDS scenario, total production is capped at 101 TWh. Hydropower maintains a clear economic and operational dominance (61%–51%), solar reaches 6%, and onshore wind stands at 5%. Natural gas expands its share to 20% and diesel to 5%, reflecting a delay in the transition and greater structural dependence on fossil fuels.
4.4. Economic Performance and Levelized Cost of Electricity (LCOE)
4.4.1. Assessment of the Levelized Cost of Electricity (LCOE) by Technology (2050)
The LCOE analysis for the 2050 horizon confirms the superiority and economic competitiveness of renewable technologies compared to conventional thermal alternatives, in line with the data in Figure 10. In the three simulated scenarios, large-scale solar photovoltaics (19.2–25.5 EUR/MWh) and onshore wind (28.5–30.5 EUR/MWh) have the lowest marginal generation costs. In contrast, pure diesel systems are the least efficient and most expensive option (202.3–238.0 EUR/MWh), Natural gas combined-cycle plants operate in an intermediate range between 130.5 and 142.3 EUR/MWh, while large-scale hydropower continues to face high structural costs (179.0–193.4 EUR/MWh), due to the significant CAPEX associated with large civil infrastructure projects and the length of the national transmission lines.
Diesel-solar hybrid systems demonstrate a robust capacity for cost-effective mitigation, reducing decentralized generation costs to levels between 86.3 and 93.9 EUR/MWh. In addition, green hydrogen has competitive production costs, ranging from 2.4 to 3.0 EUR/kg H₂, establishing itself as a viable vector for energy storage and industrial decarbonization in the Angolan system.
4.4.2. Comparative Analysis of LCOE: Pure Diesel Systems vs. Hybrid Systems
Figure 11 details the temporal evolution of the LCOE for the decentralized Pure Diesel and Hybrid (Diesel–Solar) systems over the period from 2030 to 2050. The Pure Diesel system shows a continuous increase in linear costs, rising from 150 EUR/MWh (2030) to 208 EUR/MWh (2050) in the BS scenario, and peaking at 238 EUR/MWh in the GTS scenario, driven by the volatility and rising prices of fossil fuels, In contrast, the hybrid configuration introduces tariff stability, keeping the LCOE between 70 and less than 95 EUR/MWh. This translates into economic efficiency and cost savings of over 60% compared to the standalone fossil fuel mix in 2050, demonstrating the mitigation of the risk associated with the international fuel market.
4.5. Carbon Intensity Assessment: Operational Emissions vs. Life-Cycle Emissions
Environmental accounting based on carbon intensities reveals severe disparities between thermal power and renewable energy systems when direct operational emissions are compared with the integrated life cycle assessment (LCA) footprint, Figure 12. Diesel-fired generation alone results in the system having the most burdensome indicators, ranging from 0.78 tCO₂e/MWh (operational, EFop) and 0.90 tCO₂e/MWh (LCA, EFLCA), Natural gas CCGTs come in right behind, with emissions ranging from 0.49 to 0.64 tCO₂e/MWh. The introduction of solar hybridization mitigates the environmental impact of diesel, reducing emissions to 0.43 tCO₂e/MWh (operational) and 0.45 tCO₂e/MWh (LCA). 100% renewable technologies eliminate operational emissions, leaving only residual life-cycle footprints associated with manufacturing and construction: solar photovoltaic (0.04 tCO₂e/MWh), hydropower (0.01 tCO₂e/MWh), wind power (0.01 tCO₂e/MWh), and biomass (0.23 tCO₂e/MWh). These indicators demonstrate the climate benefits of hybridization and the central role of renewables in meeting Angola’s decarbonization goals.
4.6. Multivariate Sensitivity Analysis and Systematic Uncertainty Analysis
The sensitivity and uncertainty analysis demonstrates the model’s stability and robustness in the face of extreme fluctuations in the input parameters, as shown in the diagrams in Figure 13. In the total electricity demand vector, yield elasticity (epsilon) is assumed to be the dominant variable, generating deviations in the range of -60% to -31%, followed by variations in GDP (-59% to +19%), while fluctuations in CAPEX are negligible or residual. With regard to the system’s present value, the discount rate (r) is the parameter with the highest sensitivity and financial risk, causing variations ranging from -37.5% to +50.0% and outweighing the influence of elasticity and GDP, while CAPEX has only marginal effects limited to < plus or minus 4.1%. To aggregate CO₂ emissions, uncertainty is driven almost exclusively by the magnitude of final demand, with an additional impact of only approximately 8% associated with the specific emission factor for natural gas. The robustness tests confirm that the trajectories of the Angolan electricity system respond with greater volatility to macroeconomic and demographic factors than to technological parameters.
5. Discussion
5.1. Bridging the Gap Between Official Energy Planning and Electric System Optimization in Angola
The results point to a profound structural transformation of Angola’s electricity system by 2050, which is only partially consistent with the guidelines of the Angola 2025 Long-Term Strategy [81], the Angola Energy Plan 2025 [82], the Angola 2050 Long-Term Strategy [83], and the 2040 Electricity Sector Master Plan [84]. There is a critical mismatch between current official planning and the simulated long-term dynamics.
Electricity demand reaches 283 TWh in the GTS scenario, far exceeding the projections of the Ministry of Energy and Water (MEW), which estimate approximately 65 TWh and 11.2 GW of peak load by 2040 [84]. The Master Plan itself acknowledges significant methodological limitations in its demand data and acknowledges the existence of a weak historical correlation between GDP and electricity consumption [84], which reinforces the need to adopt forward-looking and structural approaches such as the one developed in this model. The results also indicate high demographic pressure (84–86 million inhabitants) and a macroeconomic trajectory aligned with the Angola 2050 Long-Term Strategy [83] and the targets of SDG 7 of the UN 2030 Agenda. The energy mix is evolving from a historically hydro-centric system to a diversified matrix, characterized by strong growth in solar photovoltaics (33%), onshore wind (14%), and green hydrogen (9%) in the GTS scenario. This configuration significantly exceeds the modest targets of the 2040 Master Plan, which limits expansion to levels less than or equal to 100 MW for solar and 652 MW for wind, while completely omitting the role of hydrogen [79,81].
Despite the conceptual alignment with the sustainability goals of the Angola Energy 2025 Plan [82], the current pace of implementation is insufficient to meet long-term security of supply needs. From an economic standpoint, renewable sources offer an unequivocal advantage in terms of LCOE (19 - 30 EUR/MWh) when compared to the costs associated with diesel-powered generators (150 - 238 EUR/MWh) or large-scale hydropower, which is burdened by high CAPEX for grid infrastructure; this reinforces the economic rationale for energy decentralization. In off-grid systems, diesel-solar hybridization reduces generation costs by more than 50%, providing technical validation for PEGC and MEW policies on rural electrification. From an environmental perspective, the transition scenarios significantly reduce the sector’s carbon intensity, in close alignment with Angola’s Nationally Determined Contributions (NDCs) [86]. Conversely, the RDS scenario increases the risk of climate non-compliance due to its persistent reliance on fossil fuels
Finally, the sensitivity analysis confirms the predominance of macroeconomic variables over technological constraints, indicating that the success of Angola’s energy transition depends fundamentally on financial and regulatory stability. It is concluded that only the GTS scenario ensures simultaneous coherence among energy security, socioeconomic development, and deep decarbonization by 2050.
5.2. Analysis of Policy Gaps: Model vs. National Energy Plan
The comparative analysis presented in Table 5 reveals a systematic bias toward underestimation in official planning when compared with the GTS (2050) scenario. There is a discrepancy of more than four times in total demand and a shortfall of more than 23 GW in peak installed capacity, which is inextricably linked to an underestimation of official demographic projections (35 million according to official figures versus the projected 84–86 million). On the technological front, there is a significant underestimation of solar and wind power, as well as a structural lack of pathways for green hydrogen.
This transition involves shifting from a hydro dominated energy mix (> 60%) to a balanced and resilient structure (37 - 51%). From an economic perspective, power generation based strictly on diesel incurs costs up to 10 times higher than those of solar photovoltaics (150 - 238 EUR/MWh versus 19 - 26 EUR/MWh), exhibiting high price volatility.
Decentralized hybrid systems, on the other hand, enable reductions of more than 50% in both operating costs and greenhouse gas emissions. Overall, the results show that Angola’s current energy planning simultaneously underestimates long-term demand, capacity expansion needs, and the depth of the necessary technological transition, thereby compromising the robustness of strategic decisions and alignment with international decarbonization commitments.
6. Conclusions
This paper presented a prospective and structural analysis of Angola’s energy system for the time horizon from 2024 to 2050, evaluating different transition pathways based on dynamic multi-scenario modeling. The results reveal a profound structural shift from the historical pattern observed during the 2010–2024 period, driven by strong demographic pressure—with the population projected to reach between 84 and 86 million—and by a sharp increase in electricity demand. This demand could reach 283 TWh in the Green Transition (GTS) scenario, in stark contrast to the 194 TWh estimated in the Reference Scenario (BS) and the 101 TWh in the Restricted Development Scenario (RDS). Per capita consumption rises significantly to 3,350 kWh/capita in the GTS scenario, underscoring the urgent need for an accelerated expansion of national installed capacity.
The electricity system is gradually evolving toward a more balanced and diversified generation mix. Although large-scale hydropower remains the backbone and structural foundation of the supply (accounting for a share of 37% to 51%, depending on the scenario), there is strong penetration of unconventional renewable sources. Large-scale solar photovoltaics account for up to 33% of total installed capacity, while onshore wind and green hydrogen account for up to 14% and 9% of total generation, respectively, drastically reducing the country’s structural dependence on fossil fuels.
From an economic perspective, renewable technologies demonstrate a clear competitive advantage in terms of lower-cost planning, with an optimized LCOE ranging from 19.2 to 30.5 EUR/MWh. These indicators contrast with the high generation costs associated with the expansion of regulated hydropower infrastructure (179.0-193.4 EUR/MWh) and, most importantly, with the volatile costs of pure diesel generation (271.4-307.1 EUR/MWh), confirming the direct economic benefit of decarbonizing the national grid. In the field of decentralized and rural electrification, diesel-solar hybrid systems are emerging as a highly mature solution, reducing generation costs to levels ranging from 86.3 to 121.5 EUR/MWh, representing savings of more than 50%. At the same time, they reduce the subsector’s carbon intensity from 0.78 - 0.90 tCO₂e/MWh to just 0.43 tCO₂e/MWh, validating the decentralized regulatory strategies coordinated by PEGC and MEW.
Finally, the sensitivity and systemic uncertainty analysis strongly indicates that macroeconomic variables—namely revenue elasticity, GDP growth, and the discount rate — exert greater statistical dominance than the technological parameters of CAPEX and OPEX, demonstrating that the viability of Angola’s energy transition is intrinsically dependent on factors of institutional, exchange rate, and macrofinancial stability. In summary, it is concluded that decentralized solar hybridization and the large-scale expansion of interconnected renewable energy parks constitute technically viable and economically imperative solutions to safeguard security of supply, ensure climate sustainability, and enable sustained cost reductions in Angola’s electricity system through 2050.
Author Contributions
Conceptualization, Afonso António, José Pombo and Rosário Calado; methodology, Afonso António; software, Afonso António and José Pombo; validation, José Pombo, Sílvio Mariano and Rosário Calado; formal analysis, Afonso António; research, Afonso António, José Pombo, Sílvio Mariano and Rosário Calado; data curation, Afonso António; writing—preparation of the original draft, Afonso António; writing—review and editing, José Pombo and Rosário Calado; visualization, Sílvio Mariano; supervision, Rosário Calado. All authors have read and approved the published version of the manuscript.
Funding
This work was supported by the FCT—Foundation for Science and Technology, I.P.—through the project reference and DOI identifier: https://doi.org/10.54499/PALOP/BD/155054/2024.
Data Availability Statement
The data supporting the conclusions of this study are available from the corresponding author upon justified request. Historical data on the electrical system were obtained from official reports and publicly accessible international databases, as cited in the manuscript.
Conflicts of interest
The authors declare that they have no conflicts of interest.
Abbreviations
The following abbreviations are used in this manuscript:
| CAPEX | Capital Expenditure | |
| CO2 | Carbon dioxide | |
| CCGT | Combined Cycle Gas Turbine | |
| EF | Emission factor | |
| EF CCGT | Emission factor of Combined Cycle Gas Turbine | |
| EUR/MWh | Euros per Megawatt-hour | |
| gCO₂/kWh | grams of carbon dioxide per kilowatt-hour | |
| LCOE | Levelized Cost of Energy | |
| LCOH | Levelized Cost of Hydrogen | |
| LEAP | Low-Emissions Analysis Platform | |
| MEW | Ministry of Energy and Water | |
| IMACLIM-R | Climate Images - Regions | |
| NDC | Nationally Determined Contribution | |
| USD | Union State dollar | |
| UN | United Nations | |
| GDP | Gross Domestic Product | |
| PEGC | Public Electricity Generation Company | |
| PV | Photovoltaic | |
| r | Discount rate | |
| SADC | Southern African Development Community | |
| SDG | Sustainable Development Goal | |
| ε | Elasticity of Demand | |
References
- André Filemono, S. M.; Tembo, André; Cabenda, Manuel; Barros, A. A. C. Life Cycle Assessment of Electricity Generation Systems in Angola. Int. J. Energy Econ. Policy 2025, vol. 15(no. 5), 3–15. [Google Scholar] [CrossRef]
- Lemba; Ferreira Dias, M.; Robaina, M. Electric energy planning in Namibe, Angola: Inserting renewable energies in search of a sustainable energy mix. J. Energy South. Afr. 2021, vol. 32(no. 4), 69–83. [Google Scholar] [CrossRef]
- Tsangas, M.; Papamichael, I.; Zorpas, A. A. Sustainable Energy Planning in a New Situation. Energies 2023, vol. 16(no. 4). [Google Scholar] [CrossRef]
- Chipangamate, N. S.; Nwaila, G. T. Assessment of challenges and strategies for driving energy transitions in emerging markets: A socio-technological systems perspective. Energy Geosci. 2024, vol. 5(no. 2), 100257. [Google Scholar] [CrossRef]
- Vanegas Cantarero, M. M. Of renewable energy, energy democracy, and sustainable development: A roadmap to accelerate the energy transition in developing countries. Energy Res. Soc. Sci. 2019, vol. 70, 101716. [Google Scholar] [CrossRef]
- Oree, V.; Sayed Hassen, S. Z.; Fleming, P. J. Generation expansion planning optimisation with renewable energy integration: A review. Renew. Sustain. Energy Rev. 2016, vol. 69, 790–803. [Google Scholar] [CrossRef]
- Koltsaklis, N. E.; Dagoumas, A. S. State-of-the-art generation expansion planning: A review. Appl. Energy 2018, vol. 230, no. September, 563–589. [Google Scholar] [CrossRef]
- Gacitua, L.; et al. A comprehensive review on expansion planning: Models and tools for energy policy analysis. Renew. Sustain. Energy Rev. 2018, vol. 98, no. September, 346–360. [Google Scholar] [CrossRef]
- F. F, P. A, H. L, G. D, and D. N, A long-term capacity investment and operational energy planning model with power-to-X and flexibility technologies. Renew. Sustain. Energy Rev. 2022, vol. 167. [CrossRef]
- Sun, X.; Bao, M.; Guo, C.; Ding, Y.; Zheng, C.; Gao, X. An equilibrium capacity expansion model for power systems considering Gencos’ coupled decisions between carbon and electricity markets. Appl. Energy 2024, vol. 359, no. February, 122386. [Google Scholar] [CrossRef]
- Mohseni, S.; Brent, A. C. Long-term planning optimisation of sustainable energy systems: A systematic review and meta-analysis of trends, drivers, barriers, and prospects. Energy Strateg. Rev. 2025, vol. 57, no. January. [Google Scholar] [CrossRef]
- Nicoli, M.; Faria, V. A. D.; de Queiroz, A. R.; Savoldi, L. Modeling energy storage in long-term capacity expansion energy planning: an analysis of the Italian system. J. Energy Storage 2024, vol. 101, no. PA, 113814. [Google Scholar] [CrossRef]
- Gebremeskel, D. H.; Ahlgren, E. O.; Beyene, G. B. Long-term electricity supply modelling in the context of developing countries: The OSeMOSYS-LEAP soft-linking approach for Ethiopia. Energy Strateg. Rev. 2023, vol. 45, 101045. [Google Scholar] [CrossRef]
- Fields, N.; et al. Long-Term Forecasting: A MAED Application for Sierra Leone’s Electricity Demand (2023–2050). Energies 2024, vol. 17(no. 12), 1–17. [Google Scholar] [CrossRef]
- Mir, A.; Alghassab, M.; Ullah, K.; Khan, Z. A.; Lu, Y.; Imran, M. A review of electricity demand forecasting in low and middle income countries: The demand determinants and horizons. Sustain. 2020, vol. 12(no. 15). [Google Scholar] [CrossRef]
- Sackey, Van-Hein; Levin, T.; Nock, D. Latent demand for electricity in sub-Saharan Africa: a review. Environ. Res. Infrastruct. Sustain. 2022, vol. 2(no. 2). [Google Scholar] [CrossRef]
- Ouedraogo, N. S. Modeling sustainable long-term electricity supply-demand in Africa. Appl. Energy 2017, vol. 190, 1047–1067. [Google Scholar] [CrossRef]
- Chaima, E.; et al. Long-term electricity demand scenarios for Malawi’s electric power system. Energy Sustain. Dev. 2022, vol. 73, 23–38. [Google Scholar] [CrossRef]
- Kanté, M.; Li, Y.; Deng, S. Scenarios analysis on electric power planning based on multi-scale forecast: A case study of Taoussa, Mali from 2020 to 2035. Energies 2021, vol. 14(no. 24). [Google Scholar] [CrossRef]
- Arnob, S. S.; Arefin, A. I. M. S.; Saber, A. Y.; Mamun, K. A. Energy Demand Forecasting and Optimizing Electric Systems for Developing Countries. IEEE Access 2023, vol. 11, no. February, 39751–39775. [Google Scholar] [CrossRef]
- Ali, A. ; Yousif, M.; Numan, M.; Ali Abbas Kazmi, S. Coordinated Generation and Transmission Expansion Planning With Energy Storage Systems to Facilitate High Penetration of Renewable Energy. IEEE Access 2025, vol. 13, no. September, 176801–176812. [Google Scholar] [CrossRef]
- Ghanbarzadeh, T.; Habibi, D.; Aziz, A. Generation Expansion Planning in Isolated Power Systems: A Robust Approach With Dunkelflaute Assessment. IEEE Access 2024, vol. 12, no. November, 165831–165844. [Google Scholar] [CrossRef]
- de Angola, M. de E. e Á. Atlas e estratégia Nacional para as novas energias renováveis. Ministério Da Energ. E Águas 2015, vol. 1, 242. Available online: http://www.angolaenergia2025.com/sites/default/files/editor/atlas_e_estrategia_nacional_para_as_novas_energias_renovaveis.pdf.
- Ministerio do Planeamento da República de Angola. “Angola Visão 2050,” Angola. 2023. Available online: https://mep.gov.ao/bo/api/getDoc/9eb287d088e1e6b3fe0c79122ceb5b92.pdf.
- Ceita, C. “Projeção da População 2014 -2050,” Angola; 2016. [Google Scholar]
- ASAER, Renewable Energy in Angola-National Status Report, vol. I, no. July. 2022. Available online: https://asaer.co.ao/v3/wp-content/uploads/2025/05/ALER-Relatorio-Angola_versao-final_2-de-Julho.pdf.
- C. Economy, “Angola - Electricity generation 2024 | countryeconomy.com.”. Available online: https://countryeconomy.com/energy-and-environment/electricity-generation/angola (accessed on 15 March 2026).
- C. Economy, “Angola GDP - Gross Domestic Product 2024 | countryeconomy.com.”. Available online: https://countryeconomy.com/gdp/angola (accessed on 15 March 2026).
- D. de E. D. e Sociais, “INE-Instituto Nacional De Estatísticas de Angola.” Accessed: Mar. 14, 2026. [Online]. Available: https://www.ine.gov.ao/Diretorios/Ver?caminho=CfDJ8NMpZBryiqVPuGc0gO8mewQrZ1kEP3MLe_pyUSqCv7tQgDrrAyRHMXq9vX3dTFmhT4Va4g2z-uTTMnWZRq54NDOoJP2ZmE7I4wKf1hYsNSKNz-2hUVw_HreTE3QQ3sII2LLauzhSo-nVTRMWNK0Q-rlCvU5JvC3jTTydZVHGBOVM.
- de P., E. P. Eletricidade, Relatorio de atividades referente ao exercicio economico 2023_PRODEL-EP.pdf. 2023. [Google Scholar] [PubMed]
- PRODEL, E. P.; PRODEL, E.P. - Relatório de Gestão e Contas 2024; 2024. [Google Scholar]
- Gielen, D. Renewable Energy Technologies: Cost Analysis Series. 2012. [Google Scholar] [CrossRef]
- Snyder, S. Energy Systems. Clin. Nutr. Athl. Train. 2024, 41–48. [Google Scholar] [CrossRef]
- Guidi, G.; Violante, A. C.; De Iuliis, S. Environmental Impact of Electricity Generation Technologies: A Comparison between Conventional, Nuclear, and Renewable Technologies. Energies 2023, vol. 16(no. 23). [Google Scholar] [CrossRef]
- Ise, F. Levelized Cost of Electricity Renewable Energy Technologies LEVELIZED COST OF ELECTRICITY RENEWABLE ENERGY TECHNOLOGIES. 2024. [Google Scholar] [CrossRef]
- Bolson, N.; Prieto, P.; Patzek, T. Capacity factors for electrical power generation from renewable and nonrenewable sources. Proc. Natl. Acad. Sci. U. S. A. 2022, vol. 119(no. 52), 1–6. [Google Scholar] [CrossRef] [PubMed]
- Daily, F. Lazard’s Levelized Cost of Energy Analysis—Version 18.0. 2025. [Google Scholar] [PubMed]
- Wang, X.; Guo, L.; Xue, G.; Tan, J.; Niu, W.; Wu, Y. Toward Low-Carbon Power Systems: Reviewing Life Cycle Carbon Footprints of Diverse Generation Pathways. Energies 2025, vol. 18(no. 24). [Google Scholar] [CrossRef]
- Warner, E. S.; Heath, G. A. Life Cycle Greenhouse Gas Emissions of Systematic Review and Harmonization. 2012, vol. 16, 73–92. [Google Scholar] [CrossRef]
- C. by the E. Union, Levelised Cost of Hydrogen (LCOH) Calculator Manual. 2024, 2025. [PubMed]
- Park, J.; et al. Green hydrogen to tackle the power curtailment: Meteorological data-based capacity factor and techno-economic analysis. Appl. Energy 2023, vol. 340, no. February, 121016. [Google Scholar] [CrossRef]
- Bourne, S. The future of fuel: The future of hydrogen. Fuel Cells Bull. 2012, vol. 2012(no. 1), 12–15. [Google Scholar] [CrossRef]
- Bhandari, R.; Trudewind, C. A.; Zapp, P. Life cycle assessment of hydrogen production via electrolysis e a review. J. Clean. Prod. 2014, vol. 85, 151–163. [Google Scholar] [CrossRef]
- Wang, Z.; Li, Y.; Zheng, J.; Tan, H.; Zhang, L.; Xu, C. Multi-objective capacity optimization of a wind-solar-hydrogen-gas turbine hybrid system: Balancing economics, power stability, and carbon emissions. Int. J. Hydrogen Energy 2026, vol. 200, 152928. [Google Scholar] [CrossRef]
- Chernova, E. A. Stationary combustion. J. Appl. Mech. Tech. Phys. 1966, vol. 7(no. 6), 69–70. [Google Scholar] [CrossRef]
- Commission, E. Technical Assisteance Facility - Sustainabçle Energy for All - Western and Central Africa. 2016; no. February, pp. 1–14. [Google Scholar]
- IPCC, IPCC Guidelines for National Greenhouse Gas Inventories. 2006.
- U. S. E. I. Administration. Capital Cost and Performance Characteristics for Utility-Scale Electric Power Generating Technologies. no. January, 2024.
- Mohseni, S.; Brent, A. C.; Burmester, D. A reliability-oriented cost optimisation method for capacity planning of a multi-carrier micro-grid: A case study of stewart Island, New Zealand. arXiv 2019, 25–27. [Google Scholar]
- Grimaldo-guerrero, J.; Rivera-alvarado, J.; Díaz-pérez, S.; Mosquera-molina, C.; Lerma-ahumada, D.; Grimaldo-guerrero, J. Analysis of a Log-Linear Model for Forecasting Electricity Demand Based on Economic Growth in Colombia. 2025, vol. 15(no. 6), 680–684. [Google Scholar] [CrossRef]
- Adeoye, C. S. Modelling and forecasting hourly electricity demand in West African countries Omotola Adeoye 1, Catalina Spataru; UCL Energy Institute, University College London: United Kingdom., 2019; pp. 14–15. [Google Scholar]
- Chicco, D.; Warrens, M. J.; Jurman, G. The coef fi cient of determination R-squared is more informative than SMAPE, MAE, MAPE, MSE and RMSE in regression analysis evaluation; 2021; pp. 1–24. [Google Scholar] [CrossRef] [PubMed]
- Kitessa, B. D.; Ayalew, S. M.; Gebrie, G. S.; Teferi, S. T. Regression Model for Predicting Water and Energy Demand: A Case Study of Addis Ababa City in 2050. Lect. Notes Inst. Comput. Sci. Soc. Telecommun. Eng. LNICST 2021, vol. 385, 48–68. [Google Scholar] [CrossRef]
- Amini; Voosoghi, B.; Khalili, M. A.; Di Martire, D.; Roohi, S.; Pirooznia, M. Generalized Logistic Function : A Retracker to Improve the Accuracy of Water Level Time Series in Coastal Areas and Lakes. 2025. [Google Scholar] [CrossRef]
- Liddle; Parker, S.; Hasanov, F. Why has the OECD long-run GDP elasticity of economy-wide electricity demand declined ? Because the electrification of energy services has saturated. Energy Econ. 2022, vol. 125, 106832. [Google Scholar] [CrossRef]
- Khalifa; Caporin, M.; Di Fonzo, T. Scenario-based forecast for the electricity demand in Qatar and the role of energy efficiency improvements. Energy Policy 2018, vol. 127, 155–164. [Google Scholar] [CrossRef]
- M. , C.; Nakicenovic, N. THE DYNAMICS OF ENERGY SYSTEMS AND THE LOGISTIC SUBSTITUTION MODEL; 1979. [Google Scholar]
- George, F.; Thalmann, P.; Vielle, M. Input factor substitution under climate-neutral pathways. Appl. Energy 2025, vol. 399, no. August, 126505. [Google Scholar] [CrossRef]
- Akaev, A.; Davydova, O. I. The Paris Agreement on Climate Is Coming into Force : Will the Great Energy Transition Take Place ? 2020, vol. 90(no. 5), 588–599. [Google Scholar] [CrossRef]
- Khatri, S. A.; Harijan, K.; Uqaili, M. A.; Shah, S. F.; Mirjat, N. H.; Kumar, L. A Logistic Modelling Analysis for Wind Energy Potential Assessment and Forecasting its Diffusion in Pakistan. Front. Energy Res. 2022, vol. 10, no. May, 1–15. [Google Scholar] [CrossRef]
- Ferioli, F.; Schoots, K.; Van Der Zwaan, B. C. C. Use and limitations of learning curves for energy technology policy : A component-learning hypothesis. 2009, vol. 37, 2525–2535. [Google Scholar] [CrossRef]
- Thibault. Capturing physical, technical and economic constraints on electricity generation: a description of the IMACLIM-R electricity module. 2023. [Google Scholar] [PubMed]
- Sens, L.; Neuling, U.; Kaltschmitt, M. Capital expenditure and levelized cost of electricity of photovoltaic plants and wind turbines e Development by 2050. Renew. Energy 2022, vol. 185, 525–537. [Google Scholar] [CrossRef]
- Bolinger, M.; Wiser, R.; Shaughnessy, O. Levelized cost-based learning analysis of utility- scale wind and solar in the United States. ISCIENCE 2022, vol. 25(no. 6), 104378. [Google Scholar] [CrossRef] [PubMed]
- Rubert, T.; Road, G.; Ab, A.; Carlo, M. Levelised cost of energy – A theoretical justification and critical assessment. Energy Policy 2018, vol. 124, 169–179. [Google Scholar] [CrossRef]
- Timilsina, G. R. Demystifying the Costs of Electricity Generation Technologies. no. June, 2020. [PubMed]
- K. B. Blechinger, P. Energy Supply in Mini-Grids Regarding Renewable Energies: An Optimization for Petite Martinique P. Blechinger 2012, 1(2), 1–8. [Google Scholar]
- Short, T. H. Walter; Packey, Daniel J. A Manuel for the Economic Evaluation of Energy Efficiency and Renewable Energy Technologies. 1995. [Google Scholar] [CrossRef] [PubMed]
- Duffie, J. A.; Beckman, W. A. Sol. Engineeering Therm. Process. Sol. Eng. 2013. [CrossRef] [PubMed]
- Kaabeche; Ibtiouen, R. Techno-economic optimization of hybrid photovoltaic / wind / diesel / battery generation in a stand-alone power system. Sol. Energy 2014, vol. 103, 171–182. [Google Scholar] [CrossRef]
- Curcio, E. “Hydrogen Production Costs: Analyzing LCOH, LCOE, and Market Implications,” pp. 1–12. [CrossRef]
- Oyewo, S.; Lopez, G.; Elsayed, M.; Galimova, T.; Breyer, C. Power-to-X Economy: Green e-hydrogen, e-fuels, e-chemicals, and e-materials opportunities in Africa. Energy Rep. 2026, vol. 12, 2026–2048. [Google Scholar] [CrossRef]
- Fernandes, L.; Machado, F.; Marcon, L. Unified Case Study Analysis of Techno-Economic Tools to Study the Viability of Off-Grid Hydrogen Production Plants; 2025; pp. 1–25. [Google Scholar]
- Bertolini, M.; Duttilo, P.; Lisi, F. Accounting carbon emissions from electricity generation : A review and comparison of emission factor-based methods. Appl. Energy 2025, vol. 392, no. April, 125992. [Google Scholar] [CrossRef]
- Narayan, P. K.; Smyth, R. Electricity consumption, employment and real income in Australia evidence from multivariate Granger causality tests. Energy Policy 2005, vol. 33(no. 9), 1109–1116. [Google Scholar] [CrossRef]
- Zeyen, M. Victoria; Brown, T. Endogenous learning for green hydrogen in a sector-coupled energy model for Europe. Nat. Commun. 2023, vol. 14(no. 1), 1–11. [Google Scholar] [CrossRef] [PubMed]
- Kerr, P.; Noble, D. R.; Hodges, J. Implementing Radical Innovation in Renewable Energy Experience Curves; 2021; pp. 1–28. [Google Scholar]
- Revinova, S.; Lazanyuk, I.; Ratner, S.; Gomonov, K. Forecasting Development of Green Hydrogen Production Technologies Using Component-Based Learning Curves. Energies 2023, vol. 16(no. 11). [Google Scholar] [CrossRef]
- Rezaei, S.; Alsamri, K.; Simeoni, E.; Huynh, J.; Brouwer, J. Techno-economic and environmental analysis of clean hydrogen deployment : A case study of Los Angeles International Airport. Energy Convers. Manag. 2025, vol. 340, 119946. [Google Scholar] [CrossRef]
- Bolinger, M.; Wiser, R.; Shaughnessy, O. iScience ll scale wind and solar in the United States. ISCIENCE 2022, vol. 25(no. 6), 104378. [Google Scholar] [CrossRef] [PubMed]
- do P., M. Republica de Angola, Estratégia de Desenvolvimento a Longo Prazo para Angola (2025). 2025. [Google Scholar] [PubMed]
- República de Angola, “Angola Power Sector Long Term Vision,”. 2018. Available online: http://www.angolaenergia2025.com/pt-pt/conteudo/geracao-0.
- República de Angola. Estratégia de Longo Prazo Angola 2050 (ELP 2050); Ministério da Econ. e Planeam: Luanda, Angola, 2023. [Google Scholar]
- Agency, J. I. C. “The Project for Power Development Master Plan in the Republic of Angola Final Report December 2018,”. 2018. [Google Scholar]
- L. Tokyo Electric Power Services Co., Plano Director de Desenvolvimento do Sector Electrico na República de Angola. 2018. [PubMed]
- Republic of Angola. Nationally Determined Contribution of Angola. 2021.
Figure 1.
Solar resource assessment in Angola: (a) global horizontal irradiation (GHI); (b) photovoltaic power potential. Source: Adapted from the World Bank Group–ESMAP Global Solar Atla [23].
Figure 1.
Solar resource assessment in Angola: (a) global horizontal irradiation (GHI); (b) photovoltaic power potential. Source: Adapted from the World Bank Group–ESMAP Global Solar Atla [23].
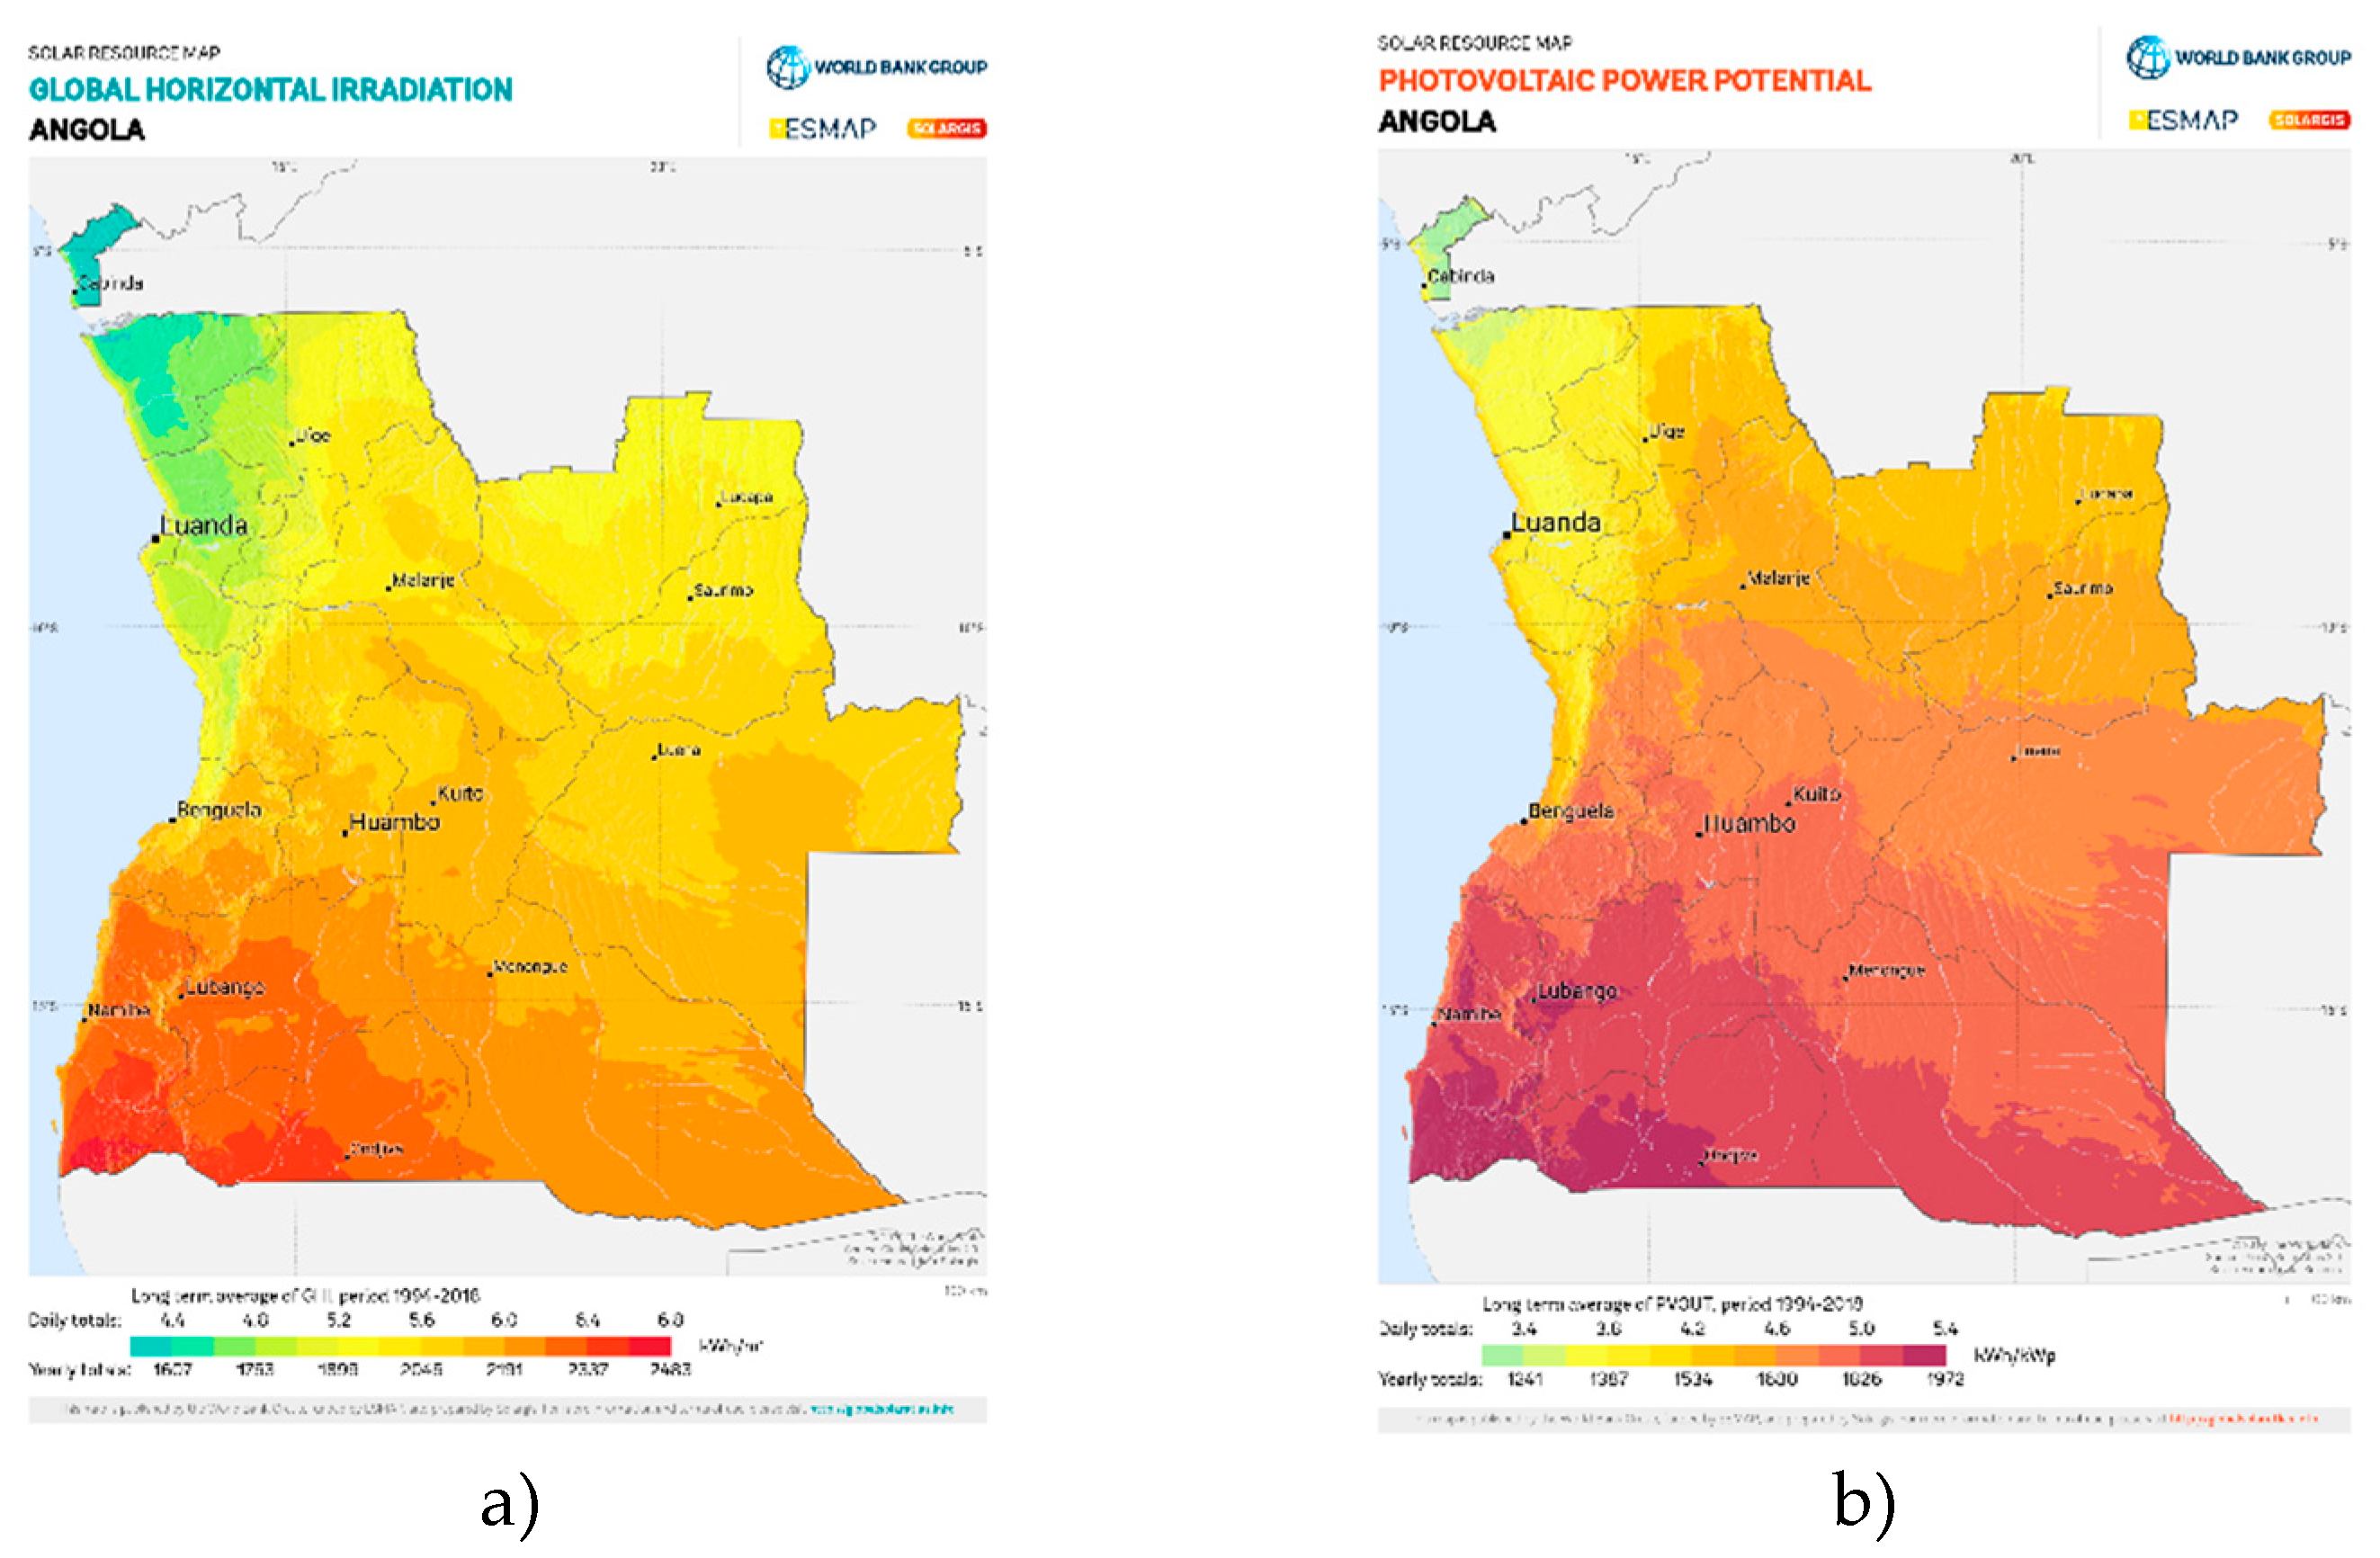
Figure 2.
Spatial distribution of hydropower potential and mean annual hydropower density in Angola. Source: Adapted from the Renewable Energy Atlas of Angola [25].
Figure 2.
Spatial distribution of hydropower potential and mean annual hydropower density in Angola. Source: Adapted from the Renewable Energy Atlas of Angola [25].
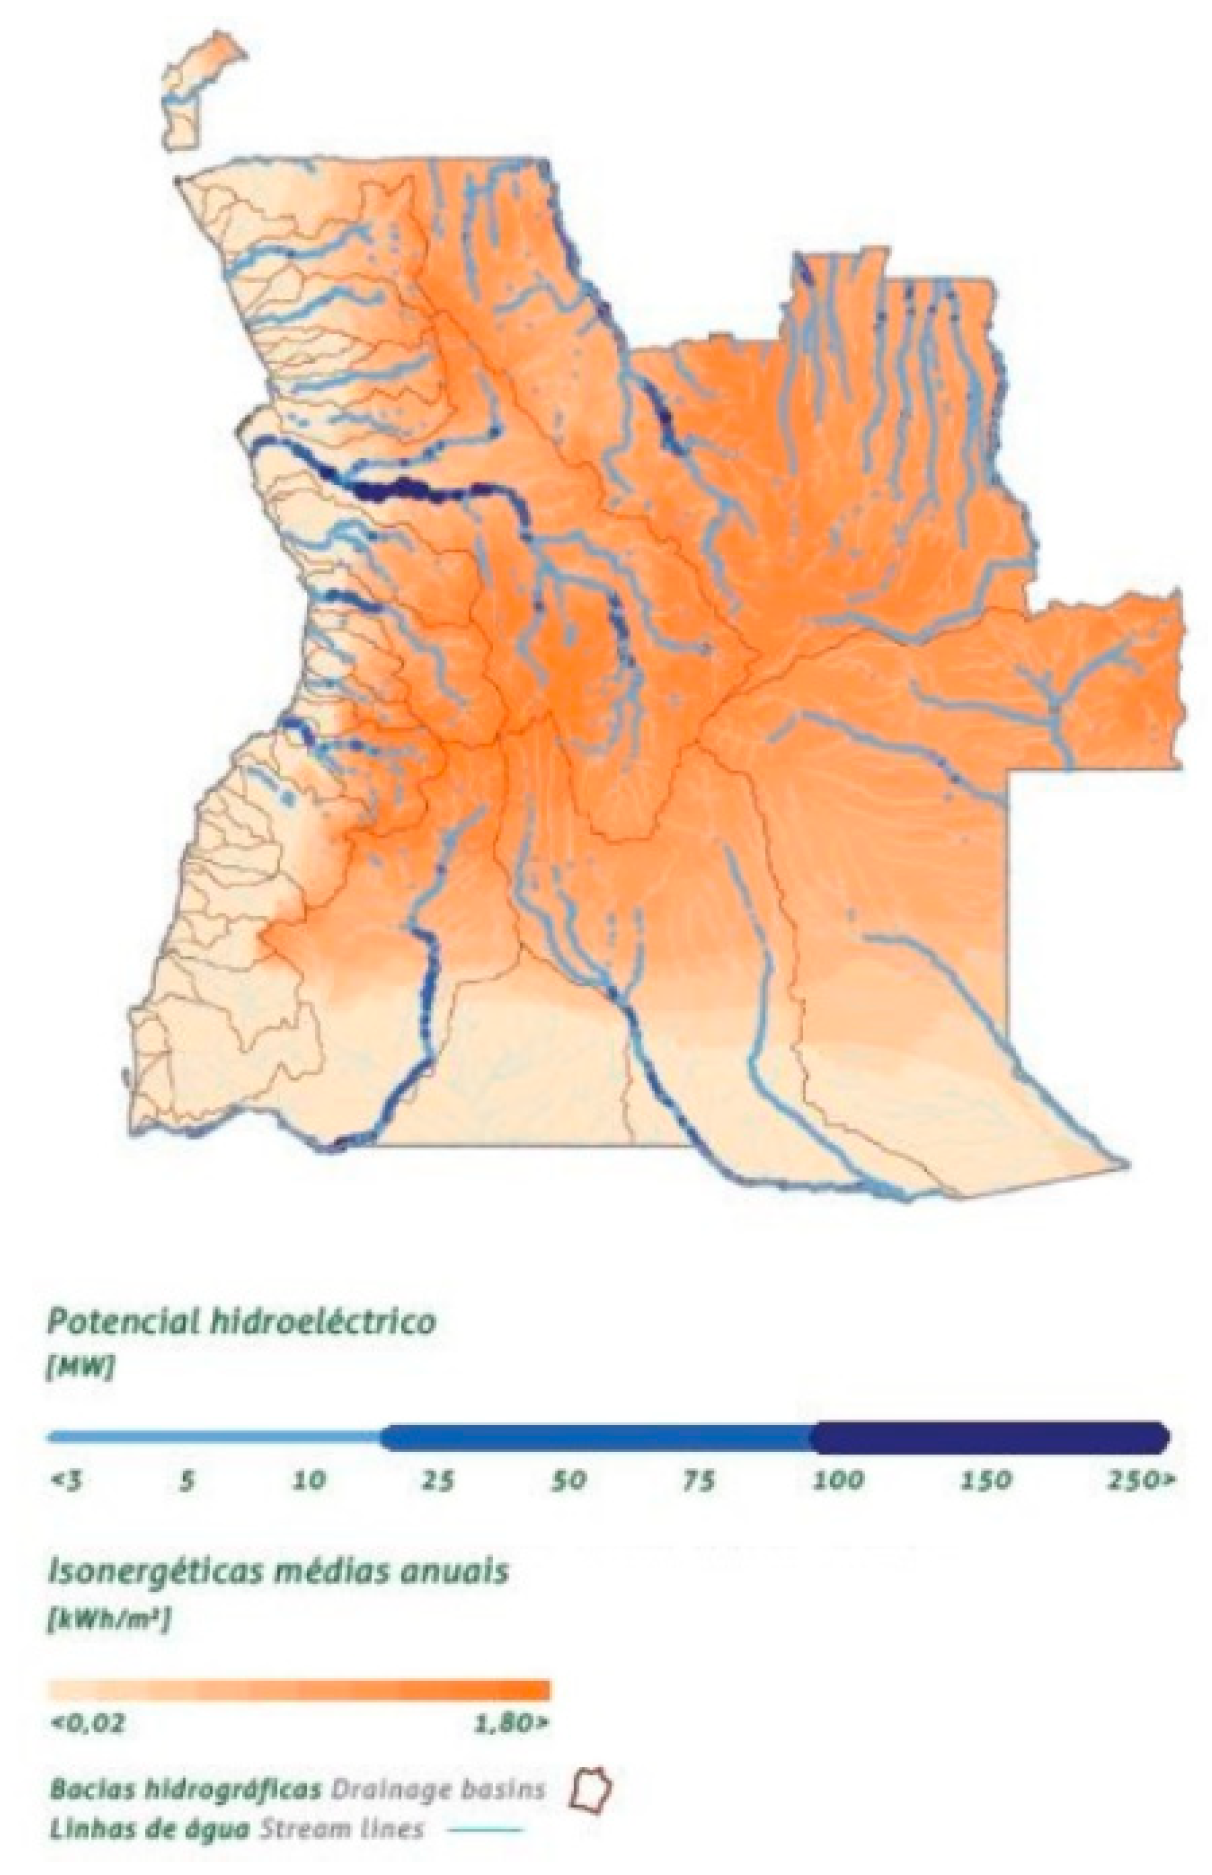
Figure 3.
Spatial distribution of land cover in Angola, showing the main vegetation and land-use classes relevant to biomass resource assessment. Source: Adapted from [26].
Figure 3.
Spatial distribution of land cover in Angola, showing the main vegetation and land-use classes relevant to biomass resource assessment. Source: Adapted from [26].
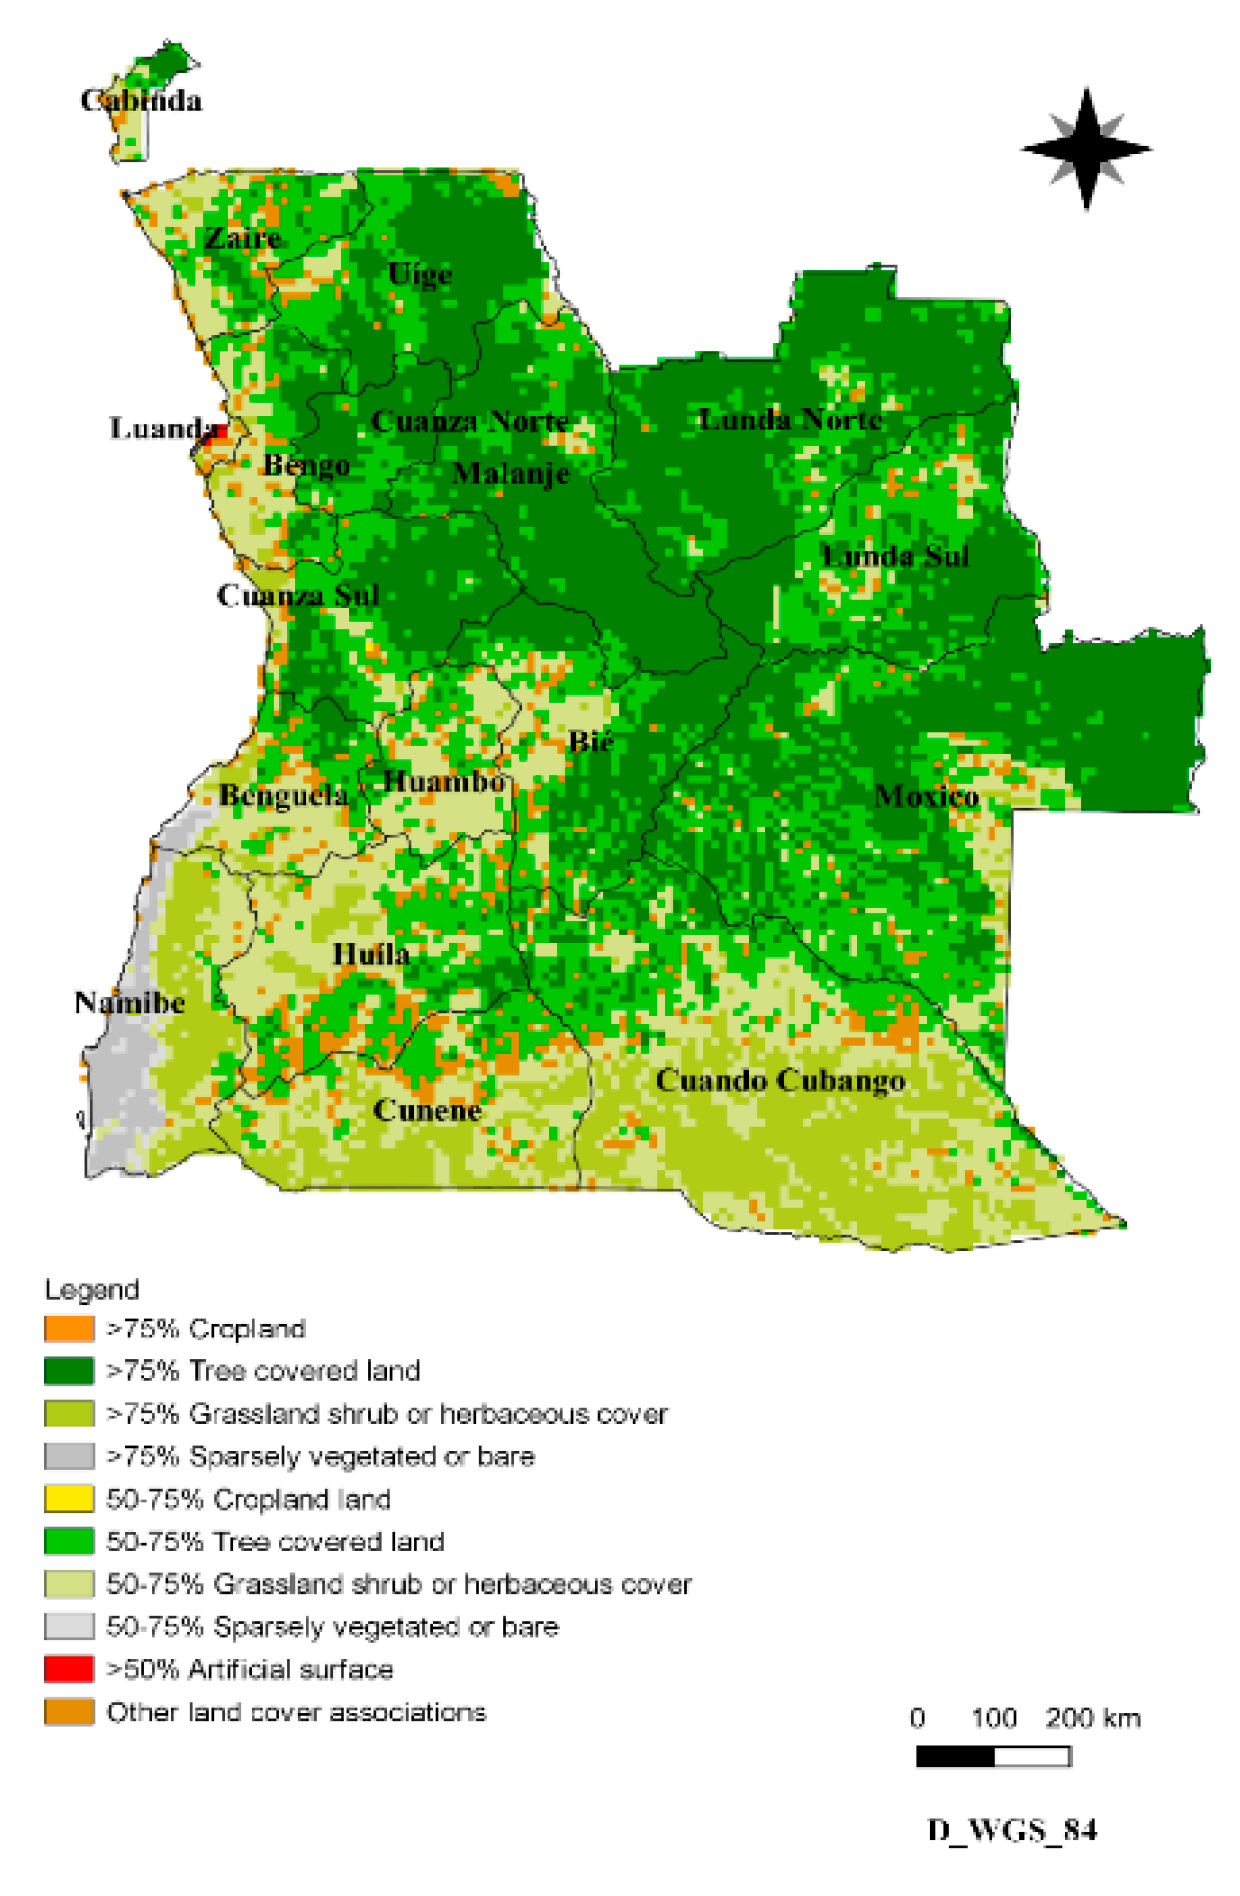
Figure 4.
Spatial distribution of the annual average wind speed at 80 m above ground level in Angola. Source: Adapted from the National Renewable Energy Laboratory (NREL) Wind Resource Map [27].
Figure 4.
Spatial distribution of the annual average wind speed at 80 m above ground level in Angola. Source: Adapted from the National Renewable Energy Laboratory (NREL) Wind Resource Map [27].
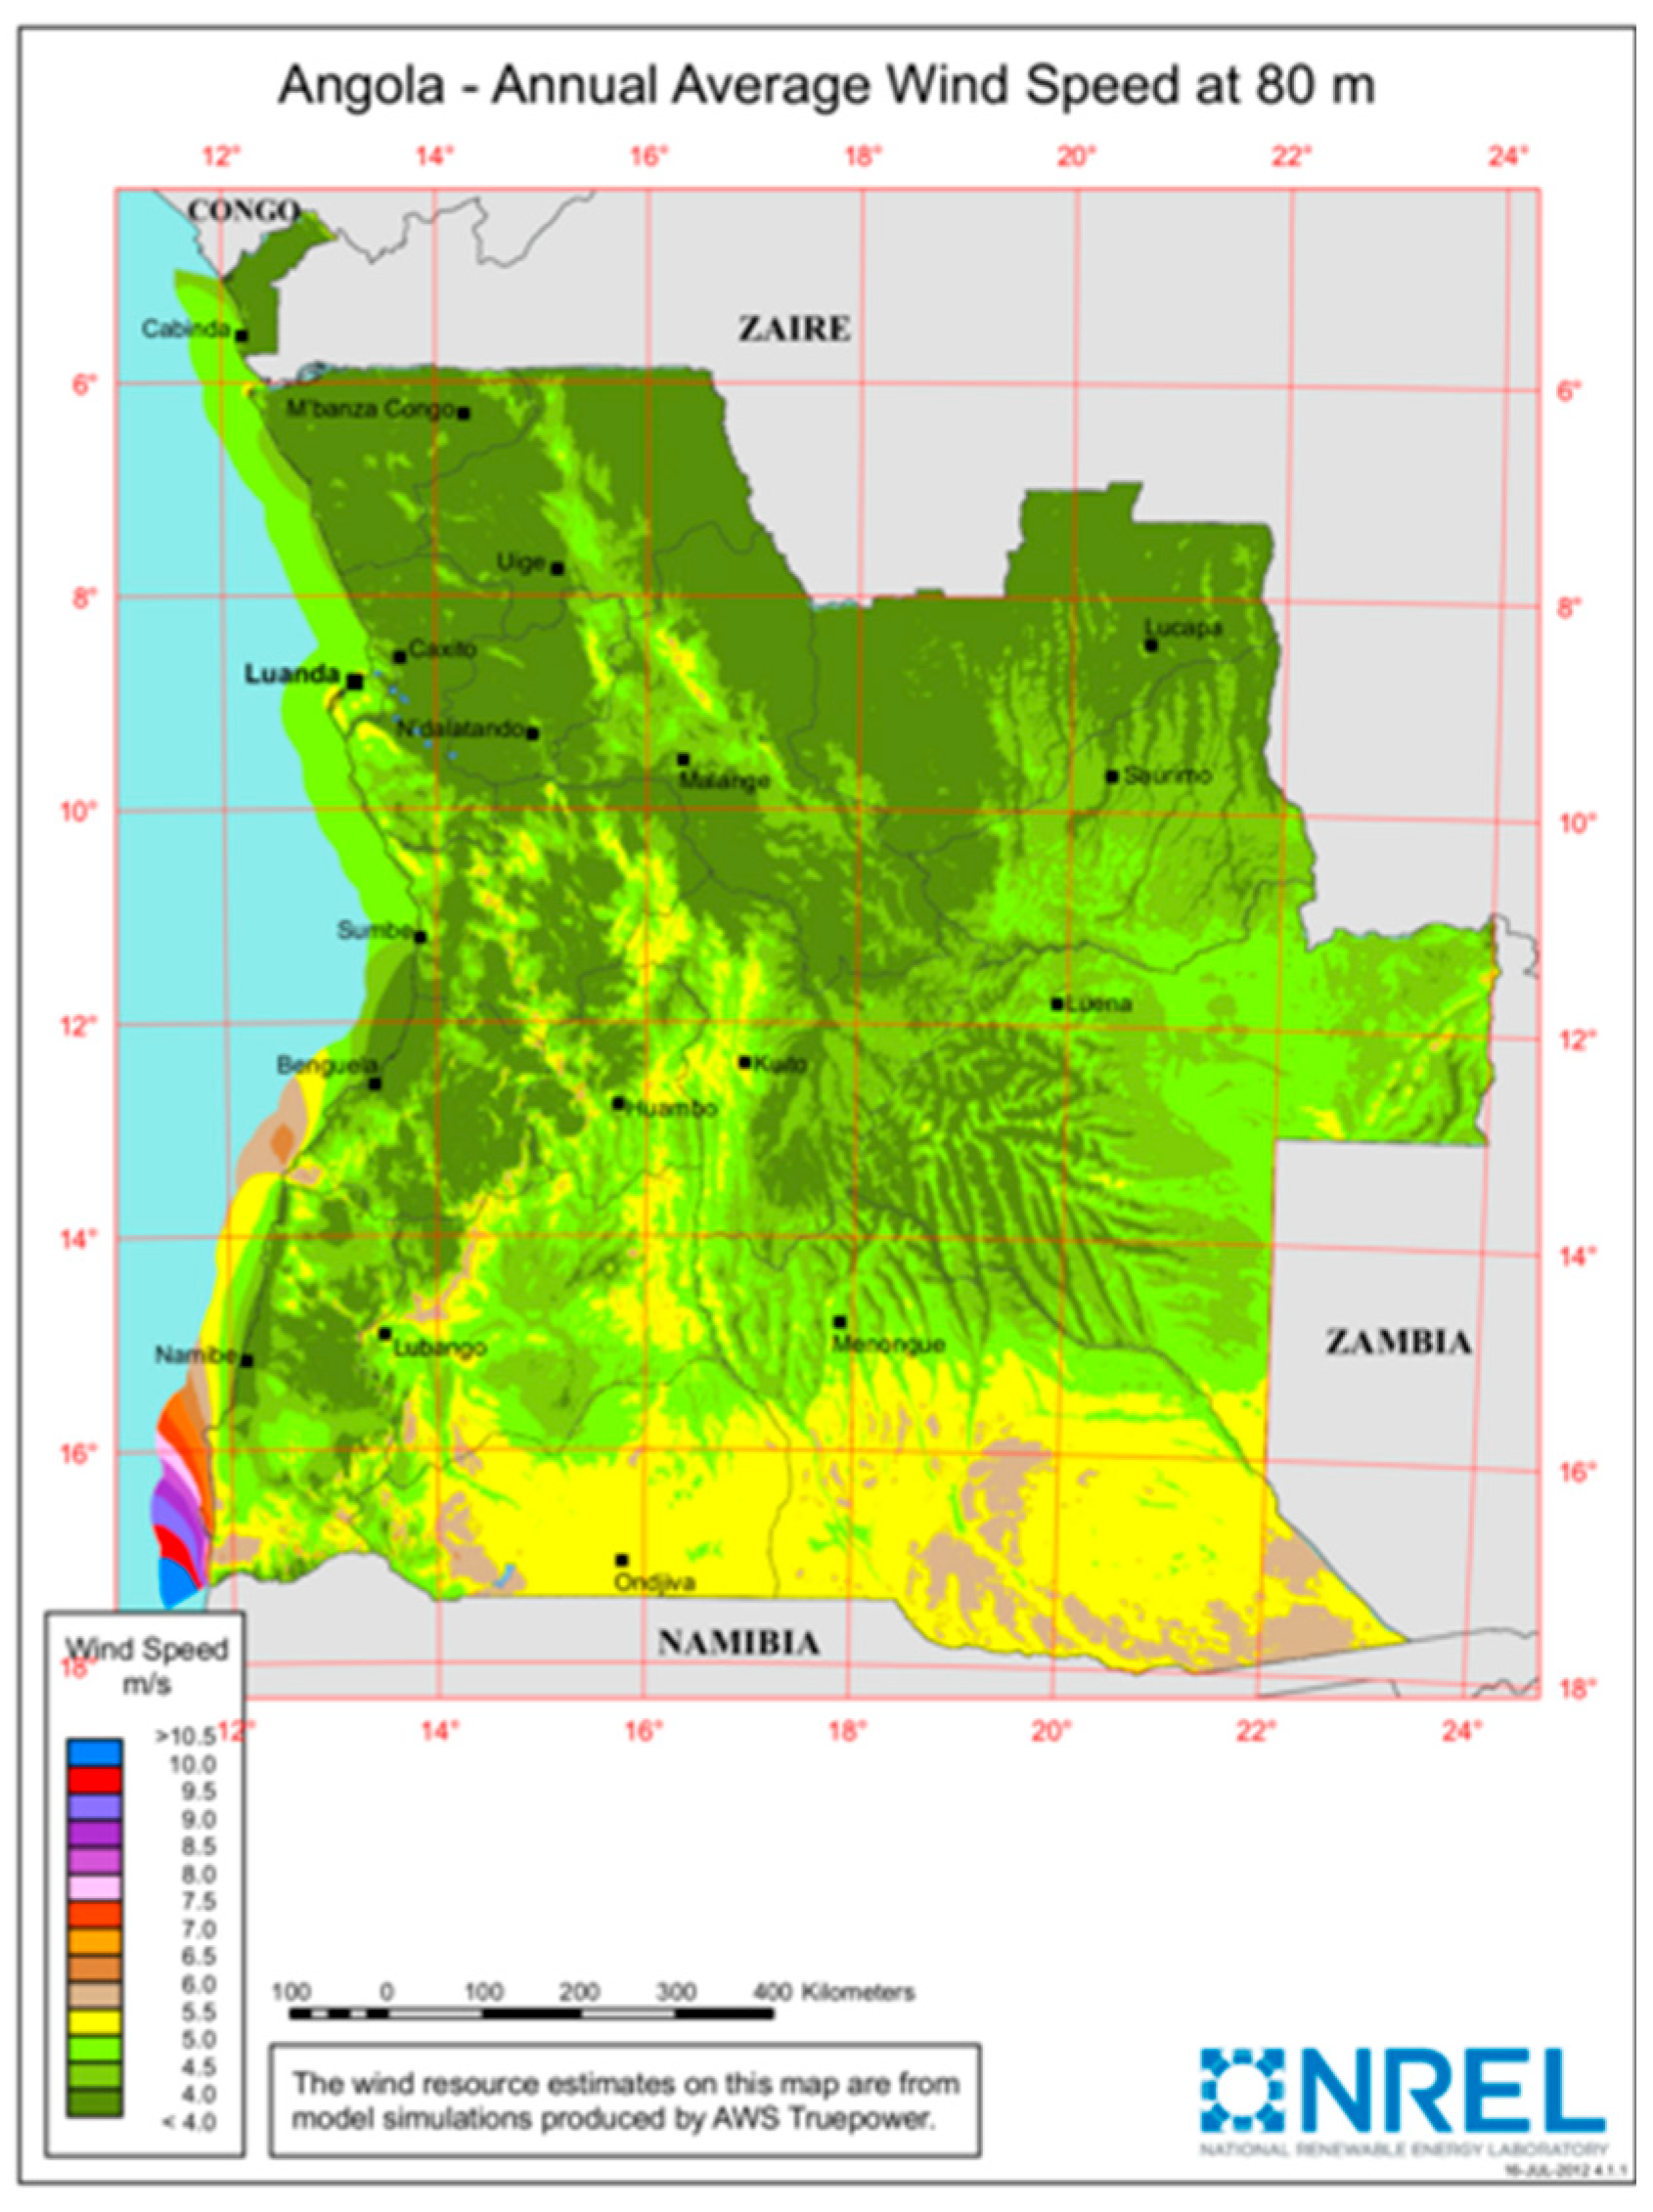
Figure 9.
Trends in Angola’s electricity generation mix (2030–2050) under the following scenarios: a) BS; b) GTS; c) RDS, showing the specific contributions of each technology to total electricity supply.
Figure 9.
Trends in Angola’s electricity generation mix (2030–2050) under the following scenarios: a) BS; b) GTS; c) RDS, showing the specific contributions of each technology to total electricity supply.
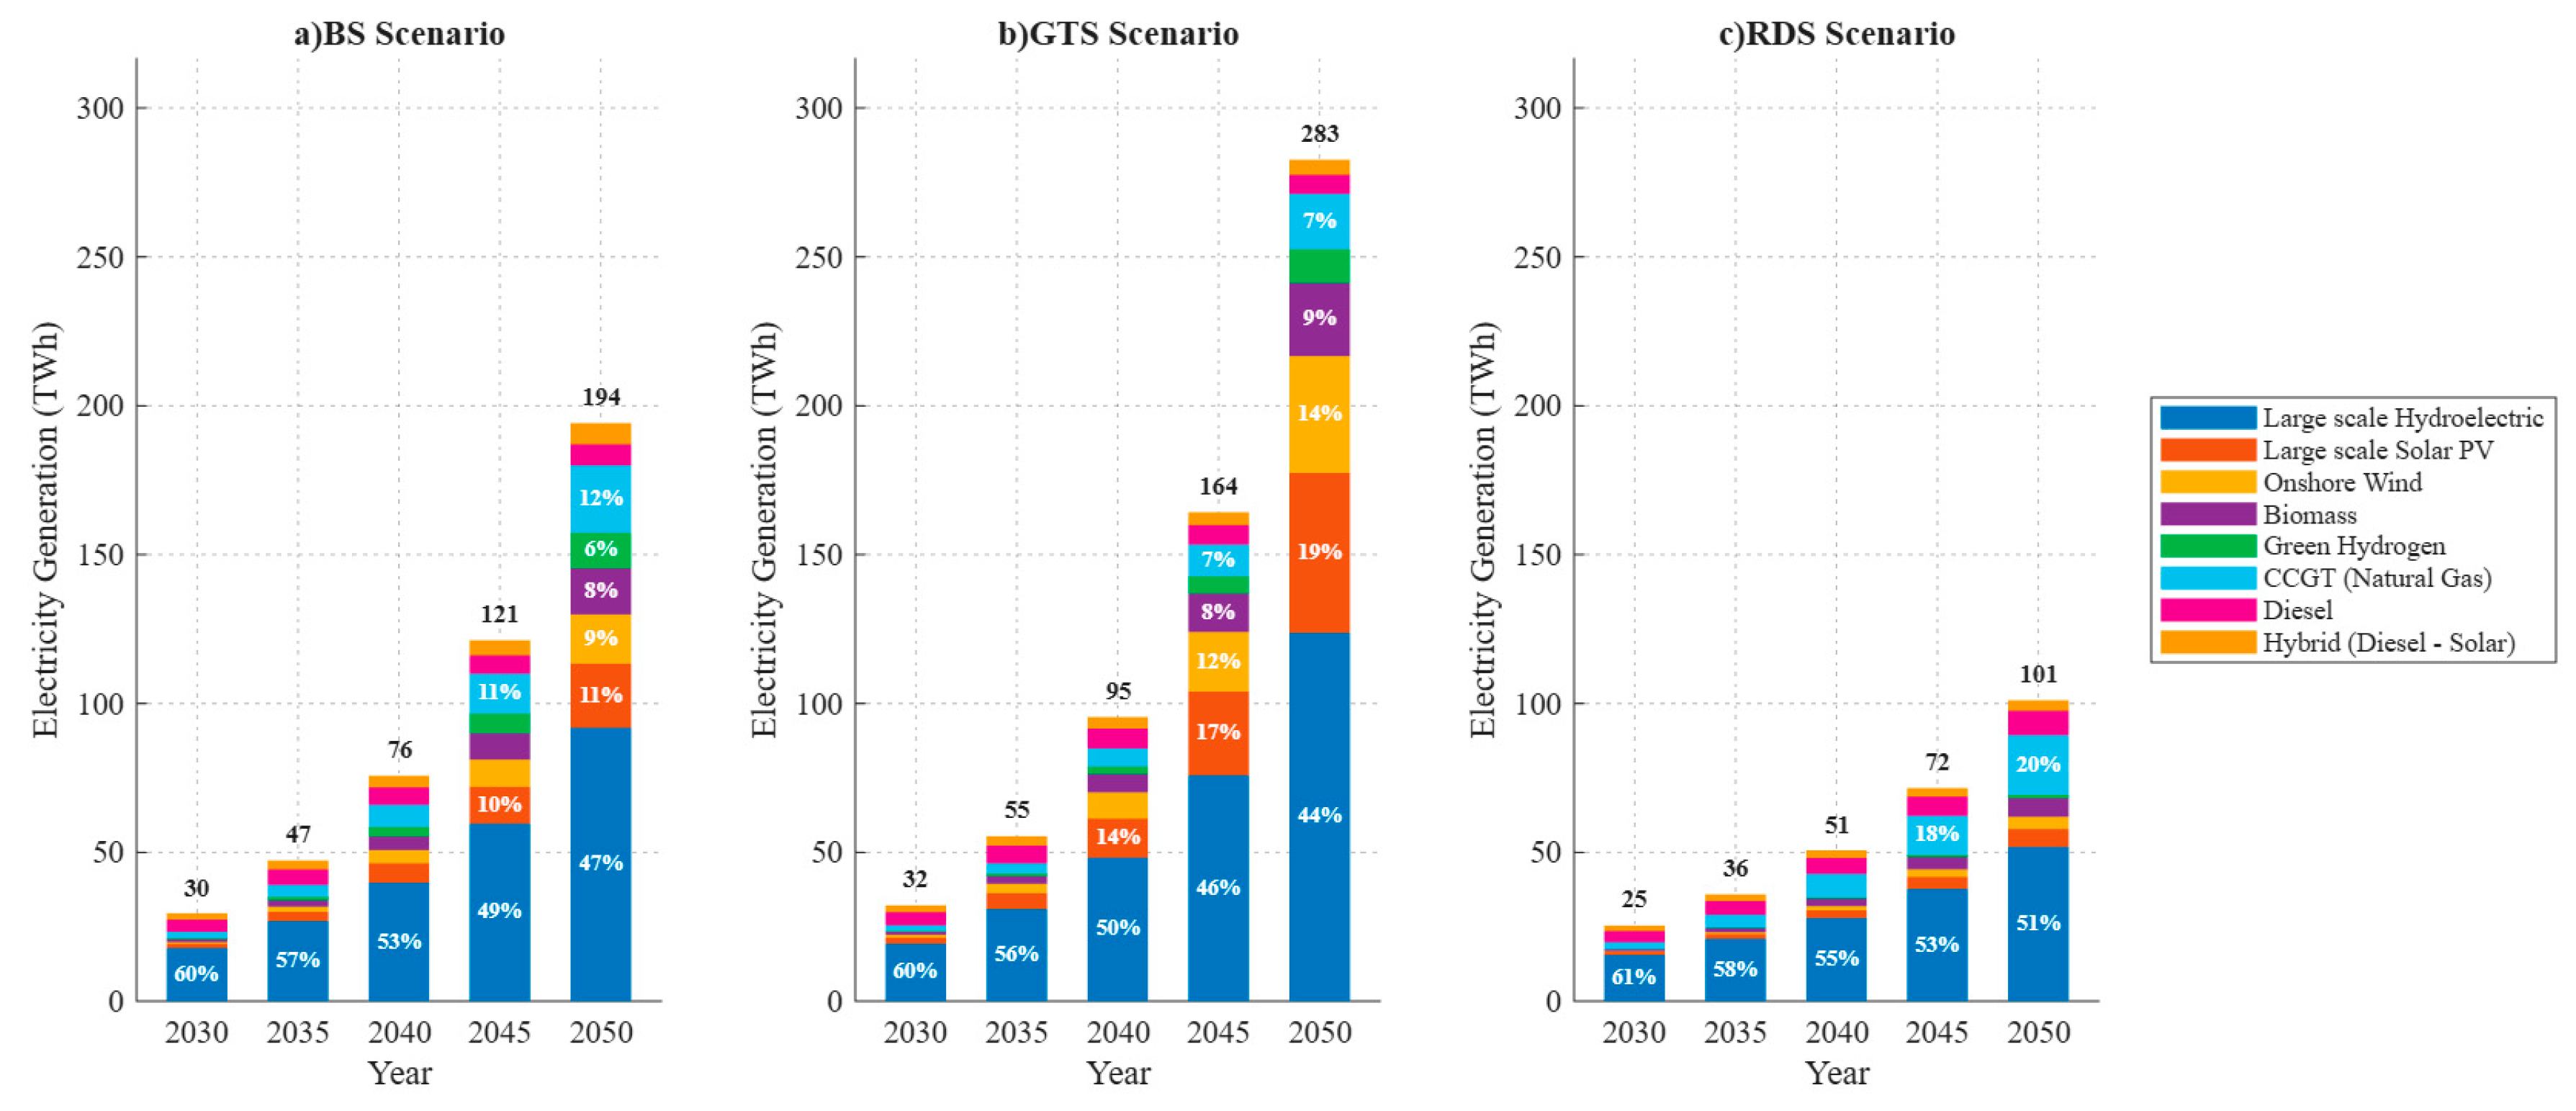
Figure 10.
Levelized Cost of Electricity (LCOE) by technology in Angola for the year 2050 under the BS, GTS, and RDS scenarios (EUR/MWh).
Figure 10.
Levelized Cost of Electricity (LCOE) by technology in Angola for the year 2050 under the BS, GTS, and RDS scenarios (EUR/MWh).
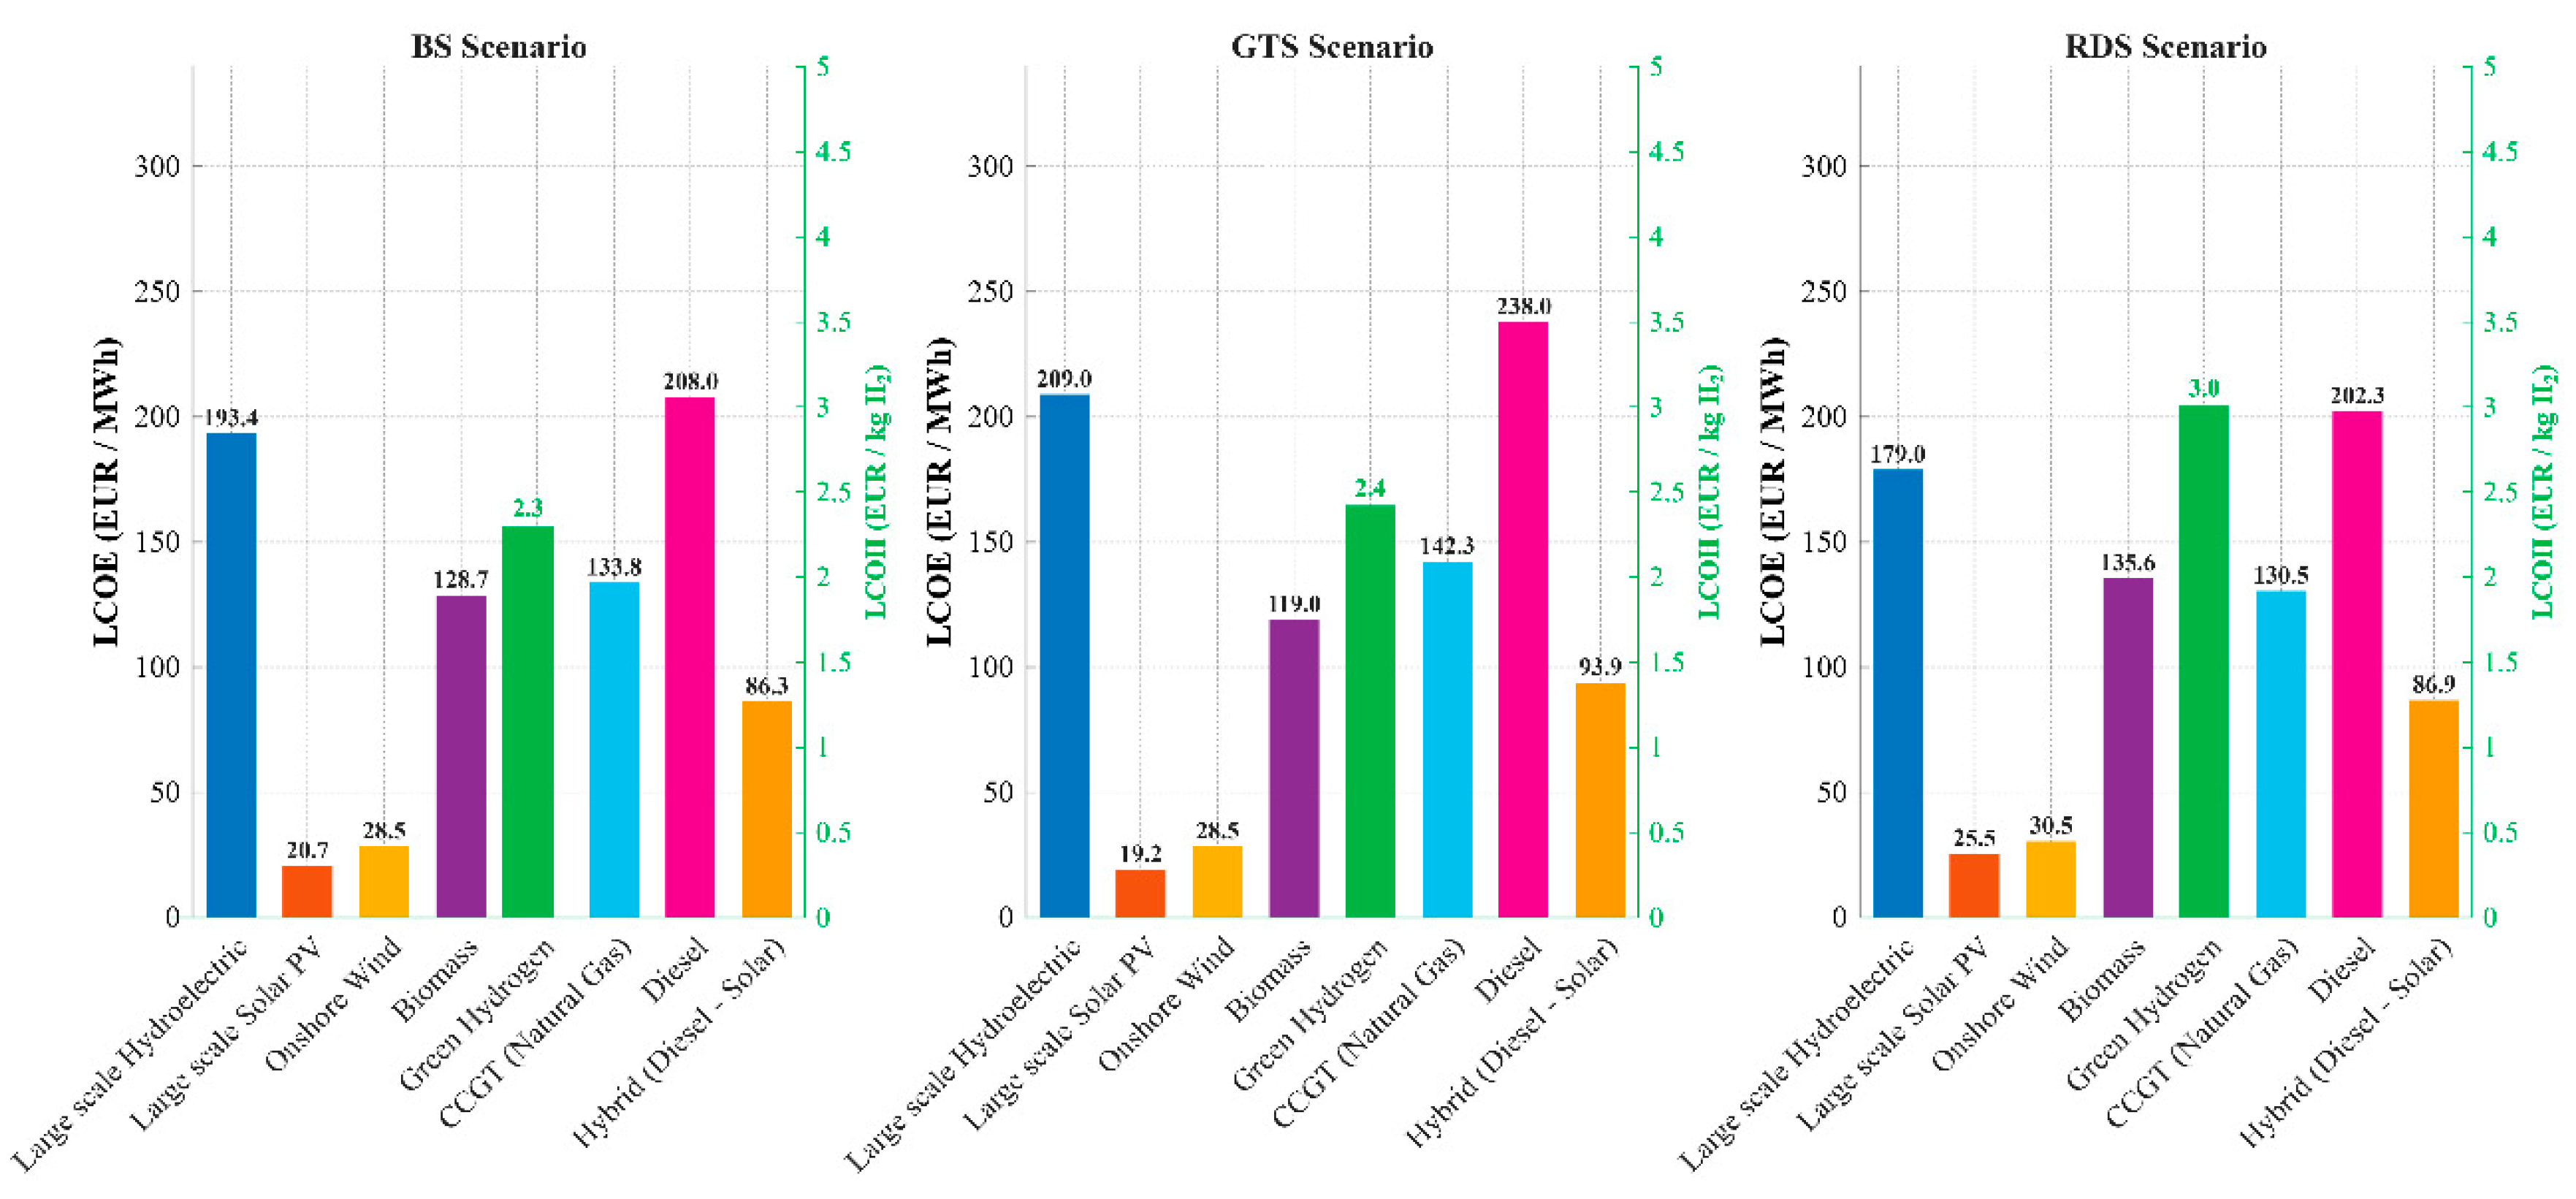
Figure 11.
Time series of the Levelized Cost of Electricity (LCOE) for all-diesel and hybrid (diesel-solar) systems in Angola (2030–2050) under the BS, GTS, and RDS scenarios.
Figure 11.
Time series of the Levelized Cost of Electricity (LCOE) for all-diesel and hybrid (diesel-solar) systems in Angola (2030–2050) under the BS, GTS, and RDS scenarios.
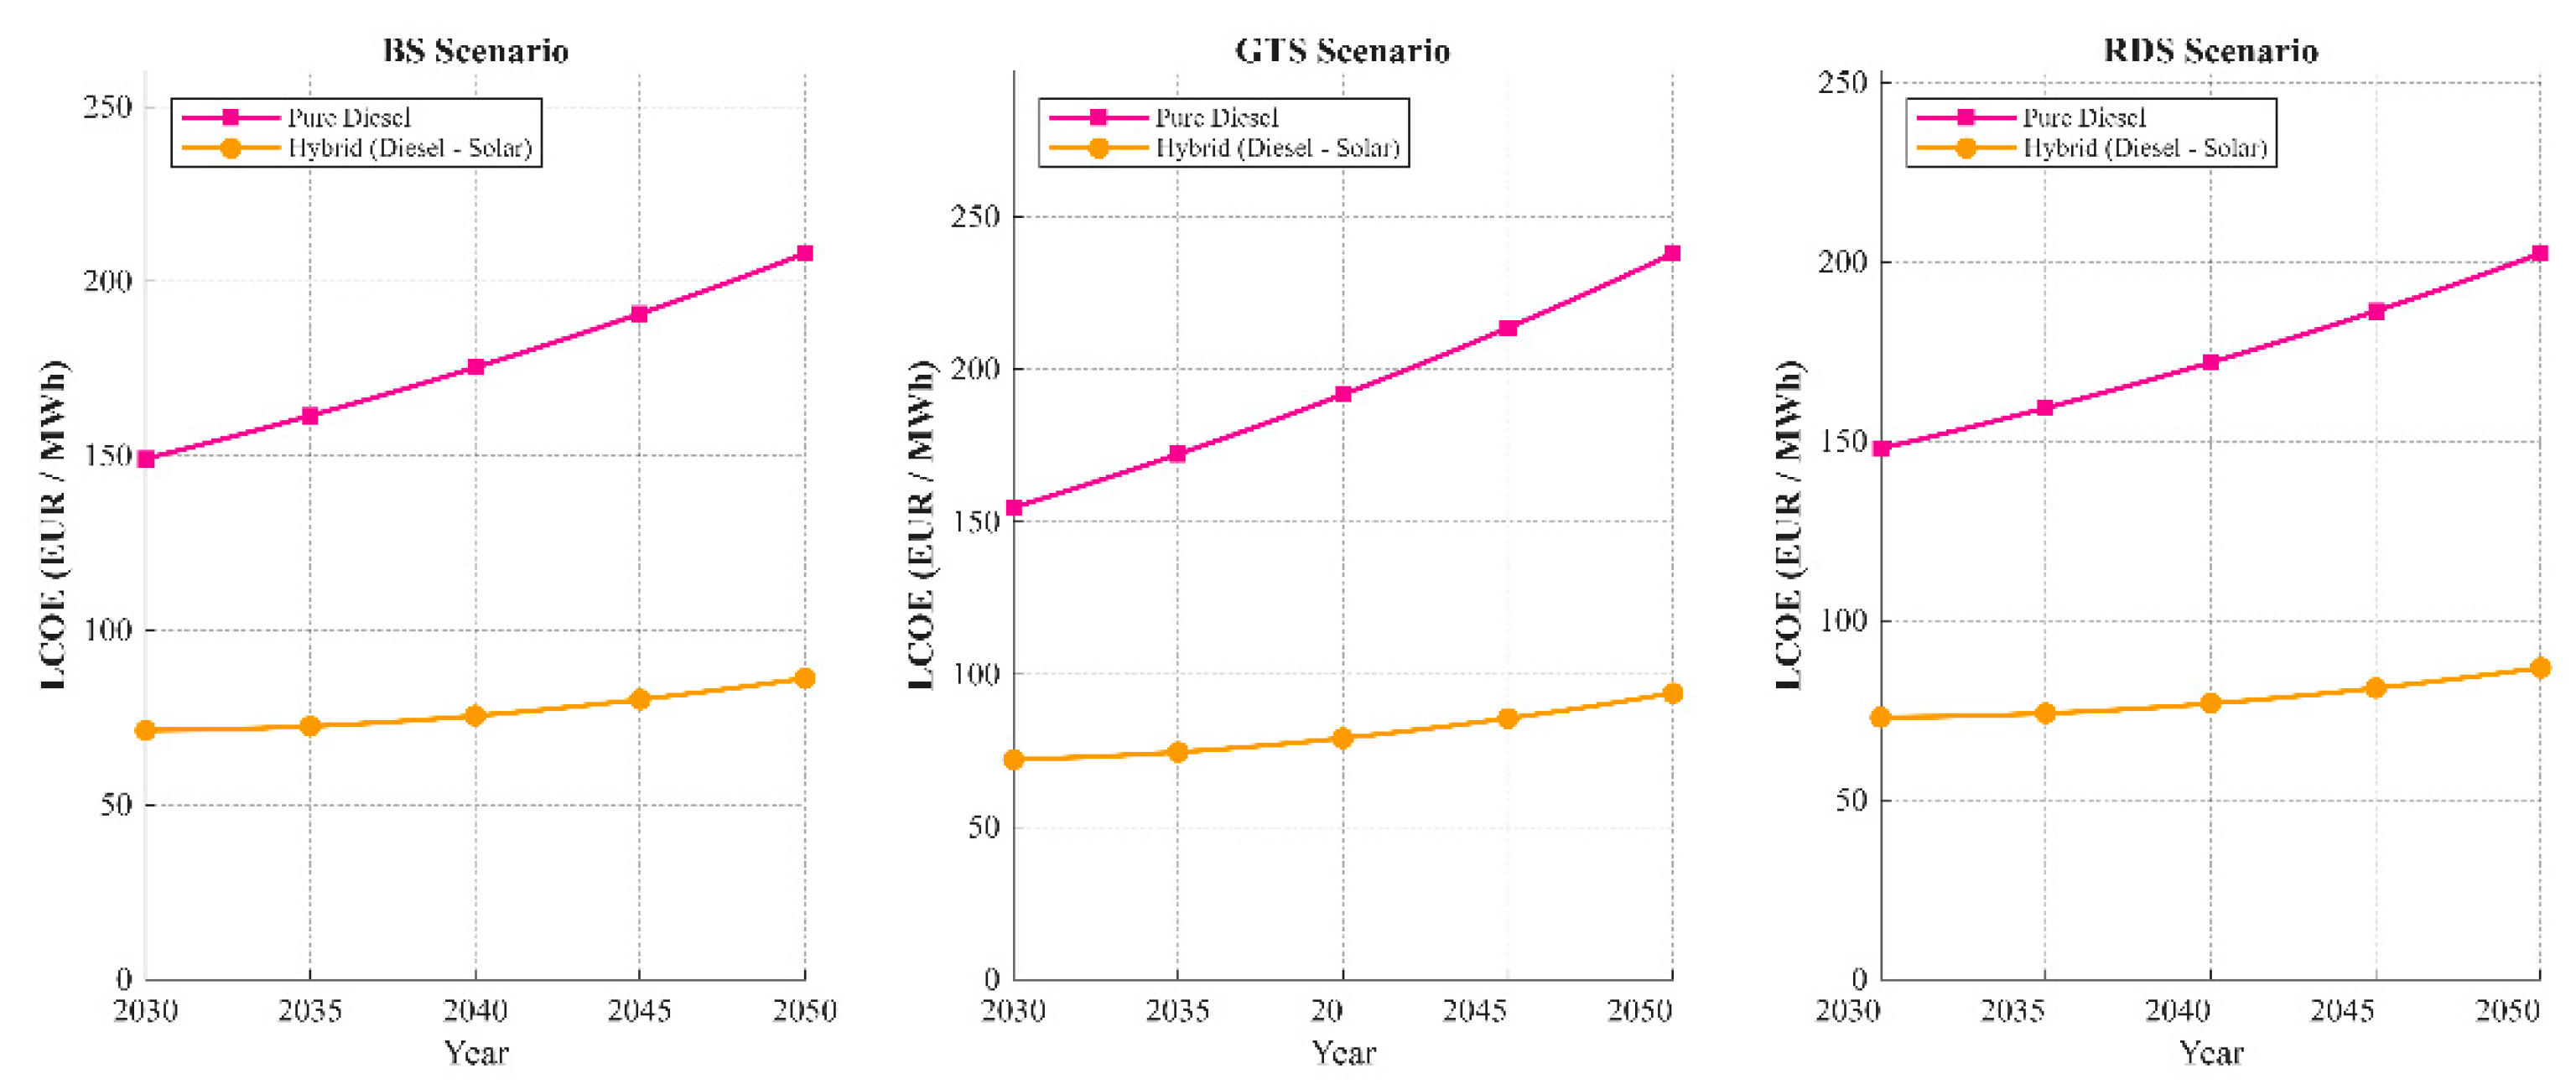
Figure 12.
Assessment of the carbon intensity of electricity generation technologies in Angola: operational emissions (EFop) versus life-cycle emissions (EFLCA), expressed in tCO₂e/MWh.
Figure 12.
Assessment of the carbon intensity of electricity generation technologies in Angola: operational emissions (EFop) versus life-cycle emissions (EFLCA), expressed in tCO₂e/MWh.
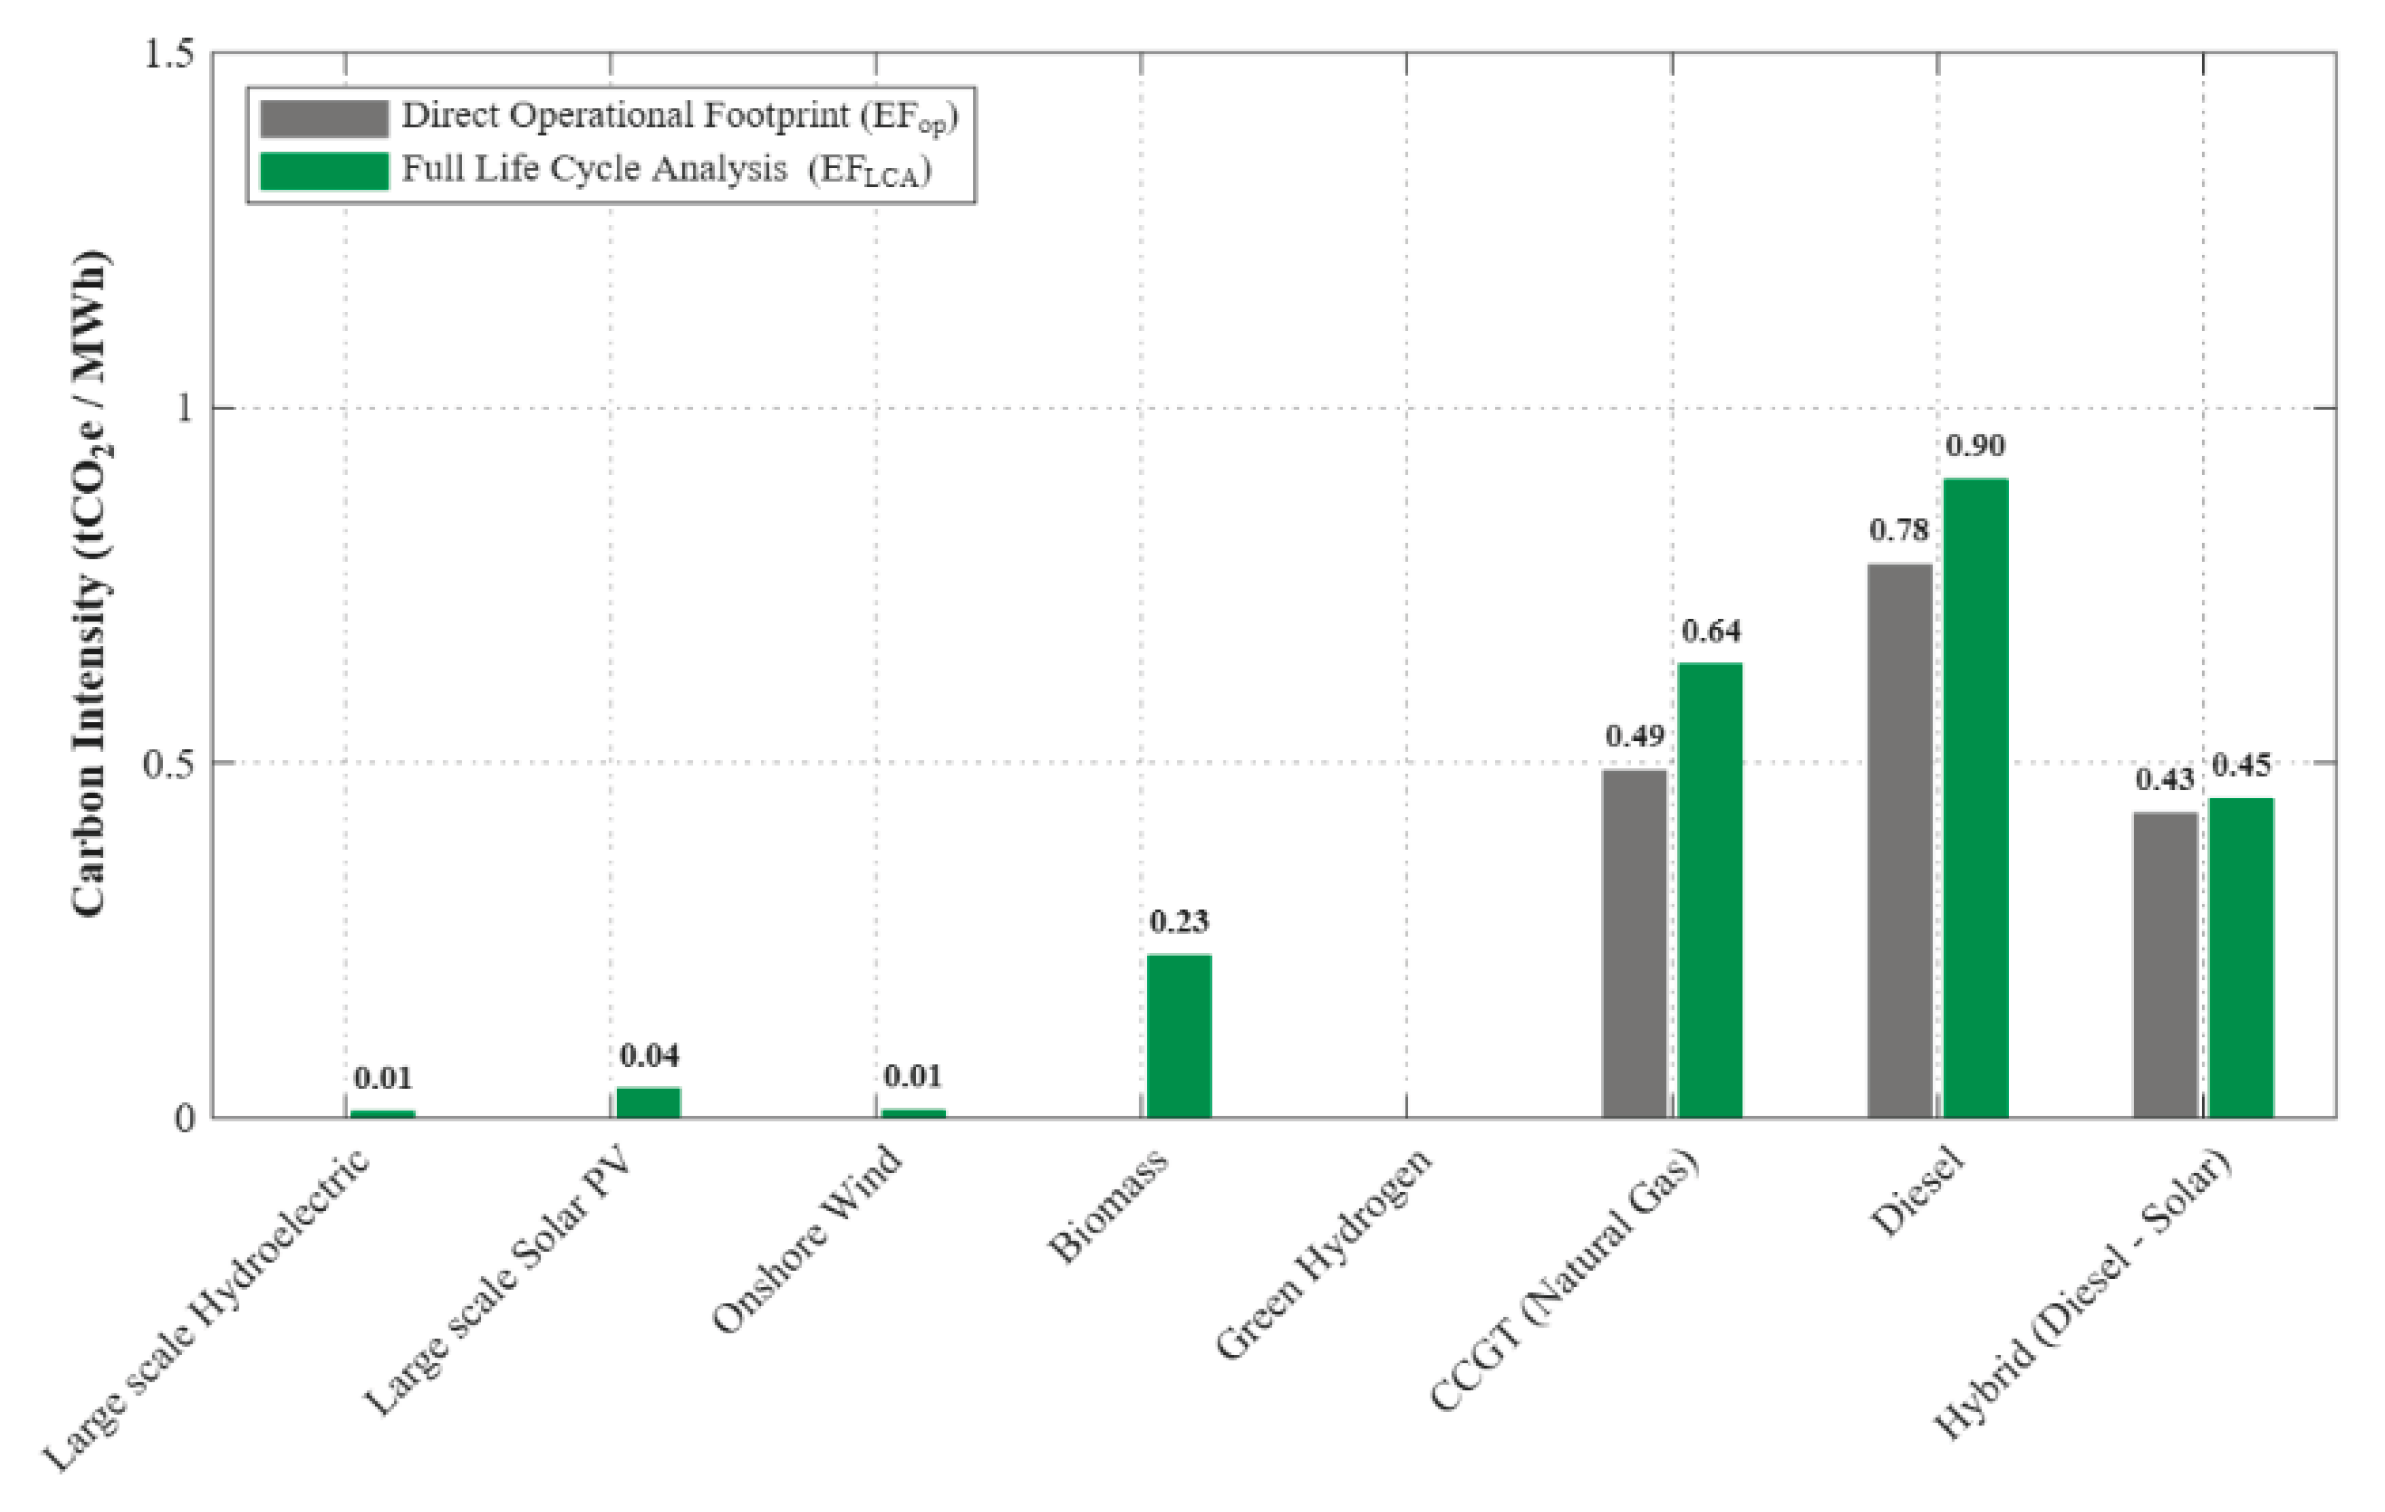
Figure 13.
Multivariate sensitivity analysis of the long-term electricity system model for Angola (2050): tornado diagrams showing the change in: a) electricity demand; b) total system cost; c) emissions under conditions of parameter uncertainty.
Figure 13.
Multivariate sensitivity analysis of the long-term electricity system model for Angola (2050): tornado diagrams showing the change in: a) electricity demand; b) total system cost; c) emissions under conditions of parameter uncertainty.
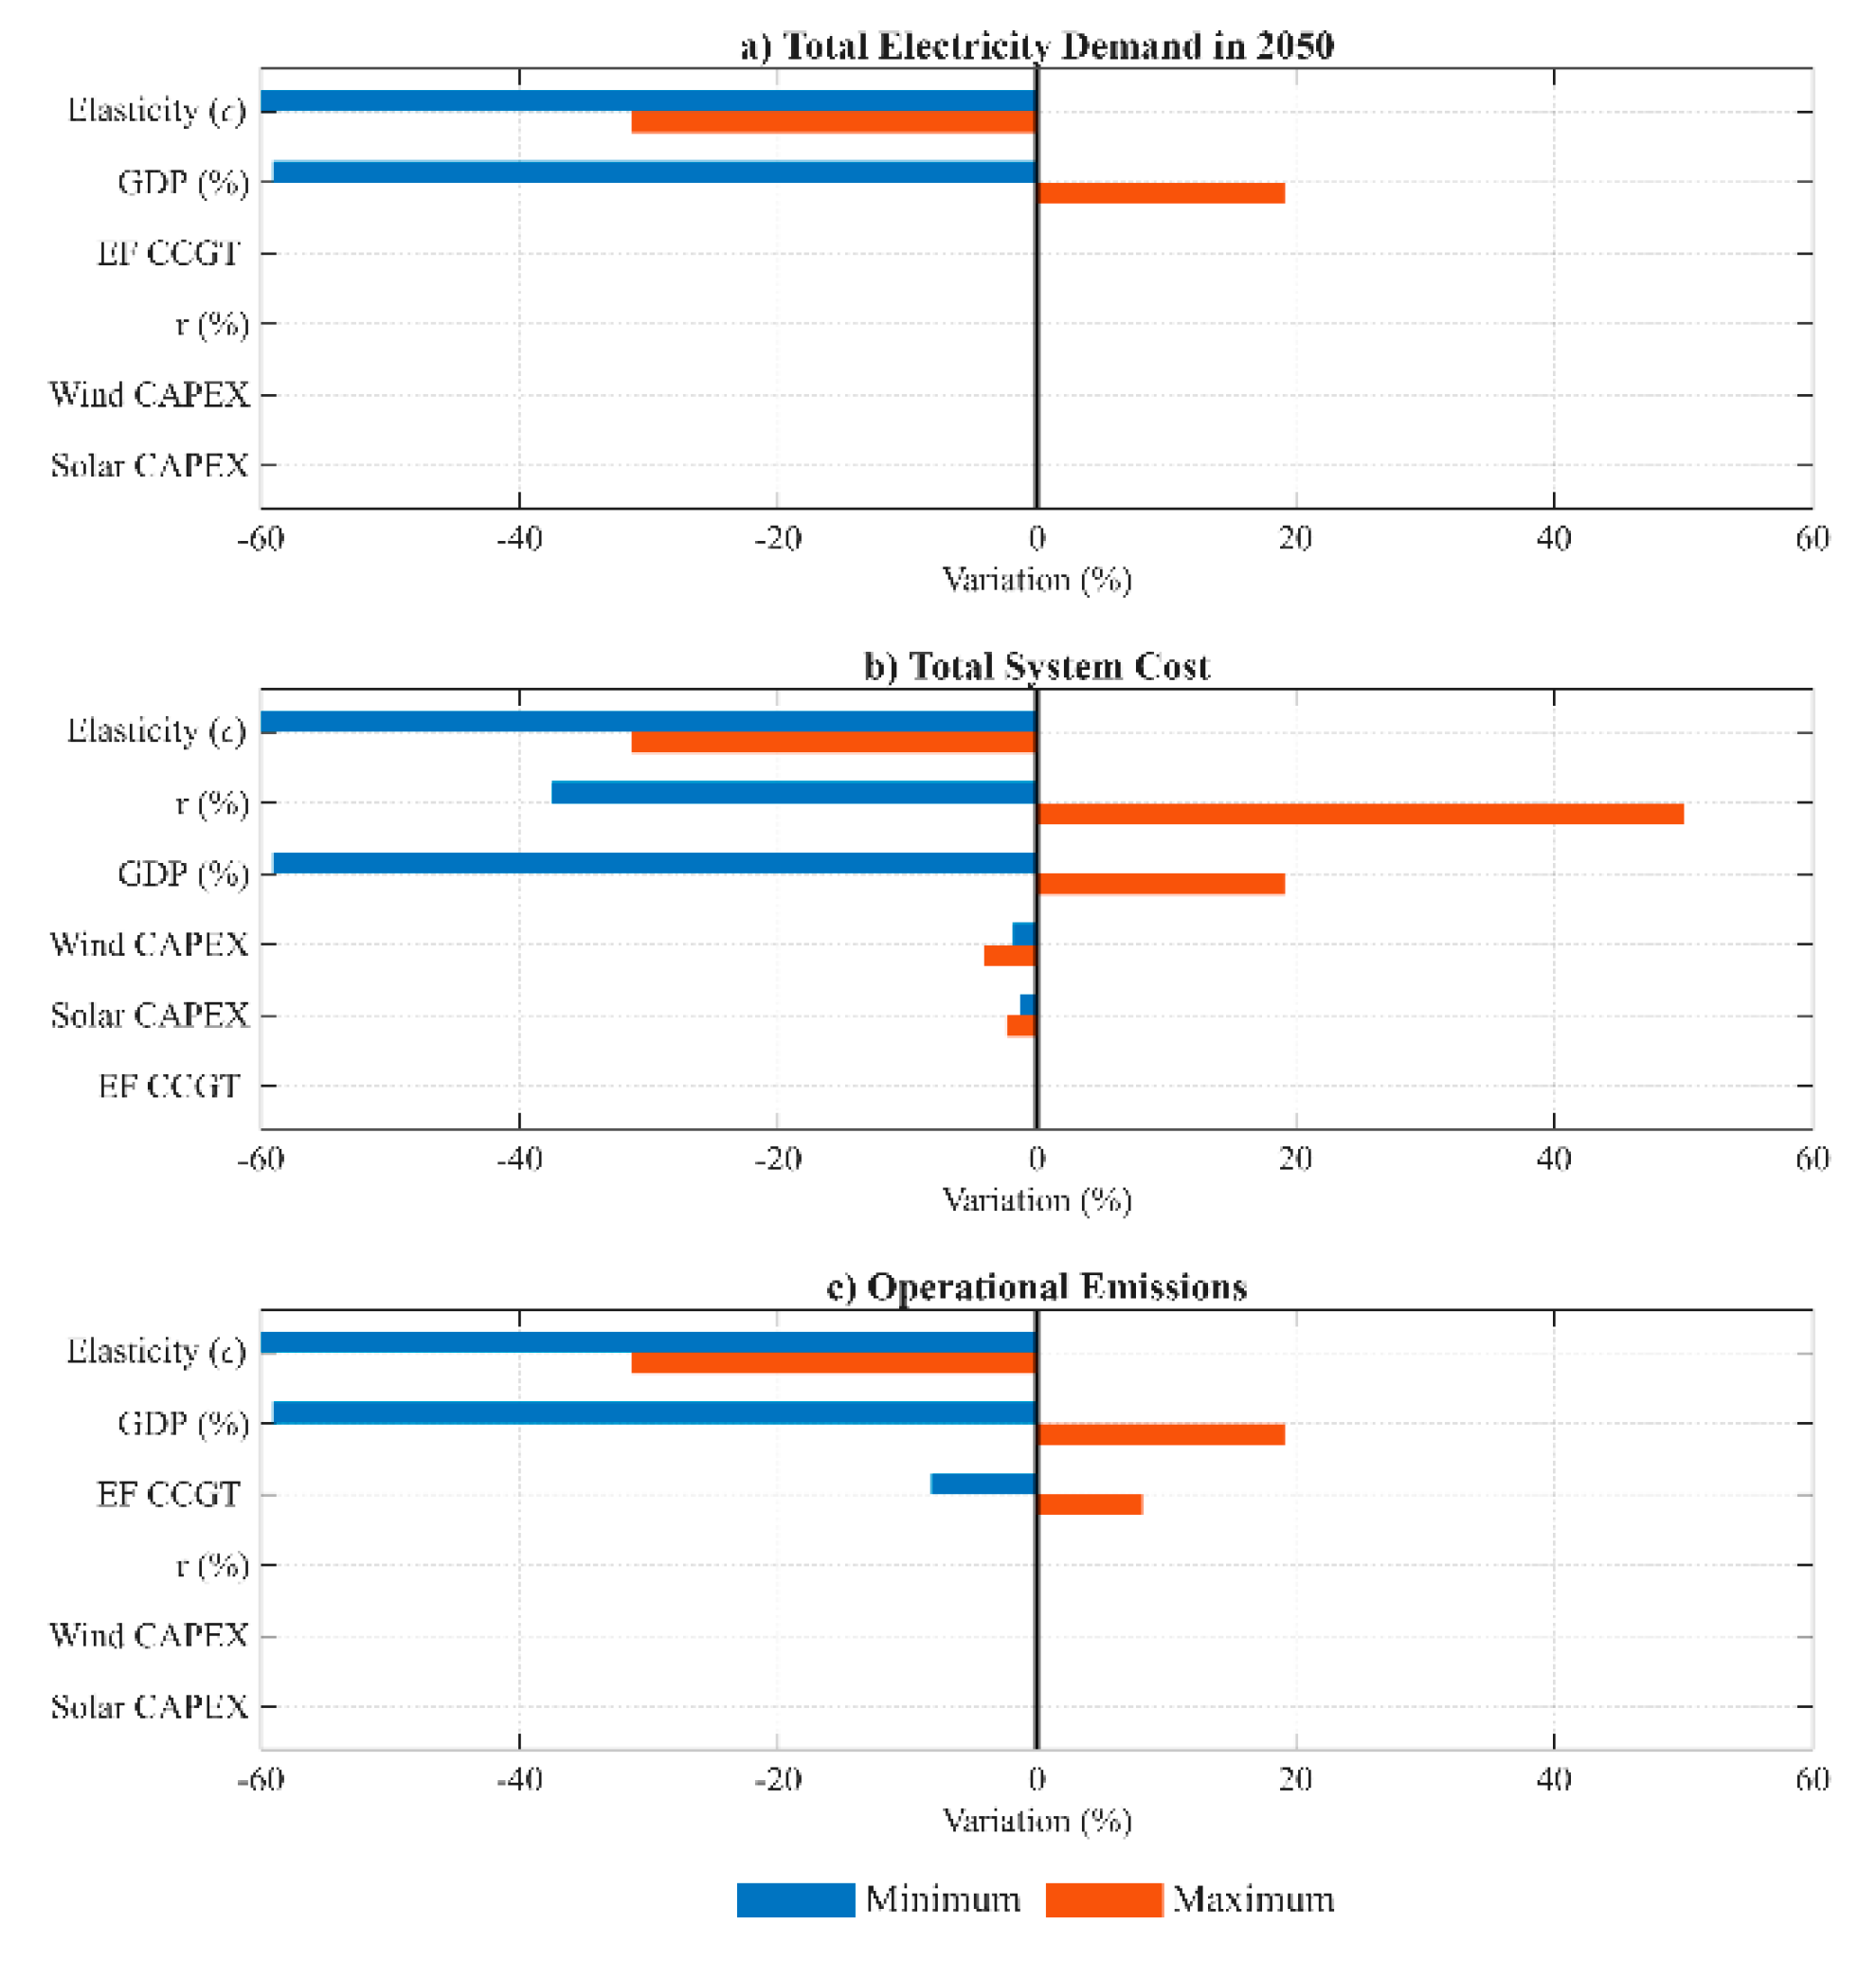

Table 1.
Historical data on the national power system from 2010 to 2024, based on the historical data provided.
Table 1.
Historical data on the national power system from 2010 to 2024, based on the historical data provided.
| Year | Installed Capacity (GW) | Ref. | Annual Production (TWh) | Ref. | GDP (billion USD) | Ref. | Population (Millions) | Ref. |
| 2010 | 1.37 | [26] | 5.31 | [27] | 95.54 | [28] | 22.68 | [25,29] |
| 2011 | 1.40 | 5.52 | 125.55 | 23.41 | ||||
| 2012 | 1.77 | 6.03 | 143.57 | 24.17 | ||||
| 2013 | 1.98 | 7.97 | 153.76 | 24.96 | ||||
| 2014 | 2.24 | 9.21 | 164.44 | 25.78 | ||||
| 2015 | 2.40 | 9.77 | 131.66 | 26.68 | ||||
| 2016 | 3.14 | 10.97 | 114.76 | 27.50 | ||||
| 2017 | 4.10 | 10.80 | 139.83 | 28.35 | ||||
| 2018 | 4.96 | 13.14 | 114.18 | 29.25 | ||||
| 2019 | 5.70 | 13.81 | 94.67 | 30.17 | ||||
| 2020 | 5.93 | 13.83 | 66.52 | 31.12 | ||||
| 2021 | 5.93 | 14.24 | [26] | 84.37 | 32.09 | |||
| 2022 | 5.92 | [30] | 14.95 | [30] | 142.44 | 33.08 | ||
| 2023 | 6.09 | [30] | 15.76 | [31] | 112.48 | 34.09 | ||
| 2024 | 6.28 | [31] | 16.79 | [31] | 115.21 | 35.12 |
Table 2.
Cost, performance, and emissions intensity parameters by technology.
| Technology |
CAPEXj (USD/kW) |
CAPEXj (EUR /kW) |
nj (years) |
OPEXj (% of CAPEX) |
Ref. | FC (%) | Ref | EFOP (gCO₂/KWh) | Ref. | EFLCA (gCO₂/KWh) | Ref. | |
| Large Hydroelectric Plant | 1050.0 – 7650.0 | 966.0 – 7038.0 | 50 | 2.0 | [32] | 25 - 90 | [32] | 0.0 | [33] | 10.70 | [34] | |
| Large-Scale Solar PV (> 1 MWhp) | 602.41 - 774.53 | 700.0 – 900.0 | 25 | 1.20 | [35] | 20 - 25 | [36] | 0.0 | [33] | 42.0 | [34] | |
| Onshore Wind | 1510.60 – 2207.80 | 1300.0 – 1900.0 | 25 | 2.50 | [35] | 30 - 55 | [37] | 0.0 | [33] | 12.0 | [38] | |
| Biomass | 4035.63 - 6725.66 | 3473.0 – 5788.0 | 25 | 5.0 | [35] | 60 - 75 | [36] | 0.0 | [33] | 230.0 | [39] | |
| Green Hydrogen | 2684.22 | 2310.0 | 20 | 4.0 | [40] | 25 - 60 | [41] | 0.0 | [42] | 0.0 | [43] | |
| CCGT/Natural Gas | 1045.0 – 1510.0 | 900.0 – 1300.0 | 30 | 3.0 | [35] | 50 - 60 | [44] | 490.0 | [45] | 645.0 | [38] | |
| Diesel | 1000.0 – 1300.0 | 860.59 – 1118.76 | 20 | 8.0 | [46] | 95 | [46] | 780.0 | [45] | 900.0 | [47] | |
| Hybrid (Diesel + Solar) | 1234.40 | 1135.65 | 20 | 6.0 | [48] | 20 - 40 | [49] | 430.0 | [33] | 450.0 | [33] |
Table 3.
Key economic, technological, and scenario parameters used in the calibration and projection of the energy model for Angola (2024–2050).
Table 3.
Key economic, technological, and scenario parameters used in the calibration and projection of the energy model for Angola (2024–2050).
| Category | Analytical Parameter | Variable | value |
| General Parameters | Annual operating hours | H | 8760 h |
| Discount rate | r | 8.0% | |
| Exchange rate | fEUR | 0.92 EUR/USD | |
| Learning Technology | PV Solar Learning Rate | LRsolar | 18.0% |
| Wind Learning Rate | LRwind | 12.0% | |
| H2 Green Learning Rate | LRH2 | 15.0% | |
| Fuels | Diesel Price (2024) | PDiesel,2024 | 0.23EUR/L |
| Natural Gas Prices (2024) | PGas,2024 | 4.60 EUR/MMBtu | |
| Annual price growth | αt | 2.5% | |
| Technical Specifications | Electrolyzer Efficiency | ηelectr | 65.0% |
| Hydrogen PCI | 33.33 kWh/kg | ||
| CR Scenario (2050) | GDP Growth | GRPIBCR | 4.5 % - 5.2% |
| Energy efficiency | ηCR | 3 %/ year | |
| Maximum power | KCR | 44 GW | |
| CTV Scenario (2050) | GDP Growth | GRPIBCTV | 5.8% |
| Energy efficiency | ηCTV | 5%/ year | |
| Maximum power | KCTV | 40 GW | |
| CDR Scenario (2050) | GDP Growth | GRPIBCDR | 3.3% constant |
| Energy efficiency | ηCDR | 4%/ year | |
| Maximum power | KCDR | 38 GW |
Table 4.
Variation ranges used in the univariate sensitivity analysis of the model’s key economic, technological, and environmental parameters.
Table 4.
Variation ranges used in the univariate sensitivity analysis of the model’s key economic, technological, and environmental parameters.
| Parameter | Base Value (CR) | Minimum | Maximum | Justification |
| Elasticity of Demand (ε) | 0.8 | 0.5 | 1.1 | Uncertainty regarding how demand will respond to economic growth [45,46] |
| GDP growth rate | 3.5%/ano | 2.0%/ano | 5.0%/ano | Historical Variability in Angola's Economic Growth [31] |
| Solar PV CAPEX (2050) | − 40% | − 30% | − 55% | Uncertainty in Technological Learning Curves [64,65] |
| Wind Power CAPEX (2050) | − 30% | − 20% | − 45% | Variability in Cost-Reduction Pathways [65,66] |
| Discount rate (r) | 8% | 5% | 12% | Different Risk and Financing Profiles [61] |
| CCGT Emission Factor | 490 gCO₂/kWh | 450 gCO₂/kWh | 530 gCO₂/kWh | Variability in Fuel Efficiency and Composition [75] |
Table 5.
Comparison between the targets of the 2040 Master Plan/Angola Energy 2025 and the results projected by the model under the Green Transition (GTS) scenario for 2050.
Table 5.
Comparison between the targets of the 2040 Master Plan/Angola Energy 2025 and the results projected by the model under the Green Transition (GTS) scenario for 2050.
| Key indicator | Master Plan 2040/Angola Energy 2025 | Model (2050 – GTS) | Implication |
| Electricity demand | 65 TWh (2040) | 283 TWh | Underestimation of demand |
| Peak load | 11.2 GW | > 35 GW | Risk of a capacity shortfall |
| Population | 50 - 60 M | 84 - 86 M | Population underestimation |
| Solar PV | 100 MW | 33% of power | Low solar ambition |
| Wind | 652 MW | 14% of production | Undersizing wind turbines |
| Green hydrogen | Not considered | 9% of production | Lack of an H₂ strategy |
| Hydric | > 60% | 37 - 51% | Technological diversification |
| CCGT (Natural Gas) | Structuring | 5 - 20% | Less dependence on fossil fuels |
| Diesel | Transitional | 2 - 10% | Residual persistence |
| LCOE solar | Not specified | 19 – 26 EUR/MWh | High competitiveness |
| LCOE diesel | Not specified | 150 – 238 EUR/MWh | High cost of fossil fuel-based power generation |
| Hybrid systems | Pilot projects | > 50% cost reduction | Potential for expansion |
| Emissions | Gradual reduction | Sharp decline | Greater potential for decarbonization |
Disclaimer/Publisher’s Note: The statements, opinions and data contained in all publications are solely those of the individual author(s) and contributor(s) and not of MDPI and/or the editor(s). MDPI and/or the editor(s) disclaim responsibility for any injury to people or property resulting from any ideas, methods, instructions or products referred to in the content. |
© 2026 by the authors. Licensee MDPI, Basel, Switzerland. This article is an open access article distributed under the terms and conditions of the Creative Commons Attribution (CC BY) license (http://creativecommons.org/licenses/by/4.0/).
Copyright: This open access article is published under a Creative Commons CC BY 4.0 license, which permit the free download, distribution, and reuse, provided that the author and preprint are cited in any reuse.