

Submitted:
10 September 2026
Posted:
11 September 2026
You are already at the latest version
Abstract
Abrasive waterjet cutting (AWJC) is widely used for processing Kevlar-reinforced polymer composites; however, surface quality is typically assessed using amplitude-based roughness parameters like Ra and Rz, which offer limited insight into the overall morphology of the machined surface. This study investigates the use of complementary roughness descriptors—focusing on profile height, distribution, spacing, and slope—to characterize the kerf wall morphology generated during the cutting process. Measurements were performed across different zones of the kerf wall under varied cutting conditions, enabling the examination of how specific process parameters influence these descriptors. All investigated parameters significantly influenced the four roughness descriptors, which proved to be strongly inter-correlated, reflecting a unified material removal mechanism. Furthermore, a clear distinction was highlighted between the smooth, uniform top zone and the rougher bottom zone featuring diagonal striations, confirming the sensitivity of these descriptors to local variations in cutting conditions.
Keywords:
abrasive water-jet cutting
; Kevlar fiber-reinforced polymer
; complementary roughness parameters
; full factorial experiment
; desirability plots
1. Introduction
Aramid fibers, particularly Kevlar®, are widely used in high-performance composites due to their high strength-to-weight ratio, impact resistance, and thermal stability [1,2,3]. Owing to these properties, Kevlar-reinforced composites are utilized in structural applications in civil engineering [4], ballistic protection systems [5], and, more recently, in hybrid carbon–Kevlar configurations for aerospace applications [6].
However, processing these materials represents a technological challenge, as conventional machining methods, such as milling and drilling, can lead to delamination, fiber pull-out, and localized damage associated with mechanical and thermal stresses [7,8]. In response to these limitations, Abrasive Water Jet Cutting (AWJC) constitutes an effective non-conventional method for processing composite materials, owing to the absence of a heat-affected zone and reduced cutting forces [9,10]. The applicability of AWJC to carbon fiber-reinforced composites was also confirmed through comparative studies with milling, which highlighted lower defect levels and superior process predictability [11]. In the case of AWJC, the material removal process occurs through the erosive action of abrasive particles, kinetically activated by the high-velocity water jet, which provides both the energy and momentum required for impact, as well as the flushing of erosion products and spent abrasive.
Achieving favorable surface characteristics through AWJC depends on numerous process parameters, such as water pressure, traverse speed, standoff distance, abrasive mass flow rate and grain size, and nozzle diameter [9,12]. The effects of these parameters can interact, and recent studies have also highlighted the influence of jet pressure oscillations on surface topography [13]. This process complexity justifies the use of systematic experimental approaches, where Design of Experiments (DoE) methods provide an appropriate framework for evaluating the effects of process parameters and their interactions on the characteristics of cut surfaces [14,15,16,17,18]. In a recent study, machine learning methods were also explored for modeling and predicting the roughness of surfaces machined by AWJC [19].
A characteristic aspect of surfaces obtained by AWJC is the variation of topography along the depth of the cut. Depending on the available energy and the evolution of the jet during material penetration, the surface can be described by a relatively smooth top zone, associated with the cutting zone, and a rougher bottom zone, characterized by more pronounced waviness and striations [12,13,16]. This differentiation highlights the complex and non-uniform character of the generated surface.
Conventional amplitude parameters, such as arithmetic mean roughness (Ra) and maximum profile height (Rz), although most commonly used for surface characterization, do not fully capture the shape, spatial distribution, and local variation of the profile [20, 21]. For this reason, literature increasingly employs extended sets of roughness descriptors. For instance, the study by Sedlaček et al. [22] on 100Cr6 steel demonstrated that parameters such as skewness (Rsk) or valley depth directly influence the friction coefficient. Along the same lines, the study by Alsoufi et al. [23] on carbon steel cutting via AWJC and laser beam shows that although mean roughness values (Ra) are close, profile skewness (Rsk) has opposite signs (negative for AWJC and positive for laser), an aspect extremely useful in choosing the optimal technology according to functional requirements. Furthermore, Menezes et al. [24] explicitly demonstrated that the mean profile slope (Rda) is the parameter best correlated with the friction coefficient under lubricated conditions, while Radziejewska et al. [25], Huang et al. [26], and Hlaváčová [27] emphasized the importance of using extended sets of descriptors and statistical correlations between them to correctly evaluate wear and friction behavior.
In this direction, our team's previous research has progressively addressed the characterization of the surface resulting from the AWJC of Kevlar/epoxy composites using Design of Experiments (DoE) methods. Initial studies aimed to evaluate the most commonly used roughness parameter, Ra, alongside the kerf taper angle [28]. The investigation was subsequently extended to the profile height parameter Rz by introducing the kerf zone as a virtual factor to develop a unified model for both roughness zones [29]. The study was complemented by investigating delamination-induced defects, intending to identify deterministic influences of certain input process parameter levels on this phenomenon [28, 29]. In a later stage, the study was deepened through the additional modeling of two roughness height parameters, Rz1max and Rt, for the two characteristic regions of the cut [30], while another research direction focused on modeling the material removal rate (MRR) and the dimensional and geometric precision of the machined parts [31]. Although these studies led to empirical models with a high degree of determination (R2 > 90%) for each investigated parameter, the analysis remained centered on conventional roughness amplitude parameters, without exploring additional profile parameters capable of capturing the periodic and distributional character specific to surfaces generated by AWJC.
Thus, to fully characterize the kerf surface morphology resulting from AWJC and overcome the limitations caused by analyzing only the amplitude parameters (Ra, Rz, Rz1max, Rt) used in previous studies [16,21,28,29,30,31], this paper additionally investigates four profile parameters with complementary significance: two additional amplitude parameters — maximum peak height (Rp) and profile skewness (Rsk) — along with one spacing parameter — mean spacing of irregularities (RSm) — and one hybrid parameter — mean profile slope (Rda). These were chosen for their ability to capture both the extreme and asymmetric character of the topography, as well as the periodic nature and local inclination of the asperities generated by the oscillatory trajectory of the abrasive waterjet. Furthermore, the research evaluates kerf surface morphology to identify input parameter combinations that maximize surface uniformity, thereby minimizing discrepancies between the roughness characteristics of the top and bottom zones.
2. Materials and Methods
The experimental strategy adopts an empirical input-output framework—functioning as a black box—that deliberately omits a detailed physical analysis of workspace mechanics to focus on establishing statistical relationships between the investigated objective functions and input factors. To generate reliable regression models and evaluate the inter-correlations among the four roughness descriptors, a four-factor full factorial experimental design was implemented.
2.1. Material
The experimental investigation was carried out on a Kevlar fiber-reinforced polymer (KFRP) laminate, identical to the one used in the team's previous studies [23,24,25,26], manufactured from Kevlar® 29 plain-weave prepregs supplied by Duqueine Composites (France) and impregnated with an epoxy resin system.
The laminate consists of 18 prepreg plies and has a nominal thickness of 9.5 ± 0.1 mm, with a resin content of approximately 40 wt.%. The laminate is vacuum-bagged and autoclave-cured. The reinforcing fabric is composed of 100% para-aramid Kevlar® 29 yarns, with a linear density of 3300 dtex in both the warp and weft directions, an areal density of 440 ± 10 g/m², and a thread count of 6.65 × 6.65 ends/cm (Figure 1).
2.2. Machining Equipment
Rectangular specimens (60 mm × 30 mm) were machined from the KFRP laminate using a CNC-controlled JEDO abrasive water jet machining (AWJM) system. The equipment comprises a high-pressure water supply unit, an abrasive delivery system, a CNC motion platform, and a cutting head equipped with a focusing tube, enabling accurate and repeatable machining of composite materials. Australian GMA garnet was used as the abrasive material because of its high hardness, angular particle shape, and suitability for abrasive water jet machining [32]. Only the abrasive grain size was varied during the experiments, whereas all other abrasive characteristics were kept constant. All cuts were performed in a single pass with the jet oriented perpendicular to the laminate surface (90°). A general view of the AWJM equipment and a schematic representation of the cutting head with the input experimental parameters are presented in Figure 2.
2.3. Influence Factors
The experimental program was designed to evaluate the influence of the main abrasive water jet cutting (AWJC) parameters on the quality of the KFRP surface cut. Three machining parameters were selected as influence factors: traverse speed (v), focusing tube diameter (D), and abrasive grain size (g). In addition, the kerf zone (Z) was introduced as a virtual factor to account for the different material removal mechanisms occurring along the laminate thickness. The experimental levels of all investigated factors are presented in Table 1.
The top zone corresponds to the initial jet penetration, where the abrasive jet possesses its maximum kinetic energy, whereas the bottom zone is characterized by progressive jet energy attenuation and increased jet deflection, resulting in different material removal mechanisms and surface morphologies.
The selected factor levels were established considering the operational capabilities of the CNC-controlled JEDO AWJM system, previous experimental studies, and preliminary trials conducted by the authors. Throughout the experiments, all other process parameters were kept constant: water pressure (300 MPa), abrasive flow rate (200 g/min), water nozzle diameter (0.33 mm), standoff distance (3 mm), jet angle (90°), abrasive material (GMA garnet), and the number of passes (1), ensuring that any variations in surface quality could be attributed to the investigated factors.
2.4. Objective Functions
Although conventional amplitude parameters (such as Ra and Rz) are widely used both in AWJC literature and in product specification engineering practice, they provide a limited one-dimensional view of surface geometry. Therefore, additional surface roughness parameters (Rp, Rsk, RSm, and Rda) were considered to further characterize the cut surface morphology, with particular emphasis on peak characteristics and the spatial distribution of surface striations.
The definitions of the roughness descriptors used in this study follow the parameter descriptions provided in the Surtronic 25 User’s Guide [33], with reference to standard terminology [34].
The maximum profile peak height (Rp) represents the largest deviation of the roughness profile above the mean line within the sampling length (Figure 3) and was used as an indicator of protruding Kevlar fibers resulting from incomplete cutting [28].
The skewness (Rsk) quantifies the asymmetry of the profile height distribution about the mean line and is defined as the ratio of the mean cubed ordinate values, Z(x), to the cube of the root-mean-square roughness (Rq³), evaluated over the sampling length lr (Figure 3). Here, Z(x) represents the profile height at a given position x, and lr denotes the sampling length.
A positive Rsk indicates a surface profile with a predominance of peaks, which may be associated with protruding fibers, whereas a negative Rsk indicates a profile with a predominance of valleys, which may result from matrix erosion or fiber pull-out. This parameter was used to assess the dominant material removal characteristics across the different cutting zones.
The mean width of profile elements (RSm) characterizes the average spacing between successive profile elements and was used to quantify the spatial spacing of the striations on the cut surface. For the particular case illustrated in Figure 3 (m = 6), the definition relationship can be written:
Finally, the arithmetic mean slope (Rda) describes the average steepness of the surface irregularities (Figure 3) and was considered as an indirect indicator of the potential for local stress concentrations at the cut edge.
Surface roughness measurements were performed separately in the upper and lower regions of the kerf zone (Figure 4a) using a handheld Taylor Hobson Surtronic 25 stylus tester (Figure 4b) [28]. For each specimen, two measurements were performed on each 60 mm long cut surface, and the maximum value was retained for further analysis. During the evaluation procedure, the stylus traversed the surface perpendicularly to the lay direction, while a Gaussian filter was applied to process the profiles.
To accurately capture the distinct characteristics across the cut sections, measurements were performed according to the specifications for selecting the cut-off length [33]. Thus, the majority of the measurements were performed with a standard sampling (cut-off) length lr = λc = 0.8 mm and an evaluation length ln = 5 λc. For the results that revealed an RSm value greater than 400μm, the measurements were repeated with the recommended λc = 2.5 mm, and the evaluation lengths were adjusted based on the available surface area of each zone: ln top = 5 λc was implemented for the top region, whereas ln bottom = 2 λc was utilized for the constrained bottom region.
2.5. Research Flow Summary
The cybernetic model of the experiment (Figure 5) consists of interconnected components, linking the material properties and AWJ cutting parameters to the kerf formation mechanism, surface morphology, and, ultimately, to a rigorous quantitative characterization through roughness descriptors. The evaluation relies on advanced statistical tools, such as full factorial design of experiments, regression models, correlation analysis, and contour overlay plots.
3. Results and Discussion
To model the influence of a set of p selected factors, xⱼ, on a performance characteristic, y, using a 2p full factorial experiment, the experimental results are used to determine the coefficients b0, bⱼ, and bjk of the following polynomial [35]:
This type of experimental design makes it possible to obtain a highly accurate model while carrying out a minimum number of trials, which in turn helps reduce the overall cost of the investigation.
3.1. Experimental Design and Measured Results
The experimental matrix (Table 2) was generated according to the principles of a full factorial experimental design, including all possible combinations of factor levels [30]. To estimate the experimental error, each experimental run was replicated. Table 2 presents the corresponding results for all four objective functions considered in this study. Data processing, statistical analysis, and plotting were performed using Minitab® 17 Statistical Software [36]. As shown in Table 2, the bottom zone generally exhibited higher roughness values than the top zone across all descriptors.
The empirical regression models obtained for the four roughness descriptors, as a function of the process parameters (expressed in coded values), are presented in Table 3. The insignificant factors effects and interactions were identified by carrying out a Multifactor ANOVA. The coefficient of determination (R2) indicates how well each model reproduces the experimental data. All models achieved high R² values (>92%) and correspondingly high adjusted R² values (>88%), confirming both a strong and reliable fit between the process parameters and the measured surface texture parameters.
As an example, the predicted and experimentally measured mean values are compared in Table 4, for both kerf zones and the parameter combination v = 100 mm/min, D = 0.76 mm, g = 200 mesh. The relative error was calculated as follows:
Eror [%] = (|Predicted − Experimental| / Experimental × 100) (5)
The good agreement between predicted and measured values, observed for all four roughness descriptors, with relative errors generally below 8%, confirms the validity and predictive accuracy of the mathematical models.
3.2. Analysis of the Influence of Technological Parameters
Figure 6 presents the standardized Pareto charts of the effects for the four objective functions analyzed. The charts rank the factors and their interactions according to the magnitude of their standardized effects, with an effect considered statistically significant when its bar exceeds the reference line at the significance level α = 0.05.
For all four roughness descriptors, the factors exhibited the same order of influence: kerf zone, Z (D), had the strongest effect, followed by traverse speed, v (A), nozzle diameter, D (B), and abrasive mesh size, g (C), with all four main factors being statistically significant. The interactions between factors were generally not statistically significant for the roughness characteristics analyzed. The only exception was observed for Rsk (Figure 5b), where the interaction between nozzle diameter and abrasive mesh size (BC) exceeded the significance threshold, indicating that the combined effect of these two parameters significantly influences the skewness of the surface profile.
3.1.1. Influence of the Measurement Zone
Figure 7 presents the statistical distribution (boxplot) of the four roughness descriptors as a function of the kerf zone analyzed. For all four parameters, the bottom zone exhibits higher median values than the top zone.
Regarding the spread of the measured values, the maximum profile peak height (Rp, Figure 7a), skewness (Rsk, Figure 7b), and arithmetic mean slope (Rda, Figure 7d) show similar distributions in the top and bottom zones, although their overall values increase toward the bottom zone. In contrast, the mean width of profile elements (RSm, Figure 7c) shows a much wider range of values in the bottom zone, indicating greater differences in the surface morphology.
Overall, RSm appears to be the descriptor most sensitive to the changes in surface morphology between the top and bottom zones. This behavior may be related to the more irregular striation pattern toward the lower part of the kerf, where jet deflection and attenuation can contribute to changes in the local surface morphology.
3.1.2. Influence of Traverse Speed
As shown in Figure 8, increasing the traverse speed from 100 to 500 mm/min resulted in higher values for all four roughness descriptors (Rp, Rsk, RSm, and Rda)—a trend widely consistent with previous studies on fiber-reinforced polymers [17,28,29,31,37]. A higher traverse speed reduces the interaction time between the jet and the workpiece, lowering the impact energy flow per unit length and decreasing trajectory overlap. This diminishes the jet's cutting capacity, causes non-uniform material removal, and amplifies jet deflection toward the bottom zone, ultimately driving up all profile descriptors.
3.1.3. Influence of Focusing Tube Diameter
Increasing the focusing tube diameter from 0.76 to 1.00 mm resulted in higher values of all four roughness descriptors (Figure 9) a trend consistent with our previous findings [28, 29, 31]. A smaller diameter reduces the jet impact area and generates more closely spaced abrasive-particle trajectories, increasing specific energy (per unit area) and favoring a smoother surface. Conversely, a larger diameter disperses the jet action and reduces overlap between erosion trajectories, leading to less uniform material removal, local differences in matrix erosion and fibre separation, and a simultaneous increase in all profile descriptors.
3.1.4. Influence of Abrasive Grain Size
Decreasing the abrasive grain size from 100 to 200 mesh # resulted in lower values of the roughness descriptors (Figure 10) — consistent with our previous findings on Kevlar-reinforced polymers [28,29,31]. A finer grain size increases the number of impacting particles at a given flow rate, creating denser, more overlapping erosion trajectories. This initiates closely spaced micro-cracks and limits the size of machining traces, whereas coarser particles (lower mesh #) produce fewer, more widely spaced impacts that drive up the profile descriptors.
3.1.5. Correlation Between Roughness Descriptors
Figure 11 shows the correlation matrix between the four roughness descriptors investigated, Rp, Rsk, RSm, and Rda. Since these descriptors were selected to capture different aspects of the cut-surface profile — height, asymmetry, spacing, and defect density, respectively — it is important to verify to what extent they actually provide independent information, or whether some of them simply reproduce the same trend under a different name.
The strong correlation observed here between all four descriptors (r = 0.856–0.944, n = 32), including a shape parameter (Rsk) and a spacing parameter (RSm), contrasts with the pattern reported by Huang et al. [26] for GH4720Li nickel-based superalloy specimens produced under four distinct surface states (electrical discharge machining, longitudinal polishing, shot peening, and shot peening followed by stress-relief annealing). In their study, height-related parameters (Rp, Rv, Rt, Rz, Ra, Rq) correlated strongly among themselves but were essentially uncorrelated with skewness, kurtosis, and spacing, since each surface-generation process altered a distinct aspect of the topography independently — e.g., polishing reduced amplitude without changing spacing, while shot peening increased both through the formation of larger, more widely spaced impact craters.
In the present study, by contrast, all four descriptors respond jointly to the same AWJC process parameters (v, D, g), which act simultaneously on a single material-removal mechanism. An increase in traverse speed or focusing tube diameter reduces the overlap of abrasive-particle trajectories and lowers the specific kinetic energy delivered to the surface, concurrently increasing profile height (Rp), erosion asymmetry (Rsk), mean spacing (RSm), and defect density (Rda). Since a single mechanism governs all four descriptors, they remain strongly inter-correlated.
3.1.6. Spatial Mapping and Multi-Response Optimization of Surface Texture
In this section, Response Surface Methodology (RSM) was employed on the one hand to visualize the influence of all three technological parameters on the analyzed roughness descriptors, and on the other hand to achieve a global characterization of the surface texture by identifying a set of parameters in the multi-factor space where process performances simultaneously satisfy given constraints.
For this purpose, Statgraphics® Centurion XVI software was used to generate 3D Response Surface Mesh plots for each roughness parameter (Figure 12). Unlike a conventional 3D surface plot, where the response is plotted against two input factors, this visualization type enables the representation of a response variation within a cubic domain defined by three independent factors simultaneously. Thus, it was possible to plot the roughness parameters as a function of all three technological variables, allowing for a rapid identification of their influence.
For instance, Figure 12d illustrates the spatial distribution of the profile mean slope, Rda [deg], as a function of the three selected experimental factors for the top roughness region. The Rda value is color-coded using an isoclinic color map (legend on the right). Since the transition from blue (left) to red (right) occurs almost parallel to the v-axis, traverse speed is confirmed as the dominant parameter. At a constant speed v, an increase in the diameter D contributes to a slight increase in Rda (warm colors shift further to the left for higher D values). Conversely, the vertical color gradient is minimal (color lines are nearly vertical), indicating a minor effect of the grain size g on the plotted roughness parameter.
Subsequently, desirability plots were generated using the same software by overlaying the constant contour lines of the four roughness parameters, aimed at tracking the influence of v and g on these descriptors (Figure 13). The plotted lines represent isoclinic thresholds (constant values) for each parameter, while the slope of the lines serves as a measure of the magnitude of the traverse speed's influence on them.
Such plots allow for the identification of the optimal operating window based on the technological requirements. If the goal is to maintain the parameters within a specific range, the area between the isoclinic lines represents the combination of parameters (v, g) that simultaneously satisfies the imposed surface quality requirements, effectively achieving a multi-response optimization.
3.3. Investigation on Kerf Surface Morphology
Morphological characterization of the cut regions was performed using a Nikon SMZ745T stereomicroscope featuring a plan achromatic optical design and integrated LED illumination, providing the necessary working distance for detailed examination of the Kevlar fibers.
Figure 14 presents a macroscopic comparison of the cut-surface morphology at the jet entrance (top) and exit (bottom) for a representative specimen under high-speed machining conditions. The top surface (Figure 14a) maintains a compact and relatively regular structure, whereas the bottom surface (Figure 14b) exhibits pronounced diagonal striations and a less regular surface structure, indicating a less uniform material removal process toward the jet exit. This difference between the top and bottom surfaces can be associated with the progressive attenuation and deflection of the abrasive waterjet as it penetrates the composite thickness. This interpretation is in agreement with the depth-of-penetration model proposed by Wang and Guo [38] for AWJC of polymer matrix composites, which describes a decrease in the jet cutting capability with increasing penetration depth and provides a possible explanation for the less regular surface morphology observed near the kerf exit.
Figure 15 provides progressively magnified views of the bottom zone of the same specimen. Fiber bundles protruding from the kerf surface are visible at low magnification (Figure 15a), while increasingly pronounced diagonal striations can be observed at intermediate magnifications (Figure 15b–c). At higher magnification (Figure 15d), finer morphological features become visible, revealing local irregularities and exposed fiber regions. These observations are consistent with our previous macroscopic investigations of KFRP kerf surfaces, where minor fiber pull-out at the jet exit side was reported for several specimens [29], and where delamination and fiber–matrix debonding were found to be more pronounced for cutting regimes associated with a larger focusing tube diameter [28,29].
Similar morphological features, including increased surface irregularity, protruding fibers, grooves, and fibrillation, have also been reported for mechanically degraded Kevlar-reinforced composites [21], as well as for other machining processes applied to Kevlar-reinforced composites, such as drilling [7,8], further supporting the susceptibility of Kevlar yarns to morphological changes when the fiber surface and inter-yarn structure are mechanically disturbed.
For comparison, Figure 16 presents the same multi-scale analysis for a specimen machined at low traverse speed and focusing tube diameter. In this case, the fabric structure remains compact and regular in both the top (Figure 16a) and bottom zones (Figure 16b), showing substantially less disorganization than that observed in Figure 14b.
Figure 17 presents images of the cut surface at various magnifications, revealing a structure where the fabric pattern remains clearly distinct and uniform, with no significant fraying, fiber pull-out, or localized disruptions of the reinforcement.
This qualitative observation is consistent with the broader quantitative trends, where lower traverse speeds combined with lower focusing tube diameter associated with finer abrasive particles resulted in lower values of Rp, Rsk, RSm, and Rda. Taken together, these results indicate that, within the investigated parameter range, this combination of cutting conditions is associated with a less pronounced top–bottom difference in surface morphology and a more regular cut-surface structure. This combination also matches the optimum parameter set identified in our previous studies of KFRP machined by AWJC for minimizing surface roughness and kerf taper angle [28,29,30,31].
Figure 18 provides a conceptual summary of these findings, illustrating the distinct morphological zones that develop under unfavorable machining conditions.
4. Conclusions
Following the experimental investigation carried out, the main conclusions can be drawn:
- To complement the study on the influence of abrasive water jet cutting parameters on the surface quality of the cut Kevlar, less-studied roughness descriptors were chosen, namely those characterizing maximum peak height (Rp), profile skewness (Rsk), mean spacing of irregularities (RSm), and mean profile slope (Rda).
- Within the investigated experimental domain, all adjusted input parameters exhibit a statistically significant influence on the four roughness descriptors.
- The four descriptors are strongly intercorrelated (r = 0.856–0.944), reflecting a single underlying material removal mechanism, unlike results reported in the literature for other materials, where height and shape parameters remain independent [26].
- Empirical models with coefficients of determination of 92% or higher were established for all descriptors, enabling the generation of overlaid contour plots to evaluate simultaneously the combined effects of the parameters on all roughness descriptors investigated.
- Visual and morphological analysis reveals a clear distinction between the cut zones: the top zone is characterized by a smooth texture and a uniform profile dominated by micro-machining, while the bottom zone exhibits a rougher texture, diagonal striations, and local irregularities.
- The combination of a low feed rate, a small focusing tube diameter, and a fine abrasive grit size yielded the most regular morphology and the lowest descriptor values, representing the optimal parameter set for a favorable finish and reduced susceptibility to fiber damage.
Author Contributions
For research articles with several authors, a short paragraph specifying their individual contributions must be provided. The following statements should be used “Conceptualization, A.-A.H. and D.-V.G.; methodology, D.-V.G and A.-A.H.; software, A.-A.H. and D.-V.G.; validation A.-A.H. and D.-V.G..; formal analysis, D.-V.G. and A.-A.H.; investigation, D.-V.G. and A.-A.H.; data curation, A.-A.H.; writing—original draft preparation, A.-A.H.; writing—review and editing, D.-V.G. and A.-A.H.; visualization, A.-A.H. and D.-V.G.; supervision, D.-V.G. All authors have read and agreed to the published version of the manuscript.
Funding
This research received no external funding.
Data Availability Statement
Not applicable.
Acknowledgments
The authors gratefully acknowledge Duqueine Composites (Timișoara) for supplying the material and providing access to their AWJC facilities for this experimental work.
Conflicts of Interest
The authors declare no conflicts of interest.
References
- DuPont. What is Kevlar®? DuPont de Nemours, Inc. Available online: https://www.dupont.com/what-is-kevlar.html (accessed on 18 August 2026).
- Canceco de la Cruz, R.A.; Carreño Gallardo, C.; Diaz Diaz, A.; Zuñiga Aviles, L.A.; Plascencia Barrera, G.; Herrera Ramirez, J.M. In-Plane Mechanical Characterization of a Kevlar® Composite. Fibers 2024, 12, 38. [Google Scholar] [CrossRef]
- Chowdhury, S.C.; Sockalingam, S.; Gillespie, J.W. Molecular Dynamics Modeling of the Effect of Axial and Transverse Compression on the Residual Tensile Properties of Ballistic Fiber. Fibers 2017, 5, 7. [Google Scholar] [CrossRef]
- Ursache, Ș.; Cerbu, C.; Hadăr, A. Characteristics of Carbon and Kevlar Fibres, Their Composites and Structural Applications in Civil Engineering—A Review. Polymers 2024, 16, 127. [Google Scholar] [CrossRef] [PubMed]
- Kondor, I.P.; Líska, J.; Kovács, Z.F. Ballistic Performance of Lightweight Armor Aramid Fabric with Different Bounding Technologies. Fibers 2025, 13, 106. [Google Scholar] [CrossRef]
- Murugesan, V.; Bhaskar, G.B.; Madhan, A. Influence of Thermoplastic Matrix on the Mechanical Behavior of Hybrid Carbon–Kevlar Fiber Reinforced Composites for Aerospace Applications. Cureus J. Eng. 2026. [Google Scholar] [CrossRef]
- Baharlooey, D.; Abootorabi, M.M. Defects in the Kevlar-epoxy thin layer sheet drilling with different machining strategies. Polym. Polym. Compos. 2021, 29(7), 909–918. [Google Scholar] [CrossRef]
- Pathak, S.R.; Malik, A.; Mali, H.S. Hole Quality Assessment During Drilling of Carbon-Kevlar Hybrid Textile Composite Considering Matrix and Tool Geometry Effect. Polym. Compos. 2026, 1–22. [Google Scholar] [CrossRef]
- Saravanan, S.; Vijayan, V.; Jaya Suthahar, S.T.; Balan, A.V.; Sankar, S.; Ravichandran, M. A review on recent progresses in machining methods based on abrasive water jet machining. Mater. Today Proc. 2020, 21, 116–122. [Google Scholar] [CrossRef]
- Xue, X.; Salenko, O.; Habuzian, H.; Havrushkevych, A. A Review of Abrasive Water Jet Cutting Technology for Composite Materials. Mech. Adv. Technol. 2025, 9(3(106)), 372–385. [Google Scholar] [CrossRef]
- Sambruno, A.; Gómez-Parra, Á.; Márquez, P.; Tellaeche-Herrera, I.; Batista, M. Evaluation of Peripheral Milling and Abrasive Water Jet Cutting in CFRP Manufacturing: Analysis of Defects and Surface Quality. Fibers 2024, 12, 78. [Google Scholar] [CrossRef]
- Rowe, A.; Pramanik, A.; Basak, A.K.; Prakash, C.; Subramaniam, S.; Dixit, A.R.; Radhika, N. Effects of Abrasive Waterjet Machining on the Quality of the Surface Generated on a Carbon Fibre Reinforced Polymer Composite. Machines 2023, 11, 749. [Google Scholar] [CrossRef]
- Veljković, D.Ž.; Baralić, J.; Janković, P.; Dučić, N.; Savković, B.; Jovičić, A. The Influence of Operating Pressure Oscillations on the Machined Surface Topography in Abrasive Water Jet Machining. Materials 2025, 18, 3570. [Google Scholar] [CrossRef] [PubMed]
- Palanikumar, K.; Prabhudass¹, J.M.; Prabha, P.S.; Senthilkumar, N. Sustainable optimization of abrasive water jet machining for MWCNT/bamboo/Kenaf hybrid polymer composites. Int. J. Interact. Des. Manuf. 2025, 19, 3765–3782. [Google Scholar] [CrossRef]
- Bekal, S.M.; Hiremath, A.; B. R. N., M.; K., S.; S. R., H.; B. M., G.; M. C., G.S. Optimization of Process Parameters for Minimum Kerf Taper Angle and Surface Roughness in the Abrasive Water Jet Machining of a Hybrid Composite. J. Compos. Sci. 2025, 9, 604. [Google Scholar] [CrossRef]
- Siddiqui, T.U.; Shukla, M. Optimisation of surface finish in abrasive water jet cutting of Kevlar composites using hybrid Taguchi and response surface method. Int. J. Mach. Mach. Mater. 2008, 3, 382–402. [Google Scholar] [CrossRef]
- Azmir, M.A.; Ahsan, A.K.; Rahmah, A. Effect of abrasive water jet machining parameters on aramid fibre reinforced plastics composite. Int. J. Mater. Form. 2009, 2, 37–44. [Google Scholar] [CrossRef]
- Murthy, B.R.N.; Makki, E.; Potti, S.R.; Hiremath, A.; Bolar, G.; Giri, J.; Sathish, T. Optimization of Process Parameters to Minimize the Surface Roughness of Abrasive Water Jet Machined Jute/Epoxy Composites for Different Fiber Inclinations. J. Compos. Sci. 2023, 7, 498. [Google Scholar] [CrossRef]
- Lavanya, M. Integrating AWJ Process Parameters with Ensemble Learning Techniques (RF & XG Boost) for Accurate Surface Roughness Prediction in Hemp Fibre Polymer Composites. IEEE Madhya Pradesh Section Conference (MPCON), Gwalior, India, 2026; pp. pp. 457–463. [Google Scholar] [CrossRef]
- Płodzień, M.; Żyłka, Ł.; Żak, K.; Wojciechowski, S. Modelling the Kerf Angle, Roughness and Waviness of the Surface of Inconel 718 in an Abrasive Water Jet Cutting Process. Materials 2023, 16, 5288. [Google Scholar] [CrossRef] [PubMed]
- Brăileanu, P.I.; Mocanu, M.-T.; Pascu, N.E. Profilometric Quantification of Wear-Track Degradation in FFF Kevlar-Reinforced ASA Composites. Materials 2026, 19, 2135. [Google Scholar] [CrossRef] [PubMed]
- Sedlaček, M.; Podgornik, B.; Vižintin, J. Influence of surface preparation on roughness parameters, friction and wear. ISSN 0043-1648 2009, Volume 266(Issues 3–4), Pages 482–487. [Google Scholar] [CrossRef]
- Alsoufi, M. S.; Suker, D. K.; Alsabban, A. S.; Azam, S. Experimental Study of Surface Roughness and Micro-Hardness Obtained by Cutting Carbon Steel with Abrasive WaterJet and Laser Beam Technologies. Am. J. Mech. Eng. 2016, 4(5), 173–181. [Google Scholar] [CrossRef]
- Menezes, P.L.; Kishore; Kailas, S.V. Influence of roughness parameters on coefficient of friction under lubricated conditions. Sadhana 2008, 33, 181–190. [Google Scholar] [CrossRef]
- Radziejewska, J.; Marczak, M.; Maj, P.; Głowacki, D. The Influence of Vibro-Assisted Abrasive Processing on the Surface Roughness and Sub-Surface Microstructure of Inconel 939 Specimen Made by LPBF. Materials 2023, 16, 7429. [Google Scholar] [CrossRef] [PubMed]
- Huang, H.; Wang, T.; Mao, J.; Hu, D.; Pan, J.; Zhang, X.; Chen, G.; Wang, R. Mechanism Investigation on the Surface Integrity Influence on Fretting Wear. Advances Transdiscipl. Eng. 2026, Volume 87: Mechanical and Aerospace Engineering, 143–158. [Google Scholar] [CrossRef]
- Hlaváčová, I.M.; Sadílek, M.; Váňová, P.; Szumilo, Š.; Tyč, M. Influence of Steel Structure on Machinability by Abrasive Water Jet. Materials 2020, 13, 4424. [Google Scholar] [CrossRef] [PubMed]
- Gubencu, D.V.; Opriș, C.; Han, A.A. Analysis of Kerf Quality Characteristics of Kevlar Fiber-Reinforced Polymers Cut by Abrasive Water Jet. Materials 2023, 16, 2182. [Google Scholar] [CrossRef] [PubMed]
- Gubencu, D.V.; Opris, C.; Han, A.; Lazar, C. O.; Perianu, I. A. Experimental Study of Kerf Surface Finish of Abrasive Water-Jet Cutting of Kevlar Fiber-Reinforced Polymers. Key Eng. Mater. 2023, 952, 69–80. [Google Scholar] [CrossRef]
- Gubencu, Dinu-Valentin. Experimental Investigation for the Prediction of Surface Roughness Height Parameters in Abrasive Water Jet Cutting of Kevlar/epoxy Composites. Mater. Plast. 2023, 60.3, 94–105. [Google Scholar] [CrossRef]
- Gubencu, D.V.; Lazar, C. O. Experimental modeling of abrasive water-jet cutting processes of Kevlar fiber-reinforced polymer composites. J. Phys.: Conf. Ser. 2540 012044. 2023. [Google Scholar] [CrossRef]
- Available online: http://gmagarnet.com/en/our-garnet (accessed on 14 August 2026).
- Hobson, Taylor. Surtronic 25 User’s Guide, K505/125-01, Issue 4; Taylor Hobson Ltd.: Leicester, UK.
- ISO 4288:1996; Geometrical Product Specifications (GPS)—Surface Texture: Profile Method—Rules and Procedures for the Assessment of Surface Texture. International Organization for Standardization: London, UK, 1996.
- Montgomery, D.C. Design and Analysis of Experiments, 5th ed.; John Wiley and Sons: New York, NY, USA, 2001; pp. 218–276. [Google Scholar]
- Minitab, Inc. Minitab 17 Statistical Software: User’s Guide; Minitab, Inc.: State College, PA, USA.
- Murthy, B.R.N.; Rao U, S.; Naik, N.; Potti, S.R.; Nambiar S, S. A Study to Investigate the Influence of Machining Parameters on Delamination in the Abrasive Waterjet Machining of Jute-Fiber-Reinforced Polymer Composites: An Integrated Taguchi and Response Surface Methodology (RSM) Optimization to Minimize Delamination. J. Compos. Sci. 2023, 7, 475. [Google Scholar] [CrossRef]
- Wang, J.; Guo, D.M. A predictive depth of penetration model for abrasive waterjet cutting of polymer matrix composites. J. Mater. Process. Technol. 2002, 121, 390–394. [Google Scholar] [CrossRef]
- Roark, J.; Thomas, F.D.; Sockalingam, S.; Kempf, J.; Christy, D.; Haas, D.; O’Brien, D.J.; Senecal, K.J.; Crittenden, S.R. Experimental Investigation of the Influence of Metallic Coatings on Yarn Pull-Out Behavior in Kevlar® Fabrics. Fibers 2023, 11, 7. [Google Scholar] [CrossRef]
Figure 1.
Investigated KFRP material: (a) Kevlar® 29 plain-weave prepreg, (b) 18-ply KFRP laminate, (c) KFRP specimens cut by AWJC.
Figure 1.
Investigated KFRP material: (a) Kevlar® 29 plain-weave prepreg, (b) 18-ply KFRP laminate, (c) KFRP specimens cut by AWJC.
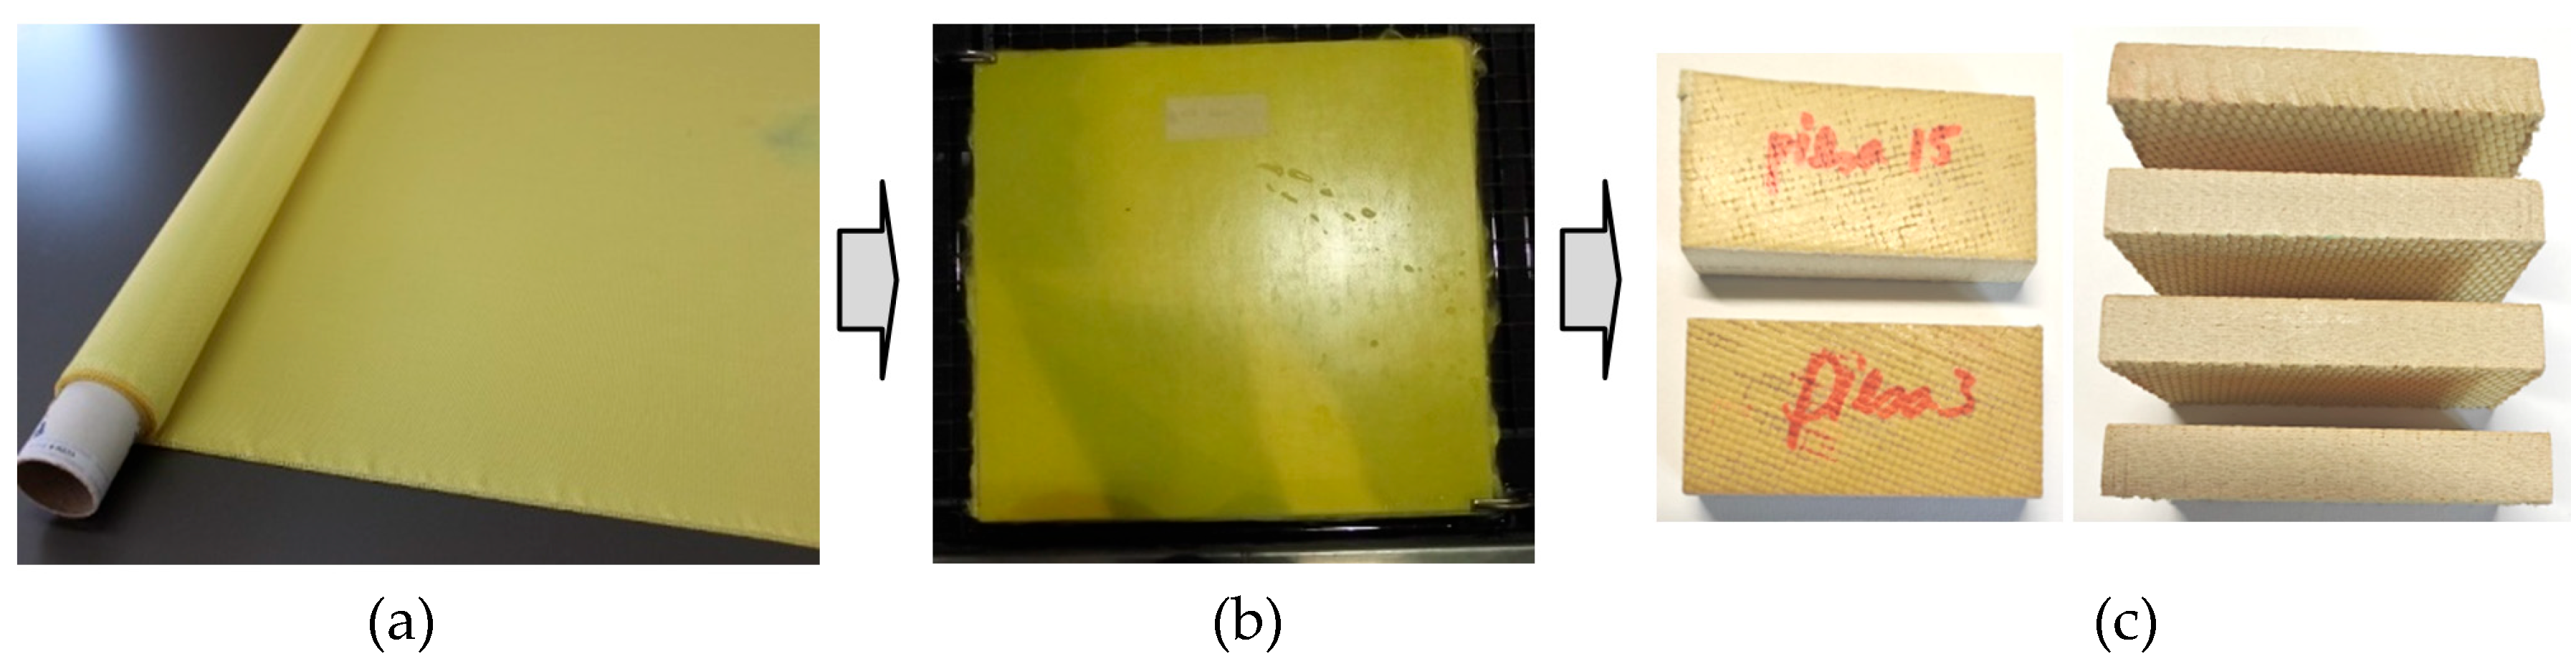
Figure 2.
CNC-controlled JEDO abrasive water jet machining system: (a) general view of the machining equipment; (b) detail of the cutting head; (c) schematic representation of the cutting head indicating the process variables considered in this study.
Figure 2.
CNC-controlled JEDO abrasive water jet machining system: (a) general view of the machining equipment; (b) detail of the cutting head; (c) schematic representation of the cutting head indicating the process variables considered in this study.
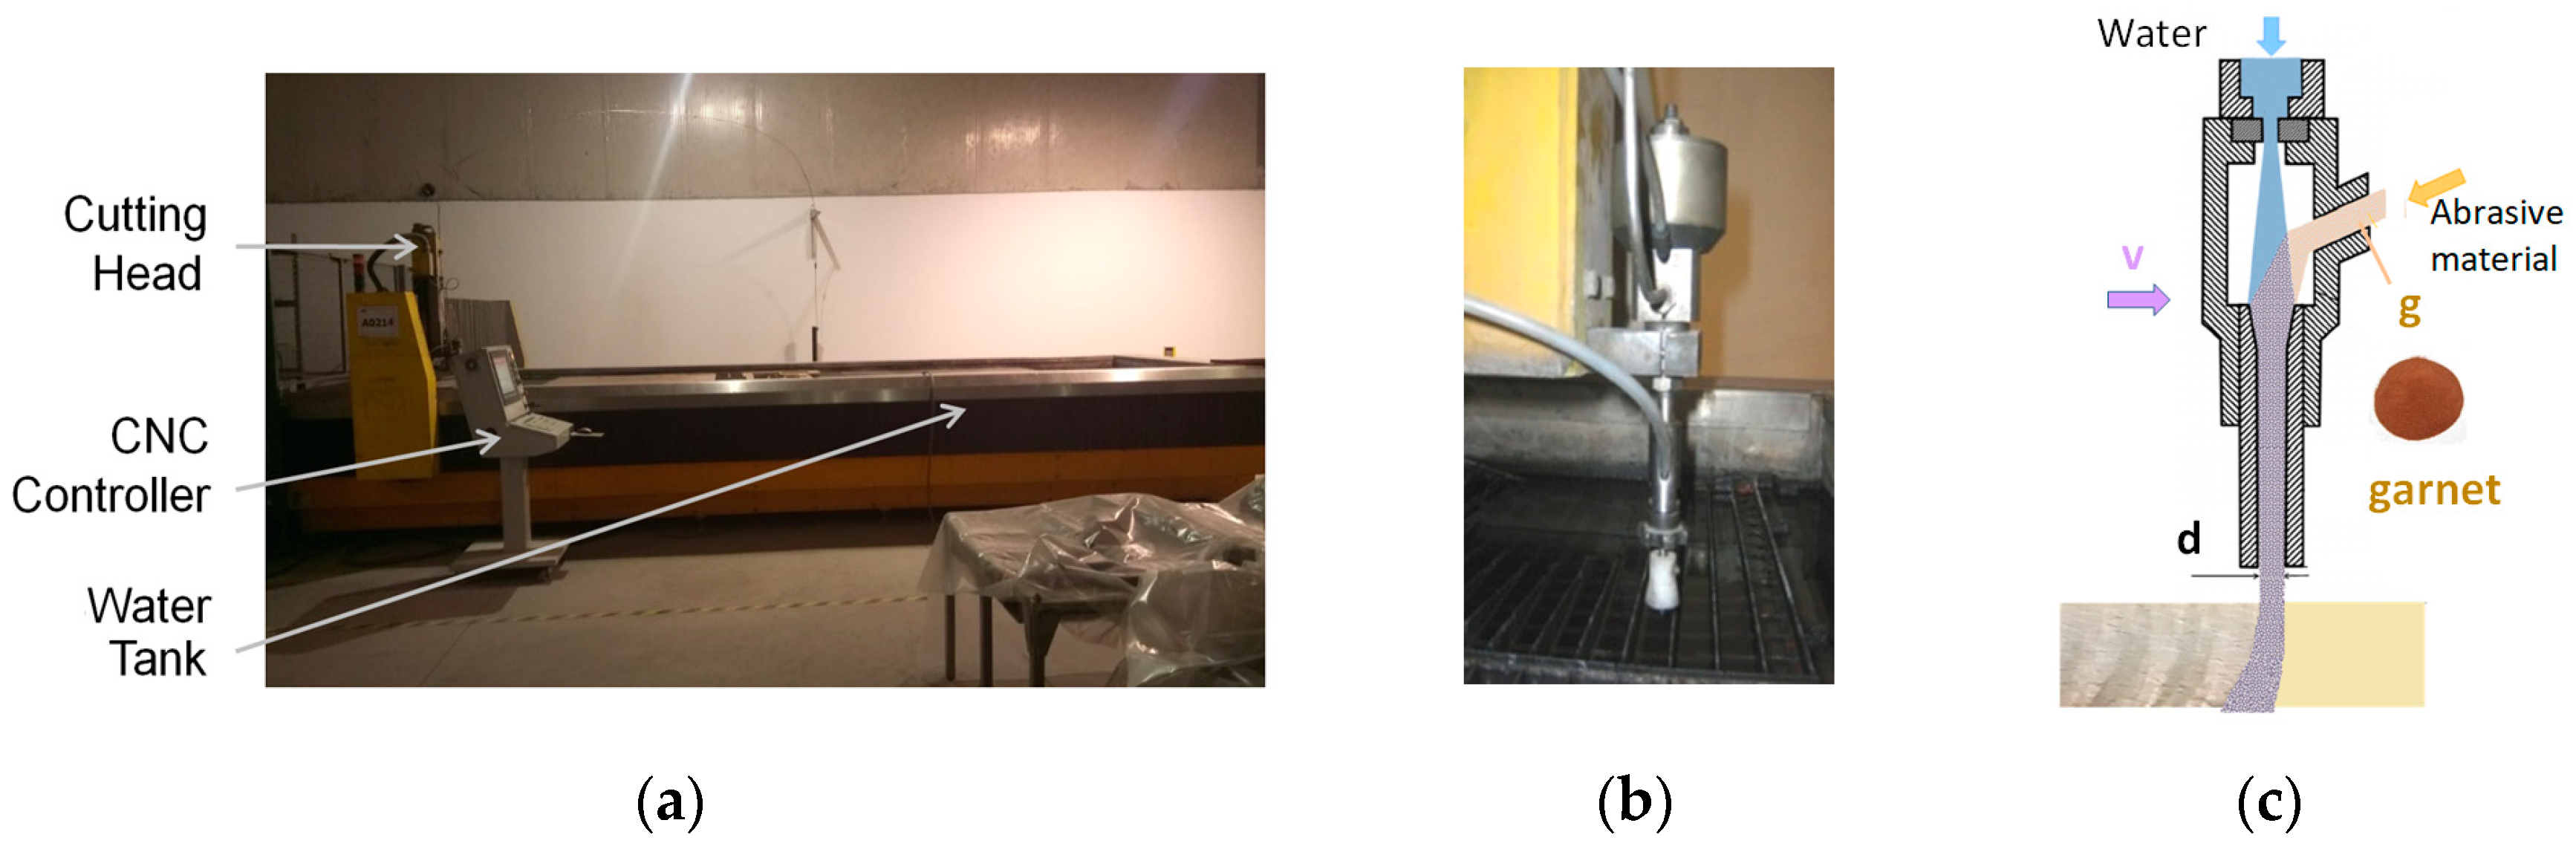
Figure 3.
Definition of the roughness descriptors used in this study.

Figure 4.
Experimental setup for roughness evaluation: (a) overview of the portable roughness tester and specimen mounting fixture, (b) top view of the laminate and detailed measurement areas for the top and bottom cutting zones.
Figure 4.
Experimental setup for roughness evaluation: (a) overview of the portable roughness tester and specimen mounting fixture, (b) top view of the laminate and detailed measurement areas for the top and bottom cutting zones.
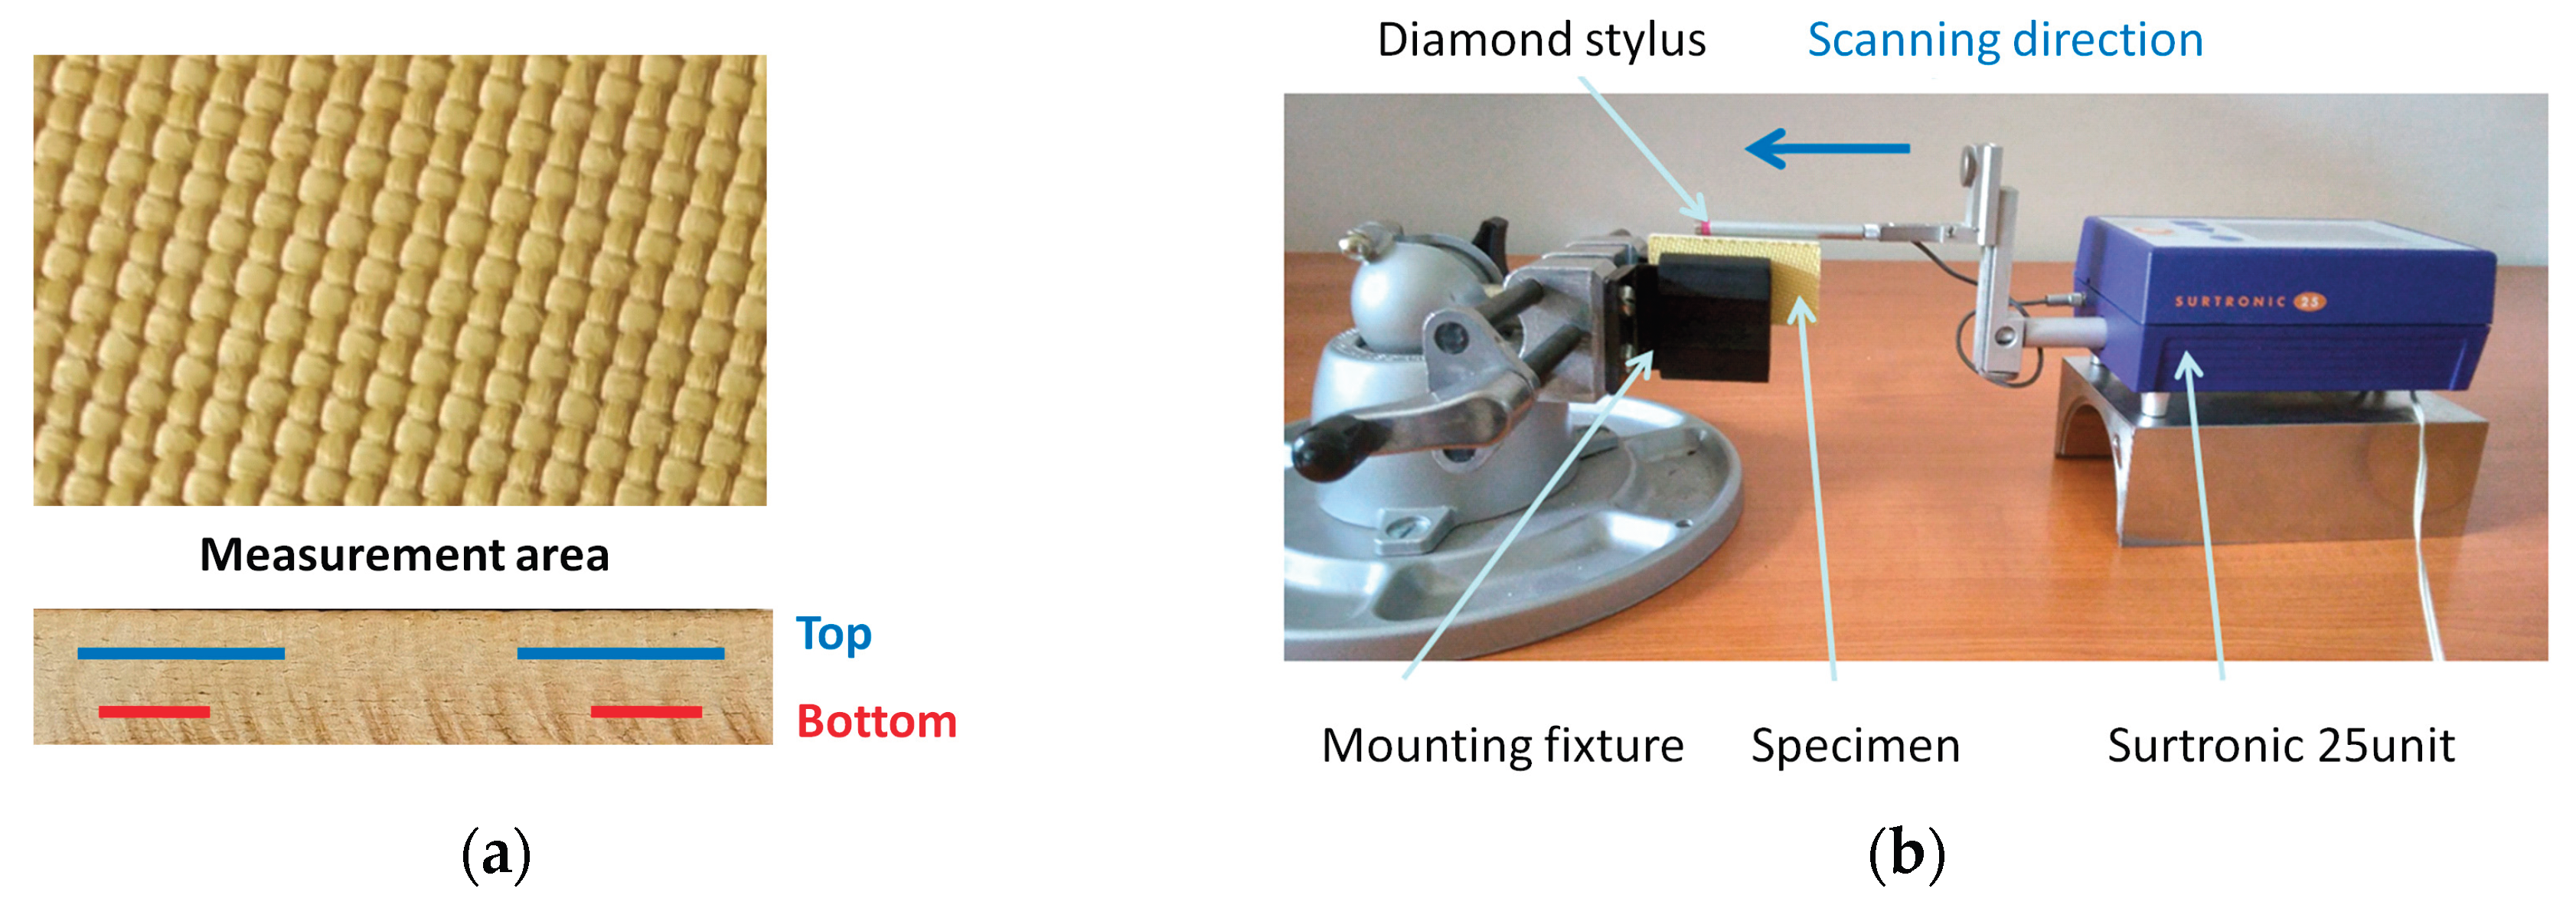
Figure 5.
Cybernetic model of the experiment.
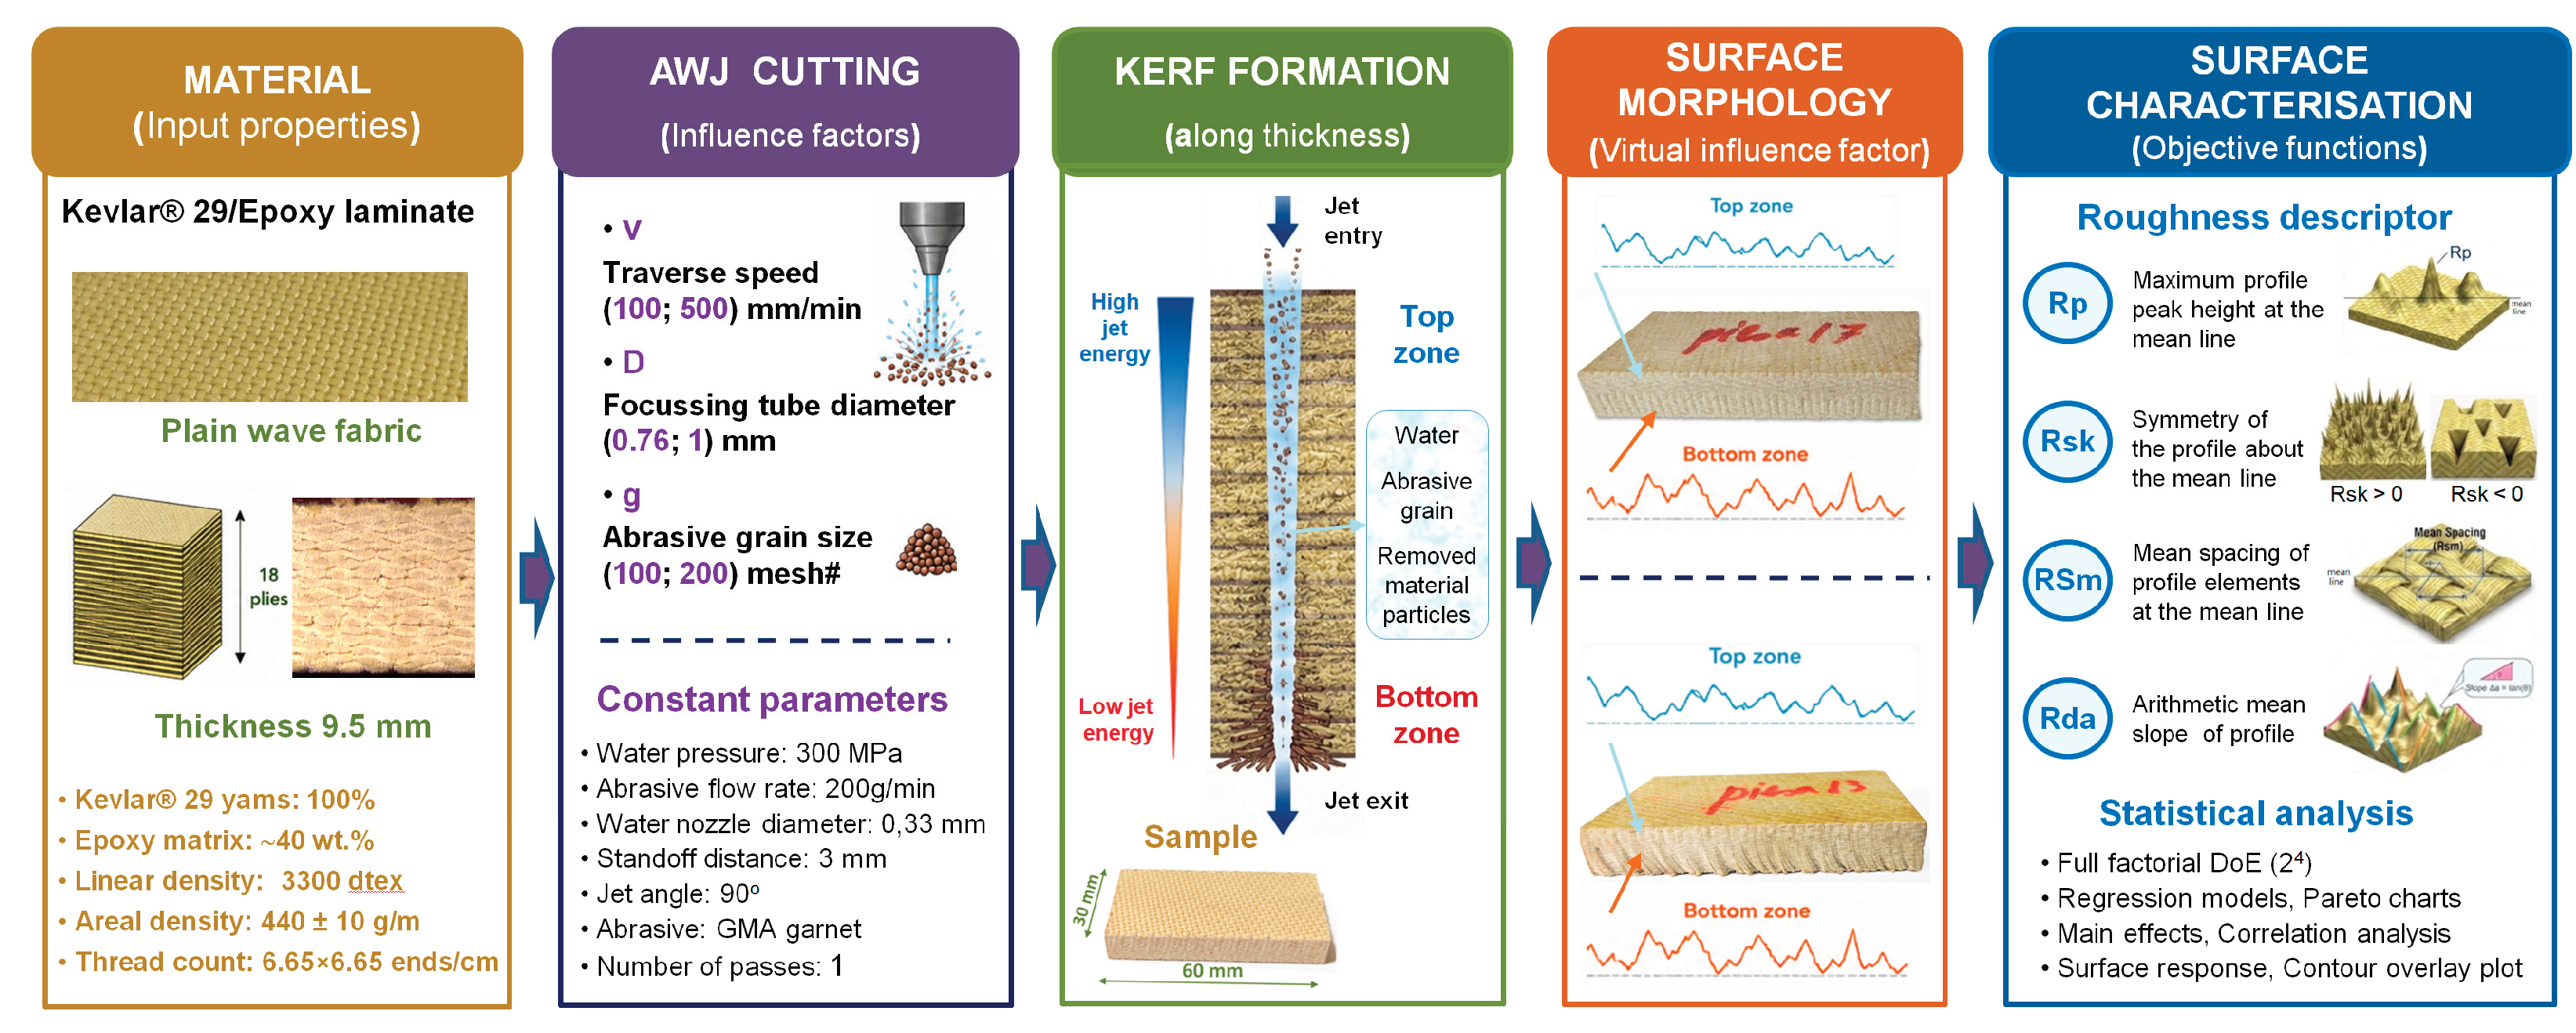
Figure 6.
Hierarchy of factors effects:(a) maximum profile peak height (Rp), (b) skewness (Rsk), (c) mean width of profile elements (RSm), (d) arithmetic mean slope (Rda).
Figure 6.
Hierarchy of factors effects:(a) maximum profile peak height (Rp), (b) skewness (Rsk), (c) mean width of profile elements (RSm), (d) arithmetic mean slope (Rda).
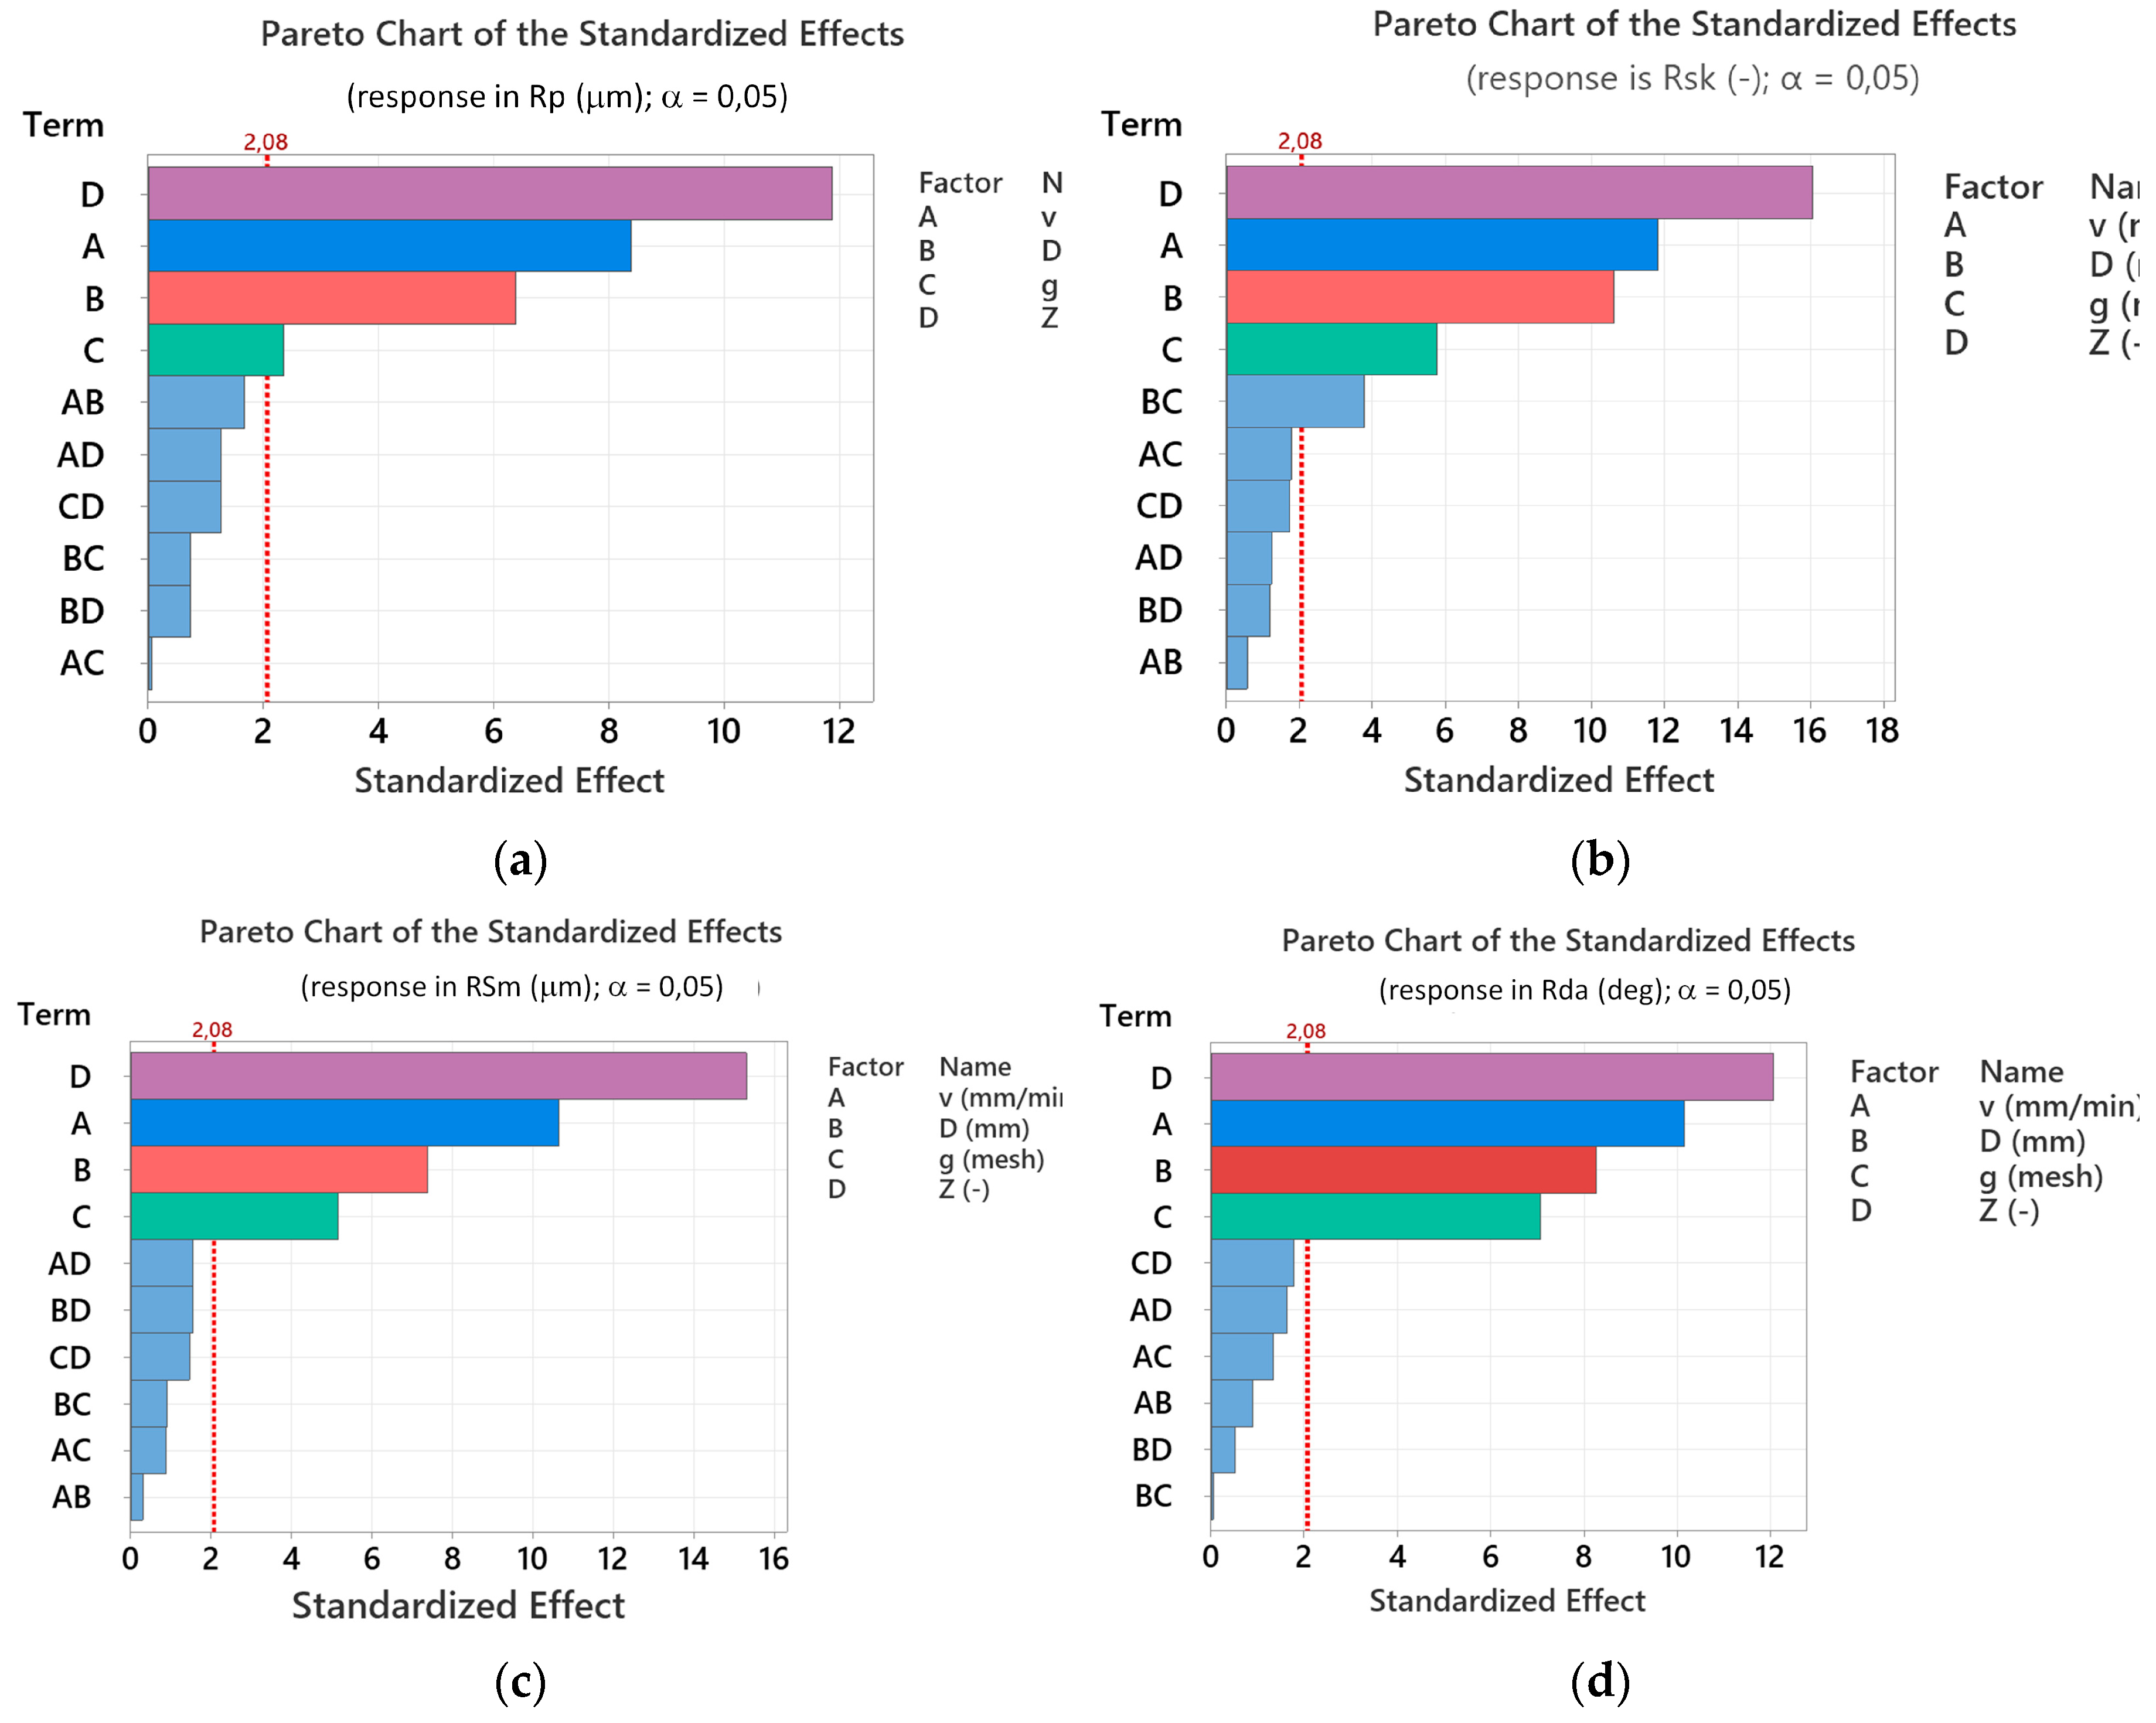
Figure 7.
Boxplot distribution of the roughness descriptors as a function of the kerf zone: (a) maximum profile peak height (Rp), (b) skewness (Rsk), (c) mean width of profile elements (RSm), (d) arithmetic mean slope (Rda).
Figure 7.
Boxplot distribution of the roughness descriptors as a function of the kerf zone: (a) maximum profile peak height (Rp), (b) skewness (Rsk), (c) mean width of profile elements (RSm), (d) arithmetic mean slope (Rda).
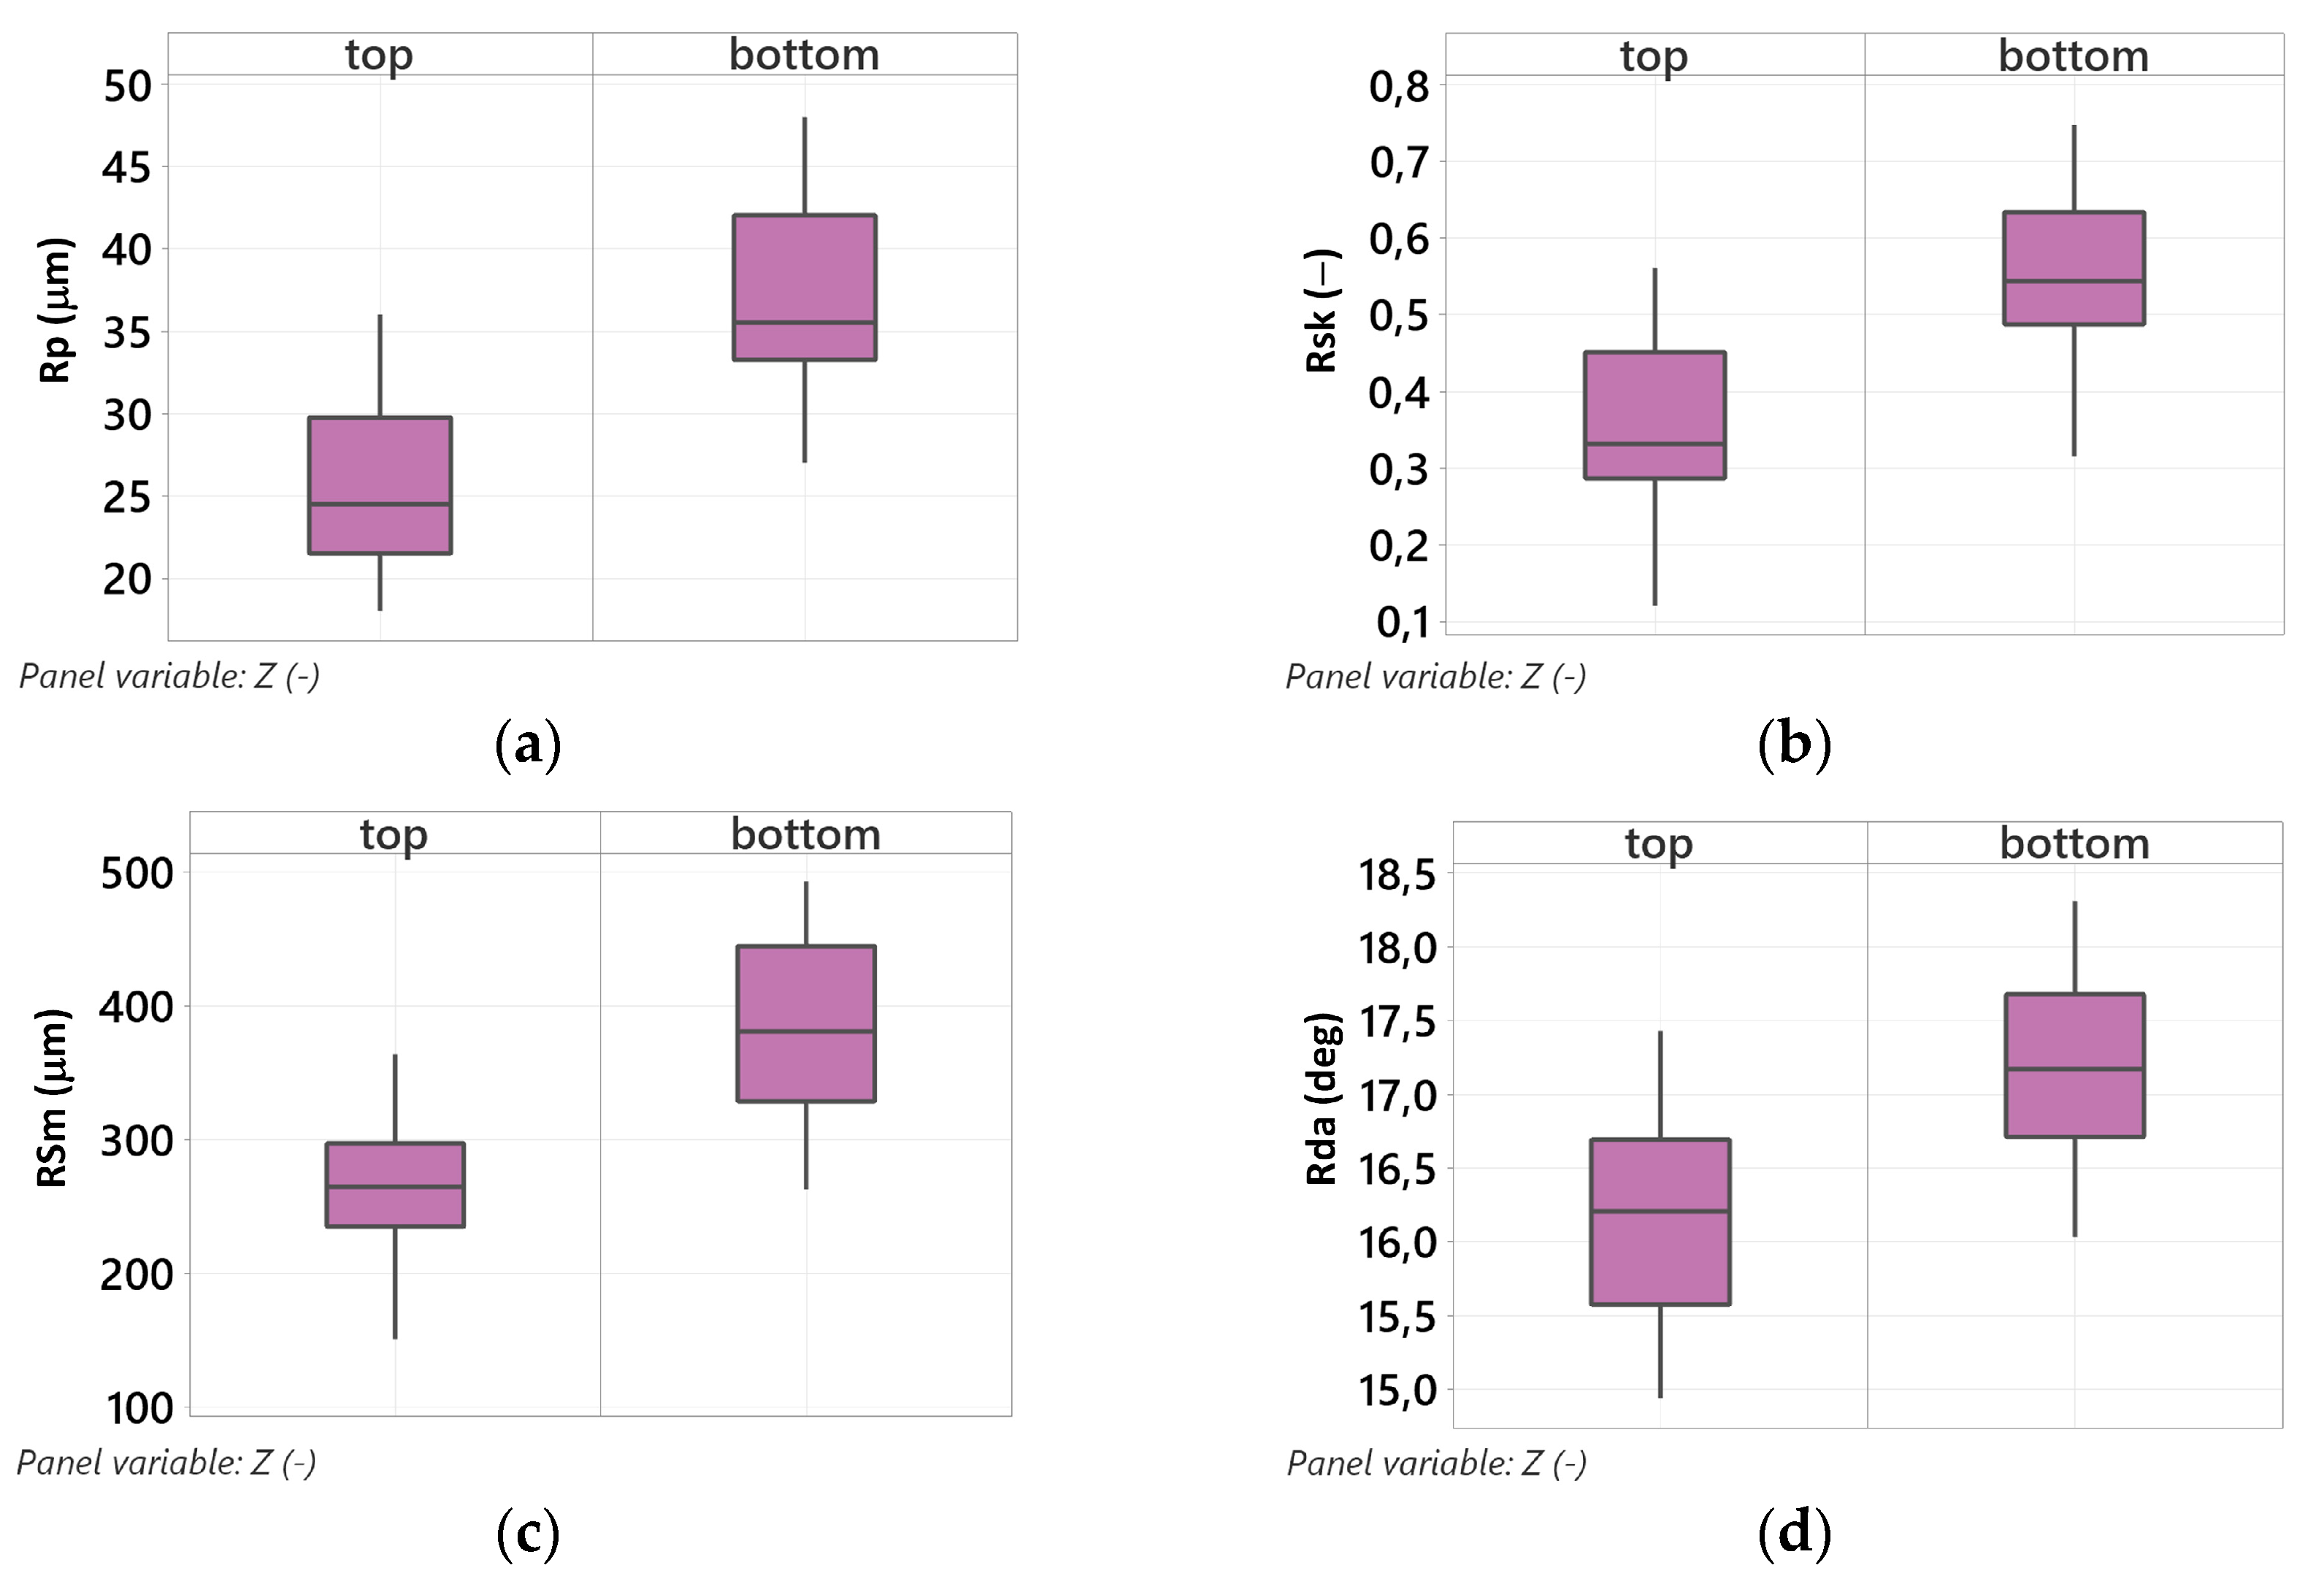
Figure 8.
Influence of traverse speed on the studied surface roughness descriptors: (a) maximum profile peak height (Rp), (b) skewness (Rsk), (c) mean width of profile elements (RSm), (d) arithmetic mean slope (Rda).
Figure 8.
Influence of traverse speed on the studied surface roughness descriptors: (a) maximum profile peak height (Rp), (b) skewness (Rsk), (c) mean width of profile elements (RSm), (d) arithmetic mean slope (Rda).
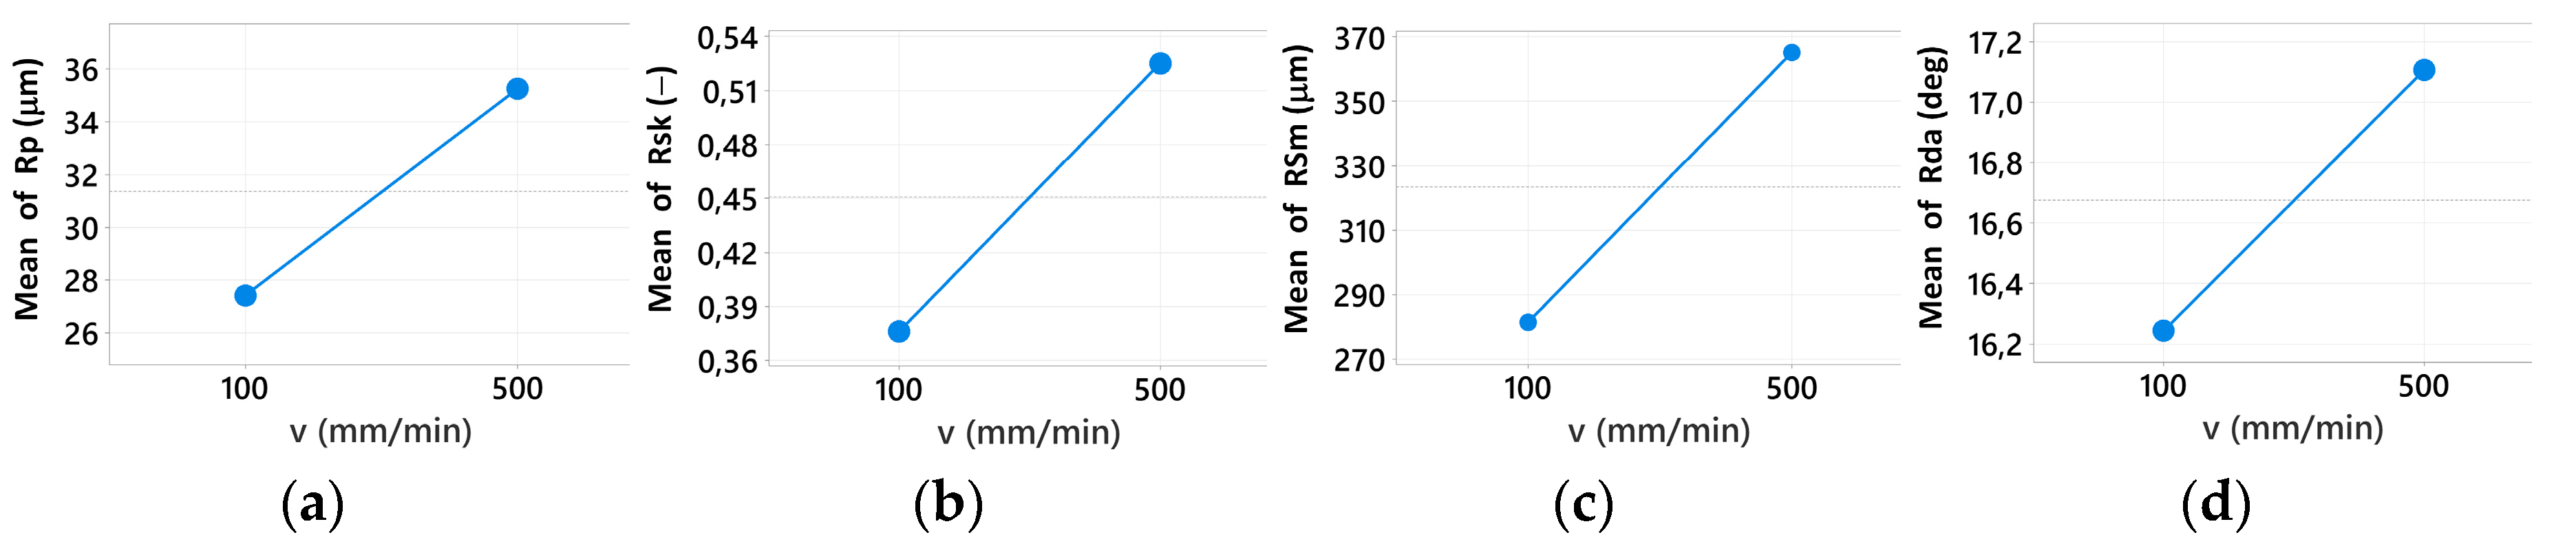
Figure 9.
Influence of focusing tube diameter on the studied surface roughness descriptors: (a) maximum profile peak height (Rp), (b) skewness (Rsk), (c) mean spacing of profile elements (RSm), (d) arithmetic mean slope (Rda).
Figure 9.
Influence of focusing tube diameter on the studied surface roughness descriptors: (a) maximum profile peak height (Rp), (b) skewness (Rsk), (c) mean spacing of profile elements (RSm), (d) arithmetic mean slope (Rda).
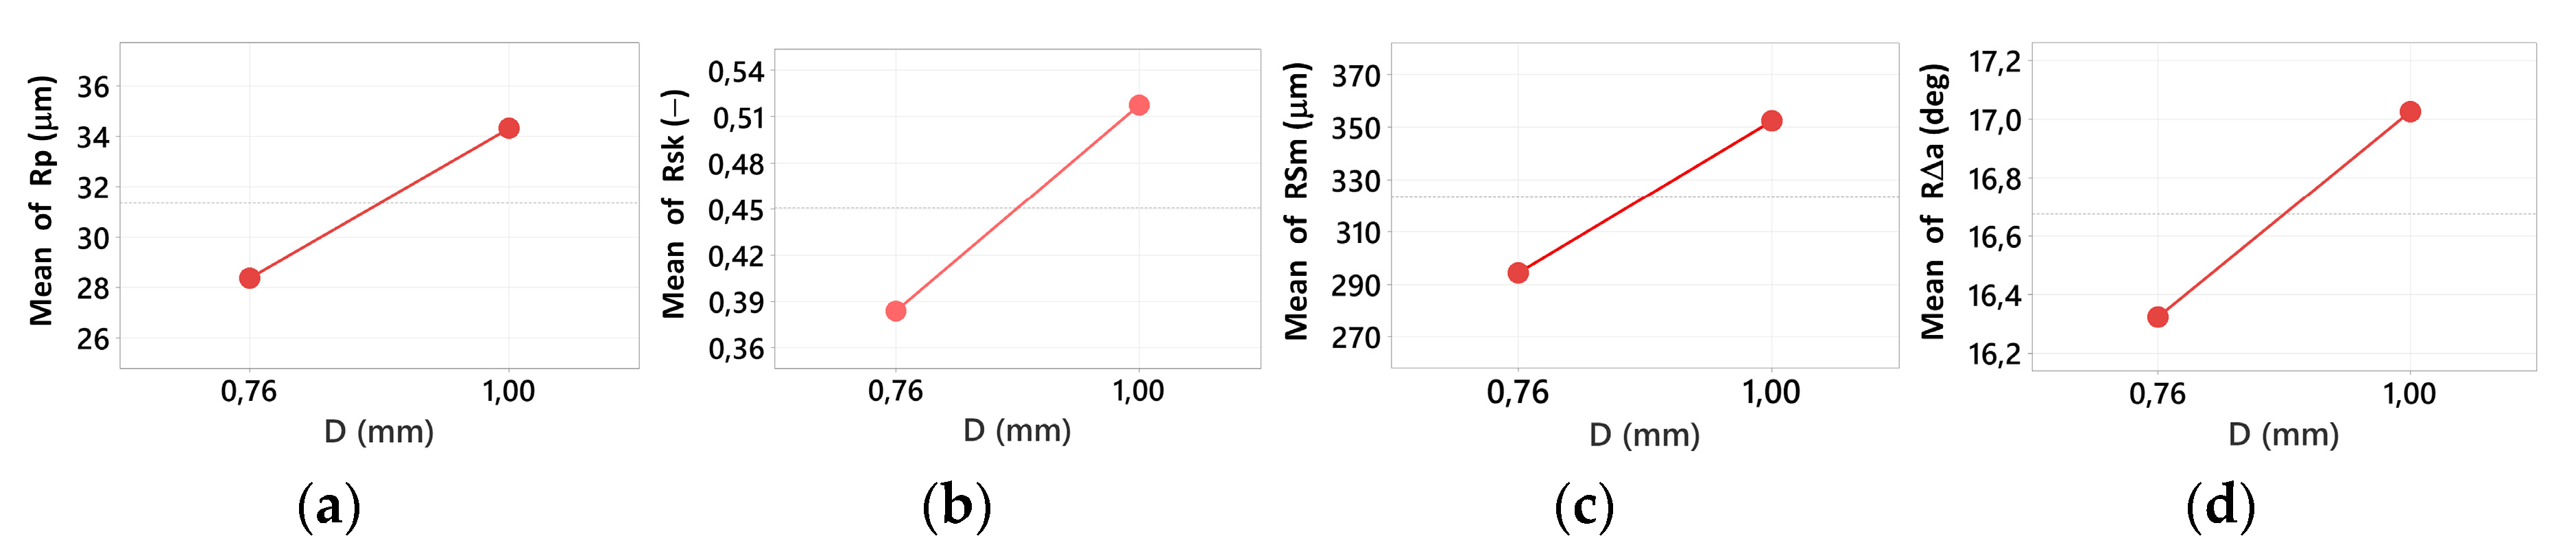
Figure 10.
Influence of abrasive grain size on the studied surface roughness descriptors: (a) maximum profile peak height (Rp), (b) skewness (Rsk), (c) mean width of profile elements (RSm), (d) arithmetic mean slope (Rda).
Figure 10.
Influence of abrasive grain size on the studied surface roughness descriptors: (a) maximum profile peak height (Rp), (b) skewness (Rsk), (c) mean width of profile elements (RSm), (d) arithmetic mean slope (Rda).
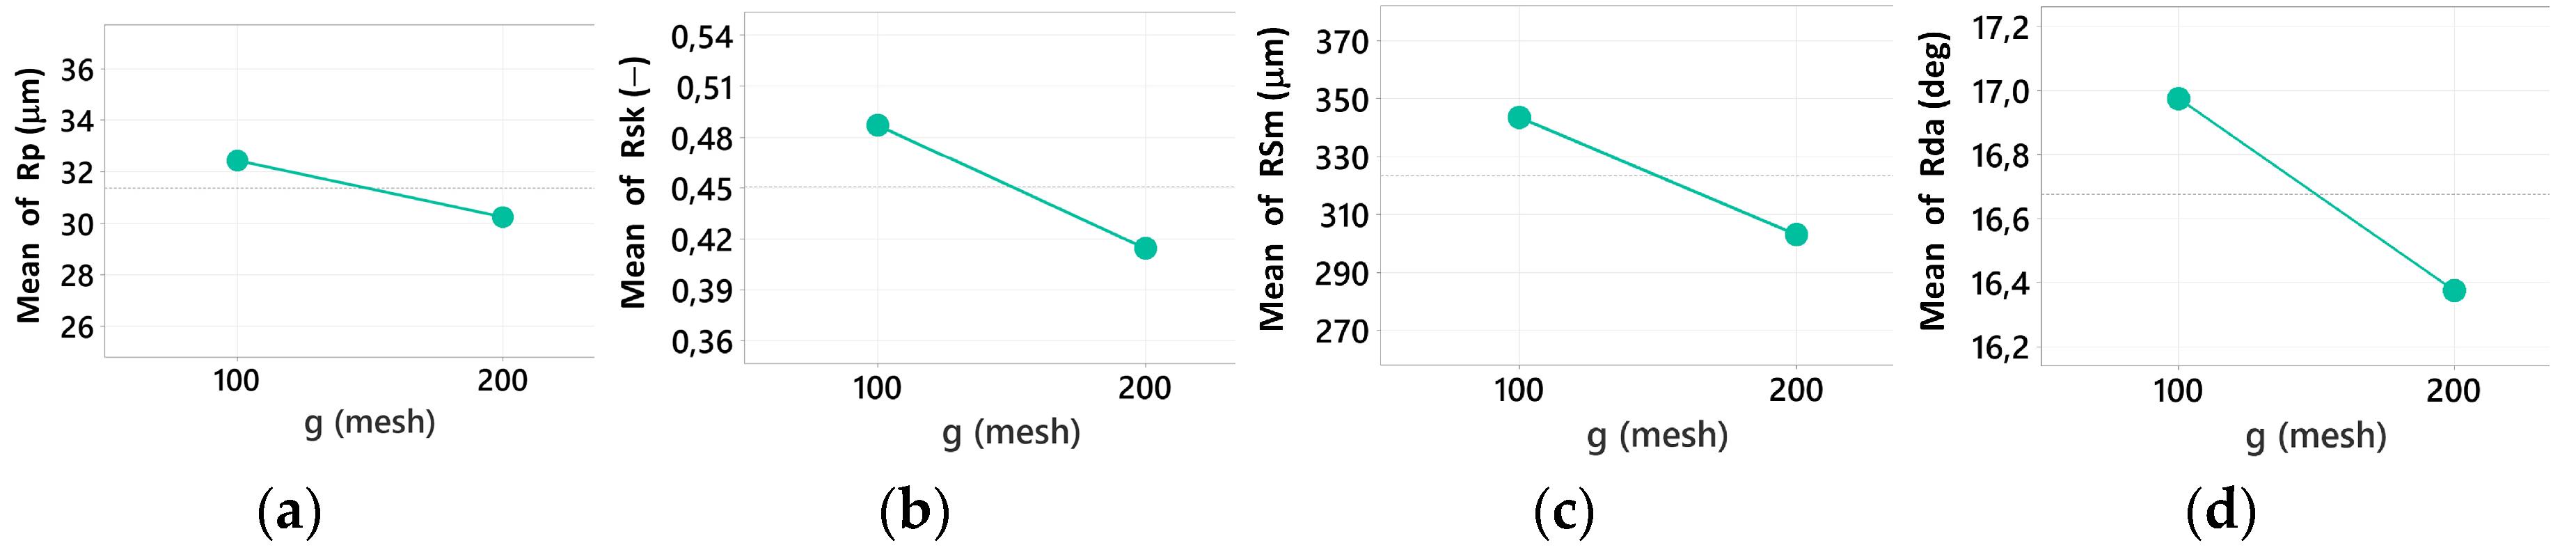
Figure 11.
Matrix plot of Pearson correlations between the roughness descriptors Rp, Rsm, Rsk, and Rda (coefficient of correlation r and 95% confidence intervals shown).
Figure 11.
Matrix plot of Pearson correlations between the roughness descriptors Rp, Rsm, Rsk, and Rda (coefficient of correlation r and 95% confidence intervals shown).
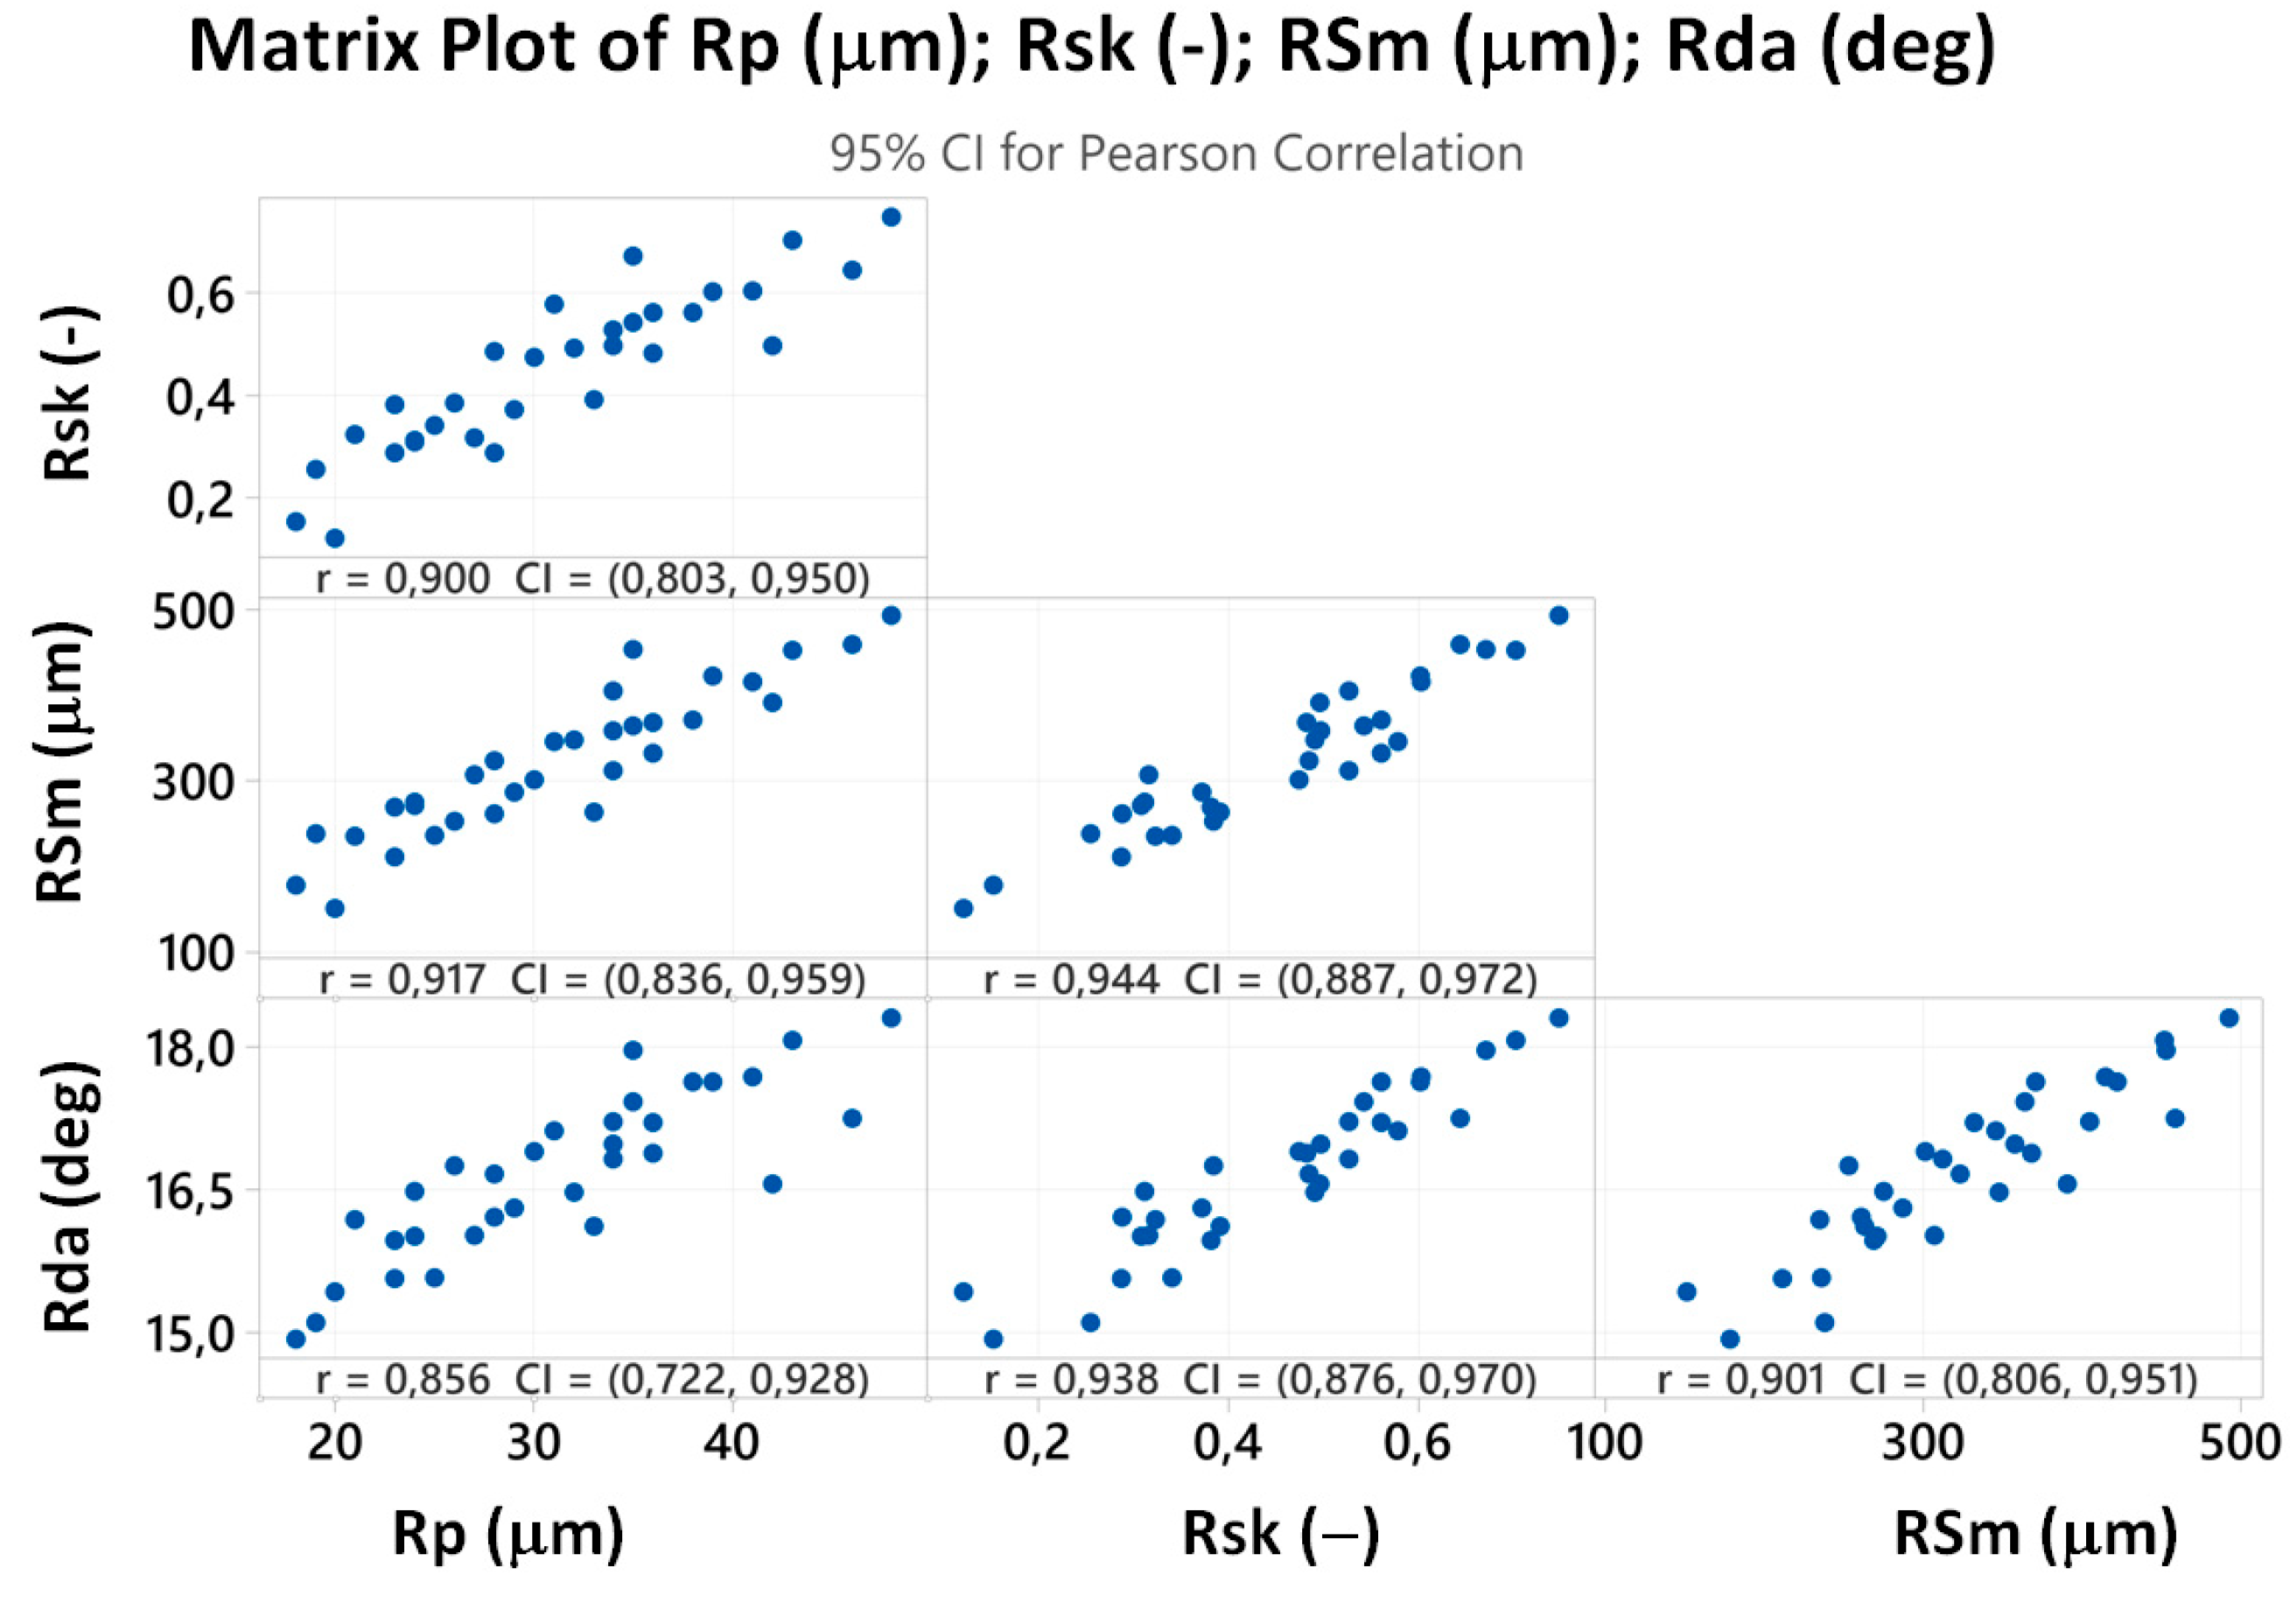
Figure 12.
Estimated surface response mesh: (a) maximum profile peak height (Rp), (b) skewness (Rsk), (c) mean width of profile elements (RSm), (d) arithmetic mean slope (Rda).
Figure 12.
Estimated surface response mesh: (a) maximum profile peak height (Rp), (b) skewness (Rsk), (c) mean width of profile elements (RSm), (d) arithmetic mean slope (Rda).
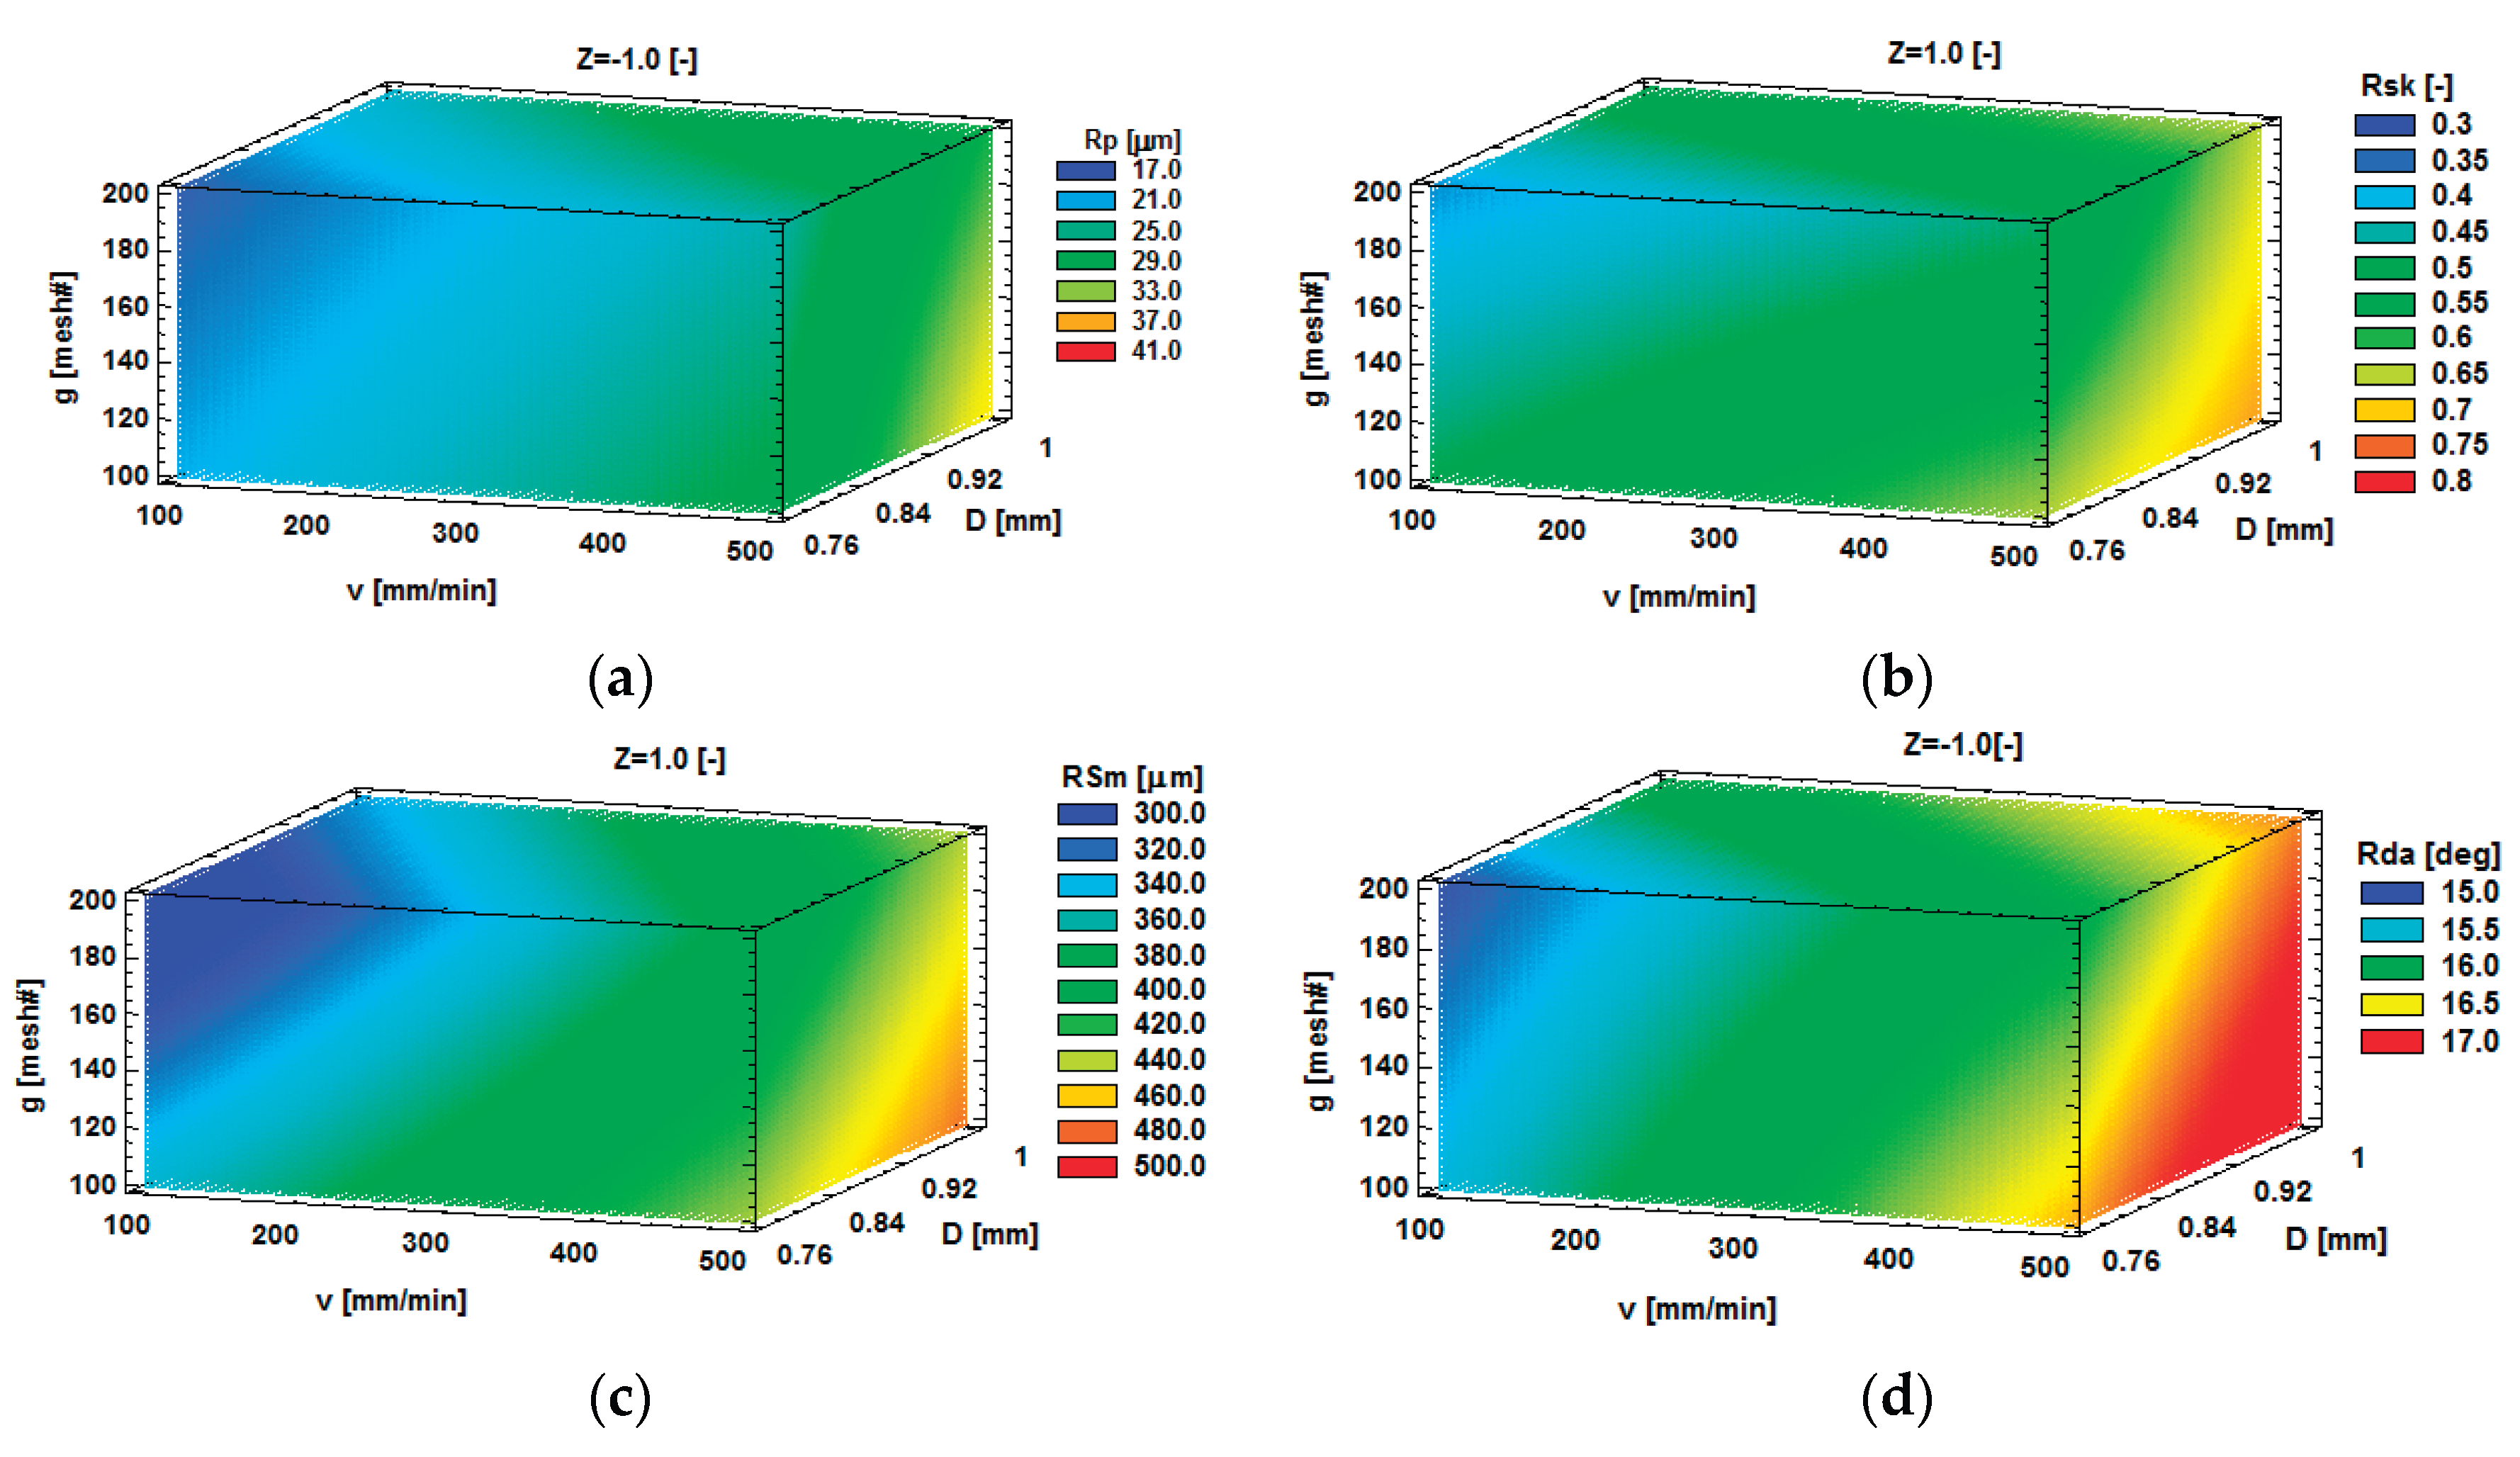
Figure 13.
Contour overlay plot for the investigated roughness descriptors in different conditions:(a) D = 0.76 mm, Z = top, (b) D = 1.0 mm, Z = top, (c) D = 0.76 mm, Z = bottom, (d) D = 1.0 mm, Z = bottom.
Figure 13.
Contour overlay plot for the investigated roughness descriptors in different conditions:(a) D = 0.76 mm, Z = top, (b) D = 1.0 mm, Z = top, (c) D = 0.76 mm, Z = bottom, (d) D = 1.0 mm, Z = bottom.
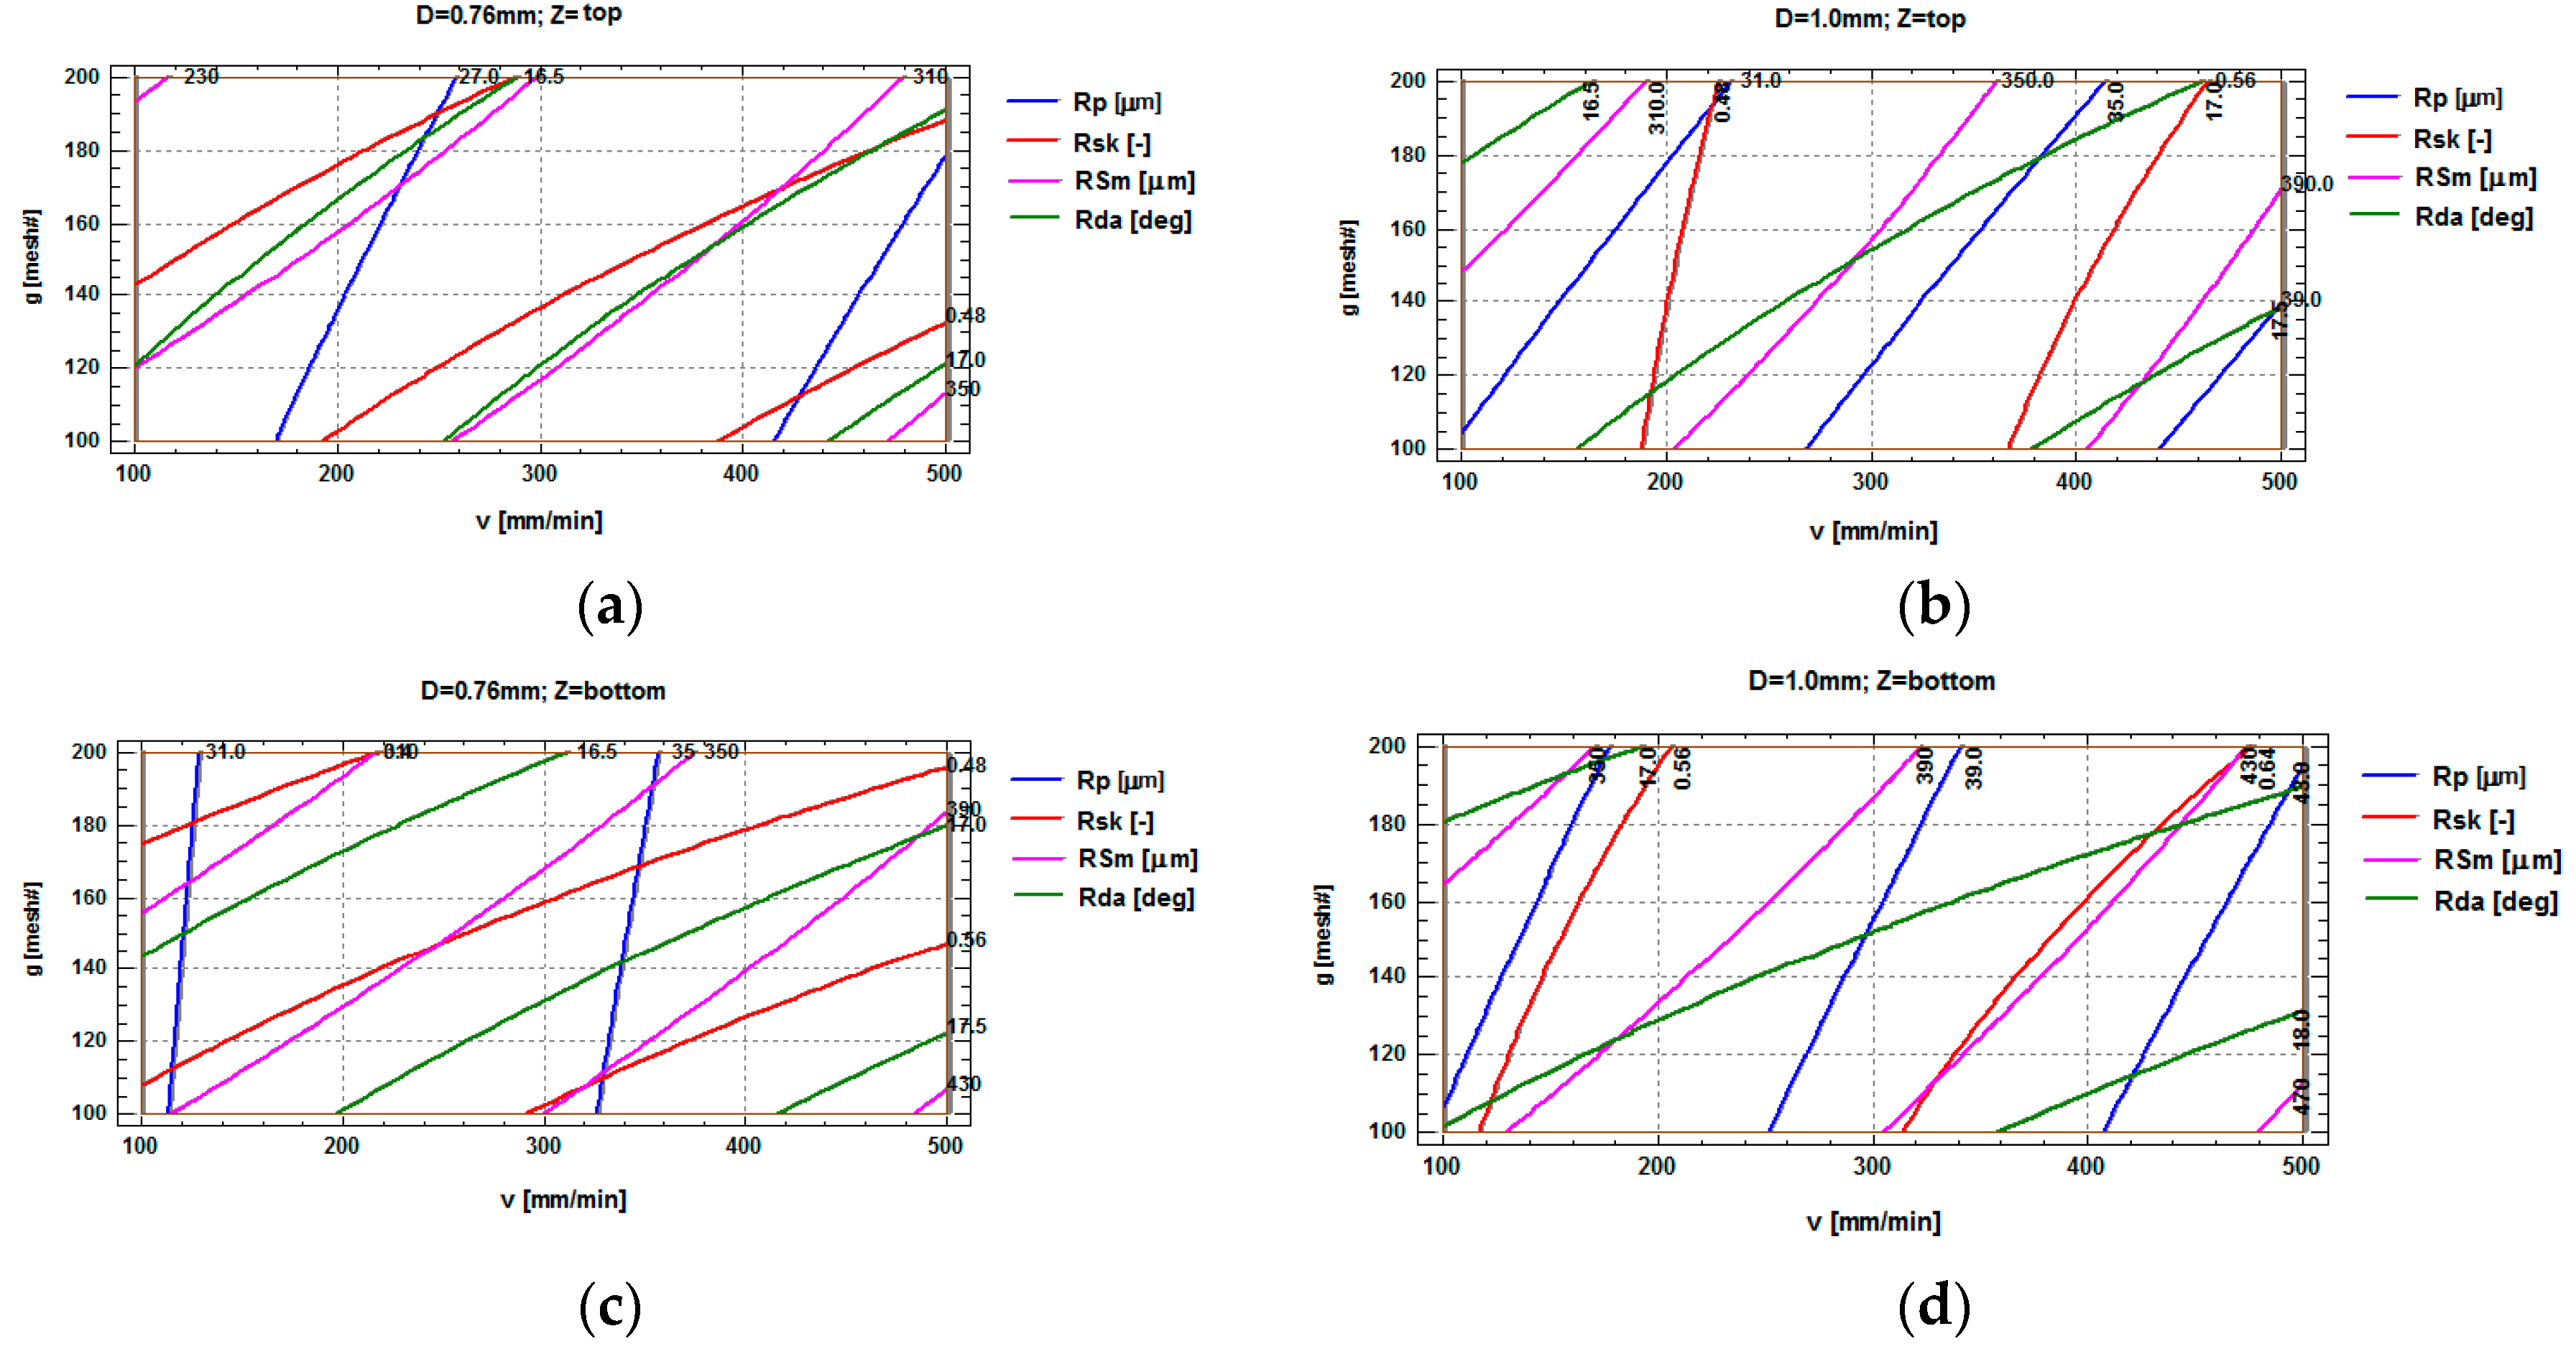
Figure 14.
Macroscopic comparison of surface texture at the jet entry and exit: (a) Top surface, (b) Bottom surface (v = 500 mm/min, D = 1 mm, g = 100 mesh#).
Figure 14.
Macroscopic comparison of surface texture at the jet entry and exit: (a) Top surface, (b) Bottom surface (v = 500 mm/min, D = 1 mm, g = 100 mesh#).

Figure 15.
Detail of the surface in the bottom zone at progressive magnifications, highlighting the extent of local degradation: (a) 1x, (b) 2x, (c) 5x (d) 10x (v = 100 mm/min, D = 1 mm, g = 100 mesh#).
Figure 15.
Detail of the surface in the bottom zone at progressive magnifications, highlighting the extent of local degradation: (a) 1x, (b) 2x, (c) 5x (d) 10x (v = 100 mm/min, D = 1 mm, g = 100 mesh#).

Figure 16.
Macroscopic comparison of surface texture at the jet entry and exit: (a) Top surface, (b) Bottom surface (v = 100 mm/min, D = 0.76 mm, g = 200 mesh#).
Figure 16.
Macroscopic comparison of surface texture at the jet entry and exit: (a) Top surface, (b) Bottom surface (v = 100 mm/min, D = 0.76 mm, g = 200 mesh#).

Figure 17.
Detail of the surface in the Bottom zone at progressive magnifications: (a) 1x, (b) 2x, (c) 5x, (d) 10x (v = 100 mm/min, D = 0.76 mm, g = 200 mesh#).
Figure 17.
Detail of the surface in the Bottom zone at progressive magnifications: (a) 1x, (b) 2x, (c) 5x, (d) 10x (v = 100 mm/min, D = 0.76 mm, g = 200 mesh#).
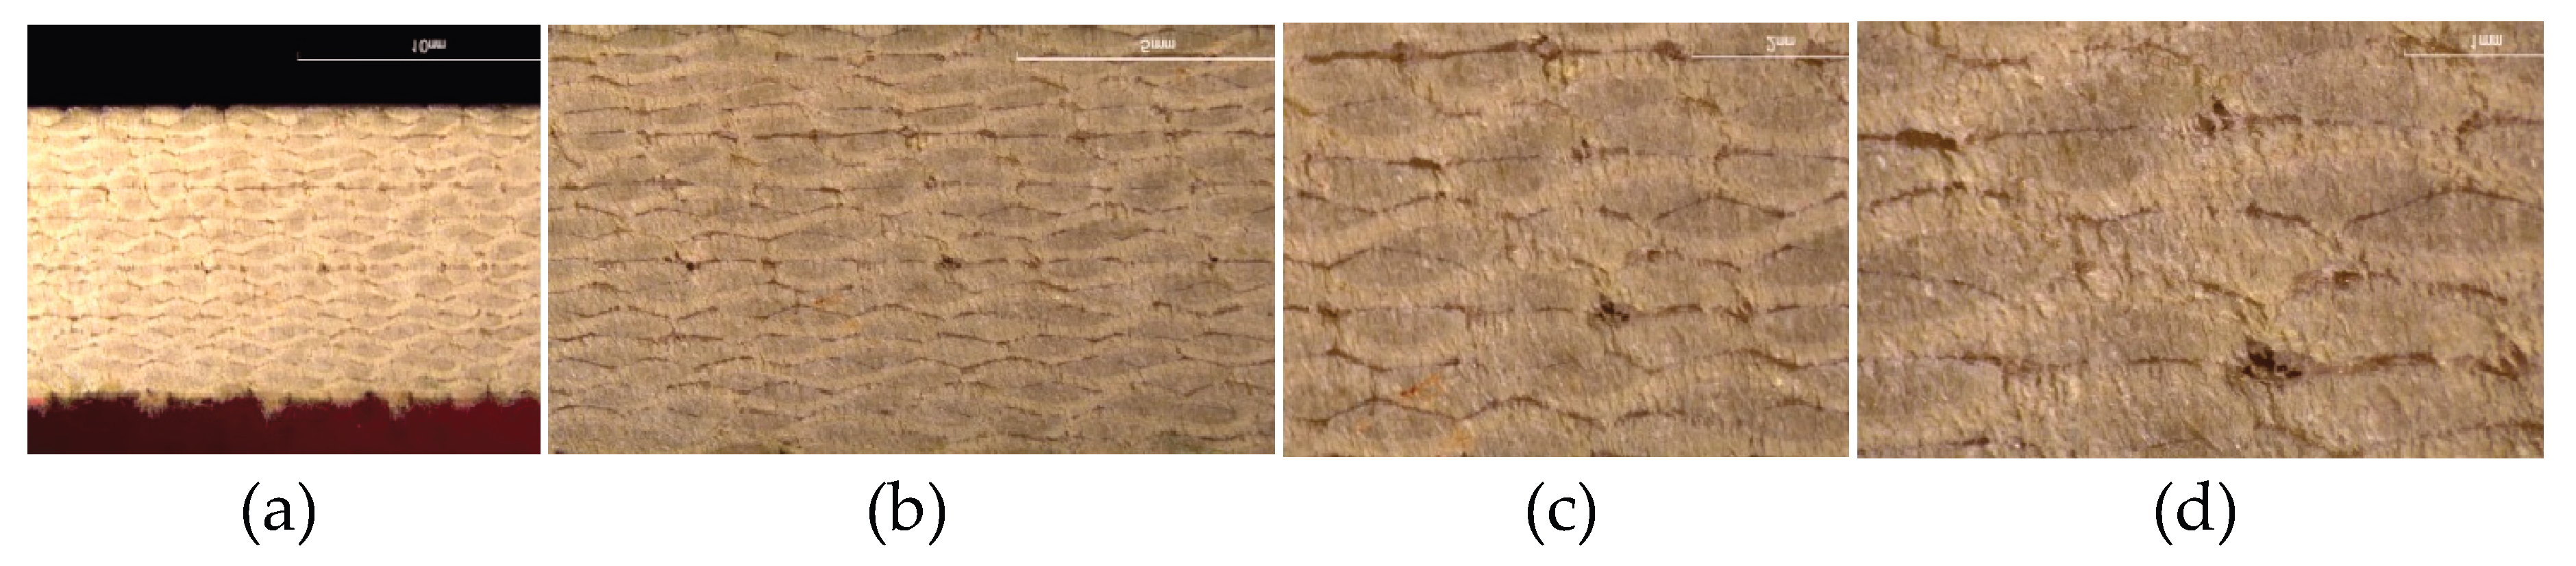
Figure 18.
Conceptual diagram of the morphological features and roughness parameters in the kerf.
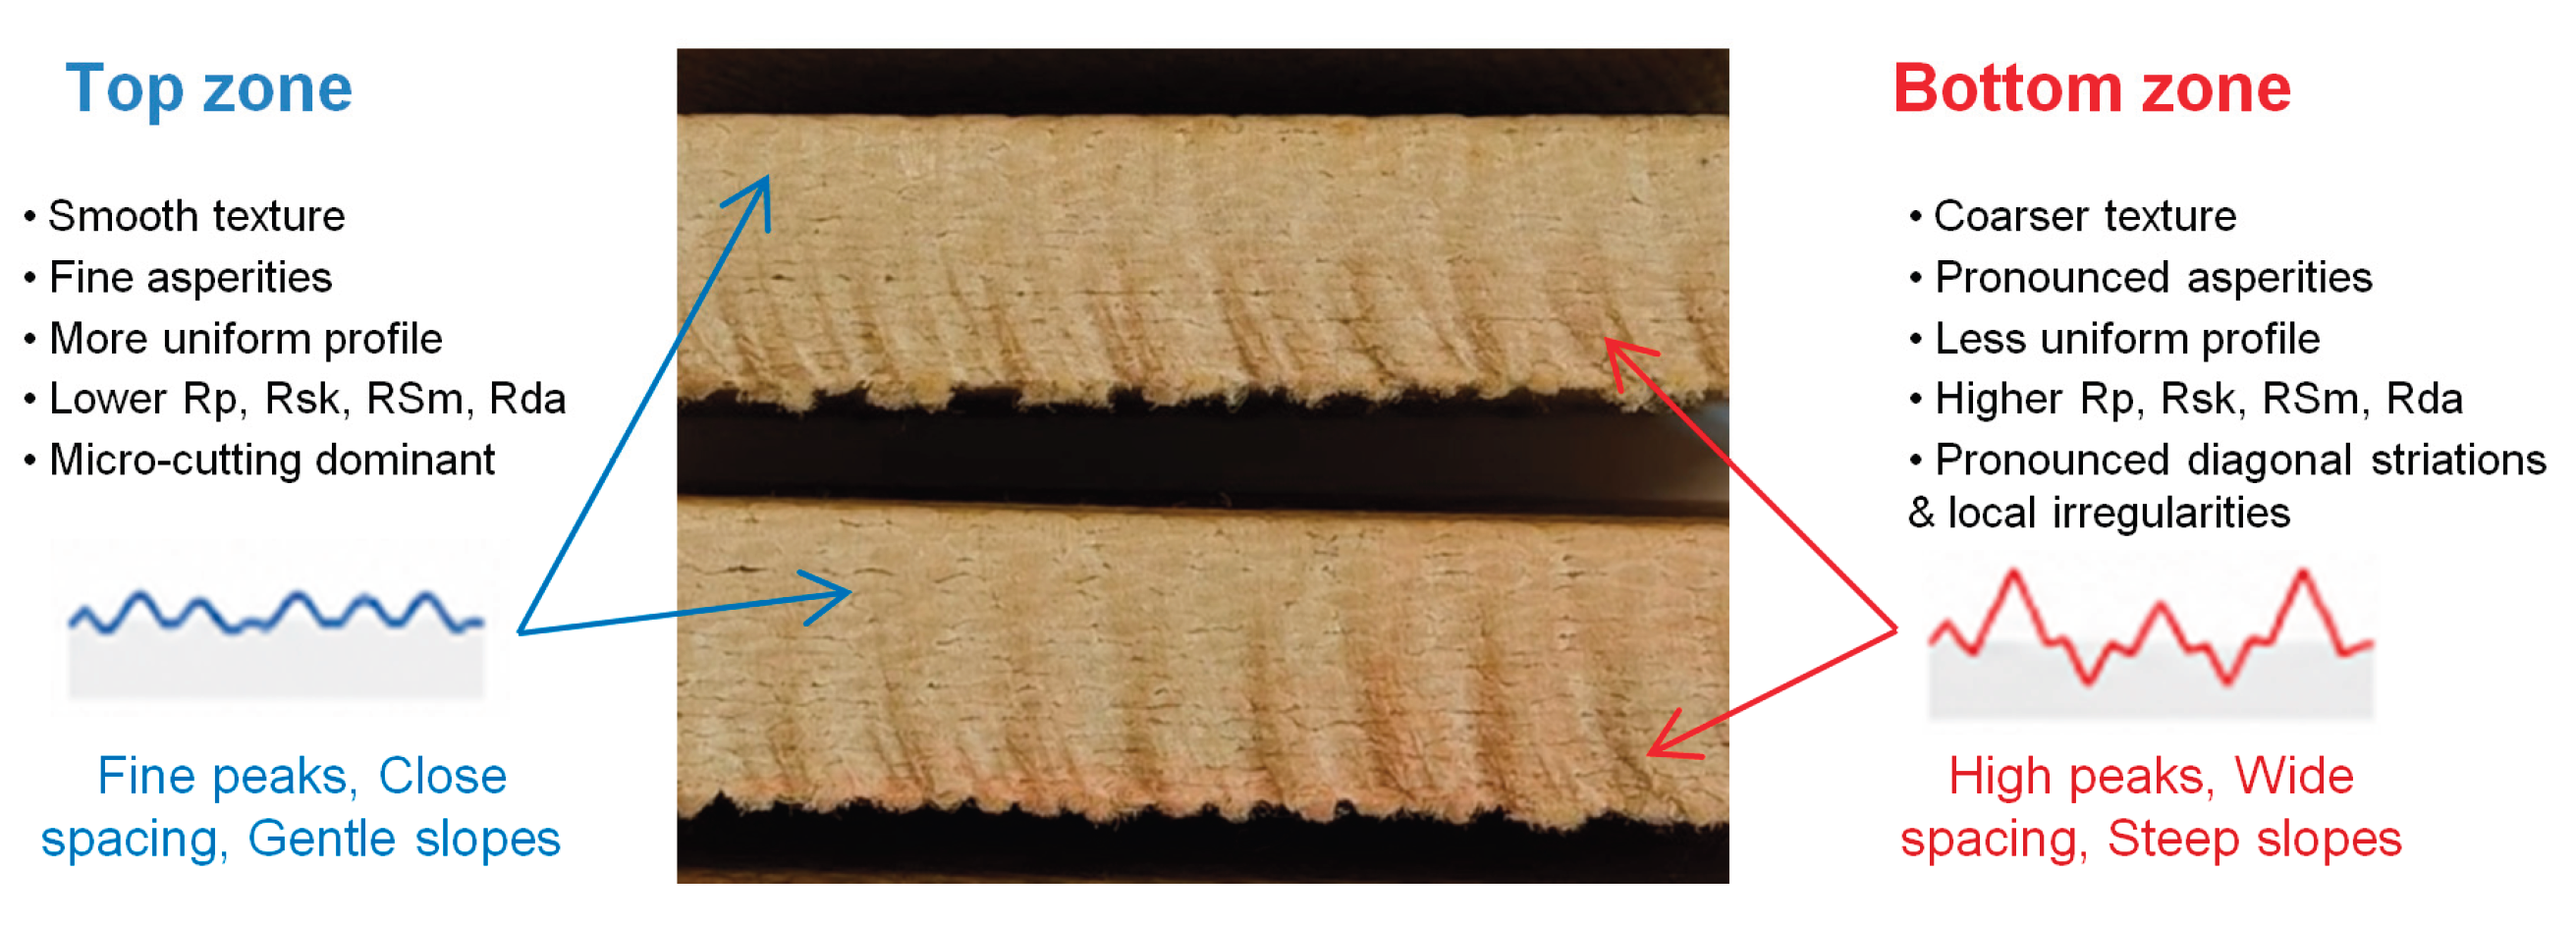

Table 1.
Experimental levels for the influence factors.
| Factors | Symbol | Lower Level (–1) | Higher Level (+1) |
| Traverse speed, v (mm/min) | x1 | 100 | 500 |
| Focusing tube diameter, D (mm) | x2 | 0.76 | 1.00 |
| Abrasive grain size, g (mesh #) | x3 | 100 | 200 |
| Kerf zone, Z (–) | x4 | top | bottom |
Table 2.
Matrix and results of 24 full factorial experiments.
| Run No. i | Influences factors | Objective functions | ||||||||||||||
| A: v | B: D | C : g | D: Z | Rp (m) | Rsk () | RSm (m) | Rda (deg) | |||||||||
| Coded | (mm/min) | Coded | (mm) | Coded | (mesh #) | Coded | (-) | Rp1 | Rp2 | Rsk1 | Rsk2 | Rsm1 | Rsm2 | Rda1 | Rda2 | |
| 1 | -1 | 100 | -1 | 0.76 | -1 | 100 | -1 | top | 19 | 23 | 0.255 | 0.287 | 238 | 211 | 15.11 | 15.57 |
| 2 | +1 | 500 | -1 | 0.76 | -1 | 100 | -1 | top | 29 | 26 | 0.372 | 0.384 | 287 | 253 | 16.31 | 16.76 |
| 3 | -1 | 100 | +1 | 1.00 | -1 | 100 | -1 | top | 24 | 28 | 0.312 | 0.288 | 275 | 261 | 16.49 | 16.22 |
| 4 | +1 | 500 | +1 | 1.00 | -1 | 100 | -1 | top | 36 | 35 | 0.561 | 0.542 | 332 | 364 | 17.21 | 17.43 |
| 5 | -1 | 100 | -1 | 0.76 | +1 | 200 | -1 | top | 18 | 20 | 0.153 | 0.121 | 178 | 151 | 14.94 | 15.43 |
| 6 | +1 | 500 | -1 | 0.76 | +1 | 200 | -1 | top | 21 | 24 | 0.323 | 0.308 | 235 | 271 | 16.19 | 16.02 |
| 7 | -1 | 100 | +1 | 1.00 | +1 | 200 | -1 | top | 23 | 25 | 0.382 | 0.341 | 269 | 236 | 15.97 | 15.58 |
| 8 | +1 | 500 | +1 | 1.00 | +1 | 200 | -1 | top | 30 | 32 | 0.474 | 0.491 | 301 | 348 | 16.91 | 16.48 |
| 9 | -1 | 100 | -1 | 0.76 | -1 | 160 | +1 | bottom | 28 | 34 | 0.485 | 0.497 | 323 | 358 | 16.67 | 16.98 |
| 10 | +1 | 500 | -1 | 0.76 | -1 | 100 | +1 | bottom | 35 | 39 | 0.671 | 0.602 | 453 | 422 | 17.97 | 17.64 |
| 11 | -1 | 100 | +1 | 1.00 | -1 | 100 | +1 | bottom | 38 | 34 | 0.561 | 0.527 | 371 | 405 | 17.64 | 17.22 |
| 12 | +1 | 500 | +1 | 1.00 | -1 | 100 | +1 | bottom | 43 | 48 | 0.702 | 0.748 | 452 | 493 | 18.07 | 18.31 |
| 13 | -1 | 100 | -1 | 0.76 | +1 | 200 | +1 | bottom | 27 | 33 | 0.316 | 0.391 | 307 | 263 | 16.03 | 16.12 |
| 14 | +1 | 500 | -1 | 0.76 | +1 | 200 | +1 | bottom | 36 | 42 | 0.482 | 0.496 | 368 | 391 | 16.89 | 16.57 |
| 15 | -1 | 100 | +1 | 1.00 | +1 | 200 | +1 | bottom | 31 | 34 | 0.578 | 0.527 | 346 | 312 | 17.12 | 16.83 |
| 16 | +1 | 500 | +1 | 1.00 | +1 | 200 | +1 | bottom | 46 | 39 | 0.644 | 0.603 | 459 | 415 | 17.25 | 17.69 |
Table 3.
Empirical regression models developed for the roughness descriptors.
| Regression model (coded values) | R2 | R2 (adj) |
| Rp =31.312 + 3.875 v + 2.937 D – 1.125 g + 5.500 Z | 92.34 % | 88.69% |
| Rsk = 0.4507 + 0.0744 v + 0.0668 D – 0.0363 g + 0.1011 Z + 0.0238 D g | 96.43% | 94.73% |
| RSm = 323.38 + 41.88 v + 29.06 D – 20.25 g + 60.25 Z | 95.41 % | 93.22% |
| Rda = 16.675 + 0.4306 v + 0.3506 D – 0.2949 g + 0.5119 Z | 94.69% | 92.17% |
Table 4.
Comparison between experimental and predicted values of the roughness descriptors.
| Descriptor | Zone | Experimental (average) | Predicted | Eror [%] |
| Rp | Top | 19 | 17.87 | 5.9 |
| Bottom | 30 | 28.87 | 3.7 | |
| Rsk | Top | 0.137 | 0.148 | 8.0 |
| Bottom | 0.353 | 0.351 | 0.6 | |
| RSm | Top | 164 | 171.94 | 4.8 |
| Bottom | 285 | 292.44 | 2.6 | |
| Rsa | Top | 15.185 | 15.082 | 0.7 |
| Bottom | 16.075 | 16.106 | 0.2 |
Disclaimer/Publisher’s Note: The statements, opinions and data contained in all publications are solely those of the individual author(s) and contributor(s) and not of MDPI and/or the editor(s). MDPI and/or the editor(s) disclaim responsibility for any injury to people or property resulting from any ideas, methods, instructions or products referred to in the content. |
© 2026 by the authors. Licensee MDPI, Basel, Switzerland. This article is an open access article distributed under the terms and conditions of the Creative Commons Attribution (CC BY) license (http://creativecommons.org/licenses/by/4.0/).
Copyright: This open access article is published under a Creative Commons CC BY 4.0 license, which permit the free download, distribution, and reuse, provided that the author and preprint are cited in any reuse.