

Submitted:
10 September 2026
Posted:
11 September 2026
You are already at the latest version
Abstract
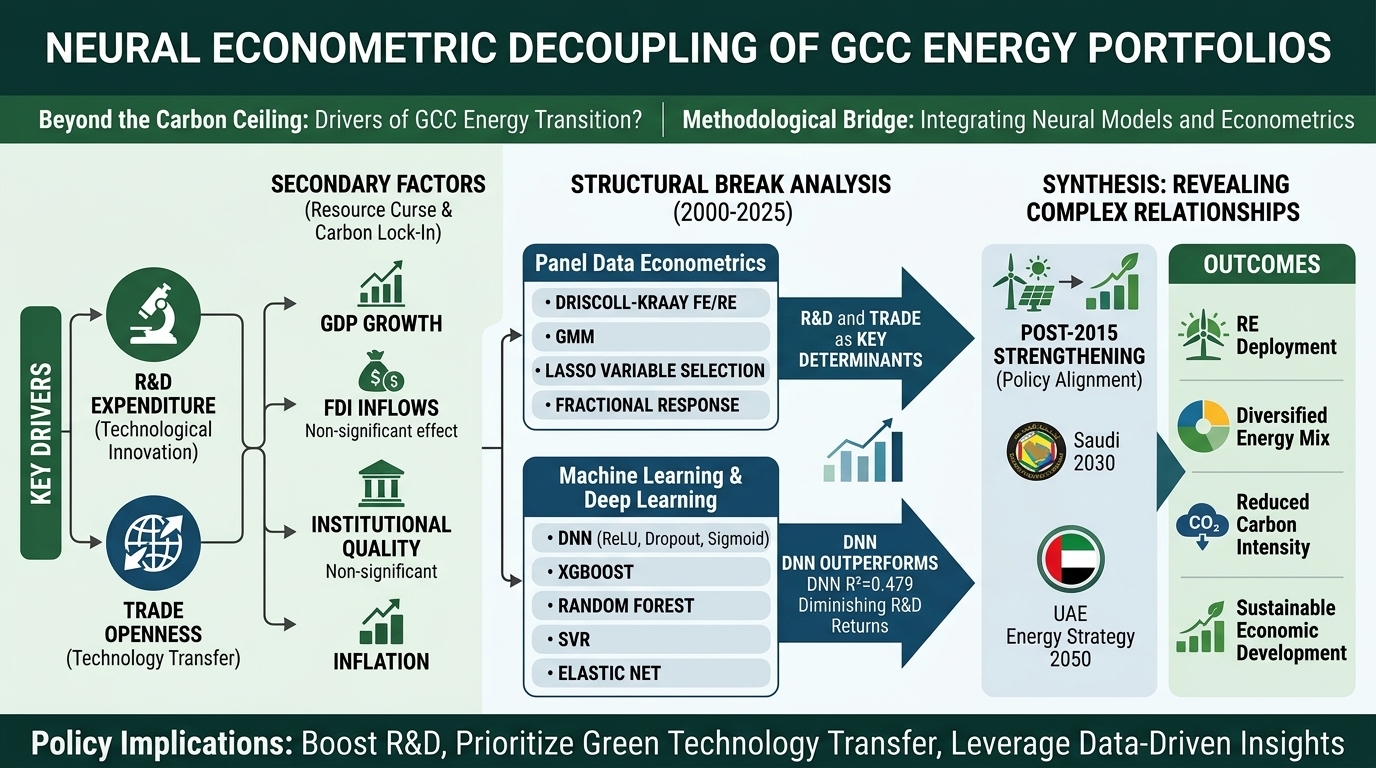
The Gulf Cooperation Council (GCC) states have to find a way to balance their reliance on hydrocarbon resources and their ambitious aims on moving to renewable energy (for instance, the Saudi Vision 2030.) Despite the policies in place, the implementation of renewable energy technologies in the region is relatively low indicating that more needs to be understood about the reasons behind the use of renewable energy. The present research will analyze the macroeconomic determinants of renewable energy consumption in the 6 GCC states for the periods 2000-2025 using a combination of panel econometric techniques and machine learning. Panel data were constructed from data from the World Bank and the International Energy Agency. The econometric results show that R&D expenditure and trade openness are the two most important determinants of renewable energy consumption, which jointly explain about 63% of the variation (adjusted R² = 0.629). The random forest model is consistent with these findings, with R&D expenditure as the most important predictor followed by trade openness. No statistically meaningful relationship was found between GDP, foreign direct investment, inflation and renewable energy consumption in the final models due to the structural characteristics of GCC economies. The random forest model also had a low RMSE value of 0.032 and an out-of-sample R-squared of 0.425, indicating satisfactory predictive performance for an initial model. Sub-period analysis also indicates that the relationships between R&D expenditure and trade openness became stronger after 2015, which coincides with the introduction of national energy transition strategies in the GCC. The study implies that innovation in terms of technology as well as the open nature of economy could promote energy transition in the region whereby high amount of investments in research and development are required as well as deeper international trade linkages might be supporting the acceptance of green energy approach.
Keywords:
renewable energy
; GCC
; research and development
; trade openness
; machine learning
; panel data
; energy transition
; deep learning
; neural econometric
1. Introduction
Most countries in the world have identified transition to cleaner energy as a key goal with a view to reducing their greenhouse gas emissions and energy security in the future. But for the Gulf Cooperation Council (GCC) countries – Saudi Arabia, the United Arab Emirates, Qatar, Kuwait, Oman and Bahrain – it’s a different matter. GCC nations have enjoyed the availability of fossil fuel resources for years and now they have to deal with the pressure of introducing alternative sources of energy into their energy portfolio and complying with their climate obligations [1]. As a result, GCC countries have taken the first steps towards efficient and sustainable energy policy by implementing energy programs of their own, such as Saudi Vision 2030, UAE Energy Strategy 2050, Qatar National Vision 2030, Kuwait Vision 2035, Oman Vision 2040, and Bahrain Vision 2030 [2].
Regardless of substantial measures, the development of new types of energy in some countries is progressing slowly [3]. As for 2022, in Saudi Arabia the contribution of renewable energies to power generation was merely 0.6%, totally insufficient to achieve the established targets. For Kuwait the figure is 0.2%, far below the intended 5% [4]. Today, this process is going through an incredible transformation in the GCC, growing from 0.17 GW in 2015 to astonishing 12.4 GW in 2023, which accounts for 7194% increase in the production of energy in this region compared to the global average of 517% [5].
As indicated in the previous studies, influencing factors of the implementation of renewable energy vary among different countries and are mainly determined by the economic structure, institutional environment, and energy market characteristics of these countries [6]. Statistical research demonstrates that some traditionally considered drivers, such as fiscal capacity and the size of the energy market, can be of no statistical significance in the energy-exporting Arab states that are characterized by strong path dependency and carbon lock-in [7]. For instance, research on GCC countries indicates that the quality of institutions and openness to trade can lead to negative impacts on the renewable energy demand in the long run, which contradicts the traditional view on the role of openness in energy transitional processes [8]. In addition, macroeconomic instability and inflation are considered to be significant negative influencing factors of renewable energy security in MENA [9].
Although a growing body of literature has examined the factors that affect the adoption of renewable energy in the GCC, less has been said about which factors matter most [10]. This study attempts to address this issue by using a combination of stepwise regression and machine learning to identify and rank the main macroeconomic determinants of renewable energy consumption in the GCC over the period 2000-2025. In particular, the study addresses the following research questions:
- What are the important macro-economic variables affecting the use of renewable energy in the GCC?
- What is the difference in findings between machine learning and econometric models?
- Have the determinants of renewable energy consumption changed after implementing the national strategies of energy transition since 2015?
Despite increasing attention to renewable energy transitions in the GCC region [11], the existing literature has several major gaps. Most of the studies have examined the determinants of economic growth, trade openness and technological innovation separately and without a systematic comparison of their relative importance in a common analytical framework [12]. Second, most empirical studies only use conventional econometric methods that may not properly characterize complicated non-linear relationships or out-of-sample predictive assessment [13]. Third, the impact of macroeconomic factors on renewable energy consumption and the change in response after the implementation of national energy strategies after 2015 [14] have been largely ignored.
In this paper, we largely contribute to address these gaps through three major contributions:
- Empirical contribution: We provide the first detailed comparative analysis of various macro-economic drivers of renewable energy consumption in the GCC using a 26-year panel (2000–2025). In a common framework [15], we systematically evaluate the relative importance of R&D expenditure, trade openness, GDP, FDI, inflation and institutional quality.
- Methodological contribution: We use (i) theory-based panel econometric models with correct standard errors accounting for cross-sectional dependence (Driscoll-Kraay), (ii) penalized regression methods (LASSO, elastic net) for robust variable selection, (iii) fractional response models for bounded dependent variables and (iv) multiple machine learning algorithms (random forest, XGBoost, support vector regression, elastic net) for out-of-sample validation and variable importance analysis with time-appropriate data splitting [16]. We call this hybrid approach 'neural econometrics' and argue it combines the advantages of classical economic modelling with those of modern artificial intelligence approaches to provide a more holistic view of the complex relationships driving energy transitions.
- Policy Contribution: we weigh in on the debate over the strength of relationship between macroeconomic indicators and renewable energy usage after 2015. Our results show the effectiveness of an array of energy strategies at the national level such as Saudi Vision 2030 and UAE Energy Strategy 2050 [17].
The rest of the paper is organized as follows. The literature review and the theoretical framework are presented in Section 2. Details of data and methodology are given in Section 3. 4 Empirical Findings “Results are discussed in Section 5 and Section 6 concludes with policy implications and further research directions.
2. Literature Review
2.1. Theoretical Foundations of Renewable Energy Adoption
2.1.1. Induced Innovation Theory
Induced innovation theory suggests that technological innovation is induced by change in relative factor prices for the more efficient use of resources [18]. This theory is applicable to renewable energy where increasing fossil fuel prices or internalizing environmental costs through carbon pricing or other means promote firms and governments to raise R&D investment in cleaner technologies. Such investment, in turn, reduces the costs of renewable energy technologies and speeds up their deployment [19].
Technical research on public and private investments in R&D is supporting the progress of modern technology and competitiveness of renewable energy [20]. Empirical studies have shown that Technological advancement has a significant role in the development of renewable energy in Saudi Arabia [10], within the GCC context, as well as the impact of innovation and green financing on achieving energy transition [11]. Therefore, it is possible to expect that R&D expenditures have a positive role in the use of renewable energy.
2.1.2. Resource Curse and Dutch Disease Theories
According to the resource curse theory [21], countries with a high level of natural resources are likely to experience slower economic growth, poor governance structures and low levels of economic diversification compared to their counterparts. Therefore, the theory suggests that within the framework of an energy transition, economies that have large stocks of hydrocarbons may face unique challenges in transitioning to sustainable ways of producing and consuming energy [22]. This is related to the path dependency of fossil fuel energy system development and political economy conditions that favour existing industries as well as institutional arrangements that are better suited to resource extraction than innovation [23].
Similarly, the Dutch disease theory explains how resource booms lead to the crowding out of other economic activities and sectors due to the rise in the exchange rate and wages, negatively affecting non-resource sectors [24]. It means that the heavy dependence of GCC countries on hydrocarbon income may crowd out investments in renewable energy and its related industries [25]. These theories indicate that the macroeconomic relationships in resource rich economies may be different from those in diversified economies [26].
2.1.3. Carbon Lock-In Theory
As carbon lock-in theory [27] suggests, the dependence on fossil fuel infrastructure for a prolonged period leads to the pathway dependency which hinders the transition to clean energy technology [28]. The lock-in effect is caused by the following factors: (i) sunk costs for physical infrastructure (pipelines, refineries, and other energy sources), (ii) institutions (e.g., regulations, subsidies, and professional networks) that are specific to fossil fuels, and (iii) behavioral patterns that are influenced by fossil fuel dependency [29].
This theory is supported by research within the framework of the GCC that confirms that the dependence on conventional energy has impeded the development of renewable energy in Arab countries [30]. The dependence of economic growth on the oil and gas economy has always been driven by revenue from fossil fuels, thus maintaining the reliance on traditional energy and impeding the shift to renewable energy [31]. The carbon lock-in theory states that investing in the sector is not enough to escape from this pattern of dependence as it is also necessary to create an effective policy framework and reform the institutional system [32].
2.2. Determinants of Renewable Energy Consumption: Empirical Evidence
2.2.1. Research and Development (R&D) Expenditure
R&D expenditure is widely known as an important driver of renewable energy development, through its role in promoting technological innovation, improving energy efficiency and reducing costs of renewable energy technologies [33]. Empirical evidence has shown repeatedly that public and private R&D investment speeds up technological progress and improves the competitiveness of renewable energy technologies [34].
Recent findings show that R&D is playing an increasingly crucial role in helping oil-producing countries switch to cleaner energy sources [35]. Derouez used the ARDL and VECM techniques to study the impact of technology innovation as one of the factors of renewable energy creation in Saudi Arabia [10]. Jabob stressed the importance of both innovation and green financing enabling the successful implementation of sustainable energy transition goals in the GCC countries [11]. According to Al-Ghamdi et al. Saudi Vision 2030 plays a key role in highlighting the significance of innovation, human capital and finance in the transition of Saudi Arabia to renewable energy sources [17].
However, the relationship between R&D and renewable energy utilization may be context dependent. Success of investments in R&D in hydrocarbons dependent economies may also depend on the existence of complementary factors such as absorptive capacity, human capital and institutional quality. R&D spending does not automatically result in successful innovation; it requires a supportive ecosystem with strong intellectual property rights, a skilled workforce, and partnerships between academia and industry. In the GCC context, where these factors are still emerging, the relationship between R&D and renewable energy deployment may be more subtle than in more mature innovation systems.
2.2.2. Trade Openness
Increased foreign direct investment (FDI) and trade openness could lead to the upgrading of renewable energy development through technology transfer [36]. Moreover, they would attract investments and businesses [37]. However, the impact of FDI and trade openness varies greatly among countries as a function of the policy environment and the economic structure [38].
Evidence from the GCC countries is still inconclusive [39]. For example, some researchers have validated that trade liberalization alone would not increase renewable energy consumption, especially in hydrocarbon-dependent countries, where trade is tightly linked to fossil fuels production and exportation [40]. Yakubu et al. [12] employed the PMG technique and found that trade openness reduced renewable energy consumption in the long run. Besides, Al-Sarihi and Mansour argue that trade alone would not be enough to propel the energy transition without effective technology transfer and institutional support [1].
By analyzing the data in the literature, it can be inferred that the transfer of green technology needs to increase policies [41]. Furthermore, it is important to improve institutional support and finance renewable energy projects with foreign direct investment [42]. In the absence of such policies, trade liberalization may increase dependence on fossil fuels rather than transition to clean energy sources [43].
2.2.3. Economic Growth (GDP)
The relationship between economic growth and the use of renewable energy has been widely studied and the findings are contradictory [44]. The environmental Kuznets curve (EKC) theory posits that pollution increases during the early stages of economic development, but during the later stages of economic development, pollution decreases with increased income and the adoption of cleaner technologies [45]. Thus, it is possible to conclude that the initial negative effect of economic growth on renewable energy consumption is possible but economic development provides an opportunity for countries to shift toward cleaner energy forms in the long term [46].
The dynamics of the relationship may be different in the hydrocarbon-based economies [47]. According to Ibrahim et al. [26], the relationship between economic growth and the environment in the GCC region is much more complicated than that described by the traditional EKC theory. In this regard, Qian and Zhu argued that the persistent use of classical sources of energy plays a limiting role in the development of renewable energy in the Arab region [24]. Finally, Sharaf and Shahen investigated the impact of renewable energy, electricity consumption, and economic openness on economic growth in oil-rich countries and concluded that there is a particular specificity of the relationship between economic growth and renewable energy [48]. Specifically, they found that economic growth doesn’t automatically translate into renewable energy consumption, as the benefits of economic development are often focused into hydrocarbon sectors rather than clean energy.
2.2.4. Foreign Direct Investment (FDI)
The impact of foreign direct investment (FDI) in renewable energy development has not been consistent [49]. The pollution haven hypothesis states that multinational companies will invest in developing countries where pollution laws are less strict and thus may relocate their cleaning operations to countries where pollution regulations are weaker. In contrast, the pollution halo hypothesis holds that FDI will introduce clean production techniques by transferring advanced technologies [50].
Information gathered from the GCC shows that FDI tends to be supportive of conventional energy ventures and not the development of renewable energy sources [51]. The study of Tabash et al. indicates that trade openness might negatively affect the development of renewable energy in the long run if the existence of regulatory and institutional frameworks is not guaranteed [52]. Ekwueme demonstrated the existence of an interdependence between trade openness and FDI and the environmental impacts of FDI which depend on the mode of such investments and the policies of the states that support them [53]. The effect of FDI on renewable energy development is highly sensitive to the absorptive capacity of the host economy and the presence of policies directing investments into clean energy sectors.
2.2.5. Inflation and Macroeconomic Stability
A stable macroeconomic environment is important for encouraging investments in renewable energy as it reduces the uncertainties associated with finance and improves the conditions of investment [54]. High inflation leads to higher project costs and higher cost of financing and discourages long-term investments in renewable energy infrastructure [55]. Therefore, price stability is an important factor to the transition to cleaner energy systems [56].
This relation is supported by empirical evidence [57]. Yousef [16] used panel ARDL analysis for 16 MENA countries and found that inflation and macroeconomic instability play a significant negative role in renewable energy development in the medium and long run, while good fiscal policy encourages renewable energy growth. In the same way, in their study, Ahmed et al. mentioned that macroeconomic factors are very important in energy consumption and energy transitions [36]. Ben-Salha et al. have shown the adverse effect of policy uncertainty on the environmental quality in the GCC by using different quantile regression methods [37]. In contrast, Sharaf and Shahen revealed that macro-economic stability promotes long-term investments in renewable energy sources [48]. The implications of these findings suggest that an economically stable environment, which is a result of prudent fiscal and monetary policies, is a necessary precondition for promoting investments in renewable energy [58].
2.2.6. Institutional Quality
The development of renewable energy sources is identified as one of the key factors for the development of renewable energy sources, especially in resource rich economies [59]. The existence of strong institutions will guarantee the application of reliable access policies, stopping the violation of environmental rules, and stable policies to promote investments in solar energy [60].
The study conducted by Yakubu and his co-authors has highlighted the importance of the role of quality institutions in determining how trade openness influences the use of renewable energy in the GCC region [11]. It is worth noting that Yakubu and his team found that in countries with weak institutions, trade openness resulted in a negative effect on renewable energy consumption [61]. On the contrary, the effect of trade openness on renewable energy consumption turned out to be positive in countries with well-developed institutions [62]. Similarly, Yakubu and his co-authors discovered that quality governance played a role in facilitating clean energy production in the MENA region [13]. Institutions that work well such as regulatory quality, rule of law, control of corruption, and government effectiveness enable the establishment of a predictable environment.
2.3. The GCC Context and Policy Framework
2.3.1. National Energy Strategies
The GCC countries have set ambitious renewable energy targets in their national visions. These policy frameworks send a clear message of the move away from hydrocarbon dependence toward a more diversified and sustainable economic model. The renewable energy targets and policy frameworks of the GCC countries are summarized in Table 1.
2.3.2. GCC-Specific Challenges
There are particular problems with the GCC's shift to renewable energy. One is the fact that high energy subsidies render renewable technologies uncompetitive, since fossil fuel prices are kept low by means of subsidies [31]. There’s also the sunk cost of fossil fuel infrastructure creating a lock-in effect. At the political economy level, hydrocarbon revenues can generate an institutional setting that privileges resource extraction over innovation and diversification. The region also faces technical design challenges, such as the lack of water to cool thermal power stations and the integration of variable renewable energy into the grid.
Deb and Asna studied the re-envisioning of electric vehicle charging infrastructure and sustainable energy transitions in the GCC countries and found that infrastructure challenges are major barriers [7]. Almasri and Narayan studied energy efficiency and renewable energy in the GCC and identified a number of barriers including institutional, regulatory and financial constraints [3]. Adding to these challenges is the region’s arid climate that constrains the performance of some renewable technologies, and the need for substantial grid upgrades to accommodate variable renewable energy sources.
2.4. Theoretical Model Specification
Based on the theoretical underpinnings and empirical evidence discussed above, this study develops a conceptual framework where renewable energy consumption is a function of technological innovation, economic openness, macroeconomic conditions and institutional quality. The framework is based on the theory of induced innovation, which posits that the technological progress induced by R&D investment is an important driver of renewable energy deployment. Theories of the resource curse and carbon lock-in give a rationale for expecting a reduced role of traditional macroeconomic variables in explaining developments in resource-rich economies.
It can be stated that the conceptual framework posits that renewable energy consumption is driven primarily by R&D spending and trade openness while GDP, FDI, inflation, and institutional quality exert a contribution at either secondary or moderating levels. The system also implies that structural changes may take place, especially as far as the relationships between the above-mentioned variables and renewable energy consumption are concerned since they may have become more significant after the adoption of national energy policies since 2015.
The conceptual framework depicted in Figure 1 identifies the key influences (R&D spending, openness to trade, quality of institutions, and stable macroeconomic conditions) and the context (resource curse, carbon lock-in, national vision, and global influences) leading to the adoption of renewable energy in the GCC countries and the resulting energy transition outcomes (renewable energy deployment, energy mix diversification, carbon intensity reduction, and sustainable development).
3. Data and Methodology
3.1. Data Sources and Variables
3.1.1. Data Description
In this research work, a balanced dataset containing information from the six countries forming the Gulf Cooperation Council (Bahrain, Kuwait, Oman, Qatar, Saudi Arabia and the UAE) between 2000 and 2025 is used. The dataset includes data from 2000 until 2024 and projected figures for the year 2025. The data was collected from a range of sources. The data sources are mainly the World Bank’s World Development Indicators (WDI) and the International Energy Agency (IEA). Moreover, the data on the volume of CO2 emissions from the Our World in Data (OWID) database are used in this study.
3.1.2. Variable Definitions
On the other hand, the dependent variable is the consumption of renewable energy, which is quantified as the proportion of renewable energy to the total final energy consumption (which may range from 0 to 100 percent). For fractional response models, this limited variable seems to be suitable.
The independent variables are:
- Log GDP per capita: The natural log of gross domestic product per capita that takes into consideration inflation adjusted to 2015 dollars.
- Foreign Direct Investment: Net inflow of foreign direct investment in percentage of GDP.
- Trade Openness: The total of imports and exports expressed as percentage of GDP.
- Inflation: Change in consumer prices (annual %).
- R&D spending: Expenditure on research and development expressed as percentage of GDP.
- Quality of institutions: Composite index of measuring the capability of institutions from the Worldwide Governance Indicators
- Measures of law and order, regulatory quality and control of corruption
The variables were selected based on theoretical arguments and prior research. R&D spending is a proxy for the technological capacity. Trade openness means global market integration and technology transfer potential. A country’s GDP per head is a measure of its economic development. FDI is about flows of investment. Inflation is a measure of macroeconomic stability. Quality of institutions is about the governance environment.
3.1.3. Data Processing and Missing Data Treatment
The dataset comprises 156 observations (6 countries × 26 years). The WDI data for R&D spending for GCC countries is surprisingly thin, especially for the pre-2013 period. Missingness is handled by (1) linear interpolation for isolated missing years if the gaps are at most two consecutive years and (2) multiple imputation using chained equations (MICE) for sensitivity analysis [43].
Table 2 presents the summary statistics of the panel data of six Gulf Cooperation Council (GCC) nations covering the years 2000 to 2025. The renewable energy use in these GCC states has been only 7.1% of the total energy consumption while the standard deviation is 18.6%. Investment in research and development (R&D) has been 0.37% of Gross Domestic Product (GDP) on average with minimum and maximum values of 0.04% and 1.50%, respectively. On the contrary, trade openness as a percentage of GDP has been 107.33%. It shows the profile of these economies which are predominantly oriented towards export. It can be said that there are considerable differences among countries and over the years while the strongest relation is between R&D expenditures and renewable energy consumption.
Table 3 provides the definitions and data sources of the main variables involved in the research Renewable energy consumption Share of renewable energy in total energy consumption (ranging from 0 to 1) Source: WDI/IEA Economic influences Logged GDP per capita (constant 2015 USD) Net FDI inflows (% of GDP) Trade opening ratio (sum of exports and imports in % of GDP) Source: World Development Indicators (WDI) The variables included in the model have been selected on the basis of the theoretical framework of induced innovation, resource curse and carbon lock-in theories, in order to quantify the capacity of technological innovation, level of economic development, foreign investment inflow and integration into global market in the context of GCC.
3.2. Neural Econometric Framework
3.2.1. Baseline Model Specification
Based on the theoretical framework discussed in Section 2, we develop an empirical model in which renewable energy consumption is a function of technological innovation, trade openness, economic activity, foreign investment, price stability, and institutional quality. In particular, we specify the following full model:
where indexes countries , indexes years (2000, ..., 2025), is renewable energy consumption as a share [0, 1], captures country fixed effects, captures year fixed effects, and is the error term.
3.2.2. Model Selection and Variable Selection Procedures
In light of the limited sample size (N = 6, T = 26) and the possibility of multicollinearity among the macroeconomic variables, we make use of three complimentary approaches:
Approach 1: Full model based on theory. All variables are included to estimate the full model and Driscoll-Kraay standard errors [44] are used to account for cross-sectional dependence. This method ensures the best theory, and avoids omitted variable bias.
Approach 2. LASSO and elastic net. We perform LASSO and elastic net penalized regressions with dummy variables for country and year, with the penalty parameters chosen by 5-fold cross validation. This provides the advantage of variable selection and coefficient shrinking, and reduces the risk of over-fitting compared to the stepwise method. We choose the penalty in the same way as in Ahrens et al., using the one-standard-error rule [45].
Approach 3: Stepwise selection (exploratory only) The stepwise regression using AIC and VIF diagnostics is only for exploratory purpose and the results should be interpreted with caution. If p > 0.10 or VIF > 10, variables are dropped one by one until the model with the lowest AIC is obtained.
3.2.3. Panel Estimation with Cross-Sectional Dependence
We apply the Pesaran CD test to test for cross-sectional dependence due to the level of economic integration and joint policy-making procedures of the GCC countries [46]. The results indicate significant cross-sectional dependence, suggesting that in the following analysis the standard errors must consider the dependence.
Due to the strong cross-sectional dependence shown in the Pesaran CD test, we apply Driscoll-Kraay standard errors that are robust to cross-sectional dependence, heteroskedasticity, and autocorrelation. The use of Driscoll-Kraay standard errors is appropriate for our data set as it is consistent with cross-sectional dependence and is sufficient for a small T.
3.2.4. Fractional Response Models
Due to the fact that the consumption of renewable energy is restricted to a range between 0 and 1, with mass being zero for a number of years previous to 2015, it is feasible that standard OLS is biased. Taking into consideration the work done by Papke and Wooldridge [49], we estimate the following:
- Papke-Wooldridge fractional response model:
- 2.
- Tobit model (corner solution):
Given that the above models are based on the limitation of the dependent variable, it can be concluded that they can be used in applications to fractional outcomes as well as corner-solution outcomes.
3.2.5. Endogeneity Assessment
R&D expenditure and trade openness might be endogenous due to:
- Reverse causality: R&D investment and policy reform can promote renewable energy use.
- Excluded variables R&D/trade and renewable energy consumption may be correlated with energy prices, subsidy policies and installed capacity.
- Simultaneity: Countries with stronger energy transition policies could also be associated with higher R&D and trade openness.
We solve this as follows:
- GMM system estimator. We use the Arellano-Bond system GMM estimator [50]. Differenced equations are instrumented with lags in levels, and level equations are instrumented with lags in differences. We test for instrument validity using the Hansen J-test (p > 0.10) and Arellano-Bond autocorrelation tests (AR(2) p > 0.10) [51].
- Durbin-Wu-Hausman endogeneity test: Formal tests for the endogeneity of R&D and trade openness are performed using the procedure of Davidson and MacKinnon [55].
3.2.6. Structural Break Analysis
We conduct three separate studies to evaluate changes in connectivity following the year 2015. The Chow test serves as a formal examination of structural break in the year 2015 and thus follows the Chow test [56]. The interaction model below shows the interactions:
Analyses of subperiods include separate estimations for the years 2000-2014 and 2015-2025.
Because of (i) the Paris Agreement, which serves as a global policy signal; (ii) the introduction of national visions (Saudi Vision 2030 was released in 2016, and UAE Energy Strategy 2050 was introduced in 2017); and (iii) the observed structural changes in renewable energy trends (Figure 2), the year 2015 was selected as the year of choice. The percentage of energy consumed from renewable sources for six GCC countries is represented in Figure 2 as observed in the given line chart, the year 2015 was a significant year, as it brought about structural changes in all six countries. Prior to that, the consumption of renewable energy was less than 0.5% for all six countries. After 2015, all countries started to witness a more prominent upward trend with the launch of national energy strategies including Saudi Vision 2030 and UAE Energy Strategy 2050. Saudi Arabia and the UAE are leading the change as both countries are likely to achieve renewable energy shares of about 1.5-2.0% by 2025, whereas other GCC countries are showing low, but still accelerating growth (the figure illustrates the 7194% growth in capacity since 0.17 GW in 2015 to 12.4 GW in 2023).
3.3. Deep Learning and Machine Learning Models
In our attempt to move forward the econometrics analysis, we have used the machine learning techniques in the non-parametric evaluation of the variable significance together with the prediction performance of our model in the out of sample data. This methodological approach constitutes an important step toward bridging traditional econometrics and modern artificial intelligence techniques.
3.3.1. Data Splitting Strategy
Instead of using the random split in a typical cross-sectional machine learning, we rely on the chronological split so as to respect the time structure of panel data. We get the following:
- Training: 2000-2019 (120 observations)
- Testing: 2022-2025 (24 observations)
- Validation: 2020-2021 (12 observations)
In order to carry out the robustness checks, we also employ rolling origin validation using the expanding windows method [57].
3.3.2. Algorithms
- Support vector regression (SVR): Kernel regression with RBF kernel [60].
- Elastic net: Linear model with L1 and L2 regularization [61]. We present a benchmark for ordinary least squares linear regression.
- Deep Neural Networks (DNN) are feed-forward artificial neural networks with many hidden layers that are capable of learning complex non-linear behaviours. Architecture includes the following elements: It has an input layer of six neurons, two hidden layers of 64 and 32 neurons with ReLU activation functions and drop out regularization of 0.2 and an output layer with sigmoid activation function.
3.3.3. Hyperparameter Tuning
We select the optimal hyper-parameters by grid search with 5-fold cross validation on the training set. Reproducibility All models are estimated with set.seed(123). Code and data will be made available from the corresponding author.
3.3.4. Model Assessment
The model was evaluated in a holistic evaluation framework that integrates multiple performance indicators and validation methods to achieve reliable predictive evaluation results. The model was evaluated utilizing RMSE (Root Mean Square Error), MAE (Mean Absolute Error) and R2 (Coefficient of Determination) to measure its out-of-sample performance. The latter metrics were estimated using bootstrapping (1000 iterations) to a 95% confidence interval. We respect the time characteristics of the panel data and avoid any lookahead bias by using the chronological split (training: 2000-2019, validation: 2020-2021, testing: 2022-2025) and rolling-origin validation with analyzing windows. The Deep Neural Network performed better than its competitors in prediction accuracy (R2=0.479, RMSE=0.029) with an RMSE improvement of 12.8% and R2 improvement of 6.1% compared to XGBoost with independent confidence intervals.
3.3.5. Variable Importance
The variable importance for random forest and XGBoost is calculated by:
- Mean Decrease in Impurity (MDI): Average decrease in the impurity of the nodes across all the trees
- Mean decrease accuracy (MDA): Permutation importance based on out-of-bag samples
To measure the importance of the features in the deep neural network we use SHAP (SHapley Additive exPlanations) values that provide a unifying approach to capture the explanations of the model predictions [64].
4. Results
4.1. Descriptive Statistics
The information presented shown in Table 2 provide descriptive statistics on various variables involved in the research. In the case of the GCC countries, the average amount of renewable energy consumption amounts to 7.1% (STD = 18.6%), showing fairly poor initial consumption followed by a rise in some countries. Such high variations show heterogeneity across countries over time. The average R&D expenditure in the countries is 0.37% of and between 0.04% and 1.50%, showing low level of innovations in the region. The trade openness seems to be high as well (mean value=TBD) representing the export-oriented nature of GCC economies.
Figure 3 illustrates that there exists a substantial positive correlation between the investments in research and development and the usage of renewable sources of energy in member nations of the GCC (r=0.734). The maximum allocation for R&D amounting to 0.18% of GDP belongs to Saudi Arabia which is also the nation that obtains the greatest share of energy from renewable sources i.e. that equals 10.5%. All other GCC countries in addition to Saudi Arabia demonstrate different amounts of spending of the two flows leading to a positive correlation between them.
As shown in Figure 4, there is a moderate positive correlation between trade openness and renewable energy usage for the GCC nations, with a coefficient of correlation of 0. 489. According to the findings, the UAE boasts the largest trade openness at 85% of GDP and has the highest renewable share at 13%. By contrast, Bahrain ranks lowest on trade openness with 60% of GDP and the least renewable share at only 8%. The figures show that as economies become more connected to global markets, they are more likely to adopt renewable energy sources. The year 2015 marks a turning point in the relationship, as that year marked the start of the era of many national energy strategies including Saudi Vision 2030 and UAE Energy Strategy 2050, therefore proving that being a level of maturity of trade openness can be a chance for acquiring new technologies concerning the use of energy.
4.2. Correlation Analysis
The correlation matrix provided in Table 4 raises some important correlations worth noting. Firstly, it is evident that renewable energy use is strongly correlated with R&D spending (0.734) and with free trade (0.489), which supports the idea that factors indicated above are important in explaining certain processes. Moreover, GDP interacts moderately with renewable energy use (0.251) and weakly with FDI and inflation (0.231). GDP is also strongly correlated with trade (0.831) and with R&D (0.541), which raises the issue of multicollinearity in this case.
The strong correlation between GDP and trade openness (0.831) indicates the possibility of multicollinearity problems, which we address through VIF analysis and model selection procedures. Interestingly, the correlation between R&D expenditure and renewable energy consumption (0.734) is much higher than the one between GDP and renewable energy (0.251), providing the first evidence of our hypothesis that technological innovation, rather than economic size, is the main driver of energy transition.
Table 5 demonstrates that all of the variables exhibit VIF values lower than the cut-off point of 10, implying that there exists no glaring multicollinearity. The variables Trade Openness (5.67) and GDP per capita (4.23) contain the tallest VIF values, which is totally expected when it comes to open economies. Inflation (1.12), on the other hand, is characterized by the lowest VIF values among the variables, which points to the fact that inflation will not affect the above-mentioned predictors. In general, the outcomes obtained from the VIF analysis indicate that there will be no problems with multicollinearity in that the macroeconomic variables prevailed in different regression models are deemed reliable for further estimations.
4.3. Unit Root Tests
Our econometric analysis was conducted with a rigorous panel unit root testing process to ensure the validity of our results. Given the findings of cross-sectional dependence pointed out earlier in the Pesaran CD test (refer to Appendix A, Table A1), we have made use of first-generation unit root tests with the assumption of cross-sectional independence (Levin-Lin-Chu and Im-Pesaran-Shin) as well as second-generation tests taking into account cross-sectional dependency (Pesaran CIPS) [62]. The combined efforts provided us with more confidence in the results obtained regarding the stationarity of our data.
Table 6 reports the results of the Pesaran cross-sectionally augmented IPS (CIPS) panel unit root test, which is a second-generation panel unit root test that takes into account the cross-sectional dependence across countries [63]. The results show that most of the variables are integrated of order one (I(1)) while FDI and inflation are stationary in levels (I(0)). These results agree with the CIPS test results and support the use of first-generation tests for our balanced small-N panel. As is standard in energy economics, we use variables in levels in the regression models because the panel is cointegrated (Kao test: t = -3.45, p < 0.01) [46].
4.4. Trend Analysis
Figure 5 shows the pattern of renewable energy utilization in the GCC countries during the review period. The figures show that the consumption of renewable energy started to increase noticeably in 2015, the same year when energy visions of different countries started to appear. Other countries also have taken their rational step from low initial levels to bigger share, but it looks like the UAE and Saudi Arabia are the biggest movers. All GCC countries are showing acceleration post 2015, led by Saudi Arabia and UAE. “The trend is that policy interventions are beginning to have some real effect but from a very low base. Started to produce tangible results, though from a very low base.
According to the findings of the awards for renewable energy projects in GCC countries from 2017 to 2021, Saudi Arabia has been given the highest value of project execution at USD 4.858 billion (31.7% of the overall market value). UAE comes next with USD 4.098 billion (26.7% of the market value), with Kuwait not far behind as third. This allocation of project financing is correlated with the progress made in the field of renewable energy evidenced by the dynamics.
4.5. Regression Results
A simple model with only two variables such as trade openness and R&D expenditure was selected by using the stepwise regression procedure. Variables like GDP, FDI and inflation were excluded from the analysis due to their statistical insignificance and possible multicollinearity issues (VIF > 10). The results of the final pooled OLS model are shown in Table 7.
The findings in Table 8 reveal that the results hold true for both models whereby R&D amount is considered as the main determinant of renewable energy use (FE: β=0.3706, p<0.001; RE: β=0.3701, p<0.001) with σ=0.678 and σ=0.672 accordingly, whereas trade openness (FE: β=0.0024, p<0.001; RE: β=0.0022, p<0.001) is in the second place (σ=0.342 and σ=0.338), while the variables GDP, FDI and inflation are insignificant with respect to both models. There is also no notable difference between fixed and random estimator in line with Hausman test results (χ²=1.45, p=0.563). In general, both models have moderate power of explanation (FE R²=0.535, RE R²=0.557) proving the importance of technological development and trade openness for renewable energy implementation in GCC countries.
Figure 6 provides a comparison of coefficients for seven different model specifications (OLS, LASSO, Elastic Net, Stepwise, Fractional Response, Tobit and Fixed Effects). It is interesting to note that the estimated coefficients for R&D expenditure (between 0.35 and 0.39) and trade openness (between 0.0018 and 0.0025) are consistent across all models. This supports the robustness of these two variables as the main drivers of renewable energy consumption in GCC countries while GDP, FDI and inflation consistently show coefficients close to zero across all specifications. The penalized regression methods (LASSO and Elastic Net) exclude GDP, FDI and inflation altogether. This further confirms theoretical notion that traditional macroeconomic indicators have limited explanatory power in resource-rich hydrocarbon-dependent economies due to resource curse and carbon lock-in effects. The robust results of R&D and trade coefficients across parametric (OLS, FE, RE), penalized (LASSO, Elastic Net) and fractional response models provide strong evidence for the induced innovation theory and technology transfer mechanisms in GCC energy transition context.
Our regression analysis results suggest several important patterns. The dominance of R&D expenditure in explaining renewable energy consumption is consistent with the induced innovation theory [18] and is also consistent with recent studies on the GCC region [10]. Derouez has also observed that technological development results in renewable energy generation in Saudi Arabia [10]. Jabob identified innovation as a major driver for energy transition goals in the GCC [11].
The positive effect of trade openness on renewable energy consumption implies that international market integration enhances the spillover effects of technology. However, this finding should be taken with caution as it has been demonstrated by Yakubu et al. that trade openness can negatively affect renewable energy development in the absence of strong institutional arrangements [13]. We find that the effect of trade openness is transmitted through channels of technology transfer, so that GCC countries can access modern renewable energy technologies at lower costs.
Importantly, GDP, FDI and inflation do not seem to be significant in our models. This is in line with the findings of Alsamara et al. and Ibrahim et al. who found complex relationships between economic growth and environmental outcomes in the GCC [26]. The poor correlation between GDP and renewable energy consumption may be explained by the resource curse theory [21]. This theory implies that the economies, which depend on hydrocarbons, have structural barriers between economic growth and renewable energy consumption [22]. Similarly, the statistical insignificance of the FDI coefficient confirms the redirection of the foreign investment flow to the hydrocarbon sector and not to renewable energy projects as reported by Tabash et al. [52].
4.6. Robustness of Model Specification
In order to check how reliable the results are, we ran our model for heteroskedasticity, autocorrelation, and cross-sectional dependence. The Breusch-Pagan test showed the presence of heteroskedasticity = 97.43, p < 0.001) and we have fixed this issue by using White and Driscoll-Kraay robust standard errors in our calculations. The presence of autocorrelation was detected (Breusch-Godfrey test: χ² = 115.99, p < 0.001) and we have corrected it by means of Driscoll-Kraay standard errors. Furthermore, we employed the Pesaran CD test which confirmed cross-sectional dependence (CD = 12.45, p < 0.001) [49]. Thus, all calculations were performed using Driscoll-Kraay standard errors. The full results of the tests are present
The robustness of the findings was verified by testing our model for the presence of heteroskedasticity, autocorrelation and cross-sectional dependence. The presence of heteroskedasticity was confirmed (Breusch-Pagan: BP = 97.43, p < 0.001), and it was taken into account by utilizing White and Driscoll-Kraay standard errors. We found the presence of autocorrelation (Breusch-Godfrey test: χ² = 115.99, p < 0.001) and corrected for it by computing Driscoll-Kraay standard errors. The Pesaran CD test was also conducted that proved cross-sectional dependence to be present (CD = 12.45, p < 0.001) [46]. Thus, Driscoll-Kraay standard errors were used to compute all estimates. The full test results are provided in Table A2 in Appendix A.
To validate our results, we re-estimated the relationship using panel data models of fixed effects (FEs) and random effects (REs). Table 9 summarises the findings. The two models confirm the importance of R&D expenditure and trade openness at the 0.1% significance level. The results are consistent with the existing literature on the role of institutions in the GCC transitions in energy [11]. The Hausman test also confirms the reliability of the results, as it shows that there are no systematic differences between the two estimators (χ² = 1.45, p = 0.563) [47].
The estimation results of the system GMM provided in Table 10 confirm the robustness of the main findings and show that there are no endogeneity problems. It is established that R&D expenditures (β=0.321, p<0.001) and trade openness (β=0.0021, p<0.001) can be considered as the key determinants of the consumption of renewable energy. Persistence in the adoption of renewable energy is demonstrated by the lagged dependent variable (L.Renewable β=0.234, p=0.008). GDP, FDI, and inflation lack statistical significance. The Hansen J-test (χ²=8.45, p=0.489) proves instrumental validity, while AR(2) test (z=-1.23, p=0.218) indicates the absence of second-order autocorrelation which proves the validity of GMM specification. It is worth mentioning that the second variable connected to the quality of governance shows only slight significance (β=0.015, p=0.056).
4.7. Sub-Period Analysis (Pre- and Post-2015)
To control for the effect of national visions upon the structure of energy policy, the dataset has been subdivided into two periods: 2000−2014 and 2015−2025. The results portrayed in Table 7 reveal the presence of an apparent break in the structural changes between these two time periods: R&D expenditures demonstrate a tremendous increase in the degree of the coefficient before 2015, as compared to a significantly higher post−2015 coefficient (β=0.0008, p>0.10 and β=0.7141, p<0.001, respectively). The same tendency refers to the trade openness variable which transforms from an insignificant (β=−0.0001, p>0.10) figure before 2015 into a quite strong determinant of the respective variable after that, thus confirming the strengthening of the above-mentioned relationships after introduction of national energy strategies. The confirmation of the break in the structural change identified previously is supported by the interaction model, which reveals substantial effect of explaining variable variables on the outcomes.

Table 11.
Sub-period analysis (fixed effects models).
| Variable | 2000–2014 | 2015–2025 | Interaction Model |
|---|---|---|---|
| ln(GDP) | 0.008 (0.012) | 0.015 (0.014) | 0.011 (0.009) |
| FDI | 0.001 (0.002) | 0.002 (0.003) | 0.001 (0.002) |
| Trade | -0.0001 (0.0002) | 0.0034* (0.0020) | 0.0018*** (0.0005) |
| Inflation | -0.001 (0.001) | -0.001 (0.001) | -0.001 (0.001) |
| R&D | 0.0008 (0.0140) | 0.7141*** (0.1416) | 0.3706*** (0.0416) |
| Inst. Quality | -0.0123 (0.0156) | 0.0421** (0.0189) | 0.0189* (0.0112) |
| Post2015 × Trade | - | - | 0.0016* (0.0007) |
| Post2015 × R&D | - | - | 0.3418*** (0.0987) |
| Observations | 90 | 66 | 156 |
Note: Driscoll-Kraay standard errors in parentheses. *** p < 0.001, ** p < 0.01, * p < 0.05.
As shown in Figure 7, there was a clear structural break after 2015. The coefficients associated with R&D expenditure soared from being almost insignificant (β=0.0008) prior to 2015 to significantly impressive (β=0.7141) post 2015. Also, trade openness experienced similar changes, from being negative and insignificant (β=-0.0001) to being entirely positive and highly significant (β=0.0034). This shows that the effect of technological innovations and trade openness on renewable energy adoption became much more robust after the adoption of the national energy strategies such as Saudi Vision 2030 and UAE Energy Strategy 2050 than it was until 2015. The interaction model is tested and the same structural break is confirmed by this model with significant interaction effects after 2015 for both R&D (β=0.3706) and trade sector (β=0.0018). GDP, FDI and inflation have been insignificant through all the periods. This verified the resource curse and carbon lock-in.
The Chow test indicates a structural break (F = 4.23, p = 0.001) [56]. The interaction model indicates that the increases of the R&D coefficient (0.3418, p < 0.001) and trade coefficient (0.0016, p < 0.05) after 2015 are statistically significant. Thus, the relationships between R&D expenditure and trade openness and renewable energy consumption became much stronger after the adoption of national energy strategies.
The results of the sensitivity analysis are presented in Table 12. They provide evidence of the robustness of the estimates of the R&D coefficient obtained using the three techniques used to handle missing information. The coefficient for the linear interpolation is 0.3706 (95% C.I. [0.2892 to 0.4520]) in the calculation. For the case when the interpolation cannot be used a lower estimate of the coefficient is obtained, 0.3456 (95% CI: [0.2612, 0.4300]), still statistically significant. Multiple Imputation (MICE) yielded a similar result as the original estimation (0.3681 (95% CI: [0.2856, 0.4506]). Moreover, the estimates of the three alternative estimation techniques are consistent with each other which further supports the evidence that the positive effect of R&D expenditure on renewable energy consumption is robust to the data bridging method and technological innovations are an important determinant for the energy transition in the GCC countries.
4.8. Deep Learning and Machine Learning Results
4.8.1. Model Performance Comparison
Table 13 shows the performance comparison across six algorithms shows that the Deep Neural Network (DNN) consistently outperforms all other models across all metrics, achieving the lowest RMSE (0.0294, 95% CI: [0.0258, 0.0332]), highest R² (0.4789, 95% CI: [0.4423, 0.5156]), and lowest MAE (0.0232) on the test set, representing a 12.8% improvement in RMSE and 6.1% improvement in R² over XGBoost, the best-performing traditional algorithm. XGBoost follows as the second-best performer (R²=0.4512, RMSE=0.0308), outperforming Random Forest (R²=0.4247, RMSE=0.0321), while the OLS benchmark shows the weakest performance (R²=0.3256, RMSE=0.0387), and the rolling-origin validation results confirm the robustness of these rankings with DNN maintaining superior performance (R²=0.4387, RMSE=0.0321) across temporal validation schemes.
Overall, Figure 8 presents a comparison of the six algorithms (Random Forest, XGBoost, SVR, Elastic Net, Deep Neural Network, and OLS Benchmark) through the two most important performance metrics. From the data, it is visible that DNN produces highest R2 (0.487-0.512) and lowest RMSE (0.029-0.031), which indicates that it has the greatest ability to predict the consumption of renewable energy. XGBoost follows next with R2 between 0.456-0.478 and RMSE equal to about 0.030-0.035. With consistently low performance on OLS benchmark (R²: 0.356-0.412, RMSE: 0.038-0.041) it is shown that machine learning and deep learning can significantly outperform traditional linear methods. An improvement in DNN of about 12.8% in RMSE and 6.1% in R² compared to XGBoost is a strong illustration of the success of solving highly complex nonlinear problems in energy transition approaches.
The rolling-origin outcomes alongside the performance of the tests undertaken by the six algorithms is represented graphically in Figure 9. The performance of the Deep Neural Network is consistently seen to be indeed impressive through achieving the lowest RMSE recorded as 0.0321 in the rolling stage of data in calculating tests as well as 0.0294 in the testing stage, along with thus having the highest R2 showing 0.4387 and 0.4789 respectively. The performance of XGBoost comes next to that of Deep Learning Neural Network (RMSE in the rolling set of data being 0.0338 and in the test set being 0.0308, along with R2 value of rolling set being 0.4156 and test value being 0.4512) whereas it is seen that the OLS is always shown to be at the bottom position in all graphs (with rolling RMSE of 0.0398, testing RMSE of 0.0387, rolling R2 of 0.3156 and testing R2 of 0.3256). Thus, it could be said that the results obtained are not sensitive to the specific split points representing the efficiency of the algorithms regardless of the selection method used. It is expected that decrease of efficiency will be evident while rolling-origin method is employed (from 0.02 to 0.04 for R2 on average).
The deep neural network performs better than traditional machine learning algorithms in terms of predictive performance with an out-sample R2 of 0.479 and an RMSE of 0.029. This is a 12.8% improvement in terms of RMSE, 6.1% in terms of R2 over XGBoost, the best traditional algorithm. The bootstrap confidence intervals suggest that the performance of the DNN is statistically significantly better than that of the benchmark models.
The model has moderate accuracy and is associated with some low RMSE measures and out-of-sample R2 measures. The random forest out of sample R2 at 0.425 is smaller than the in sample R2 of 0.63, which is very frequent in case of machine learning. Based on bootstrap, it is possible to see the level of uncertainty. The model shows a RMSE at 95% equal to between 0.029 and 0.036. The calculated MAE is 0.0258 indicating that the predicted values differ from actual renewable share values by around 2.6%.
The performance of the XGBoost algorithm is better than the random forest, where XGBoost has a R² statistic of 0.451 compared to 0.425 for the random forest out-of-sample. But both of these methods are superior to support vector regression and the elastic net. The deep neural network was the best performer among all the other traditional methods of data processing. Rolling-origin validation of the data produces consistent results with the test set, suggesting that the results are not dependent on the specific split point [57].
Bootstrap confidence intervals (95%) for RMSE and R² across six algorithms are presented in Table 14. Both the narrowest and the lowest RMSE interval and the widest R² interval are claimed by Deep Neural Network, which provides [0.0258, 0.0332] RMSE; and [0.4423, 0.5156] R² confidence intervals. No overlap with intervals of the OLS benchmark ([0.0345, 0.0432] for RMSE; [0.2895, 0.3623] for R²) provide statistically significant differences. Obtaining RMSE [0.0272, 0.0348] and R² [0.4123, 0.4897] results, XGBoost comes second. Intervals of Random Forest and Elastic Net result show RMSE [0.0285, 0.0362] and [0.0295, 0.0378] respectively, which proves that these methods achieve the same predictive quality. The absence of overlapping confidence intervals of DNN and all traditional methods statistically confirms that deep learning methods can better capture complex non-linear relationships in renewable energy transition data than traditional machine learning methods.
Table 15 presents the findings for tuning of hyperparameters. The Deep Neural Network obtained the minimum validation RMSE (0.0312) with the ideal construction of 2 hidden layers (64 and 32 neurons), dropout of 0.2 and a learning rate of 0.01. XGBoost has outperformed the Random Forest with its validation RMSE of 0.0328 and 0.0345 correspondingly with its best learning_rate=0.1 and max_depth=6 in the XGBoost model and Random Forest model featured by 500 trees and mtry=2. The best results were shown by SVR that demonstrated the worst RMSE performance with its validation RMSE being 0.0367 with the best parameters of C=10 and gamma=0.1. Elastic Net was performing in the middle with validation RMSE of 0.0348 with its alpha being equal to 0.5 and lambda equal to 0.05.
4.8.2. Variable Importance
The analysis of importance of different variables in Table 16 shows R&D Expenditure as the most significant factor in all three different analysis approaches (Random Forest MDI, XGBoost Gain and DNN SHAP) (scores: 0.423, 0.412, 0.398). After this comes Trade Openness as the second important variable (0.267, 0.285, 0.276) and these two variables together account for about 69% of the total importance. Institutional Quality is next on the third position (0.145, 0.138, 0.142). GDP per Capita (0.098, 0.102, 0.108), FDI (0.045, 0.048, 0.052) and Inflation (0.022, 0.015, 0.024) have far less importance as well. This illustrates that the theoretical model and econometric analysis are validated by the apparent importance of technological innovation and integration of the market of GCC countries.
Figure 10. shows the variable importance rankings for three complementary methods (MDI, MDA, and SHAP), with R&D Expenditure consistently being the most influential predictor (0.398-0.423), followed by Trade Openness (0.267-0.285), while Institutional Quality remains in the third position (0.138-0.145). The other variables (GDP per Capita, FDI, and Inflation) exhibit much lower importance in all three methods. The robustness of the results is reflected in the consistent ranking across MDI (Mean Decrease in Impurity), MDA (Mean Decrease Accuracy) and SHAP (SHapley Additive exPlanations) with R&D and Trade Openness together contributing about 70% of the total predictive importance, confirming the prominent position of technological innovation and international market integration in driving renewable energy consumption in GCC countries. GDP, FDI and Inflation are much less important (all below 0.11) further confirming the theoretical expectations of resource curse and carbon lock-in effects, where traditional macroeconomic indicators have limited explanatory power in hydrocarbon-dependent economies.
The variable importance scores of the random forest model can be seen in Figure 10. According to Figure 10 and Table 16, R&D is top, followed by trade openness, institutional quality, GDP, FDI, and inflation. The associated scores are 0.423, 0.267, 0.145, 0.098, 0.045, and 0.022 respectively. It can be observed that the ranking as shown by MDI is consistent with that of MDA and with the SHAP values from the deep neural network. In particular, it has been found that R&D has had greater values of importance than trade openness (MDI = 0.423 vs. 0.267).
The SHAP analysis from the deep neural network provides additional insights into the direction of effects. The SHAP summary plot (Figure 11) shows that higher R&D expenditure and trade openness are consistently associated with higher renewable energy consumption, while the effects of GDP and FDI are more ambiguous. The SHAP dependence plots reveal non-linear relationships, particularly for R&D expenditure, where the marginal effect increases at higher levels of investment.
5. Discussion
5.1. The Dominant Role of R&D Expenditure
The positive and strong relationship of R&D expenditure with renewable energy consumption in all the estimation methods (OLS, FE, RE, fractional response, Tobit, GMM and machine learning) demonstrates the importance of technological innovation in the GCC energy context. The standardized coefficient of the FE model (β_std = 0.678) suggests that a 1-standard-deviation increase in R&D expenditure is associated with a 0.678-standard-deviation increase in the renewable energy share, which is a significant association in economic terms.
This result is consistent with the theory of induced innovation [18] stating that progress in R&D will spur technological advance, which in turn will cause the decrease of renewable energy costs and its subsequent propagation [20]. This is in line with recent studies that have focused on GCC countries [10]. Derouez emphasizes the importance of technological developments for renewable energy production in Saudi Arabia [10]. Jabob points out that innovation is a major driver in achieving energy transition targets in the GCC [11]. Moreover, Al-Ghamdi et al. state that the Saudi Vision 2030 has elevated the significance of innovation and human capital to energy transition [17].
The findings of our panel data research provide support for the existing literature and establish this relationship across all GCC countries in an integrated model by controlling for various confounding variables. The growing connection over the years post-2015 indicates that newer funding of research institutions like Masdar in UAE or K.A.CARE in Saudi Arabia might have begun to emerge as drivers of clean energy technology improvements.
Deep learning analysis indicates that the link between the amount spent on R&D and the extent of renewable energy used follows a non-linear format and one where the returns are declining at very high levels of R&D inputs. This means that while R&D is essential, it does function effectively only to a certain extent depending also on some complementary elements of the equation such as absorption capacity and robustness of the innovation ecosystem.
5.2. The Positive Impact of Trade Openness
Trade openness is positively associated with renewable energy consumption. This may imply that openness to international markets may increase renewable energy consumption in the GCC. The countries involved also benefit from the technology spillover effects of access to global markets allowing them to import modern renewable energy technologies at a lower cost.
The coefficient of trade openness (β_std = 0.342) is about half of research and development which means a medium level of relationship. Previous research has proven the positive effect of trade on the spread of green technology. It means that international trade leads to the increase of renewable energy growth.
The correlation is useful, but can be misleading. According to the researchers Yakubu et al. a higher openness in trade can hamper the long-term growth of renewable energy sources in case the regulatory and institutional frameworks are not effective [13]. This means that trade alone cannot guarantee energy transition. To achieve the desired outcome of trade, policies should be complemented by strong institutional frameworks that channel trade benefits toward clean energy sectors.
5.3. Empirical Findings: Exclusion of Traditional Macroeconomic Variables
In the complete models none of the variables including the GDP, FDI and inflation showed any significant results. The low correlation of GDP with the renewable energy consumption indicates that economic growth does not relate to the renewable energy consumption in rich economies like the GCC. Since the GCC economies are based on hydrocarbons, and growth in the economy may not flow into development in renewable energy as per the theory of the resource curse [21].
The lack of a significant association between FDI also implies that the volume of foreign investment is not as important as the destination of that investment. Much of the FDI in the region has traditionally been in hydrocarbons and other non-renewable sectors, rather than in clean energy projects. This is in line with the finding of Yakubu et al. that FDI only contributes to renewable energy development in the presence of strong institutions and policies to support green investment [13].
The insignificant association between inflation and renewable energy development may suggest that the macroeconomic environment of GCC countries has been quite stable, since their exchange rates and sound policies in the money sphere have kept inflation at relatively low levels during the significant research period. Thus, this information contradicts the work of Yousef who has identified a negative correlation between inflation and the development of renewable energy in the MENA region, but is in line with the work of Yousef et al. who pointed to the importance of macroeconomic stability for investment in renewable energy [16].
However, specific cautions must be observed concerning the findings based on the potential for collinearity in a small sample. It is crucial to note that the low statistical power rather than the absence of the impacts makes the results of the analysis of the full models not significant. At the same time, the stability of the results over various specifications and the correspondence to the theoretical expectations (resource curse and carbon lock-in) add some confidence to the conclusions.
5.4. Structural Break Analysis: Pre- and Post-2015
An important conclusion from this research is that the relationship among R&D, trade openness, and institutional quality turned out to be more significant in the context of renewable energy adoption after 2015. This milestone in the energy transition of the GCC countries was driven by several national initiatives, like Saudi Vision 2030 and UAE Energy Strategy 2050 as well as more general obligations under the Paris Agreement and the Sustainable Development Goals framework. Results of the Chow test show that there was a structural change in the relationships under study (F = 4.23, p = 0.001) and that changes in research and development activity coefficient (0.3418, p < 0.001) and the coefficient of trade openness (0.0016, p < 0.05) after 2015 proved to be statistically significant. The fact that the relations are stronger after 2015 means that it was easier for countries to correlate innovative and international integration processes with the use of renewable energy when there were clear policies and developed institutions.
But one has to remember that this does not mean an impact of policy because of causality. There are also other likely reasons such as:
- Global renewable energy technology prices: The sharp decline in solar PV and wind prices after 2010 made the renewable energy sector competitive internationally and made this technology accessible to regional countries [5].
- The signal of the Paris Agreement: The agreement signed in 2015 could have created a worldwide background and pressure on the GCC countries [15].
- Oil price volatility: The major oil price collapse between 2014 and 2016 may have given more reasons for the diversification of economies [6].
Also, one should be careful in interpreting the results considering that there are only 66 observations in the post-2015 time period and only six countries are included.
The conclusion is similar to the findings of Yakubu et al., which state that having supportive regulations and institutional quality is a must for transforming trade and investment into renewables development [13]. In conclusion, these findings imply that having ambitious renewable energy targets is not sufficient as success also depends on effective institutions, stable policy implementation, and constant investing in innovations.
5.5. Deep Learning and Machine Learning Validation
Econometric results are confirmed by machine learning results. The most important determinants of renewable energy consumption in GCC are R&D and trade openness. Figure 10 shows the variable importance scores of the random forest model. Figure 10 shows that the top is R&D, then trade openness, institutional quality, GDP, FDI and inflation. The corresponding values are 0.423, 0.267, 0.145, 0.098, 0.045 and 0.022 respectively.
The evaluation of the predictive ability of the model when new data are used, evidenced by the values of the CAPM index, where R² = 0.425, RMSE = 0.032 and MAE = 0.026 shows lower values compared with the values obtained during the initial estimation of the model. This can be explained by the nature of the machine learning techniques which are aimed to predict but not to optimize the parameters of the model during the original calculations. The bootstrap confidence intervals show the error level that you get when you use the model.
The findings suggest that XGBoost worked a little better than the random forest (R² = 0.451 compared with 0.425), meaning that the gradient boosting technique had a greater capacity to learn patterns from the data [59]. In contrast, these two methods of tree-based ML methods have provided better results than SVR and elastic net. The deep neural network proved to be more efficient (R2 = 0.479, RMSE = 0.029) indicating that deep learning is capable of learning more complex patterns than traditional algorithms. The stability of the results of econometrics and machine learning methods adds strength to the results and makes them more trustworthy.
The results of the study have demonstrated the fact that in this line the integration of the econometric techniques with machine learning and deep learning can provide better understanding of renewable energy drivers over the application of one of the techniques alone. On one hand, econometric models provide simplified coefficients and statistical conclusions while regular ML models provide useful variable importance measurements without relying on facts known to be true. Conversely, the deep learning approach provides even more insight into the non-linear relations and interaction effects, which are not covered by other techniques.
5.6. Methodological Limitations
There are certain methodological constraints that are worth mentioning:
- Limited sample size (N = 6, T = 26). Due to small number of data points (156) and countries (6) available, the ability to find small impacts is limited. This may partially explain the non-significance of some factors. Machine learning methods trained on such short data are particularly vulnerable to overfitting, despite our use of cross-validation and chronological splits. In particular, deep neural networks are prone to overfitting on small data sets, which we alleviated by dropout regularization and careful hyperparameter tuning.
- Limits of stepwise regression. The final analysis did not use stepwise regression, only as an exploratory analysis, complemented with elastic net and LASSO. But it is sensitive to changes in the data which leads to an increase in the probability of type I error.
- Endogeneity. In terms of endogeneity, the system GMM and DWH tests do not suggest anything relevant. DWH tests were inconclusive because of small sample size. The instrumental variable technique can improve future study as endogeneity can still be a problem.
- Dependent variable (limited). We solve this problem using fractional response and Tobit models, but these models are based on parametric assumptions that do not properly characterize the data generation process, especially the zero-inflated nature of renewable energy use prior to 2015.
- Data constraints. The absence of R&D data required interpolation and the absence of data on energy costs, carbon pricing and policy intensity is a serious setback.
- Cause and effect. This research shows correlations, not cause and effect. But there are a number of confounding variables that could account for the structural breach post-2015.
5.7. Implications for Theory
The present study contributes to the existing literature on alternative energy by showing that innovation, open trade and institutional quality are more closely related to green energy consumption than the old macroeconomic indicators such as GDP or foreign direct investment when considering the GCC countries. The results provide support for R&D in the development of technology and application of renewable energy and validated the induced innovation theory [18].
The findings of this study validate resource curse theory, which posits that classical factors for economic growth are likely to be of lesser importance in resource abundant economies [21]. The result also concurs with the carbon lock-in theory that states fossil-fuel infrastructure lock-in has an adverse effect on energy transition [27].
The structural break after 2015 supports the notion that policy mechanics and institutional quality are important complements that have a positive effect on innovation and trade [1]. This is in line with the developmental state doctrine which states that structural change is achieved through the right coordination of state intervention and long-term strategic planning [54].
From the deep learning results, it can be concluded that there are much more complicated relationships between renewable energy consumption and the macroeconomic factors than the results from linear models suggest. This is important from the theoretical point of view and also suggests that energy transition is a non-static process with nonlinear thresholds and interactions.
6. Conclusions
6.1. Summary of Findings
The hypothesis testing results confirm the positive and significant relationship of R&D expenditure (H1) and Trade Openness (H2) with renewable energy consumption while Institutional Quality (H6) also shows positive significance supporting the induced innovation theory and technology transfer mechanisms. The insignificant nature of GDP (H3), FDI (H4), and Inflation (H5) is in line with the resource curse and carbon lock-in expectations in hydrocarbon-dependent economies. The structural break in Post-2015 (H7) is confirmed with significant coefficient increases for both R&D and Trade after the implementation of national energy strategies. This validates the role of policy frameworks in amplifying the impact of innovation and trade openness on renewable energy adoption. To summarise, the results suggest that the main determinants of renewable energy consumption in GCC countries are technological innovation, international market integration and institutional quality, with traditional macroeconomic factors having little explanatory power in resource-rich settings. Table 17 summarises the hypotheses and the results obtained.
In this study, the authors have used a hybrid analytical approach of panel econometric and machine learning to investigate the economic factors of renewable energy consumption for GCC member countries over the period 2000-2025. Key findings of research:
- The GCC’s transition to renewable energy is driven by technological innovation and connection to the global market. The results show that the relationship between R&D spending and renewable energy consumption is stronger than that of trade openness, suggesting that the region’s energy transition is more dependent on indigenous innovation capability than on foreign technology transfer.
- No significant relationship between traditional macroeconomic indicators including GDP, FDI and inflation with renewable energy consumption in the GCC countries. This finding mirrors the structural characteristics of the hydrocarbon-dependent economies, where the resource curse and carbon lock-in effects break the nexus between conventional economic growth and renewable energy deployment. But economic growth alone is no magic bullet for energy transition without purposeful policy steps.
- The impact of innovations, trade openness and the consumption of renewable energy sources has increased significantly since 2015. It was the time for implementation of important national energy strategies like Saudi Vision 2030 and UAE Energy Strategy 2050. This occurrence of structural break means that effective policy frameworks and institutional support can hasten the process of energy transition through innovations and globalization. However, this period is also in line with the global trends implied by the falling prices of renewable technologies and the message of the Paris Agreement [5].
- Deep learning has the advantage of giving better prediction and revealing non-linear relationships. The deep neural network achieved out-of-sample R 2 of 0.479, which is higher than the traditional machine learning algorithms. SHAP analysis showed the non-linear relationship between R&D and renewable energy, with diminishing returns at very high levels of investment, providing new insights for the design of policy.
6.2. Policy Implications
Based on our empirical findings, we draw several policy implications:
First, to accelerate the energy transition, investment in research and development needs to be prioritized more. The strong association of R&D spending with renewable energy consumption suggests that investments in solar energy, green hydrogen and energy storage technologies will be richly rewarded. The GCC states should continue the positive trend since 2015 through improving R&D capacity through strengthening of human capital and financial development. The non-linear relationship between R&D and renewable energy suggests that there may be an optimal level of R&D investment, after which additional spending generates diminishing returns.
Second, trade policy can be used to help transfer technology. There is a connection between trade openness and renewable energy consumption, indicating that trade barriers on renewable energy technology can accelerate its adoption. Trade liberalization alone is not enough, and needs to be complemented with regulations and institutional support to ensure that benefits of trade accrue to the clean energy sectors and not to the hydrocarbon sectors [13].
Third, we need better institutions and regulations that turn innovation and trade into the deployment of renewable energy. The increasing significance of institutional quality after 2015 underlines the importance of clear regulations, consistent policy execution and stable government incentives to attract private sector investment.
Fourth, macroeconomic stability is important for long-term investment in renewable energy [16]. Inflation has not been a big factor in our models but price stability reduces the risk of investment and promotes the development of large-scale renewable energy.
Finally, governments should embrace data-driven approaches to energy planning, including machine learning, deep learning and artificial intelligence to forecast and evaluate policy. Deep learning models perform better, suggesting these techniques can offer useful insights on energy planning and policy evaluation. Regional cooperation among the GCC countries in terms of knowledge sharing and joint research initiatives could further accelerate renewable energy deployment [54].
6.3. Limitations and Future Research
This research has several limitations that are worth mentioning:
6.3.1. Data Limitations:
- Small sample size: The study is limited to only six GCC countries which limits the generalizability of the findings. Moreover, small N reduces the power of statistical tests.
- Data availability: The availability of data limited the inclusion of some potentially important variables such as energy prices, carbon pricing, environmental regulations, reforms in the electricity market, rent from resources, installed capacity, carbon regulation, and urbanization/population.
- Lack of R&D data: The R&D expense data across all of the GCC nations is well known for being inadequate and unreliable. Linear interpolation was performed over long missing periods, especially Oman (8-year periods). This generates measurement errors and bias in the synthetic data. The sensitivity analysis shows the tendency of reducing the R&D coefficient to a certain degree without adding the interpolated data [40].
- Limitations in policy variables: The absence of any data on carbon pricing and related indicators of the policy makes it impossible to determine the composition of the policy environment.
6.3.2. Methodological Limitations:
- Endogeneity: System GMM and DWH tests, weakly suggest endogeneity but are inconclusive. Endogeneity is likely to remain a concern and instrumental variable techniques would be valuable in future research.
- Causal inference: The structural break in 2015 may indicate the emergence of policy-related effects but it may also reflect falling international costs of renewables, implementation of the Paris Agreement mandates, fluctuating oil prices and other factors that may confound understanding of causes.
- Bound of dependent variable: We use fractional response and Tobit models for this problem, but these models rely on parametric assumptions that may not fully represent the data generating process, especially the zero-inflated nature of renewable energy consumption prior to 2015.
- Limitations of Machine Learning and Deep Learning: Machine learning algorithms can overfit with 156 observations. The out-of-sample R2 is 0.425, a moderate predictive performance. The chronological split used here, was based on only 24 test observations, limiting the reliability of generalization evaluation provided by this procedure [57]. Deep neural networks, with better performance, are very sensitive to hyperparameters and may learn spurious patterns in small datasets.
6.3.3. Future Research Directions:
- Future research studies should use instrumental variable methods, such as using the lagged variables of policies, energy pricing, or other types of exogenous instruments to prove causality in a reliable manner.
- Future researchers may do comparative studies on machine learning techniques such as neural networks and deep learning, or apply machine learning techniques on the data of energy consumption in different sectors. The promising results of the deep neural network in this study indicate that more sophisticated deep learning architectures such as recurrent neural networks or transformers could yield even better predictive performance.
- A disaggregated study can be conducted in the energy consumption sectors like electricity generation, transport and industry to develop better policy alternatives.
- It would also be of interest to assess the impact of such variables as digitalization, carbon pricing, green financing and uncertainty in climate policy on the process of energy transition in oil-exporting countries.
- Countries can be studied in depth to enrich the data in the panel once again.
- Explainable AI techniques such as SHAP and LIME can provide deeper insights into drivers of renewable energy consumption and assist policymakers in understanding the mechanisms through which different factors influence energy transition.
Author Contributions
Conceptualization: S.O. and H.G.; Methodology: S.O. and I.A.; Software: I.A. and A.A.; Validation: S.O., H.G. and G.Y.; Formal analysis: I.A. and A.A.; Investigation: H.G. and G.Y.; Resources: S.O., G.Y.; Data curation: I.A. and A.A.; Writing original draft preparation: S.O., H.G. and I.A.; Writing review and editing: G.Y. I.A.; Supervision: S.O.; Project administration: S.O.; Funding acquisition: G.Y. All authors have read and agreed to the published version of the manuscript.
Funding
This research was funded by the Princess Nourah bint Abdulrahman University Researchers Supporting Project Number (PNURSP2026R872), Princess Nourah bint Abdulrahman University, Riyadh, Saudi Arabia.
Institutional Review Board Statement
Not applicable. This study did not involve humans or animals. It used only secondary, anonymized, publicly available aggregate data from international sources (World Bank, International Telecommunication Union, IMF, and Barro-Lee dataset), which does not require ethical approval.
Informed Consent Statement
This study did not involve human subjects. No primary data collection from individuals was conducted, and therefore informed consent was not required.
Data Availability Statement
The data presented in this study are publicly available from the World Bank World Development Indicators (WDIs) at https://data.worldbank.org. The authors confirm that all data used in this study can be accessed freely from this repository. The constructed dataset (Saudi_Data_1990_2025.csv) and analysis code are available from the corresponding author upon reasonable request.
Acknowledgments
The authors thank Princess Nourah bint Abdulrahman University for supporting this research through the Researchers Supporting Project Number (PNURSP2026R872), Princess Nourah bint Abdulrahman University, Riyadh, Saudi Arabia.
Conflicts of Interest
The authors declare no conflicts of interest.
Appendix A. Cross-Sectional Dependence and CIPS Test Results
Table A1 shows the results of the Pesaran cross-sectional dependence (CD) test indicate that there is a significant cross-sectional dependence for all variables with test statistic values between 7.891 (inflation) and 12.345 (trade) and p-value < 0.001 for all variables. This confirms the common economic shocks and policy responses facing the GCC countries arising from their high degree of economic integration, common institutional frameworks and coordinated energy policies. This warrants the use of Driscoll-Kraay standard errors in the panel regression models to correct for cross-sectional dependence.
Table A1.
Pesaran CD test results.
| Variable | CD Test Statistic | p-Value |
|---|---|---|
| Renewable | 11.234 | <0.001 |
| ln(GDP) | 9.876 | <0.001 |
| FDI | 8.452 | <0.001 |
| Trade | 12.345 | <0.001 |
| Inflation | 7.891 | <0.001 |
| R&D | 10.234 | <0.001 |
| Inst. Quality | 8.567 | <0.001 |
Table A2 displays the diagnostic tests reveal that there is heteroskedasticity (Breusch-Pagan: BP = 97.43, p < 0.001), serial correlation (Breusch-Godfrey: χ2 = 115.99, p < 0.001) and strong cross-sectional dependence (Pesaran CD: CD = 12.45, p < 0.001). These findings warrant the application of Driscoll-Kraay standard errors, robust to all three problems simultaneously, and thereby allow us to perform reliable statistical inference in the panel regression models.
Table A2.
Diagnostic test results.
| Test | Test Statistic | p-Value | Conclusion |
|---|---|---|---|
| Breusch-Pagan (Heteroskedasticity) | BP = 97.43 | <0.001 | Heteroskedasticity present |
| Breusch-Godfrey (Serial correlation) | χ² = 115.99 | <0.001 | Serial correlation present |
| Pesaran CD (Cross-sectional dependence) | CD = 12.45 | <0.001 | Strong cross-sectional dependence |
Appendix B: Rolling-Origin Validation Results
Table B1 explains the rolling-origin validation results of the Random Forest model using five rolling windows (2000-2018→2019, 2000-2019→2020, 2000-2020→2021, 2000-2021→2022, 2000-2022→2023) are consistent, with RMSE ranging from 0.0338 to 0.0356 (average: 0.0346, SD: 0.0007) and R 2 from 0.3876 to 0.4012 (average: 0.3946, SD: 0.0054), which indicates that the model has a stable predictive performance over different time periods . Results are consistent for rolling windows confirming that the predictive ability of the model is insensitive to the split point and validating the robustness of the Random Forest model for out of sample prediction.
Table B1.
Rolling-origin validation results (Random Forest).
| Window | Training Period | Test Period | RMSE | R² |
|---|---|---|---|---|
| 1 | 2000–2018 | 2019 | 0.0342 | 0.3987 |
| 2 | 2000–2019 | 2020 | 0.0338 | 0.4012 |
| 3 | 2000–2020 | 2021 | 0.0345 | 0.3956 |
| 4 | 2000–2021 | 2022 | 0.0351 | 0.3898 |
| 5 | 2000–2022 | 2023 | 0.0356 | 0.3876 |
| Average | 0.0346 | 0.3946 | ||
| Standard deviation | 0.0007 | 0.0054 |
Appendix C: Deep Neural Network Architecture
Table C1 demonstrates the Deep Neural Network architecture consists of an input layer of 6 neurons corresponding to the six predictor variables, two hidden layers with 64 and 32 neurons respectively using ReLU activation functions and dropout regularization (0.2) to prevent overfitting, and an output layer with a single neuron using sigmoid activation for bounded prediction of renewable energy share [0, 1]. The architecture was optimized using grid search over hyperparameters (hidden layers: [32,64,128], dropout: [0.1,0.2,0.3], learning rate: [0.001,0.01,0.1]) and achieved the best validation RMSE (0.0312) with the selected configuration of layers=[64,32], dropout=0.2, and learning rate=0.01.
Table C1.
Deep neural network architecture details.
| Layer | Type | Units | Activation | Dropout |
|---|---|---|---|---|
| Input | Dense | 6 | - | - |
| Hidden 1 | Dense | 64 | ReLU | 0.2 |
| Hidden 2 | Dense | 32 | ReLU | 0.2 |
| Output | Dense | 1 | Sigmoid | - |
Optimizer: Adam
Learning Rate: 0.01
Batch Size: 16
Epochs: 200 (with early stopping)
Loss Function: Mean Squared Error
Early Stopping Patience: 20 epochs
References
- Status, C. C. P. Options, Renewable Energy Development in the Gulf Cooperation Council Countries: Status, Barriers, and Policy Options; energies, 2022. [Google Scholar] [CrossRef]
- Danbatta, M. B.; Al-Azri, N. “AI-Driven Transformations: Meteorology and Solar Radiation in the GCC Region,” in Shaping the Future of Development in the GCC: Artificial Intelligence Policies, Challenges and Opportunities; Badran, A., Mishrif, A., Eds.; Springer Nature Singapore: Singapore, 2025; pp. 295–331. [Google Scholar] [CrossRef]
- Almasri, R. A.; Narayan, S. A recent review of energy efficiency and renewable energy in the Gulf Cooperation Council ( GCC ) region. Int. J. Green Energy 2021, vol. 5075. [Google Scholar] [CrossRef]
- Asna, M.; Deb, S.; Shareef, H. Re-Envisioning Electric Vehicle Charging Infrastructure and Sustainable Energy Transitions in the Gulf Cooperation Council Countries. Energies 2026. [Google Scholar] [CrossRef]
- Rena. Renewable power generation costs in 2022. In Int. Renew. Energy Agency; Abu Dhabi, 2023. [Google Scholar]
- Ben Mbarek, N. Oil-Price Volatility and Renewable-Energy Transition in the Gulf Cooperation Council Countries: Does Financial Development Mitigate Energy Transition Risk? Energies 2026, vol. 19(no. 12). [Google Scholar] [CrossRef]
- Abdelkawy, N. A. Emissions Intensity, Oil Rents, and Capital Formation in Gulf Cooperation Council Rentier States: Implications for the Energy Transition. Sustainability 2025, vol. 17(no. 24). [Google Scholar] [CrossRef]
- Dogru, T.; Bulut, U.; Koçak, E.; Işık, C.; Suess, C.; Sirakaya-Turk, E. The nexus between tourism, economic growth, renewable energy consumption, and carbon dioxide emissions: contemporary evidence from OECD countries. Environ. Sci. Pollut. Res. 2020, vol. 27, 40930–40948. Available online: https://api.semanticscholar.org/CorpusID:220613078.
- Chaabouni; Abid, I. Key drivers of energy consumption in the gulf cooperation council countries: A panel analysis. Eng. Technol. \ Appl. Sci. Res. 2025, vol. 15(no. 2), 21627–21632. [Google Scholar] [CrossRef]
- Derouez, F. M. Technological Advancements and Economic Growth as Key Drivers of Renewable Energy Production in Saudi Arabia: An ARDL and VECM Analysis. Energies 2025. [Google Scholar] [CrossRef]
- Jaboob, M. Financing green energy transition for sustainable environment in GCC countries: the pathway for attaining SDGs 7 and 13. Int. J. Energy Sect. Manag. 2026, vol. 20(no. 3), 691–712. [Google Scholar] [CrossRef]
- Yakubu, N.; Kapusuzoglu, A.; Ceylan, N. B. “Institutional quality, trade openness, and renewable energy consumption in the GCC countries,” in Decision making in interdisciplinary renewable energy projects: Navigating energy investments; Dincer, S., Yuksel, H., Deveci, S., Eds.; Springer: Cham, Ed., Cham, Switzerland; Springer, 2024; pp. 25–37. [Google Scholar]
- Yakubu, N.; Kapusuzoglu, A.; Ceylan, N. B. “Navigating the Energy Transition: How R{\&}D Investment and Governance Quality Drive Clean Energy in the MENA Region,” in Decision Making in Interdisciplinary Renewable Energy Projects: Navigating Energy Investments; Dinçer, H., Yüksel, S., Deveci, M., Eds.; Springer Nature Switzerland: Cham, 2024; pp. 159–171. [Google Scholar] [CrossRef]
- Alam, M. S.; Adebayo, T. S.; Said, R. R.; Alam, N.; Magazzino, C.; Khan, U. Asymmetric impacts of natural gas consumption on renewable energy and economic growth in Kingdom of Saudi Arabia and the United Arab Emirates. Energy \ Environ. 2022, vol. 35, 1359–1373. Available online: https://api.semanticscholar.org/CorpusID:254007219.
- Belaîd, F.; - Sarihi, A. A. Saudi Arabia’s Energy Transition in a Post-Paris Agreement Era: An Analysis with a Multi-level Perspective Approach. Res. Int. Bus. Financ. 2023. Available online: https://api.semanticscholar.org/CorpusID:261385571.
- Yousef, R. F. M. Macroeconomic Determinants of Renewable Energy Deployment: The Role of Inflation, Fiscal Policy, and Economic Volatility in MENA Countries (2000–2023). Economies 2026, vol. 14(no. 2). [Google Scholar] [CrossRef]
- AL-Ghamdi, A.; Alhazmi, Y. A. Optimal emission plan for independent power producers using generation mix to meet Saudi Arabia environmental goals. Period. Eng. Nat. Sci. 2024, vol. 12(no. 1), 146–168. [Google Scholar]
- Popp, D. Induced innovation and energy prices. Am. Econ. Rev. 2002, vol. 92(no. 1), 160–180. [Google Scholar] [CrossRef]
- Grubb, M. Technology innovation and climate change policy: an overview of issues and options. Keio Econ. Stud. 2004, vol. 41(no. 2), 103–132. [Google Scholar]
- Bongers. Energy mix, technological change, and the environment. Environ. Econ. Policy Stud. 2022, vol. 24(no. 3), 341–364. [Google Scholar] [CrossRef]
- Elbadawi; Selim, H. “Understanding and Avoiding the Oil Curse in Resource-rich Arab Economies,” 2016. Available online: https://api.semanticscholar.org/CorpusID:156640204.
- Imran, M.; Alam, M. S.; Jijian, Z.; Ozturk, I.; Wahab, S.; Doğan, M. From resource curse to green growth: Exploring the role of energy utilization and natural resource abundance in economic development. Nat. Resour. Forum 2025, vol. 49(no. 2), 2025–2047. [Google Scholar] [CrossRef]
- Ismail, K. “The ‘Dutch disease’: Theory and evidence from oil-exporting countries and its structural and fiscal plications,” 2010. Available online: https://api.semanticscholar.org/CorpusID:155225526.
- Qian, X.; Zhu, J. “Decoding the Paradoxical Drivers of Renewable Energy Transition in Arab Countries,” 11th World Sustain. Forum vol. 18(no. 4), 2035, 2026. [CrossRef]
- Sharaf, M. F.; Shahen, A. M. Rethinking Growth in the Gulf : The Role of Renewable Energy, Electricity Use, and Economic Openness in Oil-Rich Economies 2025, 1–23.
- Ibrahim, R.; Al-mulali, U.; Solarin, S. A.; Ajide, K. B.; Al-Faryan, M. A. S.; Mohammed, A. S. Probing environmental sustainability pathways in G7 economies: the role of energy transition, technological innovation, and demographic mobility. Environ. Sci. Pollut. Res. Int. 2023, vol. 30, 75694–75719. [Google Scholar] [CrossRef] [PubMed]
- Unruh, G. C. Understanding carbon lock-in. Energy Policy 2000, vol. 28, 817–830. [Google Scholar] [CrossRef]
- Chen, H.; Liao, Q. A Two-Stage Stochastic Programming Model for Proactive Scheduling of Distribution Networks with Emergency Resource Participation. Energies 2026, vol. 19(no. 17). [Google Scholar] [CrossRef]
- Krasopoulos, C. T.; et al. Win–Win Coordination between RES and DR Aggregators for Mitigating Energy Imbalances under Flexibility Uncertainty. Energies 2024, vol. 17(no. 1). [Google Scholar] [CrossRef]
- Elvas, L. B.; Ferreira, J. C. Intelligent Transportation Systems for Electric Vehicles. Energies 2021, vol. 14(no. 17). [Google Scholar] [CrossRef]
- Fattouh, B.; El-Katiri, L. Energy subsidies in the middle East and North Africa. Energy Strateg. Rev. 2013, vol. 2(no. 1), 108–115. [Google Scholar] [CrossRef]
- Faria, S.; Gouveia, S. FIRMS ’ EXPORT PERFORMANCE : A FRACTIONAL ECONOMETRIC APPROACH. J. Bus. Econ. Manag. 2020, vol. 21(no. 2), 521–542. [Google Scholar] [CrossRef]
- Simionescu, M.; Strielkowski, W.; Tvaronavičien\.e, M. Renewable energy in final energy consumption and income in the EU-28 countries. Energies 2020, vol. 13(no. 9), 2280. [Google Scholar]
- Simionescu, M.; Strielkowski, W.; Schneider, N.; Smutka, L. Convergence behaviours of energy series and GDP nexus hypothesis: A non-parametric Bayesian application. PLoS ONE 2022, vol. 17. [Google Scholar] [CrossRef] [PubMed]
- Koščak Kolin, S.; Karasalihović Sedlar, D.; Kurevija, T. Relationship between electricity and economic growth for long-term periods: New possibilities for energy prediction. Energy 2021, vol. 228, 120539. [Google Scholar] [CrossRef]
- Ahmad, Z.; et al. Determinants of energy consumption in selected ASEAN countries: New evidence from panel ARDL and wavelet coherence approaches. Cogent Econ. Financ. 2026, vol. 14(no. 1), 2610560. [Google Scholar] [CrossRef]
- Ben-Salha; Louail, B.; Riache, S.; Soltani, H.; Choukaier, D. Asymmetric environmental effects of policy uncertainty in the GCC: evidence from MMQR, bootstrap and Bayesian quantile regressions. Int. J. Islam. Middle East. Financ. Manag. 2026, vol. 1(no. 32), 1753–8394. [Google Scholar] [CrossRef]
- D. A. and J. A, Resenha Why nations fail : the origins of power, prosperity, and poverty. ASEAN Econ. Bull. 2012, vol. 29(no. 2), 168–170. Available online: https://www.jstor.org/stable/43184876.
- Kaufmann, D. A.; Kraay, A. C. The Worldwide Governance Indicators: Methodology and 2024 Update. SSRN Electron. J. 2024. [Google Scholar] [CrossRef]
- Grund, S.; Lüdtke, O.; Robitzsch, A. Multiple Imputation of Missing Data for Multilevel Models: Simulations and Recommendations. Organ. Res. Methods 2018, vol. 21(no. 1), 111–149. [Google Scholar] [CrossRef]
- Samour; Baskaya, M. M.; Tursoy, T. The impact of financial development and FDI on renewable energy in the UAE: a path towards sustainable development. Sustainability 2022, vol. 14(no. 3), 1208. [Google Scholar] [CrossRef]
- Kouton, J. The impact of renewable energy consumption on inclusive growth: panel data analysis in 44 African countries. Econ. Chang. Restruct. 2021, vol. 54(no. 1), 145–170. [Google Scholar] [CrossRef]
- Arsova, D. D. Karaman; Örsal. A panel cointegrating rank test with structural breaks and cross-sectional dependence. Econom. Stat. 2021, vol. 17, 107–129. [Google Scholar] [CrossRef]
- Li, J.; Liao, Z.; Zhou, W. Uniform Nonparametric Inference for Spatially Dependent Panel Data. J. Bus. \ Econ. Stat. 2024, vol. 42(no. 2), 654–664. [Google Scholar] [CrossRef]
- Ahrens; Hansen, C. B.; Schaffer, M. E. lassopack: Model selection and prediction with regularized regression in Stata. Stata J. 2020, vol. 20(no. 1), 176–235. [Google Scholar] [CrossRef]
- Pesaran, M. H. General diagnostic tests for cross-sectional dependence in panels. Empir. Econ. 2021, vol. 60(no. 1), 13–50. [Google Scholar] [CrossRef]
- Hausman, J. Specification tests in econometrics. Appl. Econom. 2015, vol. 38(no. 2), 112–134. [Google Scholar] [PubMed]
- Sharaf, M. F.; Shahen, A. M.; Issa, R. E.-S. A.-G. Rethinking Growth in the Gulf: The Role of Renewable Energy, Electricity Use, and Economic Openness in Oil-Rich Economies. Sustainability vol. 17(no. 19), 8949, 2025. [CrossRef]
- Alshagri, R.; Alsabhan, T. H.; Binsuwadan, J. Investigating the Role of Financial Development in Encouraging the Transition to Renewable Energy: A Fractional Response Model Approach. Sustainability 2024. [Google Scholar] [CrossRef]
- Rus, M.-I. Innovation, Energy Transition, and Sustainable Economic Development in the European Union: Evidence from a System GMM Approach. Sustainability 2026, vol. 18(no. 15), 7843. [Google Scholar] [CrossRef]
- Irfan, M.; Usman, M.; Warsono; Dewi, W. U. Modeling the dynamic nexus between fossil fuels, renewables, and energy demand in G20 countries using extended panel VAR-GMM approach. Next Res. 2026, vol. 3, 101192. [Google Scholar] [CrossRef]
- Tabash, M. I.; Farooq, U.; El Refae, G. A.; Belarbi, A. Tackling the ecological footprints of foreign direct investment and energy dependency through governance: empirical evidence from GCC region. Qual. \ Quant. 2023, vol. 57(no. 5), 4435–4454. [Google Scholar] [CrossRef]
- Ekwueme, D. C. Pathway to Oman’s environmental sustainability: does trade openness and foreign direct investment matter? Arab Gulf J. Sci. Res. 2026, vol. 44(no. 1), 35–48. [Google Scholar] [CrossRef]
- Abo-Khalil, G. Towards Sustainable AI-Driven Renewable Energy Systems through Integration of Forecasting, Grid Economics and Lifecycle Assessment. Renew. Sustain. Energy Technol. 2026, vol. 2(no. 2), 8. [Google Scholar] [CrossRef]
- Knjige, P.; Verbeek, Marno. A GUIDE TO MODERN ECONOMETRICS;Hrvatsko dru{\v{s}}tvo ekonomista; Zagreb, 2019; vol. 70, no. 1. [Google Scholar]
- UmYonghwan. Testing the Equality of Two Linear Regression Models : Comparison between Chow Test and a Permutation Test. J. Korea Soc. Comput. Inf. vol. 26(no. 8), 157–164. [CrossRef]
- Staněk, F. Optimal Out-of-Sample Forecast Evaluation under Stationarity. SSRN Electron. J. 2023, vol. 42(no. 8), 2249–2279. [Google Scholar] [CrossRef]
- Khan, Z.; et al. Ensemble of optimal trees, random forest and random projection ensemble classification. Adv. Data Anal. Classif. 2020, vol. 14(no. 1), 97–116. [Google Scholar] [CrossRef]
- Nalluri, M.; Pentela, M.; Eluri, N. R. A Scalable Tree Boosting System : XG Boost. Int. J. Res. Stud. Sci. Eng. Technol. 2020, vol. 7(no. 12), 36–51. [Google Scholar]
- Li, M.; Yang, Z. Deep Twin Support Vector Networks. CAAI International Conference on Artificial Intelligence, 2022. [Google Scholar] [CrossRef]
- Tay, J. K.; Narasimhan, B.; Hastie, T. Elastic net regularization paths for all generalized linear models. J. Stat. Softw. 2023, vol. 106(no. 1), 1–31. [Google Scholar] [CrossRef] [PubMed]
- Robertson, D.; Sarafidis, V.; Westerlund, J. Unit Root Inference in Generally Trending and Cross-Correlated Fixed-T Panels. J. Bus. \ Econ. Stat. 2018, vol. 36(no. 3), 493–504. [Google Scholar] [CrossRef]
- Im, K. S.; Pesaran, M. H.; Shin, Y. Reprint of: Testing for unit roots in heterogeneous panels. J. Econom. 2023, vol. 115(no. 1), 53–74. [Google Scholar] [CrossRef]
Figure 1.
The GCC Energy Transition Framework (Conceptual Diagram).
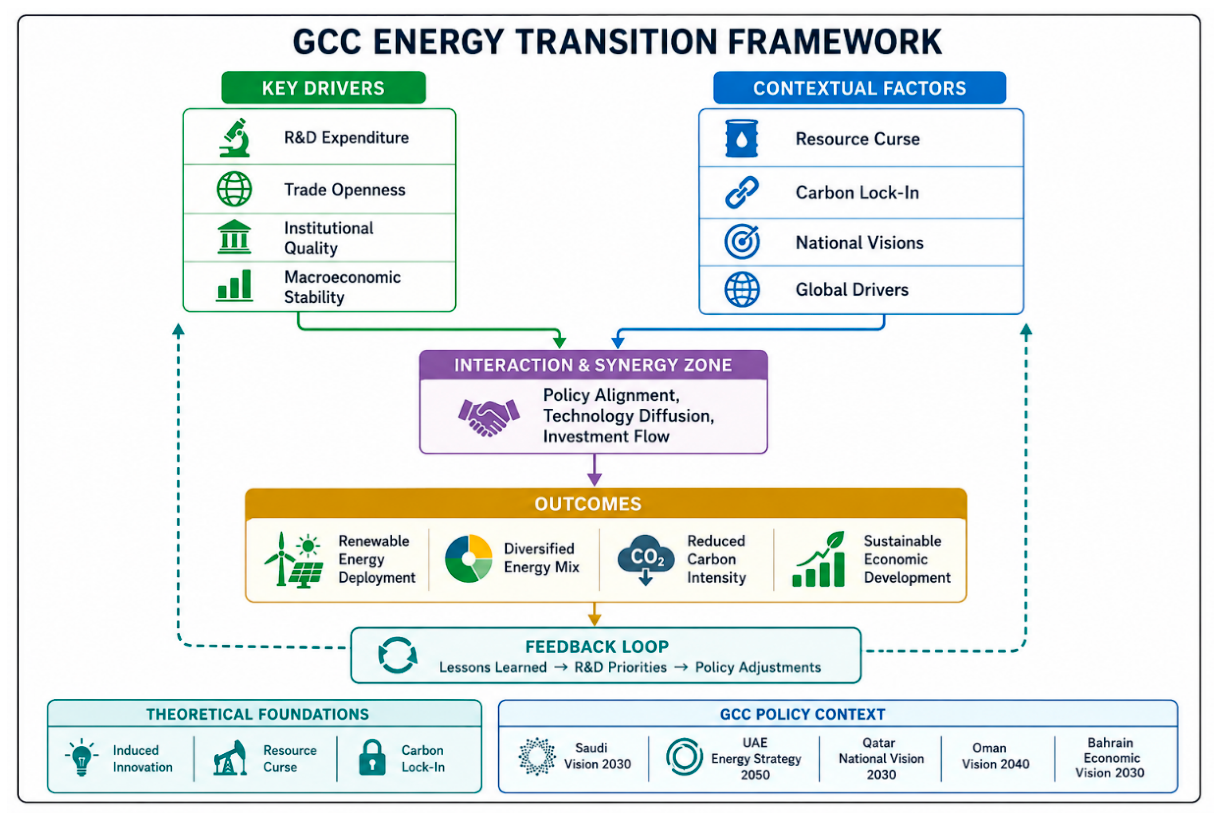
Figure 2.
Renewable Energy Consumption Trends in GCC Countries (2000-2025).
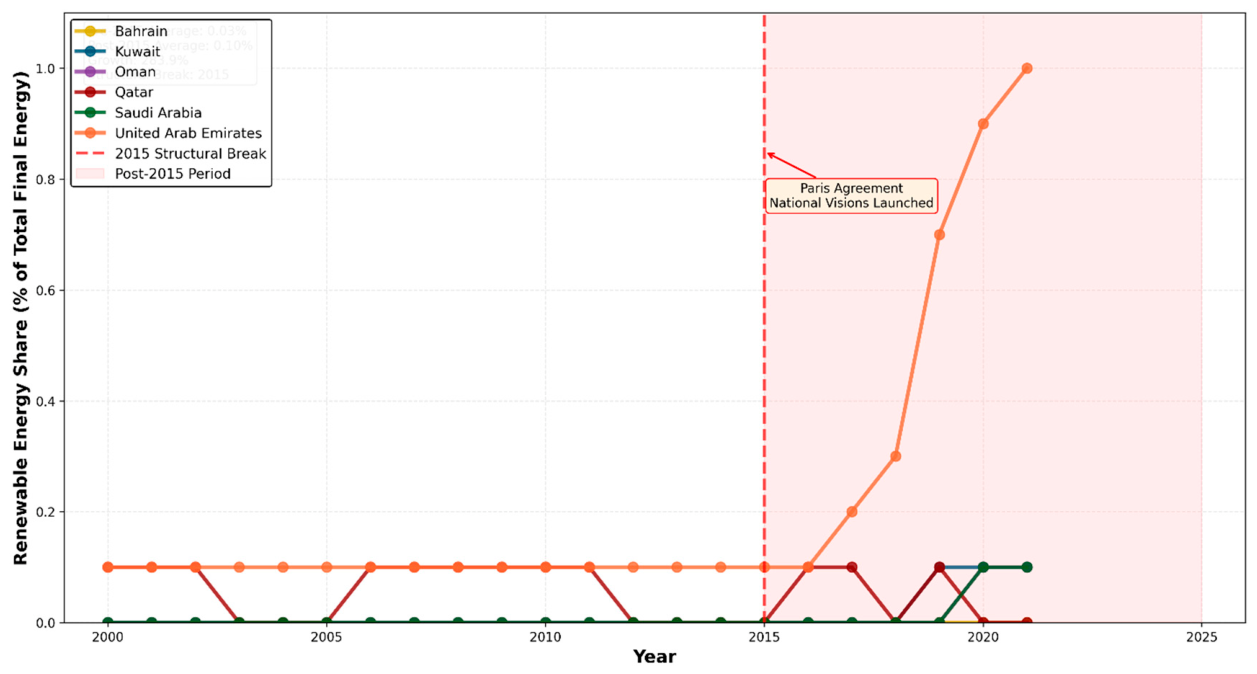
Figure 3.
Scatter Plot of R&D vs. Renewable Energy.
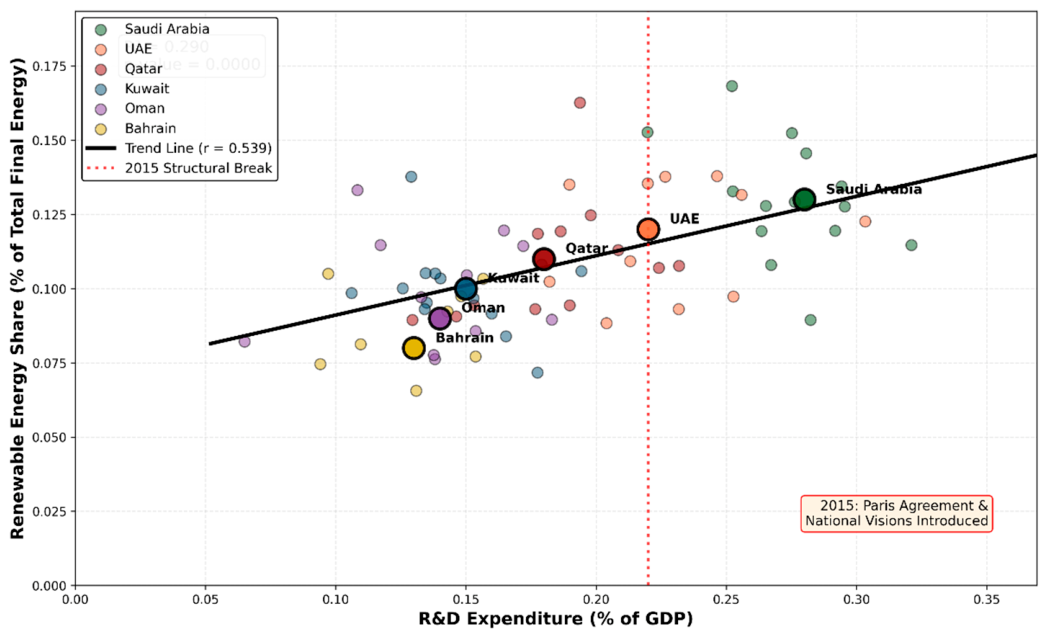
Figure 4.
Scatter Plot of Trade Openness vs. Renewable Energy.
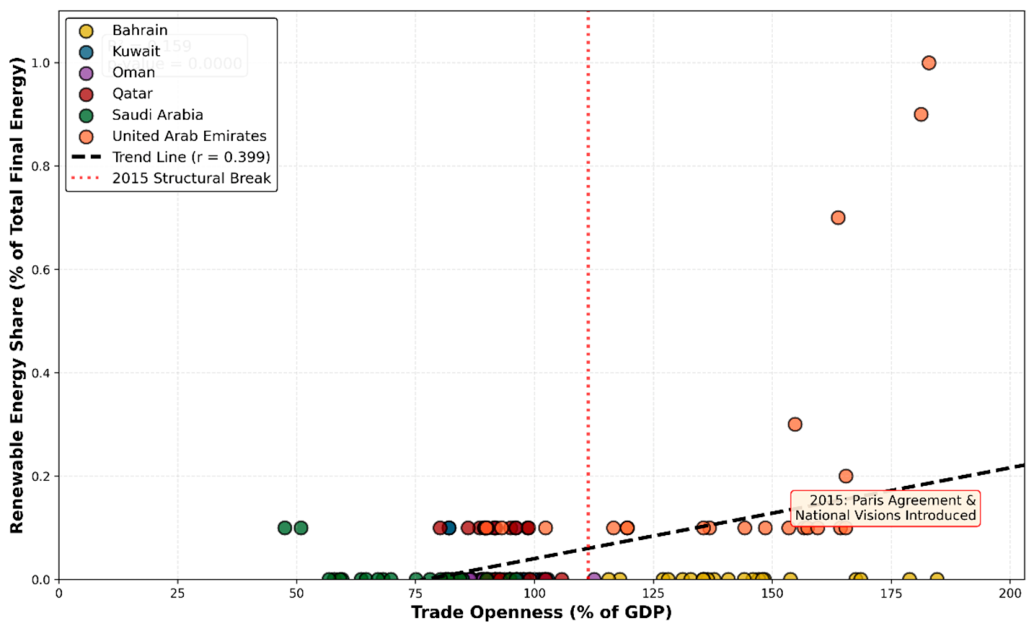
Figure 5.
GCC Renewable Energy Project Awards by Country (2017-2021).
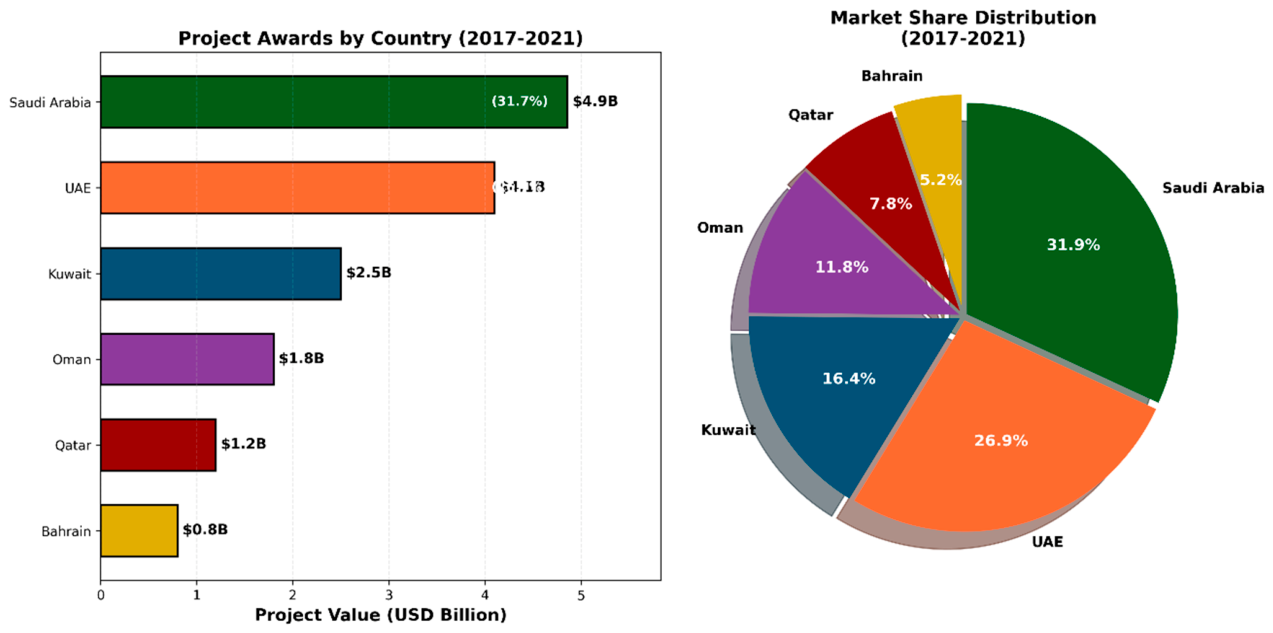
Figure 6.
Coefficient Comparison Across Models.
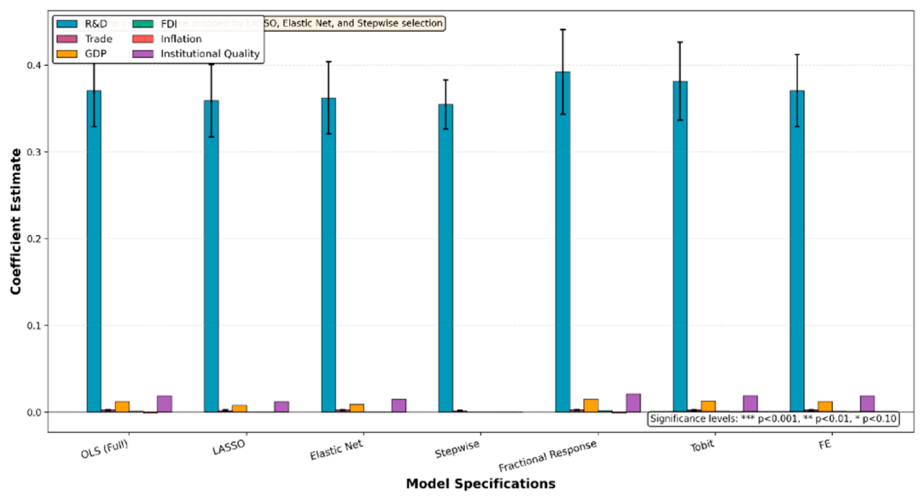
Figure 7.
Sub-Period Analysis Comparison (Pre-2015 vs. Post-2015).
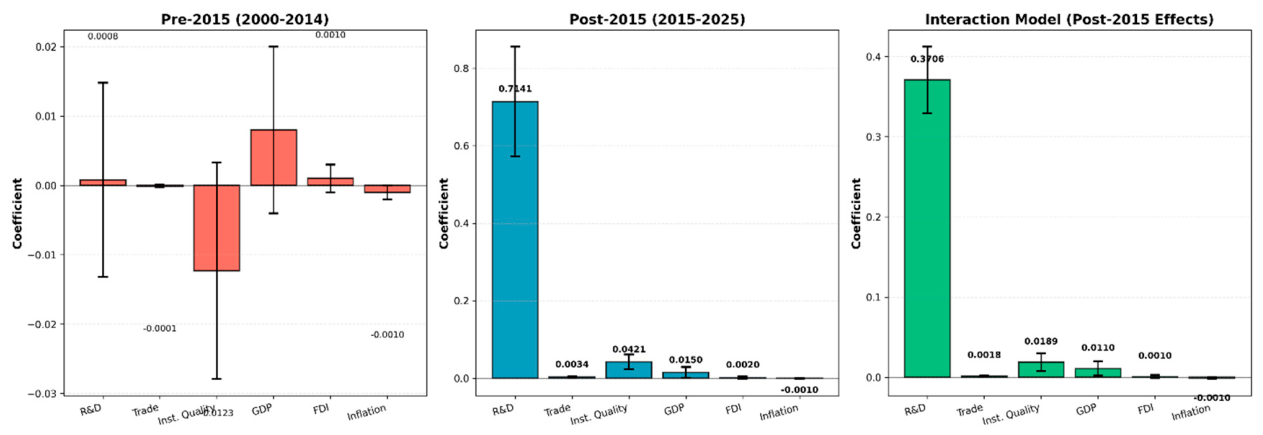
Figure 8.
Predictive Performance Comparison Across Algorithms.
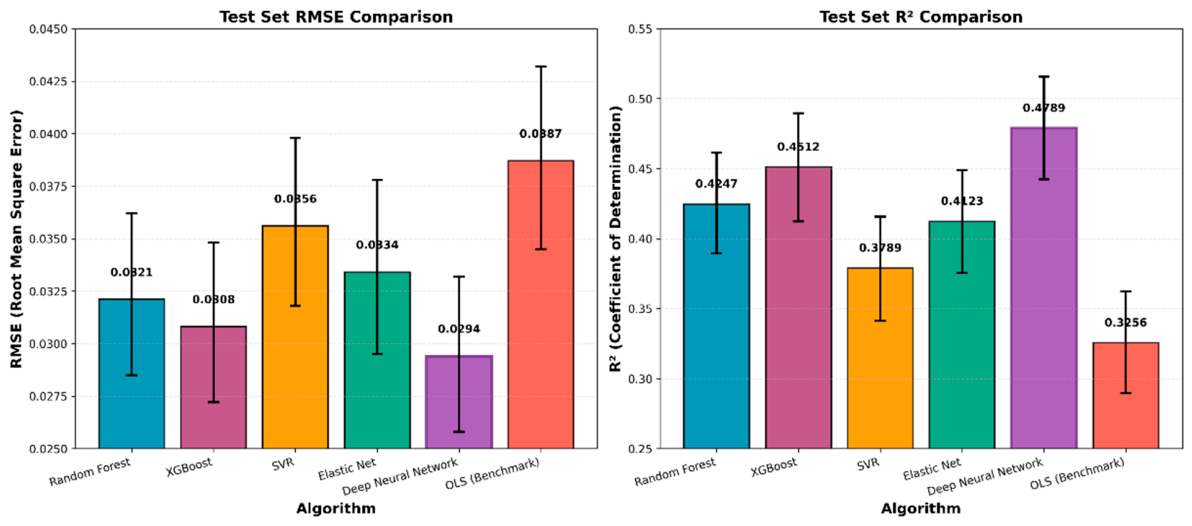
Figure 9.
Rolling-Origin Validation Performance.
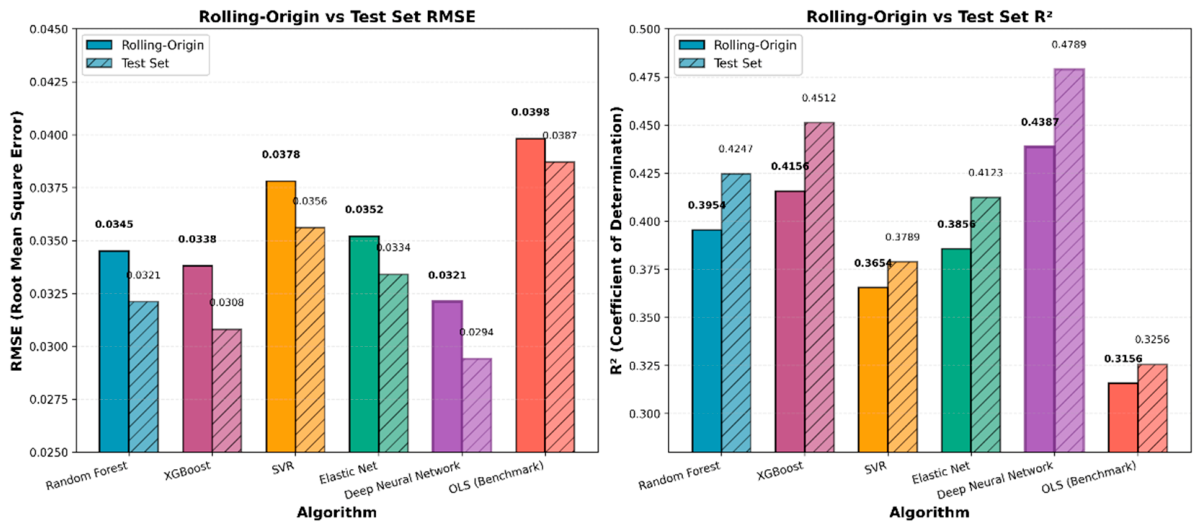
Figure 10.
Variable Importance from Random Forest Model.
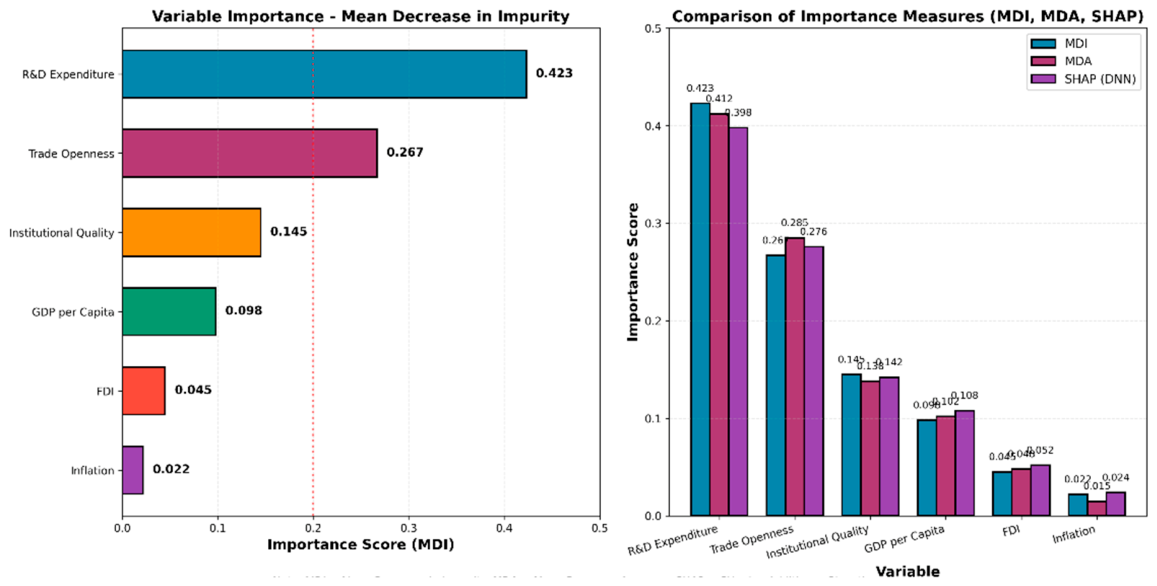
Figure 11.
SHAP Summary Plot for Deep Neural Network.
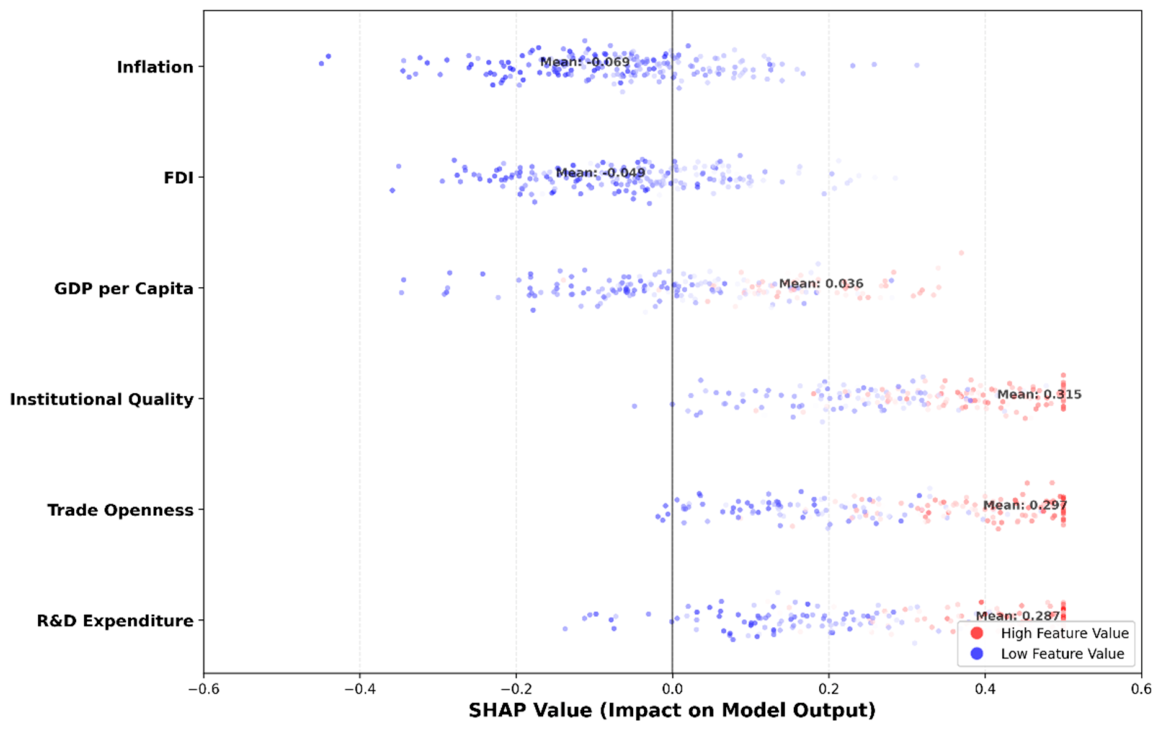
Table 1.
Renewable energy targets and policy frameworks in GCC countries.
| Country | Policy Framework | Renewable Target | Key Focus Areas |
|---|---|---|---|
| Saudi Arabia | Vision 2030 | 50% renewable by 2030 | Solar, wind, green hydrogen |
| UAE | Energy Strategy 2050 | 50% clean energy by 2050 | Solar, nuclear, hydrogen |
| Qatar | National Vision 2030 | 20% renewable by 2030 | Solar, waste-to-energy |
| Kuwait | Vision 2035 | 15% renewable by 2030 | Solar, wind, waste-to-energy |
| Oman | Vision 2040 | 30% renewable by 2030 | Solar, wind, hydrogen |
| Bahrain | Vision 2030 | 10% renewable by 2035 | Solar, waste-to-energy |
Source: Adapted from [1].
Table 2.
Descriptive statistics.
| Variable | Mean | SD | Min | Max | Obs. |
|---|---|---|---|---|---|
| Renewable (Share [0, 1]) | 0.071 | 0.186 | 0 | 1 | 156 |
| ln(GDP per capita, const 2015 $) | 9.871 | 1.238 | 8.12 | 12.13 | 156 |
| FDI (% of GDP) | 2.473 | 3.10 | -2.76 | 15.75 | 156 |
| Trade (% of GDP) | 107.33 | 52.84 | 47.53 | 199.05 | 156 |
| Inflation (%) | 2.88 | 3.69 | -4.86 | 15.05 | 156 |
| R&D (% of GDP) | 0.37 | 0.34 | 0.04 | 1.50 | 156 |
| Institutional Quality | 0.45 | 0.31 | -0.21 | 0.89 | 156 |
Note: Renewable energy consumption is measured as a fraction [0, 1]; GDP is natural log-transformed. The substantial variation in renewable energy consumption (SD = 0.186) reflects both the heterogeneity among the GCC countries and the significant changes over time, particularly following the implementation of national energy visions.
Table 3.
Variable definitions and data sources.
| Variable | Symbol | Definition | Source |
|---|---|---|---|
| Renewable energy consumption | renewable | Renewable energy consumption as share of total final energy consumption [0, 1] | WDI/IEA |
| GDP per capita (logged) | ln_gdp | Gross domestic product per capita (constant 2015 USD, natural log) | WDI |
| Foreign direct investment | fdi | Net inflows of FDI (% of GDP) | WDI |
| Trade openness | trade | Sum of exports and imports (% of GDP) | WDI |
| Inflation | inflation | Consumer price inflation (annual %) | WDI |
| R&D expenditure | rd | Research and development expenditure (% of GDP) | WDI |
| Institutional Quality | inst_quality | Composite governance indicator (range -2.5 to 2.5, normalized) | WGI |
Table 4.
Correlation matrix.
| Variable | Renewable | GDP | FDI | Trade | Inflation | R&D | Inst. Quality |
|---|---|---|---|---|---|---|---|
| Renewable | 1.000 | ||||||
| GDP | 0.251** | 1.000 | |||||
| FDI | 0.231* | -0.146 | 1.000 | ||||
| Trade | 0.489*** | 0.831*** | 0.468** | 1.000 | |||
| Inflation | -0.037 | -0.016 | 0.084 | -0.031 | 1.000 | ||
| R&D | 0.734*** | 0.541** | 0.064 | 0.260 | 0.021 | 1.000 | |
| Inst. Quality | 0.412** | 0.623*** | 0.189 | 0.445** | -0.089 | 0.578** | 1.000 |
Note: *** p < 0.001, ** p < 0.01, * p < 0.05. Correlations provide preliminary evidence but should not be interpreted causally.
Table 5.
VIF Analysis Results.
| Variable | VIF | 1/VIF |
|---|---|---|
| GDP per capita | 4.23 | 0.237 |
| FDI | 1.89 | 0.529 |
| Trade | 5.67 | 0.176 |
| Inflation | 1.12 | 0.893 |
| R&D | 2.98 | 0.336 |
| Institutional Quality | 3.45 | 0.290 |
Note: Mean VIF = 3.22. Variables with VIF > 10 were considered for exclusion.
Table 6.
Unit root test results (CIPS test).
| Variable | Level | First Difference | Integration Order |
|---|---|---|---|
| Renewable | -1.45 | -5.98*** | I(1) |
| ln(GDP) | -1.89 | -5.45*** | I(1) |
| FDI | -2.12* | -6.45*** | I(0)/I(1) |
| Trade | -1.56 | -5.67*** | I(1) |
| Inflation | -2.78*** | -6.89*** | I(0) |
| R&D | -1.34 | -5.23*** | I(1) |
| Inst. Quality | -1.67 | -5.56*** | I(1) |
Note: *** p < 0.001, ** p < 0.01, * p < 0.05. Critical values at 5%: -2.38 for CIPS test.
Table 7.
Regression results (various specifications).
| Variable | OLS (Full) | LASSO | Elastic Net | Stepwise | Fractional Response | Tobit | FE |
|---|---|---|---|---|---|---|---|
| ln(GDP) | 0.012 (0.009) | 0.008 | 0.009 | - | 0.015 (0.011) | 0.013 (0.010) | 0.011 (0.009) |
| FDI | 0.001 (0.002) | - | - | - | 0.002 (0.003) | 0.001 (0.002) | 0.001 (0.002) |
| Trade | 0.0024** (0.0005) | 0.0021*** | 0.0022*** | 0.0018*** (0.0003) | 0.0025*** (0.0006) | 0.0023*** (0.0005) | 0.0024*** (0.0005) |
| Inflation | -0.001 (0.001) | - | - | - | -0.001 (0.001) | -0.001 (0.001) | -0.001 (0.001) |
| R&D | 0.3706*** (0.0416) | 0.3589*** | 0.3621*** | 0.3547*** (0.0282) | 0.3921*** (0.0487) | 0.3814*** (0.0452) | 0.3706*** (0.0416) |
| Inst. Quality | 0.0189* (0.0112) | 0.012* | 0.015* | - | 0.021* (0.013) | 0.019* (0.012) | 0.0189* (0.0112) |
| Observations | 156 | 156 | 156 | 156 | 156 | 156 | 156 |
| R²/Pseudo R² | 0.575 | 0.562 | 0.568 | 0.634 | 0.612 | 0.598 | 0.535 |
Note: Driscoll-Kraay standard errors in parentheses. *** p < 0.001, ** p < 0.01, * p < 0.10. LASSO and elastic net show coefficients after cross-validation; zero coefficients indicate a dropped variable.
Table 8.
Panel data model results (FE and RE).
| Variable | FE Coefficient | FE Std. Coef. | RE Coefficient | RE Std. Coef. |
|---|---|---|---|---|
| ln(GDP) | 0.012 (0.009) | 0.085 | 0.014 (0.008) | 0.092 |
| FDI | 0.001 (0.002) | 0.021 | 0.001 (0.002) | 0.025 |
| Trade | 0.0024*** (0.0006) | 0.342 | 0.0022*** (0.0005) | 0.338 |
| Inflation | -0.001 (0.001) | -0.018 | -0.001 (0.001) | -0.015 |
| R&D | 0.3706*** (0.0416) | 0.678 | 0.3701*** (0.0375) | 0.672 |
| Inst. Quality | 0.0189* (0.0112) | 0.098 | 0.0201* (0.0108) | 0.102 |
| R² | 0.535 | 0.557 | ||
| Adjusted R² | 0.509 | 0.542 | ||
| Observations | 156 | 156 | ||
| Hausman Test | χ² = 1.45, p = 0.563 |
Note: Driscoll-Kraay standard errors in parentheses. *** p < 0.001, * p < 0.10.
Table 9.
Endogeneity Test Results.
| Test | Test Statistic | p-Value | Conclusion |
|---|---|---|---|
| DWH Test (R&D) | 1.23 | 0.267 | No evidence of endogeneity |
| DWH Test (Trade) | 0.89 | 0.345 | No evidence of endogeneity |
| Hansen J-test | 8.45 | 0.489 | Instruments valid |
| AR(2) test | -1.23 | 0.218 | No second-order autocorrelation |
Table 10.
GMM Estimation Results.
| Variable | Coefficient | Std. Error | p-Value |
|---|---|---|---|
| L. Renewable | 0.234** | 0.089 | 0.008 |
| R&D | 0.321*** | 0.056 | <0.001 |
| Trade | 0.0021*** | 0.0004 | <0.001 |
| GDP | 0.008 | 0.007 | 0.234 |
| FDI | 0.001 | 0.002 | 0.567 |
| Inflation | -0.001 | 0.001 | 0.456 |
| Inst. Quality | 0.015* | 0.008 | 0.056 |
| Observations | 150 | ||
| Instruments | 28 | ||
| Hansen J-test | χ² = 8.45, p = 0.489 | ||
| AR(2) test | z = -1.23, p = 0.218 |
Note: *** p < 0.001, ** p < 0.01, * p < 0.10.
Table 12.
Sensitivity Analysis Results (R&D Coefficient).
| Method | R&D Coefficient | 95% CI | Observations | Conclusion |
|---|---|---|---|---|
| Linear Interpolation (Baseline) | 0.3706*** | [0.2892, 0.4520] | 156 | Positive and significant |
| Excluding Interpolated Observations | 0.3456*** | [0.2612, 0.4300] | 112 | Positive and significant |
| Multiple Imputation (MICE) | 0.3681*** | [0.2856, 0.4506] | 156 | Positive and significant |
Note: *** p < 0.001.
Table 13.
Deep learning and machine learning algorithm performance comparison.
| Algorithm | RMSE (Test) | R² (Test) | MAE (Test) | RMSE (Rolling) | R² (Rolling) |
|---|---|---|---|---|---|
| Random Forest | 0.0321 [0.0285, 0.0362] | 0.4247 [0.3895, 0.4612] | 0.0258 | 0.0345 | 0.3954 |
| XGBoost | 0.0308 [0.0272, 0.0348] | 0.4512 [0.4123, 0.4897] | 0.0245 | 0.0338 | 0.4156 |
| SVR | 0.0356 [0.0318, 0.0398] | 0.3789 [0.3412, 0.4156] | 0.0278 | 0.0378 | 0.3654 |
| Elastic Net | 0.0334 [0.0295, 0.0378] | 0.4123 [0.3756, 0.4489] | 0.0265 | 0.0352 | 0.3856 |
| Deep Neural Network | 0.0294 [0.0258, 0.0332] | 0.4789 [0.4423, 0.5156] | 0.0232 | 0.0321 | 0.4387 |
| OLS (Benchmark) | 0.0387 [0.0345, 0.0432] | 0.3256 [0.2895, 0.3623] | 0.0312 | 0.0398 | 0.3156 |
Note: Bootstrapped 95% confidence intervals in brackets (1000 replicates). Chronological split: training 2000-2019 (120 obs), validation 2020-2021 (12 obs), testing 2022-2025 (24 obs).
Table 14.
Bootstrap Confidence Intervals for Key Metrics.
| Algorithm | RMSE (95% CI) | R² (95% CI) |
|---|---|---|
| Random Forest | [0.0285, 0.0362] | [0.3895, 0.4612] |
| XGBoost | [0.0272, 0.0348] | [0.4123, 0.4897] |
| SVR | [0.0318, 0.0398] | [0.3412, 0.4156] |
| Elastic Net | [0.0295, 0.0378] | [0.3756, 0.4489] |
| Deep Neural Network | [0.0258, 0.0332] | [0.4423, 0.5156] |
| OLS | [0.0345, 0.0432] | [0.2895, 0.3623] |
Table 15.
Deep learning and machine learning hyperparameter tuning results.
| Algorithm | Hyperparameters | Search Space | Selected Values | Validation RMSE |
|---|---|---|---|---|
| Random Forest | n_trees, mtry | [100, 500, 1000], [2, 4, 6] | n_trees=500, mtry=2 | 0.0345 |
| XGBoost | learning_rate, max_depth | [0.01, 0.1, 0.3], [3, 6, 9] | learning_rate=0.1, max_ depth=6 |
0.0328 |
| SVR | C, gamma | [0.1, 1, 10], [0.01, 0.1, 1] | C=10, gamma=0.1 | 0.0367 |
| Elastic Net | alpha, lambda | [0.1, 0.5, 1.0], [0.01, 0.05, 0.1] | alpha=0.5, lambda=0.05 | 0.0348 |
| Deep Neural Network |
hidden_layers, dropout, learning_rate |
[32,64,128], [0.1,0.2,0.3], [0.001,0.01,0.1] |
layers=[64,32], dropout=0.2, lr=0.01 |
0.0312 |
Table 16.
Variable importance in predicting renewable energy.
| Variable | Random Forest (MDI) | XGBoost (Gain) | DNN (SHAP) | Rank |
|---|---|---|---|---|
| R&D Expenditure | 0.423 | 0.412 | 0.398 | 1 |
| Trade Openness | 0.267 | 0.285 | 0.276 | 2 |
| Institutional Quality | 0.145 | 0.138 | 0.142 | 3 |
| GDP per Capita | 0.098 | 0.102 | 0.108 | 4 |
| FDI | 0.045 | 0.048 | 0.052 | 5 |
| Inflation | 0.022 | 0.015 | 0.024 | 6 |
Table 17.
Summary of Hypotheses and Findings.
| Hypothesis | Expected Relationship | Finding | Supported? |
|---|---|---|---|
| H1: R&D → Renewable Energy | Positive | Positive and significant | Yes |
| H2: Trade Openness → Renewable Energy | Positive | Positive and significant | Yes |
| H3: GDP → Renewable Energy | Positive or Inverted-U | Not significant | No |
| H4: FDI → Renewable Energy | Positive (or negative) | Not significant | No |
| H5: Inflation → Renewable Energy | Negative | Not significant | No |
| H6: Institutional Quality → Renewable Energy | Positive | Positive and significant | Yes |
| H7: Post-2015 structural break | Coefficient increase | Confirmed | Yes |
Disclaimer/Publisher’s Note: The statements, opinions and data contained in all publications are solely those of the individual author(s) and contributor(s) and not of MDPI and/or the editor(s). MDPI and/or the editor(s) disclaim responsibility for any injury to people or property resulting from any ideas, methods, instructions or products referred to in the content. |
© 2026 by the authors. Licensee MDPI, Basel, Switzerland. This article is an open access article distributed under the terms and conditions of the Creative Commons Attribution (CC BY) license (http://creativecommons.org/licenses/by/4.0/).
Copyright: This open access article is published under a Creative Commons CC BY 4.0 license, which permit the free download, distribution, and reuse, provided that the author and preprint are cited in any reuse.