

Submitted:
10 September 2026
Posted:
11 September 2026
You are already at the latest version
Abstract
Micromobility has become an increasingly important part of sustainable urban transport, but its rapid expansion has also raised safety concerns for users who have limited physi-cal protection in the event of a crash. National-level evidence on micromobility safety re-mains limited in Central and Eastern Europe. This study therefore provides an epidemio-logical assessment of 836 micromobility-related crashes recorded in Hungary in 2024 us-ing administrative data from the Hungarian Central Statistical Office (KSH/HCSO). De-scriptive statistics were used to characterize injury severity, hourly crash occurrence, weather conditions, nature of accident, and road shape. Chi-square tests were then ap-plied to examine whether injury severity was associated with these temporal, environ-mental, and crash-context characteristics. For inferential analysis, injury severity was di-chotomized into slight versus serious/fatal injury. Monte Carlo permutation procedures were used to estimate p-values, and Cramér’s V was calculated to quantify the strength of association. Slight injuries accounted for 63.4% of recorded crashes, serious injuries for 35.8%, and fatal outcomes for 0.8%. Crash occurrence was concentrated in the afternoon, with 192 crashes (23.0%) recorded between 15:00 and 17:00 and the highest hourly fre-quency occurring at 16:00 (n = 79). Nature of accident was significantly associated with injury severity (χ²(11) = 26.36, p = 0.0037, Cramér’s V = 0.178), whereas weather condition, road shape, and hour of day were not. These findings identify crash mechanism as an important area of focus for future micromobility safety analysis and prevention.
Keywords:
micromobility
; road safety
; injury severity
; crash epidemiology
; crash mechanism
1. Introduction
Micromobility has become an increasingly important component of contemporary urban transport as cities look for flexible, low-emission, and space-efficient alternatives for short-distance travel. Bicycles, shared bicycles, e-scooters, e-bikes, and other lightweight mobility devices can support commuting and leisure travel while also improving first- and last-mile connections with public transport [1,2,3,4]. When these modes replace motorized trips, they may help reduce dependence on private cars, encourage active and low-emission travel, improve accessibility, and lower transport-related environmental impacts [5,6,7,8,9,10,11]. Their long-term contribution to sustainable urban mobility, however, also depends on whether they can be integrated into transport systems without creating unacceptable safety risks.
Unlike occupants of conventional motor vehicles, micromobility users have little physical protection during a collision. They often travel in environments where they interact with motor vehicles, pedestrians, parked vehicles, road infrastructure, crossings, and junctions [12,13,14,15]. Recent empirical studies have linked micromobility crashes and injury outcomes to a wide range of factors, including time of travel, rider behavior and experience, motor-vehicle involvement, alcohol or substance use, environmental conditions, collision configuration, and characteristics of the built environment [13,16,17,18,19,20].
For example, a nationwide analysis of e-scooter crashes in the United Kingdom identified important spatial, environmental, and severity-related patterns [13]. Naturalistic riding research has also shown that rider experience, single-handed riding, phone use, pack riding, and trip purpose can influence safety-critical events among e-scooter users [16]. Built-environment characteristics and motor-vehicle involvement have likewise been associated with differences in e-scooter crash severity [17]. Comparative studies further suggest that bicycles, e-bikes, e-scooters, and other forms of electric micromobility do not necessarily share the same collision or injury patterns [14,19,20]. Taken together, these findings support examining micromobility crashes within the particular temporal, environmental, and collision contexts in which they occur rather than treating all events as a single homogeneous safety problem.
Infrastructure and road context are also central to micromobility safety. Evidence from cycling and micromobility research indicates that facility design, separation from motorized traffic, intersection configuration, lighting, pavement condition, and other features of the road environment can influence crash and injury outcomes [14,15,17,21,22]. A review of transportation infrastructure and cycling safety, for instance, identified associations between bicycle crash or injury risk and infrastructure characteristics such as purpose-built cycling facilities, lighting, and surface conditions [22]. Intersections and crossing environments deserve particular attention because they bring together intersecting trajectories, turning movements, priority decisions, and interactions between physically vulnerable road users and larger motor vehicles [14,22]. Nevertheless, infrastructure-related crash counts must be interpreted carefully. A high number of crashes in a particular type of road environment does not necessarily indicate that the environment is more dangerous unless the amount of micromobility exposure within that setting is also known.
The same distinction applies to temporal and environmental patterns. Micromobility use can vary considerably by time of day, day of week, weather conditions, trip purpose, and spatial context [23,24,25,26]. Hosseinzadeh et al., for example, found that weather and day-of-week characteristics influenced e-scooter and bikeshare trip frequencies, with usage declining under unfavorable weather conditions [25]. McKenzie similarly identified clear spatiotemporal differences between scooter-share and bikeshare use [26]. Consequently, a greater number of crashes during afternoon periods or favorable weather may partly reflect a larger number of trips rather than a higher probability of crashing during an individual trip. Descriptive epidemiology remains an important first step for identifying concentrations of crashes, but exposure-adjusted measures are needed before such concentrations can be interpreted as differences in individual risk.
Safety is also relevant beyond recorded crash outcomes because perceptions of risk may affect whether people are willing to adopt micromobility. Previous studies have shown that adoption and use are influenced by perceived usefulness, accessibility, service characteristics, infrastructure, trust, and perceptions of safety [27,28,29,30,31,32,33,34]. Reviews of electric micromobility adoption, in particular, have identified concerns about safety and reliability as potential barriers to use [34]. A recent comparative study of university students in Hungary and the Kurdistan Region of Iraq also examined micromobility adoption from environmental and service-level perspectives [35]. Although adoption research addresses a different outcome from crash epidemiology, it further demonstrates the importance of developing locally grounded safety evidence if micromobility is to become a regular component of sustainable urban transport. Despite the rapid growth of international research on micromobility safety, the geographical distribution of available evidence remains uneven. Recent studies have examined national or large-scale crash and injury datasets in settings such as the United Kingdom and the United States, as well as urban evidence from Finland and other established micromobility contexts [13,17,18,19,20].
Evidence from Hungary has also begun to emerge. Foglar et al. conducted a one-year retrospective study at a major trauma center in Budapest, comparing injury characteristics among bicycle, e-scooter, and conventional scooter users [36]. More recently, Abdullah et al. used a machine-learning approach with survey data from Budapest to identify factors associated with self-reported micromobility accidents among bicycle, e-bike, and e-scooter users [37]. These studies provide valuable clinical and user-level evidence, but neither offers a national administrative crash-based epidemiological assessment covering micromobility crashes throughout Hungary. A national descriptive baseline is therefore valuable for understanding how crash severity, temporal occurrence, environmental conditions, collision configuration, and road context are distributed within the Hungarian setting.
Accordingly, this study provides a national epidemiological assessment of micromobility-related crashes recorded in Hungary during 2024 using administrative crash data from the Hungarian Central Statistical Office (KSH/HCSO). It addresses the following research questions:
RQ1: What are the distributions of crash severity, hour of occurrence, weather condition, nature of accident, and road shape among recorded micromobility crashes in Hungary?
RQ2: Is crash severity statistically associated with hour of day, weather condition, nature of accident, or road shape?
By addressing these questions, the study establishes a national descriptive baseline for micromobility crash characteristics in Hungary and evaluates whether selected temporal, environmental, and crash-context variables are associated with injury severity. The findings can also provide a foundation for future research incorporating exposure measures, spatial information, detailed infrastructure characteristics, and multivariable severity modelling.
2. Materials and Methods
2.1. Data Source and Study Design
A retrospective quantitative design was used to examine the epidemiological characteristics and severity patterns of micromobility-related crashes recorded in Hungary during 2024. The analysis was based on a national administrative road-crash dataset obtained from the Hungarian Central Statistical Office (HCSO; Hungarian: Központi Statisztikai Hivatal, KSH).
According to KSH methodology, statistics on road-traffic accidents involving personal injury are derived from statistical reporting forms completed by the traffic-control departments of county police forces and the Budapest police force [38]. KSH defines a road-traffic accident involving personal injury as an incidental, unintentional road-traffic event involving at least one moving vehicle and resulting in the injury or death of one or more persons.
The analytical dataset contained 836 micromobility-related crash records, with recorded dates ranging from 2 January to 31 December 2024. Each row represented one recorded crash event. Available variables included crash date and time, crash outcome, accident type, nature of accident, road shape, weather condition, pavement condition, visibility, geographic coordinates, and additional road-context characteristics. The dataset used in this study was provided as a micromobility-specific analytical extract. KSH supplied the dataset after pre-filtering the records as micromobility related; the authors did not independently identify or classify crashes as micromobility events. The extract therefore included crashes involving micromobility users according to the data provider's definition.
However, the analytical file did not contain a sufficiently detailed mode-level variable to allow reliable separate analyses of conventional bicycles, e-bikes, e-scooters, and other lightweight mobility devices. The variables selected for the present study were crash severity, hour of occurrence, weather condition, nature of accident, and road shape. The methodological workflow is summarized in Figure 1.
Figure 1: Analytical sequence of the methodological procedures applied in the study.
2.2. Crash-Severity Classification
Crash severity was the primary outcome variable. In the supplied KSH dataset, the Outcome variable contained three translated labels: “lightly injured,” “seriously injured,” and “deadly.” To align the terminology with international academic road-safety literature, these categories are reported in this study as slight-injury crash, serious-injury crash, and fatal crash, respectively.
Interpretation of these categories followed KSH methodology [38]. A fatal road-traffic accident is one in which at least one person is killed at the scene or dies within 30 days as a result of the crash. A person is classified as seriously injured when the crash causes an injury requiring more than eight days to heal or necessitating hospital care. A slight injury is one expected to recover within eight days. The analysis relied on the crash-level Outcome classification supplied in the KSH analytical dataset.
The original three severity categories were retained for descriptive analysis. The dataset contained:
530 slight-injury crashes;
299 serious-injury crashes; and
7 fatal crashes.
Because only seven fatal crashes were recorded, retaining all three severity categories in the contingency-table analyses resulted in substantial sparse-cell problems. For inferential analysis, severity was therefore dichotomized into:
slight injury, n = 530; and
serious/fatal injury, n = 306.
The serious and fatal categories were combined only for inferential testing. The original three-category classification was retained for descriptive presentation.
2.3. Explanatory Variables
Crash hour was derived from the recorded crash time and classified into 24 hourly intervals from 00:00 to 23:00.
Weather condition was represented by five categories: clear, overcast, rainy, foggy, and stormy. One duplicated source label recorded as “stormy, stormy” was harmonized to “stormy” during data preparation. Crash mechanism was represented by the Nature of accident variable contained in the source dataset. The variable included 12 categories, all of which were retained for analysis without further analytical regrouping. Category terminology was standardized where necessary to improve clarity in the manuscript.
Road shape was classified as straight path, crossroads, bend in the road, or other/non-roadway. One observation recorded as “bends in the road” was harmonized with the equivalent “bend in the road” category
2.4. Data Processing
Before analysis, the dataset was examined for completeness, categorical consistency, missing values, duplicated labels, and sparse category frequencies. All 836 records contained valid information for injury severity, weather condition, nature of accident, road shape, and hour of occurrence.
Minor inconsistencies in categorical wording were harmonized without altering the substantive meaning of the original categories. The original three-level crash-severity classification was retained for descriptive analysis. For inferential testing, serious and fatal crashes were combined because of the very small number of fatal events and the resulting sparse expected frequencies in the contingency tables.
2.5. Statistical Analysis
The analysis consisted of descriptive and bivariate components. Frequencies and percentages were calculated for crash severity, weather condition, nature of accident, and road shape. Hourly crash frequencies were calculated for each of the 24 hours and presented graphically. Bivariate associations between dichotomized crash severity and weather condition, nature of accident, road shape, and hour of day were evaluated using the Pearson chi-square statistic. Expected cell frequencies were examined before interpreting the inferential results.
Sparse expected frequencies remained in several contingency tables even after severity was dichotomized. Conventional asymptotic chi-square p-values were therefore not used as the sole basis for inference. Instead, Monte Carlo permutation p-values based on 1,000,000 permutations under the null hypothesis of independence were calculated.
A fixed random seed of 2024 was used to ensure reproducibility. For each test, the dichotomized injury-severity labels were randomly permuted while the observed explanatory-variable values were preserved. The Monte Carlo p-value was estimated as the proportion of simulated chi-square statistics equal to or greater than the observed statistic. Cramér’s V was calculated to quantify the magnitude of each association. Statistical significance was defined as p < 0.05. Because four primary bivariate association tests were conducted, Holm's sequential correction was additionally applied to control for multiple comparisons. Given the retrospective and observational design of the study, statistically significant results were interpreted as associations rather than causal relationships.
2.6. Software
All analyses were performed using Python 3.11. Data processing and aggregation were carried out using Python-based data-analysis procedures. Statistical testing was performed using SciPy, while graphical outputs were generated using matplotlib and related Python visualization tools.
3. Results
3.1. Crash-Severity Distribution
The final dataset contained 836 recorded micromobility-related crashes in Hungary. Figure 2 presents their distribution by injury severity. Most crashes were classified as slight injury, accounting for 530 cases (63.4% of the sample). Serious-injury crashes accounted for 299 cases (35.8%), while 7 crashes (0.8%) were classified as fatal.
For inferential analysis, serious and fatal outcomes were combined into a higher-severity category comprising 306 crashes (36.6%). Although fatal crashes were uncommon, more than one-third of recorded micromobility crashes were classified as serious or fatal, indicating that higher-severity injuries constituted a substantial part of the recorded crash burden.
3.2. Temporal Distribution of Crashes
Crash occurrence was unevenly distributed across the 24-hour period. The largest individual hourly frequency occurred at 16:00, when 79 crashes were recorded, representing 9.4% of the sample.
The clearest concentration occurred in the afternoon. There were 60 crashes at 15:00, 79 at 16:00, and 53 at 17:00. Together, these three consecutive hours accounted for 192 crashes, or 23.0% of the total sample.
A smaller morning concentration was also evident, with 59 crashes recorded at 07:00. Across the broader afternoon period from 14:00 to 18:00, 300 crashes occurred, representing 35.9% of all recorded cases.
The hourly pattern therefore shows a pronounced concentration of crashes during the afternoon, together with a smaller morning increase. These frequencies should not be interpreted as exposure-adjusted risk because the dataset does not contain hourly micromobility trip counts, distance travelled, or numbers of active riders. Figure 3 illustrates the hourly distribution.
3.3. Weather Conditions
Most recorded crashes occurred during clear weather. Clear conditions accounted for 678 crashes (81.1%), followed by overcast conditions with 127 crashes (15.2%).
Crashes during adverse weather were comparatively uncommon. Twenty crashes occurred during rainy conditions (2.4%), nine during foggy conditions (1.1%), and two during stormy conditions (0.2%) all illustrated in Table 1. Clear and overcast weather together accounted for 805 crashes (96.3%), whereas rainy, foggy, and stormy conditions accounted for 31 crashes (3.7%).
The predominance of crashes under clear or overcast conditions should not be taken as evidence that favorable weather is inherently more hazardous. Because weather-specific exposure information was unavailable, crash risk per trip could not be estimated.
3.4. Nature of Accident Distribution
The distribution of crashes by nature of accident varied considerably across crash mechanisms as illustrated in Table 2. The most frequent category was collision of vehicles traveling in the opposite direction, accounting for 313 crashes (37.4%). This was followed by skidding, rear-ending, or overturning on the road, with 152 crashes (18.2%), and collisions between straight-moving and turning vehicles, with 112 crashes (13.4%). Pedestrian-involved crashes accounted for 63 cases (7.5%), while collisions involving vehicles traveling in the same direction accounted for 62 cases (7.4%). Running off the road without hitting a fixed object occurred in 54 cases (6.5%).
Less frequent mechanisms included collisions of oncoming vehicles (n = 30, 3.6%), collisions with stationary vehicles (n = 25, 3.0%), collisions with a fixed object on the road (n = 13, 1.6%), and lane-departure crashes involving a fixed object outside the roadway (n = 9, 1.1%). Collisions with wild animals and passenger accidents were rare. The three most frequent categories together accounted for 577 crashes (69.0%), indicating that recorded micromobility crashes were concentrated within a limited number of dominant crash mechanisms.
3.5. Road-Shape Distribution
Most crashes occurred on straight road sections, which accounted for 487 cases (58.3%). Crossroads were the second most frequent road-shape category, with 273 crashes (32.7%). Other or non-roadway locations accounted for 43 cases (5.1%), while 33 crashes (3.9%) occurred on bends all shown in Table 3. These descriptive frequencies show where recorded crashes occurred, but they cannot establish road-type-specific risk because the corresponding amount of micromobility exposure on each road configuration is unknown.
3.6. Association Between Crash Severity and Selected Characteristics
Bivariate associations between dichotomized crash severity and weather condition, nature of accident, road shape, and hour of day were examined using Pearson's chi-square statistic. Because several contingency tables retained sparse expected cell frequencies, statistical significance was evaluated using Monte Carlo permutation p-values based on 1,000,000 resamples. Cramér's V was used to quantify the strength of association.
Nature of accident was significantly associated with crash severity (χ²(11) = 26.36, Monte Carlo p = 0.0037, Cramér's V = 0.178). The association remained statistically significant after Holm correction for the four primary comparisons (adjusted p = 0.0147). No statistically significant association was found between crash severity and weather condition (χ²(4) = 4.04, Monte Carlo p = 0.4181, Cramér's V = 0.070), road shape (χ²(3) = 5.10, Monte Carlo p = 0.1664, Cramér's V = 0.078), or hour of day (χ²(23) = 23.72, Monte Carlo p = 0.4220, Cramér's V = 0.168). Descriptive examination of individual nature-of-accident categories showed variation in the proportion of serious/fatal outcomes. Serious/fatal outcomes accounted for 52.0% of collisions with stationary vehicles, 48.1% of crashes involving running off the road without hitting a fixed object, 44.1% of skidding, rear-ending, or overturning crashes, and 42.0% of collisions between straight-moving and turning vehicles. By comparison, serious/fatal outcomes accounted for 29.4% of opposite-direction collisions and 25.8% of same-direction collisions. Categories containing very few observations, including passenger accidents and collisions with wild animals, were not interpreted individually despite their high observed proportions. These percentages are descriptive. The inferential findings support an overall association between nature of accident and injury severity, but they do not establish that any individual accident mechanism independently causes more severe outcomes. All ILLUSTRATED IN Table 4.
4. Discussion
4.1. Principal Findings
This study provides a national epidemiological assessment of 836 micromobility-related crashes recorded in Hungary during 2024. Four findings are particularly important.
First, although slight-injury crashes constituted most recorded cases, serious and fatal crashes together accounted for 36.6% of the dataset. The recorded micromobility safety burden was therefore not confined to minor injuries. Second, crash occurrence was concentrated at particular times of day. Almost one-quarter of all recorded crashes occurred during the three-hour period from 15:00 to 17:00, with 16:00 representing the single most frequent hour.
Third, most crashes occurred during clear or overcast weather and on straight road sections. These findings describe the distribution of recorded crashes rather than differences in risk because corresponding exposure measures were unavailable. Fourth, nature of accident was the only examined characteristic significantly associated with injury severity. Weather condition, road shape, and hour of day showed no statistically significant association with the distinction between slight and serious/fatal outcomes.
The association between nature of accident and injury severity remained statistically significant after correction for multiple comparisons, although its magnitude was modest (Cramér’s V = 0.178). Crash mechanism therefore appears to contribute to variation in injury severity, but it does not by itself explain the outcome of a crash.
4.2. Injury Severity and Temporal Crash Patterns
Serious and fatal outcomes represented more than one-third of the recorded crashes. This finding underlines the importance of considering serious non-fatal injury when evaluating micromobility safety. An assessment based only on fatalities would overlook a substantial proportion of higher-severity outcomes. The observed severity distribution should nevertheless be interpreted cautiously. Administrative crash databases may underrepresent minor events, particularly those that are not formally reported. The finding that 36.6% of recorded crashes resulted in serious or fatal injury therefore does not mean that the same proportion applies to all micromobility incidents occurring in Hungary.
The hourly distribution showed a clear afternoon concentration. A total of 192 crashes (23.0%) occurred between 15:00 and 17:00, while 16:00 alone accounted for 79 crashes, the highest hourly frequency in the dataset. The inferential results, however, showed no significant association between hour of day and injury severity. Crashes were therefore more frequent during certain hours, but there was no statistical evidence that crashes occurring at those times were more likely to result in serious or fatal outcomes.
This distinction between frequency and severity is important. Higher crash counts during active travel periods may partly reflect increased micromobility use and greater interaction among micromobility users, pedestrians, cyclists, public transport, and motor vehicles. Because hourly exposure measures were unavailable, the afternoon pattern should be interpreted as a concentration of recorded crash occurrence rather than evidence of higher per-trip risk.
4.3. Nature of Accident and Injury Severity
The principal inferential finding of this study was the statistically significant association between nature of accident and injury severity. This association remained significant after Holm correction for the four primary comparisons. The magnitude of the relationship was modest, with a Cramér’s V of 0.178. Injury severity is therefore unlikely to be determined by crash mechanism alone. Other characteristics that were unavailable or not included in the present bivariate analysis, such as impact speed, collision partner, rider age, helmet use, alcohol involvement, vehicle type, infrastructure characteristics, and lighting, may also contribute to injury outcomes.
The descriptive distribution of severity across individual crash mechanisms nevertheless provides useful context. Serious/fatal outcomes occurred in 52.0% of collisions with stationary vehicles, 48.1% of crashes involving running off the road without hitting a fixed object, 44.1% of skidding, rear-ending, or overturning crashes, and 42.0% of collisions between straight-moving and turning vehicles. These mechanisms may involve different impact dynamics and different levels of rider protection. Running-off-road crashes and skidding or overturning events, for example, may involve loss of control followed by direct rider contact with the roadway or surrounding environment. Collisions involving turning vehicles may involve intersecting trajectories and interactions with larger vehicles. The available variables, however, do not allow these mechanisms to be established causally, and they require more detailed investigation.
By contrast, serious/fatal outcomes accounted for 29.4% of opposite-direction collision cases and 25.8% of same-direction collisions. These percentages should not be interpreted as direct comparisons of risk because the frequency of exposure associated with each crash mechanism is unknown. Overall, the significant association indicates that crash mechanism deserves greater attention in future micromobility severity research. Subsequent studies should examine nature of accident together with collision partner, impact direction, vehicle speed, infrastructure, and rider-level characteristics using multivariable modelling.
4.4. Weather and Road Context
Clear and overcast weather accounted for 96.3% of the recorded crashes. This pattern does not demonstrate that favorable weather increases crash risk. Micromobility use is likely to be more common when conditions are suitable for riding, whereas rain, fog, and storms may discourage travel. Without weather-specific exposure data, the relative risk associated with different weather conditions cannot be determined.
Weather condition was also not significantly associated with crash severity. The number of crashes in adverse-weather categories was small, however, particularly for foggy and stormy conditions. Conclusions concerning these individual categories should therefore remain cautious. Road shape was likewise not significantly associated with crash severity. Straight road sections accounted for most recorded crashes, while approximately one-third occurred at crossroads. These figures describe the distribution of crash locations but do not demonstrate that straight roads are more hazardous than crossroads.
The road-shape variable is also relatively broad. Categories such as “straight path” and “crossroads” cannot capture many infrastructure characteristics that may influence micromobility safety, including bicycle-lane protection, crossing design, turning radius, traffic-signal control, sight distance, vehicle speed, pavement quality, lane width, and separation from motorized traffic. Previous research has identified infrastructure and built-environment characteristics as important aspects of cycling and micromobility safety [14,17,21,22]. The absence of a significant relationship between broad road-shape categories and injury severity should therefore not be interpreted as evidence that infrastructure characteristics are unimportant.
4.5. Policy and Infrastructure Implications
The findings have several implications for micromobility safety planning in Hungary.
First, the significant association between nature of accident and injury severity indicates that crash mechanism should receive particular attention in future safety assessments. Mechanisms showing relatively high proportions of serious/fatal outcomes—especially collisions with stationary vehicles, running-off-road crashes, skidding or overturning events, and collisions between straight-moving and turning vehicles—warrant more detailed investigation. Second, several of these mechanisms suggest specific areas for infrastructure-focused research. Running-off-road, skidding, and overturning events may justify closer examination of pavement quality, roadside obstacles, drainage, kerbs, tram tracks, surface irregularities, visibility, and vehicle stability. Turning-related collisions may warrant detailed assessment of junction configuration, priority arrangements, sight distance, and separation between micromobility users and motor vehicles.
The present study does not establish that any of these infrastructure characteristics caused the observed crashes. They should therefore be treated as priorities for further investigation rather than as countermeasures proven by the current dataset. Third, the strong afternoon concentration in crash occurrence remains relevant from a practical perspective even though hour of day was not associated with injury severity. Prevention activities carried out during periods when crashes occur most frequently may still reach a substantial proportion of the overall crash burden. Targeted monitoring, public-awareness campaigns, visibility interventions, or enforcement strategies could therefore be evaluated during high-volume afternoon periods.
Finally, the results demonstrate the value of increasing the level of detail available in national micromobility crash datasets. Future data collection should distinguish individual micromobility modes and include information on rider demographics, helmet use, alcohol and distraction, collision partner, speed, detailed road-surface condition, infrastructure type, lighting, traffic volume, and exposure. Such information would enable future studies to progress from descriptive and bivariate analyses toward multivariable severity modelling and exposure-adjusted estimation of crash risk.
4.6. Strengths and Limitations
A principal strength of this study is its use of a national administrative dataset containing 836 recorded micromobility-related crashes over a complete reporting year. The analysis adds empirical evidence from Hungary and establishes a baseline for a Central and Eastern European context that remains comparatively underrepresented in the international micromobility safety literature. The statistical approach is another strength. Rather than retaining the original three-level severity variable in contingency tables with substantial sparsity, serious and fatal outcomes were combined for inferential analysis, and statistical significance was assessed using Monte Carlo resampling. Effect sizes and correction for multiple comparisons were also incorporated, allowing a more robust interpretation than relying on asymptotic p-values alone.
Several limitations should nevertheless be considered. First, the dataset did not contain exposure measures such as trip counts, distance travelled, duration of riding, or the number of active micromobility users. The analysis therefore describes the distribution of recorded crashes rather than exposure-adjusted risk. Second, only seven fatal crashes were recorded. Serious and fatal crashes were consequently combined for inferential analysis. Although this substantially reduced the sparse-cell problem, some explanatory categories remained infrequent.
Third, administrative crash databases may underrepresent less severe events, particularly crashes that do not result in police attendance or formal reporting. The observed severity distribution may therefore not represent the full range of micromobility crashes occurring in Hungary. Fourth, several Nature of accident categories contained very small numbers of observations. Although the use of Monte Carlo inference reduced dependence on asymptotic chi-square assumptions, percentages for rare crash mechanisms should still be interpreted cautiously.
Fifth, the micromobility-specific analytical extract did not contain a usable mode-level variable that would allow conventional bicycles, e-bikes, e-scooters, and other micromobility devices to be analyzed separately. Potential differences among individual micromobility modes could therefore not be examined. Sixth, several contextual variables were available only in relatively broad categories. Road shape, in particular, does not provide enough detail to characterize specific cycling infrastructure, intersection design, vehicle speed, or road-surface conditions.
Seventh, the analysis covered only one calendar year. Interannual variability and longer-term temporal trends could therefore not be assessed. Finally, the study used an observational bivariate design. The identified associations should not be interpreted as causal effects, and potentially important confounding factors could not be controlled simultaneously. Future research should incorporate exposure measures, geospatial data, detailed infrastructure information, rider characteristics, and multivariable statistical modelling.
5. Conclusions
This study provides a national epidemiological assessment of 836 micromobility-related crashes recorded in Hungary during 2024 using administrative crash data from the Hungarian Central Statistical Office.
Slight injuries accounted for 63.4% of recorded cases, serious injuries for 35.8%, and fatal outcomes for 0.8%. Serious and fatal outcomes together represented 36.6% of the dataset, showing that higher-severity injuries form an important part of the recorded micromobility crash burden.
Crash occurrence was strongly concentrated at certain times of day. A total of 192 crashes (23.0%) occurred between 15:00 and 17:00, while the highest individual hourly frequency was recorded at 16:00 (n = 79). Hour of day, however, was not significantly associated with injury severity. The temporal concentration of crashes should therefore not be interpreted as evidence of greater severity during those hours.
The main inferential finding was a statistically significant association between nature of accident and injury severity (χ²(11) = 26.36, Monte Carlo p = 0.0037, Cramér’s V = 0.178). This relationship remained significant after Holm correction for multiple comparisons (adjusted p = 0.0147). Weather condition, road shape, and hour of day were not significantly associated with injury severity.
Descriptive patterns showed relatively high proportions of serious/fatal outcomes among collisions with stationary vehicles, running-off-road crashes without impact with a fixed object, skidding or overturning crashes, and collisions between straight-moving and turning vehicles. These results identify crash mechanism as an important priority for future micromobility safety research.
Interpretation of the findings is limited by the absence of exposure measures, the small number of fatal cases, possible underreporting of minor crashes, rare crash-mechanism categories, broad road-context variables, and reliance on a single year of observational data.
Future studies should incorporate rider characteristics, individual micromobility mode, collision partner, impact speed, detailed infrastructure information, geospatial characteristics, traffic conditions, and exposure measures, together with multivariable severity models.
Overall, the study establishes a national baseline for micromobility crash epidemiology in Hungary and highlights the importance of distinguishing between factors associated with when and where crashes occur and those associated with the severity of their outcomes.
Author Contributions
Conceptualization, Z.F.M. and J.J.A.; methodology, Z.F.M. and J.J.A.; formal analysis, Z.F.M.; data curation, Z.F.M.; visualization, Z.F.M.; writing—original draft preparation, Z.F.M.; writing—review and editing, Z.F.M. and J.J.A.; supervision, J.J.A. All authors have read and agreed to the published version of the manuscript.
Funding
Please add: This research received no external funding
Data Availability Statement
The data analyzed in this study were obtained from the Hungarian Central Statistical Office (KSH/HCSO). The dataset is not publicly redistributed by the authors and may be subject to the data provider’s access conditions.
Acknowledgments
During the preparation of this manuscript, the authors used GenAI, for language editing, manuscript restructuring. The authors reviewed and edited all outputs and take full responsibility for the content of the publication.
Conflicts of Interest
The authors declare no conflicts of interest.
References
- Jäppinen, S.; Toivonen, T.; Salonen, M. Modelling the potential effect of shared bicycles on public transport travel times in Greater Helsinki: An open data approach. Appl. Geogr. 2013, 43, 13–24. [Google Scholar] [CrossRef]
- Montes, A.; Geržinič, N.; Veeneman, W.; van Oort, N.; Hoogendoorn, S. Shared micromobility and public transport integration—A mode choice study using stated preference data. Res. Transp. Econ. 2023, 99, 101302. [Google Scholar] [CrossRef]
- Lee, M.; Chow, J.Y.J.; Yoon, G.; He, B.Y. Forecasting e-scooter substitution of direct and access trips by mode and distance. Transp. Res. Part D. Transp. Environ. 2021, 96, 102892. [Google Scholar] [CrossRef]
- Ziedan, A.; Shah, N.R.; Wen, Y.; Brakewood, C.; Cherry, C.R.; Cole, J. Complement or compete? The effects of shared electric scooters on bus ridership. Transp. Res. Part D. Transp. Environ. 2021, 101, 103098. [Google Scholar] [CrossRef]
- Abduljabbar, R.L.; Liyanage, S.; Dia, H. The role of micro-mobility in shaping sustainable cities: A systematic literature review. Transp. Res. Part D. Transp. Environ. 2021, 92, 102734. [Google Scholar] [CrossRef]
- Banister, D. The sustainable mobility paradigm. Transp. Policy 2008, 15, 73–80. [Google Scholar] [CrossRef]
- Zhang, Y.; Mi, Z. Environmental benefits of bike sharing: A big data-based analysis. Appl. Energy 2018, 220, 296–301. [Google Scholar] [CrossRef]
- Keall, M.D.; Shaw, C.; Chapman, R.; Howden-Chapman, P. Reductions in carbon dioxide emissions from an intervention to promote cycling and walking: A case study from New Zealand. Transp. Res. Part D. Transp. Environ. 2018, 65, 687–696. [Google Scholar] [CrossRef]
- D’Acierno, L.; Tanzilli, M.; Tescione, C.; Pariota, L.; Di Costanzo, L.; Chiaradonna, S.; et al. Adoption of micro-mobility solutions for improving environmental sustainability: Comparison among transportation systems in urban contexts. Sustainability 2022, 14, 7960. [Google Scholar] [CrossRef]
- McQueen, M.; Abou-Zeid, G.; MacArthur, J.; Clifton, K. Transportation Transformation: Is Micromobility Making a Macro Impact on Sustainability? J. Plan. Lit. 2021, 36, 46–61. [Google Scholar] [CrossRef]
- Comi, A.; Polimeni, A. Assessing potential sustainability benefits of micromobility: A new data driven approach. Eur. Transp. Res. Rev. 2024, 16, 19. [Google Scholar] [CrossRef]
- Bozzi, A.D.; Aguilera, A. Shared E-scooters: A review of uses, health and environmental impacts, and policy implications of a new micro-mobility service. Sustainability 2021, 13, 8676. [Google Scholar] [CrossRef]
- Li, X.; Qiao, S.; Rybarczyk, G.; Zhao, Q. E-scooter safety under scrutiny: Examining crash patterns and injuries in the UK. J. Saf. Res. 2025, 92, 292–305. [Google Scholar] [CrossRef] [PubMed]
- Shah, N.R.; Aryal, S.; Wen, Y.; Cherry, C.R. Comparison of motor vehicle-involved e-scooter and bicycle crashes using standardized crash typology. J. Saf. Res. 2021, 77, 217–228. [Google Scholar] [CrossRef] [PubMed]
- Johns Hopkins International Injury Research Unit. Evidence Synthesis on E-Bike and E-Scooter Injuries, Safety Interventions, and Policies; Johns Hopkins University: Baltimore, MD, USA, 2024. [Google Scholar]
- Pai, R.R.; Dozza, M. Understanding factors influencing e-scooterist crash risk: A naturalistic study of rental e-scooters in an urban area. Accid. Anal. Prev. 2025, 209, 107839. [Google Scholar] [CrossRef] [PubMed]
- Abdi, A.; O’Hern, S. Understanding e-scooter rider crash severity using a built environment typology: A two-stage clustering and random parameter model analysis. Accid. Anal. Prev. 2025, 215, 108018. [Google Scholar] [CrossRef] [PubMed]
- Dibaj, S.; Vosough, S.; Kazemzadeh, K.; O’Hern, S.; Mladenović, M.N. An exploration of e-scooter injuries and severity: Impact of restriction policies in Helsinki, Finland. J. Saf. Res. 2024, 91, 271–282. [Google Scholar] [CrossRef] [PubMed]
- Younes, H. Comparing injuries from e-scooters, e-bikes, and bicycles in the United States. J. Cycl. Micromobility Res. 2025, 4, 100061. [Google Scholar] [CrossRef]
- Brenner, A.; Niry, D.; Blum, I.; Shendler, G.; Rabinowich, A.; Stav, D.; Ran, Y.; Weiss-Meilik, A.; Ungar, O.J. Comparative analysis of accident mechanisms and injury patterns of e-moped and e-scooter operators. Am. J. Emerg. Med. 2025, 92, 32–36. [Google Scholar] [CrossRef] [PubMed]
- Shaheen, S.; Cohen, A. Shared Micromobility Policy Toolkit: Docked and Dockless Bike and Scooter Sharing; Transportation Sustainability Research Center, University of California, Berkeley: Berkeley, CA, USA, 2019. [Google Scholar]
- Reynolds, C.C.O.; Harris, M.A.; Teschke, K.; Cripton, P.A.; Winters, M. The impact of transportation infrastructure on bicycling injuries and crashes: A review of the literature. Environ. Health 2009, 8, 47. [Google Scholar] [CrossRef] [PubMed]
- Badia, H.; Jenelius, E. Shared e-scooter micromobility: Review of use patterns, perceptions and environmental impacts. Transp. Rev. 2023, 43, 811–837. [Google Scholar] [CrossRef]
- O’Brien, O.; Cheshire, J.; Batty, M. Mining bicycle sharing data for generating insights into sustainable transport systems. J. Transp. Geogr. 2014, 34, 262–273. [Google Scholar] [CrossRef]
- Hosseinzadeh, A.; Karimpour, A.; Kluger, R. Factors influencing shared micromobility services: An analysis of e-scooters and bikeshare. Transp. Res. Part D. Transp. Environ. 2021, 100, 103047. [Google Scholar] [CrossRef]
- McKenzie, G. Spatiotemporal comparative analysis of scooter-share and bike-share usage patterns in Washington, D.C. J. Transp. Geogr. 2019, 78, 19–28. [Google Scholar] [CrossRef]
- Özdemir, P. University students’ perspectives on micromobility: An evaluation based on e-scooters. Akıllı Ulaşım Sist. Ve Uygulamaları Derg. 2023, 6, 223–237. [Google Scholar]
- Blazanin, G.; Mondal, A.; Asmussen, K.E.; Bhat, C.R. E-scooter sharing and bikesharing systems: An individual-level analysis of factors affecting first-use and use frequency. Transp. Res. Part C Emerg. Technol. 2022, 135, 103515. [Google Scholar] [CrossRef]
- Reck, D.J.; Axhausen, K.W. Who uses shared micro-mobility services? Empirical evidence from Zurich, Switzerland. Transp. Res. Part D. Transp. Environ. 2021, 94, 102803. [Google Scholar] [CrossRef]
- Samadzad, M.; Nosratzadeh, H.; Karami, H.; Karami, A. What are the factors affecting the adoption and use of electric scooter sharing systems from the end user’s perspective? Transp. Policy 2023, 136, 70–82. [Google Scholar] [CrossRef]
- Eccarius, T.; Leung, A.; Shen, C.-W.; Burke, M.; Lu, C.-C. Prospects for shared electric velomobility: Profiling potential adopters at a multi-campus university. J. Transp. Geogr. 2021, 96, 103190. [Google Scholar] [CrossRef]
- Torrisi, V.; Ignaccolo, M.; Inturri, G.; Tesoriere, G.; Campisi, T. Exploring the factors affecting bike-sharing demand: Evidence from student perceptions, usage patterns and adoption barriers. Transp. Res. Procedia 2021, 52, 573–580. [Google Scholar] [CrossRef]
- Bokolo, A.J. Examining the adoption of sustainable eMobility-sharing in smart communities: Diffusion of Innovation Theory perspective. Smart Cities 2023, 6, 2057–2080. [Google Scholar] [CrossRef]
- Bretones, A.; Marquet, O. Sociopsychological factors associated with the adoption and usage of electric micromobility: A literature review. Transp. Policy 2022, 127, 230–249. [Google Scholar] [CrossRef]
- Mohammed, Z.F.; Juhasz, J.A. Sustainable transportation mode for university students: Examining micro-mobility adoption in Hungary and the Kurdistan Region of Iraq through environmental and service level lenses. AIP Conf. Proc. 2026, 3396, 1. [Google Scholar] [CrossRef]
- Foglar, V.; Süvegh, D.; Al-Smadi, M.W.; Veres, D.; Nemes, C.; Viola, Á. Electric-Scooter- and Bicycle-Related Trauma in a Hungarian Level-1 Trauma Center—A Retrospective 1-Year Study. J. Clin. Med. 2025, 14, 8782. [Google Scholar] [CrossRef] [PubMed]
- Abdullah, P.; Esztergár-Kiss, D.; Sipos, T. Identifying accident and safety risks in urban micromobility: An analytical approach using machine learning. Sustain. Futur. 2026, 11, 101452. [Google Scholar] [CrossRef]
- Hungarian Central Statistical Office (KSH). Road Traffic Accidents Causing Personal Injuries—Methodology. Available online: https://www.ksh.hu/docs/eng/modszgyors/esermodsz06.html. (accessed on 7 September 2026).
Figure 1.
Analytical sequence of the methodological procedures applied in the study.
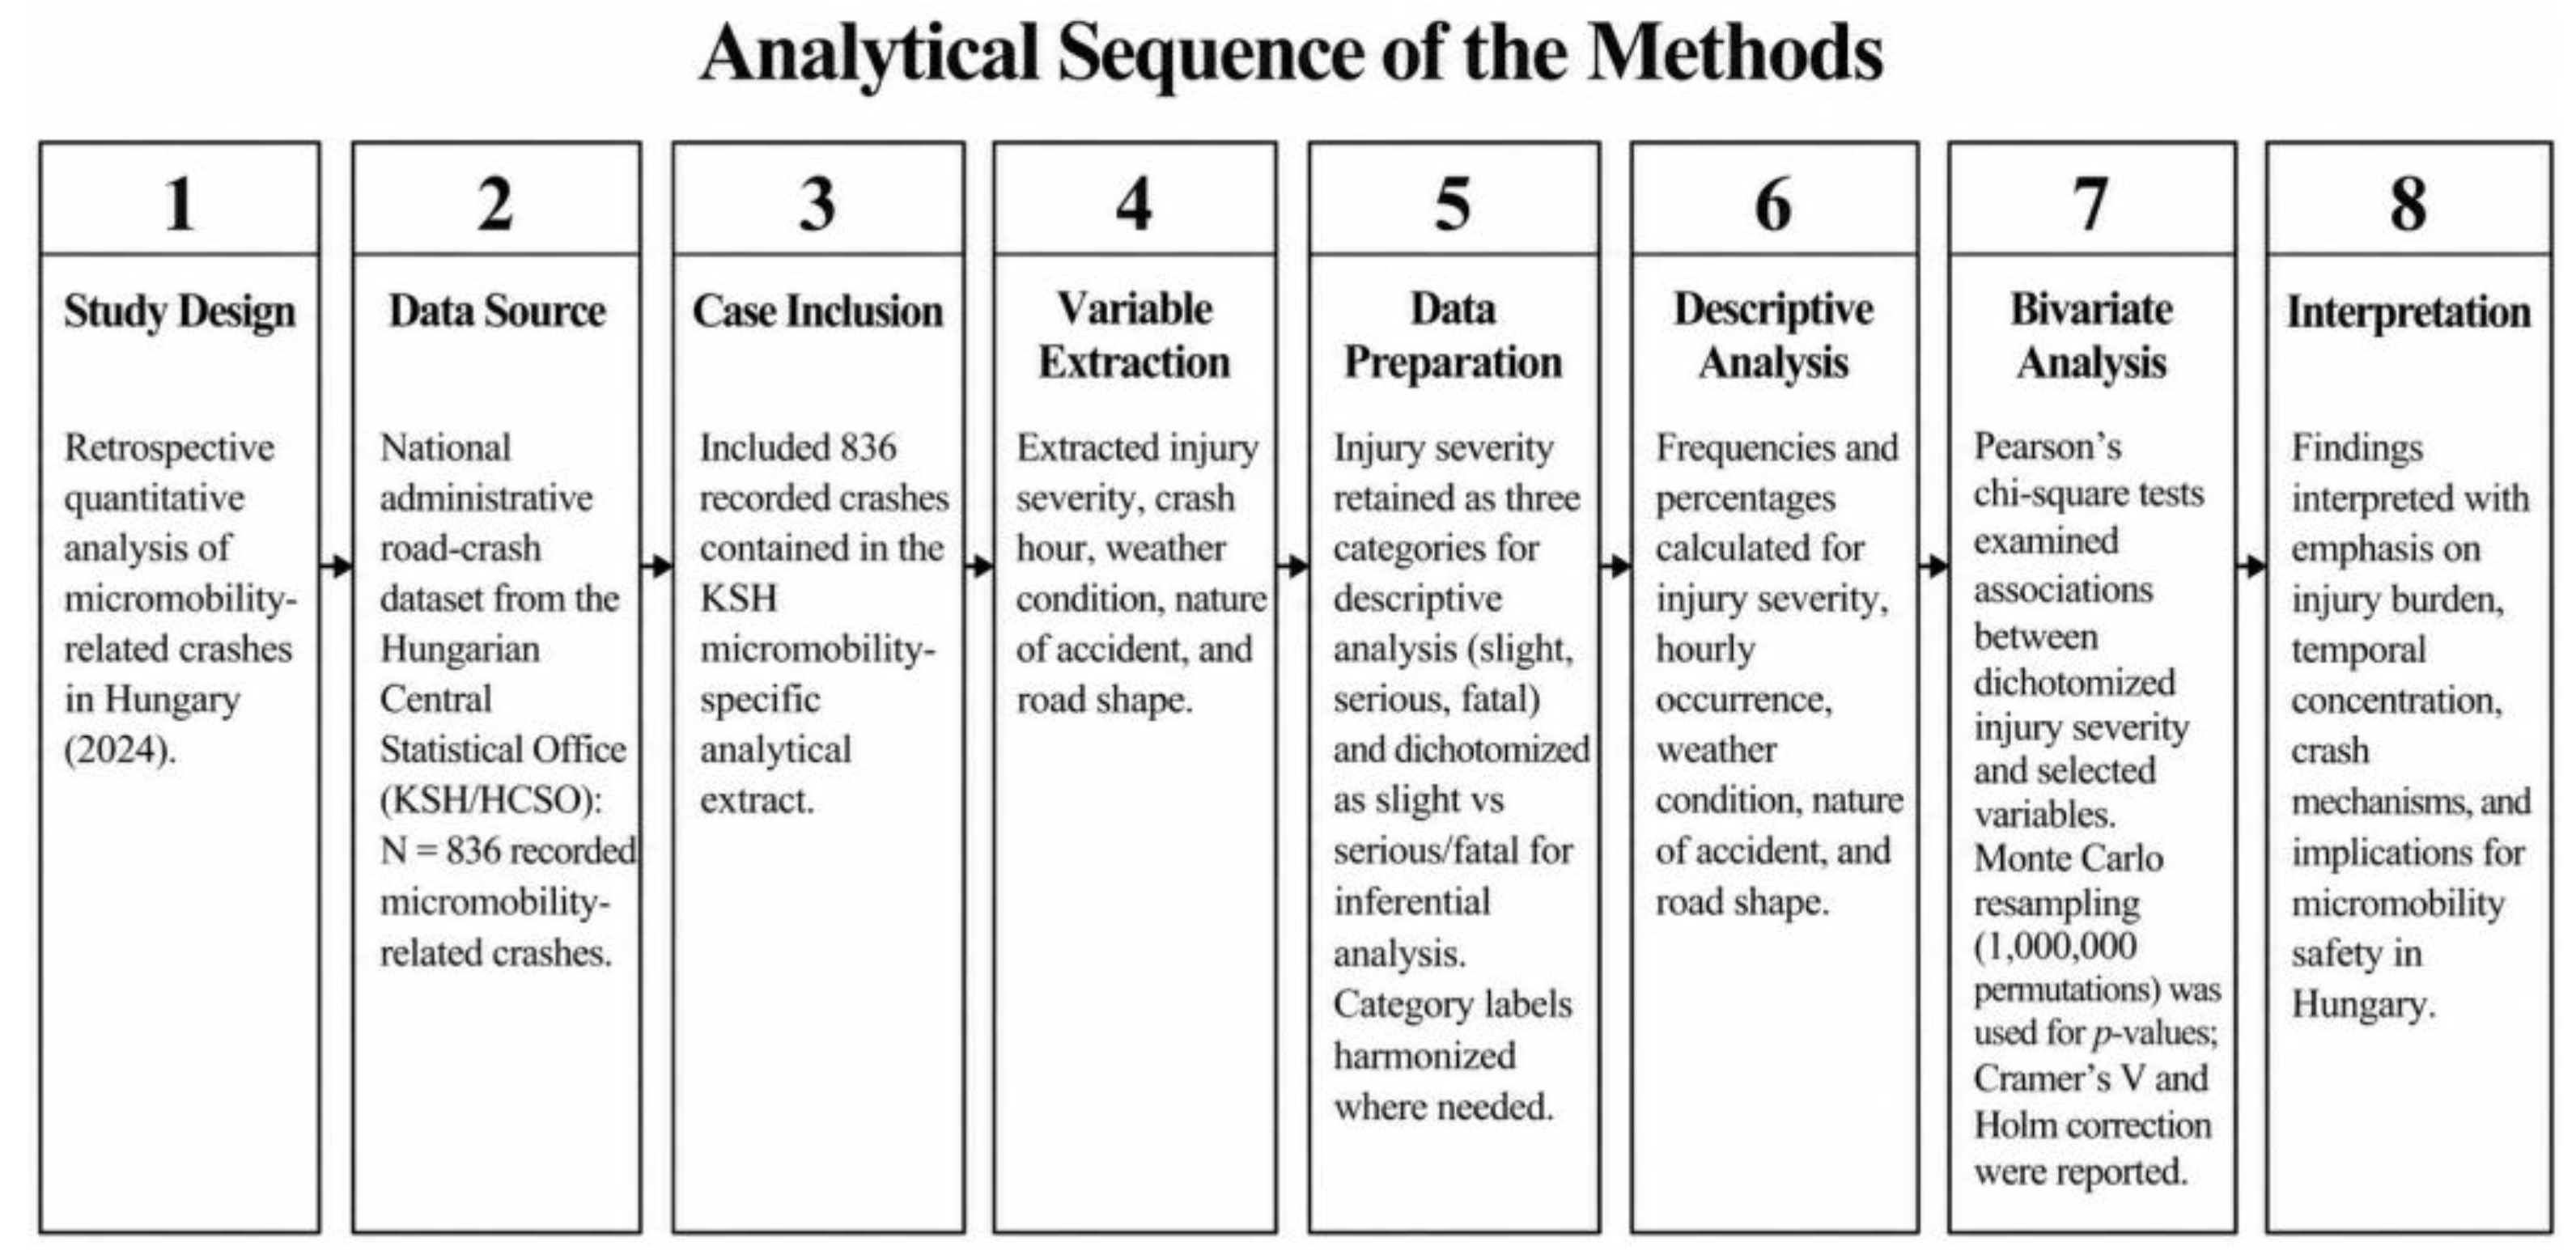
Figure 2.
Distribution of recorded micromobility crashes by injury-severity category in Hungary in 2024.
Figure 2.
Distribution of recorded micromobility crashes by injury-severity category in Hungary in 2024.
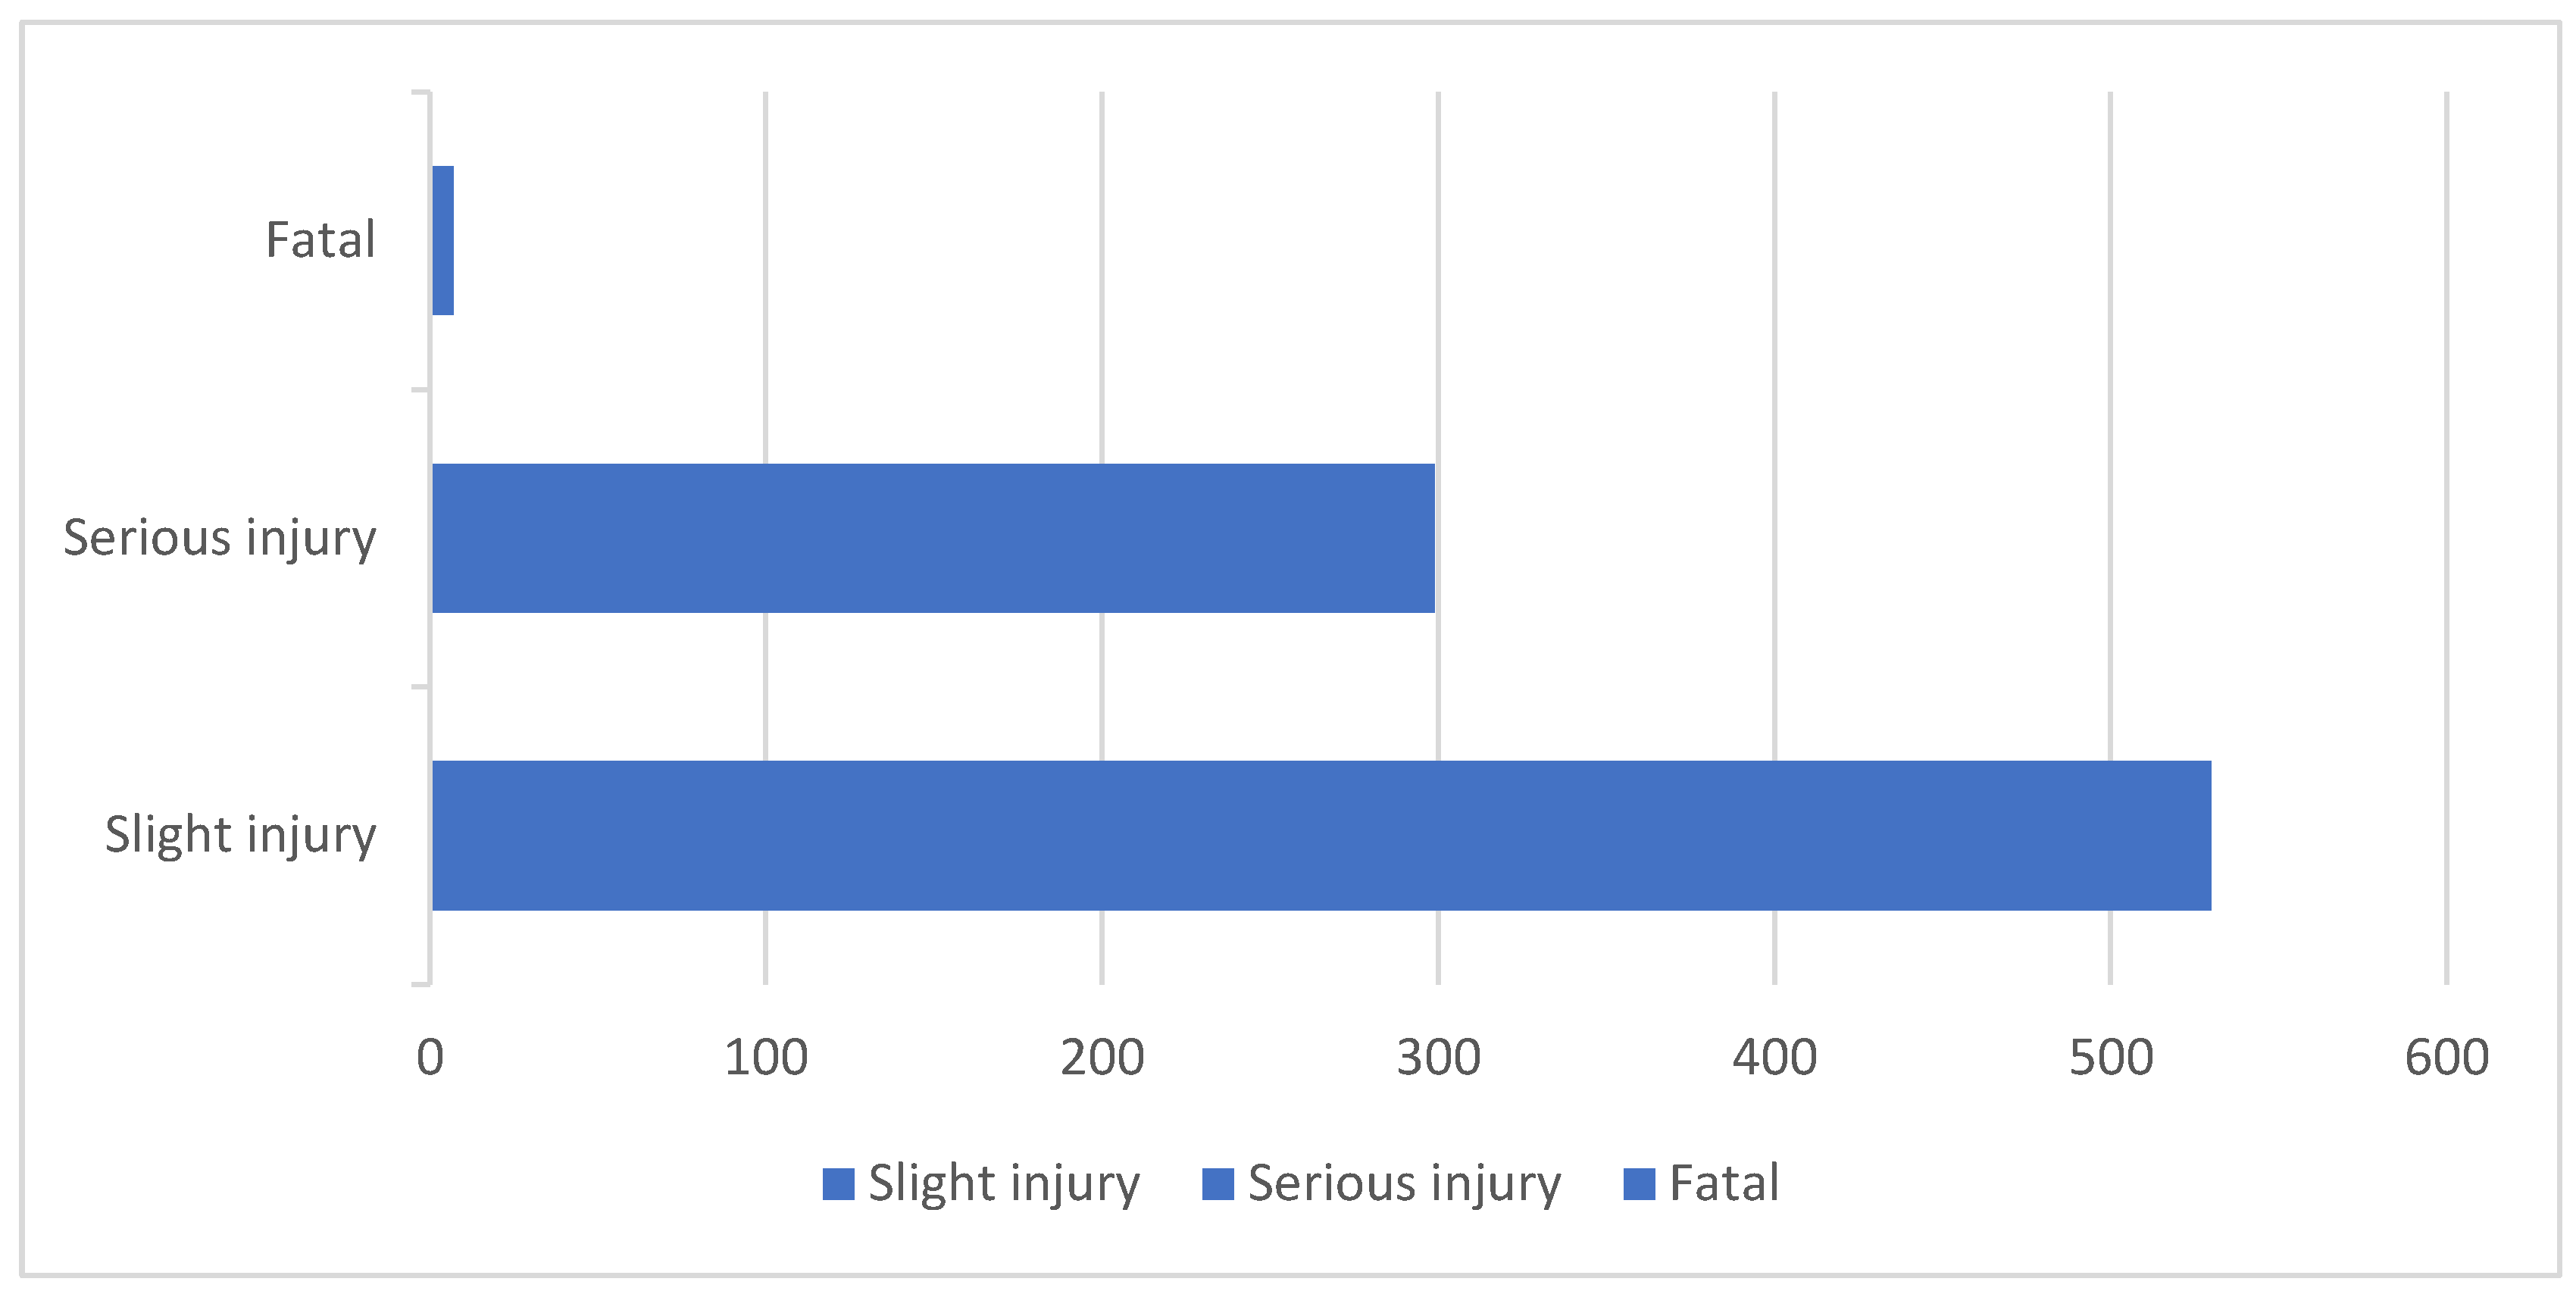
Figure 3.
Hourly distribution of recorded micromobility-related crashes in Hungary in 2024.
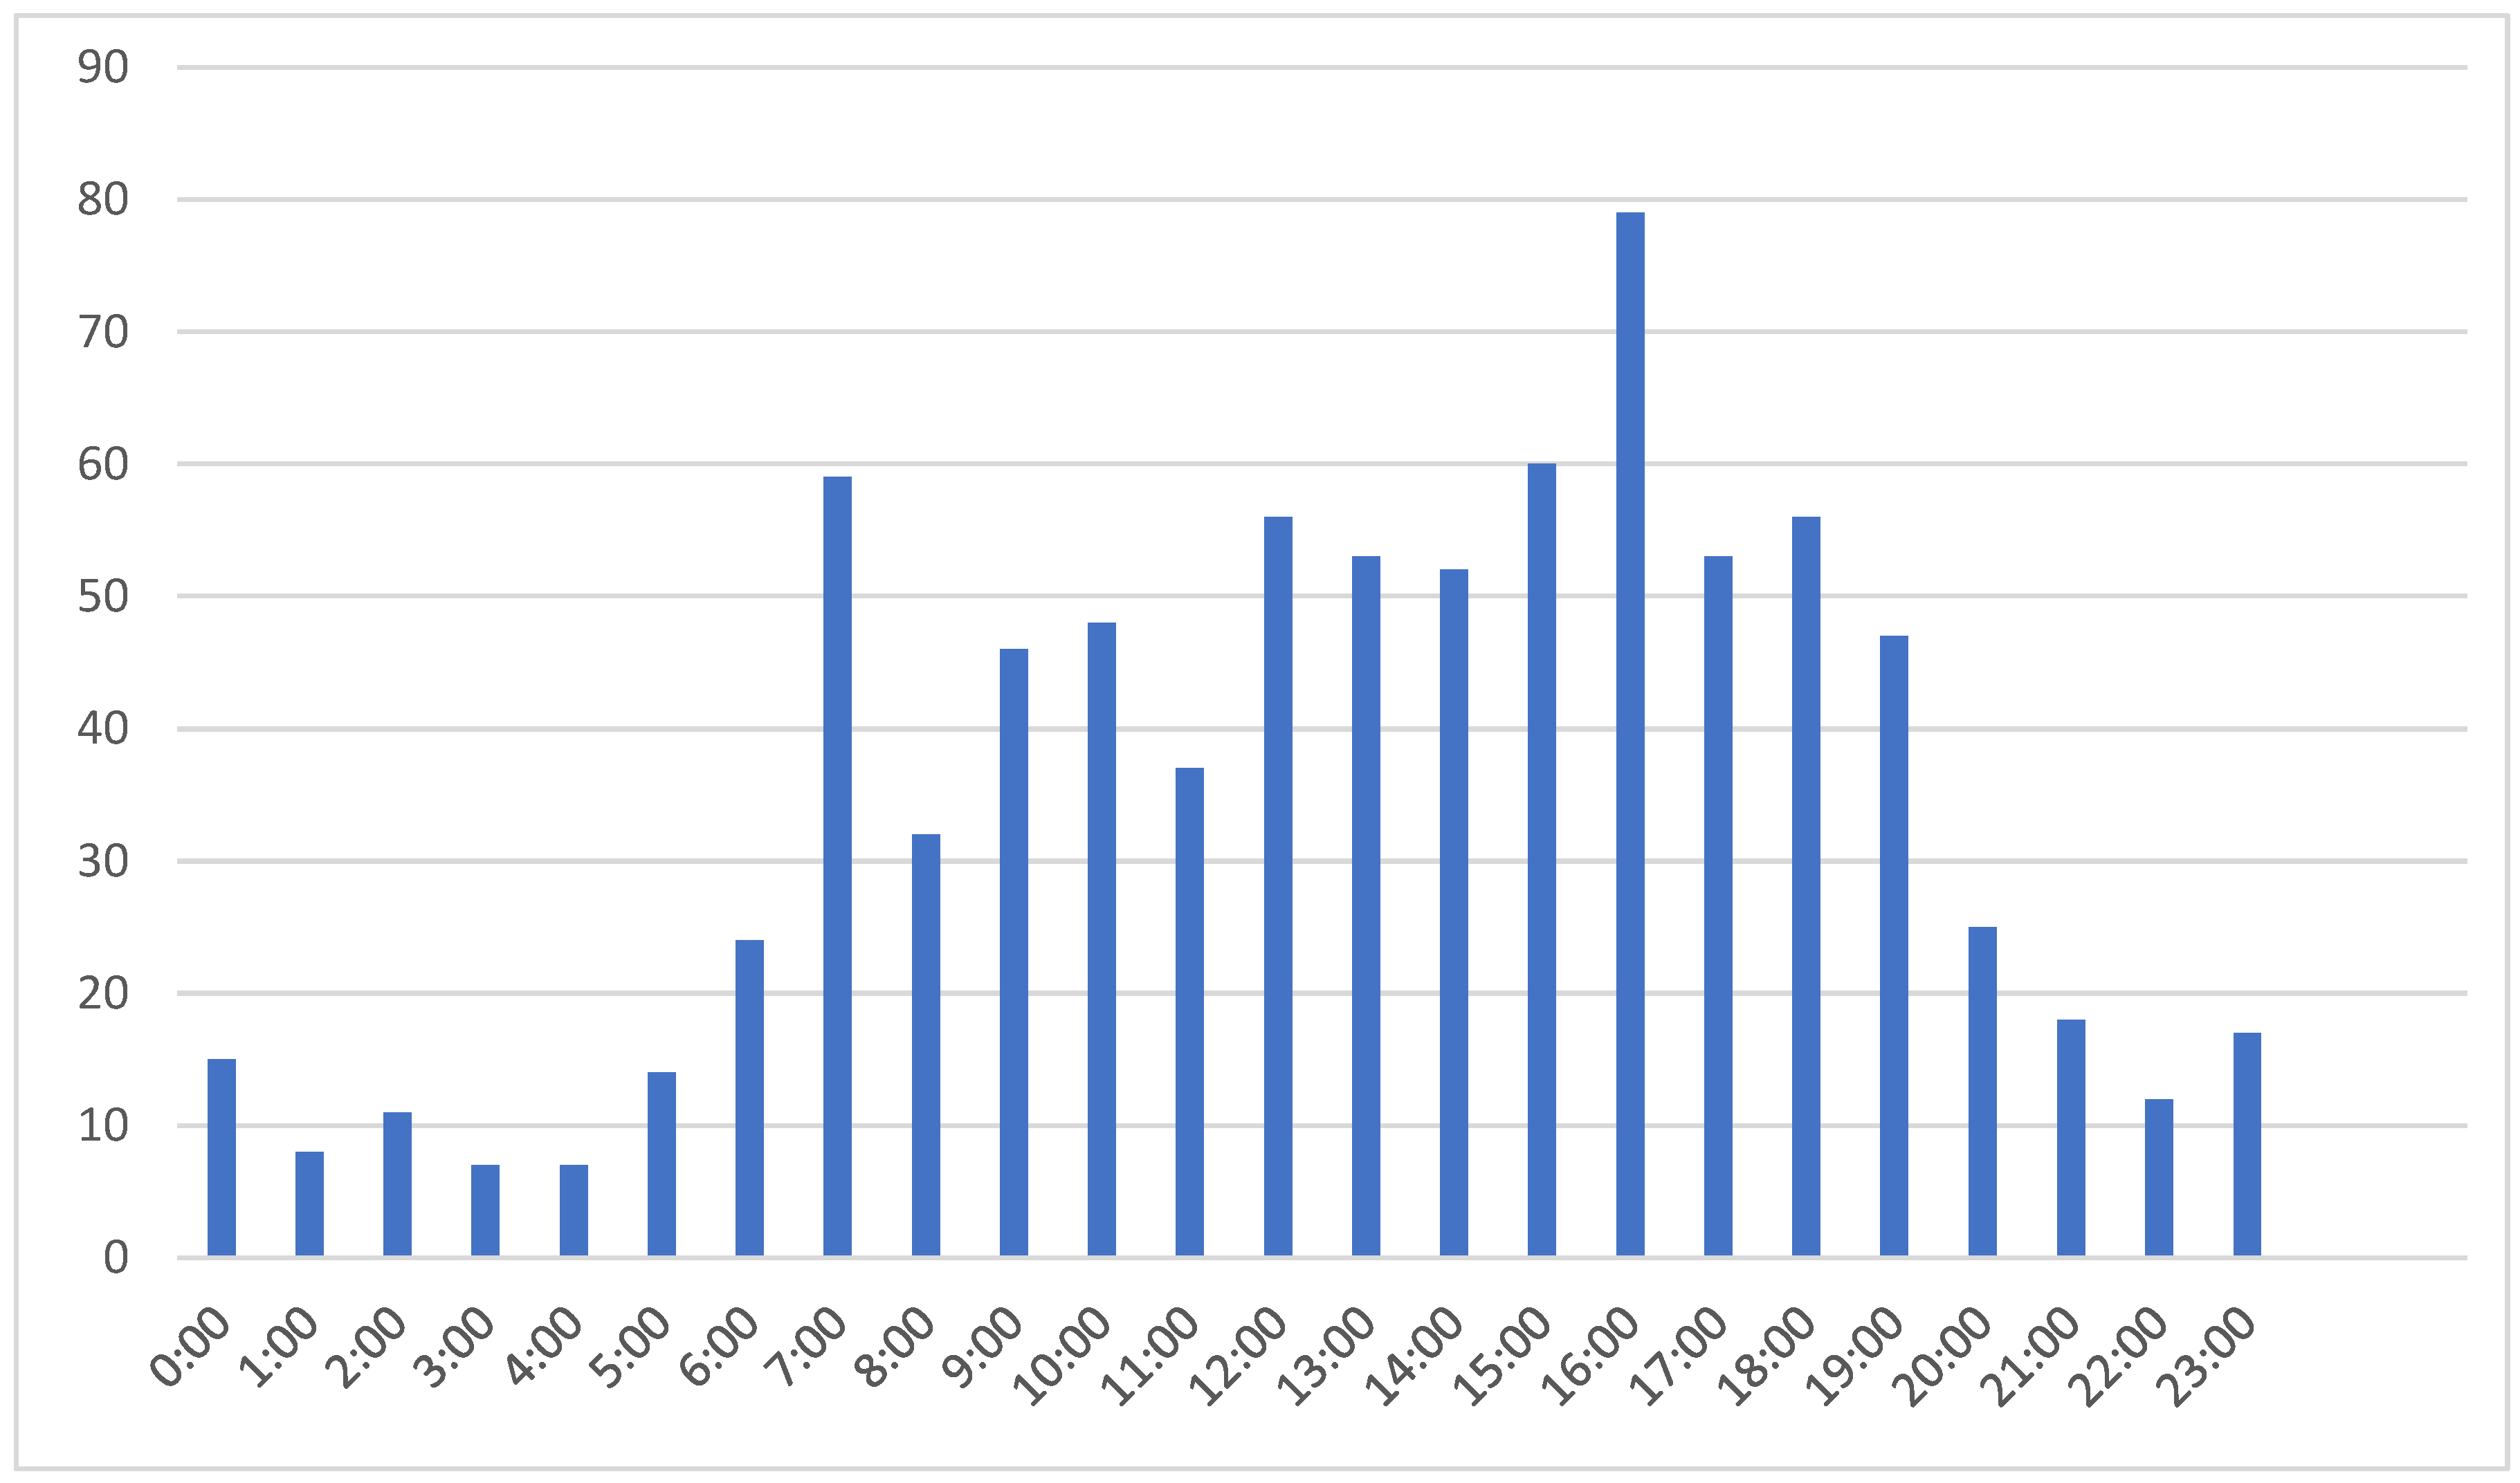

Table 1.
Distribution of recorded micromobility-related crashes by weather condition.
| Clear | 678 | 81.1% |
| Overcast | 127 | 15.2% |
| Rainy | 20 | 2.4% |
| Foggy | 9 | 1.1% |
| Stormy | 2 | 0.2% |
| Total | 836 | 100.0% |
Table 2.
Distribution of recorded micromobility crashes by nature of accident.
| Nature of accident | n | Percentage |
| Collision of vehicles traveling in the opposite direction | 313 | 37.4% |
| Skidding, rear-ending, or overturning on the road | 152 | 18.2% |
| Collision between straight-moving and turning vehicles | 112 | 13.4% |
| Pedestrian hit | 63 | 7.5% |
| Collision of vehicles traveling in the same direction | 62 | 7.4% |
| Running off the road without hitting a fixed object | 54 | 6.5% |
| Collision of oncoming vehicles | 30 | 3.6% |
| Collision with a stationary vehicle | 25 | 3.0% |
| Collision with a fixed object on the road | 13 | 1.6% |
| Lane departure/collision with a fixed object outside the road | 9 | 1.1% |
| Collision with a wild animal | 2 | 0.2% |
| Passenger accident | 1 | 0.1% |
| Total | 836 | 100.0% |
Table 3.
Distribution of recorded micromobility crashes by road shape.
| Road shape | Number of crashes | Percentage |
| Straight path | 487 | 58.3% |
| Crossroads | 273 | 32.7% |
| Other or non-roadway | 43 | 5.1% |
| Bend in the road | 33 | 3.9% |
| Total | 836 | 100.0% |
Table 4.
Associations between crash severity and selected crash characteristics.
| Predictor | N | χ² | df | Monte Carlo p | Holm-adjusted p | Cramér’s V |
| Weather condition | 836 | 4.04 | 4 | 0.4181 | 0.8362 | 0.070 |
| Nature of accident | 836 | 26.36 | 11 | 0.0037 | 0.0147 | 0.178 |
| Road shape | 836 | 5.10 | 3 | 0.1664 | 0.4992 | 0.078 |
| Hour of day | 836 | 23.72 | 23 | 0.4220 | 0.8362 | 0.168 |
Disclaimer/Publisher’s Note: The statements, opinions and data contained in all publications are solely those of the individual author(s) and contributor(s) and not of MDPI and/or the editor(s). MDPI and/or the editor(s) disclaim responsibility for any injury to people or property resulting from any ideas, methods, instructions or products referred to in the content. |
© 2026 by the authors. Licensee MDPI, Basel, Switzerland. This article is an open access article distributed under the terms and conditions of the Creative Commons Attribution (CC BY) license (http://creativecommons.org/licenses/by/4.0/).
Copyright: This open access article is published under a Creative Commons CC BY 4.0 license, which permit the free download, distribution, and reuse, provided that the author and preprint are cited in any reuse.