

Submitted:
09 September 2026
Posted:
11 September 2026
You are already at the latest version
Abstract
Palatability critically determines pediatric medication adherence, yet the impact of oral cavity dilution and salivary pH on the sensory performance of formulations remains poorly characterized. This study provides the first systematic, biorelevant evaluation of how dilution and physiologically relevant pH affect the palatability of three commercially available hyoscine butylbromide (HBB) syrup brands (X, Y, and Z), extending prior characterization of undiluted formulations. Samples were evaluated using an Alpha Astree II electronic tongue (ChemFET array). Dilution with water and with 2 mL or 5 mL phosphate-buffered saline (PBS) at pH 6.2, 6.8, and 7.4 replicated residual salivary volumes and physiological pH across pediatric and adult populations. Pure HBB API solutions were tested in parallel. Principal component analysis (>85% cumulative variance) confirmed robust discrimination across all conditions. Water dilution increased bitterness across all brands by disrupting excipient matrix integrity, with cellulosic polymer-containing Brands X (HEC) and Y (HPMC) retaining superior taste masking over polymer-free Brand Z. PBS dilution revealed pH-dependent, brand-specific palatability responses: at pH 6.2, 6.8, and 7.4, the hierarchy was consistently Y > X > Z, confirming the robust superiority of Brand Y's HPMC-based taste-masking system across the full physiological salivary pH range. Notably, Brand X exhibited substantially higher ANS sweetness scores than Brand Y at 2 mL pH 7.4 PBS, reflecting differential sweetener system sensitivity to near-neutral PBS ionic conditions. Increasing simulated salivary volume from 2 mL to 5 mL amplified bitterness and attenuated sourness across all brands. Taste-masking strategies that rely solely on sweeteners, without viscosity-building polymers, are inadequate under biorelevant oral conditions. pH-stratified assessment is essential for comprehensive characterization of palatability in pediatric oral liquid formulations.
Keywords:
hyoscine butylbromide
; ChemFET electronic tongue
; biorelevant palatability assessment
; salivary pH simulation
; taste masking
; pediatric oral liquid formulation
; principal component analysis
; potentiometric sensor array
1. Introduction
Electronic taste-sensing systems, commonly referred to as electronic tongues (e-tongues), have emerged as powerful analytical platforms for the objective, reproducible, and ethically sound evaluation of pharmaceutical palatability, offering a validated alternative to human sensory panels that is particularly valuable in pediatric drug development contexts, where human sensory panels present significant ethical, logistical, and safety constraints (Steiner et al., 2024; Podrażka et al., 2017; Zaid et al., 2022). Potentiometric e-tongue systems based on chemically modified field-effect transistor (ChemFET) technology, such as the Alpha Astree II (Alpha M.O.S., Toulouse, France), employ multi-sensor electrochemical arrays to generate multivariate taste profiles that are analyzed using principal component analysis (PCA) and related chemometric methods, enabling discrimination between formulations with distinct taste profiles and detection of taste changes under varying physicochemical conditions (Uchida, 2024; Ishida et al., 2022; Zhao et al., 2024; Omoteso et al., 2026a; Omoteso et al., 2026b). The Alpha Astree II operates through an ion-selective membrane positioned on the gate of the ISFET sensor; this membrane interacts not only with pH and ions but also with the chemical structures of dissolved molecules, enabling the differentiation of complex taste patterns and flavors across formulations (Gongoni et al., 2026; Steiner et al., 2024). Despite their established utility in pharmaceutical taste assessment, e-tongue systems have rarely been applied under biorelevant oral conditions, specifically the diluted, pH-modified matrix encountered when an oral liquid formulation mixes with residual saliva in the oral cavity. This gap represents a significant limitation in the use of e-tongue technology for pharmaceutical palatability characterization, since the sensory performance of a formulation under real-use oral conditions may differ substantially from that measured in the undiluted state. The Alpha Astree II effectively differentiated between three commercial hyoscine butylbromide (HBB) syrup brands and their individual taste attributes in our earlier study (Omoteso et al., 2026a), providing a validated analytical foundation for the present biorelevant investigation.
Oral liquid formulations are the standard dosage form for the pediatric population, providing dose flexibility and facilitating swallowing. Nonetheless, the palatability of oral liquids, including taste, aftertaste, smell, and mouthfeel, is a crucial factor influencing patient acceptability and, consequently, therapeutic adherence (Meyers, 2024; Gvozdeva & Staynova, 2025). The US Food and Drug Administration defines palatability as the overall appreciation of a drug product based on its organoleptic properties and recognizes it as a critical quality attribute for oral pediatric formulations (Food & Drug Administration, 2018; Peña et al., 2024; Ranmal et al., 2025). Children exhibit heightened sensitivity to bitterness, a trait linked to an evolutionarily conserved aversion to bitter stimuli that historically served as a protective mechanism against ingesting toxic substances (Melis & Tomassini Barbarossa, 2017; Chaudhari & Roper, 2010). Reports indicate that between 18% and 60% of caregivers observe that patients frequently refuse medications due to taste (Ranmal et al., 2025; El-Sahn et al., 2025). Approximately 75% of active pharmaceutical ingredients (APIs) are inherently bitter, posing a significant challenge for taste masking in the formulation of pediatric pharmaceuticals (Peña et al., 2024; Ranmal et al., 2023).
Hyoscine butylbromide (HBB), also known as scopolamine butylbromide or butylscopolamine bromide, is an anticholinergic compound listed by the World Health Organization (WHO) as an essential medicine used to treat oesophageal and bladder spasm, abdominal pain, biliary and renal colic (Yildirim et al., 2024). HBB is authorized for use in children aged six years and older and has shown effectiveness in treating abdominal cramps in infants as young as two days old, according to randomized controlled trials (Vázquez Frias et al., 2025; Sultanoğlu et al., 2022). Despite its recognized clinical utility, palatability remains a significant barrier to optimal administration in pediatric patients, and commercial HBB syrups rely on sweeteners, flavoring agents, and viscosity-modifying excipients to mask the drug's inherent bitterness, strategies whose effectiveness under real-use oral conditions has not been systematically characterized.
A critical yet largely underexplored aspect of oral palatability assessment is the influence of the oral physicochemical environment on the sensory performance of formulations. Upon administration of an oral liquid, it promptly mixes with residual saliva in the oral cavity (approximately 1–2 mL under resting conditions), forming a diluted, pH-altered matrix that directly interacts with taste receptors (Pein et al., 2014; Gittings et al., 2015). Salivary pH ranges from 6.2 to 7.6, with younger children showing lower mean values compared to adolescents and adults, who exhibit higher values (Anderson et al., 2001; Pein et al., 2014; Bechir et al., 2021). In addition to physiological dilution, caregivers often intentionally dilute liquid medications with water or other beverages to enhance palatability or aid in swallowing, especially among young children and individuals with dysphagia (Martir et al., 2020; Gvozdeva & Staynova, 2025). The European Medicines Agency has observed that children favor the minimal volume of unpalatable liquids, and that combining these liquids with food or beverages may affect pharmacokinetic properties (van Riet-Nales et al., 2012). Both forms of dilution significantly modify the concentration matrix of the unit dose, encompassing the active pharmaceutical ingredient, sweeteners, flavoring agents, preservatives, and viscosity modifiers. However, the implications for sensory performance in specific commercial formulations remain poorly characterized.
The physicochemical mechanisms that govern taste alterations due to dilution are intricate. Dilution decreases the concentrations of both active pharmaceutical ingredients (API) and excipients. The extent and nature of taste alteration are influenced by: (i) the integrity of excipient-mediated taste-masking systems at lower concentrations; (ii) pH- and ionic strength-dependent changes in the electrochemical environment at the ChemFET sensor membrane surface, governing sensor response to dissolved species; and (iii) the viscosity and film-forming characteristics of the formulation matrix, which affect the rate of API diffusion to taste receptors. HBB possesses a permanent positive charge on its quaternary ammonium nitrogen, independent of pH across the entire physiological range (Corsetti et al., 2023). Unlike its parent compound scopolamine, which bears a titratable tertiary amine (pKa 7.55–7.81), HBB carries no ionizable proton (Ni'ma, 2022). Nevertheless, changes in medium pH and ionic strength alter the electrochemical activity coefficient of the permanently charged HBB cation in solution, modifying its interaction with the lipid/polymer membranes of ChemFET taste sensors, which detect charged species through membrane potential changes driven by surface charge density (Bakker et al., 1997; Toko, 2000; Ishida et al., 2022; Zhao et al., 2024). The ion-selective membrane on the gate of the ISFET sensor interacts not only with pH and ions but also with the chemical structures of dissolved molecules, making the sensor response sensitive to changes in ionic composition introduced by PBS at varying pH values, independently of any ionization change in HBB itself (Gongoni et al., 2026). These ionization-independent, medium-driven effects are not adequately represented by assessments conducted at a single pH; thus, their evaluation requires a biorelevant, pH-stratified experimental design.
The current study expands on existing research by providing a systematic, biorelevant assessment of the impact of dilution across a physiologically relevant spectrum of pH and salivary volume on the sensory performance of commercially available HBB syrups. Palatability is assessed using phosphate-buffered saline (PBS) solutions at pH 6.2, 6.8, and 7.4 as surrogates for human saliva across various age groups, and simulated salivary volumes of 2 mL and 5 mL to mimic the residual oral fluid present during and after swallowing. The primary scientific objectives are: (i) to determine whether dilution by water or simulated saliva disrupts excipient-mediated taste masking in a brand- and formulation-specific manner; (ii) to establish the mechanistic basis for pH-dependent palatability changes in terms of ionic strength effects on ChemFET sensor response and excipient performance; (iii) to compare the sensory behavior of commercial formulations with that of pure HBB API under identical biorelevant conditions, quantifying the contribution of excipient matrices to taste masking; and (iv) to evaluate the Alpha Astree II electronic tongue as a biorelevant palatability assessment tool capable of detecting formulation-specific responses across the physiological pH range. The findings aim to elucidate the mechanisms underlying the effectiveness of taste-masking strategies under real-use oral conditions and to guide the development of oral liquid formulations with enhanced sensory attributes.
2. Material and Methods
2.1. Materials
Pure HBB API was donated by Aspen Pharmacare (Gqeberha, South Africa). Potassium dihydrogen orthophosphate, disodium monohydrogen phosphate, hydrochloric acid, and sodium hydroxide pellets were purchased from Merck® Laboratories (Wadeville, South Africa) and used to prepare buffers spanning the salivary pH range of 6.2-7.6. Specifically, the buffers were 0.1 M standard phosphate-buffered saline of pH 6.2, 6.8, and 7.4. HPLC-grade water was used to clean the sensor probe, and was produced using a Rephile® Ultrapure water system with a 3-stage prefiltration kit (Microsep®, Johannesburg, South Africa) and filtered using a 0.2 µm polyethersulfone (PES) high-flux capsule filter (Microsep®, Johannesburg, South Africa) before use to produce water quality that was 18.2 MΩ·cm at 21.3 °C, with a total organic carbon (TOC) concentration of 2 ppb and a feed of 1.4 µS/cm. A Mettler Toledo® Model AG135 top-loading analytical balance (Zurich, Switzerland) was used for all weighing. All chemical reagents were of at least analytical reagent grade or superior and were used without further modification. Three (3) batches of three (3) different commercially available hyoscine butylbromide-syrups in South Africa were purchased from Frontier Pharmacy (Makhanda, South Africa). The qualitative composition and details of the products are summarized in Table 1.
2.2. Electronic Tongue (e-tongue) and Taste Evaluation of HBB Syrup
2.1.1. Instrumentation
The Alpha Astree II (Alpha MOS, Toulouse, France) e-tongue used in this study was fitted with a 48-position autosampler accommodating 25 mL glass vessels. The ChemFET liquid sensor array comprised seven sensors identified as AHS, PKS, CTS, NMS, CPS, ANS, and SCS, in addition to one Ag/AgCl reference electrode stored in a 3 M KCl solution. The SCS sensor detects bitterness, the ANS sensor sweetness, the AHS sensor acidity/sourness, the CTS sensor saltiness, the NMS sensor is associated with umami taste, and the PKS and CPS sensors perform general functions (Nam et al., 2023; Bai et al., 2024; Sruthi et al., 2024). Each measurement cycle was 120 seconds per sample, with a 60-second HPLC-grade water wash at 1000 rpm between samples. Nine (9) runs per sample were undertaken to verify sensor stabilization and reproducibility at 22 °C, and data analysis focused exclusively on the final 20 seconds of each measurement cycle (Omoteso et al., 2026b).
2.1.2. Sample Preparation
The commercial HBB syrups were tested undiluted as Batch A and have been reported (Omoteso et al., 2026a), diluted as Batches B–H, and diluted HBB powder (Batch I) to evaluate dilution-induced taste changes. The dilution conditions and sample compositions for these studies are summarized in Table 2 and Table 3, respectively.
2.1.3. Analysis
Multivariate statistical analysis was conducted using AlphaSoft version 2021-7.2.8 (Alpha MOS, Toulouse, France) software to evaluate e-tongue sensor data using principal component analysis (PCA). The middle three of the nine repeated runs were used for multivariate analysis, enabling the construction of bar chart plots and taste screening rankings (scale: 1–10).
2.3. Preparation of Phosphate-Buffered Saline Solutions (PBS-0.01 M)
PBS was prepared by accurately weighing 8.00 g NaCl, 0.20 g KCl, 1.44 g Na₂HPO₄, and 0.24 g KH₂PO₄ and transferring the salts into a 1000 mL beaker. HPLC-grade water was added, and the mixture was stirred at 1500 rpm using a magnetic stirrer. The solution was transferred quantitatively to a 1000 mL Grade A volumetric flask and made up to volume with HPLC-grade water. The pH was adjusted to 6.2, 6.8, and 7.4 using 0.1 M HCl.
3. Results and Discussion
The e-tongue results and discussion for Batch A (undiluted HBB syrup samples) are reported in a previous publication (Omoteso et al., 2026a).
3.1. Mechanistic Basis for Dilution- and pH-Induced Taste Changes in HBB Syrups
Prior to presenting the sensor data for each dilution condition, it is essential to establish the physicochemical and formulation-science framework that dictates how dilution and salivary pH are anticipated to influence the taste profile of commercially available HBB syrups. Two primary mechanisms function together: (i) dilution-induced disruption of excipient-based taste-masking systems, and (ii) pH- and ionic strength-dependent effects on sensor response and excipient performance. Comprehending these mechanisms is crucial for interpreting the brand-specific, pH-dependent palatability patterns noted in Batches B–H and for contextualizing the comparison with pure HBB API data (Batch I).
3.1.1. Dilution-Mediated Disruption of Excipient Taste-Masking Systems
Brands X and Y include hydrophilic cellulosic polymers, hydroxyethyl cellulose (HEC) in Brand X and hydroxypropyl methylcellulose (HPMC) in Brand Y, along with sweeteners (saccharin sodium in Brand X; saccharin sodium, sodium cyclamate, and sorbitol in Brand Y) and banana flavoring. Brand Z does not include a cellulosic polymer; it uses sorbitol (2 g per 5 mL), glycerol, and saccharin sodium for sweetening and viscosity modification, along with citric acid monohydrate as an acidulant.
In their concentrated forms, the viscosities produced by HEC and HPMC serve a dual function in taste masking. Initially, these polymers form a viscoelastic matrix that impedes the diffusion of dissolved HBB molecules throughout the formulation to the sensor surface or, in vivo, to taste receptor cells on the lingual epithelium. This results in a decreased effective concentration of the API available for activating taste receptors (Pein et al., 2014; Vlad et al., 2025). Secondly, the film-forming characteristics of cellulosic polymers facilitate a degree of physical encapsulation of the API within the viscous polymer matrix, thereby further restricting API–receptor interactions (Coupland & Hayes, 2014; Vlad et al., 2025). This aligns with the lower SCS (bitterness) sensor scores recorded for Brands X and Y, compared with Brand Z, in the undiluted state (Omoteso et al., 2026a).
Upon dilution, whether with water (Batch B) or with PBS (Batches C–H), multiple concurrent processes compromise these taste-masking mechanisms. Initially, the polymer concentration decreases in direct proportion to the dilution factor, thereby reducing solution viscosity. Due to the concentration-dependent nature of taste-masking efficiency in cellulosic polymers, the protective viscoelastic network is disrupted at lower polymer concentrations. This disruption facilitates a more rapid and complete dissolution of HBB into the aqueous phase, thereby enhancing API–sensor contact (Pein et al., 2014; Vlad et al., 2025). This elucidates the steady rise in SCS bitterness scores observed across all brands following water dilution (Batch B). Secondly, the concentration of sweeteners—saccharin sodium, sodium cyclamate, and sorbitol—decreases proportionally, thereby reducing the competitive masking of bitterness by sweet taste stimuli. Sweeteners are known to mask bitterness via peripheral inhibition at the receptor level and through psychophysical contrast effects; thus, their dilution directly diminishes taste-masking efficacy (Sanjay et al., 2025; Choi et al., 2024). Third, the overall reduction in formulation viscosity, resulting from both polymer network disruption and the general dilution effect, facilitates more rapid convective transport of dissolved HBB to taste receptor cells on the lingual epithelium (Wu & Zhao, 2021). The electronic tongue, which measures the electrochemical response of dissolved species at the ChemFET sensor surface, is similarly sensitive to transport-mediated increases in local API concentration (Bakker et al., 1997; Toko, 2000; Gaohua et al., 2021; Ishida et al., 2022; Zhao et al., 2024).
The increased bitterness observed for Brand Z compared to Brands X and Y after water dilution (bitterness rank: Z > X > Y, Batch B) aligns with the lack of cellulosic polymers in Brand Z's formulation. In the absence of a polymer network to hinder API diffusion, the reduction in sorbitol and glycerol concentration due to dilution fails to adequately mask the bitterness of the dissolved HBB API, leaving it fully exposed to the sensors. The comparison with pure HBB API solutions (Batch I) supports this interpretation: dilution of pure HBB powder with water produced an SCS bitterness score of 8.2 and a PDI of 93.37% relative to undiluted HBB-P, confirming significant dilution-induced taste divergence in the pure API. Notably, HBB-P diluted scored higher than water-diluted Brands X and Y (SCS 5.0–5.4) but lower than Brand Z water-diluted samples (SCS 8.0–10.0), directly confirming that the cellulosic polymer matrices of Brands X and Y provide meaningful taste masking that is absent in polymer-free Brand Z. The low PDI values for Brand Z on water dilution (Z2H₂O vs Z2PURE = 25.19%; Z3H₂O vs Z3PURE = 38.50%) further corroborate this interpretation: because Brand Z lacks a polymer network, its taste profile is already predominantly driven by dissolved HBB in the undiluted state, and water dilution produces relatively little additional taste divergence. Collectively, these findings confirm that all three commercial excipient matrices provide only partial taste masking that diminishes upon dilution, and that the incorporation of cellulosic polymers is the critical differentiating factor for taste-masking resilience.
3.1.2. pH- and Ionic Strength-Dependent Effects on Sensor Response and Excipient Performance
The pH-dependent palatability profile observed in Batches C–H (PBS dilutions at pH 6.2, 6.8, and 7.4) necessitates an examination of HBB's physicochemical properties and their implications for API–sensor interactions. HBB is a quaternary ammonium compound bearing a permanent positive charge on the N-butyl nitrogen, rendering it constitutively cationic and highly water-soluble across the physiological pH range (Corsetti et al., 2023). Unlike its parent compound scopolamine, which possesses a titratable tertiary amine (pKa 7.55–7.81) (Ni'ma, 2022), HBB's quaternary nitrogen is not proton-exchangeable. The ion-selective membrane at the gate of the ISFET sensor interacts not only with pH and ions but also with the chemical structures of dissolved molecules, thereby enabling differentiation of complex taste patterns arising from changes in the medium's ionic composition (Gongoni et al., 2026). pH-dependent changes in the ionic strength and composition of the surrounding medium alter the compound's electrochemical activity coefficient and its interaction with ChemFET sensor surfaces and taste receptor proteins (Gaohua et al., 2021; Krieg et al., 2015). As PBS pH increases from 6.2 toward 7.4, the dominant phosphate species shifts from monovalent H₂PO₄⁻ toward divalent HPO₄²⁻, increasing ionic strength and reducing the activity coefficient of the permanently charged HBB cation according to the Debye-Hückel relationship, modifying the Nernstian phase-boundary potential at the ChemFET sensor membrane (Bakker et al., 1997; Toko, 2000; Gaohua et al., 2021; Krieg et al., 2015; Ishida et al., 2022). In vivo, the altered ionic environment of the oral cavity at near-neutral pH similarly modulates the interaction of dissolved HBB with bitter taste receptor proteins of the T2R family (Kim et al., 2024; Tong et al., 2025). Furthermore, pH-dependent changes in counter-ion (bromide) speciation and in the competing ionic environment of PBS alter the Nernstian response of the sensor array, producing the pH-stratified palatability patterns observed across Batches C–H (Gaohua et al., 2021). Therefore, pH affects the sensor response to HBB not through protonation of the drug itself, but through changes in the ionic environment, ionic strength, counter-ion activity, and competing cations in PBS, which modify the Nernstian electrochemical behavior of the permanently charged cation at the sensor membrane surface.
The observed progressive increase in SCS bitterness scores with increasing PBS pH in the pure HBB API experiments (Batch I; palatability order pH 6.2 > 6.8 > 7.4) reflects the influence of medium ionic composition and ionic strength on the potentiometric response of ChemFET sensors to permanently charged species, rather than any ionization-dependent change in HBB itself. As a quaternary ammonium compound, HBB carries a fixed positive charge independent of pH (Corsetti et al., 2023). The sensor response to HBB is governed by the Nernst equation, in which the measured potential reflects the electrochemical activity rather than the concentration of the HBB cation at the membrane surface (Bakker et al., 1997; Ishida et al., 2022; Zhao et al., 2024). As PBS pH increases from 6.2 to 7.4, the dominant phosphate species shifts from monovalent H₂PO₄⁻ toward divalent HPO₄²⁻, increasing ionic strength and altering the competition between phosphate anions and HBB cations for adsorption onto the lipid/polymer sensor membrane. This reduces the activity coefficient of HBB⁺ in solution according to the Debye-Hückel relationship, modifying the phase-boundary potential and the resulting SCS sensor output in a pH-dependent manner (Bakker et al., 1997; Toko, 2000; Gaohua et al., 2021; Krieg et al., 2015). Consequently, the pH-stratified SCS responses observed in the PBS dilution batches represent an electrochemical medium effect, not a change in HBB ionization state, and must be interpreted accordingly when extrapolating e-tongue data to in vivo bitter taste perception.
The pH of the medium also influences the speciation and activity of formulation excipients. Citric acid monohydrate (Brand Z) undergoes pH-dependent deprotonation across this pH range (pKa1 = 3.13, pKa2 = 4.76, pKa3 = 6.39) (Lambros et al., 2022), such that its titratable acidity is substantially neutralized by PBS at pH 6.4 and above, reducing the free proton activity available for AHS sensor activation (Da Conceicao Neta et al., 2007). This is mechanistically consistent with the progressive reduction in AHS scores observed for Brand Z as PBS pH increases across Batches C–H. For Brands X and Y, which do not contain citric acid, the decrease in AHS scores with increasing PBS pH is attributable to the phosphate buffering capacity of PBS, which progressively neutralizes residual formulation acidity, reducing proton activity at the sensor surface (Krieg et al., 2015; Bechir et al., 2021).
Although the palatability hierarchy Y > X > Z was maintained consistently across all PBS pH values and volumes, the pH 7.4 PBS conditions produced a notable differential in the ANS sweetness sensor response between Brands X and Y. At 2 mL pH 7.4 PBS (Batch G), Brand X exhibited substantially higher ANS scores (7.7–7.8) relative to Brand Y (6.2–6.4), reflecting the differential sensitivity of the saccharin-only system in Brand X to the ionic conditions created by near-neutral PBS. Both HPMC (Brand Y) and HEC (Brand X) are nonionic cellulose ethers whose viscosity is pH-independent across pH 3–11 (Vlad et al., 2025); this differential ANS response is therefore not attributable to polymer ionization but rather to the distinct sweetener systems of the two brands responding differently to the altered ionic environment of pH 7.4 PBS (Gaohua et al., 2021; Krieg et al., 2015). At 5 mL pH 7.4 PBS (Batch H), this pattern reversed. Brand Y's ANS scores (7.0–7.4) exceeded those of Brand X (6.7–6.8), demonstrating that the differential sweetener response is volume- and pH-dependent. Despite these ANS differences, Brand Y maintained superior overall palatability across all conditions, as evidenced by consistently lower SCS bitterness scores relative to Brand X. These findings underscore the importance of evaluating formulation palatability across both the full physiological pH range and a range of simulated salivary volumes to capture the complete sensory behavior of oral liquid formulations under real-use conditions.
3.1.3. Salivary Volume and Ionic Strength Effects
The consistent amplification of bitterness observed when the simulated salivary volume was increased from 2 mL to 5 mL (in the C/D, E/F, and G/H batch pairs) is consistent with the dilution-dependent reduction in excipient concentration and the increased ionic strength associated with larger PBS volumes. As salivary volume increases, the phosphate buffer concentration in the measurement medium rises, progressively shifting the dominant phosphate species from monovalent H₂PO₄⁻ toward divalent HPO₄²⁻. This alters the ionic environment at the ChemFET sensor surface, modifying the Nernstian electrochemical response to dissolved HBB and excipient species in a volume-dependent manner (Bakker et al., 1997; Toko, 2000; Gaohua et al., 2021; Krieg et al., 2015). The simultaneous reduction in AHS sourness with increasing salivary volume is consistent with the greater buffering capacity of larger PBS volumes, which more completely neutralize residual formulation acidity and reduce the proton activity available to activate the AHS sensor (Lambros et al., 2022; Krieg et al., 2015). These volume-dependent effects have direct implications for formulation design: taste-masking strategies must account not only for the dilution factor but also for the pH and buffering capacity of the oral environment encountered during administration, which varies with salivary flow rate, age group, and disease state (Bechir et al., 2021; Gittings et al., 2015).
3.2. Assessment of HBB syrups diluted with HPLC-grade water (Batch B)
This section evaluates whether diluting commercial HBB syrups with water significantly alters the taste profile as detected by the e-tongue, simulating the reduction in excipient concentration that occurs when an oral liquid formulation encounters residual oral fluid or is administered with water. Water dilution reduces the concentration of all dissolved components, API, sweeteners, viscosity modifiers, flavoring agents, and preservatives proportionally, thereby providing a controlled assessment of how excipient matrix integrity responds to concentration reduction in the absence of pH or ionic strength effects. The enhanced viscosity of a pharmaceutical formulation facilitates taste masking by impeding drug diffusion to taste receptors; consequently, dilution-induced viscosity reduction directly compromises this protective mechanism (Pein et al., 2014; Wu & Zhao, 2021).
The 3D PCA score plot (Figure 1a), generated following analysis of nine (9) 5 mg/5 mL HBB samples diluted with 20 mL HPLC-grade water, yielded a cumulative variance contribution of 96.474% (PC1 = 81.938%, PC2 = 10.882%, PC3 = 3.654%), confirming the capacity of the e-tongue to discriminate between undiluted and diluted samples across all three brands (Nam et al., 2023; Sruthi et al., 2024). The inclusion of a third principal component improved variance capture relative to the two-dimensional representation, resolving overlapping clusters and providing a more complete representation of the multivariate sensor data. Diluted samples were substantially displaced from their undiluted counterparts in three-dimensional space with no inter-group overlap, confirming significant taste divergence upon water dilution. Intra-brand batch clustering following dilution confirmed taste consistency across batches of the same brand.
To complement the unsupervised PCA, discriminant function analysis (DFA) was applied as a supervised multivariate classification technique to maximize between-group separation based on predefined sample categories. The 2D DFA score plot (Figure 1b) yielded a cumulative discriminant variance of 99.045% (DF1 = 88.348%, DF2 = 10.697%), demonstrating near-complete capture of between-group variance across all six sample groups. Complete and unambiguous separation was achieved between all diluted and undiluted sample groups, with no inter-group overlap observed. The superior discriminant variance of DFA relative to PCA confirms that the taste divergence induced by water dilution is not only statistically significant but is also systematically structured along the dimensions that best distinguish the predefined brand and dilution categories, corroborating and strengthening the PCA findings (Lorenz et al., 2009; Gongoni et al., 2026).
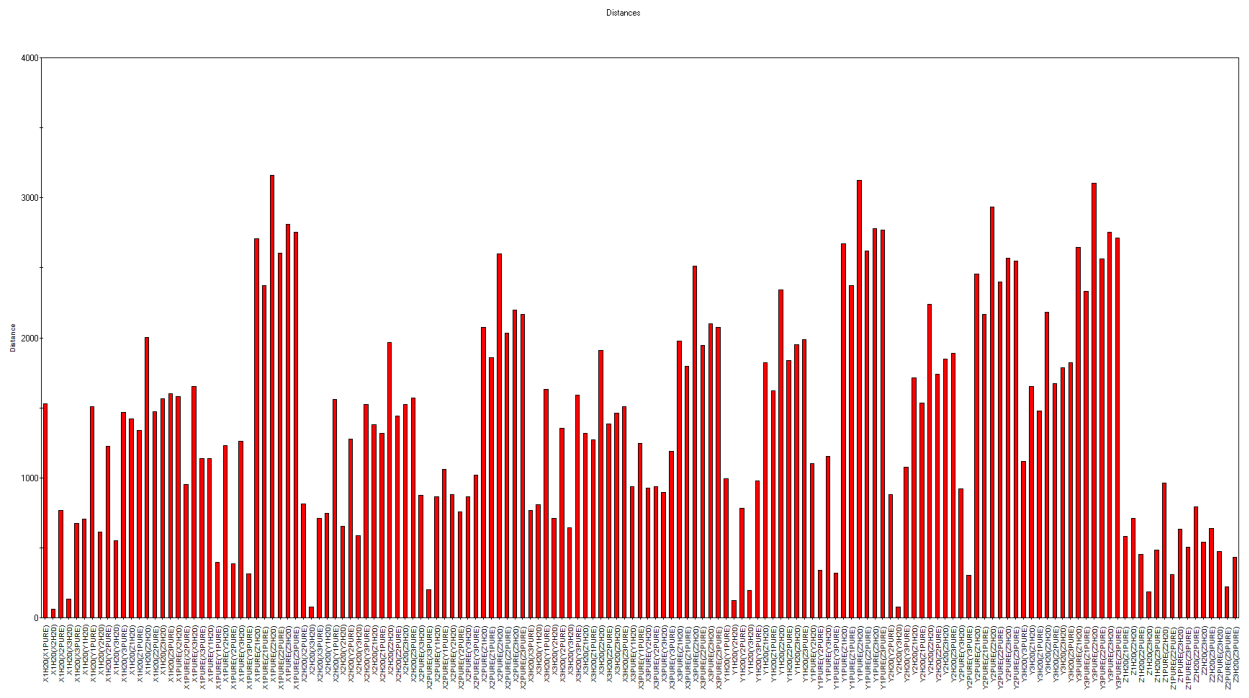
Figure 2.
Distance bar chart plot for Batch B samples compared to Batch A samples.
The bar plot in Figure 3 depicts the sensory profile of the samples and indicates that most diluted samples exhibited greater bitterness than their undiluted counterparts, except for Z3H20, which recorded a marginally lower SCS intensity than Z3PURE. Examination of the bitterness sensor (SCS) data for Brand Z revealed that Z2H₂O had the highest intensity of all samples tested. The increased bitterness of Brand Z following water dilution is attributable to the absence of cellulosic film-forming polymers in its formulation. In Brands X and Y, hydroxyethyl cellulose (HEC) and hydroxypropyl methylcellulose (HPMC), respectively, generate a viscoelastic matrix that physically impedes API diffusion to sensor surfaces; upon dilution, the reduction in polymer concentration disrupts this network, but the polymer matrix provides residual protective capacity at lower concentration (Pein et al., 2014; Vlad et al., 2025). Brand Z, which relies solely on sorbitol, glycerol, and saccharin, lacks a viscosity-building polymer network and thus has no equivalent structural protection, resulting in the full bitterness of dissolved HBB being detected by the SCS sensor. The bitterness ranking following water dilution was Z > X > Y, directly reflecting the hierarchy of polymer-mediated taste-masking resilience across the three formulations.
The e-tongue sensor produces a response that reflects the electrochemical activity of dissolved species at the ChemFET membrane surface, which interacts not only with pH and ions but also with the chemical structures of dissolved molecules (Gongoni et al., 2026; Ishida et al., 2022). The film-forming properties of the cellulosic polymers present in Brands X and Y reduce the dissolution rate of HBB into the aqueous phase by physically retaining the API within the viscous polymer matrix, thereby directly reducing bitterness responses detected by the SCS sensor (Vlad et al., 2025; Coupland & Hayes, 2014). The absence of these hydrophilic polymers in Brand Z reduces taste-masking efficiency during water dilution, as the sweetening and flavoring agents in this formulation, without polymer support, are insufficient to maintain acceptable palatability under dilution conditions.
As the concentration of sweetening agents decreases on dilution, their capacity for peripheral inhibition of bitter taste receptors is reduced (Sanjay et al., 2025; Choi et al., 2024), and the pleasant tastes contributed by banana flavoring are simultaneously attenuated (Adamkiewicz & Szeleszczuk, 2023). The bitterness of all water-diluted samples ranked as Z > X > Y, confirming that incorporation of cellulosic polymer is the critical determinant of taste-masking resilience under water-dilution conditions, and that sweetener-based masking alone, as in Brand Z, is insufficient to maintain palatability when the formulation concentration matrix is reduced.

Table 4.
Taste screening ranking for all sensors for Batch B samples.
| Sample number | Sample names | AHS | PKS | CTS | NMS | CPS | ANS | SCS |
|---|---|---|---|---|---|---|---|---|
| 1 | X1H20 | 6.7 | 6.6 | 7.7 | 5.4 | 6.3 | 6.7 | 5.2 |
| 2 | X1PURE | 8.0 | 3.0 | 4.2 | 9.4 | 4.9 | 2.6 | 4.1 |
| 3 | X2H20 | 6.6 | 6.7 | 7.9 | 5.3 | 6.3 | 6.9 | 5.3 |
| 4 | X2PURE | 7.8 | 5.1 | 7.2 | 7.5 | 7.4 | 5.1 | 4.4 |
| 5 | X3H20 | 6.5 | 6.8 | 8.1 | 5.2 | 6.4 | 7.1 | 5.4 |
| 6 | X3PURE | 7.7 | 5.7 | 8.4 | 7.3 | 7.7 | 5.5 | 4.5 |
| 7 | Y1H20 | 7.1 | 5.2 | 3.9 | 5.8 | 3.8 | 5.7 | 5.0 |
| 8 | Y1PURE | 8.1 | 2.3 | 2.9 | 8.2 | 3.8 | 3.4 | 4.2 |
| 9 | Y2H20 | 6.9 | 5.5 | 4.4 | 5.8 | 3.9 | 6.0 | 5.1 |
| 10 | Y2PURE | 8.1 | 3.6 | 4.1 | 8.1 | 4.4 | 3.8 | 4.3 |
| 11 | Y3H20 | 6.8 | 5.7 | 4.8 | 5.8 | 4.1 | 6.1 | 5.2 |
| 12 | Y3PURE | 8.0 | 3.5 | 3.8 | 9.0 | 3.4 | 3.0 | 4.2 |
| 13 | Z1H20 | 3.4 | 7.9 | 7.3 | 3.4 | 7.4 | 8.3 | 8.0 |
| 14 | Z1PURE | 3.4 | 7.6 | 4.6 | 5.1 | 7.5 | 6.4 | 7.9 |
| 15 | Z2H20 | 3.2 | 7.9 | 7.6 | 3.4 | 7.5 | 8.4 | 10.0 |
| 16 | Z2PURE | 3.2 | 8.5 | 6.1 | 5.0 | 7.9 | 7.1 | 8.2 |
| 17 | Z3H20 | 3.2 | 7.8 | 7.7 | 3.4 | 7.4 | 8.4 | 8.5 |
| 18 | Z3PURE | 3.2 | 8.8 | 7.2 | 4.9 | 7.9 | 7.3 | 8.6 |
3.3. Assessment of HBB Syrups Diluted with pH 6.2, 6.8, and 7.4 Phosphate-Buffered Saline Solutions (Batches C–H)
When an oral liquid formulation is administered, it immediately encounters residual saliva in the oral cavity, creating a mixed medium whose pH and ionic composition are governed by salivary physiology. Human saliva contains three principal buffer systems: protein, phosphate, and carbonic acid/bicarbonate, which collectively maintain oral pH within the physiological range of 6.2–7.6 (Bechir et al., 2021; He & Mu, 2023). The phosphate-buffered saline (PBS) solutions used in Batches C–H were designed to replicate this oral environment across its physiological range, providing a biorelevant assessment of how ionic strength, pH, and buffering capacity alter the sensory performance of HBB syrups at the formulation–saliva interface.
The pH of the oral medium has two mechanistically distinct consequences for formulation palatability. First, it governs the buffering capacity available to neutralize formulation acidity, directly affecting the AHS (sourness/acidity) sensor response. A higher PBS pH progressively neutralizes the formulation's titratable acidity, reducing free proton activity at the sensor surface (Zhang et al., 2022; Lambros et al., 2022). Second, as PBS pH increases from 6.2 to 7.4, the dominant phosphate species shifts from monovalent H₂PO₄⁻ to divalent HPO₄²⁻, increasing ionic strength and altering the Nernstian electrochemical environment at the ChemFET sensor membrane (Gaohua et al., 2021; Krieg et al., 2015). Since HBB carries a permanent positive charge on its quaternary ammonium nitrogen, independent of pH (Corsetti et al., 2023), the pH-dependent sensor responses observed across Batches C–H reflect changes in the ionic composition of the measurement medium and in excipient behavior, rather than ionization of the API itself.
Salivary pH varies systematically across patient populations: younger children typically exhibit lower resting salivary pH (6.2–6.8), while adolescents and adults exhibit higher pH values, approaching 7.4–7.6 (Anderson et al., 2001; Bechir et al., 2021). This physiological variation has direct implications for the in-use palatability of oral liquid formulations, as the same formulation encounters different ionic and pH environments depending on the patient's age. Taste perception also varies among individuals by age, sex, dietary practices, disease state, and salivary composition (Pein et al., 2014; Schluterman et al., 2024; Mennella et al., 2015). The buffering action of saliva, principally mediated by bicarbonate ions at stimulated flow rates, neutralizes formulation acidity and modulates sour taste intensity; elevated buffering capacity reduces the perception of sourness by decreasing free proton activity at taste receptor surfaces (Zhang et al., 2022; Hyodo et al., 2024).
The residual salivary volume in the oral cavity under resting conditions is approximately 1–2 mL, increasing to 5 mL or more under stimulated conditions (Pein et al., 2014; Gittings et al., 2015). To replicate this physiological range, HBB syrup samples were diluted with 2 mL and 5 mL of PBS at three pH values (6.2, 6.8, and 7.4), representing the lower, mid, and upper physiological salivary pH ranges, respectively. This design enables systematic evaluation of how both the pH and volume of simulated oral fluid affect the sensory performance of each commercial formulation, providing biorelevant palatability data that single-pH or undiluted assessments cannot capture (He & Mu, 2023; Gittings et al., 2015).
Prior to the batch-specific analysis of individual PBS conditions, a comprehensive cross-condition evaluation was performed by subjecting representative samples from each brand (X1, Y1, Z1) to simultaneous multivariate analysis across all PBS dilution conditions (Batches C–H) alongside their undiluted PURE references. The 3D PCA score plot (Figure 4a) confirmed that the three brands maintain distinct and consistent taste trajectories across the full biorelevant PBS dilution matrix, with no inter-brand overlap (cumulative variance = 96.268%). The 2D DFA score plot (Figure 4b) achieved near-complete between-group discrimination (DF1 = 99.127%, DF2 = 0.769%; total = 99.896%), confirming that brand identity, governed by excipient composition, is the dominant determinant of taste profile across all PBS pH values and salivary volumes tested. These findings provide the analytical foundation for the detailed batch-specific analyses presented in the following sections (Nam et al., 2023; Sruthi et al., 2024; Lorenz et al., 2009; Gongoni et al., 2026).
3.3.1. Assessment of HBB Syrups Diluted with 2 mL and 5 mL pH 6.2 PBS (Batches C and D)
The 3D PCA score plot of all undiluted samples and those diluted with 2 mL of pH 6.2 PBS is depicted in Figure 5a, with a cumulative variance contribution of 97.796% (PC1 = 77.101%, PC2 = 14.651%, PC3 = 6.044%), confirming that the e-tongue discriminates reliably between undiluted and PBS-diluted samples across all three brands (Nam et al., 2023; Sruthi et al., 2024). The inclusion of a third principal component improved variance captures relative to the two-dimensional representation, resolving overlapping clusters and providing a more complete representation of the multivariate sensor data. Diluted samples were clearly separated from undiluted samples with no inter-group overlap, indicating significant taste divergence upon dilution with 2 mL pH 6.2 PBS. The distance between diluted Brand X samples and the XPURE reference was substantially greater than the corresponding distances for Brands Y and Z, reflecting the more pronounced taste change undergone by Brand X's HEC-containing matrix when exposed to the ionic conditions of pH 6.2 PBS. Intra-brand clustering confirmed taste consistency across the three batches of each brand following dilution, with the exception of Y1PH622ML, which was positioned at a considerable distance from Y2 and Y3 and from YPURE, suggesting a batch-specific deviation in excipient concentration or API level warranting quality investigation (Oliva & Llabrés, 2021; Zhang et al., 2024).
To complement the unsupervised PCA, DFA was applied as a supervised multivariate classification technique. The 2D DFA score plot (Figure 5b) yielded a cumulative discriminant variance of 99.773% (DF1 = 95.446%, DF2 = 4.327%), demonstrating near-complete capture of between-group variance. Complete and unambiguous separation was achieved between all PBS-diluted and undiluted sample groups with no inter-group overlap, corroborating and strengthening the PCA findings (Lorenz et al., 2009; Gongoni et al., 2026).
The distance bar chart (Figure 6) confirmed minimal intra-brand distances across all three PBS-diluted batches of Brands X (PDI range: 1.08–4.38%) and Z (PDI range: 0.29–1.97%), and a substantial distance between Y1PH622ML and the other Brand Y batches (Y1 vs Y2 = 45.21%; Y1 vs Y3 = 44.11%), while Y2PH622ML and Y3PH622ML were virtually identical (PDI = 0.08%). Brand Z was the only brand to exhibit near-identical taste profiles across all three batches when diluted with 2 mL pH 6.2 PBS, consistent with its polymer-free excipient matrix providing a uniform, undifferentiated sensor response. Comparison of diluted versus undiluted samples revealed significant taste divergence for X1PH622ML vs X1PURE (PDI = 58.90%) and Y1PH622ML vs Y1PURE (PDI = 65.34%), moderate divergence for X3PH622ML vs X3PURE (PDI = 44.93%), Y2PH622ML vs Y2PURE (PDI = 46.98%), and all Brand Z batch pairs (PDI range: 50.20–62.00%), and slight divergence for Y3PH622ML vs Y3PURE (PDI = 36.53%). The moderate divergence observed for Brand Z on PBS dilution is attributable to partial buffering of its citric acid monohydrate component, as PBS at pH 6.2 approaches the third dissociation constant of citric acid (pKa3 = 6.39), titratable acidity is progressively neutralized, modestly altering the AHS sensor response relative to the undiluted state (Lambros et al., 2022; Da Conceicao Neta et al., 2007).
The bar plot in Figure 7 illustrates the sensory profiles of all Batch C samples. All samples diluted with 2 mL pH 6.2 PBS showed increased sweetness (ANS) relative to undiluted products, except Z2PH622ML and Z3PH622ML, whose ANS scores were slightly reduced. The bitterness (SCS) and sourness (AHS) sensor responses were highest for Brand Z samples across all samples tested. Brands X and Y showed increased bitterness (SCS) and sourness (AHS) relative to undiluted samples, whereas Brand Z showed a reduction in both SCS and AHS scores relative to its undiluted state. This divergent behavior reflects the mechanistic differences between the two formulation types: in Brands X and Y, PBS at pH 6.2 introduces additional ionic species, principally phosphate anions that alter the electrochemical environment at the ChemFET sensor membrane, increasing the Nernstian response to dissolved cationic species, including the permanently charged HBB cation and sweetener molecules, thereby elevating both SCS and AHS scores (Gaohua et al., 2021; Krieg et al., 2015). For Brand Z, the reduction in SCS and AHS scores on PBS dilution relative to the undiluted state reflects the partial neutralization of citric acid by PBS and the simultaneous dilution of the dissolved HBB concentration, which together reduce both sourness and bitterness sensor adsorption. Notably, the PKS sensor responses for PBS-diluted Brand X samples were substantially elevated relative to all other samples in Batch C, with X1PH622ML recording the highest PKS score across all batches, reflecting a distinctive electrochemical interaction between Brand X's HEC matrix and the ionic composition of pH 6.2 PBS. The PKS sensor responses for diluted Brand Y and Z samples were considerably lower than those for diluted Brand X samples, consistent with the differences in polymer and excipient compositions among these formulations.
The transition from 2 mL to 5 mL PBS (Batch D) reflects an increase in simulated salivary volume from resting to stimulated conditions. As PBS volume increases, the total phosphate buffer content of the measurement medium rises, progressively shifting the dominant phosphate species from monovalent H₂PO₄⁻ to divalent HPO₄²⁻, thereby increasing ionic strength and altering the electrochemical activity at the ChemFET sensor surface (Gaohua et al., 2021; Krieg et al., 2015). Additionally, the greater buffering capacity of 5 mL PBS more completely neutralizes residual formulation acidity than 2 mL PBS, reducing free proton activity available for AHS sensor activation (Zhang et al., 2022; Lambros et al., 2022). These two effects, increased ionic strength and greater acid neutralization, account for the volume-dependent changes in sensor scores observed between Batches C and D.
The taste screening rankings for Batch D (Table 6) confirm that increasing PBS volume from 2 mL to 5 mL at pH 6.2 resulted in higher SCS bitterness and lower AHS sourness scores across all brands compared with Batch C, consistent with the ionic strength and buffering capacity mechanism described above. For Brand Z, higher PBS volume resulted in substantially elevated SCS scores (8.5–9.1 for Batch D versus 7.3–7.5 for Batch C; Table 5), further amplifying the bitterness already dominant in this polymer-free formulation, as additional phosphate ions compete with and modify the sensor membrane's response to dissolved HBB. For Brands X and Y, bitterness also increased with volume, though from a lower baseline, and AHS scores decreased, consistent with greater phosphate buffering of residual formulation acidity. Y2PH62 and Y3PH62 showed modest increases in ANS sweetness scores at 5 mL relative to 2 mL, reflecting the differential sensitivity of the sodium cyclamate–sorbitol–saccharin system to the altered ionic conditions created by larger PBS volumes, while Y1PH62 and all Brand X and Z samples showed decreased ANS scores at the higher volume. The palatability hierarchy under Batch D conditions remained Y > X > Z (Table 6), with the taste-masking advantage of cellulosic polymer-containing formulations preserved despite the more challenging biorelevant conditions imposed by increased simulated salivary volume.
Table 5.
Taste screening ranking for all sensors for all batch C samples.
| Sample number | Sample names | AHS | PKS | CTS | NMS | CPS | ANS | SCS |
|---|---|---|---|---|---|---|---|---|
| 1 | X1PH622ML | 6.2 | 9.5 | 5.2 | 5.2 | 5.5 | 7.6 | 5.4 |
| 2 | X1PURE | 8.0 | 4.6 | 7.3 | 8.1 | 6.5 | 3.3 | 4.2 |
| 3 | X2PH622ML | 6.3 | 8.2 | 5.1 | 5.3 | 5.4 | 7.5 | 5.4 |
| 4 | X2PURE | 7.8 | 5.0 | 8.4 | 6.3 | 8.0 | 5.5 | 4.6 |
| 5 | X3PH622ML | 6.2 | 8.8 | 5.1 | 5.1 | 5.4 | 7.6 | 5.4 |
| 6 | X3PURE | 7.7 | 5.1 | 8.8 | 6.1 | 8.2 | 5.9 | 4.7 |
| 7 | Y1PH622ML | 6.9 | 8.2 | 3.7 | 6.2 | 4.3 | 6.1 | 4.8 |
| 8 | Y1PURE | 8.1 | 4.4 | 6.8 | 7.0 | 5.8 | 3.9 | 4.3 |
| 9 | Y2PH622ML | 7.2 | 5.3 | 3.2 | 6.9 | 3.5 | 5.5 | 4.6 |
| 10 | Y2PURE | 8.1 | 4.7 | 7.2 | 6.9 | 6.2 | 4.3 | 4.4 |
| 11 | Y3PH622ML | 7.1 | 5.3 | 3.2 | 6.9 | 3.5 | 5.4 | 4.6 |
| 12 | Y3PURE | 8.0 | 4.7 | 7.1 | 7.7 | 5.6 | 3.6 | 4.4 |
| 13 | Z1PH622ML | 4.1 | 6.0 | 4.5 | 6.1 | 5.4 | 7.1 | 7.3 |
| 14 | Z1PURE | 2.9 | 5.4 | 7.4 | 3.9 | 8.1 | 6.7 | 9.2 |
| 15 | Z2PH622ML | 3.9 | 5.9 | 4.3 | 6.4 | 5.1 | 6.8 | 7.5 |
| 16 | Z2PURE | 2.7 | 5.6 | 8.0 | 3.8 | 8.3 | 7.3 | 9.6 |
| 17 | Z3PH622ML | 4.0 | 5.8 | 4.2 | 6.4 | 4.9 | 6.5 | 7.3 |
| 18 | Z3PURE | 2.7 | 5.7 | 8.4 | 3.8 | 8.3 | 7.5 | 10.2 |
Table 6.
Taste screening ranking for all sensors for all batch D samples.
| Sample number | Sample names | AHS | PKS | CTS | NMS | CPS | ANS | SCS |
|---|---|---|---|---|---|---|---|---|
| 1 | X1PH62 | 6.1 | 6.0 | 7.1 | 8.2 | 4.6 | 4.9 | 5.7 |
| 2 | X1PURE | 8.5 | 3.4 | 3.9 | 7.4 | 5.3 | 3.5 | 3.5 |
| 3 | X2PH62 | 5.7 | 5.4 | 6.3 | 7.9 | 4.7 | 5.0 | 6.0 |
| 4 | X2PURE | 8.3 | 5.8 | 7.0 | 5.4 | 7.7 | 6.4 | 3.8 |
| 5 | X3PH62 | 5.5 | 5.9 | 5.7 | 6.4 | 6.4 | 6.6 | 6.3 |
| 6 | X3PURE | 8.2 | 6.4 | 8.2 | 5.2 | 8.0 | 6.9 | 3.9 |
| 7 | Y1PH62 | 6.3 | 6.3 | 6.8 | 7.3 | 4.8 | 5.5 | 5.6 |
| 8 | Y1PURE | 8.6 | 2.7 | 2.6 | 6.2 | 4.3 | 4.4 | 3.6 |
| 9 | Y2PH62 | 6.1 | 6.0 | 6.5 | 7.1 | 4.7 | 5.7 | 5.8 |
| 10 | Y2PURE | 8.5 | 4.1 | 3.8 | 6.1 | 4.9 | 4.9 | 3.7 |
| 11 | Y3PH62 | 5.8 | 6.0 | 5.6 | 6.9 | 4.9 | 6.0 | 6.0 |
| 12 | Y3PURE | 8.5 | 4.0 | 3.5 | 6.9 | 3.9 | 3.9 | 3.6 |
| 13 | Z1PH62 | 3.4 | 6.7 | 8.7 | 6.3 | 6.6 | 6.3 | 9.0 |
| 14 | Z1PURE | 4.3 | 8.4 | 4.3 | 2.8 | 7.8 | 7.9 | 7.5 |
| 15 | Z2PH62 | 3.0 | 6.0 | 8.2 | 6.2 | 6.5 | 6.3 | 9.1 |
| 16 | Z2PURE | 4.1 | 9.4 | 5.8 | 2.7 | 8.2 | 8.7 | 7.8 |
| 17 | Z3PH62 | 3.1 | 5.7 | 7.0 | 6.2 | 6.4 | 6.2 | 8.5 |
| 18 | Z3PURE | 4.1 | 9.8 | 7.0 | 2.7 | 8.2 | 9.0 | 8.3 |
3.3.2. HBB Syrups Diluted with 2 mL and 5 mL pH 6.8 PBS (Batches E and F)
The 3D PCA score plot for all undiluted samples and samples diluted with 2 mL pH 6.8 PBS is depicted in Figure 8a, with a cumulative variance contribution of 96.798% (PC1 = 74.724%, PC2 = 12.857%, PC3 = 9.217%), confirming that the e-tongue discriminates reliably between undiluted samples and those exposed to pH 6.8 PBS across all three brands (Nam et al., 2023; Sruthi et al., 2024). The inclusion of a third principal component improved variance capture relative to the two-dimensional representation, resolving overlapping clusters and providing a more complete representation of the multivariate sensor data. Diluted samples were distinctly separated from undiluted samples with no inter-group overlap. The distance between diluted Brand X samples and the XPURE reference was substantially greater than the corresponding distances for Brands Y and Z, consistent with the pattern observed at pH 6.2 (Batch C) and reflecting the greater sensitivity of Brand X's HEC-containing matrix to the ionic conditions introduced by PBS. Marginal intra-brand clustering was observed for diluted samples across batches of the same brand, indicating that PBS dilution at pH 6.8 standardizes the formulation matrix sufficiently for the sensor to detect high degrees of taste similarity across batches, consistent with dilution reducing manufacturing-related batch-to-batch excipient variability (Li et al., 2016; Zhang et al., 2024). While bicarbonate buffer systems more closely approximate the in vivo salivary buffer composition, PBS at pH 6.8 provides a stable, reproducible, and well-characterized biorelevant medium for this assessment (Claussen et al., 2024; Gittings et al., 2015).
To complement the unsupervised PCA, DFA was applied as a supervised multivariate classification technique. The 2D DFA score plot (Figure 8b) yielded a cumulative discriminant variance of 98.683% (DF1 = 83.362%, DF2 = 15.321%), demonstrating near-complete capture of between-group variance across all sample groups. Complete and unambiguous separation was achieved between all PBS-diluted and undiluted sample groups with no inter-group overlap, corroborating and strengthening the PCA findings (Lorenz et al., 2009; Gongoni et al., 2026).
The distance bar chart (Figure 9) confirmed minimal inter-batch distances for X1/X3 (PDI = 2.62%), Z1/Z2 (PDI = 5.95%), Z1/Z3PH682ML2 (PDI = 12.53%), and Z2/Z3PH682ML2 (PDI = 7.38%), and slight distances for X1/X2 (PDI = 19.92%) and X2/X3 (PDI = 17.56%). Brand Y showed minimal distances for Y1/Y2 (PDI = 5.37%) but slight divergence for Y1/Y3 (PDI = 23.32%) and Y2/Y3 (PDI = 25.94%), indicating that Brand Y did not exhibit fully identical taste profiles across all three batches at pH 6.8 PBS. Comparison of PBS-diluted versus undiluted samples revealed significant taste divergence for X1PH682ML vs X1PURE (PDI = 57.54%), Z1PH682ML vs Z1PURE (PDI = 63.93%), Z2PH682ML vs Z2PURE (PDI = 63.54%), and Z3PH682ML2 vs Z3PURE (PDI = 58.09%), moderate divergence for Y3PH682ML vs Y3PURE (PDI = 45.14%), and slight to minimal divergence for X2PH682ML vs X2PURE (PDI = 10.88%), X3PH682ML vs X3PURE (PDI = 4.02%), Y1PH682ML vs Y1PURE (PDI = 8.28%), and Y2PH682ML vs Y2PURE (PDI = 9.90%), confirming that 2 mL pH 6.8 PBS produces formulation-specific sensory changes of varying magnitude relative to the undiluted state.
The bar plot in Figure 10 illustrates the sensory profiles of all Batch E samples. All samples diluted with 2 mL of pH 6.8 PBS showed higher sweetness (ANS) scores than their undiluted counterparts across all three brands. The SCS bitterness response was highest for Brand Z samples across all Batch E samples, with Z3PH682ML2 recording the highest PBS-diluted SCS score. Brands X and Y showed higher bitterness (SCS) than their undiluted counterparts, while Brand Z showed lower bitterness on dilution with 2 mL pH 6.8 PBS relative to undiluted Brand Z. The AHS sourness scores for Brands X and Y increased on PBS dilution relative to their undiluted counterparts. For Brand Z, Z1PH682ML and Z2PH682ML showed marginally lower AHS scores than their undiluted counterparts, while Z3PH682ML2 showed a higher AHS score than Z3PURE. The PKS response was substantially elevated for diluted Brand X samples, particularly X1PH682ML, distinguishing it from the diluted Brand Y and Z profiles.
Table 7.
Taste screening ranking scores for all sensors for all batch E samples.
| Sample number | Sample names | AHS | PKS | CTS | NMS | CPS | ANS | SCS |
|---|---|---|---|---|---|---|---|---|
| 1 | X1PH682ML | 5.5 | 9.5 | 5.0 | 5.1 | l5.5 | 7.7 | 6.1 |
| 2 | X1PURE | 8.2 | 4.4 | 7.0 | 9.2 | 6.3 | 2.8 | 3.8 |
| 3 | X2PH682ML | 5.3 | 7.3 | 4.9 | 5.0 | 5.5 | 7.8 | 6.3 |
| 4 | X2PURE | 8.1 | 4.9 | 8.0 | 6.9 | 8.3 | 5.0 | 4.2 |
| 5 | X3PH682ML | 5.2 | 8.7 | 4.9 | 5.0 | 5.5 | 7.8 | 6.4 |
| 6 | X3PURE | 7.9 | 5.0 | 8.4 | 6.6 | 8.6 | 5.4 | 4.3 |
| 7 | Y1PH682ML | 6.3 | 5.8 | 4.5 | 5.2 | 5.2 | 7.3 | 5.5 |
| 8 | Y1PURE | 8.3 | 5.9 | 7.6 | 7.3 | 5.5 | 3.9 | 4.0 |
| 9 | Y2PH682ML | 6.0 | 5.8 | 4.5 | 5.1 | 5.3 | 7.5 | 5.7 |
| 10 | Y2PURE | 8.3 | 6.1 | 7.8 | 7.3 | 6.0 | 4.1 | 4.1 |
| 11 | Y3PH682ML | 6.4 | 5.6 | 3.2 | 7.1 | 2.9 | 5.7 | 5.2 |
| 12 | Y3PURE | 8.2 | 4.5 | 6.9 | 8.6 | 5.1 | 3.1 | 3.9 |
| 13 | Z1PH682ML | 3.7 | 5.9 | 4.3 | 6.3 | 4.6 | 6.4 | 7.8 |
| 14 | Z1PURE | 3.4 | 5.4 | 7.1 | 3.9 | 8.4 | 6.2 | 8.9 |
| 15 | Z2PH682ML | 3.2 | 6.1 | 4.5 | 3 | 5.3 | 7.1 | 8.3 |
| 16 | Z2PURE | 3.2 | 5.6 | 7.6 | 3.8 | 8.7 | 6.8 | 9.3 |
| 17 | Z3PH682ML | 2.7 | 6.3 | 3.4 | 5.3 | 4.6 | 7.9 | 8.9 |
| 18 | Z3PURE | 3.3 | 5.7 | 8.0 | 3.8 | 8.7 | 7.0 | 10.0 |
The transition from 2 mL to 5 mL of pH 6.8 PBS (Batch F) shows the same amplification of ionic strength and buffering capacity as the Batch C–D comparison. As PBS volume increases from 2 mL to 5 mL, total phosphate content rises, ionic strength increases, and buffering capacity more fully neutralizes formulation acidity, producing the volume-dependent sensory shifts confirmed in Table 8. For all Brand Z samples, increasing PBS volume at pH 6.8 produced markedly elevated SCS bitterness (Table 8: Z1PH68 = 8.5, Z2PH68 = 8.9, Z3PH68 = 9.3) relative to Batch E, and reduced ANS sweetness responses consistent with the greater ionic strength environment amplifying sensor adsorption of the permanently charged HBB cation (Gaohua et al., 2021; Krieg et al., 2015). For Brands X and Y, increasing PBS volume elevated SCS bitterness scores and further reduced AHS sourness and ANS sweetness across most batches, reflecting the ionic strength effect on sensor responses within formulations whose cellulosic polymer matrices continue to provide partial but progressively eroded taste-masking protection, with the exception of Y3PH68, which showed an increase in ANS. The reduction in AHS sourness across all brands with increasing salivary volume at pH 6.8 is consistent with greater phosphate buffer neutralization of formulation acidity at higher PBS volumes, thereby reducing the proton activity available for AHS sensor activation (Zhang et al., 2022; Lambros et al., 2022). The palatability hierarchy under Batch F conditions remained Y > X > Z (Table 8), with the taste-masking advantage of cellulosic polymer-containing formulations sustained under increased simulated salivary volume at pH 6.8.
3.3.3. HBB Syrups Diluted with 2 mL and 5 mL of pH 7.4 PBS (Batches G and H)
The 3D PCA score plot for undiluted samples and samples diluted with 2 mL of pH 7.4 PBS is depicted in Figure 11a, with a cumulative variance of 98.185% (PC1 = 75.816%, PC2 = 12.601%, PC3 = 9.768%), confirming reliable e-tongue discrimination between undiluted and PBS-diluted samples across all three brands (Nam et al., 2023; Sruthi et al., 2024). The inclusion of a third principal component improved variance capture relative to the two-dimensional representation, resolving overlapping clusters and providing a more complete representation of the multivariate sensor data. Diluted samples were distinctly separated from undiluted samples with no inter-group overlap. Notably, the distance between diluted Brand Z samples and the ZPURE reference was substantially lower than the corresponding distances for Brands X and Y, a pattern that contrasts with the results at pH 6.2 and 6.8, where Brand X showed the greatest divergence from its undiluted state. At pH 7.4, Brand Z's undiluted profile is already predominantly bitter, and the PBS ionic environment produces only a relatively modest additional divergence, consistent with the absence of a polymer network that would otherwise be progressively disrupted by changing ionic strength. Intra-brand batch clustering was observed for all three brands, confirming taste consistency across batches of the same brand at this pH, with the exception of X3PH742ML, which was positioned at a marginal distance from the other two Brand X batches, suggesting a batch-specific deviation in excipient concentration or preparation (Oliva & Llabrés, 2021; Zhang et al., 2024).
To complement the unsupervised PCA, DFA was applied as a supervised multivariate classification technique. The 2D DFA score plot (Figure 11b) yielded a cumulative discriminant variance of 99.853% (DF1 = 98.1%, DF2 = 1.753%), the highest across all PBS batches in this study, demonstrating near-complete capture of between-group variance. Complete and unambiguous separation was achieved between all PBS-diluted and undiluted sample groups with no inter-group overlap, corroborating and strengthening the PCA findings (Lorenz et al., 2009; Gongoni et al., 2026).
The distance bar chart (Figure 12) confirmed minimal inter-batch distances for X1/X2 (PDI = 1.81%), Z1/Z2 (PDI = 7.54%), Z1/Z3 (PDI = 6.97%), and Z2/Z3 (PDI = 0.02%), and moderate distances for X1/X3 (PDI = 42.33%) and X2/X3 (PDI = 37.30%), reflecting batch-specific variability in Brand X at pH 7.4. Brand Y exhibited virtually identical taste profiles across all three batches (Y1/Y2 = 0.07%, Y1/Y3 = 0.16%, Y2/Y3 = 0.12%), consistent with the uniform behavior of its HPMC matrix observed at pH 6.8 (Figure 8). Comparison of PBS-diluted versus undiluted samples revealed significant taste divergence for all Brand X batches (PDI range: 64.20–90.86%) and all Brand Y batches (PDI range: 55.12–65.11%), and moderate divergence for Brand Z batches (Z1PH742ML vs Z1PURE = 53.56%; Z2PH742ML vs Z2PURE = 43.03%; Z3PH742ML vs Z3PURE = 41.11%), consistent with the progressive increase in PBS ionic strength as pH rises and the dominant phosphate species shifts further toward divalent HPO₄²⁻ (Gaohua et al., 2021; Krieg et al., 2015).
Figure 12.
Distance bar chart plot for Batch G samples compared to Batch A samples.The bar plot in Figure 13 illustrates the sensory profiles of all Batch G samples. All samples diluted with 2 mL of pH 7.4 PBS showed lower saltiness (CTS) scores than undiluted samples across all three brands, with Brand X retaining the highest CTS scores among diluted samples, followed by Brand Z, then Brand Y (X > Z > Y). The PKS sensor response was highest for diluted Brand X samples, followed by Brand Z, then Brand Y (X > Z > Y). All Brand X and Y samples showed higher SCS, ANS, and AHS scores when diluted with 2 mL of pH 7.4 PBS than undiluted samples. For Brand Z, dilution with 2 mL pH 7.4 PBS also increased ANS and AHS scores relative to undiluted Brand Z, and SCS scores were slightly higher for Z1PH742ML and Z2PH742ML, while Z3PH742ML showed a slight reduction in SCS relative to Z3PURE. The increase in AHS scores for Brand Z on dilution with pH 7.4 PBS, which differs from the AHS reduction observed at pH 6.2 and 6.8, is attributable to the near-complete neutralization of citric acid at pH 7.4, with the competing ionic environment of divalent HPO₄²⁻ modifying the AHS sensor response independently of titratable acidity (Lambros et al., 2022; Gaohua et al., 2021).
Figure 12.
Distance bar chart plot for Batch G samples compared to Batch A samples.The bar plot in Figure 13 illustrates the sensory profiles of all Batch G samples. All samples diluted with 2 mL of pH 7.4 PBS showed lower saltiness (CTS) scores than undiluted samples across all three brands, with Brand X retaining the highest CTS scores among diluted samples, followed by Brand Z, then Brand Y (X > Z > Y). The PKS sensor response was highest for diluted Brand X samples, followed by Brand Z, then Brand Y (X > Z > Y). All Brand X and Y samples showed higher SCS, ANS, and AHS scores when diluted with 2 mL of pH 7.4 PBS than undiluted samples. For Brand Z, dilution with 2 mL pH 7.4 PBS also increased ANS and AHS scores relative to undiluted Brand Z, and SCS scores were slightly higher for Z1PH742ML and Z2PH742ML, while Z3PH742ML showed a slight reduction in SCS relative to Z3PURE. The increase in AHS scores for Brand Z on dilution with pH 7.4 PBS, which differs from the AHS reduction observed at pH 6.2 and 6.8, is attributable to the near-complete neutralization of citric acid at pH 7.4, with the competing ionic environment of divalent HPO₄²⁻ modifying the AHS sensor response independently of titratable acidity (Lambros et al., 2022; Gaohua et al., 2021).
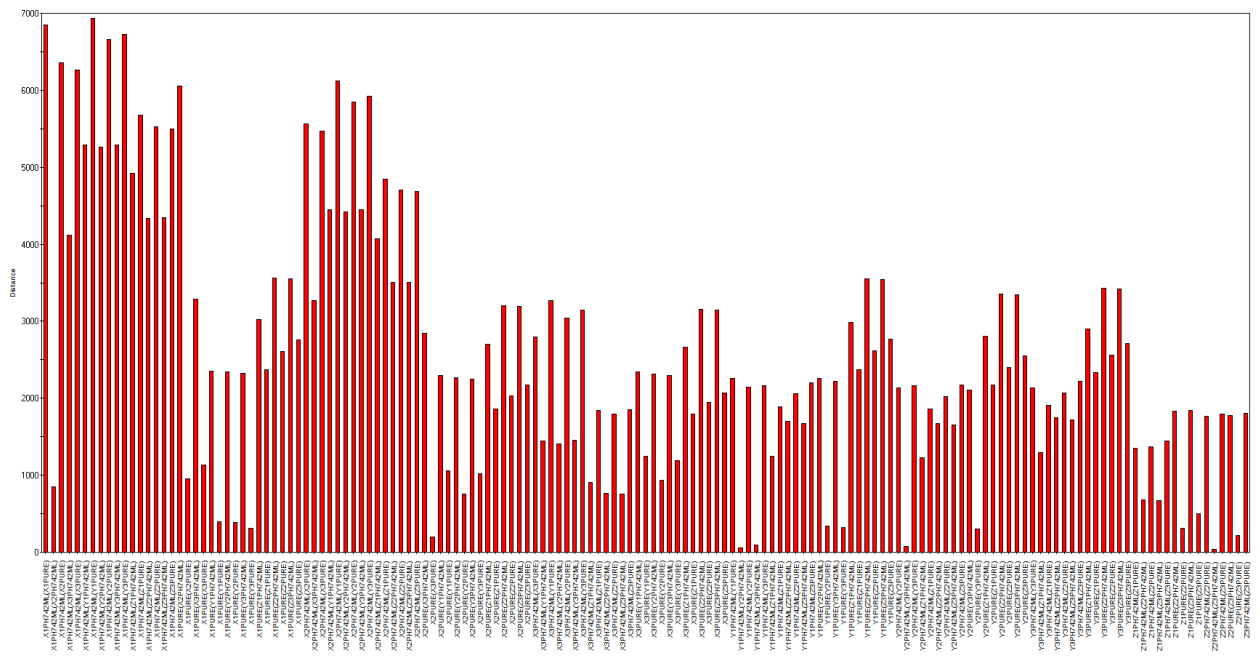
Figure 13.
Bar chart plot of sensor responses for Batch G samples compared to Batch A samples (n = 3 replicates).
Figure 13.
Bar chart plot of sensor responses for Batch G samples compared to Batch A samples (n = 3 replicates).
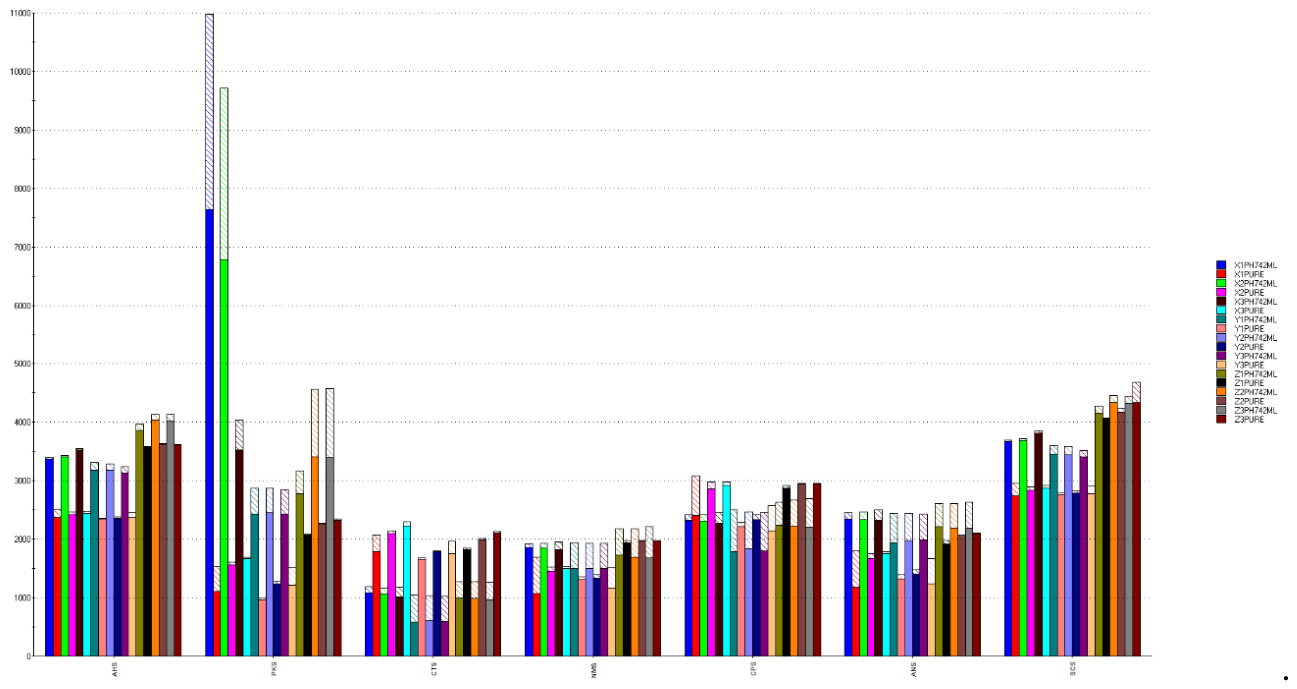
The taste screening rankings summarised in Table 9 confirmed that all three brands exhibited higher SCS and ANS scores than the undiluted samples when diluted with 2 mL of pH 7.4 PBS, except for Z3PH742ML, which showed no change in SCS (8.6 = Z3PURE). The bitterness ranking was Z > X > Y, and the sweetness ranking was X > Z > Y. The progressive increase in SCS bitterness scores from pH 6.2 to pH 6.8 to pH 7.4 across all brands is consistent with the pH-dependent shift in PBS phosphate speciation, as the proportion of divalent HPO₄²⁻ increases, ionic strength rises, reducing the activity coefficient of the permanently charged HBB cation in solution according to the Debye-Hückel relationship and modifying the Nernstian phase-boundary potential at the ChemFET sensor membrane (Bakker et al., 1997; Toko, 2000; Gaohua et al., 2021; Krieg et al., 2015; Ishida et al., 2022). This is an effect of the electrochemical medium, not a change in the HBB ionization state, as HBB carries a fixed positive charge independent of pH (Corsetti et al., 2023).
The dilution of Brands X and Y with 2 mL pH 7.4 PBS produced a marked reduction in AHS scores relative to undiluted samples, attributable to the substantial phosphate buffering capacity of PBS at this pH, more completely neutralizing residual formulation acidity than at pH 6.2 or 6.8 (Krieg et al., 2015; Zhang et al., 2022). For Brand Z, the AHS reduction (−0.9 to −1.4) reflects the interaction between citric acid neutralization and the altered ionic environment described above. The primary taste contributor for Brand X at pH 7.4 was the PKS response for X1PH742ML and X2PH742ML, and ANS for X3PH742ML; for Brand Y, the NMS umami response predominated across all three batches; and for Brand Z, the SCS bitterness response predominated. The identity of the primary sensor contributor remained brand-specific across all PBS pH values, confirming that the fundamental taste character of each formulation is governed by its excipient composition, regardless of PBS pH applied, even as absolute sensor scores change with ionic strength and buffering capacity.
The palatability hierarchy at pH 7.4 remained Y > X > Z (Table 9), consistent with the rankings established at pH 6.2 and 6.8, confirming the sustained superiority of Brand Y's HPMC-based taste-masking system across the full physiological salivary pH range. Notably, Brand X exhibited substantially higher ANS sweetness scores (7.7–7.8) relative to Brand Y (6.2–6.4) at pH 7.4, reflecting the differential sensitivity of the saccharin-only sweetener system in Brand X to the ionic conditions created by near-neutral PBS. Despite this stronger sweetness response, Brand X's overall palatability remained inferior to Brand Y's, as evidenced by higher SCS bitterness scores (X = 6.4–6.9 vs Y = 5.6–5.8). Brand Z remains the least palatable at all three pH values, consistently exhibiting the highest SCS scores in the absence of any polymer-mediated diffusion barrier. These findings demonstrate that biorelevant pH-stratified assessment is essential for comprehensive palatability characterization, and that consistent superiority of a taste-masking system across the full physiological pH range, as demonstrated by Brand Y, is a critical quality criterion for oral pediatric liquid formulations intended for use across diverse patient age groups (van Riet-Nales et al., 2012; Gittings et al., 2015).
The transition from 2 mL to 5 mL pH 7.4 PBS (Batch H) produced pronounced volume-dependent sensory changes, consistent with pH 7.4 PBS having the highest ionic strength of the three PBS conditions tested. For Brand Z, increasing PBS volume from 2 mL to 5 mL produced a markedly elevated SCS bitterness score for Z1PH74 (9.5 vs Batch G 8.0), while Z2PH74 showed only marginal change (8.7 vs 8.6) and Z3PH74 showed a slight reduction (8.1 vs 8.6). Brand Z AHS scores were largely unchanged or slightly increased relative to Batch G. For Brands X and Y, increasing PBS volume elevated SCS bitterness and further reduced AHS sourness. Notably, Brand X ANS sweetness decreased at 5 mL (6.7–6.8) relative to Batch G (7.7–7.8), while Brand Y ANS increased (7.0–7.4 vs 6.2–6.4 at Batch G), reflecting the differential sensitivity of the two sweetener systems to the higher ionic strength conditions created by larger volumes of near-neutral PBS. The reduction in AHS sourness across all brands with increasing salivary volume at pH 7.4 is mechanistically consistent with the greater phosphate buffering capacity of 5 mL PBS, more completely neutralising residual formulation acidity and reducing proton activity at the AHS sensor surface (Krieg et al., 2015; Zhang et al., 2022; Lambros et al., 2022). The increased ionic strength introduced by 5 mL PBS alters the Nernstian electrochemical response of the ChemFET array to dissolved HBB and excipient species in a volume-dependent manner (Bakker et al., 1997; Toko, 2000; Gaohua et al., 2021; Gaohua et al., 2021; Ishida et al., 2022). The palatability hierarchy under Batch H conditions remained Y > X > Z (Table 10), consistent with all previous PBS batches. Critically, the SCS bitterness scores of Brands X and Y converged substantially at 5 mL pH 7.4 PBS (X = 7.2–7.3; Y = 7.0–7.3), compared with a wider gap at 2 mL (X = 6.4–6.9; Y = 5.6–5.8), indicating that the taste-masking advantage of Brand Y's HPMC system is progressively eroded under the most challenging biorelevant conditions. This finding further underscores the importance of evaluating formulation palatability across the full range of physiologically relevant salivary volumes for comprehensive biorelevant palatability characterisation.
3.4. Assessment of Pure HBB API Diluted with HPLC-Grade Water, pH 6.2, 6.8, and 7.4 Phosphate-Buffered Saline Solutions of (Batches I)
Batch I was designed to evaluate the taste profile of pure HBB API, free of any excipient contribution, across the full matrix of dilution conditions applied to the commercial syrups in Batches B–H. By subjecting a pure API solution (5 mg/5 mL) to identical water and PBS dilution conditions, this batch provides an excipient-free reference against which the taste-masking performance of the commercial formulation matrices can be directly quantified. The comparison isolates the contribution of excipient systems to palatability from the intrinsic bitterness of dissolved HBB, thereby enabling a direct formulation-science assessment of taste-masking efficiency under biorelevant conditions (Steiner et al., 2024; Pein et al., 2014).
The 2D PCA score plot for all eight Batch I samples, HBB-P, HBB-PDILUTED, HBB-P2MLPH62, HBB-P5MLPH62, HBB-P2MLPH68, HBB-P5MLPH68, HBB-P2MLPH74, and HBB-P5MLPH74, is depicted in Figure 14a, with a total cumulative variance contribution of 99.483%, the highest across all batches in this study. Unlike the PBS dilution batches, where 3D PCA provided meaningful additional variance capture, the 2D representation was retained for Batch I as it already achieves near-complete variance capture, reflecting the absence of excipient complexity in the measurement medium and allowing the e-tongue to respond exclusively to HBB and the PBS ionic environment. The water-diluted pure HBB API sample (HBB-PDILUTED) was distinctly separated from all PBS-diluted samples, and no clustering was observed across any of the eight samples, confirming that each dilution condition produces a measurably distinct taste profile for the pure API (Nam et al., 2023; Sruthi et al., 2024).
To complement the unsupervised PCA, DFA was applied as a supervised multivariate classification technique. The 2D DFA score plot (Figure 14b) yielded a cumulative discriminant variance of 99.571% (DF1 = 95.177%, DF2 = 4.394%), demonstrating near-complete capture of between-group variance across all eight sample conditions. Complete and unambiguous separation was achieved between all sample groups with no inter-group overlap. The DFA further reveals a systematic pH-dependent stratification along the DF2 axis, with pH 6.2 PBS-diluted samples positioned lower and pH 7.4 PBS-diluted samples positioned upper right, confirming that the pH-driven ionic composition changes in PBS produce structurally distinct and reproducible taste profiles for the pure API, independent of any excipient contribution (Lorenz et al., 2009; Gongoni et al., 2026).
The pattern discrimination index (PDI) range of 85.82–99.72% across all pairwise comparisons in Table 11 confirms robust e-tongue discrimination across all Batch I conditions. The minimum PDI of 85.82% was recorded between HBB-P2MLPH68 and HBB-P5MLPH68, representing the smallest taste divergence in the dataset. The two samples differ only in PBS volume at the same pH, and the modest PDI reflects the relatively small ionic strength increment between 2 mL and 5 mL at pH 6.8 compared with the larger pH-driven differences between conditions. With the exception of HBB-P2MLPH68 vs HBB-P5MLPH68 (85.82%) and HBB-P2MLPH74 vs HBB-P5MLPH74 (86.98%), all other pairwise PDI values within the pure API dataset exceeded 93%, confirming that pH, volume, and diluent type each produce substantial, independently detectable taste differences in pure HBB API solutions.
The Euclidean distances and PDI values for HBB-PDILUTED compared with the water-diluted commercial syrup samples (Batch B, olive green in Table 11) provide a direct quantification of excipient-mediated taste masking. The PDI between HBB-PDILUTED and each water-diluted commercial sample reflects the multivariate taste divergence attributable to the presence or absence of excipient matrices. Brand Z water-diluted samples exhibited the lowest PDI values across the table: Z2H2O vs Z2PURE = 25.19% and Z3H2O vs Z3PURE = 38.50%, confirming that Brand Z's taste profile changes minimally with water dilution because its polymer-free formulation provides no structural taste-masking network to disrupt. The undiluted and water-diluted Brand Z profiles are already predominantly driven by dissolved HBB bitterness, making the dilution-induced taste divergence small. In contrast, Brands X and Y show substantially higher PDI values upon water dilution (42.50–93.96%), reflecting disruption of their cellulosic polymer networks and associated changes in API diffusion rate and sweetener masking efficacy (Pein et al., 2014; Vlad et al., 2025). The PDI between HBB-PDILUTED and Y1H2O (93.37% vs 93.96%, respectively) indicates that the magnitude of taste change upon water dilution for the pure API is comparable to that of Brand Y, suggesting that HPMC provides meaningful but not substantially greater taste-masking protection than the unformulated API under simple water-dilution conditions. The marked intra-brand variation for Brand X (X1H2O PDI = 42.50% vs X3H2O PDI = 91.97%) warrants quality investigation, as it suggests batch-to-batch inconsistency in the HEC excipient concentration or its interaction with the API in this brand.
The taste screening rankings summarised in Table 12 confirmed that HBB-PDILUTED produced the highest PKS, CTS, CPS, ANS, and SCS scores and the lowest AHS score among all eight Batch I samples. The SCS bitterness score of HBB-PDILUTED (8.2) was intermediate between the water-diluted Brand Z samples (SCS range 8.0–10.0, Table 4) and the water-diluted Brand X and Y samples (SCS range 5.0–5.4, Table 4), directly confirming that Brand Z's polymer-free excipient matrix provides no additional taste-masking protection over the unformulated API under water dilution conditions, whereas the cellulosic polymer-containing matrices of Brands X and Y retain measurably superior taste masking (Pein et al., 2014; Coupland & Hayes, 2014). The elevated HBB-PDILUTED score relative to HBB-P reflects the concentration-dependent nature of ChemFET sensor response: at 5 mg/5 mL, the dissolved HBB concentration is identical to the commercial syrup samples, whereas HBB-P is prepared at 25 mg/25 mL, although mathematically the same concentration, the lower absolute volume of HBB-PDILUTED produces a higher local API activity at the sensor surface in the 25 mL measurement vessel, consistent with the electrochemical activity-based response of the ChemFET array (Ishida et al., 2022; Zhao et al., 2024). The PBS-diluted pure API samples showed a progressive increase in SCS bitterness scores with increasing PBS pH, pH 6.2 PBS (2 mL = 3.3; 5 mL = 2.9), pH 6.8 PBS (2 mL = 5.4; 5 mL = 5.1), and pH 7.4 PBS (2 mL = 7.9; 5 mL = 7.7), consistent with the pH-dependent shift in phosphate speciation and increasing ionic strength modifying the Nernstian sensor response to the permanently charged HBB cation (Gaohua et al., 2021; Krieg et al., 2015). The intrinsic water solubility of HBB ensures complete dissolution under all conditions tested, confirming that differences in sensor response reflect genuine differences in taste profiles rather than incomplete dissolution (Khattab et al., 2007).
The bar plot in Figure 15 shows that all PBS-diluted pure HBB API samples exhibited substantially lower SCS bitterness and AHS sourness scores than HBB-PDILUTED, with the palatability order being pH 6.2 > pH 6.8 > pH 7.4 for both 2 mL and 5 mL PBS conditions. This progressive increase in bitterness with increasing PBS pH is consistent with the pH-dependent shift in phosphate speciation, as pH rises from 6.2 to 7.4, the dominant phosphate species transitions from H₂PO₄⁻ toward divalent HPO₄²⁻, increasing ionic strength and reducing the activity coefficient of the permanently charged HBB cation according to the Debye-Hückel relationship, which modifies the Nernstian phase-boundary potential and the resulting SCS sensor output (Bakker et al., 1997; Toko, 2000; Gaohua et al., 2021; Krieg et al., 2015). This is an electrochemical medium effect driven by the ionic composition of PBS, not by any change in ionization in HBB itself, which carries a fixed positive charge independent of pH (Corsetti et al., 2023; Ishida et al., 2022). The PDI data in Table 11 confirm these pH-dependent differences: the distance between HBB-P2MLPH62 and HBB-P2MLPH74 (PDI = 98.58%) and between HBB-P5MLPH62 and HBB-P5MLPH74 (PDI = 99.37%) indicate that the taste profiles at pH 6.2 and 7.4 are almost entirely distinct, even though the API concentration is identical across these conditions, confirming that pH-driven ionic strength differences, not API concentration, are the primary determinant of the PBS-dependent sensory variation.
Comparison of the pure HBB API PBS responses (Figure 15) with the corresponding commercial syrup PBS responses (Figure 7, Figure 10 and Figure 13) directly demonstrates that the excipient matrices of all three commercial formulations attenuate the PBS-dependent increase in bitterness observed for pure HBB API under biorelevant dilution conditions. The commercial syrups consistently showed lower SCS bitterness scores than the pure API at equivalent PBS conditions, confirming that both cellulosic polymer-containing (Brands X and Y) and sweetener-only (Brand Z) formulations provide partial taste masking, but that this masking is formulation-specific in magnitude and is progressively challenged as PBS pH and volume increase. Brand Z's excipient matrix provides substantially less attenuation than Brands X and Y under all PBS conditions, confirming the central finding of this study: cellulosic polymer incorporation is the critical determinant of taste-masking resilience under biorelevant oral conditions. The increased drug solubility resulting from artificially enhanced dissolution conditions would produce a stronger sensor response than under biorelevant dilution conditions, potentially leading to an underestimation of the taste-masking success of formulation excipients, reinforcing the importance of the biorelevant assessment approach employed throughout this study (Steiner et al., 2024).
4. Conclusions
This study presents the first systematic, biorelevant assessment of the sensory performance of commercially available HBB oral liquid formulations under simulated oral cavity conditions, thereby extending the baseline palatability characterization documented in our previous investigation (Omoteso et al., 2026a). By exposing three commercial HBB syrup brands and pure HBB API to a structured matrix of dilution conditions, including water dilution and PBS at pH 6.2, 6.8, and 7.4 across residual salivary volumes of 2 mL and 5 mL, this study demonstrates that the palatability of HBB syrups is significantly influenced by the physicochemical conditions present during oral administration. These sensory alterations are mechanistically driven by two interacting processes: dilution-mediated disruption of excipient taste-masking systems and pH- and ionic strength-dependent modulation of excipient behavior and the ChemFET sensor's electrochemical response. The inclusion of cellulosic film-forming polymers (HEC in Brand X; HPMC in Brand Y) offers a significantly enhanced taste-masking structure compared to the polymer-free formulation of Brand Z. These polymers create a viscoelastic matrix that hinders the diffusion of active pharmaceutical ingredients to taste receptors while sustaining competitive sweetness masking at formulation-relevant excipient concentrations. Brand Z, which utilizes only sorbitol, glycerol, and saccharin without a viscosity-building polymer network, consistently exhibits higher bitterness scores across all dilution conditions. This underscores that sweetener-based masking alone is inadequate to maintain robust palatability under the diluting and pH-modifying conditions of the oral cavity. From a formulation science perspective, these findings highlight the incorporation of cellulosic polymers as a crucial design element for enhancing taste-masking efficacy in oral pediatric liquids.
The pH-stratified evaluation reveals a significant and previously undocumented feature of HBB syrup palatability: the palatability hierarchy Y > X > Z was maintained consistently across the full physiological salivary pH range evaluated (pH 6.2, 6.8, and 7.4), demonstrating the robust and sustained superiority of Brand Y's HPMC-based taste-masking system relative to Brand X's HEC-based system and Brand Z's sweetener-only formulation. This consistent hierarchy confirms that HPMC provides more resilient taste-masking protection than HEC across all biorelevant conditions tested. Notably, at 2 mL pH 7.4 PBS (Batch G), Brand X exhibited substantially higher ANS sweetness scores (7.7–7.8) relative to Brand Y (6.2–6.4), reflecting the differential sensitivity of the saccharin-only sweetener system in Brand X to the ionic conditions created by near-neutral PBS. Despite this stronger sweetness response, Brand X's overall palatability remained inferior to Brand Y's, as evidenced by consistently higher SCS bitterness scores. These findings demonstrate that taste-masking efficiency must be evaluated across the full physiological pH range and salivary volume spectrum to be meaningful. Single-pH assessments or evaluations of undiluted formulations do not adequately predict in-use palatability across diverse patient populations
The comparison with pure HBB API data indicates that all three commercial formulations offer partial taste masking; however, this masking diminishes progressively under biorelevant dilution conditions. The Alpha Astree II electronic tongue demonstrates cumulative PCA variance contributions exceeding 85% across all datasets, alongside pattern discrimination indices ranging from 85.82% to 99.72%. This establishes it as a sensitive and reliable instrument for identifying dilution- and pH-dependent sensory changes, making it highly suitable for biorelevant palatability assessment in pharmaceutical development.
Collectively, these findings have direct implications for the development of robust oral liquid formulations for pediatric use. Taste-masking strategies that incorporate film-forming cellulosic polymers, which maintain protective viscoelastic properties under oral dilution conditions, demonstrate superior resilience across the physiological pH range. Formulations intended for use across a wide age range, from young children (salivary pH 6.2–6.8) to adolescents and adults (pH 7.4–7.6), should be evaluated under the full spectrum of biorelevant oral conditions, including pH-stratified simulated saliva, to ensure that palatability specifications are met in use. Future work should include evaluating alternative cellulosic and non-cellulosic polymer grades, investigating additional taste-masking technologies, such as cyclodextrin complexation, and validating e-tongue palatability data against pediatric sensory panels to establish definitive in vitro–in vivo correlations for HBB oral liquid formulations.
Conflicts of Interests
The author(s) declared no conflict of interest.
Author Contributions
Omobolanle A. Omoteso: Writing - original draft preparation, Visualization, Validation, Project administration, Methodology, Formal analysis and Investigation, Data curation, Formatting of manuscript to journal`s specification, Writing- review and editing, Final revision of manuscript. Handsome Ndlovu - Methodology. Sandile M. Khamanga - Supervision, Resources, Funding acquisition, Conceptualization. Roderick B. Walker – Writing- review and editing, Supervision, Resources, Project administration, Funding acquisition, Conceptualization.
Funding
Sandile M. Khamanga and Roderick B. Walker express gratitude for the financial assistance provided by Rhodes University, South Africa. Omobolanle A. Omoteso recognizes financial support from Rhodes University, South Africa, for a Postdoctoral Fellowship (2025-2026). Sandile M. Khamanga also acknowledges assistance from the NRF NEP grant in South Africa.
Acknowledgments
We appreciate Aspen Pharmacare for their kind donation and Rhodes University for their continuous support.
References
- Adamkiewicz, L.; Szeleszczuk, Ł. Review of applications of cyclodextrins as taste-masking excipients for pharmaceutical purposes. Molecules 2023, 28(19), 6964. [Google Scholar] [CrossRef] [PubMed]
- Anderson, P.; Hector, M.P.; Rampersad, M.A. Critical pH in resting and stimulated whole saliva in groups of children and adults. Int J Paediatr Dent. 2001, 11(4), 266–273. [Google Scholar] [CrossRef] [PubMed]
- Bai, J.; Yang, Z.; Luo, W.; Zhu, Y.; Zhao, Y.; Pan, B.; Zhang, J.; Zhu, L.; Huang, S.; Xiao, X. Influences of Lactiplantibacillus plantarum dy-1 fermentation on the bitterness of bitter melon juice, the composition of saponin compounds, and their bioactivities. Foods 2024, 13(20), 3341. [Google Scholar] [CrossRef] [PubMed]
- Bakker, E.; Bühlmann, P.; Pretsch, E. Carrier-based ion-selective electrodes and bulk optodes. 1. General characteristics. Chem Rev. 1997, 97(8), 3083–132. [Google Scholar] [CrossRef] [PubMed]
- Bechir, F.; Pacurar, M.; Tohati, A.; Bataga, S.M. Comparative study of salivary pH, buffer capacity, and flow in patients with and without gastroesophageal reflux disease. Int J Environ Res Public Health 2021, 19(1), 201. [Google Scholar] [CrossRef] [PubMed]
- Chaudhari, N.; Roper, S.D. The cell biology of taste. The Journal of Cell Biology 2010, 190(3), 285–296. [Google Scholar] [CrossRef] [PubMed]
- Choi, Y.; Wong, R.R.; Cha, Y.K.; Park, T.H.; Kim, Y.; Chung, S.J. Sweet–bitter taste interactions in binary mixtures of sweeteners. Food Chem. 2024, 459, 140343. [Google Scholar] [CrossRef] [PubMed]
- Claussen, F.; Al-Gousous, J.; Salehi, N.; Garcia, M.A.; Amidon, G.L.; Langguth, P. Solubility vs dissolution in physiological bicarbonate buffer. Pharm Res. 2024, 41(5), 937–945. [Google Scholar] [CrossRef] [PubMed]
- Corsetti, M.; Forestier, S.; Jiménez, M. Hyoscine butylbromide mode of action on bowel motility: From pharmacology to clinical practice. Neurogastroenterol Motil 2023, 35(4), e14451. [Google Scholar] [CrossRef] [PubMed]
- Coupland, J.N.; Hayes, J.E. Physical Approaches to Masking Bitter Taste: Lessons from Food and Pharmaceuticals: Coupland and Hayes. Pharm Res. 2014, 31(11), 2921–2939. [Google Scholar] [CrossRef] [PubMed]
- Da Conceicao Neta, E.R.; Johanningsmeier, S.D.; McFeeters, R.F. The chemistry and physiology of sour taste — a review. J Food Sci. 2007, 72(2), R33–R38. [Google Scholar] [CrossRef] [PubMed]
- El-Sahn, M.; Elliott, R.; El-Sahn, M.; Lucas, I.; Kong, K.; Walsh, J.; Lucas, J. Poor-tasting pediatric medicines: Part 2. Exploring caregiver and healthcare provider values and preferences for a novel taste-blocker product to improve acceptability. Front Drug Deliv. 2025, 5, 1555522. [Google Scholar] [CrossRef] [PubMed]
- Food and Drug Administration. Use of liquids and/or soft foods as vehicles for drug administration: General considerations for selection and in vitro methods for product quality assessments. Maryland, USA: Center for Drug Evaluation and Research (CDER), Food and Drug Administration. 2018. Available online: https://www.fda.gov/regulatory-information/search-fda-guidance-documents/use-liquids-andor-soft-foods-vehicles-drug-administration-general-considerations-selection-and-vitro (accessed on 27 March 2026).
- Gaohua, L.; Miao, X.; Dou, L. Crosstalk of physiological pH and chemical pKa under the umbrella of physiologically based pharmacokinetic modeling of drug absorption, distribution, metabolism, excretion, and toxicity. Expert Opin Drug Metab Toxicol 2021, 17(9), 1103–1124. [Google Scholar] [CrossRef] [PubMed]
- Gittings, S.; Turnbull, N.; Henry, B.; Roberts, C.J.; Gershkovich, P. Characterisation of human saliva as a platform for oral dissolution medium development. Eur J Pharm Biopharm. 2015, 91, 16–24. [Google Scholar] [CrossRef] [PubMed]
- Gongoni, J.L.; Medeiros, M.; Azevedo, H.; de Araújo, M.M. Electrochemical Sensors as a Tool for Taste Perception in Pharmaceutical Products: Advances and Perspectives. Biosensors 2026, 16(2), 84. [Google Scholar] [CrossRef] [PubMed]
- Gvozdeva, Y.; Staynova, R. Choosing the “Ideal” Oral Dosage Form for Pediatric Patients: Parents’ Perspectives on Children’s Preferences with a Focus on Orodispersible Tablets. Children 2025, 12(9), 1187. [Google Scholar] [CrossRef] [PubMed]
- He, S.; Mu, H. Microenvironmental pH modification in buccal/sublingual dosage forms for systemic drug delivery. Pharmaceutics 2023, 15(2), 637. [Google Scholar] [CrossRef] [PubMed]
- Hyodo, A.; Mikami, A.; Horie, K.; Mitoh, Y.; Ninomiya, Y.; Iida, S.; Yoshida, R. Salivary buffering capacity is correlated with umami but not sour taste sensitivity in healthy adult Japanese subjects. Arch Oral Biol. 2024, 165, 106013. [Google Scholar] [CrossRef] [PubMed]
- Ishida, M.; Ide, H.; Arima, K.; Zhao, Z.; Matsui, T.; Toko, K. Identification of the principle of taste sensors to detect non-charged bitter substances by 1H-NMR measurement. Sensors 2022, 22(7), 2592. [Google Scholar] [CrossRef] [PubMed]
- Khattab, I.S.; Zaghloul, A.A.; Afouna, M.I. Studies on the development of rapidly disintegrating hyoscine butylbromide tablets. DDT 2007, 1(1), 61–64. [Google Scholar]
- Kim, Y.; Gumpper, R.H.; Liu, Y.; Kocak, D.D.; Xiong, Y.; Cao, C.; Deng, Z.; Krumm, B.E.; Jain, M.K.; Zhang, S.; Jin, J. Bitter taste receptor activation by cholesterol and an intracellular tastant. Nature 2024, 628(8008), 664–71. [Google Scholar] [CrossRef] [PubMed]
- Krieg, B.J.; Taghavi, S.M.; Amidon, G.L.; Amidon, G.E. In vivo predictive dissolution: comparing the effect of bicarbonate and phosphate buffer on the dissolution of weak acids and weak bases. J Pharm Sci. 2015, 04(9), 2894–2904. [Google Scholar] [CrossRef] [PubMed]
- Lambros, M.; Tran, T.; Fei, Q.; Nicolaou, M. Citric acid: A multifunctional pharmaceutical excipient. Pharmaceutics 2022, 14(5), 972. [Google Scholar] [CrossRef] [PubMed]
- Li, X.; Gao, X.; Liu, R.; Wang, J.; Wu, Z.; Zhang, L.; Li, H.; Gui, X.; Kang, B.; Shi, J. Optimization and validation of the protocol used to analyze the taste of traditional Chinese medicines using an electronic tongue. Exp Ther Med. 2016, 12(5), 2949–2957. [Google Scholar] [CrossRef] [PubMed]
- Lorenz, J.K.; Reo, J.P.; Hendl, O.; Worthington, J.H.; Petrossian, V.D. Evaluation of a taste sensor instrument (electronic tongue) for use in formulation development. Int J Pharm. 2009, 367(1-2), 65–72. [Google Scholar] [CrossRef] [PubMed]
- Martir, J.; Flanagan, T.; Mann, J.; Fotaki, N. Co-administration of Pediatric medicines with food and drinks in the context of their physicochemical properties — a global perspective on practices and recommendations. AAPS J 2020, 22(2), 34. [Google Scholar] [CrossRef] [PubMed]
- Melis, M.; Tomassini Barbarossa, I. Taste perception of sweet, sour, salty, bitter, and umami and changes due to l-arginine supplementation, as a function of genetic ability to taste 6-n-propylthiouracil. Nutrients 2017, 9(6), 541. [Google Scholar] [CrossRef] [PubMed]
- Mennella, J.A.; Roberts, K.M.; Mathew, P.S.; Reed, D.R. Children’s perceptions about medicines: individual differences and taste. BMC Pediatrics 2015, 15(1), 130. [Google Scholar] [CrossRef] [PubMed]
- Meyers, R.S. The past, present, and future of oral dosage forms for children. The Journal of Pediatric Pharmacol Ther. 2024, 29(1), 22–31. [Google Scholar] [CrossRef] [PubMed]
- Nam, S.H.; Lee, J.; Kim, E.; Koo, J.W.; Shin, Y.; Hwang, T.M. Electronic tongue for the simple and rapid determination of taste and odor compounds in water. Chemosphere 2023, 338, 139511. [Google Scholar] [CrossRef] [PubMed]
- Ni'ma, N.S. The Bright Side and the Dark Side of Scopolamine (Pharmacology, Toxicology, and Clinical Use Review). J Sci Technol Res Pharm. 2022, 2(1), 18–25. [Google Scholar] [CrossRef]
- Oliva, A.; Llabrés, M. New Quality-Range-setting method based on between-and within-batch variability for biosimilarity assessment. Pharmaceuticals 2021, 14(6), 527. [Google Scholar] [CrossRef] [PubMed]
- Omoteso, O.A.; Ndlovu, H.; Khamanga, S.M.; Walker, R.B. The palatability of commercially available hyoscine butyl bromide syrups for pediatric use in South Africa: Comparative assessment using an electronic tongue. Pharm Dev Technol. 2026a, 1–18. [Google Scholar] [CrossRef] [PubMed]
- Omoteso, O.A.; Ndlovu, H.; Sethoga, L.; Khamanga, S.M.; Walker, R.B. Application of an Electronic Tongue for Taste Assessment of Some Brands of Commercially Available Milk in South Africa: A Comparative Analysis. Appl Food Res. 2026b, 20, 101922. [Google Scholar] [CrossRef]
- Pein, M.; Preis, M.; Eckert, C.; Kiene, F.E. Taste-masking assessment of solid oral dosage forms–a critical review. Int J Pharm. 2014, 465(1-2), 239–254. [Google Scholar] [CrossRef] [PubMed]
- Peña, D.E.; Morgan, J.A.; Howard, A.K. Pediatric Prescribers’ Knowledge of the Ew Meds™ List and Taste Masking. J Pediatr Pharmacol Ther. 2024, 29(6), 624–629. [Google Scholar] [CrossRef] [PubMed]
- Peng, Y.; Zhang, H.; Gao, L.; Wang, X.; Peng, X. Palatability assessment of carbocysteine oral solution strawberry taste versus carbocysteine oral solution mint taste: a blinded randomized study. Front Pharmacol. 2022, 13, 822086. [Google Scholar] [CrossRef] [PubMed]
- Podrażka, M.; Bączyńska, E.; Kundys, M.; Jeleń, P.S.; Witkowska Nery, E. Electronic tongue - A tool for all tastes? Biosensors 2017, 8(1), 3. [Google Scholar] [CrossRef] [PubMed]
- Ranmal, S.R.; Nhouchi, Z.; Keeley, A.; Adler, L.; Lavarde, M.; Pensé-Lhéritier, A.M.; Tuleu, C. Taste assessment for pediatric drug Development: A comparison of bitterness taste aversion in children versus Naïve and expert young adult assessors. Int J Pharm. 2023, 647, 123494. [Google Scholar] [CrossRef] [PubMed]
- Ranmal, S.R.; Walsh, J.; Tuleu, C. Poor-tasting pediatric medicines: Part 1. A scoping review of their impact on patient acceptability, medication adherence, and treatment outcomes. Front Drug Deliv. 2025, 5, 1553286. [Google Scholar] [CrossRef] [PubMed]
- Sanjay, L.R.; Ashokbhai, M.K.; Ghatole, S.; Roy, S.; Kashinath, K.P.; Kaity, S. Strategies for beating the bitter taste of pharmaceutical formulations towards better therapeutic outcomes. RSC Pharm. 2025, 2(1), 59–81. [Google Scholar] [CrossRef]
- Schluterman, H.M.; Linardos, C.G.; Drulia, T.; Marshall, J.D.; Kearns, G.L. Evaluating palatability in young children: a mini-review of relevant physiology and assessment techniques. Front Pediatr. 2024, 12, 1350662. [Google Scholar] [CrossRef] [PubMed]
- Steiner, D.; Meyer, A.; Immohr, L.I.; Pein-Hackelbusch, M. Critical view on the qualification of electronic tongues regarding their performance in the development of peroral drug formulations with bitter ingredients. Pharmaceutics 2024, 6(5), 658. [Google Scholar] [CrossRef] [PubMed]
- Sultanoğlu, H.; Safi, Y.; Demirel, M.E.; Demir, M.C.; Altinsoy, B.K.; Boğan, M.; Gümüşboğa, H. Comparison of paracetamol and hyoscine-N-butylbromide in the treatment of abdominal pain and cramps due to acute gastroenteritis. IMCJMS 2022, 16(1), 009. [Google Scholar] [CrossRef]
- Sruthi, P.; Asha, M.R.; YanMiya, S.K.; Naidu, M.M. Characterization and storage stability of milk pudding incorporated with cashew nut (Anacardium occidentale L.) testa phenolic extract. J Food Meas Charact. 2024, 18(7), 5826–5843. [Google Scholar] [CrossRef]
- Toko, K.; Hara, D.; Tahara, Y.; Yasuura, M.; Ikezaki, H. Relationship between the amount of bitter substances adsorbed onto lipid/polymer membrane and the electric response of taste sensors. Sensors 2014, 14(9), 16274–86. [Google Scholar] [CrossRef] [PubMed]
- Tong, A.; Yang, H.; Yu, X.; Wang, D.; Guan, J.; Zhao, M.; Li, J. Mechanisms and novel therapeutic roles of bitter taste receptors in diseases. Theranostics 2025, 15(9), 3961. [Google Scholar] [CrossRef] [PubMed]
- Van Riet-Nales, D.A.; Wang, S.; Saint-Raymond, A.; Robert, J.L. The EMA quality guideline on the pharmaceutical development of medicines for pediatric use. Int J Pharm. 2012, 435(2), 132–134. [Google Scholar] [CrossRef] [PubMed]
- Vázquez Frias, R.; Hoerning, A.; Boggio Marzet, C.; Michel, M.C. A Comprehensive Review of the Effects of Hyoscine Butylbromide in Childhood. J Clin Med. 2025, 14(9), 3009. [Google Scholar] [CrossRef] [PubMed]
- Vlad, R.A.; Pintea, A.; Pintea, C.; Rédai, E.M.; Antonoaea, P.; Bîrsan, M.; Ciurba, A. Hydroxypropyl methylcellulose—a key excipient in pharmaceutical drug delivery systems. Pharmaceutics 2025, 17(6), 784. [Google Scholar] [CrossRef] [PubMed]
- Wu, Z.; Zhao, K. Impact of pulsation rate and viscosity on taste perception–Application of a porous medium model for human tongue surface. Comput Biol Med. 2021, 134, 104419. [Google Scholar] [CrossRef] [PubMed]
- Ç, Yildirim; Günaydin gü, Pamukçu. Hyoscine-n-butylbromide in treating abdominal pain caused by gastroenteritis: a double-blind randomized placebo-controlled study. Turk J Medi Sci. 2024, 54(5), 887–92. [Google Scholar] [CrossRef] [PubMed]
- Zaid, A.N.; Al Ramahi, R.; AlKilany, A.; Abu-Khalaf, N.; El Kharouf, M.; Dayeh, D.A.; Al-Omari, L.; Yaqoup, M. Following drug degradation and consequent taste deterioration of an oral reconstituted pediatric suspension during dosing interval via electronic tongue. Saudi Pharm J. 2022, 30(5), 555–561. [Google Scholar] [CrossRef] [PubMed]
- Zhang, D.; Jiang, H.; Chen, J.; Wang, X. Buffering capacity of saliva influences the perception of acid-related sensory properties. Food Qual Prefer 2022, 97, 104454. [Google Scholar] [CrossRef]
- Zhang, N.; Casasent, T.D.; Casasent, A.K.; Kumar, S.V.; Wakefield, C.; Broom, B.M.; Weinstein, J.N.; Akbani, R. PCA-Plus: Enhanced principal component analysis with illustrative applications to batch effects and their quantitation. BioRxiv 2024, 2024.01.02.573793. [Google Scholar] [CrossRef] [PubMed]
- Zhao, Z.; Song, F.; Kimura, S.; Onodera, T.; Uchida, T.; Toko, K. Assessment of bitterness in non-charged pharmaceuticals with a taste sensor: A study on substances with xanthine scaffold and allopurinol. Molecules 2024, 29(11), 2452. [Google Scholar] [CrossRef] [PubMed]
Figure 1.
a. Three-dimensional PCA score plot of Alpha Astree II e-tongue sensor responses for Batch B samples compared to Batch A (PC1 = 81.938%, PC2 = 10.882%, PC3 = 3.654%; total = 96.474%). b. Two-dimensional DFA score plot of Alpha Astree II e-tongue sensor responses for Batch B samples compared to Batch A (DF1 = 88.348%, DF2 = 10.697%; total = 99.045%).The distance bar chart (Figure 2) presents the pairwise Euclidean distances and PDI (pattern discrimination index) values between all sample combinations for Batch B; key inter-group comparisons are summarised below. This distance bar chart revealed minimal intra-brand distances for water-diluted samples X1/X2/X3 and Y1/Y2/Y3, confirming intra-brand taste consistency following water dilution. A slight divergence was observed for Brand Z, with Z1 differing from Z2 and Z3. Analysis of inter-group distances between diluted and undiluted samples revealed significant taste divergence for X2H20 vs X2PURE (PDI = 87.70%), X3H20 vs X3PURE (PDI = 91.97%), Y1H20 vs Y1PURE (PDI = 93.96%), and Y2H20 vs Y2PURE (PDI = 90.04%), while moderate divergence was observed for X1H20 vs X1PURE (PDI = 42.50%) and Y3H20 vs Y3PURE (PDI = 47.30%).
Figure 1.
a. Three-dimensional PCA score plot of Alpha Astree II e-tongue sensor responses for Batch B samples compared to Batch A (PC1 = 81.938%, PC2 = 10.882%, PC3 = 3.654%; total = 96.474%). b. Two-dimensional DFA score plot of Alpha Astree II e-tongue sensor responses for Batch B samples compared to Batch A (DF1 = 88.348%, DF2 = 10.697%; total = 99.045%).The distance bar chart (Figure 2) presents the pairwise Euclidean distances and PDI (pattern discrimination index) values between all sample combinations for Batch B; key inter-group comparisons are summarised below. This distance bar chart revealed minimal intra-brand distances for water-diluted samples X1/X2/X3 and Y1/Y2/Y3, confirming intra-brand taste consistency following water dilution. A slight divergence was observed for Brand Z, with Z1 differing from Z2 and Z3. Analysis of inter-group distances between diluted and undiluted samples revealed significant taste divergence for X2H20 vs X2PURE (PDI = 87.70%), X3H20 vs X3PURE (PDI = 91.97%), Y1H20 vs Y1PURE (PDI = 93.96%), and Y2H20 vs Y2PURE (PDI = 90.04%), while moderate divergence was observed for X1H20 vs X1PURE (PDI = 42.50%) and Y3H20 vs Y3PURE (PDI = 47.30%).
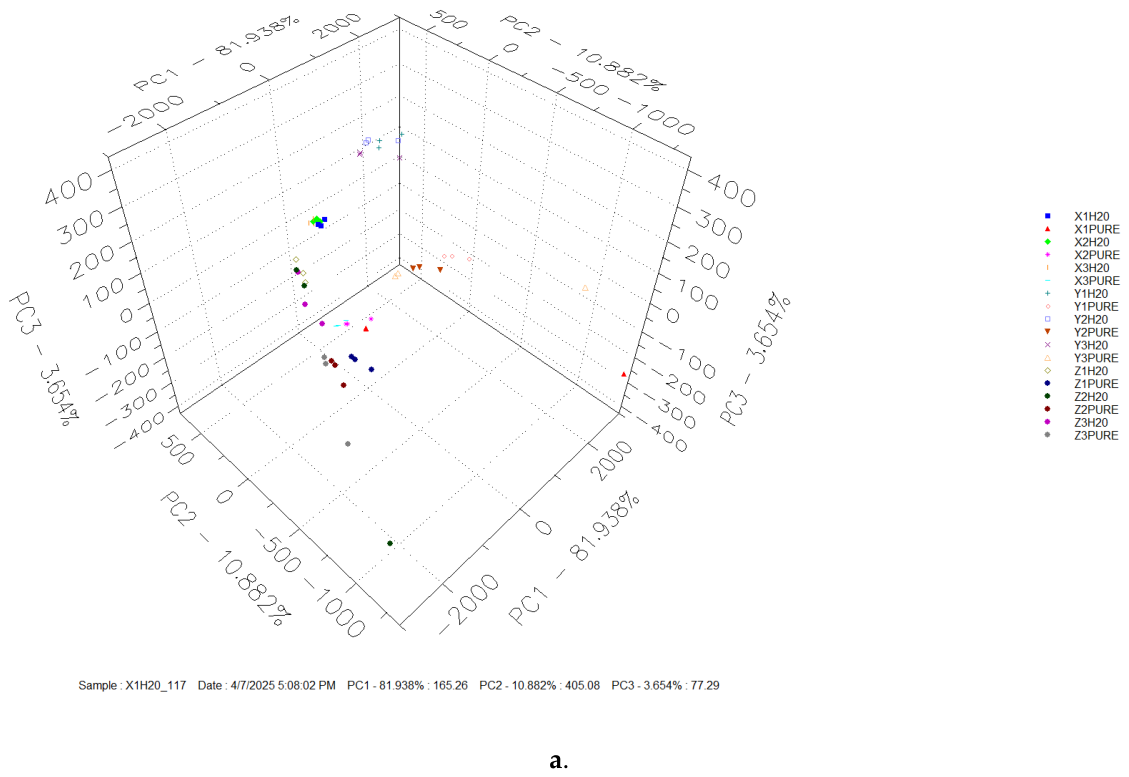
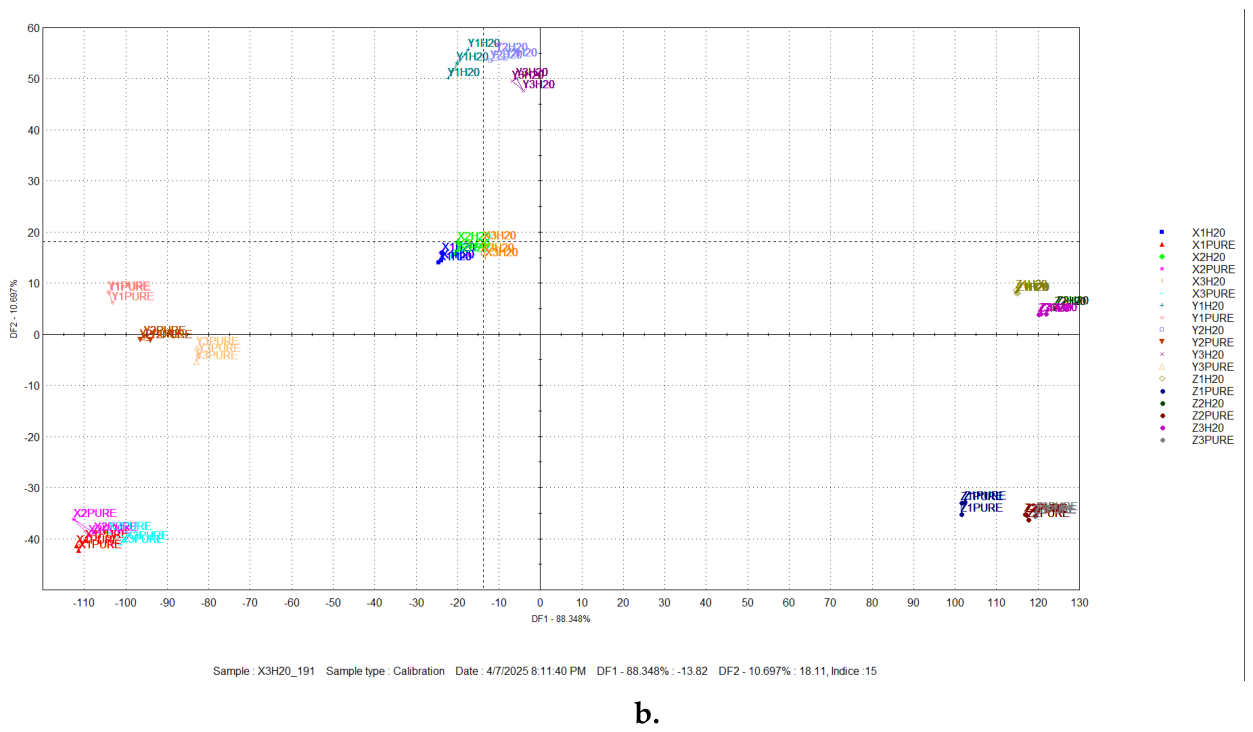
Figure 3.
Bar chart plot of sensor responses for Batch B samples compared to Batch A samples (n = 3 replicates).The primary taste variables driving post-dilution discrimination were the saltiness (CTS) score for Brand X and the sourness/acidity (AHS) score for Brand Y, as determined by taste-screening rankings (Table 4). Dilution of all HBB syrup brands with water increased bitterness and altered the sweetness and sourness profiles. Dilution of Brands X and Y revealed a decrease in sour (AHS) and increases in sweet (ANS) taste scores compared to undiluted samples, whereas Brand Z showed no change in AHS score on dilution with water, consistent with the pH-independence of Brand Z's sourness profile under water dilution, the citric acid monohydrate present in Brand Z contributes sourness at a fixed formulation pH that is not substantially altered by water dilution alone (Da Conceicao Neta et al., 2007; Lambros et al., 2022). The increase in sweetness (ANS) scores following dilution of Brand Y samples is notable and reflects the differential behavior of the sodium cyclamate–sorbitol–saccharin system in Brand Y relative to Brand X's saccharin-only system; at lower polymer concentrations, the sweetener contribution to the ANS sensor becomes more prominent relative to the polymer-dominated signal in the undiluted state. Diluting all three brands of HBB syrup with 20 mL of water produces a bitter-sweet taste profile, with bitterness predominating in Brand Z and sweetness partially compensating for it in Brands X and Y.
Figure 3.
Bar chart plot of sensor responses for Batch B samples compared to Batch A samples (n = 3 replicates).The primary taste variables driving post-dilution discrimination were the saltiness (CTS) score for Brand X and the sourness/acidity (AHS) score for Brand Y, as determined by taste-screening rankings (Table 4). Dilution of all HBB syrup brands with water increased bitterness and altered the sweetness and sourness profiles. Dilution of Brands X and Y revealed a decrease in sour (AHS) and increases in sweet (ANS) taste scores compared to undiluted samples, whereas Brand Z showed no change in AHS score on dilution with water, consistent with the pH-independence of Brand Z's sourness profile under water dilution, the citric acid monohydrate present in Brand Z contributes sourness at a fixed formulation pH that is not substantially altered by water dilution alone (Da Conceicao Neta et al., 2007; Lambros et al., 2022). The increase in sweetness (ANS) scores following dilution of Brand Y samples is notable and reflects the differential behavior of the sodium cyclamate–sorbitol–saccharin system in Brand Y relative to Brand X's saccharin-only system; at lower polymer concentrations, the sweetener contribution to the ANS sensor becomes more prominent relative to the polymer-dominated signal in the undiluted state. Diluting all three brands of HBB syrup with 20 mL of water produces a bitter-sweet taste profile, with bitterness predominating in Brand Z and sweetness partially compensating for it in Brands X and Y.
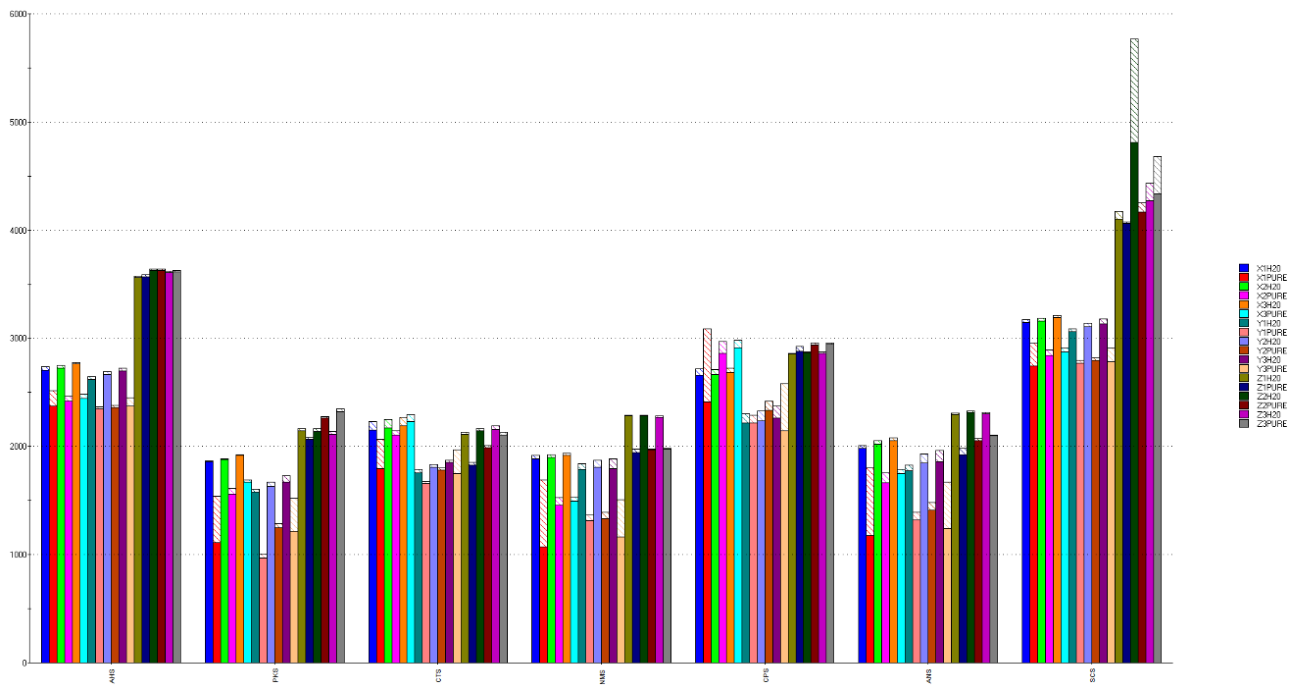
Figure 4.
a. Three-dimensional PCA score plot of Alpha Astree II e-tongue sensor responses across all PBS dilution conditions (Batches C–H; pH 6.2, 6.8, and 7.4 at 2 mL and 5 mL) for Brand X Batch 1 (X1), Brand Y Batch 1 (Y1), and Brand Z Batch 1 (Z1), including undiluted PURE references (PC1 = 66.2%, PC2 = 25.452%, PC3 = 4.616%; total = 96.268%). b. Two-dimensional DFA score plot of Alpha Astree II e-tongue sensor responses across all PBS dilution conditions (Batches C–H; pH 6.2, 6.8, and 7.4 at 2 mL and 5 mL) for Brand X Batch 1 (X1), Brand Y Batch 1 (Y1), and Brand Z Batch 1 (Z1), including undiluted PURE references (DF1 = 99.127%, DF2 = 0.769%; total = 99.896%).
Figure 4.
a. Three-dimensional PCA score plot of Alpha Astree II e-tongue sensor responses across all PBS dilution conditions (Batches C–H; pH 6.2, 6.8, and 7.4 at 2 mL and 5 mL) for Brand X Batch 1 (X1), Brand Y Batch 1 (Y1), and Brand Z Batch 1 (Z1), including undiluted PURE references (PC1 = 66.2%, PC2 = 25.452%, PC3 = 4.616%; total = 96.268%). b. Two-dimensional DFA score plot of Alpha Astree II e-tongue sensor responses across all PBS dilution conditions (Batches C–H; pH 6.2, 6.8, and 7.4 at 2 mL and 5 mL) for Brand X Batch 1 (X1), Brand Y Batch 1 (Y1), and Brand Z Batch 1 (Z1), including undiluted PURE references (DF1 = 99.127%, DF2 = 0.769%; total = 99.896%).
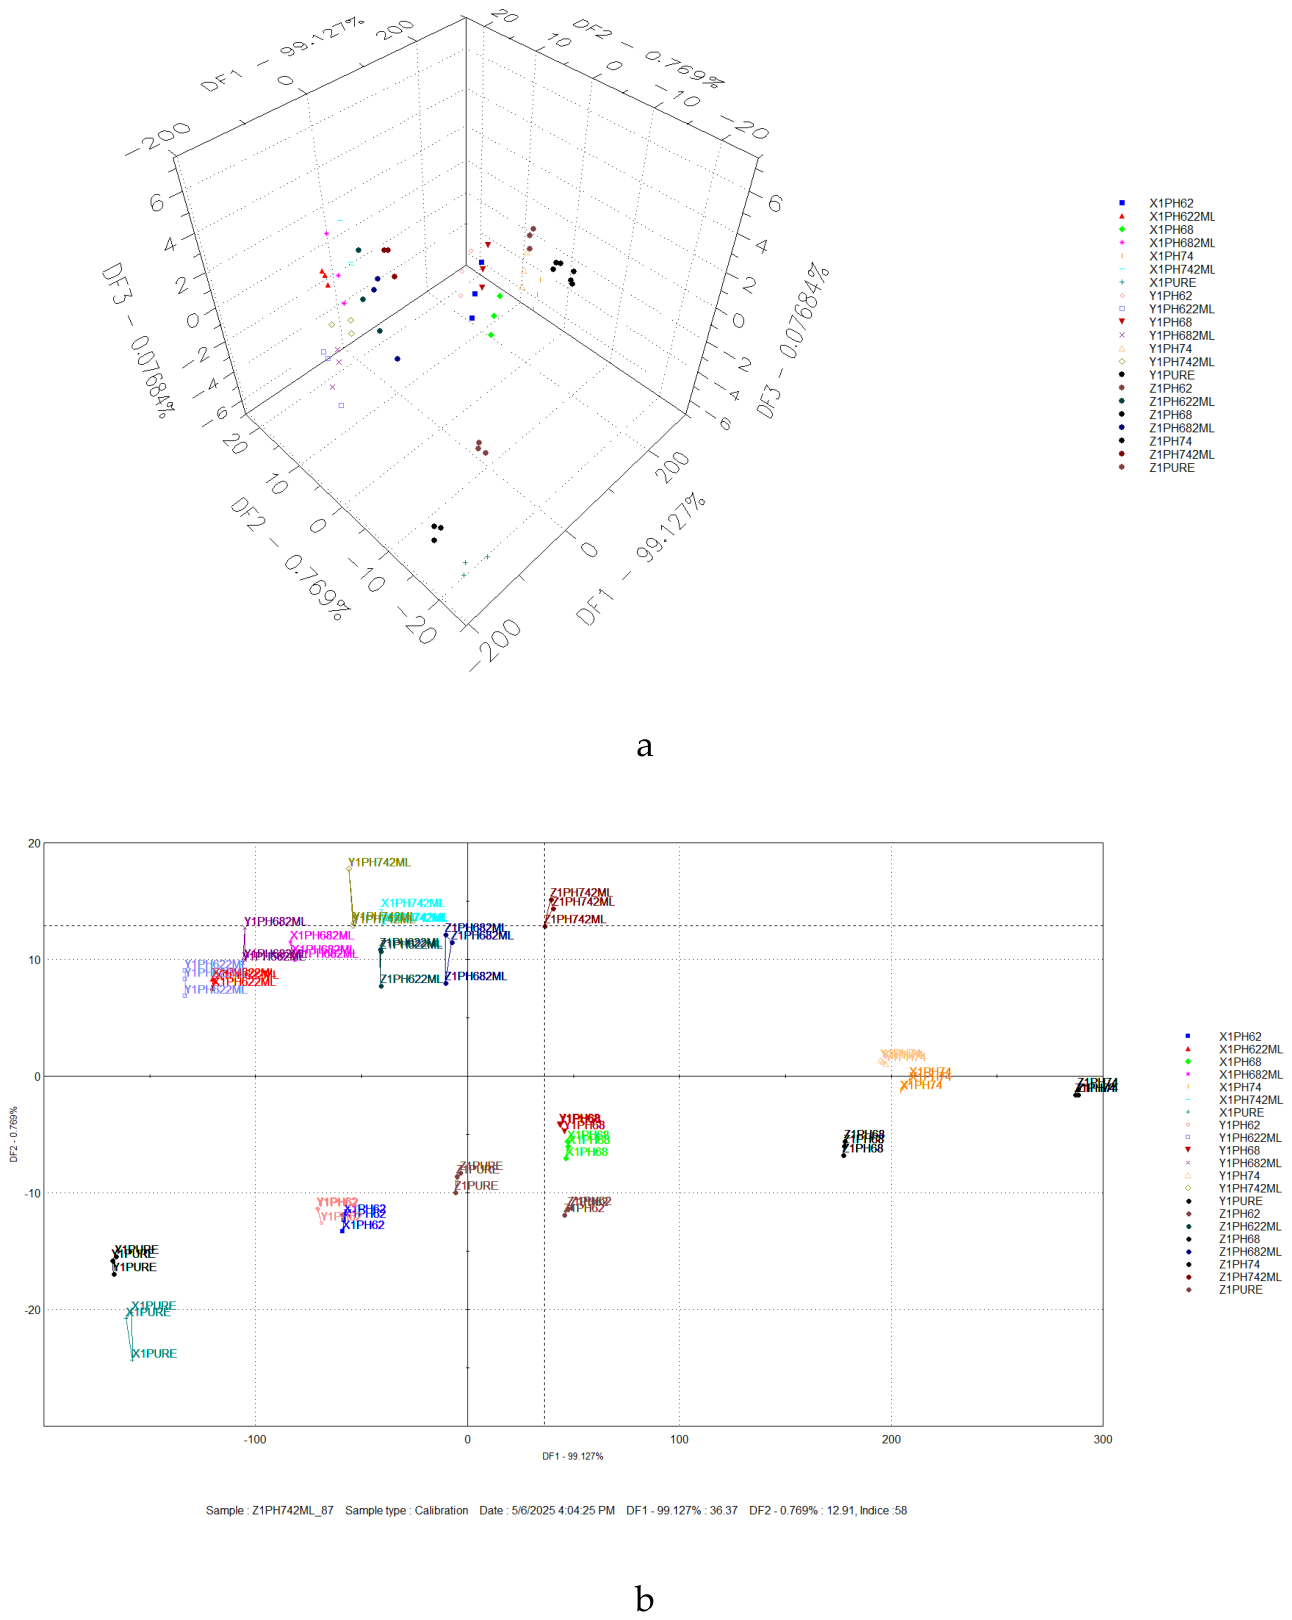
Figure 5.
a. Three-dimensional PCA score plot of Alpha Astree II e-tongue sensor responses for Batch C samples compared to Batch A (PC1 = 77.101%, PC2 = 14.651%, PC3 = 6.044%; total = 97.796%). b. Two-dimensional DFA score plot of Alpha Astree II e-tongue sensor responses for Batch C samples compared to Batch A (DF1 = 95.446%, DF2 = 4.327%; total = 99.773%).
Figure 5.
a. Three-dimensional PCA score plot of Alpha Astree II e-tongue sensor responses for Batch C samples compared to Batch A (PC1 = 77.101%, PC2 = 14.651%, PC3 = 6.044%; total = 97.796%). b. Two-dimensional DFA score plot of Alpha Astree II e-tongue sensor responses for Batch C samples compared to Batch A (DF1 = 95.446%, DF2 = 4.327%; total = 99.773%).
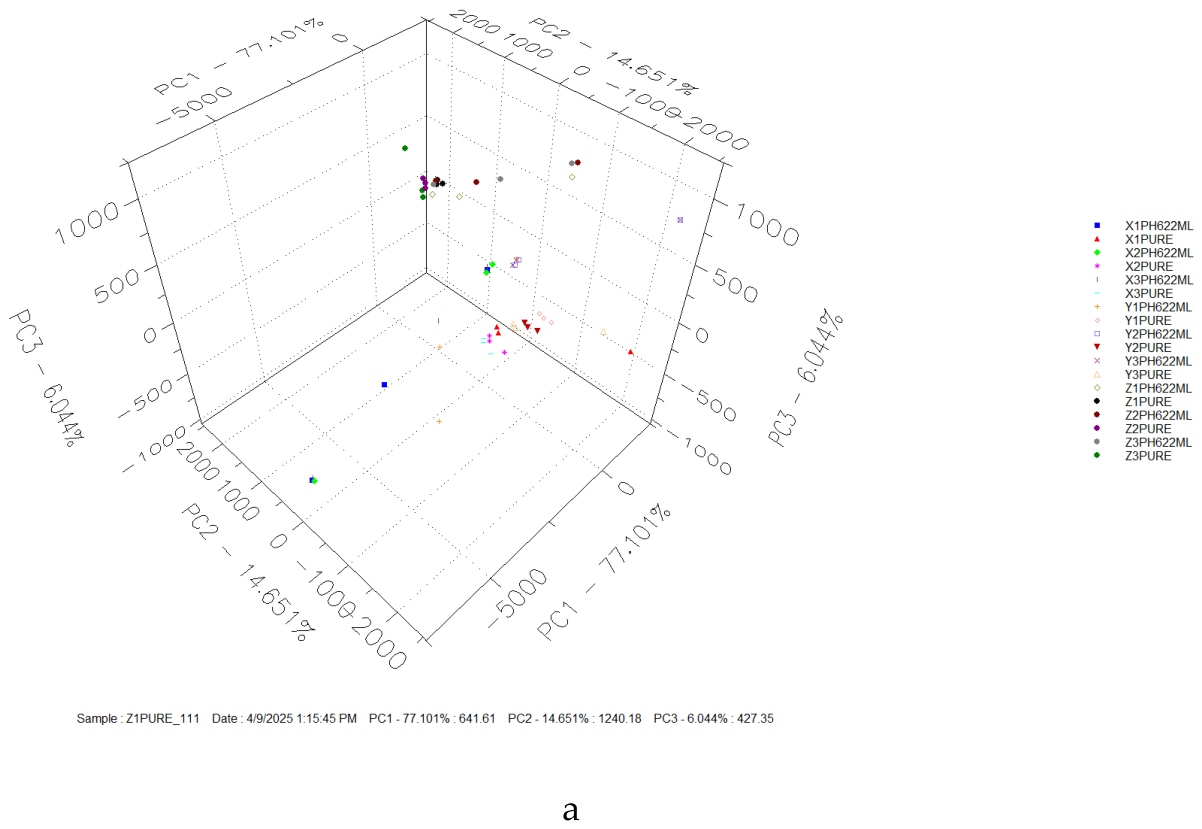
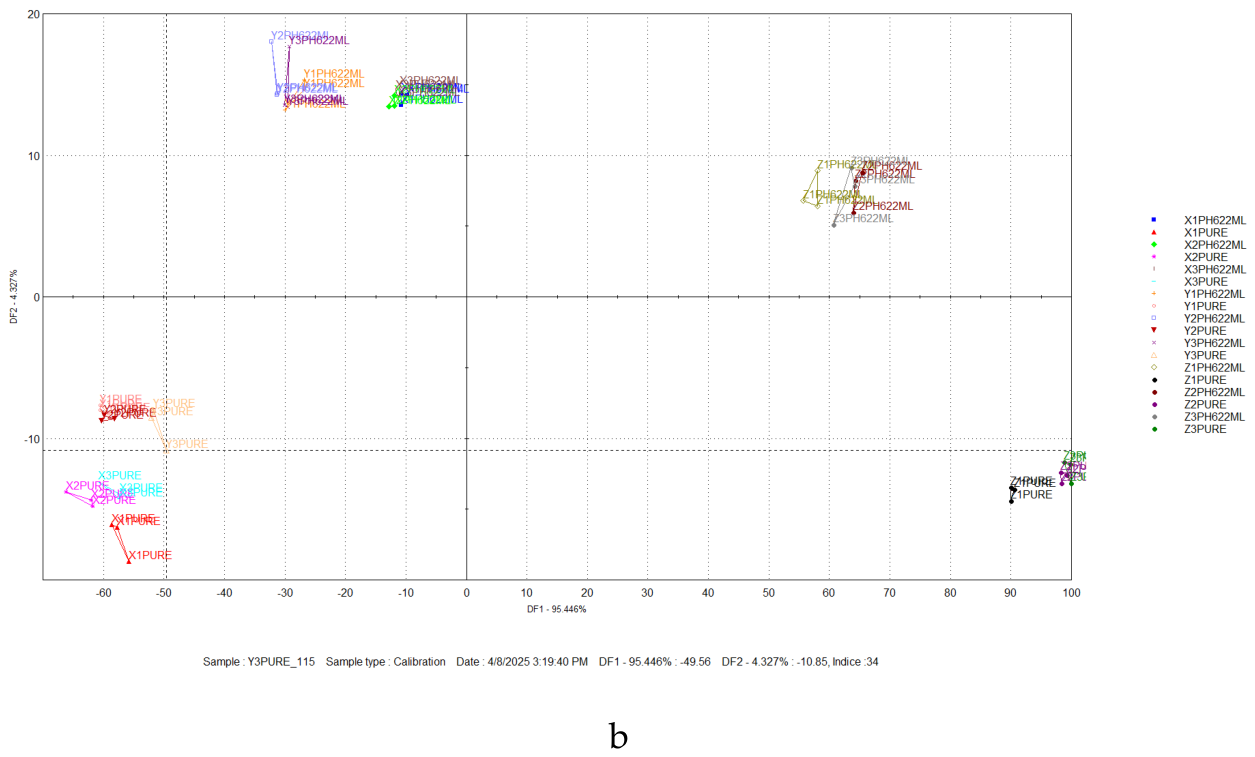
Figure 6.
Distance bar chart plot for Batch C samples compared to Batch A samples.
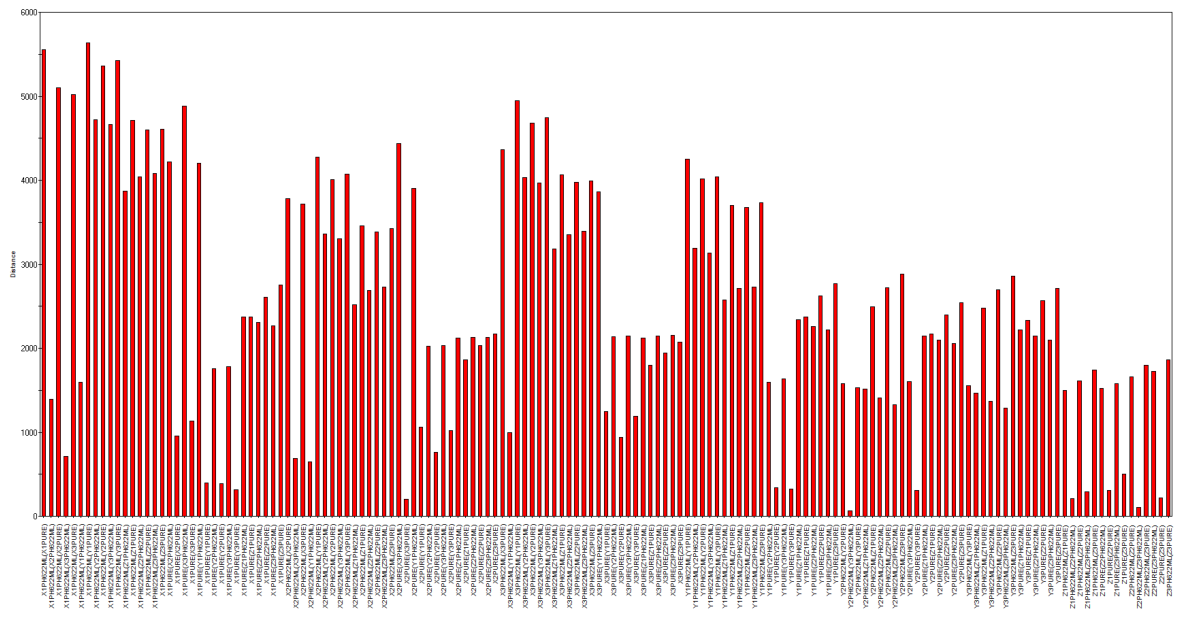
Figure 7.
Bar Chart plot of sensor responses for Batch C samples compared to Batch A samples (n = 3 replicates).The taste screening rankings for Batch D (Table 6) confirm that increasing PBS volume from 2 mL to 5 mL at pH 6.2 resulted in higher SCS bitterness and lower AHS sourness scores across all brands compared with Batch C, consistent with the ionic strength and buffering capacity mechanism described above. For Brand Z, higher PBS volume resulted in substantially elevated SCS scores (8.5–9.1 for Batch D versus 7.3–7.5 for Batch C; Table 5), further amplifying the bitterness already dominant in this polymer-free formulation as additional phosphate ions compete with and modify the sensor membrane response to dissolved HBB. For Brands X and Y, bitterness also increased with volume, though from a lower baseline, and AHS scores decreased, consistent with greater phosphate buffering of residual formulation acidity. Brand Y Batches 2 and 3 showed modest increases in ANS sweetness scores at 5 mL relative to 2 mL, reflecting the differential sensitivity of the sodium cyclamate–sorbitol–saccharin system to the altered ionic conditions created by larger PBS volumes; Brand Y Batch 1 and all Brand X samples showed decreased ANS scores at the higher volume. The palatability hierarchy under Batch D conditions remained Y > X > Z (Table 6), with the taste-masking advantage of cellulosic polymer-containing formulations preserved despite the more challenging biorelevant conditions imposed by increased simulated salivary volume.
Figure 7.
Bar Chart plot of sensor responses for Batch C samples compared to Batch A samples (n = 3 replicates).The taste screening rankings for Batch D (Table 6) confirm that increasing PBS volume from 2 mL to 5 mL at pH 6.2 resulted in higher SCS bitterness and lower AHS sourness scores across all brands compared with Batch C, consistent with the ionic strength and buffering capacity mechanism described above. For Brand Z, higher PBS volume resulted in substantially elevated SCS scores (8.5–9.1 for Batch D versus 7.3–7.5 for Batch C; Table 5), further amplifying the bitterness already dominant in this polymer-free formulation as additional phosphate ions compete with and modify the sensor membrane response to dissolved HBB. For Brands X and Y, bitterness also increased with volume, though from a lower baseline, and AHS scores decreased, consistent with greater phosphate buffering of residual formulation acidity. Brand Y Batches 2 and 3 showed modest increases in ANS sweetness scores at 5 mL relative to 2 mL, reflecting the differential sensitivity of the sodium cyclamate–sorbitol–saccharin system to the altered ionic conditions created by larger PBS volumes; Brand Y Batch 1 and all Brand X samples showed decreased ANS scores at the higher volume. The palatability hierarchy under Batch D conditions remained Y > X > Z (Table 6), with the taste-masking advantage of cellulosic polymer-containing formulations preserved despite the more challenging biorelevant conditions imposed by increased simulated salivary volume.
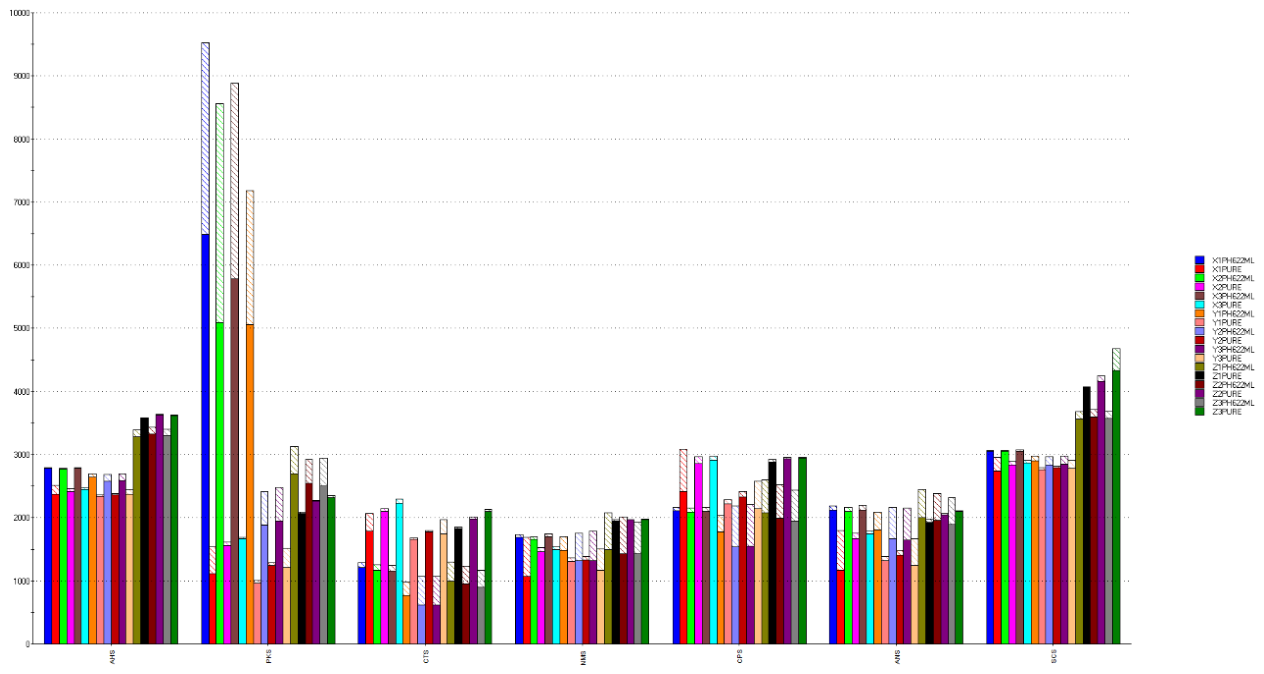
Figure 8.
a. Three-dimensional PCA score plot of Alpha Astree II e-tongue sensor responses for Batch E samples compared with Batch A (PC1 = 74.724%, PC2 = 12.857%, PC3 = 9.217%; total = 96.798%). b. Two-dimensional DFA score plot of Alpha Astree II e-tongue sensor responses for Batch E samples compared to Batch A (DF1 = 83.362%, DF2 = 15.321%; total = 98.683%).
Figure 8.
a. Three-dimensional PCA score plot of Alpha Astree II e-tongue sensor responses for Batch E samples compared with Batch A (PC1 = 74.724%, PC2 = 12.857%, PC3 = 9.217%; total = 96.798%). b. Two-dimensional DFA score plot of Alpha Astree II e-tongue sensor responses for Batch E samples compared to Batch A (DF1 = 83.362%, DF2 = 15.321%; total = 98.683%).
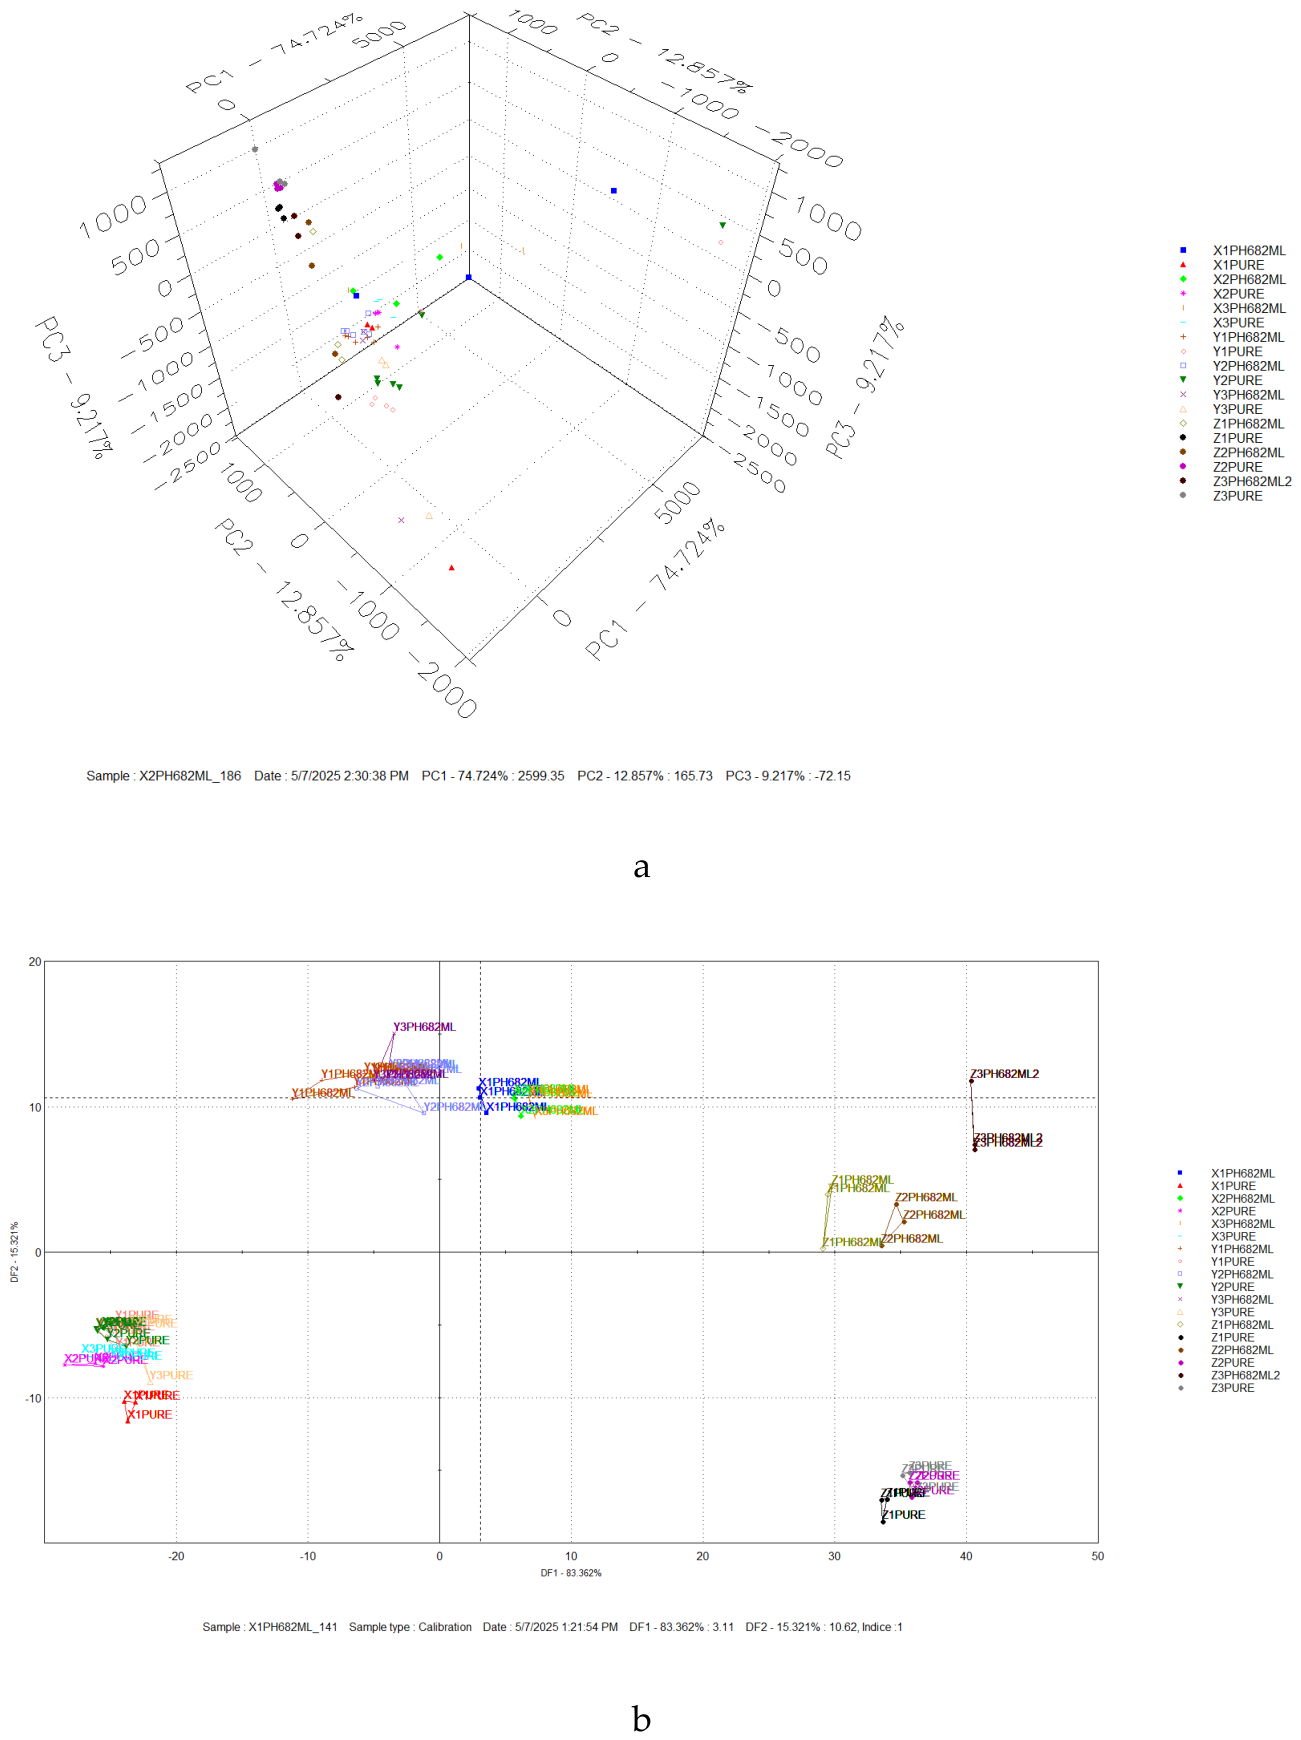
Figure 9.
Distance bar chart plot for Batch E samples compared to Batch A samples.
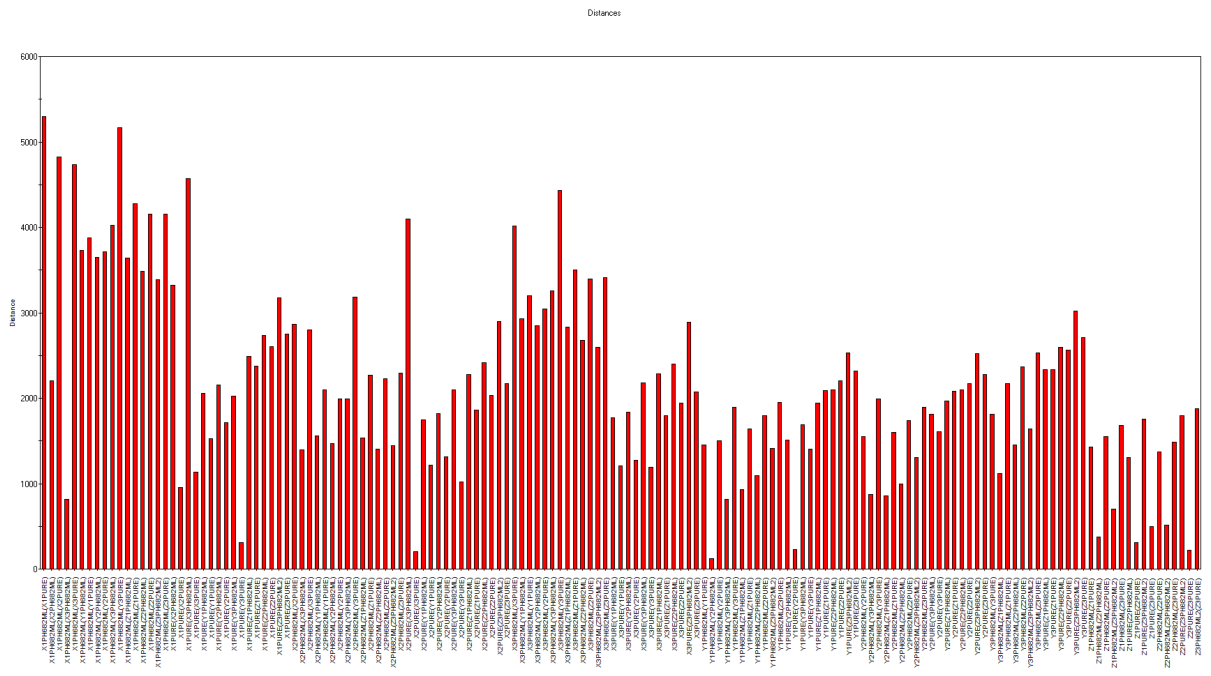
Figure 10.
Bar chart plot of sensor responses for Batch E samples compared to Batch A samples (n = 3 replicates).The taste screening rankings summarised in Table 7 confirmed that diluted Brand X and Y samples exhibited higher SCS and ANS scores than their undiluted counterparts. For Brand Z, Z3PH682ML recorded the highest SCS score among all PBS-diluted Brand Z batches (SCS = 8.9), though it remained lower than those of Z2PURE (9.3) and Z3PURE (10.0). The reduction in AHS scores for Brands X and Y upon dilution with 2 mL pH 6.8 PBS is mechanistically attributable to the phosphate buffering capacity of PBS, which neutralizes residual formulation acidity, reducing free proton activity at the AHS sensor surface (Krieg et al., 2015; Zhang et al., 2022). For Brand Z, the absence of a meaningful change in AHS on dilution reflects the near-complete neutralisation of citric acid monohydrate at PBS pH 6.8, at this pH, all three ionisation steps of citric acid (pKa values 3.13, 4.76, and 6.39) are substantially complete, leaving negligible titratable acidity to drive the AHS response (Lambros et al., 2022; Da Conceicao Neta et al., 2007). The elevated SCS scores for Brand Z relative to Brands X and Y across all Batch E samples confirm the continued absence of polymer-mediated taste-masking protection in this formulation under biorelevant pH 6.8 conditions. The primary taste contributor for Brand X at pH 6.8 was the PKS response for X1PH682ML and X3PH682ML, while ANS predominated for X2PH682ML; for Brand Y, ANS was the primary contributor for Y1PH682ML and Y2PH682ML, while NMS predominated for Y3PH682ML; and for Brand Z, the SCS bitterness response predominated across all three batches. The palatability hierarchy at pH 6.8 was Y > X > Z (Table 7), identical to that at pH 6.2, reflecting consistent taste-masking superiority of cellulosic polymer-containing formulations across the lower physiological salivary pH range. The increased SCS and ANS scores observed for Brands X and Y at pH 6.8 compared to pH 6.2 are consistent with the pH-dependent shift in phosphate speciation from H₂PO₄⁻ toward HPO₄²⁻, which increases ionic strength and modifies the Nernstian electrochemical response of the ChemFET sensor array to permanently charged cationic species, including dissolved HBB (Bakker et al., 1997; Toko, 2000; Gaohua et al., 2021; Gaohua et al., 2021; Krieg et al., 2015; Ishida et al., 2022).
Figure 10.
Bar chart plot of sensor responses for Batch E samples compared to Batch A samples (n = 3 replicates).The taste screening rankings summarised in Table 7 confirmed that diluted Brand X and Y samples exhibited higher SCS and ANS scores than their undiluted counterparts. For Brand Z, Z3PH682ML recorded the highest SCS score among all PBS-diluted Brand Z batches (SCS = 8.9), though it remained lower than those of Z2PURE (9.3) and Z3PURE (10.0). The reduction in AHS scores for Brands X and Y upon dilution with 2 mL pH 6.8 PBS is mechanistically attributable to the phosphate buffering capacity of PBS, which neutralizes residual formulation acidity, reducing free proton activity at the AHS sensor surface (Krieg et al., 2015; Zhang et al., 2022). For Brand Z, the absence of a meaningful change in AHS on dilution reflects the near-complete neutralisation of citric acid monohydrate at PBS pH 6.8, at this pH, all three ionisation steps of citric acid (pKa values 3.13, 4.76, and 6.39) are substantially complete, leaving negligible titratable acidity to drive the AHS response (Lambros et al., 2022; Da Conceicao Neta et al., 2007). The elevated SCS scores for Brand Z relative to Brands X and Y across all Batch E samples confirm the continued absence of polymer-mediated taste-masking protection in this formulation under biorelevant pH 6.8 conditions. The primary taste contributor for Brand X at pH 6.8 was the PKS response for X1PH682ML and X3PH682ML, while ANS predominated for X2PH682ML; for Brand Y, ANS was the primary contributor for Y1PH682ML and Y2PH682ML, while NMS predominated for Y3PH682ML; and for Brand Z, the SCS bitterness response predominated across all three batches. The palatability hierarchy at pH 6.8 was Y > X > Z (Table 7), identical to that at pH 6.2, reflecting consistent taste-masking superiority of cellulosic polymer-containing formulations across the lower physiological salivary pH range. The increased SCS and ANS scores observed for Brands X and Y at pH 6.8 compared to pH 6.2 are consistent with the pH-dependent shift in phosphate speciation from H₂PO₄⁻ toward HPO₄²⁻, which increases ionic strength and modifies the Nernstian electrochemical response of the ChemFET sensor array to permanently charged cationic species, including dissolved HBB (Bakker et al., 1997; Toko, 2000; Gaohua et al., 2021; Gaohua et al., 2021; Krieg et al., 2015; Ishida et al., 2022).
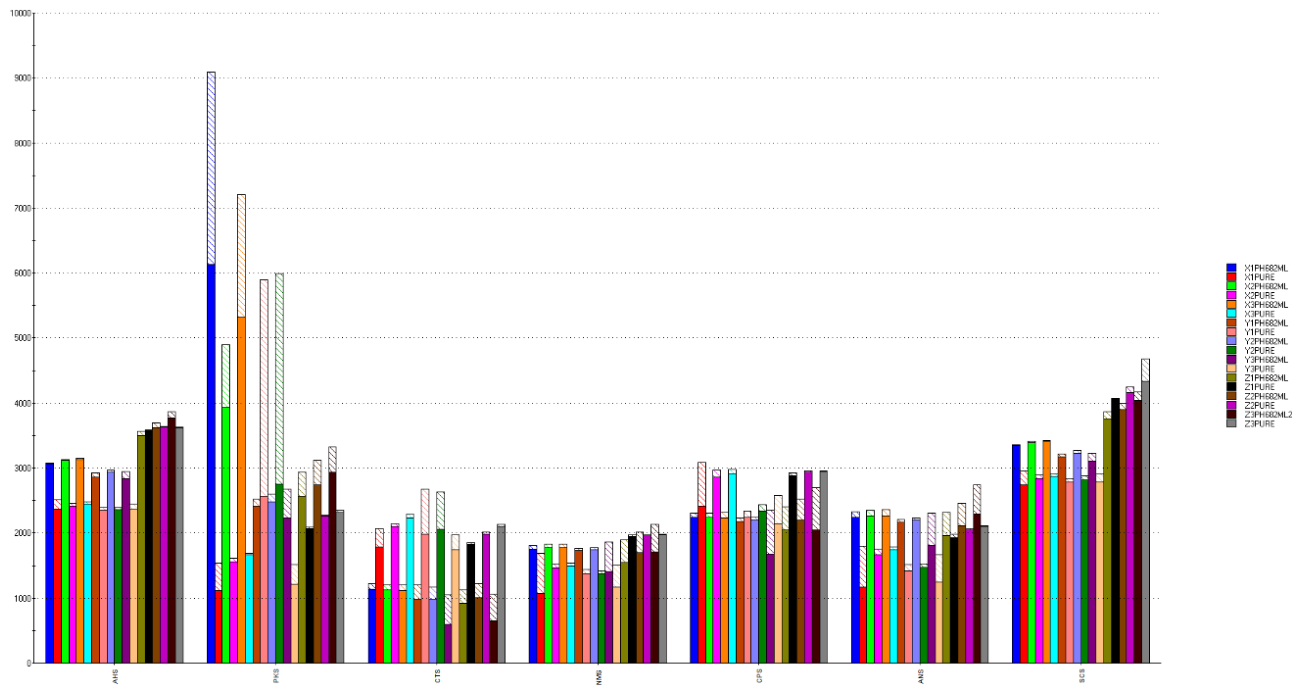
Figure 11.
a. Three-dimensional PCA score plot of Alpha Astree II e-tongue sensor responses for Batch G samples (PC1 = 75.816%, PC2 = 12.601%, PC3 = 9.768%; total = 98.185%). b. Two-dimensional DFA score plot of Alpha Astree II e-tongue sensor responses for Batch G samples (DF1 = 98.1%, DF2 = 1.753%; total = 99.853%).
Figure 11.
a. Three-dimensional PCA score plot of Alpha Astree II e-tongue sensor responses for Batch G samples (PC1 = 75.816%, PC2 = 12.601%, PC3 = 9.768%; total = 98.185%). b. Two-dimensional DFA score plot of Alpha Astree II e-tongue sensor responses for Batch G samples (DF1 = 98.1%, DF2 = 1.753%; total = 99.853%).
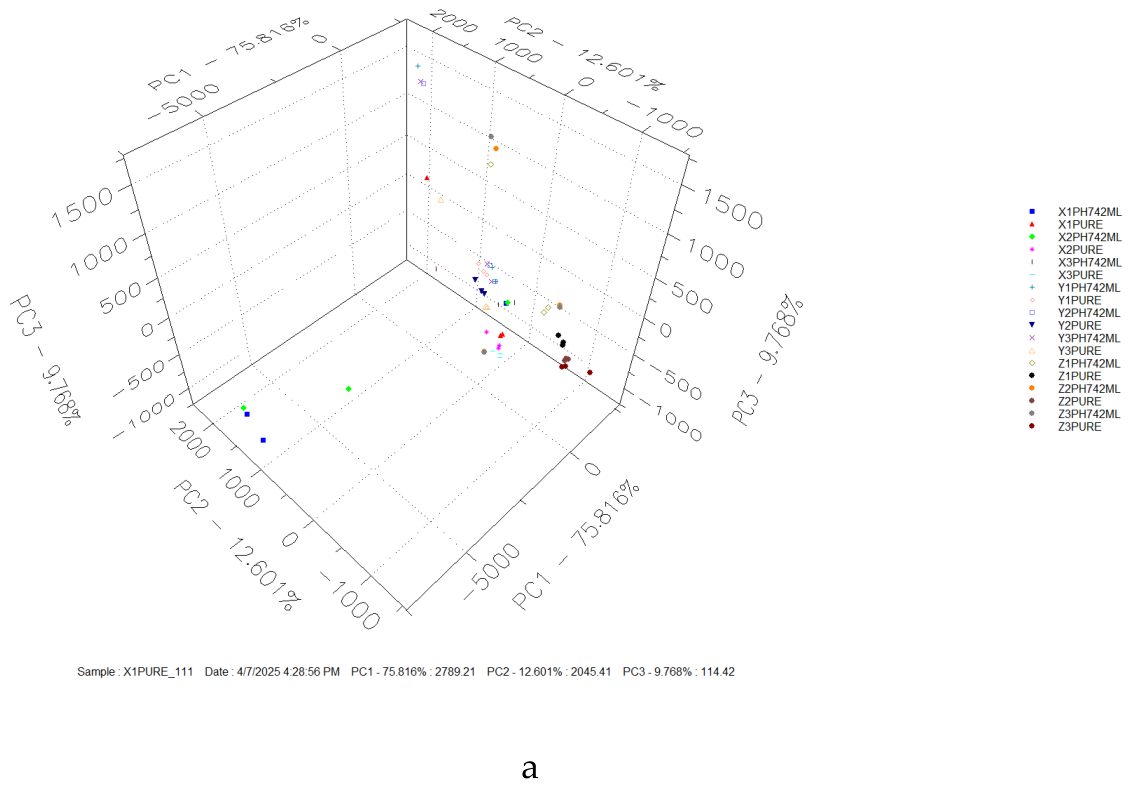
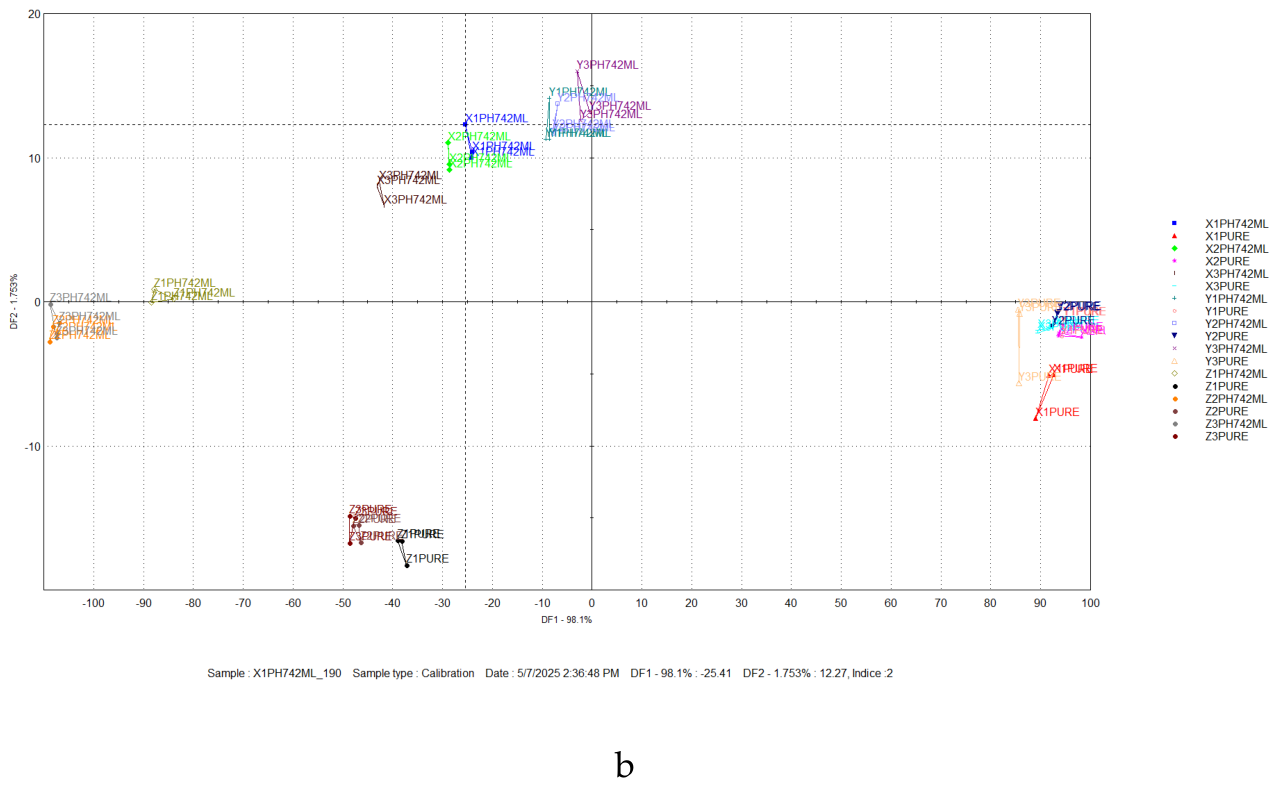
Figure 14.
a. Two-dimensional PCA score plot of Alpha Astree II e-tongue sensor responses for Batch I samples (PC1 = 91.874%, PC2 = 7.609%; total = 99.483%). b. Two-dimensional DFA score plot of Alpha Astree II e-tongue sensor responses for Batch I samples (DF1 = 95.177%, DF2 = 4.394%; total = 99.571%).
Figure 14.
a. Two-dimensional PCA score plot of Alpha Astree II e-tongue sensor responses for Batch I samples (PC1 = 91.874%, PC2 = 7.609%; total = 99.483%). b. Two-dimensional DFA score plot of Alpha Astree II e-tongue sensor responses for Batch I samples (DF1 = 95.177%, DF2 = 4.394%; total = 99.571%).
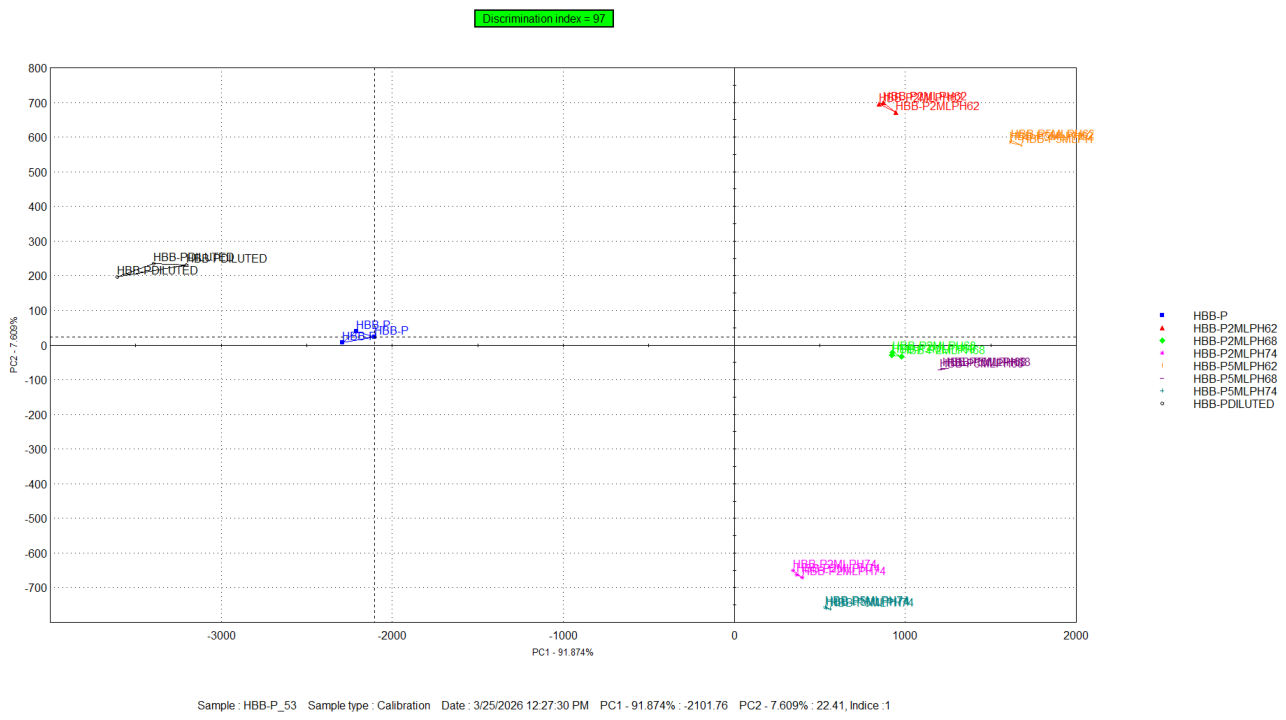
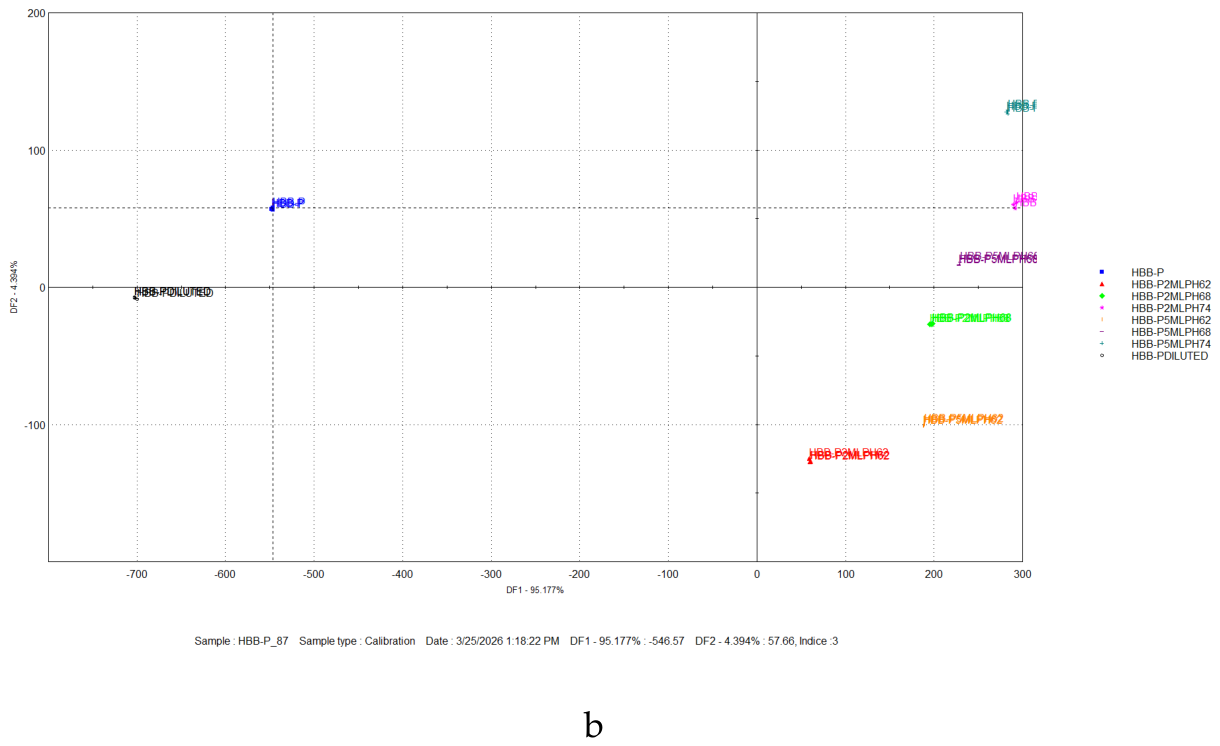
Figure 15.
Bar chart plot of sensor responses for Batch I samples (n = 3 replicates).A comparison between HBB-P2MLPH62 and HBB-P5MLPH62, HBB-P2MLPH68 and HBB-P5MLPH68, and HBB-P2MLPH74 and HBB-P5MLPH74 reveals the volume-dependent effect of simulated salivary volume on pure API taste at each pH. Increasing PBS volume from 2 mL to 5 mL produced lower sensor responses across most sensors, with the exception of AHS sourness for HBB-P2MLPH74 versus HBB-P5MLPH74, which exhibited a slight increase at larger PBS volumes, reflecting the altered ionic environment created by the higher proportion of divalent HPO₄²⁻ modifying the proton activity at the sensor surface (Gaohua et al., 2021; Zhang et al., 2022; Lambros et al., 2022). The PDI between 2 mL and 5 mL samples at the same pH was consistently the smallest within-pH comparison in Table 11 (HBB-P2MLPH68 vs HBB-P5MLPH68 = 85.82%; HBB-P2MLPH74 vs HBB-P5MLPH74 = 86.98%), reflecting the relatively modest taste divergence produced by volume change alone compared with pH-driven ionic composition changes.
Figure 15.
Bar chart plot of sensor responses for Batch I samples (n = 3 replicates).A comparison between HBB-P2MLPH62 and HBB-P5MLPH62, HBB-P2MLPH68 and HBB-P5MLPH68, and HBB-P2MLPH74 and HBB-P5MLPH74 reveals the volume-dependent effect of simulated salivary volume on pure API taste at each pH. Increasing PBS volume from 2 mL to 5 mL produced lower sensor responses across most sensors, with the exception of AHS sourness for HBB-P2MLPH74 versus HBB-P5MLPH74, which exhibited a slight increase at larger PBS volumes, reflecting the altered ionic environment created by the higher proportion of divalent HPO₄²⁻ modifying the proton activity at the sensor surface (Gaohua et al., 2021; Zhang et al., 2022; Lambros et al., 2022). The PDI between 2 mL and 5 mL samples at the same pH was consistently the smallest within-pH comparison in Table 11 (HBB-P2MLPH68 vs HBB-P5MLPH68 = 85.82%; HBB-P2MLPH74 vs HBB-P5MLPH74 = 86.98%), reflecting the relatively modest taste divergence produced by volume change alone compared with pH-driven ionic composition changes.
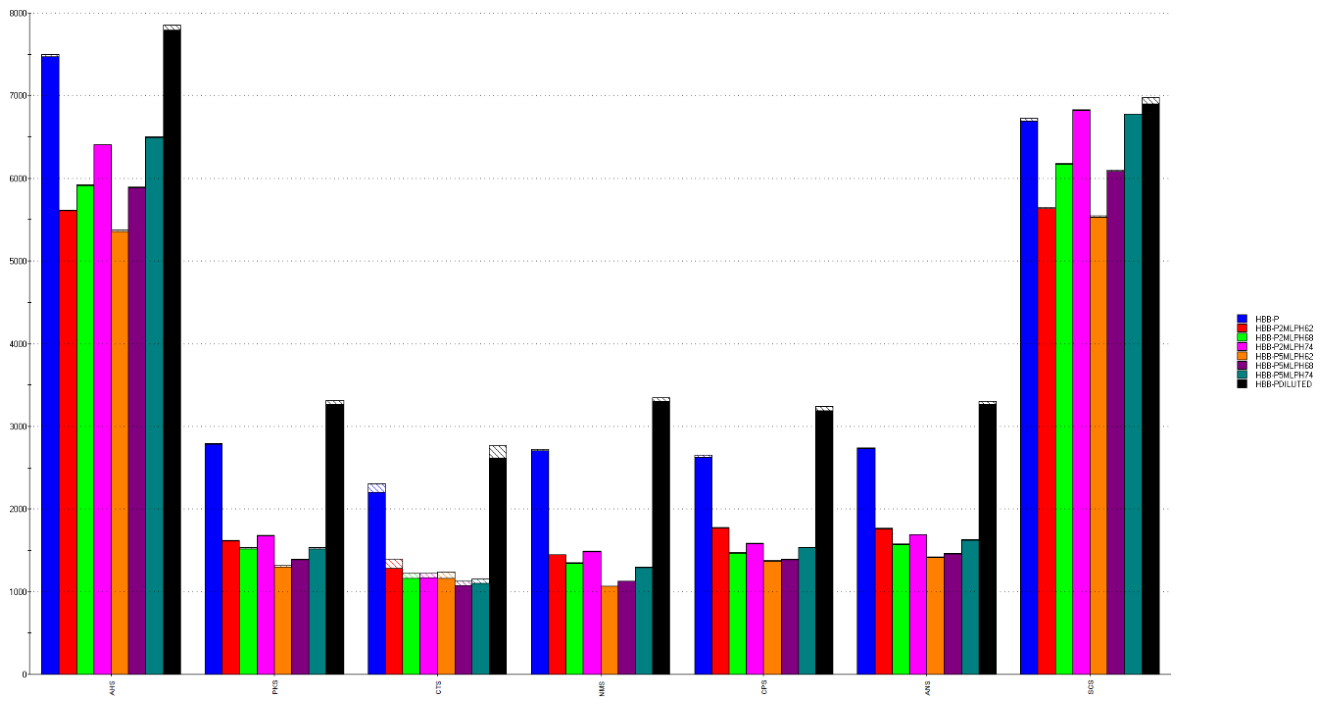
Table 1.
Sample code, composition, batch numbers, and expiry dates of the products tested.
| Sample code | Active ingredient | Excipients | Batch number | Shelf-life |
|---|---|---|---|---|
| *X1 X2 X3 | 5 mg hyoscine butylbromide/ 5mL | Saccharin sodium 15 mg/5 mL Sorbic acid 0.080% w/v Hydroxyethyl cellulose Banana flavour Purified water. |
001252 | 08/2024–07/2026 |
| 001549 | 11/2024–10/2026 | |||
| 001551 | 11/2024–10/2026 | |||
| *Y1 Y2 Y3 | 5 mg hyoscine butylbromide/5 mL | Sodium saccharin 500 – 2.5 mg; Sodium cyclamate 10 mg Sorbitol 70% solution 500 mg Glycerol 250 mg Sorbic acid 0.08% m/v Banana flavour LR 4186 Hydrochloric acid 32% Hydroxypropyl methylcellulose. |
W072014 | 11/2023–10/2025 |
| W072778 | 02/2024–01/2026 | |||
| W073861 | 04/2024–03/2026 | |||
| **Z1 Z2 Z3 | 5 mg hyoscine-N-butyl bromide/5 mL | Sorbitol 70% solution 2 g Glycerol 400 mg Saccharin sodium 4 mg Sodium benzoate 0.1% m/v Propylene glycol 3.0% m/v Citric acid monohydrate Disodium EDTA Banana flavour 85509/H Purified water. |
E0003349 | 04/2026 |
| E0011774 | 04/2026 | |||
| E0012709 | 04/2026 |
*Products were sugar-free. **Product contained sugar.
Table 2.
Sample preparation and composition of HBB syrups (Batches A-G).
| Batch | Sample code | API | HPLC-grade water | Buffer | pH |
|---|---|---|---|---|---|
| A | X Pure (X1, X2, X3); Y Pure (Y1, Y2, Y3); Z Pure (Z1, Z2, Z3) |
25 mg/25 mL | – | – | 3.63, 3.61, 3.62 3.49, 3.52, 3.57 4.57, 4.62, 4.61 |
| B | X H₂O (X1, X2, X3); Y H₂O (Y1, Y2, Y3); Z H₂O (Z1, Z2, Z3) |
5 mg/5 mL | 20 mL | – | 4.01, 3.95, 3.93 3.89, 3.91, 3.94 4.77, 4.84, 4.84 |
| C | X pH 6.2 (X1, X2, X3); Y pH 6.2 (Y1, Y2, Y3); Z pH 6.2 (Z1, Z2, Z3) |
5 mg/5 mL | 18 mL | 2 mL | 6.06, 6.11, 6.13 6.14, 6.15, 6.16 6.32, 6.37, 6.38 |
| D | X pH 6.2 (X1, X2, X3); Y pH 6.2 (Y1, Y2, Y3); Z pH 6.2 (Z1, Z2, Z3) |
5 mg/5 mL | 15 mL | 5 mL | 6.45, 4.46, 6.47 6.48, 6.49, 6.60 6.50, 6.50, 6.50 |
| E | X pH 6.8 (X1, X2, X3); Y pH 6.8 (Y1, Y2, Y3); Z pH 6.8 (Z1, Z2, Z3) |
5 mg/5 mL | 18 mL | 2 mL | 7.01, 7.04, 7.05 7.02, 7.04, 7.04 7.02, 7.04, 7.07 |
| F | X pH 6.8 (X1, X2, X3); Y pH 6.8 (Y1, Y2, Y3); Z pH 6.8 (Z1, Z2, Z3) |
5 mg/5 mL | 15 mL | 5 mL | 7.11, 7.13, 7.12 7.11, 7.12, 7.12 7.09, 7.09, 7.09 |
| G | X pH 7.4 (X1, X2, X3); Y pH 7.4 (Y1, Y2, Y3); Z pH 7.4 (Z1, Z2, Z3) |
5 mg/5 mL | 18 mL | 2 mL | 7.51, 7.52, 7.54 7.49. 7.52, 7.53 7.51, 7.52, 7.53 |
| H | X pH 7.4 (X1, X2, X3); Y pH 7.4 (Y1, Y2, Y3); Z pH 7.4 (Z1, Z2, Z3) |
5 mg/5 mL | 15 mL | 5 mL | 7.67, 7.66, 7.67 7.67, 7.67, 7.66 7.62, 7.65, 7.65 |
Table 3.
Sample preparation and composition of HBB powder (Batch I).
| Batch | Sample code | API | HPLC-grade water | Buffer | pH |
|---|---|---|---|---|---|
| I | HBB-P | 25 mg | 25 mL | – | 6.19 |
| I | HBB-P DILUTED | 5 mg/5 mL | 20 mL | – | 5.86 |
| I | HBB-P pH 6.2 HBB-P pH 6.8 HBB-P pH 7.4 |
5 mg/5 mL | 18 mL | 2 mL | 6.59 7.23 7.88 |
| I | HBB-P pH 6.2 HBB-P pH 6.8 HBB-P pH 7.4 |
5 mg/5 mL | 15 mL | 5 mL | 6.56 7.14 7.81 |
Table 8.
Taste screening ranking for all sensors for all batch F samples.
| Sample number | Sample names | AHS | PKS | CTS | NMS | CPS | ANS | SCS |
|---|---|---|---|---|---|---|---|---|
| 1 | X1PH68 | 5.2 | 6.6 | 6.1 | 6.4 | 6.6 | 6.8 | 6.8 |
| 2 | X1PURE | 8.6 | 3.0 | 5.3 | 8.6 | 4.3 | 2.6 | 3.3 |
| 3 | X2PH68 | 5.0 | 6.5 | 5.1 | 6.2 | 6.6 | 6.9 | 6.9 |
| 4 | X2PURE | 8.5 | 5.4 | 8.7 | 6.0 | 7.2 | 5.7 | 3.5 |
| 5 | X3PH68 | 4.4 | 6.5 | 4.4 | 6.4 | 6.6 | 6.7 | 7.6 |
| 6 | X3PURE | 8.4 | 6.0 | 10.1 | 5.7 | 7.6 | 6.3 | 3.6 |
| 7 | Y1PH68 | 5.3 | 7.0 | 5.8 | 6.8 | 5.4 | 6.5 | 6.6 |
| 8 | Y1PURE | 8.6 | 2.2 | 3.8 | 6.9 | 3.1 | 3.5 | 3.4 |
| 9 | Y2PH68 | 5.2 | 6.7 | 4.8 | 6.5 | 5.5 | 6.9 | 6.7 |
| 10 | Y2PURE | 8.6 | 3.7 | 5.2 | 6.8 | 3.8 | 4.1 | 3.4 |
| 11 | Y3PH68 | 4.8 | 6.8 | 4.1 | 6.3 | 5.8 | 7.1 | 7.1 |
| 12 | Y3PURE | 8.6 | 3.5 | 4.8 | 7.9 | 2.6 | 3.0 | 3.4 |
| 13 | Z1PH68 | 3.4 | 5.7 | 7.1 | 6.7 | 6.5 | 5.8 | 8.5 |
| 14 | Z1PURE | 5.9 | 8.1 | 5.7 | 2.7 | 7.3 | 7.4 | 6.1 |
| 15 | Z2PH68 | 2.9 | 5.8 | 5.7 | 6.6 | 6.7 | 5.9 | 8.9 |
| 16 | Z2PURE | 5.8 | 9.1 | 7.5 | 2.6 | 7.7 | 8.2 | 6.3 |
| 17 | Z3PH68 | 3.0 | 5.9 | 4.9 | 6.4 | 6.8 | 6.0 | 9.3 |
| 18 | Z3PURE | 5.8 | 9.4 | 8.8 | 2.5 | 7.8 | 8.5 | 6.6 |
Table 9.
Taste screening ranking for all sensors for all batch G samples.
| Sample number | Sample names | AHS | PKS | CTS | NMS | CPS | ANS | SCS |
|---|---|---|---|---|---|---|---|---|
| 1 | X1PH742ML | 5.3 | 10.7 | 5.0 | 4.8 | 5.9 | 7.8 | 6.4 |
| 2 | X1PURE | 8.6 | 4.5 | 7.3 | 8.5 | 6.2 | 3.1 | 3.4 |
| 3 | X2PH742ML | 5.2 | 9.9 | 4.9 | 4.8 | 5.8 | 7.8 | 6.5 |
| 4 | X2PURE | 8.5 | 4.9 | 8.3 | 6.7 | 7.8 | 5.1 | 3.7 |
| 5 | X3PH742ML | 4.8 | 6.7 | 4.7 | 5.0 | 5.7 | 7.7 | 6.9 |
| 6 | X3PURE | 8.4 | 5.0 | 8.8 | 6.5 | 8.0 | 5.4 | 3.8 |
| 7 | Y1PH742ML | 5.9 | 5.7 | 3.3 | 6.5 | 3.8 | 6.2 | 5.8 |
| 8 | Y1PURE | 8.7 | 4.3 | 6.9 | 7.4 | 5.4 | 3.7 | 3.5 |
| 9 | Y2PH742ML | 5.9 | 5.7 | 3.4 | 6.5 | 4.0 | 6.3 | 5.7 |
| 10 | Y2PURE | 8.6 | 4.6 | 7.3 | 7.3 | 5.9 | 4.0 | 3.6 |
| 11 | Y3PH742ML | 6.1 | 5.7 | 3.3 | 6.5 | 3.9 | 6.4 | 5.6 |
| 12 | Y3PURE | 8.6 | 4.5 | 7.2 | 8.1 | 5.2 | 3.3 | 3.5 |
| 13 | Z1PH742ML | 3.7 | 6.0 | 4.7 | 5.4 | 5.5 | 7.3 | 8.0 |
| 14 | Z1PURE | 4.6 | 5.4 | 7.4 | 4.4 | 7.9 | 6.1 | 7.7 |
| 15 | Z2PH742ML | 3.1 | 6.6 | 4.6 | 5.5 | 5.5 | 7.2 | 8.6 |
| 16 | Z2PURE | 4.5 | 5.5 | 8.0 | 4.3 | 8.1 | 6.6 | 8.1 |
| 17 | Z3PH742ML | 3.1 | 6.6 | 4.6 | 5.6 | 5.4 | 7.2 | 8.6 |
| 18 | Z3PURE | 4.5 | 5.6 | 8.4 | 4.2 | 8.1 | 6.8 | 8.6 |
Table 10.
Taste screening ranking for all sensors for all batch H samples.
| Sample number | Sample names | AHS | PKS | CTS | NMS | CPS | ANS | SCS |
|---|---|---|---|---|---|---|---|---|
| 1 | X1PH74 | 4.6 | 6.6 | 5.0 | 6.2 | 6.7 | 6.7 | 7.2 |
| 2 | X1PURE | 8.5 | 2.8 | 6.3 | 9.0 | 3.9 | 2.5 | 3.6 |
| 3 | X2PH74 | 4.2 | 6.7 | 4.6 | 6.0 | 6.7 | 6.8 | 7.3 |
| 4 | X2PURE | 8.5 | 5.1 | 9.0 | 6.4 | 6.7 | 5.5 | 3.7 |
| 5 | X3PH74 | 4.1 | 6.8 | 4.2 | 5.9 | 6.7 | 6.8 | 7.3 |
| 6 | X3PURE | 8.4 | 5.7 | 10.2 | 6.1 | 7.0 | 6.0 | 3.8 |
| 7 | Y1PH74 | 4.7 | 6.8 | 4.7 | 6.3 | 6.2 | 7.0 | 7.0 |
| 8 | Y1PURE | 8.6 | 2.1 | 5.2 | 7.4 | 2.7 | 3.4 | 3.6 |
| 9 | Y2PH74 | 4.3 | 7.0 | 4.2 | 6.0 | 6.6 | 7.3 | 7.2 |
| 10 | Y2PURE | 8.5 | 3.5 | 6.2 | 7.2 | 3.4 | 3.9 | 3.7 |
| 11 | Y3PH74 | 4.2 | 7.2 | 3.9 | 5.8 | 6.6 | 7.4 | 7.3 |
| 12 | Y3PURE | 8.5 | 3.3 | 5.9 | 8.4 | 2.3 | 2.9 | 3.7 |
| 13 | Z1PH74 | 3.8 | 6.1 | 5.4 | 6.5 | 6.9 | 6.1 | 9.5 |
| 14 | Z1PURE | 6.7 | 7.7 | 6.7 | 3.0 | 6.8 | 7.0 | 5.3 |
| 15 | Z2PH74 | 3.6 | 6.4 | 4.9 | 6.2 | 7.1 | 6.4 | 8.7 |
| 16 | Z2PURE | 6.6 | 8.7 | 8.0 | 2.9 | 7.1 | 7.8 | 5.4 |
| 17 | Z3PH74 | 3.6 | 6.5 | 4.6 | 6.0 | 7.3 | 6.6 | 8.1 |
| 18 | Z3PURE | 6.6 | 9.0 | 9.1 | 2.8 | 7.2 | 8.1 | 5.6 |
Table 11.
Distance and discrimination index table for Batch I sample testing compared to Batch B sample.
Table 11.
Distance and discrimination index table for Batch I sample testing compared to Batch B sample.
| Sample names | Reference samples | Distances | P Value | Pattern discrimination index (PDI) (%) | |
|---|---|---|---|---|---|
| 1 | HBB-P | HBB-P2MLPH62 | 3168.65 | 0.00 | 99.49 |
| 2 | HBB-P | HBB-P2MLPH68 | 3148.62 | 0.00 | 99.62 |
| 3 | HBB-P | HBB-P2MLPH74 | 2670.67 | 0.00 | 99.51 |
| 4 | HBB-P | HBB-P5MLPH62 | 3881.78 | 0.00 | 99.72 |
| 5 | HBB-P | HBB-P5MLPH68 | 3425.58 | 0.00 | 99.70 |
| 6 | HBB-P | HBB-P5MLPH74 | 2857.40 | 0.00 | 99.59 |
| 7 | HBB-P | HBB-PDILUTED | 1234.90 | 0.00 | 93.37 |
| 8 | HBB-P2MLPH62 | HBB-P2MLPH68 | 733.44 | 0.00 | 94.20 |
| 9 | HBB-P2MLPH62 | HBB-P2MLPH74 | 1452.30 | 0.00 | 98.58 |
| 10 | HBB-P2MLPH62 | HBB-P5MLPH62 | 780.83 | 0.00 | 94.24 |
| 11 | HBB-P2MLPH62 | HBB-P5MLPH68 | 844.79 | 0.00 | 95.89 |
| 12 | HBB-P2MLPH62 | HBB-P5MLPH74 | 1493.81 | 0.00 | 98.71 |
| 13 | HBB-P2MLPH62 | HBB-PDILUTED | 4316.51 | 0.00 | 99.45 |
| 14 | HBB-P2MLPH68 | HBB-P2MLPH74 | 859.81 | 0.00 | 97.87 |
| 15 | HBB-P2MLPH68 | HBB-P5MLPH62 | 932.96 | 0.00 | 97.42 |
| 16 | HBB-P2MLPH68 | HBB-P5MLPH68 | 314.47 | 0.00 | 85.82 |
| 17 | HBB-P2MLPH68 | HBB-P5MLPH74 | 850.60 | 0.00 | 97.99 |
| 18 | HBB-P2MLPH68 | HBB-PDILUTED | 4352.44 | 0.00 | 99.53 |
| 19 | HBB-P2MLPH74 | HBB-P5MLPH62 | 1786.16 | 0.00 | 99.37 |
| 20 | HBB-P2MLPH74 | HBB-P5MLPH68 | 1057.52 | 0.00 | 98.80 |
| 21 | HBB-P2MLPH74 | HBB-P5MLPH74 | 283.61 | 0.00 | 86.98 |
| 22 | HBB-P2MLPH74 | HBB-PDILUTED | 3873.25 | 0.00 | 99.43 |
| 23 | HBB-P5MLPH62 | HBB-P5MLPH68 | 777.08 | 0.00 | 96.72 |
| 24 | HBB-P5MLPH62 | HBB-P5MLPH74 | 1736.23 | 0.00 | 99.37 |
| 25 | HBB-P5MLPH62 | HBB-PDILUTED | 5054.60 | 0.00 | 99.64 |
| 26 | HBB-P5MLPH68 | HBB-P5MLPH74 | 971.54 | 0.00 | 98.71 |
| 27 | HBB-P5MLPH68 | HBB-PDILUTED | 4635.74 | 0.00 | 99.60 |
| 28 | HBB-P5MLPH74 | HBB-PDILUTED | 4067.49 | 0.00 | 99.49 |
| 29 | X1H20 | X1PURE | 1526.75 | 0.00 | 42.50 |
| 20 | X2H20 | X2PURE | 813.08 | 0.00 | 87.70 |
| 21 | X3H20 | X3PURE | 765.25 | 0.00 | 91.97 |
| 22 | Y1H20 | Y1PURE | 992.45 | 0.00 | 93.96 |
| 23 | Y2H20 | Y2PURE | 880.24 | 0.00 | 90.04 |
| 24 | Y3H20 | Y3PURE | 1117.74 | 0.00 | 47.30 |
| 25 | Z1H20 | Z1PURE | 579.89 | 0.00 | 92.17 |
| 26 | Z2H20 | Z2PURE | 791.46 | 0.00 | 25.19 |
| 27 | Z3H20 | Z3PURE | 432.94 | 0.00 | 38.50 |
Table 12.
Taste screening ranking for all sensors for all batch I samples.
| Sample number | Sample names | AHS | PKS | CTS | NMS | CPS | ANS | SCS |
|---|---|---|---|---|---|---|---|---|
| 1 | HBB-P | 3.3 | 8.6 | 8.6 | 3.4 | 8.4 | 8.5 | 7.4 |
| 2 | HBB-P2MLPH62 | 7.9 | 5.2 | 5.3 | 6.7 | 5.7 | 5.4 | 3.3 |
| 3 | HBB-P2MLPH68 | 7.1 | 4.9 | 4.9 | 7.0 | 4.7 | 4.9 | 5.4 |
| 4 | HBB-P2MLPH74 | 5.9 | 5.4 | 4.9 | 6.6 | 5.1 | 5.2 | 7.9 |
| 5 | HBB-P5MLPH62 | 8.5 | 4.3 | 4.9 | 7.7 | 4.4 | 4.4 | 2.9 |
| 6 | HBB-P5MLPH68 | 7.2 | 4.5 | 4.6 | 7.5 | 4.5 | 4.5 | 5.1 |
| 7 | HBB-P5MLPH74 | 5.7 | 4.9 | 4.7 | 7.1 | 4.9 | 5.0 | 7.7 |
| 8 | HBB-PDILUTED | 2.5 | 10.1 | 10.1 | 1.9 | 10.2 | 10.2 | 8.2 |
Disclaimer/Publisher’s Note: The statements, opinions and data contained in all publications are solely those of the individual author(s) and contributor(s) and not of MDPI and/or the editor(s). MDPI and/or the editor(s) disclaim responsibility for any injury to people or property resulting from any ideas, methods, instructions or products referred to in the content. |
© 2026 by the authors. Licensee MDPI, Basel, Switzerland. This article is an open access article distributed under the terms and conditions of the Creative Commons Attribution (CC BY) license (http://creativecommons.org/licenses/by/4.0/).
Copyright: This open access article is published under a Creative Commons CC BY 4.0 license, which permit the free download, distribution, and reuse, provided that the author and preprint are cited in any reuse.