

Submitted:
09 September 2026
Posted:
11 September 2026
You are already at the latest version
Abstract
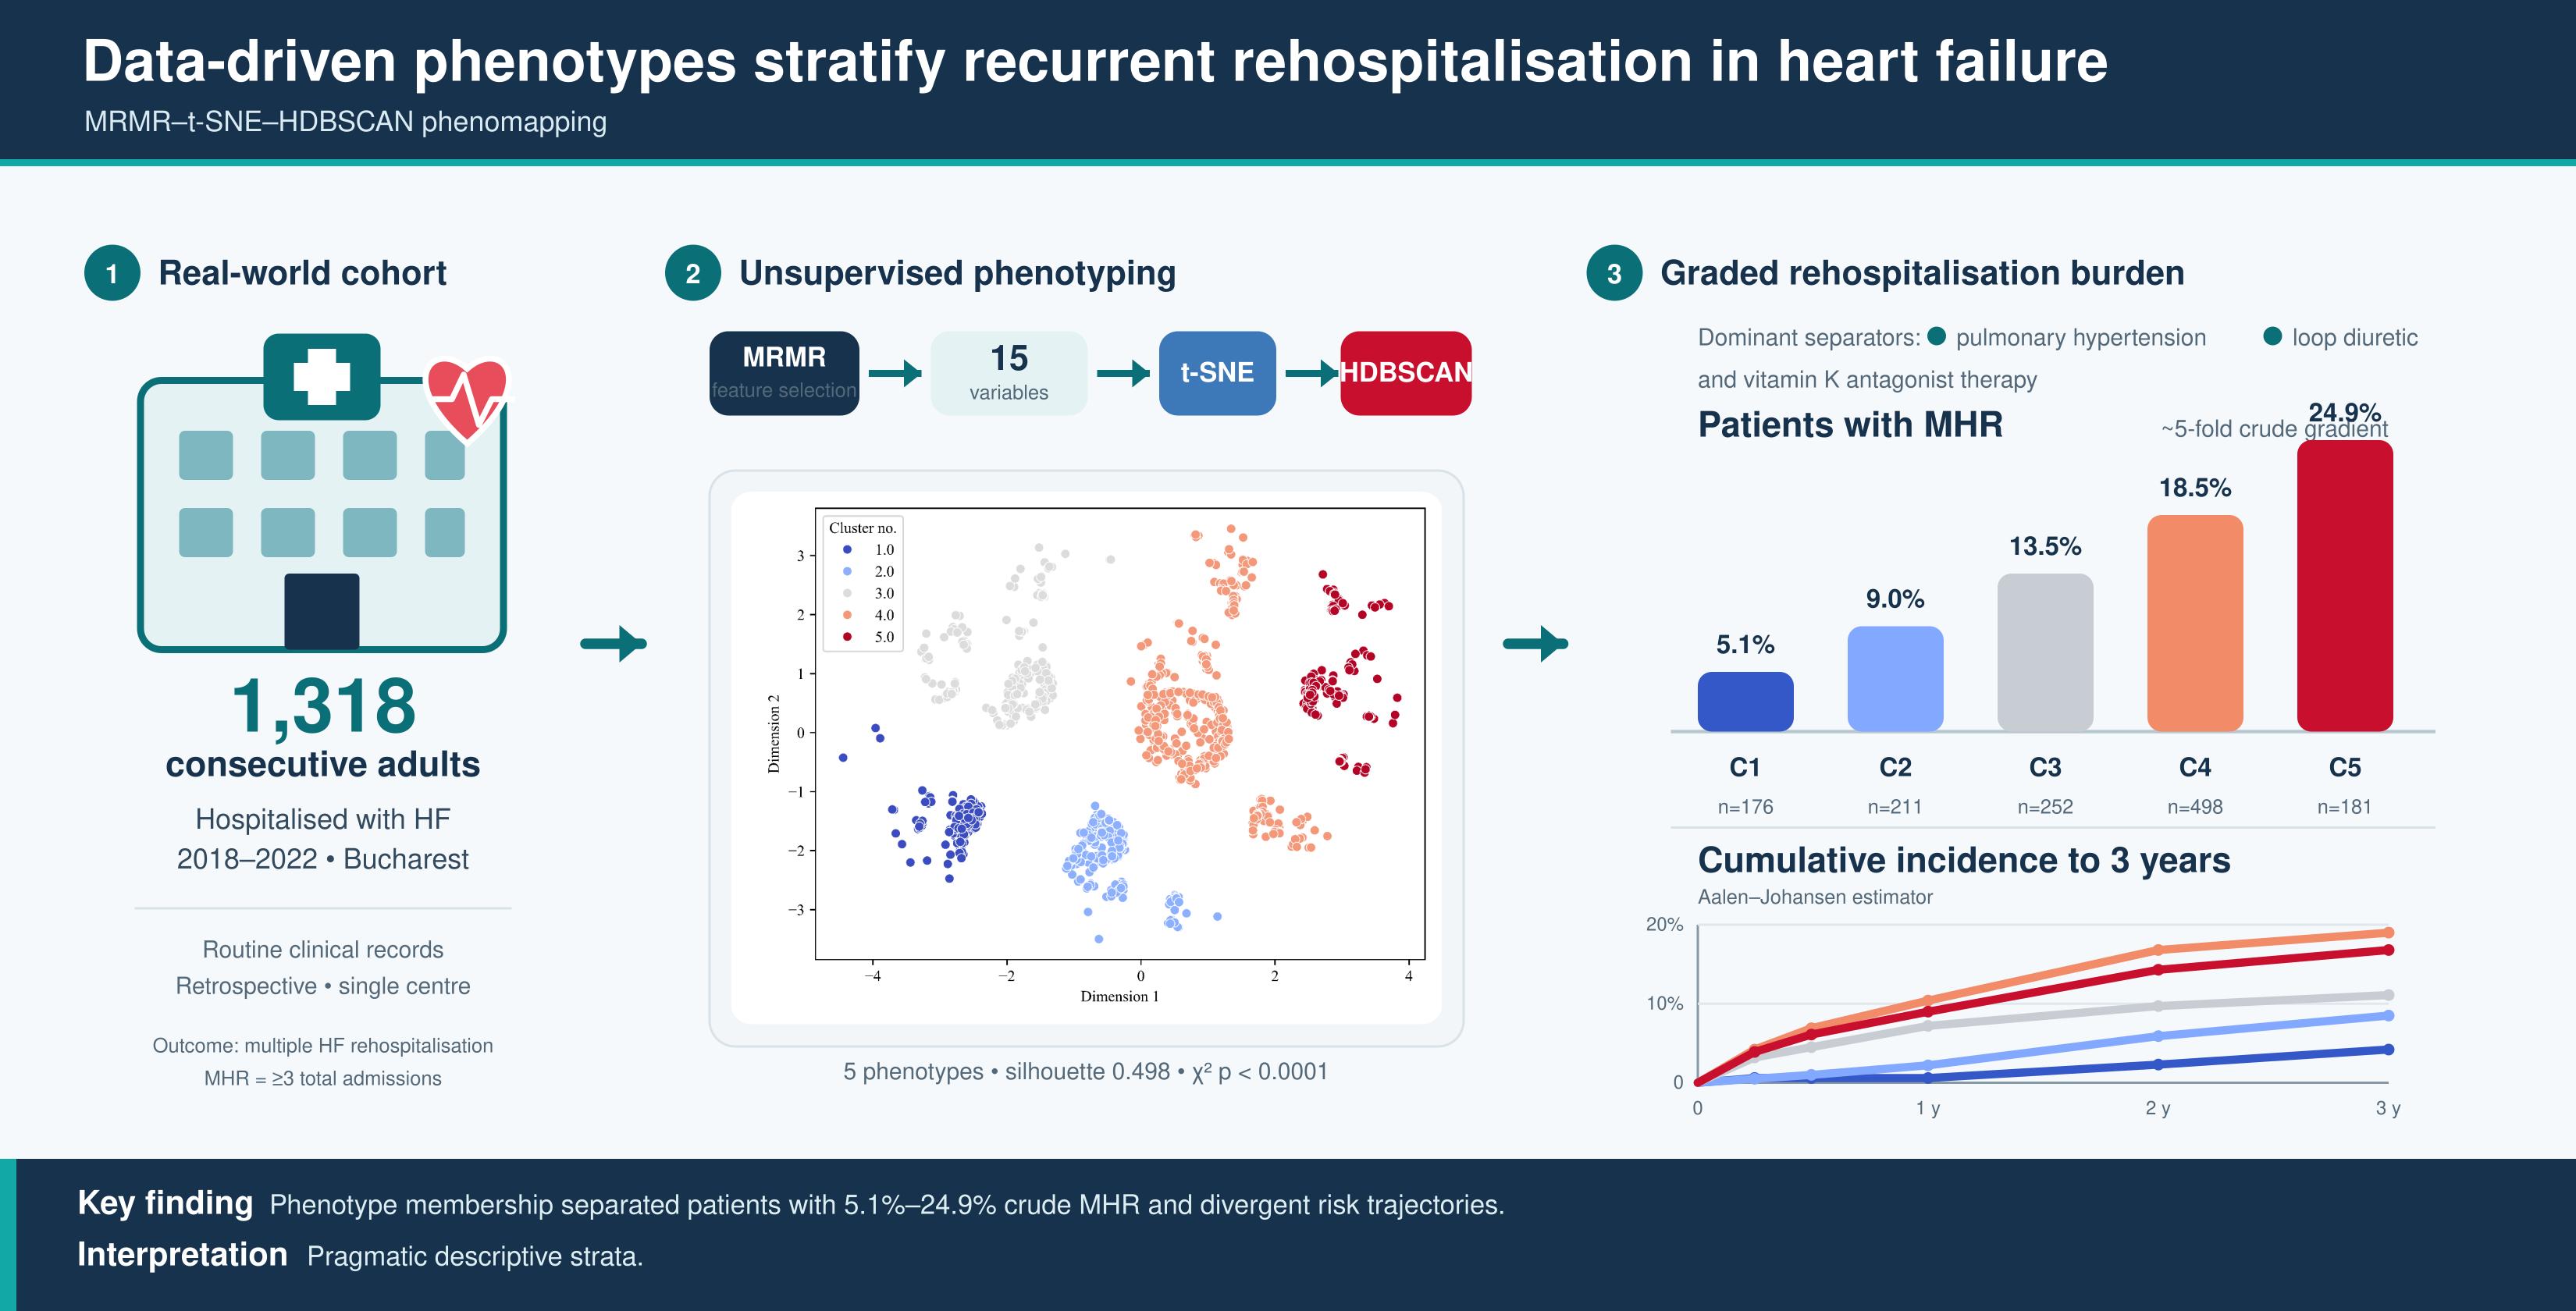
Objectives: Classification of heart failure (HF) by left ventricular ejection fraction and aetiology captures only part of the clinical heterogeneity of the syndrome. We aimed to derive data-driven phenotypes in an unselected cohort of hospitalised HF patients and to assess whether phenotype membership was associated with the cumulative incidence of recurrent HF rehospitalisation once death was modelled as a competing risk. Methods: We retrospectively analysed 1,318 consecutive adults hospitalised with HF in the Cardiology Department of Elias University Emergency Hospital, Bucharest, between 2018 and 2022. Minimum-Redundancy-Maximum-Relevance selection retained 15 non-redundant variables, which were projected into two dimensions by t-distributed Stochastic Neighbour Embedding and clustered with HDBSCAN. The endpoint was multiple HF rehospitalisation (MHR, ≥3 admissions). Results: Five phenotypes emerged (n = 176, 211, 252, 498 and 181) with moderate internal separation (silhouette 0.498; Davies–Bouldin 0.747) and a significant association with MHR (χ² p < 0.0001; Cramér’s V 0.17). The proportion of patients with MHR rose across phenotypes, from 5.1% in Cluster 1 to 24.9% in Cluster 5. The phenotypes were separated principally by documented pulmonary hypertension, loop-diuretic requirement and vitamin K antagonist therapy, with secondary gradients in age, renal function, valvular findings and congestion burden. Cluster 5, characterised by universal vitamin K antagonist use and the highest prevalence of aortic regurgitation, chronic kidney disease and thromboembolic disease, carried the highest readmission burden; Cluster 1, the youngest phenotype and free of loop-diuretic requirement, carried the lowest. Cumulative incidence curves for MHR diverged progressively across phenotypes throughout follow-up. Conclusions: Unsupervised phenotyping of an unselected hospitalised HF population identified five subgroups with a graded burden of recurrent rehospitalisation after formal accounting for competing mortality. This approach isolated different risk phenotypes that conventional classification would obscure, supporting prospective validation.
Keywords:
heart failure
; unsupervised machine learning
; phenotyping
; cluster analysis
; recurrent hospitalisation
; competing risk
; cumulative incidence
1. Introduction
Heart failure (HF) remains one of the most burdensome chronic cardiovascular syndromes worldwide, and its prevalence continues to rise as populations age and comorbidities accumulate [1,2]. HF classification is anchored primarily on left ventricular ejection fraction (LVEF) and on aetiology, yet successive consensus documents, namely the 2021 and 2026 European Society of Cardiology (ESC) guidelines and the 2026 AHA/ACC/ESC/WHF Universal Definition of Heart Failure, acknowledge that these axes capture only part of the biological and clinical heterogeneity of the syndrome [1,2,3]. The 2026 ESC guidelines have in fact narrowed the ejection-fraction taxonomy further, removing the mildly reduced category and retaining two phenotypes separated by a single LVEF threshold of 50% [2]. Patients who share the same LVEF category often differ markedly in comorbidity profile, congestion pattern, neurohormonal activation and, critically, in their subsequent clinical trajectory, and a simplified two-category taxonomy makes complementary approaches to characterising that heterogeneity more, rather than less necessary.
Among the events that define that trajectory, recurrent hospitalisation for HF is both a marker of disease progression and a powerful, independent predictor of mortality [4,5]. Real-world data consistently show that each additional HF hospitalisation is associated with a stepwise increase in the risk of subsequent readmission and death [6]. Nonetheless, the conventional “time-to-first-event” framework used in most prognostic studies systematically underestimates the true burden of disease, because it discards every event after the first one [7]. Recognition of this limitation has driven the adoption of recurrent-event endpoints in landmark trials of HF with preserved and mildly reduced ejection fraction. This approach unmasked treatment effects that first-event analyses obscured [7]. The same logic applies to observational risk stratification: a patient’s propensity for repeated readmission may encode prognostic information that single-event models miss.
Unsupervised machine learning (UML) delivers a complementary route to conventional classification. Rather than imposing predefined categories, clustering (“phenomapping”) groups patients according to the multidimensional structure of their own data, with the potential to generate clinically recognisable phenotypes with distinct outcomes [8]. Since the seminal phenomapping of HF with preserved ejection fraction by Shah and colleagues, the approach has been extended across the ejection-fraction spectrum, to HF with reduced ejection fraction [9,10], to critically ill patients in the cardiac intensive care unit [11], to congestion phenotypes in acute HF [12], and to imaging and biomarker-defined subgroups [13,14]. A recurring and clinically appealing finding across these studies is the emergence of a small, high-risk phenotype that standard LVEF or aetiology-based labels fail to isolate [10,11,15]. The field is nonetheless larger than it is settled: a scoping review searched to February 2026 mapped 73 such studies, encompassing 1,245,140 patients and 308 derived clusters, and judged 40% of those clusters to have only partial or poor clinical interpretability, concluding that translating algorithmically derived groupings into clinically meaningful phenotypes remains the principal unsolved problem in this literature [16].
Three methodological gaps persist. First, most phenomapping studies relate cluster membership to a composite outcome or to mortality, but comparatively few examine the cumulative incidence of recurrent HF hospitalisation while formally accounting for death as a competing risk, even though a patient who dies can no longer be readmitted, so that treating death as ordinary censoring biases readmission estimates upward [17]. Second, the analytical repertoire of the field is narrow: across the 73 studies mapped in that review, feature selection was left to author discretion in 60 studies, and clustering was dominated by latent class or model-based methods (25 studies), partitioning methods (18) and hierarchical methods (13), with density-based algorithms absent altogether [16]. Third, evidence derived from unselected, real-world cohorts in Central and Eastern European tertiary centres, where diagnostic and follow-up infrastructure differs from that of clinical-trial populations, remains scarce [18].
We aimed to test whether data-driven phenotypes carry prognostic information about the burden of recurrent hospitalisation that conventional classification does not capture.
2. Materials and Methods
2.1. Study Design, Setting and Reporting
This was a retrospective, observational, single-centre cohort study conducted in the Cardiology Department of Elias University Emergency Hospital, a tertiary university centre in Bucharest, Romania, affiliated to the “Carol Davila” University of Medicine and Pharmacy. The department serves both an emergency admission stream and a scheduled referral stream, and therefore receives an unselected spectrum of heart failure (HF) presentations.
The study is reported in accordance with the STROBE statement for observational cohort studies. Because the phenotypes derived here are presented as a descriptive risk stratification rather than as a validated prediction model, the study was not designed to meet the full requirements of the TRIPOD+AI reporting frame.
2.2. Participants
The screening population comprised all adult patients (≥18 years of age at the index admission) hospitalised in the Cardiology Department between 1 January 2018 and 31 December 2022, identified through principal or secondary discharge diagnoses compatible with HF and coded according to ICD-10 — including I50.0, I50.1 and I50.9, together with other HF-associated codes where the diagnosis was clinically and paraclinically supported in the medical record.
A diagnosis of HF was accepted when it was documented in the observation chart and supported by compatible clinical manifestations, by treatment specific for cardiac decompensation, by relevant biological investigations where available, and/or by echocardiographic criteria. Patients could be described according to left ventricular ejection fraction as having HF with reduced or preserved ejection fraction, depending on the data available. Classification followed the framework in force during the study period [1]. The 2026 ESC guidelines have since removed the mildly reduced ejection fraction category and replaced the term acute HF with decompensated HF [2]; the present cohort was assembled and coded before that revision, and the terminology used here reflects the definitions applied at the time of data collection.
Inclusion criteria were: (i) age ≥18 years at the index admission; (ii) a documented diagnosis of acute HF, decompensated chronic HF, or HF as a clinically relevant admission diagnosis; (iii) admission to the Cardiology Department within the study interval; and (iv) availability of the minimum clinical and paraclinical data required to characterise baseline risk factors at admission.
Exclusion criteria were: (i) age below 18 years; (ii) no confirmation of the HF diagnosis in the source documents; (iii) an incomplete record for variables essential to the analysis after application of data-quality criteria; (iv) duplicate admissions or administrative entries not corresponding to a genuine clinical hospitalisation; and (v) transfers or admissions of very short duration in which insufficient data were available to characterise the clinical episode.
The initial data extraction contained 6818 records, of which a considerable amount were duplicates and triplicates. After application of the exclusion criteria the final analysis cohort comprised 1,318 patients. Consecutive eligible patients were included; no sampling or matching was applied (Supplementary Figure S1).
2.3. Data Sources and Extraction
Data were extracted from the hospital information system, the departmental digital registries, discharge letters, observation charts, laboratory reports and available echocardiographic reports. Because a substantial proportion of the source material consisted of unstructured free text, laboratory values were extracted programmatically using regular-expression parsing rather than manual transcription, in order to reduce transcription error and to ensure that identical extraction rules were applied to every record. Extracted values were subsequently subjected to range checks, and implausible values were treated as missing.
Each patient was assigned a unique study identifier at the point of extraction. Direct identifiers (name, personal numeric code, address and telephone number) were retained exclusively in a key file held separately from the analysis database, which contained only the study identifier. All analyses were performed on the pseudonymised database.
2.4. Variables
Candidate variables covered the following domains: demographic characteristics; clinical presentation and congestion status at admission, including anasarca and peripheral oxygen saturation; comorbidities, including documented chronic kidney disease, pulmonary hypertension, arterial hypertension, diabetes mellitus and smoking status; laboratory values on admission, including, renal function, electrolytes, full blood count, iron indices and liver function tests; electrocardiographic findings, including conduction abnormalities; echocardiographic findings, including left ventricular ejection fraction, regional wall-motion abnormalities and their localisation, and valvular assessment with grading of aortic stenosis; resuscitated cardiac arrest during the index episode; and pharmacological treatment, including loop diuretics, beta-blockers, renin-angiotensin system inhibitors, anticoagulants and gastroprotective agents, recorded at the level of individual agents.
Categorical variables with more than two levels were converted to binary indicator variables by one-hot encoding. As a consequence of this procedure, the absence of a recorded value for a categorical field generated its own indicator variable; the implications of this for the interpretation of the clustering solution are addressed in the Limitations [19].
2.5. Endpoint Definitions and Follow-Up
The index admission was defined as the first eligible hospitalisation of a given patient within the study interval. Follow-up time was computed from the date of the index admission.
HF rehospitalisation was defined as any hospitalisation subsequent to the index admission that was unplanned and in which HF constituted the principal diagnosis or contributed materially to the need for admission. The endpoint of interest was multiple HF rehospitalisation (MHR), defined a priori as the accrual of at least three admissions in total during follow-up. Patients were accordingly classified into two groups for the preliminary analysis: those with fewer than three admissions and those with three or more.
All-cause death documented during the follow-up period was recorded separately and treated as a competing event, because a patient who has died can no longer be rehospitalised. Follow-up for rehospitalisation was censored at the date of death. Patients who neither died nor accrued the requisite number of admissions were administratively censored at the end of the observation period. Deaths were ascertained from hospital records; the completeness of this ascertainment is addressed explicitly in the Limitations section.
2.6. Handling of Missing Data
Missing values were not imputed by a statistical model. Before feature selection, we replaced all missing values with the median value of each column to retain the maximum number of candidate variables in the selection process rather than restrict the analysis to complete cases. This approach preserves cohort size and avoids the selection bias associated with complete-case analysis, at the cost of allowing patterns of missingness themselves to contribute to the derived structure, a trade-off whose consequences are discussed below [19].
2.7. Preliminary Statistical Analysis
Continuous variables are reported as median and interquartile range (IQR) and were compared between the MHR and non-MHR groups using the Kruskal–Wallis test, no assumption of normality being made. Categorical variables are reported as percentages. Most were binary after encoding, the exception being aortic stenosis severity, which was retained as a three-level ordered category (no aortic stenosis, non-severe aortic stenosis, severe aortic stenosis). Categorical variables were compared using the χ² test, with Fisher’s exact test substituted where expected cell counts were small; the test applied to each variable is stated in Supplementary Table S1. Spearman rank correlation coefficients were computed between each candidate variable and MHR status. A two-sided p value below 0.05 was considered statistically significant. Because the same endpoint was tested against 15 variables, unadjusted p values are reported in Supplementary Table S1. Given the exploratory and hypothesis-generating character of this stage of the analysis, p values are reported without adjustment for multiple comparisons and should be interpreted descriptively [19].
2.8. Feature Selection
To obtain a variable set that was simultaneously informative with respect to the endpoint and internally non-redundant, the Minimum-Redundancy-Maximum-Relevance (MRMR) technique was applied [19,20]. MRMR ranks candidate variables by maximising relevance to the target while penalising mutual redundancy, so that strongly autocorrelated variables, which would otherwise dominate a distance-based clustering solution are not retained in duplicate. The 15 highest-ranking variables were carried forward to the clustering stage. The number of retained features was fixed a priori at 15 as a compromise between preserving clinical breadth and limiting the dimensionality of the space to be embedded.
2.9. Dimensionality Reduction and Cluster Analysis
The 15 selected variables were projected from 15 dimensions into two dimensions using t-distributed Stochastic Neighbour Embedding (t-SNE), a non-linear technique chosen for its preservation of local neighbourhood structure, which is the property most relevant when the objective is to detect groups of clinically similar patients [21].
Patients were then grouped in the resulting two-dimensional space using Hierarchical Density-Based Spatial Clustering of Applications with Noise (HDBSCAN) [22]. This algorithm was selected in preference to k-means or agglomerative clustering for three reasons: it does not require the number of clusters to be specified in advance; it accommodates clusters of irregular shape and of differing density; and it labels low-density observations as noise rather than forcing every patient into a group. Both steps were implemented in scikit-learn [23].
Hyperparameters were selected through a standardised grid-based tuning procedure. For t-SNE, perplexity and early exaggeration were varied; for HDBSCAN, the cluster selection method, the minimum cluster size and the minimum number of samples were varied. The combination retained was that which maximised the silhouette score, subject to two prespecified constraints: that the solution should contain between three and six clusters, and that Cramér’s V for the association between cluster membership and MHR status should be at least 0.15. The second constraint was imposed to exclude solutions that were geometrically clean but clinically uninformative; it should be noted that this introduces a degree of outcome awareness into hyperparameter selection, and the resulting association statistics are therefore not fully independent of the tuning procedure.
Clustering quality was assessed using the silhouette score, which quantifies the separation of each observation from neighbouring clusters relative to its own, and the Davies–Bouldin index, which quantifies the ratio of within-cluster scatter to between-cluster separation. The association between cluster membership and MHR status was tested using the χ² test and quantified using Cramér’s V. For the optimal configuration, descriptive statistics for all 15 clustering variables, together with MHR status and the number of admissions, were computed within each cluster in order to characterise the phenotypes clinically.
2.10. Cluster-Derived Risk Scores
Two complementary scoring approaches were derived in order to explore the potential translational utility of the clustering solution.
The first was an ordinal score, in which clusters were labelled in ascending order of the observed proportion of patients meeting the MHR definition, beginning with label 1 for the cluster with the lowest proportion.
The second was a continuous score based on Euclidean distance within the two-dimensional embedding, computed as: Cluster Risk Score = 10 × (1 − disti / distmax), where disti denotes the Euclidean distance between the two-dimensional representation of an individual patient and the median two-dimensional position of the cluster exhibiting the highest proportion of MHR, and distmax denotes the distance from that median of the furthest point in the embedding. The score ranges from 0, corresponding to the lowest estimated risk of MHR, to 10, corresponding to the highest. This formulation yields a patient-level continuous value rather than a categorical label, and therefore preserves information about position within, and distance between, phenotypes.
Spearman rank correlation coefficients were computed between each score and both MHR status and the total number of admissions, in order to assess whether the geometry of the embedding retained information relevant to the burden of recurrent hospitalization [19].
2.11. Competing-Risk Analysis
Because patients who died during follow-up were thereafter no longer at risk of rehospitalisation, treating death as ordinary censoring would have overestimated the cumulative incidence of MHR, an upward bias that is most pronounced in the oldest and most comorbid subgroups, which are precisely those of greatest clinical interest [17]. A competing-risk framework was therefore adopted.
The cumulative incidence function for MHR was estimated using the Aalen–Johansen estimator, with all-cause death specified as the competing event, implemented in the lifelines library [24]. Cumulative incidence was estimated separately within each cluster across the five-year follow-up period, and is reported at 30, 90, 180, 365, 730, 1,095, 1,460 and 1,825 days from the index admission. Pointwise 95% confidence bands are displayed with the cumulative incidence curves; tabulated values are reported as point estimates. The precision of the estimates at the later time points is constrained by the number of patients remaining at risk.
Cluster membership was treated as a derived descriptive covariate rather than as an exposure. Accordingly, the analysis estimates the prognostic discrimination afforded by a clustering-derived label and does not support causal interpretation of cluster membership.
2.12. Software
All stages of the analysis were implemented in Python Programming Language, version 3.11 [19]. Feature selection used the MRMR package [20]; dimensionality reduction and clustering used scikit-learn [23]; competing-risk estimation used lifelines [24]. Code is available from the corresponding author upon reasonable request.
2.13. Ethical Considerations
The study was conducted in accordance with the principles of the Declaration of Helsinki and was approved by the institutional ethics committee. Because the analysis was retrospective and used pseudonymised data extracted from routine clinical records, with no modification to patient management and no additional procedures, the requirement for individual informed consent was waived, relying solely on the informed consent for data utilization signed at admission. Data handling complied with Regulation (EU) 2016/679 (GDPR): direct identifiers were held in a key file logically and physically segregated from the analysis database, access was restricted to named investigators, and no identifying information appears in any reported output.
3. Results
3.1. Cohort and Preliminary Analysis
A total of 1,318 patients hospitalised with HF between 2018 and 2022 were included. The patients were followed over a median of 1039 days and 72 died during the follow-up period. MRMR selection retained 15 non-redundant variables spanning demography, valvular findings, congestion status, renal function, lipid profile, conduction abnormalities, comorbidities and pharmacological treatment.
The distribution of all 15 retained variables across the whole cohort is reported in Supplementary Table S2, and the corresponding univariable comparison between patients with and without MHR, the statistical test applied to each variable and its p value, in Supplementary Table S1.
In the univariable comparison between patients with and without MHR, significant differences were observed for aortic stenosis severity (p < 0.0001), age (p < 0.0001), furosemide use (p < 0.0001), documented pulmonary hypertension (p < 0.001), estimated glomerular filtration rate (p < 0.001), vitamin K antagonist use (p < 0.001), current smoking (p = 0.001), documented chronic kidney disease (p = 0.003), aortic regurgitation (p = 0.008), anasarca (p = 0.020), LDL cholesterol (p = 0.028) and complete atrioventricular block (p = 0.046). Resuscitated cardiac arrest (p = 0.110), thromboembolic disease (p = 0.136) and prior peripheral arterial disease (p = 0.237) did not differ significantly between the two groups.
The Spearman rank correlation coefficients between the 15 retained variables and MHR status are displayed in Figure 1 and are concordant in direction and significance with the univariable test results.
Exploratory correlation matrices for the lipid profile, the complete blood count and a broader set of cardiovascular and demographic parameters, none of which was retained by MRMR, are provided in Figure 2, Figure 3 and Figure 4. Within the complete blood count panel (Figure 3), the admission neutrophil-to-lymphocyte ratio (NLR) showed no significant rank correlation with MHR status. The only blood-count variables reaching significance against the endpoint were the erythrocyte indices, and the association was negligible in magnitude (ρ = −0.06 for the admission, maximum and mean erythrocyte counts). Admission NLR was by contrast strongly correlated with its own constituents, at ρ = 0.62 with admission neutrophils and ρ = −0.71 with admission lymphocytes, and moderately with the total leucocyte count (ρ = 0.30 to 0.33).
3.2. Cluster Analysis and Internal Validation
The tuned t-SNE–HDBSCAN pipeline yielded five clusters, whose two-dimensional embedding is shown in Figure 5. Cluster sizes ranged from 176 to 498 patients (Table 1).
Internal validation indicated moderate separation, with a silhouette score of 0.498 and a Davies–Bouldin index of 0.747 (Table 2). Cluster membership was significantly associated with MHR status (χ² p < 0.0001), with a Cramér’s V of 0.17 indicating a weak but non-trivial association.
The proportion of patients meeting the MHR definition increased monotonically across clusters, from 5.1% in Cluster 1 to 24.9% in Cluster 5, an approximately five-fold gradient (Table 1, Figure 6). Cluster 5 was also the only phenotype with a median of more than one admission during follow-up. Descriptive statistics for all 15 clustering variables, together with MHR status and admission count, are reported for each cluster in Supplementary Table S3. Inspection of that table shows that the five clusters correspond closely to the combinations of three binary variables: documented pulmonary hypertension was present in 100% of Clusters 2, 4 and 5 and essentially absent from Clusters 1 and 3; loop-diuretic use was absent from Clusters 1 and 2, near-universal in Clusters 3 and 4, and present in 89.5% of Cluster 5; and vitamin K antagonist therapy separated Cluster 5 (100%) from Cluster 4 (0%).
3.3. Phenotype Characteristics
The five phenotypes were separated principally by documented pulmonary hypertension, loop-diuretic requirement and oral anticoagulation with a vitamin K antagonist, with secondary gradients in age, renal function, valvular findings and congestion burden (Table 3).
The clusters may be summarised as follows.
- Cluster 1 (n = 176; MHR 5.1%) is the lowest-risk and youngest phenotype (median age 68 years), with virtually no documented pulmonary hypertension (0.6%), no loop-diuretic requirement, and the lowest prevalence of aortic stenosis of any grade (9.7%) and of aortic regurgitation (8.0%). Documented chronic kidney disease was low (4.5%), comparable to Cluster 2 and roughly a third of the prevalence seen in Clusters 3 to 5. Resuscitated cardiac arrest was comparatively frequent (4.5%), suggesting an arrhythmic rather than congestive presentation.
- Cluster 2 (n = 211; MHR 9.0%) contains documented pulmonary hypertension in the absence of loop-diuretic use, with the best preserved renal function of the cohort (median eGFR 68.0 mL/min/1.73 m²), the highest proportion of resuscitated cardiac arrest (6.2%) and of current smokers (18.0%), and the lowest prevalence of severe aortic stenosis (0.5%).
- Cluster 3 (n = 252; MHR 13.5%) is rich in loop-diuretic use (99.6%) without documented pulmonary hypertension, intermediate age (median 74 years) and a burden of documented chronic kidney disease (13.1%) comparable to that of Clusters 4 and 5.
- Cluster 4 (n = 498; MHR 18.5%) is the largest phenotype, combining pulmonary hypertension with near-universal loop-diuretic use (98.8%) and the complete absence of vitamin K antagonist therapy. It was the oldest phenotype (median age 76 years), with the lowest renal function (median eGFR 61.1 mL/min/1.73 m²), the highest prevalence of anasarca (6.0%) and the highest prevalence of aortic stenosis of any grade (19.1%) and of severe aortic stenosis (7.6%).
- Cluster 5 (n = 181; MHR 24.9%) is the highest-risk phenotype, defined by pulmonary hypertension, high loop-diuretic use (89.5%) and anticoagulation with a vitamin K antagonist. It carried the highest prevalence of aortic regurgitation (21.5%), documented chronic kidney disease (13.3%) and thromboembolic disease (5.5%), and was the only cluster with a median of two admissions during follow-up, a profile consistent with a chronically anticoagulated, atrial-fibrillation-enriched population.
3.4. Cluster-Derived Risk Scores
Both the ordinal cluster-label score and the continuous Euclidean-distance score correlated significantly with MHR status and with the total number of admissions, but the correlations were weak: Spearman ρ = 0.170 and 0.154 respectively against MHR status, and 0.154 and 0.129 against the total number of admissions (Figure 7). The two scores were strongly correlated with one another (ρ = 0.907). The two-dimensional embedding therefore retains information relevant to the burden of recurrent hospitalisation, and a continuous patient-level score can be derived from cluster geometry without recourse to a supervised model; the magnitude of the association is nevertheless modest, and neither score performs well enough to be used as a stand-alone risk instrument.
3.5. Competing-Risk Cumulative Incidence of Recurrent Rehospitalisation
After treating all-cause death as a competing event, the cumulative incidence of MHR diverged progressively across phenotypes throughout follow-up (Figure 8, Table 4). At 30 days, cumulative incidence was negligible in all clusters (0–1.2%), consistent with the requirement for at least three admissions to accrue. Separation became apparent from 90 days onwards and widened thereafter.
At one year, estimated cumulative incidence ranged from 0.6% in Cluster 1 to 10.4% in Cluster 4, and at three years from 4.2% in Cluster 1 to 19.0% in Cluster 4. From 180 days onwards Cluster 1 retained the lowest cumulative incidence at every time point, consistent with its favourable baseline profile, whereas Clusters 4 and 5 accrued events most rapidly. The ordering of the cumulative incidence curves does not reproduce the ordering of the crude MHR proportions exactly: Cluster 5, which had the highest crude proportion of patients with ≥3 admissions, showed a slightly lower cumulative incidence than Cluster 4 at every time point up to four years, the ordering reversing only at the unstable five-year horizon. This reflects differences between the clusters in the timing of readmissions and in competing mortality, and illustrates why crude proportions and competing-risk estimates should not be used interchangeably.
Estimates at the five-year horizon should be interpreted with considerable caution. By 1,825 days the number of patients still at risk within each cluster was small, and the resulting cumulative incidence estimates are correspondingly unstable, most conspicuously the value of 0.951 in Cluster 2, which reflects the behaviour of the estimator when very few individuals remain at risk rather than a credible absolute risk. The pronounced widening of the pointwise confidence bands towards the end of follow-up (Figure 8) illustrates the same phenomenon. We therefore regard the three-year horizon as the limit of reliable inference in this cohort, and report the later estimates for completeness only.
4. Discussion
In a consecutive real-world cohort of 1,318 hospitalised HF patients, an unsupervised MRMR–t-SNE–HDBSCAN pipeline identified five phenotypes with moderate internal separation. Cluster membership was significantly associated with the burden of recurrent hospitalisation and, after accounting for death as a competing risk, the five phenotypes displayed divergent cumulative incidence curves for multiple HF rehospitalisation. The crude proportion of patients accruing three or more admissions rose approximately five-fold across the phenotype ordering, from 5.1% to 24.9%, showing that a data-driven summary of routinely recorded variables can stratify readmission burden across an unselected hospitalised population.
These findings sit within a large and rapidly expanding body of phenomapping literature. The scoping review cited above identified 73 unsupervised phenotyping studies in HF, comprising 1,245,140 patients and 308 derived clusters, with a median of four clusters per study (range 2–10) and a median of 27 input features (range 5–4,210) [16]. Our five-cluster solution built on 15 variables therefore sits within the mainstream of the field on both counts, and falls within the range of cluster counts (four to seven) associated in that review with the highest proportion of clearly interpretable phenotypes. Two aspects of our pipeline are less typical, but advantageous. Feature selection in the field is overwhelmingly by author discretion, applied in 60 of the 73 studies, with algorithmic or statistical filtering used in six, model-based importance ranking in four and dimensionality reduction in three; the use of MRMR places the present analysis in that small minority. More strikingly, no study in the atlas employed a density-based clustering algorithm, and only eight used any form of dimensionality-reduction-assisted clustering. The t-SNE–HDBSCAN combination applied here therefore appears not to have been used previously for HF phenotyping. Our solution also differs from several earlier reports in that we did not recover a compact, biologically distinctive phenotype accounting for a disproportionate share of adverse events [11,15]: the gradient in our cohort was graded rather than concentrated, and the highest-risk cluster comprised 181 patients (13.7% of the cohort) with a crude MHR proportion of 24.9%. The phenotype ordering was instead dominated by documented pulmonary hypertension, loop-diuretic requirement and vitamin K antagonist therapy, variables that document index comorbidity and the intensity of established treatment rather than latent biology.
Two features of the solution merit comment. First, the highest-risk phenotype was characterised by universal vitamin K antagonist therapy together with the highest prevalence of aortic regurgitation, documented chronic kidney disease and thromboembolic disease, a constellation consistent with a chronically anticoagulated, atrial-fibrillation-enriched population in whom recurrent congestive decompensation is expected, and one in which anticoagulation is a marker of the underlying rhythm, metallic valves and embolic burden rather than a driver of readmission. In the standardised phenotype vocabulary proposed by the scoping review, this cluster corresponds most closely to a rhythm/electrical phenotype, a category represented by 26 of the 308 catalogued clusters and distributed across better, intermediate and worse risk strata [16]. The renal profile of our phenotypes, documented chronic kidney disease two- to three-fold more prevalent in Clusters 3, 4 and 5 than in Clusters 1 and 2, with the lowest estimated glomerular filtration rate in the largest and oldest cluster, is likewise consistent with the cardiorenal or renal-dominant phenotype being among the categories most reliably associated with worse risk in that atlas, in 72.7% of such clusters [16], and with the prognostic weight now accorded to chronic kidney disease in the first dedicated ESC and European Renal Association guideline on cardiovascular disease and chronic kidney disease [25]. Second, the phenotype with the highest prevalence of aortic stenosis of any grade and of severe aortic stenosis (Cluster 4) was also the oldest and the most renally impaired, yet did not carry the highest crude readmission burden. Aortic stenosis was in fact distributed across all five phenotypes, with severe stenosis ranging only from 0.5% to 7.6%; the algorithm did not isolate a valvular subgroup. That absence is consistent with the wider literature, in which only three of 308 catalogued clusters were characterised as valvular, against 18 cardiorenal and 35 structural or remodelling clusters [16], although this may partly reflect how infrequently valvular variables are entered into clustering pipelines rather than the absence of a valvular phenotype in nature. Either way, the finding cautions against assuming that a treatable structural driver will be the feature an unsupervised pipeline surfaces.
One negative finding deserves brief comment because it concerns a widely studied marker. The neutrophil-to-lymphocyte ratio (NLR) is an inexpensive index of systemic inflammation derived from the routine blood count, and meta-analyses have linked higher values to all-cause mortality in HF [26,27]. Its relationship with readmission is much less well established: in the pooled analysis by Wang et. al, the adjusted hazard ratio for rehospitalisation did not reach statistical significance (2.19, 95% CI 0.94–5.09), in contrast to the significant association with mortality [26]. Our data are consistent with that distinction, in that admission NLR showed no significant correlation with the burden of recurrent hospitalisation and suggest that the prognostic value of NLR in HF may be specific to mortality rather than extending to readmission. Independently of any association with outcome, NLR would in any case have been unlikely to survive MRMR selection: it is by construction a ratio of two variables already present in the candidate set, and it correlated at ρ = 0.62 with admission neutrophils and ρ = −0.71 with admission lymphocytes, which is precisely the redundancy the algorithm is designed to penalise.
An important interpretive point concerns what clustering does and does not deliver. Clustering is a data-compression step, not a prediction algorithm: the cluster label carries prognostic information only because the variables used to define it (documented comorbidity, valvular status and treatment intensity) are themselves prognostic [8]. Accordingly, the associations reported here should be read as descriptive risk stratification rather than as causal effects of “belonging” to a cluster. Phenotype membership explains only a small part of the variance in readmission burden, and is best positioned as a complement to, not a replacement for established risk scores [18]. The decisive tests, which the present design cannot deliver, are whether phenotype membership adds discrimination and calibration beyond a conventional risk model and beyond a simple cross-tabulation of its own constituent variables; both are prespecified objectives of our prospective extension.
The competing-risk framing is central to the credibility of the outcome analysis. Because a deceased patient can never be rehospitalised, Kaplan–Meier estimates of readmission that censor at death overestimate the true cumulative incidence, an effect most pronounced in the oldest and sickest phenotypes, which are also the most clinically interesting [17]. By estimating cumulative incidence functions with the Aalen–Johansen estimator and treating death as a competing event, we obtain readmission probabilities that reflect real-world absolute risk. This aligns the analysis with contemporary reporting standards for competing-risks data [17] and distinguishes the present work from earlier readmission analyses that relied on standard survival methods.
Methodologically, the density-based HDBSCAN algorithm offers advantages over the k-means and agglomerative approaches used in most prior HF phenomapping studies [8,9,10,11]: it does not require the number of clusters to be pre-specified, tolerates clusters of irregular shape and density, and explicitly labels outliers as noise rather than forcing them into a group. Coupled with MRMR feature selection, which retains variables that are individually informative yet mutually non-redundant, and with t-SNE, which preserves local neighbourhood structure, the pipeline is well suited to the heterogeneous, partially incomplete data typical of retrospective HF cohorts.
The clinical and research implications are correspondingly modest but real. The phenotype ordering identifies a subgroup with an approximately five-fold higher crude burden of recurrent admission, which could in principle support bedside triage and the intensification of follow-up. The stratification is orthogonal to the conventional LVEF- and aetiology-based taxonomy, which incorporates neither pulmonary hypertension, nor loop-diuretic requirement, nor oral anticoagulation; what has not been established is whether the clustering label adds prognostic information beyond those three variables taken directly, and that comparison is a prerequisite for clinical use. The more substantial contribution of this work is methodological: it provides the effect-size expectations and the design targets for a prospective observational programme in which death ascertainment is complete by design, recurrent hospitalisations are modelled as total events with death as a competing risk, feature selection and clustering are restricted to pre-treatment patient characteristics and blinded to outcome, and phenotype membership is formally tested for incremental prognostic value over both conventional risk scores and a simple cross-tabulation of its constituent variables. Reporting such work against a standardised vocabulary for cluster characterisation, as recent calls in this literature have urged [16], would also make results comparable across cohorts rather than each study defining its own phenotypes de novo.
Limitations
Several limitations temper these conclusions. First, this is a single-centre, retrospective study; the phenotypes require external and prospective validation before any claim of generalisability, and internal validity would be strengthened by bootstrap optimism correction rather than reliance on point estimates alone.
Second, the clinical labels attached to the phenotypes above should be read as descriptions of the resulting strata rather than as discovered disease entities. Clusters defined by what patients receive, rather than by what they have, appear systematically resistant to interpretation as disease entities. Two comparators must be kept distinct here. The conventional LVEF and aetiology-based taxonomy contains none of these three variables, so the strata described here do cut across that classification and are not recoverable from it. What has not been established is the narrower question of whether the clustering label adds prognostic information beyond the three constituent variables considered directly. A solution restricted to pre-treatment patient characteristics, and a formal comparison of the clustering label against a cross-tabulation of those variables, are both warranted before these phenotypes are used for any practical purpose.
Third, missing values were replaced with the column median before feature selection, and categorical fields were one-hot encoded, so that the absence of a recorded value generated its own indicator.
5. Conclusions
Unsupervised phenotyping of an unselected, hospitalised HF population identified five subgroups whose cumulative incidence of recurrent rehospitalisation diverged once death was treated as a competing risk, with an approximately five-fold gradient in the crude proportion of patients accruing three or more admissions. These strata cut across the conventional LVEF- and aetiology-based taxonomy, which incorporates none of the variables that separated them. The separation was driven largely by three binary descriptors: documented pulmonary hypertension, loop-diuretic requirement and vitamin K antagonist therapy, so the phenotypes are best regarded as a pragmatic descriptive stratification of routinely recorded data rather than as biologically distinct entities. Whether such a stratification carries prognostic information beyond its own constituent variables is the question a prospective study must answer.
Supplementary Materials
The following supporting information can be downloaded at the website of this paper posted on Preprints.org.
Author Contributions
Conceptualization, MRP. and AV.; methodology, GC and AV.; software, AV validation, RDG., LM. and SMB.; formal analysis, AV.; investigation, MRP.; resources, MRP.; data curation, GC.; writing—original draft preparation, MRP and AV.; writing—review and editing, RDG and LM.; visualization, SMB.; supervision, ACP.; project administration, ACP. All authors have read and agreed to the published version of the manuscript.
Funding
This research received no external funding.
Institutional Review Board Statement
The study was conducted in accordance with the Declaration of Helsinki, and approved by the Ethics Committee of Elias University Emergency Hospital (No. 22062026-1/22.06.2026).
Informed Consent Statement
The requirement for individual informed consent was waived owing to the retrospective design and the use of pseudonymised data.
Data Availability Statement
“The pseudonymised dataset supporting the conclusions of this article may be made available by the corresponding author upon reasonable request, subject to institutional and data-protection approvals.
Acknowledgments
Publication of this paper was supported by the University of Medicine and Pharmacy Carol Davila through the institutional program Publish not Perish.
Conflicts of Interest
The authors declare no conflicts of interest.
Abbreviations
The following abbreviations are used in this manuscript:
| AVB | Atrioventricular block |
| CA | Resuscitated cardiac arrest |
| CKD | Chronic kidney disease |
| eGFR | Estimated glomerular filtration rate |
| HDBSCAN | Hierarchical Density-Based Spatial Clustering of Applications with Noise |
| HF | Heart failure |
| HDL | High-density lipoprotein cholesterol |
| IQR | Interquartile range |
| LDL | Low-density lipoprotein cholesterol |
| LVEF | Left ventricular ejection fraction |
| MHR | Multiple heart failure rehospitalisation (≥3 admissions) |
| MRMR | Minimum-Redundancy-Maximum-Relevance |
| NLR | Neutrophil-to-lymphocyte ratio |
| PAD | Peripheral arterial disease |
| PHT | Pulmonary hypertension |
| t-SNE | t-distributed Stochastic Neighbour Embedding |
| TED | Thromboembolic disease |
| UML | Unsupervised machine learning |
| VKA | Vitamin K antagonist |
References
- McDonagh, T.A.; Metra, M.; Adamo, M.; Gardner, R.S.; Baumbach, A.; Böhm, M.; Burri, H.; Butler, J.; Čelutkienė, J.; Chioncel, O.; et al. 2021 ESC Guidelines for the Diagnosis and Treatment of Acute and Chronic Heart Failure. Eur. Heart J. 2021, 42, 3599–3726. [Google Scholar] [CrossRef] [PubMed]
- Køber, L.; Adamo, M.; Ruwald, A.-C.; Tomasoni, D.; Anderson, L.J.; Andersson, C.; Brugts, J.J.; Chioncel, O.; Donal, E.; Ferdinandy, P.; et al. 2026 ESC Guidelines for the Management of Heart Failure. Eur. Heart J. 2026. [Google Scholar] [CrossRef] [PubMed]
- Walsh, M.N.; Kober, L.; Sliwa, K.; Adamo, M.; Agarwal, A.; Banerjee, A.; Bozkurt, B.; Cikes, M.; Damasceno, A.; Desai, A.S.; et al. AHA/ACC/ESC/WHF Expert Consensus Document: Second Universal Definition of Heart Failure (2026). JACC 2026. [Google Scholar] [CrossRef] [PubMed]
- Greene, S.J.; Bauersachs, J.; Brugts, J.J.; Ezekowitz, J.A.; Lam, C.S.P.; Lund, L.H.; Ponikowski, P.; Voors, A.A.; Zannad, F.; Zieroth, S.; et al. Worsening Heart Failure: Nomenclature, Epidemiology, and Future Directions. J. Am. Coll. Cardiol. 2023, 81, 413–424. [Google Scholar] [CrossRef] [PubMed]
- Metra, M.; Tomasoni, D.; Adamo, M.; Bayes-Genis, A.; Filippatos, G.; Abdelhamid, M.; Adamopoulos, S.; Anker, S.D.; Antohi, L.; Böhm, M.; et al. Worsening of Chronic Heart Failure: Definition, Epidemiology, Management and Prevention. A Clinical Consensus Statement by the Heart Failure Association of the European Society of Cardiology. Eur. J. Heart Fail. 2023, 25, 776–791. [Google Scholar] [CrossRef] [PubMed]
- Lindmark, K.; Boman, K.; Stålhammar, J.; Olofsson, M.; Lahoz, R.; Studer, R.; Proudfoot, C.; Corda, S.; Fonseca, A.F.; Costa-Scharplatz, M.; et al. Recurrent Heart Failure Hospitalizations Increase the Risk of Cardiovascular and All-Cause Mortality in Patients with Heart Failure in Sweden: A Real-World Study. ESC Heart Fail. 2021, 8, 2144–2153. [Google Scholar] [CrossRef] [PubMed]
- Wang, Q.; Yu, F.; Su, H.; Liu, Z.; Hu, K.; Wu, G.; Yan, J.; Chen, K.; Yang, D. Recurrent Heart Failure Hospitalizations in Heart Failure with Preserved Ejection Fraction: An Analysis of TOPCAT Trial. ESC Heart Fail. 2024, 11, 475–482. [Google Scholar] [CrossRef] [PubMed]
- Shah, S.J.; Katz, D.H.; Selvaraj, S.; Burke, M.A.; Yancy, C.W.; Gheorghiade, M.; Bonow, R.O.; Huang, C.-C.; Deo, R.C. Phenomapping for Novel Classification of Heart Failure With Preserved Ejection Fraction. Circulation 2015, 131, 269–279. [Google Scholar] [CrossRef] [PubMed]
- Segar, M.W.; Patel, K.V.; Ayers, C.; Basit, M.; Tang, W.H.W.; Willett, D.; Berry, J.; Grodin, J.L.; Pandey, A. Phenomapping of Patients with Heart Failure with Preserved Ejection Fraction Using Machine Learning-Based Unsupervised Cluster Analysis. Eur. J. Heart Fail. 2020, 22, 148–158. [Google Scholar] [CrossRef] [PubMed]
- Shah, P.; Zheng, Y.; Pieske, B.; Melenovsky, V.; Lam, C.S.P.; Sliwa, K.; Butler, J.; Ezekowitz, J.A.; deFilippi, C.R.; O’Connor, C.M.; et al. Phenomapping in Heart Failure With Reduced Ejection Fraction to Identify Subpopulations With High Residual Risk: A VICTORIA Substudy. Circ. Heart Fail. 2026, 19. [Google Scholar] [CrossRef] [PubMed]
- Jentzer, J.C.; Reddy, Y.N.V.; Soussi, S.; Crespo-Diaz, R.; Patel, P.C.; Lawler, P.R.; Mebazaa, A.; Dunlay, S.M. Unsupervised Machine Learning to Identify Subphenotypes Among Cardiac Intensive Care Unit Patients with Heart Failure. ESC Heart Fail. 2024, 11, 4242–4256. [Google Scholar] [CrossRef] [PubMed]
- Rastogi, T.; Hutin, O.; ter Maaten, J.M.; Baudry, G.; Monzo, L.; Bresso, E.; Duarte, K.; Tromp, J.; Voors, A.A.; Girerd, N. Identifying Congestion Phenotypes Using Unsupervised Machine Learning in Acute Heart Failure. Eur. Heart J.-Digit. Health 2025, 6, 907–918. [Google Scholar] [CrossRef] [PubMed]
- Simonsen, J.Ø.; Modin, D.; Skaarup, K.; Djernæs, K.; Lassen, M.C.H.; Johansen, N.D.; Marott, J.L.; Jensen, M.T.; Jensen, G.B.; Schnohr, P.; et al. Utilizing Echocardiography and Unsupervised Machine Learning for Heart Failure Risk Identification. Int. J. Cardiol. 2025, 418, 132636. [Google Scholar] [CrossRef] [PubMed]
- Verbrugge, F.H.; Omote, K.; Reddy, Y.N.V.; Sorimachi, H.; Obokata, M.; Borlaug, B.A. Heart Failure with Preserved Ejection Fraction in Patients with Normal Natriuretic Peptide Levels Is Associated with Increased Morbidity and Mortality. Eur. Heart J. 2022, 43, 1941–1951. [Google Scholar] [CrossRef] [PubMed]
- Karaçam, M.; Kültürsay, B.; Mutlu, D.; Tanyeri, S.; Kaya, A.; Efe, S.Ç.; Doğan, C.; Halil, G.S.; Akbal, Ö.Y.; Kırali, K.; et al. From Patterns to Prognosis: Machine Learning–Derived Clusters in Advanced Heart Failure. Front. Cardiovasc. Med. 2025, 12. [Google Scholar] [CrossRef] [PubMed]
- Huang, W.; Siswanto, B.B.; Nurhafizah, A.; Khairunnisa, A.R.; Kezia, C.; Frederich, A.; Syahruddin, S.S.; Retnoningrum, I.A.; Santoso, R.M. Mapping Unsupervised Machine Learning Studies in Heart Failure Population: A Scoping Review and Atlas of Study Characteristics and Cluster Phenotypes. Int. J. Cardiol. Innov. 2026, 3, 100016. [Google Scholar] [CrossRef]
- Austin, P.C.; Lee, D.S.; Fine, J.P. Introduction to the Analysis of Survival Data in the Presence of Competing Risks. Circulation 2016, 133, 601–609. [Google Scholar] [CrossRef] [PubMed]
- Stoiculescu, F.-M.; Hădăreanu, D.-R.; Hădăreanu, C.-D.; Donoiu, I.; Istrătoaie, O.; Raicea, V.-C.; Florescu, C. Prediction Model of Rehospitalization and Mortality in Heart Failure Patients with Preserved and Mildly Reduced Ejection Fraction: The AD2NNER Risk Score. Front. Cardiovasc. Med. 2025, 12. [Google Scholar] [CrossRef] [PubMed]
- Python Software Foundation Python Language Reference, Version 3.11. Available online: https://docs.python.org/3.11/reference/index.html (accessed on 4 September 2026).
- DING, C.; PENG, H. MINIMUM REDUNDANCY FEATURE SELECTION FROM MICROARRAY GENE EXPRESSION DATA. J. Bioinform. Comput. Biol. 2005, 03, 185–205. [Google Scholar] [CrossRef] [PubMed]
- van der Maaten, L.; Hinton, G. Visualizing Data Using T-SNE. J. Mach. Learn. Res. 2008, 9, 2579–2605. [Google Scholar]
- Campello, R.J.G.B.; Moulavi, D.; Sander, J. Density-Based Clustering Based on Hierarchical Density Estimates; 2013; pp. 160–172. [Google Scholar]
- Pedregosa, F.; Varoquaux, G.; Gramfort, A.; Michel, V.; Thirion, B.; Grisel, O.; Blondel, M.; Müller, A.; Nothman, J.; Louppe, G.; et al. Scikit-Learn: Machine Learning in Python. 2012. [Google Scholar] [CrossRef]
- Davidson-Pilon, C. Lifelines: Survival Analysis in Python. J. Open Source Softw. 2019, 4, 1317. [Google Scholar] [CrossRef]
- Damman, K.; ter Maaten, J.M.; Mayne, K.J.; Bolignano, D.; Brown, E.M.; da Costa, B.R.; Dagre, A.; Gansevoort, R.T.; Gavina, C.; Goette, A.; et al. 2026 ESC Guidelines for the Management of Cardiovascular Disease and Chronic Kidney Disease, in Collaboration with the European Renal Association (ERA). Eur. Heart J. 2026. [Google Scholar] [CrossRef] [PubMed]
- Wang, X.; Fan, X.; Ji, S.; Ma, A.; Wang, T. Prognostic Value of Neutrophil to Lymphocyte Ratio in Heart Failure Patients. Clin. Chim. Acta 2018, 485, 44–49. [Google Scholar] [CrossRef] [PubMed]
- Vakhshoori, M.; Nemati, S.; Sabouhi, S.; Yavari, B.; Shakarami, M.; Bondariyan, N.; Emami, S.A.; Shafie, D. Neutrophil to Lymphocyte Ratio (NLR) Prognostic Effects on Heart Failure; a Systematic Review and Meta-Analysis. BMC Cardiovasc. Disord. 2023, 23, 555. [Google Scholar] [CrossRef] [PubMed]
Figure 1.
Spearman rank correlation matrix for the 15 variables selected by the minimum-Redundancy-Maximum-Relevance (MRMR) technique and multiple heart failure rehospitalisation status. Admission no. ≥3 denotes the MHR endpoint. Abbreviations: MHR = multiple heart failure rehospitalisation (≥3 hospital admissions in total during follow-up); LDL = low-density lipoprotein cholesterol; PHT = documented pulmonary hypertension; GFR = estimated glomerular filtration rate; CA = resuscitated cardiac arrest during the index episode; complete AVB = complete atrioventricular block; VKA = vitamin K antagonist; TED = thromboembolic disease; CKD = chronic kidney disease; PAD = peripheral arterial disease. NS = non-significant (p ≥ 0.05).
Figure 1.
Spearman rank correlation matrix for the 15 variables selected by the minimum-Redundancy-Maximum-Relevance (MRMR) technique and multiple heart failure rehospitalisation status. Admission no. ≥3 denotes the MHR endpoint. Abbreviations: MHR = multiple heart failure rehospitalisation (≥3 hospital admissions in total during follow-up); LDL = low-density lipoprotein cholesterol; PHT = documented pulmonary hypertension; GFR = estimated glomerular filtration rate; CA = resuscitated cardiac arrest during the index episode; complete AVB = complete atrioventricular block; VKA = vitamin K antagonist; TED = thromboembolic disease; CKD = chronic kidney disease; PAD = peripheral arterial disease. NS = non-significant (p ≥ 0.05).
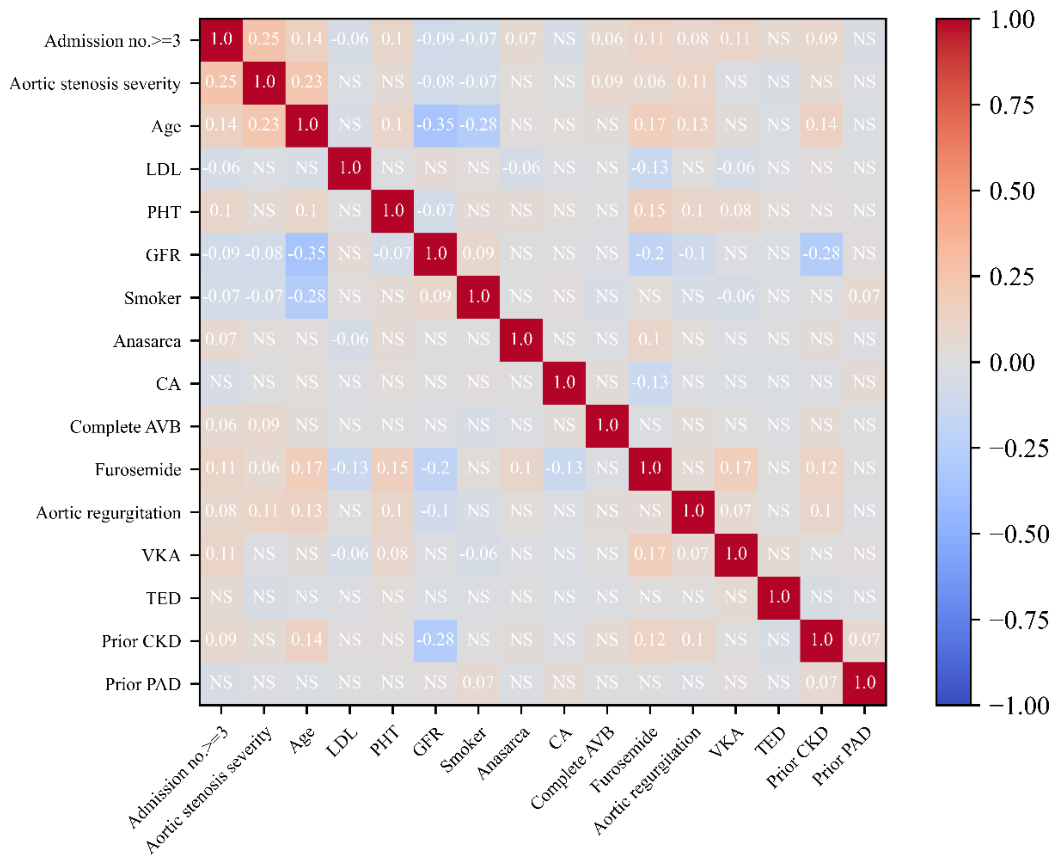
Figure 2.
Spearman rank correlation coefficients for the lipid profile and multiple heart failure rehospitalisation (MHR, admission no. ≥3) status. These variables were not retained by MRMR and are shown for exploratory purposes. LDL = low-density lipoprotein cholesterol; HDL = high-density lipoprotein cholesterol; MRMR = minimum-Redundancy-Maximum-Relevance; NS = non-significant (p ≥ 0.05).
Figure 2.
Spearman rank correlation coefficients for the lipid profile and multiple heart failure rehospitalisation (MHR, admission no. ≥3) status. These variables were not retained by MRMR and are shown for exploratory purposes. LDL = low-density lipoprotein cholesterol; HDL = high-density lipoprotein cholesterol; MRMR = minimum-Redundancy-Maximum-Relevance; NS = non-significant (p ≥ 0.05).
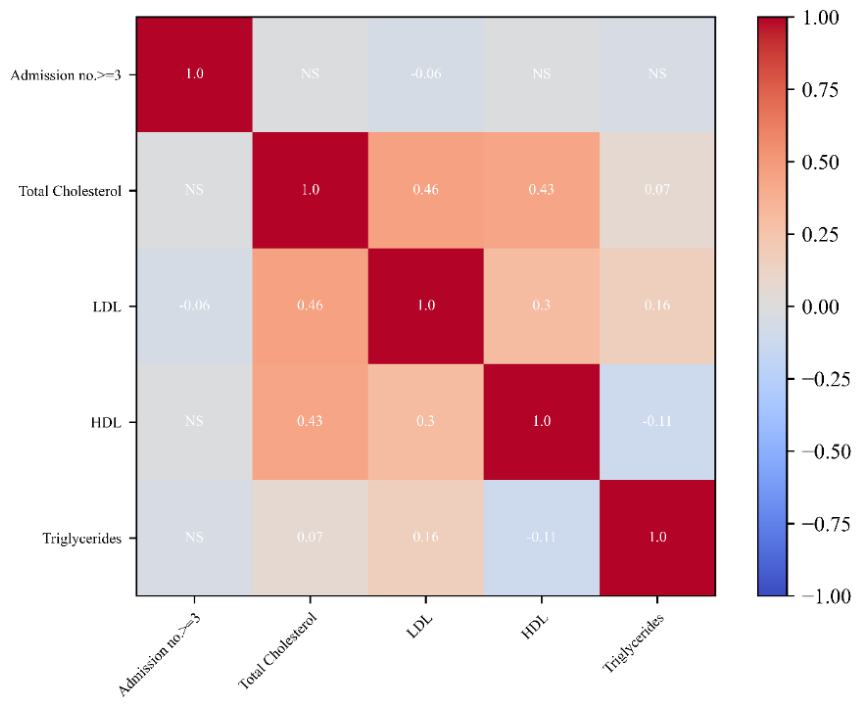
Figure 3.
Spearman rank correlation coefficients for the complete blood count and multiple heart failure rehospitalisation (MHR, admission no. ≥3) status. These variables were not retained by MRMR and are shown for exploratory purposes. Variables prefixed “Admission” denote the value recorded on admission and those prefixed “Max” the highest value recorded during the index hospitalisation; unprefixed labels denote the mean value across the episode. NLR = neutrophil-to-lymphocyte ratio; MRMR = minimum-Redundancy-Maximum-Relevance; NS = non-significant (p ≥ 0.05).
Figure 3.
Spearman rank correlation coefficients for the complete blood count and multiple heart failure rehospitalisation (MHR, admission no. ≥3) status. These variables were not retained by MRMR and are shown for exploratory purposes. Variables prefixed “Admission” denote the value recorded on admission and those prefixed “Max” the highest value recorded during the index hospitalisation; unprefixed labels denote the mean value across the episode. NLR = neutrophil-to-lymphocyte ratio; MRMR = minimum-Redundancy-Maximum-Relevance; NS = non-significant (p ≥ 0.05).
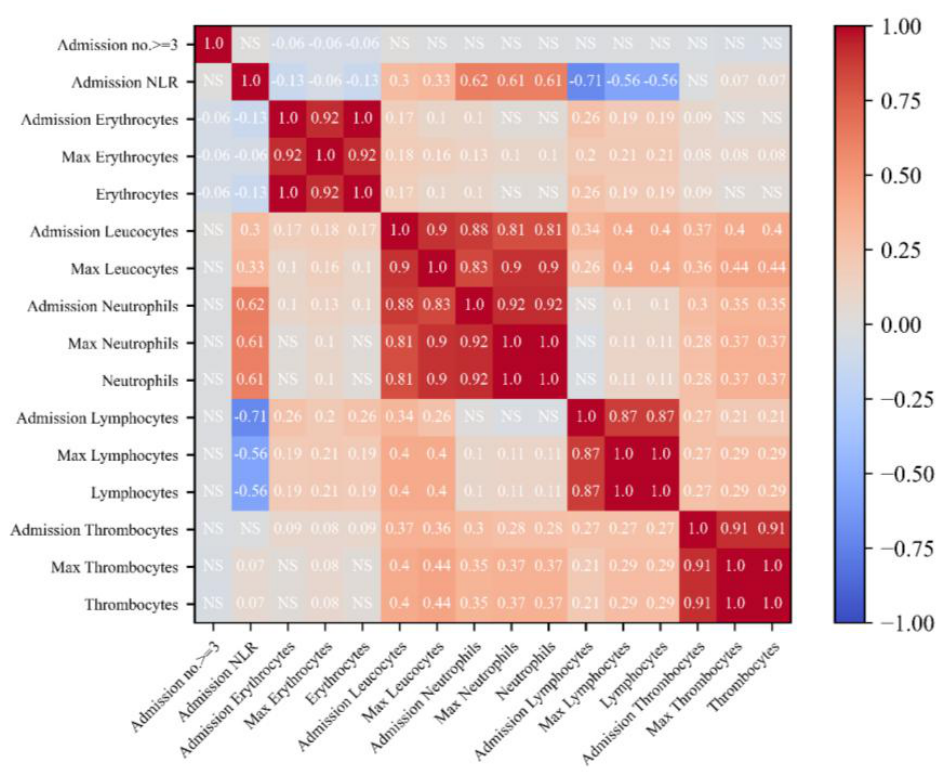
Figure 4.
Spearman rank correlation coefficients for a broader set of cardiovascular, demographic and smoking-status parameters and multiple heart failure rehospitalisation (MHR, admission no. ≥3) status. These variables were not retained by MRMR and are shown for exploratory purposes. BP = blood pressure; HTN = arterial hypertension; EF <35 = left ventricular ejection fraction below 35%; HR = heart rate; MRMR = minimum-Redundancy-Maximum-Relevance; NS = non-significant (p ≥ 0.05).
Figure 4.
Spearman rank correlation coefficients for a broader set of cardiovascular, demographic and smoking-status parameters and multiple heart failure rehospitalisation (MHR, admission no. ≥3) status. These variables were not retained by MRMR and are shown for exploratory purposes. BP = blood pressure; HTN = arterial hypertension; EF <35 = left ventricular ejection fraction below 35%; HR = heart rate; MRMR = minimum-Redundancy-Maximum-Relevance; NS = non-significant (p ≥ 0.05).
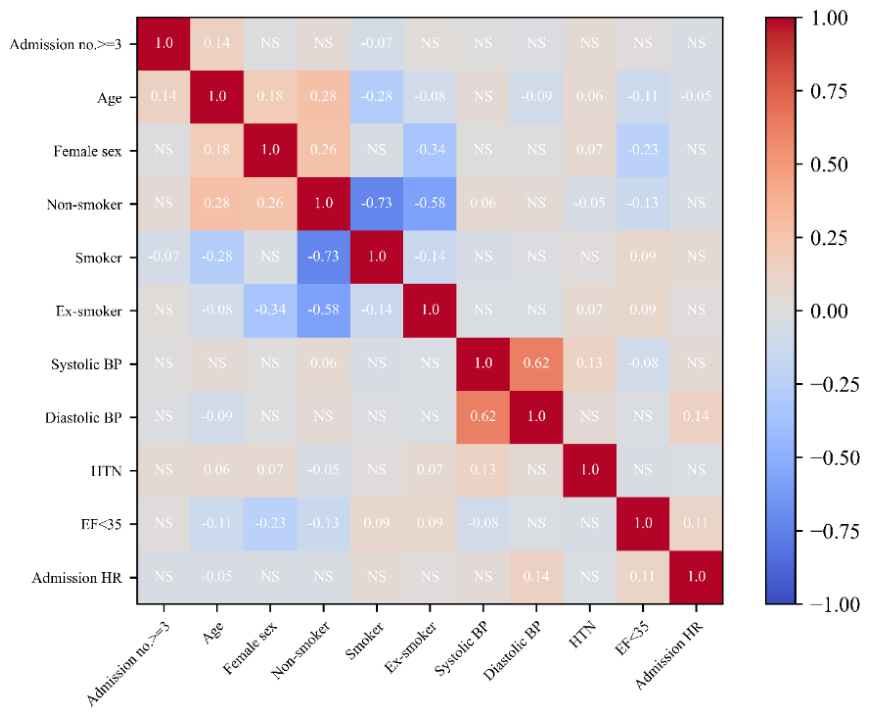
Figure 5.
Two-dimensional t-distributed Stochastic Neighbour Embedding (t-SNE) representation of the five phenotypes derived by Hierarchical Density-Based Spatial Clustering of Applications with Noise (HDBSCAN) from the 15 variables selected by the minimum-Redundancy-Maximum-Relevance (MRMR) technique. Each point represents one patient; colour denotes cluster membership.
Figure 5.
Two-dimensional t-distributed Stochastic Neighbour Embedding (t-SNE) representation of the five phenotypes derived by Hierarchical Density-Based Spatial Clustering of Applications with Noise (HDBSCAN) from the 15 variables selected by the minimum-Redundancy-Maximum-Relevance (MRMR) technique. Each point represents one patient; colour denotes cluster membership.
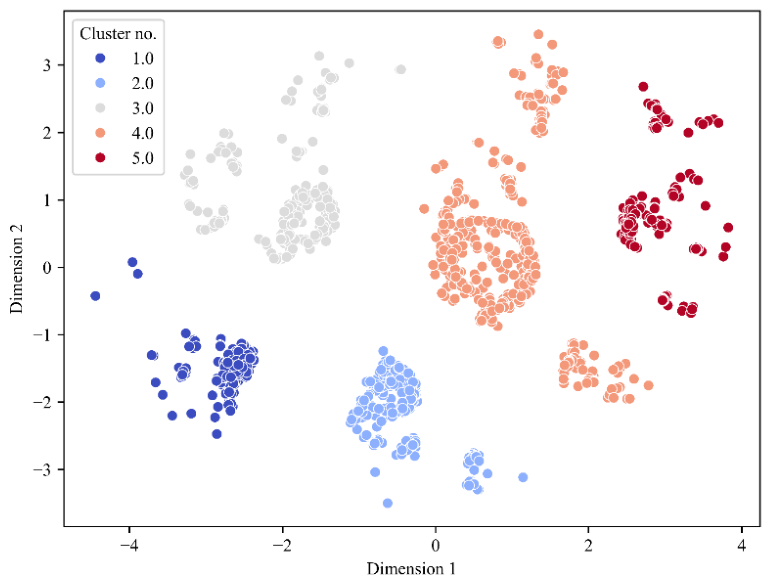
Figure 6.
Cluster size and burden of recurrent hospitalisation in each phenotype. (A) Fraction of patients with multiple heart failure rehospitalisation (MHR, ≥3 admissions) plotted against cluster size; marker size and colour encode the MHR fraction. (B) Number of patients (bars) and proportion with MHR (line) in each phenotype.
Figure 6.
Cluster size and burden of recurrent hospitalisation in each phenotype. (A) Fraction of patients with multiple heart failure rehospitalisation (MHR, ≥3 admissions) plotted against cluster size; marker size and colour encode the MHR fraction. (B) Number of patients (bars) and proportion with MHR (line) in each phenotype.
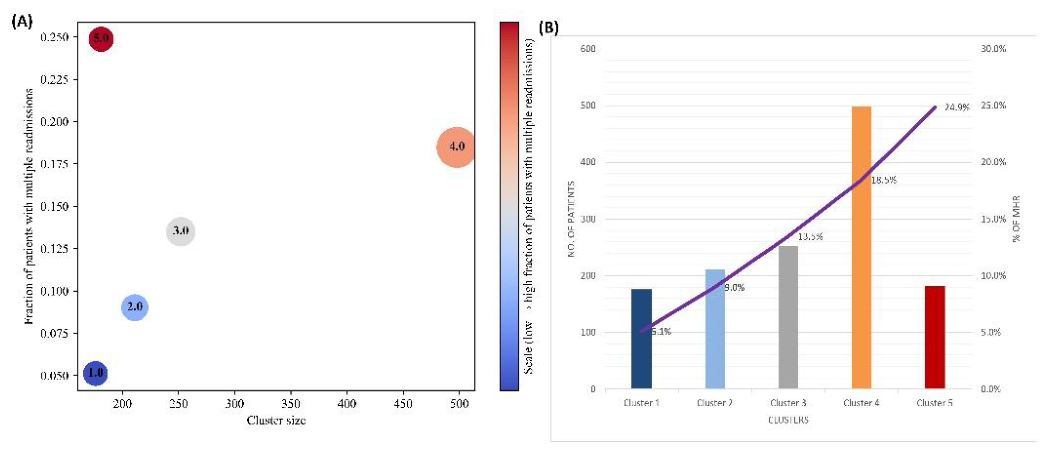
Figure 7.
Spearman rank correlation coefficients between the two cluster-derived risk scores and both multiple heart failure rehospitalisation (MHR) status and the total number of hospital admissions. Cluster Risk Score (labels) is the ordinal score assigned by ranking clusters in ascending order of observed MHR proportion; Cluster Risk Score (distance) is the continuous score derived from Euclidean distance within the two-dimensional embedding. Multiple hospital readmissions denotes the MHR endpoint (≥3 admissions).
Figure 7.
Spearman rank correlation coefficients between the two cluster-derived risk scores and both multiple heart failure rehospitalisation (MHR) status and the total number of hospital admissions. Cluster Risk Score (labels) is the ordinal score assigned by ranking clusters in ascending order of observed MHR proportion; Cluster Risk Score (distance) is the continuous score derived from Euclidean distance within the two-dimensional embedding. Multiple hospital readmissions denotes the MHR endpoint (≥3 admissions).
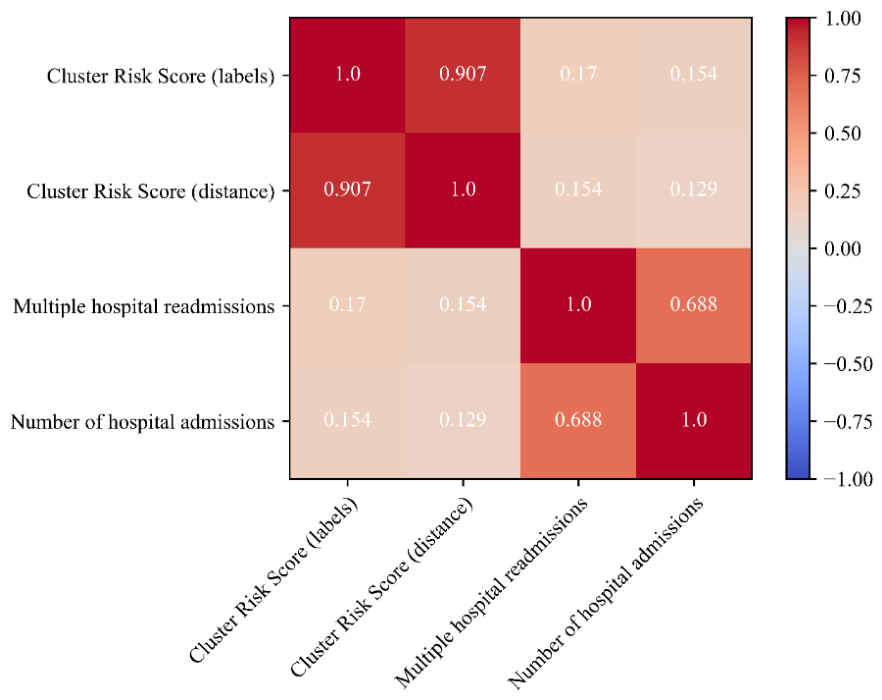
Figure 8.
Cumulative incidence of multiple heart failure rehospitalisation (MHR, ≥3 admissions) in each phenotype, estimated with the Aalen–Johansen estimator with all-cause death as a competing event, over the entire five-year follow-up period. Numbers 1–5 in the key denote Clusters 1–5. Shaded areas denote pointwise 95% confidence bands, which widen markedly beyond three years as the number of patients at risk falls.
Figure 8.
Cumulative incidence of multiple heart failure rehospitalisation (MHR, ≥3 admissions) in each phenotype, estimated with the Aalen–Johansen estimator with all-cause death as a competing event, over the entire five-year follow-up period. Numbers 1–5 in the key denote Clusters 1–5. Shaded areas denote pointwise 95% confidence bands, which widen markedly beyond three years as the number of patients at risk falls.
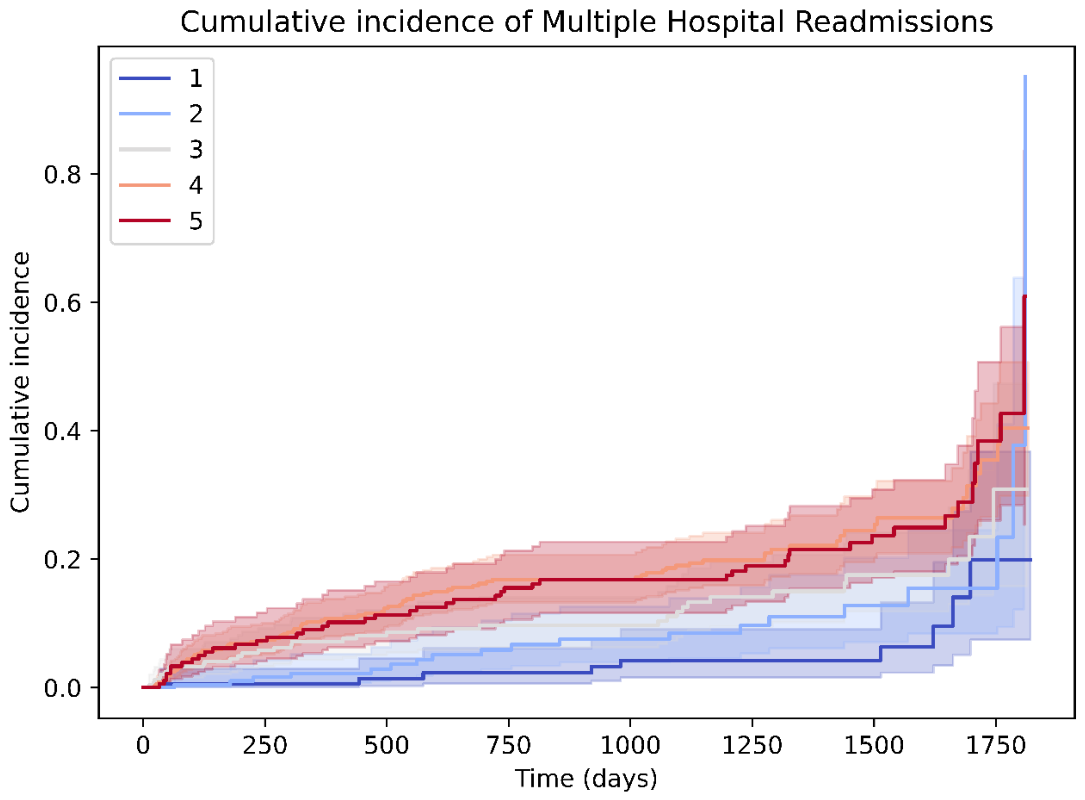

Table 1.
Cluster size and burden of recurrent hospitalisation.
| Phenotype | Patients, n (%) |
MHR (≥3 admissions), % | Admissions, median (IQR) |
|---|---|---|---|
| Cluster 1 | 176 (13.4) | 5.1 | 1 (1–2) |
| Cluster 2 | 211 (16.0) | 9.0 | 1 (1–2) |
| Cluster 3 | 252 (19.1) | 13.5 | 1 (1–2) |
| Cluster 4 | 498 (37.8) | 18.5 | 1 (1–2) |
| Cluster 5 | 181 (13.7) | 24.9 | 2 (1–2) |
| Total | 1,318 (100) | — | — |
MHR = multiple heart failure rehospitalisation; IQR = interquartile range.
Table 2.
Internal validation of the clustering solution.
| Validation measure | Value |
|---|---|
| Silhouette score (range −1 to 1; optimum 1) | 0.498 |
| Davies–Bouldin index (range 0 to ∞; optimum 0) | 0.747 |
| χ² test for association with MHR, p value | < 0.0001 |
| Cramér’s V for association with MHR (range 0 to 1) | 0.17 |
MHR = multiple heart failure rehospitalisation.
Table 3.
Selected discriminating characteristics by phenotype.
| Variable | C1 | C2 | C3 | C4 | C5 |
|---|---|---|---|---|---|
| Patients, n | 176 | 211 | 252 | 498 | 181 |
| Age, years | 68 | 72 | 74 | 76 | 75 |
| eGFR, mL/min/1.73 m² | 63.4 | 68.0 | 63.4 | 61.1 | 63.4 |
| LDL cholesterol, mg/dL | 87.8 | 87.8 | 87.8 | 87.8 | 87.8 |
| Pulmonary hypertension, % | 0.6 | 100 | 0.0 | 100 | 100 |
| Furosemide, % | 0.0 | 0.0 | 99.6 | 98.8 | 89.5 |
| Vitamin K antagonist, % | 7.4 | 0.9 | 18.7 | 0.0 | 100 |
| Aortic stenosis, any grade, % | 9.7 | 12.3 | 15.1 | 19.1 | 13.8 |
| Severe aortic stenosis, % | 2.8 | 0.5 | 6.7 | 7.6 | 5.0 |
| Aortic regurgitation, % | 8.0 | 12.3 | 11.9 | 18.3 | 21.5 |
| Documented CKD, % | 4.5 | 4.3 | 13.1 | 11.6 | 13.3 |
| Anasarca, % | 0.6 | 0.9 | 3.6 | 6.0 | 2.2 |
| Current smoker, % | 10.8 | 18.0 | 14.3 | 16.9 | 9.9 |
| Resuscitated cardiac arrest, % | 4.5 | 6.2 | 0.4 | 1.0 | 1.1 |
| Thromboembolic disease, % | 3.4 | 3.3 | 2.8 | 3.2 | 5.5 |
| Complete AV block, % | 1.7 | 1.4 | 1.2 | 1.0 | 1.7 |
| Prior PAD, % | 1.7 | 0.5 | 0.4 | 1.0 | 1.7 |
| MHR (≥3 admissions), % | 5.1 | 9.0 | 13.5 | 18.5 | 24.9 |
Continuous variables are reported as medians. eGFR = estimated glomerular filtration rate; CKD = chronic kidney disease; PAD = peripheral arterial disease; MHR = multiple heart failure rehospitalisation. Full medians with interquartile ranges and proportions for all 15 clustering variables in every cluster are provided in Supplementary Table S3.
Table 4.
Cumulative incidence of multiple HF rehospitalisation by phenotype (Aalen–Johansen estimator, death as competing event).
Table 4.
Cumulative incidence of multiple HF rehospitalisation by phenotype (Aalen–Johansen estimator, death as competing event).
| Days since index admission | C1 | C2 | C3 | C4 | C5 |
|---|---|---|---|---|---|
| 30 | 0.000 (None) | 0.000 (None) | 0.012 (0.003-0.032)* | 0.006 (0.002-0.017) | 0.000 (None) |
| 90 | 0.006 (0.001-0.030) | 0.005 (0.000-0.025) | 0.032 (0.015-0.060) | 0.042 (0.027-0.063) | 0.039 (0.017-0.075) |
| 180 | 0.006 (0.001-0.030) | 0.010 (0.002-0.034) | 0.045 (0.024-0.076) | 0.067 (0.047-0.092) | 0.061 (0.032-0.103) |
| 365 (1 year) | 0.006 (0.001-0.030) | 0.022 (0.007-0.052) | 0.072 (0.043-0.109) | 0.102 (0.076-0.132) | 0.090 (0.054-0.138) |
| 730 (2 years) | 0.023 (0.006-0.061) | 0.059 (0.029-0.104) | 0.097 (0.063-0.140) | 0.168 (0.133-0.207) | 0.143 (0.096-0.200) |
| 1,095 (3 years) | 0.042 (0.016-0.091) | 0.085 (0.046-0.139) | 0.111 (0.073-0.158) | 0.190 (0.152-0.232) | 0.168 (0.116-0.227) |
| 1,460 (4 years) | 0.042 (0.016-0.091) | 0.128 (0.071-0.202) | 0.175 (0.119-0.241) | 0.245 (0.195-0.298) | 0.226 (0.163-0.295) |
| 1,825 (5 years)** | 0.199 (0.074-0.368) | 0.951 (0.121-0.638) | 0.309 (0.158-0.473) | 0.404 (0.299-0.507) | 0.609 (0.254-0.836) |
*The estimates, representing the cumulative incidence of MHR, with the 95% confidence intervals in parentheses, are presented. **Estimates at five years are based on a small number of patients remaining at risk and are statistically unstable; they should not be interpreted as reliable absolute risks. C1–C5 = Clusters 1–5.
Disclaimer/Publisher’s Note: The statements, opinions and data contained in all publications are solely those of the individual author(s) and contributor(s) and not of MDPI and/or the editor(s). MDPI and/or the editor(s) disclaim responsibility for any injury to people or property resulting from any ideas, methods, instructions or products referred to in the content. |
© 2026 by the authors. Licensee MDPI, Basel, Switzerland. This article is an open access article distributed under the terms and conditions of the Creative Commons Attribution (CC BY) license.
Copyright: This open access article is published under a Creative Commons CC BY 4.0 license, which permit the free download, distribution, and reuse, provided that the author and preprint are cited in any reuse.