

Submitted:
09 September 2026
Posted:
10 September 2026
You are already at the latest version
Abstract
Supply chain management (SCM) optimisation is a critical but under-examined pathway for delivering circular economy outcomes in the construction sector, particularly in geographically remote and small and medium-sized enterprise dominated markets such as New Zealand (NZ). This study investigates how SCM practices, such as digital tools, early contractor involvement, strategic partnerships, and reverse logistics, can be optimised to improve circular performance in NZ built environment projects. A pragmatist, abductive mixed-methods design combined 75 case studies, a 28-case quantitative subset, 15 elite semi-structured interviews and documentary evidence. Reflexive thematic analysis was integrated with descriptive statistics, cross-tabulation, Pearson and Spearman correlation testing, and configuration archetype analysis. Findings show that coordination and partnerships are the dominant SCM lever. The article applies a Waste Hierarchy Index (WHI) and a new Digital SCM Adoption Rate (DSAR) to quantify SCM configurations; WHI of 77.6 and DSAR of 15.1% indicate upstream but uneven digital optimisation. The study delivers the first empirical construction SCM configuration analysis for NZ circular construction projects and offers actionable implications for procurement reform, construction economics policy, and future research.
Keywords:
supply chain management optimisation
; circular economy
; built environment
; early contractor involvement
; digital integration
; New Zealand
1. Introduction
The global construction sector represents one of the largest contributors to the global economy, exceeding US$10 trillion annually and consuming over 50% of extracted raw materials [1,2]. In New Zealand (NZ), construction produces roughly 7% of gross domestic product and generates over NZ$30 billion in annual revenue, making it the country’s fifth-largest sector [3]. Yet this economic achievement is matched by a similarly significant environmental burden: construction and demolition (C&D) waste in NZ is estimated at seven million tonnes per year and accounts for 30-40% of all material disposed of in Auckland’s landfills [4,5], which is consistent with waste generation metrics observed overseas [6,7]. The persistence of this waste profile, despite two decades of policy attention, signals a systemic breakdown rather than a technical or behavioural shortfall at the project level.
A key reason for this systemic impediment is that supply chain management (SCM) in NZ construction is not optimised. The sector is dominated by small and medium-sized enterprises (SMEs), with approximately 95% of registered companies employing fewer than 20 people [8]. Procurement is typically organised within a sequential design-bid-build model that fragments accountability across designers, contractors, and material suppliers, inserting waste at the specification stage. Adversarial contracting practices, which optimise for the lowest price tender rather than whole-life value, suppress the relational trust needed for circular material flows. The result is a supply chain with design decisions, procurement choices, and waste outcomes disconnected in time and authority, which is an underlying condition that linear SCM cannot address.
Circular economy (CE) principles offer an alternative to the linear take-make-dispose model by prioritising prevention, reuse, reverse logistics and product stewardship [9,10]. However, NZ’s built environment (BE) sector faces specific constraints: long supply lines, high import dependence, an SME-dominated industry structure, road-based freight, and procurement models that often prioritise lowest upfront cost over the whole-life value [11]. These conditions mean that international CE supply-chain solutions cannot simply be transferred into NZ without empirical testing.
Therefore, this study examines how SCM practices can be optimised to improve circular performance in NZ BE projects. It focuses on the interaction between digital tools, early contractor involvement (ECI), partnerships, reverse logistics, and procurement settings, rather than treating these levers as isolated interventions.
Four gaps motivate this study. First, institutional and policy conditions are studied at a macro level but rarely linked to project-level SCM decisions. Second, design authority and upstream procurement decisions are widely acknowledged as influential for waste outcomes, yet SCM literature has largely been confined to downstream operations such as logistics and material handling. Third, adversarial fragmentation in construction supply chains is repeatedly cited as a barrier to CE, but few studies test which specific relational SCM levers can dissolve this fragmentation. Fourth, NZ-specific empirical evidence on how SCM configurations interact with circular outcomes remains limited, with most circular construction research drawn from European or East Asian contexts whose institutional and geographic characteristics differ markedly from those of NZ (Nelson et al., 2022; Dhawan et al., 2022; Elliott Tinnes et al., 2024).
Therefore, the aim of this study is to investigate how SCM practices can be optimised to enhance the performance of NZ BE projects under CE constraints, with particular attention to the configurations of digital, relational, and procurement levers that sustain high-performing circular outcomes. It does so by combining case study evidence, practitioner interviews, operational metrics and configuration archetype analysis.
The study is guided by the following research question (RQ):
- RQ: How can SCM practices be optimised to enhance the performance of BE projects in NZ?
Four supporting sub-research questions examine the empirical basis for this question:
- RQA: Which SCM levers are being used across NZ and international circular built environment cases?
- RQB: How do digital tools, early contractor involvement, partnerships and reverse logistics influence waste and cost outcomes?
- RQC: What quantitative relationships exist between SCM levers, waste hierarchy position, project scale and waste-reduction performance?
- RQD: What configuration archetypes and practical implications emerge for wider SCM optimisation in NZ?
The remainder of the paper is structured as follows. Section 2 reviews the SCM and CE literature relevant to RQ and develops the theoretical framework. Section 3 describes the mixed-methods design, data collection and analytical procedures, including two metrics: the Waste Hierarchy Index (WHI) and Digital SCM Adoption Rate (DSAR). Section 4 presents empirical findings across SCM lever distribution, ECI, digital SCM tools, partnerships and configuration archetypes. Section 5 discusses theoretical contributions and practical implications, and Section 6 concludes this article.
2. Literature Review
2.1. SCM in Construction and the Circular Economy
Construction SCM has historically been organised around a linear logic in which the project moves sequentially from design through tendering to construction and disposal [12]. Within this design-bid-build paradigm, designers specify materials without having to deal with the waste consequences of their choices, contractors procure supplies against contracts that reward lowest-tender price rather than whole-life performance, and waste arises as an unpriced externality at the back end of the process [13,14]. The sequential separation of design authority from procurement and waste accountability is the root cause of why marginal interventions in any single phase rarely translate into systemic waste reduction.
CE advocates a fundamental reorientation of SCM from this linear architecture to a circular one. Theeraworawit et al. (2022) consolidate the relevant scholarship into four schools of circular SCM theory: Sustainable SCM, Environmental Management, CE SCM, and Reverse Supply Chain [15]. For this study, the CE SCM and reverse supply chain perspectives are most relevant because they treat circularity as a property of the supply-chain architecture, not simply as downstream recycling. In NZ, this architecture must also respond to import dependence, road-based freight, SME capacity limits and fragmented procurement [11]. These conditions justify an empirical focus on SCM configurations rather than generic CE prescriptions.
Within the four-school taxonomy, the most theoretically productive position for the present study is the CE SCM school, which treats circular flows as a property of the supply chain architecture rather than a downstream remediation of linear waste. This school converges with the lean construction emphasis on designing out waste at source, and it provides the conceptual rationale for organising the empirical analysis around configuration archetypes (Section 4.5) rather than around the success or failure of individual tools. The Reverse Supply Chain school, in turn, supplies the analytical vocabulary for the case-level study of partnerships, stewardship schemes and material exchanges (Section 4.4 and Section 5.2).
2.2. Digital SCM Levers: BIM and the Golden Thread
Building Information Modelling (BIM) is the most widely cited digital SCM integration tool in circular construction. By embedding material, geometric and lifecycle information into a shared model, BIM connects design decisions to procurement, waste estimation, and material tracking [16]. Berglund-Brown et al. (2022) characterise the resulting Circular Information Flow (CIF) along four dimensions: completeness (the model contains all relevant material attributes), availability (information is generated when needed), accessibility (information is shareable across actors) and incorporation into business strategy (information shapes decisions rather than merely documenting them) [17].
Empirical evidence supports the SCM value of BIM-enabled analytics. Akinade and Oyedele (2019) report that an Adaptive Neuro-Fuzzy Inference System (ANFIS)-based waste analytics platform integrated with BIM achieved 89–94% accuracy in automated material classification and reduced over-ordering by 17–24% [13]. Fereydooni Eftekhari et al. (2024) demonstrate that a BIM-based Materials Passport, generated through Industry Foundation Classes (IFC) data extraction, can produce a building-level recyclability index that supports both procurement and end-of-life planning [17]. Such findings underpin the theoretical case for RQA, namely that digital SCM tools enhance transparency, efficiency and collaboration.
Yet digital SCM literature is also clear about the conditions under which these benefits are realised. Gaps in SME adoption, siloed proprietary platforms, and digital literacy deficits frequently prevent digital tools from delivering systemic value [14,17]. These constraints are particularly significant in NZ, where 95% of construction firms are SMEs.
Materials passports present a complementary digital lever. Fereydooni Eftekhari et al. (2024) describe an IFC-based extraction process that aggregates material identities, quantities, and recoverability scores into a project-level recyclability index [18]. Such passports operate as the digital foundation for design-for-disassembly (DfD) strategies and for downstream material-bank infrastructure, because they enable recovered materials to be specified for reintroduction into new projects [19]. They also create the data backbone for the circular procurement contracts that increasingly accompany large public projects in Europe.
International benchmarks help calibrate the NZ digital SCM gap [20]. The Netherlands records above 90% C&D waste recovery, supported by annual waste-data collection, demolition licensing, registered waste operators, selective sorting and landfill restrictions [21]. England and the wider UK have consistently exceeded the 70% C&D recovery target, with recovery rates above 90% since 2010 [22]. Singapore’s Zero Waste Masterplan and mandatory waste reporting system require affected premises, including workplaces and construction sites, to report waste and recycling quantities and submit waste-reduction plans [23,24]. For Europe, Bain & Company (2022) estimate that recycled material use in construction could double to 28% by 2040 [25].
2.3. Relational SCM: ECI, Partnerships and Reverse Logistics
Relational SCM levers shift attention upstream from logistics towards the relational and contractual structures that determine what flows through the supply chain in the first place. ECI brings fabricators, main contractors and waste specialists into the design phase before key decisions are locked in, integrating procurement strategy selection in earlier stages [26].
Strategic partnerships extend ECI from a single project into longer-term, trust-based relationships that can sustain circular material flows [27]. Product stewardship schemes leverage existing logistics infrastructure rather than requiring new networks. Sonar et al. [28] identify the infrastructure conditions for viable reverse logistics in construction, such as recyclable material specifications, reliable collection networks, novel packaging, and accessible secondary markets. Their analysis shows that knowledge and awareness barriers and regulatory deficiencies act as underlying barriers leading to operational failures.
Ma and Zhang [29], demonstrate that government, constructor, and recycler interactions reach circular equilibrium only when both subsidy and penalty mechanisms are implemented. The relational structure of the supply chain, in their model, is not autonomous; instead, it requires institutional framework to remain stable. The implication for RQB is that strategic partnerships should be expected to deliver resilient, responsive SCM, but their longevity depends on the institutional context in which they operate.
Reverse logistics is the operational counterpart to relational SCM [27]. Where forward logistics moves new materials from manufacturer to construction site, reverse logistics moves used and surplus materials from buildings to subsequent projects, processors or remanufacturers. The infrastructure conditions identified by Sonar et al. [28], such as specifications, collection networks, quality assurance and secondary markets, are precisely the conditions that long-term partnerships are well placed to satisfy. The Good Wrap scheme, the IKEA Auckland concrete crushing case [30], and the Auckland industrial symbiosis network reported in Section 4.4 each illustrate how reverse logistics can be assembled from existing freight back-haul, processing and procurement capacity when partnership networks coordinate around shared specifications.
2.4. Configuration Archetypes in Circular Construction SCM
A recurring conclusion across the SCM literature is that no single “magic bullet” lever, which explains high-performance circular outcomes. Configuration-level analyses, i.e. examining combinations of levers rather than individual tools, are increasingly seen as more explanatory. The lean-production analogy informs how optimal production systems combine demand signaling, inventory minimisation, and quality at source. Improvement is achieved by using complementary elements, rather than by a single technique. Circular SCM appears to involve analogous complementarity, although the empirical literature is yet to discover the specific configurations that operate in geographically remote, SME-dominated economies. Thus, the literature exhibits a clear gap with respect to NZ circular construction, which this study addresses through configuration archetype analysis (Section 4.5).
Three additional considerations support the configuration argument. First, configurations are not static, rather, they evolve over the project life cycle as design freezes, supplier relationships mature, and waste streams emerge in measurable forms. Empirical analysis must therefore distinguish between configuration components that are deployable at the design stages, those that are deployable during construction, and those that operate post-completion. Second, configurations are not equivalent in their resilience, i.e. configurations distributed across multiple actors with overlapping capabilities tend to be more durable than those depending on a single intermediary. Third, configurations interact with project scale in non-trivial ways. Larger projects can absorb the transaction costs of multi-lever configurations, whereas smaller projects benefit disproportionately from configurations that exploit shared infrastructure rather than developing project-specific capability.
2.5. Theoretical Framework
Three primary theoretical lenses inform the analysis of RQ. Together they provide complementary explanations of why coordination-centred configurations dominate the high-performance range, and they each generate testable predictions that the empirical analysis can examine.
First, Dynamic Capabilities Theory frames circular SCM as the joint deployment of three capabilities: sensing which includes data collection, BIM, materials information, seizing, i.e. partnership formation, ECI, contractual reform, and reconfiguring, e.g. workflow redesign, circular procurement. The theory predicts that firms developing all three simultaneously will outperform those with only one or two [31.32]. This study’s configuration archetype analysis empirically tests this prediction.
Second, Lean Construction supplies a pull-workflow logic that applies upstream of construction, for instance, designing out waste at the specification stage is more effective than sorting and recycling downstream [33]. ECI represents the construction equivalent of “design for manufacture”, and the WHI introduced in Section 3.4 operationalises lean’s preference for upstream interventions.
Third, Socio-Technical Systems Theory cautions that digital tools alone cannot transform SCM. Effective digital adoption should be accompanied by social and organisational changes [34]. The theory implies that coordination may be the missing socio-technical infrastructure in NZ construction and that digital adoption rates measured in isolation could understate the conditions for high performance.
Two supporting lenses complete the framework. Reverse Logistics theory specifies the infrastructure conditions for viable circular flows, such as clear material specifications, reliable collection networks, and accessible secondary markets, and explains why partnership networks are the most efficient mechanism for assembling these conditions in fragmented markets [28,35]. Institutional Theory frames adversarial procurement as a coercive isomorphism that maintains fragmentation across the sector and identifies relational procurement as a normative-isomorphic alternative that can shift sector-wide expectations once a critical mass of public clients adopts it [36]. The two supporting lenses jointly explain why coordination-centred configurations both perform well at the project level and remain stable across projects when supported by appropriate institutional arrangements.
3. Methodology
3.1. Research Design
The study adopts a pragmatist philosophical stance with abductive reasoning, on the basis that circular SCM in NZ is an under-theorised empirical phenomenon for which neither pure deduction nor pure induction is sufficient [37,38]. A cross-sectional, mixed-methods design integrates qualitative and quantitative data to enable theoretical pattern matching across cases, interviews and documentary records.
The choice of pragmatism reflects the practical orientation of the research question with the aim to identify SCM configurations that noticeably enhance circular performance under NZ conditions, rather than to decide between competing meta-theories of SCM. Pragmatism consents parallel use of qualitative and quantitative evidence, treats theory as a tool for explanation rather than an end, and accommodates the abductive movement between observed patterns and probable explanations that is central to the study’s analytical strategy. Cross-sectional design rather than longitudinal time horizon was chosen on feasibility grounds, given the difficulty of tracking SCM configurations over multi-year project life cycles in a fragmented sector; the resulting limitations are addressed in Section 5.4.
3.2. Data Collection
Three data streams were assembled. First, 75 case studies of NZ and international circular construction projects were compiled through purposive maximum-variation sampling, drawing from peer-reviewed literature, industry reports, government databases, and project documentation. International benchmarks from Australia, the United Kingdom, the Netherlands and other EU member states, as well as Singapore were included to compare the NZ findings with mature circular construction economies. Within the 75-case dataset, a subset of 28 cases includes recorded waste-reduction percentages and was used for quantitative analysis.
Second, 15 elite semi-structured interviews were conducted with senior practitioners in design, contracting, policy and waste management roles. Sampling combined purposive selection and snowball expansion. Interviews lasted 30-45 minutes, were recorded with consent, and were transcribed verbatim. Third, documentary evidence (project reports, policy documents and industry publications) was used to triangulate case-level claims.

Table 1.
Interview Participant Profile.
| Stakeholder Group | Participants | Main Contribution to the Study |
|---|---|---|
| Design, engineering and built environment consultancy | 4 | Design-stage decisions, BIM, buildability and waste prevention |
| Contracting, construction materials and project delivery | 3 | Site operations, procurement constraints and material logistics |
| Waste, circular materials and reverse logistics | 4 | Recovery pathways, secondary materials and product stewardship |
| Public sector, policy and industry bodies | 4 | Regulation, procurement settings, professional practice and market coordination |
| Total | 15 | Cross-role evidence on SCM optimisation conditions |
Across all 75 cases, a single SCM lever variable was coded according to the primary lever observed: coordination/partnerships, digital/data, procurement/contracts, other SCM practices, or not applicable. This coding decision to record the primary rather than all levers favoured analytical clarity and inter-case comparability over coverage breadth and is reflected in the DSAR metric (Section 3.4).
Where a case displayed multiple SCM levers of comparable salience, the primary lever was assigned according to the lever that the project documentation and interview evidence identified as the proximate cause of waste-reduction outcomes. Cases without sufficient information to identify a primary lever were coded as “not applicable”, rather than being forced into a category, to preserve the integrity of the lever distribution analysis.
The interview protocol was developed iteratively and covered five core areas: respondents’ experience of NZ construction SCM and its CE constraints; the SCM levers they had observed delivering circular outcomes (and the levers that had failed to deliver); the role of digital tools, partnerships in the cases they had been involved in; barriers to wider adoption of effective configurations; and policy or institutional changes the respondent considered necessary. Probes followed Braun and Clarke’s (2019) reflexive principles [39], allowing the conversation to surface implicit knowledge that structured questionnaires would have missed.
3.3. Analytical Approach
Qualitative data were analysed using NVivo through a six-phase Reflexive Thematic Analysis (RTA) following Braun and Clarke [39,40]. An initial semantic coding cycle identifying surface-level patterns was followed by a subsequent latent cycle interpreting underlying meanings, contradictions and theoretical implications. Quantitative data were analysed in SPSS through descriptive statistics, Spearman and Pearson correlations, cross-tabulations and Kruskal-Wallis H-tests. Configuration archetype analysis combined the coded variables, such as intervention themes, SCM lever, waste hierarchy position, scale, geographic context, to identify recurrent high-performing patterns. Triangulation across cases, interviews, and documentary sources was applied at each analytical stage.
3.4. Quantitative Metrics
To make cross-case comparisons tractable, two simple operational metrics were used (Table 2). The Waste Hierarchy Index (WHI) adapts the waste-hierarchy index proposed by Pires and Martinho (2019) to capture how far SCM effort is distributed towards higher-value options in the waste hierarchy [41], while the Digital SCM Adoption Rate (DSAR) is introduced in this study to quantify the extent to which digital and data tools operate as the primary SCM lever. Together, these indices translate qualitative case descriptions into comparable numerical signals that can be used in the subsequent inferential and configuration analysis.
The dataset used to calculate WHI comprises the following waste-hierarchy categories across the 75 cases: prevention/design-out (36.0%, n = 27), reuse/relocation (17.3%, n = 13), recycling (25.3%, n = 19), recovery (6.7%, n = 5), disposal/landfill (2.7%, n = 2) and not applicable (12.0%, n = 9). Only cases with a coded hierarchy position (n = 66) are treated as “active cases” in the WHI calculation. For DSAR, 73 cases have a coded primary SCM lever, of which 11 are digital/data-led (DSAR = 15.1%), while in the 28-case quantitative subset only 2 are digital/data-led (DSAR = 7.1%).
These metrics were supplemented by descriptive statistics, cross-tabulations, Pearson and Spearman correlations, and Kruskal-Wallis H-tests. Pearson correlation was used for relationships involving waste-reduction percentage in the 28-case quantitative subset, while Spearman correlation was used for ranked or ordinal variables across the 75-case dataset.
4. Findings
4.1. SCM Lever Distribution and Waste Hierarchy Positioning
Table 3 summarises the distribution of primary SCM levers across the 75-case dataset. Coordination and partnerships are the dominant lever (46.7%, n = 35), followed by other SCM practices such as modular construction, logistics innovations and stewardship arrangements (32.0%, n = 24). Digital and data levers remain comparatively limited (DSAR = 15.1%), while procurement and contract levers account for only 4.0% of cases.
Figure 1 illustrates the lever distribution as a horizontal bar chart, making the scale of coordination and partnership dominance apparent and providing a visual reference for the pattern discussed throughout this section.
The waste hierarchy distribution also shows an upstream orientation: prevention/design-out accounts for 36.0% of cases (n = 27), reuse/relocation for 17.3% (n = 13), recycling for 25.3% (n = 19), recovery for 6.7% (n = 5), disposal/landfill for 2.7% (n = 2), and not applicable for 12.0% (n = 9). This produces a WHI of 77.6%, indicating that, on a weighted basis across the full hierarchy, SCM effort is oriented toward higher value options, with a substantial share at the prevention and reuse levels. Table 4 summarises the main inferential results used to interpret these patterns.
Figure 2 visualises the waste hierarchy distribution across the active 66-case subset.
Overall, the results indicate that SCM optimisation is not explained by one isolated tool. Instead, higher performance is associated with configurations that combine coordination, upstream decision-making and context-appropriate digital or procurement support.
4.2. Early Contractor Involvement and Design-Phase Integration
More than 80% of a project’s environmental impact is determined at the design stage [42], yet most contractors are still engaged after design completion [43]. This secular mismatch between design authority and constructor expertise is the structural obstacle that ECI is designed to address.
Three NZ case examples illustrate the magnitude of the available gain. The Albany Primary School project, which combined ECI, an Integrated Design Process (IDP), and modular coordination, achieved 88% waste diversion, an 18% cost saving and a three-week schedule advance, as reported in an interview with one construction industry practitioner. The Auckland Waste Minimisation Partnership, organised around early multi-stakeholder coordination, delivered a 41% landfill reduction over two years through coordinated material exchange. A dimensional coordination case achieved an 86.6% reduction in timber offcuts by aligning drawer and sheet-material dimensions at the design stage. As one practitioner observed, “by the time the contractor’s engaged, all the decisions have been made”.
Through the Dynamic Capabilities lens, ECI operates as a seizing capability: it is the organisational routine that converts design-stage sensing (waste data, material availability, buildability assessment) into procurement action before lock-in occurs. The empirical pattern in this study is that ECI does not merely accelerate procurement but reshapes the procurement decisions themselves, lifting case performance into Bands 3 and 4 of the diversion-rate distribution.
Beyond the headline cases, the interview material adds nuance to the ECI mechanism. Practitioners consistently distinguish between formal ECI being a contracted design-stage undertaking and informal ECI comprising early conversations between client, designer and trusted contractor in the absence of a formal contract. Formal ECI is associated with the largest cost and waste improvements but requires procurement reform; informal ECI is more common but is fragile across changes in client personnel and project scope. The implication for policy is that mandating formal ECI on projects above a defined capital threshold would secure waste savings that the sector currently captures only intermittently through informal practice.
These findings reframe ECI as fundamentally a procurement instrument with direct economic returns, rather than merely a collaborative practice. Formal ECI creates a contractual allocation of design-stage responsibility that internalises the contractor's construction-phase waste and rework costs into the pre-commitment procurement calculus, as evidenced by the Albany 18% cost saving. Kadefors [36] identified analogous procurement-policy tensions in Scandinavian public infrastructure, where prior marketisation policies prescribing low client involvement generated institutional resistance to relational contracting reform and project-level performance variation within the same procurement framework. The NZ evidence mirrors this dynamic: without formal procurement mandates, ECI-enabled cost savings are captured only intermittently, concentrated in projects where client governance and practitioner relationships happen to permit early engagement. The implication for construction economics is direct: informal ECI is not a substitute for procurement reform but evidence of the cost gap that reform would close.
4.3. Digital SCM Tools and the Golden Thread
The DSAR for the full dataset is 15.1%, falling to 7.1% in the 28-case quantitative subset or in the cases where measured waste reduction outcomes are available. This is one of the first empirical observations of the kind for NZ circular construction. The proven SCM benefits of digital tools are not in dispute: BIM-integrated waste estimation achieves 89–94% material classification accuracy and reduces over-ordering by 17–24% [13]; BIM/IFC-based Materials Passports generate building-level recyclability metrics that support both procurement and deconstruction planning [18]; and CIF framework provides a coherent target architecture across completeness, availability, accessibility and business-strategy integration [17]. The Good Wrap and Proclimar QR-coded collection systems also illustrate how closed-loop tracking can operate at project level in NZ.
A Pearson correlation between SCM lever and waste reduction percentage in the quantitative subset is statistically significant (r(26) = -.44, p = .018). Since the SCM lever variable is coded with coordination at a lower numeric value than digital/data, the negative coefficient indicates that cases with coordination/partnerships as the primary lever systematically achieve higher waste reduction than cases relying solely on digital tools. The relationship persists in Spearman rank-order analysis, where rs(26) = -.35, p = .067, approaching conventional significance thresholds.
Figure 3 presents the full Pearson correlation matrix across all eight coded variables for the 28-case quantitative subset; cells marked * (p < .05) or ** (p < .01) identify the associations that carry primary evidentiary weight in Section 4.2, Section 4.3, Section 4.4 and Section 4.5.
Three observations support this analysis. First, the SME-dominated NZ sector lacks the BIM capability, digital literacy and integration capacity required to convert digital potential into systemic outcomes. Second, the digital landscape is fragmented; as one practitioner remarked, “everyone’s got their own system and none of them talk to each other”. Third, through the Socio-Technical Systems lens, digital tools without relational restructuring are adopted piecemeal and fail to achieve the systemic effects predicted in the literature. The 7.1% DSAR within the high-performing cases is not a disproof of digital SCM’s potential; rather, it is empirical confirmation that, in the NZ context, digital levers operate as enablers within coordination-centred arrangements rather than as standalone drivers.
A complementary observation relates to the nature of digital tools that do appear in high-performing cases. They are typically narrow, task-specific applications, such as a QR-coded collection bag, a project-level material-tracking spreadsheet, a BIM clash-detection routine, etc., rather than enterprise-wide digital platforms. The pattern is consistent with the SME constraint identified above and with the Socio-Technical Systems argument that digital tools succeed where they are linked to the social and organisational structures that exist, rather than where they require those structures to be rebuilt around them.
The economics of digital adoption in the NZ context reveal a cost-to-opportunity asymmetry. The investment required to establish digital tracking infrastructure for a single project typically exceeds waste-cost savings achievable from digital tools alone in an SME-dominated market without the relational structures that would allow that investment to be amortised across projects and supply chains. Papadonikolaki et al. [44] demonstrated in their analysis of BIM-enabled supply chain partnerships that relational, collaboratively structured arrangements diffuse BIM benefits across supply chains more effectively than transactional ones, which is the organisational form absent in the 85% of NZ cases that deploy no digital levers. Dowsett and Harty [45] reinforce this finding, showing that when organisational dimensions of BIM adoption receive limited attention, the technology yields only narrow technical productivity gains rather than the systemic SCM efficiencies reported in the wider literature. The 7.1% DSAR in the high-performing subset is, therefore, not a refutation of digital SCM's economic potential; rather, it is empirical evidence of the organisational infrastructure investment that must precede digital returns in the NZ construction sector.
4.4. Collaboration, Partnerships and Reverse Logistics
Strategic partnerships and reverse-logistics infrastructure dominate the high-performance band of the dataset. The Good Wrap scheme illustrates that through supplier-installer-recycler partnerships, the scheme achieves 95% clean-wrap rates and uses existing freight back-haul networks for reverse logistics, requiring no new physical infrastructure. The Auckland industrial symbiosis network coordinates approximately 580 tonnes of monthly diversion through inter-firm material exchanges. Material banks for structural steel reuse achieve 68% reuse rates in commercial retrofits [18].
The partnership pattern aligns with the ISM-MICMAC analysis of Sonar et al. [28]: knowledge and awareness barriers and regulatory deficiencies are the root-causes that drive operational failures in reverse logistics; these barriers can be removed through shared learning and self-imposed standards by coordinated partnership networks. The evolutionary game modelling of Ma and Zhang [29] reinforces this finding by showing that coordination-based configurations require government subsidies, rather than penalties alone, to reach circular equilibrium.
Within the performance bands, the dataset reveals a noteworthy pattern: coordination/partnerships represent the SCM lever in 100% of Band 4 cases (≥90% diversion). As one senior practitioner reflected, “the projects where we got the best outcomes were where everyone was around the table from day one”. Through the Lean Construction lens, coordination is the construction-SCM equivalent of the pull signal: it creates the demand alignment that triggers circular material flows. Where coordination is absent or weak, even well-resourced digital and procurement levers fail to produce upper-band performance.
Figure 4 visualises this pattern across all four performance bands. The stacked composition shows that while coordination and partnerships appears at all diversion levels, it is the only lever present in Band 4 (≥90% diversion), with the convergence becoming progressively more pronounced as performance increases, which is consistent with the Dynamic Capabilities argument that sensing, seizing, and reconfiguring capabilities must all operate simultaneously for circular supply chain configurations to reach their performance ceiling.
A second feature of the partnership pattern is the role of intermediaries. In each high-performing partnership case, an intermediary actor, i.e. a stewardship scheme operator, a council waste team, an industrial symbiosis facilitator, absorbs the transaction costs that would otherwise prevent SMEs from participating. Intermediation explains why partnership-based outcomes are reproducible at SME scale, despite the resource constraints that prevent the same firms from sustaining bespoke bilateral arrangements. The policy implication is that subsidising intermediation is likely to be a higher-leverage intervention than subsidising firm-level capability uplift, particularly in a sector, 95% of which consist of SMEs.
The economic benefits of the partnership pattern deserve further elaboration. High-performing arrangements generate value through three distinct economic channels: avoided disposal fees, for instance, at NZ$65 per tonne, the Auckland symbiosis network's 580 tonnes per month represents approximately NZ$453,000 in annual avoided disposal costs, before accounting for recovered material value; back-haul cost-sharing through reverse logistics as the Good Wrap zero-new-infrastructure model demonstrates this at commercial scale; and relational capital that reduces procurement transaction costs across repeated project engagements.
4.4. Configuration Archetypes
Cross-tabulating SCM lever, intervention theme, waste hierarchy position and scale across the high-performance segment of the dataset yielded three dominant configuration archetypes (Table 5).
A central observation is that all three archetypes include coordination/partnerships as a core component. Digital tools appear as accelerators within coordination-focused archetypes, not as standalone configurations. Through the Dynamic Capabilities lens, Archetype 1 represents full triple-capability deployment (sensing via BIM-supported waste estimation, seizing via ECI, reconfiguring via IDP). Archetypes 2 and 3 represent partial capability deployment which is effective but sub-optimal without the full configuration.
The configuration evidence directly addresses RQ, that is SCM optimisation in NZ circular construction is achieved through complementary, multi-lever configurations focused on coordination and partnerships, with digital and procurement levers serving as accelerators. No single lever can achieve Band 4 performance in isolation.
The economic logic of archetype membership is reflected directly in contract structure. Archetype 1 employs relational procurement models (integrated design processes, alliance-type ECI arrangements) that shift risk allocation upstream and enable designing-out waste at the point of maximum design influence, before costs are committed. Archetype 2 achieves cost neutrality through avoided disposal rather than upstream prevention, i.e. source separation and stewardship costs are offset by avoided landfill fees with zero design-stage value creation. Archetype 3 configurations involve platform-level digital procurement economies that remain largely inaccessible at current NZ project volumes. This tiered economic structure corresponds with the relational contracting framework of Kadefors et al. [36], which postulates that the policy ambiguity and limited client resources in public procurement organisations produce precisely the project-level variation between Archetype 1 and Archetype 2 outcomes observed in this paper, with Archetype 1 performance remaining contingent on deliberate procurement design rather than embedded sector-wide practice.
Two cross-archetype patterns should be highlighted. First, the relationship between archetype membership and performance band is asymmetric: Archetype 1 cases concentrate in Bands 3 and 4, Archetype 2 cases concentrate in Bands 2 and 3, and Archetype 3 cases, which are predominantly international, populate Bands 3 and 4 in jurisdictions with supportive policy governments. Within the NZ subset, Archetype 1 is the only configuration consistently associated with Band 4 outcomes. Second, the cost performance of the archetypes diverges from the waste performance. Archetype 1 cases tend to combine the highest waste outcomes with positive cost effects with the Albany 18% saving being a prime example, because waste prevention upstream eliminates the procurement, handling and disposal costs that would otherwise accompany downstream-oriented configurations. Archetype 2 cases tend to be cost-neutral, recovering the cost of source separation and stewardship through avoided disposal fees. Archetype 3 cases, observed mainly internationally, often involve a one-off capital outlay, for instance on a digital platform, materials passport infrastructure, etc., that is amortised across multiple subsequent projects.
Further observation relates to scale dependence. Bigger projects (Spearman: rs(73) = .39, p = .040 between SCM lever and scale) are more likely to deploy multi-lever configurations, but the Albany Primary School case demonstrates that Archetype 1 outcomes are also attainable on smaller projects when ECI and IDP routines are embedded in procurement. The size effect is therefore better understood as a probabilistic association than as a hard threshold: smaller projects can reach Archetype 1 performance, but they require deliberate procurement design rather than the larger projects’ capacity to absorb transaction costs. This finding has direct implications for the policy-level recommendation in Section 6 to require ECI and IDP implementation for projects above a defined capital threshold. The threshold should be calibrated to capture the scale at which absent procurement reform begins to suppress Archetype 1 adoption.
5. Discussion
5.1. Addressing the Research Question and Hypotheses
The findings answer the overarching RQ by showing that SCM optimisation in NZ circular built environment projects is achieved through coordination-centred configurations rather than through isolated digital, procurement or logistics tools. In response to RQA, coordination and partnerships are the most common SCM lever, appearing in 46.7% of all cases, while digital/data tools remain relatively rare as the primary lever. This pattern suggests that the sector’s current optimisation capacity is relational rather than technological.
For RQB, digital tools, ECI, partnerships and reverse logistics each contribute to circular performance, but their effects differ. Digital tools improve visibility, waste estimation and material tracking, yet the DSAR of 15.1% indicates limited primary adoption. ECI and IDP shift decision-making upstream, where waste can be designed out before specification and procurement lock-in. Partnerships and reverse logistics provide the coordination infrastructure needed to convert material recovery from a project-level aspiration into a workable supply-chain practice.
For RQC, the statistical results show that SCM lever is associated with both scale and waste-reduction performance. The significant Pearson correlation between SCM lever and waste reduction percentage (r(26) = -.44, p = .018), together with the significant association between intervention theme and waste hierarchy position (χ²(25) = 80.20, p < .001), supports the argument that lever choice and configuration shape circular outcomes. However, the non-significant Kruskal-Wallis result for intervention theme alone (H(3) = 2.20, p = .53) cautions against over-claiming the effect of any single intervention type.
For RQD, the configuration archetypes show that the strongest pathway combines design-out, coordination and prevention. Digital and procurement tools are therefore best understood as accelerators within coordination-led configurations, not substitutes for relational SCM. The practical implication is that NZ policy and industry should prioritise ECI, relational procurement, shared material-exchange infrastructure and open digital standards that enable SMEs to participate in circular supply chains.
5.2. Theoretical Contributions
The study makes four primary theoretical contributions, each of which connects an established theoretical lens to a quantified empirical consistency in the dataset.
First, in Dynamic Capabilities terms, the configuration archetype analysis shows that circular SCM optimisation requires simultaneous deployment of all three capabilities: sensing, seizing and reconfiguring. Partial deployment, i.e. coordination or digital alone, yields lower performance than the full triple-capability configuration represented by Archetype 1.
Second, for Lean Construction, the WHI of 77.6% provides a quantitative measure of the upstream orientation of the NZ sector. The sector already directs more SCM effort to prevention and reuse than to recycling, recovery and disposal. The remaining 22.4% gap, however, identifies an opportunity for Lean Construction to eliminate downstream-oriented SCM through pull-workflow redesign of procurement and specification processes. The WHI thus operationalises lean waste-hierarchy preference as a measurable management metric.
Third, for Socio-Technical Systems Theory, the DSAR (15.1%) quantifies the social-technical gap for the first time in the NZ context. The finding that digital adoption is lower in the highest-performing cases (7.1% in Band 4), where coordination is universal, contests the assumption that digital tools are the primary optimisation lever. It confirms that social coordination is the systemic requirement, with digital tools as enablers. The DSAR, like the WHI, can be re-applied to other geographies and time periods to compare the social-technical maturity of construction supply chains.
Fourth, for the reverse-logistics literature, the ISM-MICMAC barrier analysis of Sonar et al. (2024) is given NZ-specific empirical validation: knowledge/awareness and regulatory deficiencies are the root-cause barriers, with the Good Wrap scheme and Auckland industrial symbiosis network indicating that viable reverse logistics can operate through existing infrastructure when coordination fills the regulatory gap. The implication for theory development is that reverse logistics in construction should be modelled as a coordination problem with logistics characteristics rather than as a logistics problem with coordination characteristics; the dataset shows the latter framing systematically misallocates intervention effort.
The fifth contribution is methodological. The combination of NVivo-based RTA, SPSS inferential analysis, and configuration archetype analysis demonstrates an analytical conduit that other researchers in geographically remote, SME-dominated sectors can adapt. The conduit is replicable: cases are coded against a small set of categorical variables such as the intervention theme, SCM lever, waste hierarchy position, scale, geographic context; a quantitative subset is used to test inferential associations; and configuration archetypes are generated by cross-tabulating high-performing cases. The use of two new metrics of WHI and DSAR anchors the analysis in measurable concepts that can be compared across studies, which addresses one of the secondary literature gaps identified in Section 1.2.
5.3. Implications for Practice
For contractors, the priority is to build coordination capability before investing in digital systems. ECI protocols, long-term supplier relationships and material exchange partnerships create conditions under which digital tools can generate value. For clients and project owners, procurement should include early circular material planning, ECI, and whole-life cost evaluation rather than lowest-tender selection alone.
For industry bodies and policymakers, the findings support investment in shared infrastructure: material exchanges, product stewardship schemes, industrial symbiosis networks, common material classification standards and open waste-data systems. These interventions reduce the burden on SMEs and allow circular SCM capability to be shared across projects.
For researchers, configuration-level analysis is a more productive approach for circular SCM than individual-lever studies. The three archetypes identified in this article provide a testable framework for future NZ and international research, particularly for replicating the WHI and DSAR metrics across comparable economies. Both metrics could also be incorporated into existing SWMP and sustainability-reporting frameworks at relatively low cost and would create the longitudinal evidence base that this cross-sectional study cannot provide on its own.
The implications also extend to the metrics used in the sector. WHI offers a way to quantify upstream orientation that is comparable across projects, organisations, and time periods. This indicator is agnostic to differences in project scope and material composition, since it is calculated based on the share of weighted SCM effort rather than on absolute waste volumes. Similarly, the DSAR offers a measure of digital SCM penetration. Both metrics could be incorporated into existing SWMP and sustainability-reporting frameworks at relatively low cost and would create the longitudinal evidence base that this cross-sectional study cannot provide on its own.
5.4. Limitations
Four limitations should be acknowledged. The study is cross-sectional, so dynamic effects of SCM configuration over the project life cycle cannot be directly measured. The NZ-specific context, while a deliberate choice, limits external validity to comparable geographically remote, SME-dominated economies. The 15-interview elite sample, while purposively diverse, is weighted toward larger firms with the resources to engage in formal circular initiatives, which may understate the constraints on smaller firms. Finally, only 28 of the 75 cases include quantified waste-reduction percentages, and the DSAR metric records only the primary SCM lever; multi-lever interactions within cases are partially abstracted from the analysis. These limitations point directly to the future research agenda outlined in the conclusion.
A further methodological caveat applies to the practitioner-perspective evidence. The corresponding author’s long industry experience provides contextual fluency, but it also creates the possibility that the SCM levers most familiar to the practitioner community are over-represented relative to less visible alternatives. Triangulation across cases, interviews and documentary evidence, together with the inclusion of international benchmarks that did not feature in the practitioner experience base, has been used to mitigate this risk; readers should nevertheless interpret the configuration archetypes as a robust account of high-performing patterns observable in the dataset rather than as an exhaustive account of all theoretically possible pathways.
6. Conclusion
This study investigated how SCM practices can be optimised to enhance the performance of NZ BE projects under CE constraints. The evidence shows that optimisation is achieved through complementary, coordination-centred configurations rather than through isolated digital, procurement or logistics tools. Coordination and partnerships appear in 46.7% of cases and all highest-performing cases, while digital tools serve mainly as accelerators within wider relational configurations.
The quantitative results strengthen this conclusion. The DSAR of 15.1% shows that digital/data tools remain under-adopted as primary SCM levers, while the WHI of 77.6% indicates a strong SCM orientation toward higher-value options. The significant Pearson association between SCM lever and waste reduction, together with the noteworthy chi-square association between intervention theme and waste hierarchy position, suggests that SCM configuration affects circular performance. The non-significant Kruskal-Wallis result cautions that intervention theme alone is not enough to explain outcomes.
Three archetypes summarise the empirical pattern. The strongest pathway combines design-out, coordination and prevention; the second combines site operations, coordination and recovery; and the third involves multi-lever configurations, mainly in international cases with stronger institutional support. For NZ, the practical priority is therefore to embed ECI and IDP, strengthen relational procurement, build shared digital infrastructure, develop reverse-logistics and material-exchange networks, and require SWMP reporting that captures coordination and material-flow planning rather than compliance alone.
Five practical recommendations for industry are as follows:
- Embed ECI and IDP in all projects above NZ$5 million in capital expenditure.
- Adopt relational procurement and long-term partnership frameworks in place of single-project lowest-tender contracting.
- Invest in shared digital infrastructure with open material classification standards and BIM waste plug-ins designed for SMEs.
- Develop product stewardship and industrial symbiosis networks that capitalise on existing freight back-haul capacity.
- Mandate Site Waste Management Plan (SWMP) reporting that includes coordination requirements rather than compliance checklists alone.
Future research should test these archetypes longitudinally, replicate WHI and DSAR in comparable economies, and examine SME digital adoption pathways in more detail. Overall, the study shows that circular SCM optimisation in NZ is fundamentally relational, with digital and contractual reforms acting as enablers of coordinated supply-chain performance rather than substitutes for it.
Two further avenues are worth exploring. Configuration analysis lends itself to qualitative comparative analysis (QCA) techniques that can identify necessary conditions for high performance across larger case samples. Case studies that track individual SMEs through the adoption of partnerships and digital arrangements over multiple projects would provide the longitudinal evidence base required to distil the practical recommendations into specific implementation playbooks. Together, these avenues would translate the system-level findings of this study into operational guidance at the level where most NZ construction work is delivered.
In conclusion, the empirical evidence presented in this paper supports a clear answer to RQ. SCM optimisation for circular built environment projects in NZ is best understood not as a question of choosing the right individual lever but as a question of compiling the right configuration of levers around a coordination-led core. Once coordination is established, digital tools, procurement reform and reverse logistics infrastructure each amplify performance; if coordination is missing, no individual lever has been shown to deliver Band 4 outcomes. The optimisation programme for the sector is fundamentally relational, with digital and contractual reforms serving as enablers of relational performance rather than as substitutes for it.
Supplementary Materials
all following supporting information can be downloaded at Preprints.org.
The study was approved by the Auckland University of Technology Ethics Committee (AUTEC) (Protocol Number: 24/360; Date of Approval: 10 July 2025).
Informed consent was obtained from all participants involved in the study. All procedures were conducted in accordance with the relevant guidelines and regulations.
Author Contributions
Conceptualisation: J.T. and K.S.; methodology: J.T. and K.S.; formal analysis: K.S.; investigation: K.S.; data curation: K.S.; writing—original draft preparation: K.S.; writing—review and editing: J.T., F.E.R. and K.D.; visualisation: K.S.; supervision: J.T., F.E.R. and K.D.; project administration: K.S. All authors have read and agreed to the published version of the manuscript.
Funding
Please add: The article processing charge (APC) was waived under the Buildings editorial board membership of J.T.
Data Availability Statement
The original data presented in the study are openly available in https://doi.org/10.6084/m9.figshare.32962283.
Conflicts of Interest
John Tookey serves as an Editorial Board Member of Buildings. In accordance with the journal’s editorial policy, this manuscript was handled by an independent editor and peer-reviewed by independent referees. The authors declare no other conflicts of interest.
Abbreviations
The following abbreviations are used in this manuscript:
| SCM | Supply Chain Management |
| NZ | New Zealand |
| WHI | Waste Hierarchy Index |
| DSAR | Digital SCM Adoption Rate |
| C&D | Construction and Demolition |
| SMEs | Small and Medium-sized Enterprises |
| CE | Circular Economy |
| BE | Built Environment |
| ECI | Early Contractor Involvement |
| RQ | Research Question |
| BIM | Building Information Modelling |
| CIF | Circular Information Flow |
| ANFIS | Adaptive Neuro-Fuzzy Inference System |
| IFC | Industry Foundation Classes |
| DfD | Design-for-Disassembly |
| UK | United Kingdom |
| EU | European Union |
| RTA | Reflexive Thematic Analysis |
| IDP | Integrated Design Process |
| ISM | Interpretive Structural Modeling |
| MICMAC | Cross-Impact Matrix Multiplication Applied to Classification |
| SWMP | Site Waste Management Plan |
| QCA | Qualitative Comparative Analysis |
References
- Krausmann, F.; Wiedenhofer, D.; Lauk, C.; Haas, W.; Tanikawa, H.; Fishman, T.; Miatto, A.; Schandl, H.; Haberl, H. Global socioeconomic material stocks rise 23-fold over the 20th century and require half of annual resource use. Proc. Natl. Acad. Sci. 2017, 114(8), 1880–1885. [Google Scholar] [CrossRef] [PubMed]
- Oxford Economics. Future of construction: A global forecast for construction to 2030. Oxford Economics. 2021. Available online: https://www.oxfordeconomics.com/resource/future-of-construction/ (accessed on 13 August 2026).
- Stats, N.Z. Building New Zealand: Focus on the construction industry. 2026. Available online: https://www.stats.govt.nz/news/building-new-zealand-focus-on-the-construction-industry/ (accessed on 13 August 2026).
- Gade, R.; Seadon, J.; Poshdar, M. Constr. Demolition Waste Minimisation N. Z. Chall. Rem. 2025, 46–61. [CrossRef] [PubMed]
- Seadon, J.; Aladwan, A.; Golding, K. Mandatory Site Waste Management Plans. 2022. Available online: https://www.aucklandcouncil.govt.nz/content/dam/ac/docs/plans/waste-strategy/waste-assessment-appendix-d2.pdf.
- She, Y.; Udawatta, N.; Liu, C.; Tokede, O. Circular economy-related strategies to minimise construction and demolition waste generation in Australian construction projects. Buildings 2024, 14(8), 2487. [Google Scholar] [CrossRef]
- Ferriz-Papi, J. A.; Lee, A.; Alhawamdeh, M. Examining the challenges for circular economy implementation in construction and demolition waste management: A comprehensive review using systematic methods. Buildings 2024, 14(5), 1237. [Google Scholar] [CrossRef]
- Ministry of Business; Innovation; Employment. Data for Business. New Zealand Government. 2026. Available online: https://www.business.govt.nz/browse-our-resource-library/business-planning-online-learning/data-for-business (accessed on 16 August 2026).
- Ijimdiya, S. J.; Kumarasamy, M. V.; Adu, J. T.; Pandi, D. Role of the Circular Economy Framework for Sustainable Waste Management and Climate Change Mitigation. Sustainability 2026, 18(4), 1946. [Google Scholar] [CrossRef]
- Kirchherr, J.; Yang, N.-H. N.; Schulze-Spüntrup, F.; Heerink, M. J.; Hartley, K. Conceptualizing the Circular Economy (Revisited): An Analysis of 221 Definitions. Resour. Conserv. Recycl. 2023, 194, 107001. [Google Scholar] [CrossRef]
- Dhawan, K.; Tookey, J. E.; GhaffarianHoseini, A.; GhaffarianHoseini, A. Greening construction transport as a sustainability enabler for New Zealand: A research framework. Front. Built Environ. 2022, 8, 871958. [Google Scholar] [CrossRef]
- Studer, W. P.; De Brito Mello, L. C. B. Core Elements Underlying Supply Chain Management in the Construction Industry: A Systematic Literature Review. Buildings 2021, 11(12), 569. [Google Scholar] [CrossRef]
- Akinade, O. O.; Oyedele, L. O. Integrating construction supply chains within a circular economy: An ANFIS-based waste analytics system (A-WAS). J. Clean. Prod. 2019, 229, 863–873. [Google Scholar] [CrossRef]
- Abadi, M.; Huang, J.; Yeow, J.; Mohandes, S. R.; Zhang, L. Towards a complex push-to-pull dynamics in circular construction supply chains: A systematic literature review. Eng. Constr. Archit. Manag. 2023, 32(2), 912–938. [Google Scholar] [CrossRef]
- Theeraworawit, M.; Suriyankietkaew, S.; Hallinger, P. Sustainable Supply Chain Management in a Circular Economy: A Bibliometric Review. Sustainability 2022, 14(15), 9304. [Google Scholar] [CrossRef]
- Iyiola, C. O.; Shakantu, W.; Daniel, E. I. Digital Technologies for Promoting Construction and Demolition Waste Management: A Systematic Review. Buildings 2024, 14(10), 3234. [Google Scholar] [CrossRef]
- Berglund-Brown, J.; Kedir, F.; Riabova, A.; Hall, D. Assessing Circular Information Flow in Industrialized Construction: A framework for evaluating data for circular construction. IOP Conf. Ser. Earth Environ. Sci. 2022, 1078(1), 012005. [Google Scholar] [CrossRef]
- Fereydooni Eftekhari, A.; Khodabakhshian, A.; Re Cecconi, F.; Daniotti, B. Improving Circularity in Construction Through a BIM-Based Waste Management Framework. IOP Conf. Ser. Earth Environ. Sci. 2024, 1363(1), 012042. [Google Scholar] [CrossRef]
- Gamage, I.; Senaratne, S.; Perera, S.; Jin, X. Implementing Circular Economy throughout the Construction Project Life Cycle: A Review on Potential Practices and Relationships. Buildings 2024, 14(3), 653. [Google Scholar] [CrossRef]
- Sun, Y.; Rameezdeen, R.; Chow, C. W. K.; Gao, J. Information Sharing Barriers of Construction Projects Toward Circular Economy: Review and Framework Development. Buildings 2025, 15(15), 2744. [Google Scholar] [CrossRef]
- European Commission. Construction and demolition waste management in the Netherlands. European Commission. 2015. Available online: https://ec.europa.eu/environment/pdf/waste/studies/deliverables/CDW_The%20Netherlands_Factsheet_Final.pdf.
- Department for Environment; Food; Rural Affairs. Waste management plan for England. UK Government. 2021. Available online: https://assets.publishing.service.gov.uk/media/60103f71d3bf7f05bc42d294/waste-management-plan-for-england-2021.pdf.
- Ministry of the Environment and Water Resources. Zero Waste Masterplan: Singapore’s first zero waste masterplan. Government of Singapore. 2019. Available online: https://isomer-user-content.by.gov.sg/23/795cfb86-73c7-40e8-b6c5-2ec97bc4325f/zero-waste-masterplan.pdf.
- National Environment Agency. Mandatory waste reporting. Government of Singapore. 2026. Available online: https://www.nea.gov.sg/our-services/waste-management/mandatory-waste-reporting.
- Bain & Company. Europe’s construction sector could achieve 50% circularity by 2040 and should strive to do so to meet EU decarbonisation goals. 2022. Available online: https://www.bain.com/about/media-center/press-releases/2022/europes-construction-sector-could-achieve-50-circularity-by-2040-and-should-strive-to-do-so-to-meet-eu-decarbonisation-goals-bain--company-analysis/.
- Rahmani, F.; Khalfan, M.; Maqsood, T. A Conceptual Model for Selecting Early Contractor Involvement (ECI) for a Project. Buildings 2022, 12(6), 786. [Google Scholar] [CrossRef]
- Chen, X.; Qiu, D.; Chen, Y. Reverse Logistics in the Construction Industry: Status Quo, Challenges and Opportunities. Buildings 2024, 14(6), 1850. [Google Scholar] [CrossRef]
- Sonar, H.; Dey Sarkar, B.; Joshi, P.; Ghag, N.; Choubey, V.; Jagtap, S. Navigating barriers to reverse logistics adoption in circular economy: An integrated approach for sustainable development. Clean. Logist. Supply Chain 2024, 12, 100165. [Google Scholar] [CrossRef]
- Ma, L.; Zhang, L. Evolutionary game analysis of construction waste recycling management in China. Resour. Conserv. Recycl. 2020, 161, 104863. [Google Scholar] [CrossRef]
- GreenWay Ltd. IKEA Auckland concrete crushing case study: On-site material recovery in commercial construction. GreenWay Ltd. 2023. Available online: https://www.greenway.net.nz/projects/ikea-demolition-of-buildings-site-improvements/ (accessed on 20 August 2026).
- Chari, A.; Niedenzu, D.; Despeisse, M.; Gonçalves Machado, C.; Azevedo, J.; Boavida-Dias, R.; Johansson, B. Dynamic capabilities for circular manufacturing supply chains—Exploring the role of Industry 4.0 and resilience. Bus. Strategy Environ. 2022, 31, 2500–2517. [Google Scholar] [CrossRef]
- Ortiz-Avram, D.; Ovcharova, N.; Engelmann, A. Dynamic capabilities for sustainability: Toward a typology based on dimensions of sustainability-oriented innovation and stakeholder integration. Bus. Strategy Environ. 2024, 33(4), 2969–3004. [Google Scholar] [CrossRef]
- Opoku, A.; Solomon Adewumi, A.; Leung Lok (Lawrence), K.; Amoh, E. "Chapter 17: Lean construction and SDGs: Delivering value and performance in the built environment". In The Elgar Companion to the Built Environment and the Sustainable Development Goals; Edward Elgar Publishing: Cheltenham, UK, 2024. [Google Scholar] [CrossRef]
- Abdelmegid, M.; Tezel, A.; Sandoval, C. O.; Fang, Z.; Collinge, W. Conceptualizing Digital Twins in Construction Projects as Socio-Technical Systems. In International Symposium on Automation and Robotics in Construction (ISARC) Proceedings, 2024 Proceedings of the 41st ISARC, Lille, France, 2024; pp. 577–584. [Google Scholar] [CrossRef] [PubMed]
- Pimentel, M.; Arantes, A.; Cruz, C. O. Barriers to the Adoption of Reverse Logistics in the Construction Industry: A Combined ISM and MICMAC Approach. Sustainability 2022, 14(23), 15786. [Google Scholar] [CrossRef]
- Kadefors, A.; Aaltonen, K.; Gottlieb, S.C.; Klakegg, O.J.; Lahdenperä, P.; Olsson, N.O.; Rosander, L.; Thuesen, C. Relational contracting in Nordic construction – a comparative longitudinal account of institutional field developments. Int. J. Manag. Proj. Bus. 2024, Vol. 17(No. 8), 22–46. [Google Scholar] [CrossRef]
- Creswell, J. W.; Creswell, J. D. Research design: Qualitative, quantitative, and mixed methods approaches, 6th ed.; SAGE Publications, 2023. [Google Scholar]
- Saunders, M. N. K.; Lewis, P.; Thornhill, A. Research methods for business students, 9th ed.; Pearson Education, 2023. [Google Scholar]
- Braun, V.; Clarke, V. Reflecting on reflexive thematic analysis. Qual. Res. Sport Exerc. Health 2019, 11(4), 589–597. [Google Scholar] [CrossRef]
- Braun, V.; Clarke, V. Using thematic analysis in psychology. Qual. Res. Psychol. 2006, 3(2), 77–101. [Google Scholar] [CrossRef]
- Pires, A.; Martinho, G. Waste hierarchy index for circular economy in waste management. Waste Manag. 2019, 95, 298–305. [Google Scholar] [CrossRef] [PubMed]
- Ševčíková, R.; Jarossová, M.A.; Chomová, K. The Role of Design in the Transition to a Circular Economy. In Developments in Information and Knowledge Management Systems for Business Applications. Studies in Systems, Decision and Control; Štarchoň, P., Fedushko, S., Gubíniova, K., Eds.; Springer: Cham, 2026; vol 602. [Google Scholar] [CrossRef]
- Yu, R.; Gu, N.; Liu, T.; Guan, H.; Oh, E.; Sharifi, S.; Chang, R. AEC perceptions on DFMA collaboration and supporting technologies for prefabricated housing in Australia and New Zealand. Adv. Des. Res. 2024, 2(2), 115–124. [Google Scholar] [CrossRef]
- Papadonikolaki, E.; Verbraeck, A.; Wamelink, H. Formal and informal relations within BIM-enabled supply chain partnerships. Constr. Manag. Econ. 2017, 35(8–9), 531–552. [Google Scholar] [CrossRef]
- Dowsett, R. M.; Harty, C. F. Assessing the implementation of BIM – an information systems approach. Constr. Manag. Econ. 2019, 37(10), 551–566. [Google Scholar] [CrossRef]
Figure 1.
Primary SCM Levers.
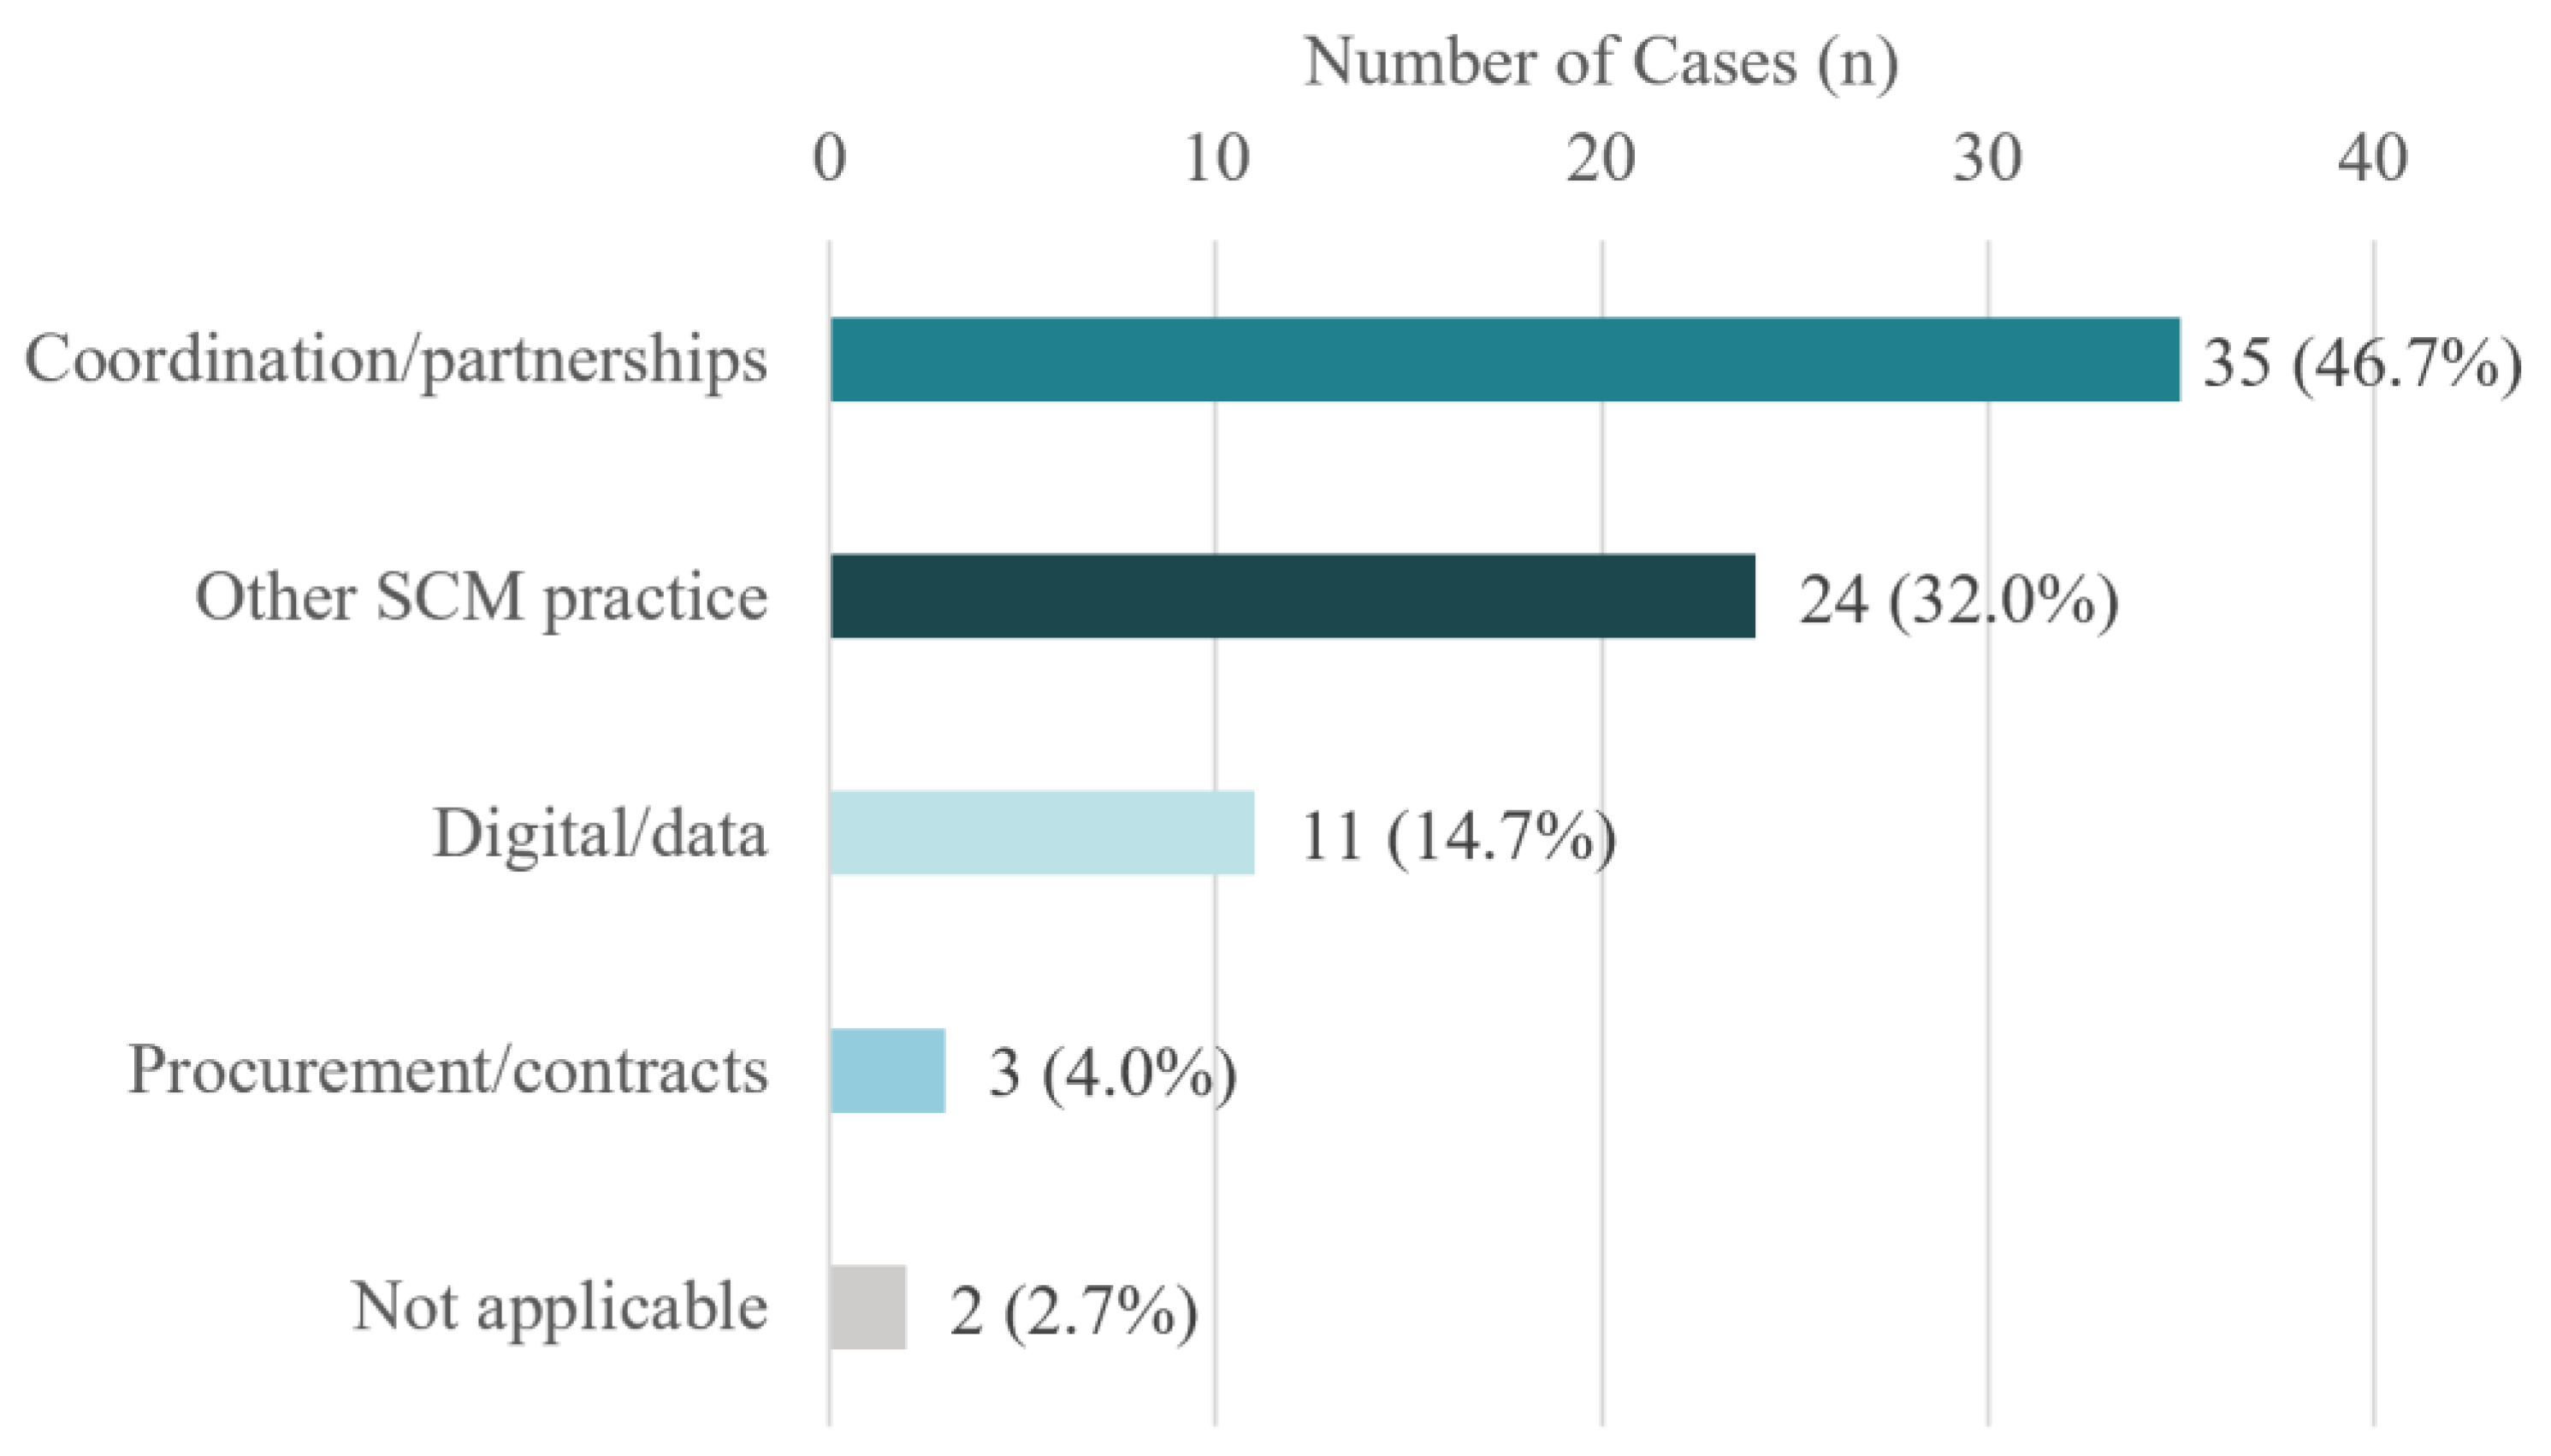
Figure 2.
Waste Hierarchy Distribution.
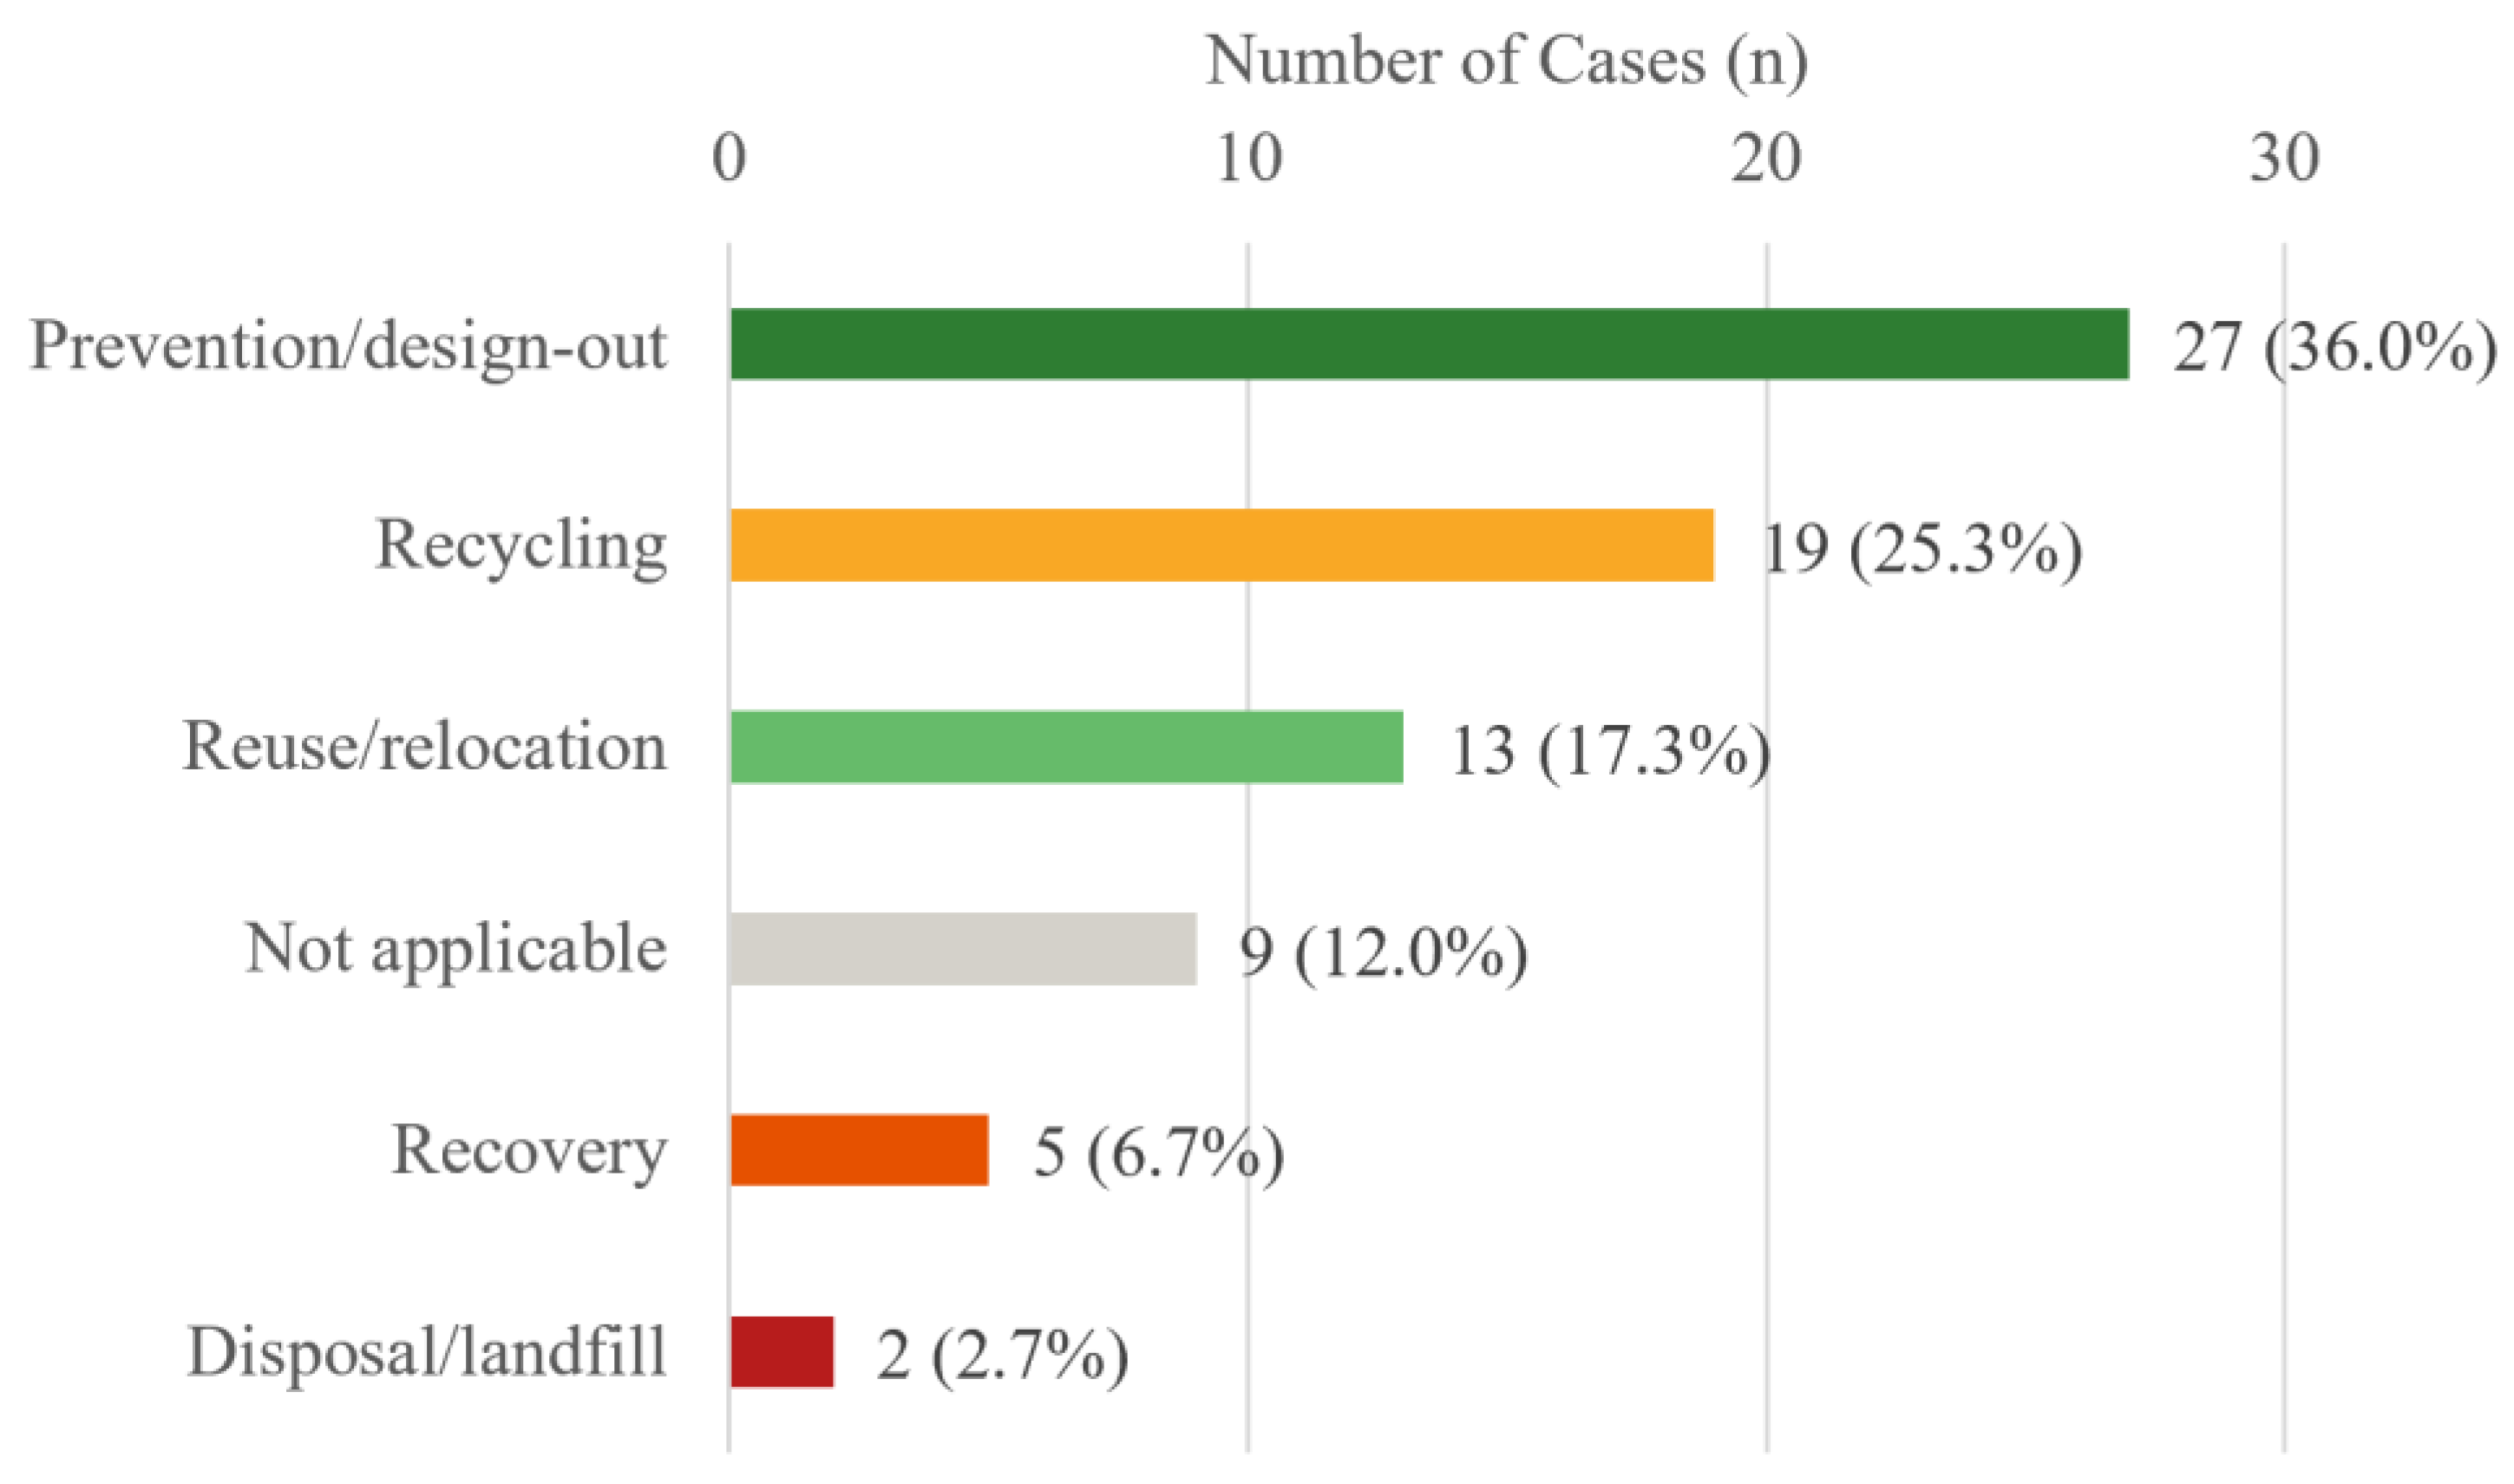
Figure 3.
Pearson Correlation Matrix Heatmap.
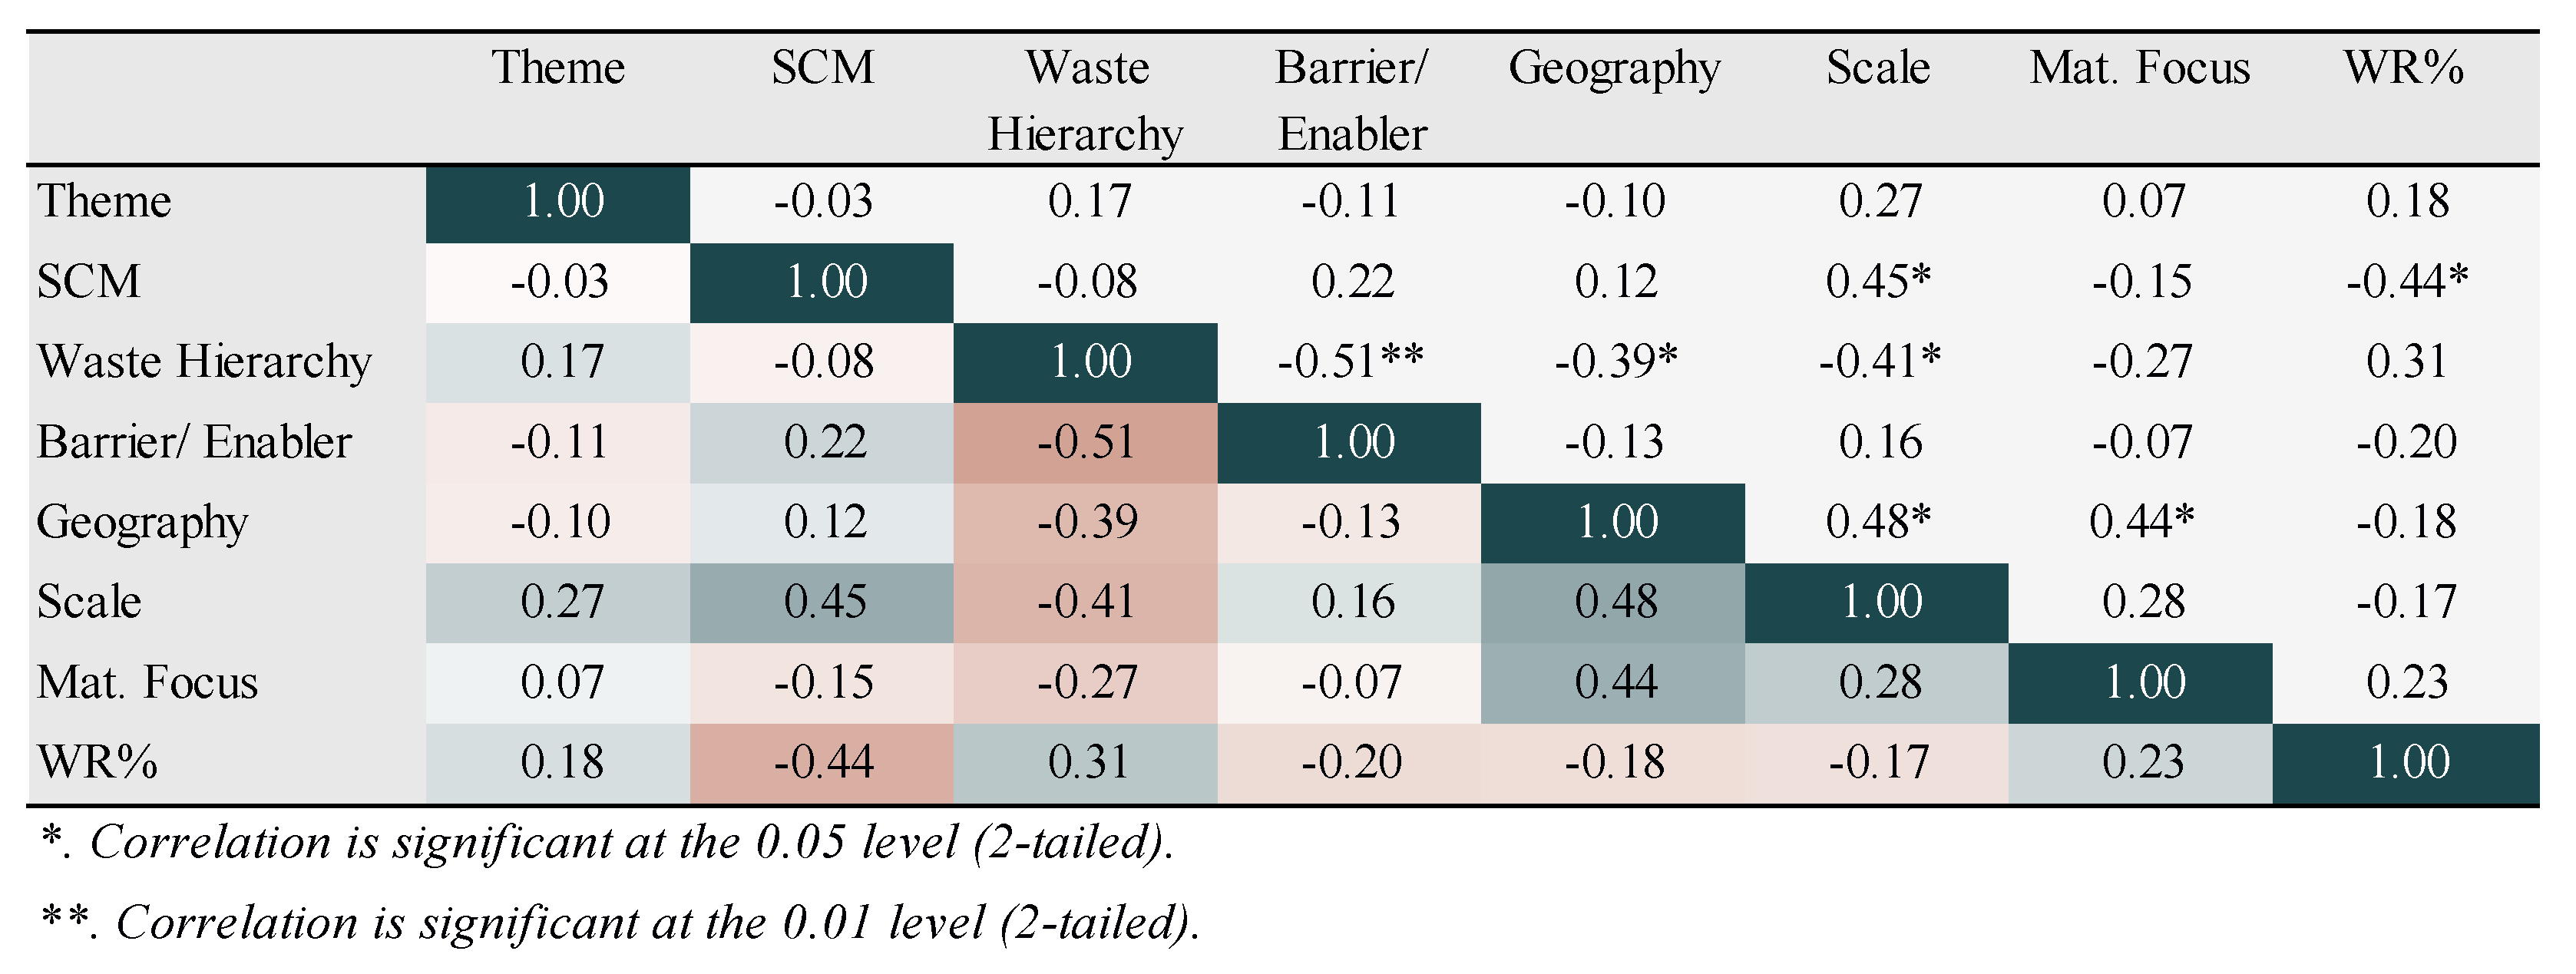
Figure 4.
Performance Bands vs SCM Lever.
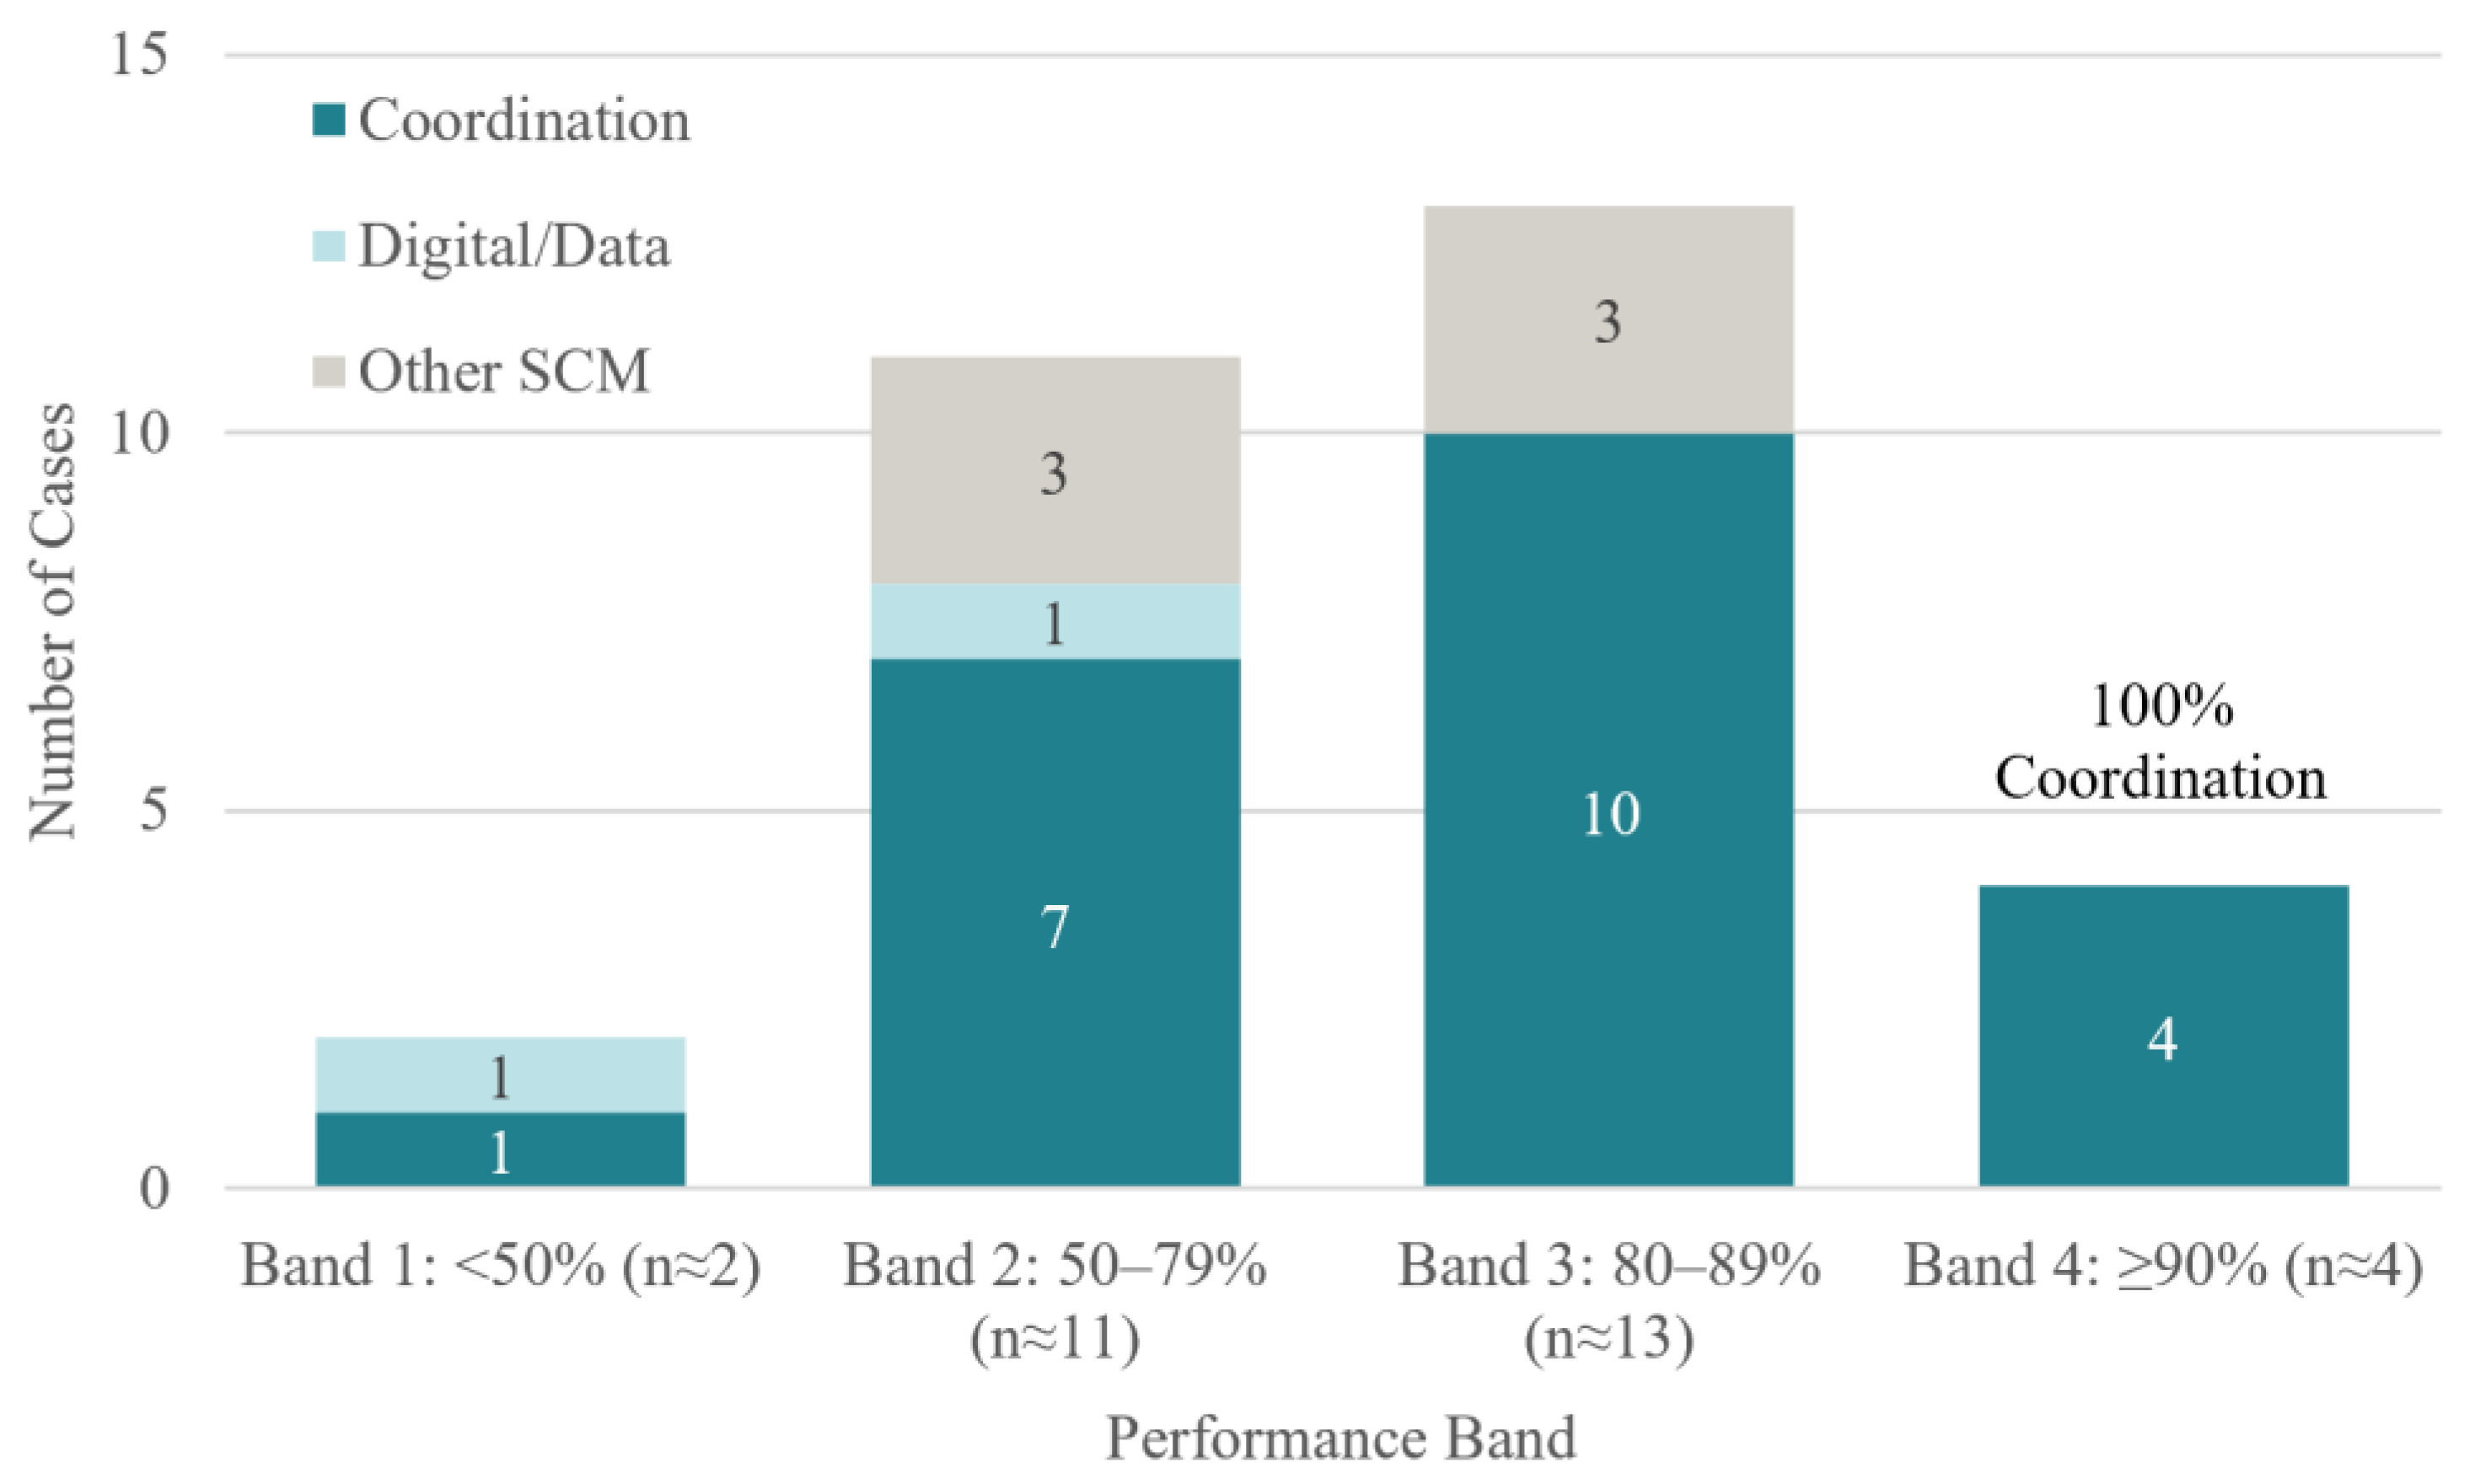
Table 2.
Operational Metrics Used in the Quantitative Analysis.
| Metric | Formula | Result | Interpretation |
|---|---|---|---|
| Waste Hierarchy Index (WHI) | WHI (%) = [(Prevention cases × 5) + (Reuse cases × 4) + (Recycling cases × 3) + (Recovery cases × 2) + (Disposal cases × 1) / (Active cases × 5)] × 100 | [(27 × 5) + (13 × 4) + (19 × 3) + (5 × 2) + (2 × 1)] / (66 × 5) × 100 = 77.6% | Measures the share of weighted SCM effort operating across the full waste hierarchy, indicating a stronger overall orientation toward higher-value options. |
| Digital SCM Adoption Rate (DSAR) | DSAR (%) = (Digital/data cases as primary SCM lever / cases with a stated SCM lever) × 100 | Full dataset: 11/73 × 100 = 15.1%; quantified subset: 2/28 × 100 = 7.1% | Measures the extent to which digital/data tools operate as the primary SCM lever. |
Table 3.
Distribution of Primary SCM Levers Across the 75-case Dataset.
| SCM Lever (Primary) | Cases (n) | Share of Total |
|---|---|---|
| Coordination / partnerships | 35 | 46.7% |
| Other SCM practices (modular, logistics, stewardship) | 24 | 32.0% |
| Digital / data (DSAR) | 11 | 14.7% |
| Procurement / contracts | 3 | 4.0% |
| Not applicable | 2 | 2.7% |
| Total | 75 | 100.0% |
Table 4.
Summary of Quantitative Associations in the Case Dataset.
| Analysis | Variables | Dataset | Result | Interpretation |
|---|---|---|---|---|
| Descriptive metric | WHI | 66 active cases | 77.6% | Indicates a stronger overall SCM orientation toward higher-value options. |
| Descriptive metric | DSAR | 73 cases with stated lever | 15.1% | Digital/data tools are under-used as the primary SCM lever. |
| Chi-square test | Intervention theme × waste hierarchy position |
75 cases | χ²(25) = 80.20, p < .001 |
Intervention themes and hierarchy positions are systematically related. Coordination and design-led themes cluster with prevention/reuse, while site operations cluster with recycling/recovery. |
| Spearman correlation | SCM lever × scale of intervention |
75 cases | rs(73) = .39, p = .040 |
Larger-scale projects are more likely to deploy complex SCM configurations. |
| Krusal- Wallis H-test |
Waste reduction percentage × intervention theme |
28 cases | H(3) = 2.20, p = .53 |
Waste reduction does not differ significantly by intervention theme alone. Configuration appears more explanatory than single-theme classification. |
| Pearson correlation | SCM lever × waste reduction percentage |
28 cases | r(26) = -.44, p = .018 |
Coordination/partnership-led cases are associated with higher waste reduction than cases relying on later-coded levers as standalone drivers. |
| Spearman correlation | SCM lever × waste reduction percentage | 28 cases | rs(26) = -.35, p = .067 |
The ranked association approaches conventional significance and supports the same directional pattern as the Pearson result. |
Table 5.
Three Dominant High-Performing SCM Configuration Archetypes.
| Archetype | Core Components |
Performance Signature |
Theoretical Interpretation |
| A1. Design-out + Coordination + Prevention | IDP/ECI; relational procurement; Design for Disassembly (DfD); upstream waste hierarchy positioning. | Highest diversion rates (Band 4 ≥90%); highest cost-saving incidence (e.g. 18% Albany). | Full triple-capability deployment in Dynamic Capabilities terms (sense + seize + reconfigure); lean “design-for -manufacture.” |
| A2. Site Operations + Coordination + Recovery / Recycling | On-site source separation; stewardship partnerships; coordinated recycling relationships. | Moderate-to-high diversion (Band 2–3); reliable cost-neutral performance. | Partial capability deployment: strong seizing/reconfiguring, limited sensing. |
| A3. Combined Multi-Lever + Prevention |
Simultaneous digital + coordination + procurement reform; observed mainly in international cases. | Highest ambition configurations; performance contingent on institutional context. | Full triple-capability deployment plus institutional scaffolding (subsidy/penalty mix). |
Disclaimer/Publisher’s Note: The statements, opinions and data contained in all publications are solely those of the individual author(s) and contributor(s) and not of MDPI and/or the editor(s). MDPI and/or the editor(s) disclaim responsibility for any injury to people or property resulting from any ideas, methods, instructions or products referred to in the content. |
© 2026 by the authors. Licensee MDPI, Basel, Switzerland. This article is an open access article distributed under the terms and conditions of the Creative Commons Attribution (CC BY) license (http://creativecommons.org/licenses/by/4.0/).
Copyright: This open access article is published under a Creative Commons CC BY 4.0 license, which permit the free download, distribution, and reuse, provided that the author and preprint are cited in any reuse.