

Submitted:
09 September 2026
Posted:
10 September 2026
You are already at the latest version
Abstract
Laser-Powder Bed Fusion process is one of the most widespread Additive Manufacturing processes for metal and polymeric parts, enabling the realisation of complex, free-form, and low-density structures that are impossible or difficult to realise with traditional manufacturing techniques. However, this process is characterised by defects such as porosity, roughness, layer delamination, and others that limit mechanical behaviour. This work aims to analyse the correlation between mechanical performance and shape complexity in additive manufacturing parts. A complexity index was adopted to characterise the geometry of specimens and lattice structures, and prototyping and testing activities were carried out to evaluate the correlation between the shape complexity and performance. The materials involved in the experimental analysis are Al-Si-Mg, Al-Cu, and PA12, all realised by Laser-Powder Bed Fusion processes. To extend the approach, specimens with a biocompatible resin realised by VAT photopolymerization were also considered. The results show a dependence between shape complexity and mechanical performance, highlighting a non-linear behaviour. Despite the shape complexity offering a significant advantage in achieving tailored component performance in mechanical products, the results showed that designers must use it with particular attention due to fluctuating material performance as shape complexity increases.
Keywords:
laser-powder bed fusion
; shape complexity
; Al-alloy
; PA12
; lattice structures
; TPMS
1. Introduction
Additive Manufacturing (AM), also known as 3D Printing, comprises digital manufacturing processes that build components by adding material layer by layer, starting from a CAD model. Standard ISO/ASTM 52900:2021 identifies seven AM categories to classify production processes [1].
AM can enable the localised production of extremely complex shapes and personalised products while reducing the need for tooling and stock holding [2]. It can diminish assembly time, improve reliability by consolidating components, and enable the fabrication of meta-materials [3] for lightweight [4] or self-assembling [5] components. These geometries can be obtained using different algorithmic techniques, such as Topology, Shape, and Parametric Optimisations, or Generative Design techniques [6]. To capitalise on the design opportunities of AM, Shape Complexity (SC) can be further increased with the introduction of fractals, lattices, and minimal surface structures [7]. From a sustainability perspective, the strength of AM lies in its material usage; AM processes can produce parts with fewer waste materials compared to traditional manufacturing techniques. Scrap is produced by the necessary support structures and sieving operations in powder processes. The efficiency of an AM component can be directly correlated to the quantity of material used; complex and lightweight geometries aim to exploit material usage, seeking increasingly challenging components. Designing complexity in AM, particularly for the Laser-Powder Bed Fusion (L-PBF) process, may appear advantageous due to potential material reductions. However, further studies are necessary to determine whether increased part complexity improves material effectiveness in terms of mechanical performance. It is relevant to assess whether the mechanical performance of materials benefits from high shape complexity. Given the multitude of factors involved, such as different materials (aluminium, maraging steel, stainless steel, titanium, nickel superalloys, precious metals, etc.), various types of lattice structures (struts, TPMS), and their diverse applications (heat exchangers, shock absorbers, acoustic absorbers, and biomedical implants, etc.); it is not feasible to establish a single guideline for design.
1.1. Aims
This work investigates the impact of Shape Complexity (SC) on the mechanical properties of additively manufactured Al-alloy specimens produced with the L-PBF process, ranging from simpler shapes in Al-Si-Mg and Al-Cu alloys to highly complex ones. However, the study also considers specimens with PA12 and biocompatible resin. In particular, the paper focuses on Al alloys, and the results aim to support the industrial adoption of HS-Al alloys, enabling the development of innovative, high-value, lightweight components. Studying printed specimens can help reduce future defects, promote sustainable “first-time-right” production with lower waste and resource use, and increase cost-effectiveness, making L-PBF more attractive to industry. Results could support the usage of High-Strength-Al (HS-Al) alloys as a sustainable alternative to composite materials for advanced lightweight applications. Several studies are advancing the use of composites; however, these materials are not relatively easy to recycle due to the cost inefficiencies in separating the individual materials and the limited recyclability of the polymeric matrix. Conversely, HS-Al alloys are fully recyclable materials that can be reprocessed indefinitely.
2. State of the Art
2.1. Design for Additive Manufacturing
Design for Additive Manufacturing (DfAM) is the branch of engineering design that focuses on enabling defect-free components, from the early design phases to the quality inspection of 3D-printed components. Despite the significant advantages of realising free-form and complex geometries, several manufacturing constraints remain. For the L-PBF process, several constraints are related to manufacturing limits, including minimum wall thickness, minimum and maximum hole clearance, dimensional accuracy, and surface roughness [8]. Other drawbacks limit the industrial adoption of this manufacturing process: the necessity of support structures, thermal post-processing operations, long build times for large-sized components, limited dimensions of the building chamber, and the high cost associated with machines, necessary auxiliary instrumentation, and raw materials [9].
2.2. Laser-Powder Bed Fusion
L-PBF, also called Selective Laser Melting (SLM) or Direct Metal Laser Sintering (DMLS), is a prominent AM technology for producing metal components due to its characteristics such as high resolution, quasi-isotropic mechanical behaviour, and enclosed build chamber [10]. In this technique, a laser selectively melts a thin metal alloy powder layer, typically measuring between 30 and 60 μm, to create the desired geometry. A recoater spreads a new layer of powder, and then the laser melts the powder particles until the part is fully constructed.
Despite L-PBF being the technique that guarantees better 3D printing results in terms of overall quality for metal components, this process needs further studies to enhance surface roughness and internal porosity, and to reduce distortions and residual stresses of 3D-printed parts, due to the high thermal gradients between layers during the printing phase. Improvements in repeatability and process stability are also needed. These issues are principally related to the high number of process parameters involved and the different quality of powders. Key parameters include laser power, scanning speed, hatching distance, layer thickness, scanning strategy, and building orientation. Other relevant parameters are gas flow, protective atmosphere of the building chamber, laser beam radius, laser type, and bed temperature. Together, these parameters and powder properties determine the quality, microstructure, and mechanical performance of the fabricated metal parts [11].
2.3. Shape Complexity
The shape of a component strongly influences the cooling rate and energy density during laser scanning. Variations in thickness, intricate features, larger surface area, internal cavities, and the part's orientation with respect to the laser direction affect the amount of material near the heat source and, consequently, the cooling behaviour. The Shape Complexity Index (SCI) is a numerical measure useful to estimate the overall geometry of a component. It describes the complexity of a part relative to a simple reference shape, such as a cube, sphere, or cylinder. SCI definitions vary by context, but higher values generally indicate more complex parts.
Brajlih et al. [12] presented a method for evaluating AM machine’ speed and accuracy capability, looking for an objective comparison among them. The authors identified three factors that influence speed (part’s volume divided by time of manufacture: the part’s geometrical complexity, the yield of the whole working space, and the technology used. To describe the geometrical complexity factor, the authors introduced a volume ratio, defined as the part’s volume divided by its envelope volume. Valentan et al. [13] proposed a model that exploits STL file metrics, geometric partitioning, and expert-based rules to quantify complexity and support the selection of suitable manufacturing processes. They convert a CAD model into its STL representation, extract geometric measures, subdivide space, analyse problematic orientations, and then combine those into a complexity score to guide process decisions. Pradel et al. [14] investigated how SC affects build time and material consumption in the material extrusion process, defining the SCI as the ratio of the bounding box surface area to its volume. More geometrically complex variants may require longer build times and greater material usage than simpler variants, due to the need for numerous support structures. Greco et al. [15] developed a method for complexity evaluation that integrates geometrical, manufacturing, assembly, and disassembly complexities into a unified product complexity index. Ali et al. [16] aimed to quantify the effects of shape complexity on energy consumption and surface quality in Stereolithography (SLA) and Fused Filament Fabrication (FFF) processes, challenging the assumption that geometric complexity in AM is cost-neutral. The authors demonstrated that increasing part complexity leads to higher power consumption in both SLA and FFF, and to degraded surface quality, particularly in FFF due to more frequent toolpath changes and start–stop motions. Matoc et al. [17] introduced a hybrid framework to define an AM complexity index tailored to VAT photopolymerization processes, combining an expert-based weighting method with machine learning to calibrate, validate, and refine the metric. The framework aims to support decision-making during the early design stages of VPP parts.
Slama et al. [18] proposed a method to determine whether a part is more suitable for AM or traditional manufacturing, including a complexity measure and a threshold value. This SCISlama is based on six factors: volume, surface, thickness, internal curves, surface type, and curve type ratios. The first factor, volume ratio (Vr; Equation 1), is the ratio of the removed volume (Vs) to the bounding box volume (Vbox). The second factor, surface ratio (Sr, Equation 2), represents the ratio of the cube surface area with the same part volume (Scube) to the part’s effective surface area (Spart). The third factor, the thickness factor (Tr, Equation 3), is defined as 1 minus the ratio of the minimum thickness (Tmin) to the maximum thickness (Tmax) of the part; this factor assesses whether thickness introduces complexity in the part. The fourth factor, internal curves ratio (Icr), is described in Equation 4, where the term is the number of internal curves. The fifth factor, surface type ratio (Str), describes the complexity related to the surface types (Equation 5); ten classes of surfaces are identified from simplex to be realized (10 class index) to complex (1 class index); the term Si is the number of surfaces of class i; is the weight coefficient associated with class i, which quantifies the manufacturing difficulty of that specific surface type. The sixth factor, curve type ratio (Ctr), is similar to surface type ratio but focuses on curves, with an index of complexity ranging from 8 (simplex) to 1 (complex). Finally, Equation 7 describes the final proposed by Slama et al. [18] as a linear combination of the coefficients described above.
2.3.1. Shape Complexity and L-PBF
Moving from general SC definitions to L-PBF-specific considerations, several defects arise that affect manufacturability and the overall quality of 3D-printed parts. It is common to associate strut-based structures and triply periodic Minimal Surfaces (TPMS) with a high SC level (examples in Figure 1).
The Maxwell number (Equation 8) is a parameter used to characterise the structural behaviour of a strut-based framework:
where is the number of struts and is the number of nodes for the single cell. When , the structure lacks enough struts to balance external forces without creating moments at the nodes, inducing bending stresses in the struts. When , the external loads are supported entirely through axial tension and compression in the struts; these systems are therefore stretch-dominated [19].
M = s - 3n + 6
TPMS are defined by mathematical equations that describe the isosurface separating the solid and void regions of the structure. Their mechanical behaviour can be tuned by modifying periodicity and relative density (, Equation 9), the ratio between the density of the lattice material () and the density of the solid material (bulk) () of the single cell.
The periodicity in TPMS is determined by the k-values (, , ), calculated using Equation 10, where is the number of cell repetitions in the x, y, or z directions, and is the total size of the structure along that axis.
As an example, the isosurface equation for the gyroid lattice (Figure 1 g) is reported in Equation 11. The variable t (thickness) is used to modify the relative density.
Compared to strut-based lattices, TPMS structures offer advantages in manufacturability. In L-PBF, strut-based lattices are limited by the inclination angles of their struts. TPMS geometries overcome this issue by smoothly varying their surface inclination, allowing each layer to be supported by the one below and enhancing printability [20].
The Gibson-Ashby model describes the mechanical properties of lattice and TPMS structures as a function of relative density. It uses power-law relationships between the effective properties of the lattice and those of the solid material it is made of. The Gibson–Ashby model provides a scaling law to predict how stiffness and strength decrease as a lattice becomes lighter. Equations 12 and 13, respectively, describe the relationships between elastic modulus and yield strength and relative density. Where is the effective Young’s modulus of the lattice, is the Young’s modulus of solid material, is the yield strength of the lattice, is the yield strength of the solid material, and , , , and are empirical constants depending on lattice geometry [21].
Alsalla et al. [7] tested how gyroid stainless steel 316L lattices made via L-PBF perform in terms of fracture toughness and tensile strength, studying the effect of building direction. The lattice structures exhibited meaningful tensile strength and fracture toughness. They highlighted that build orientation affected mechanical properties, though results agreed reasonably with Gibson–Ashby predictions.
In more general geometries, broader studies link geometric features to part quality and the mechanical behaviour of L-PBF-printed parts. Carrozza et al. [22] investigated how the different titanium alloys perform when built via L-PBF in geometries with complex features such as thin walls and hollow channels. They analysed geometrical compliance, how well the built part matches the design, porosity and internal defects, and microstructure and hardness, finding that smaller features increase defects and alter microstructure. The study emphasises that there are material-specific and geometry-specific limits (thicknesses, overhangs, internal channels) that must be considered. Bushra et al. [23] studied how specific geometric features influence part quality, specifically distortion, and used this knowledge to develop data-driven design guidelines for AM by identifying geometric features that contribute to higher part distortion. Deep et al. [24] developed a numerical framework for the preliminary evaluation of manufacturability for geometrically complex parts in the L-PBF process, with a particular focus on the layer thickness process parameter. The authors quantified how geometrical complexity (non-standard shapes, thin walls, etc.) can impact manufacturability, in terms of build time and productivity, linking layer thickness (as a controllable process parameter). The authors developed a numerical framework showing how geometrical complexity and layer thickness influence manufacturability, defining the manufacturability as a product between the build rate efficiency (considering layer thickness) and the part geometrical complexity.
2.4. Aluminium Alloys with L-PBF
Al-alloys are a sustainable material, thanks to being fully recyclable and can be reprocessed indefinitely [25]. Reprocessing infrastructures are also widely available. Al is also a non-critical material, and Al natural reserves are planned to last for hundreds of years at the current consumption levels [26].
L-PBF Aluminium alloys are appreciated for their low density, high strength-to-weight ratio, and corrosion resistance, but they present challenges due to high thermal conductivity and susceptibility to hot cracking. Alloys with high silicon content, such as AlSi10Mg and AlSi12, are the most used because silicon improves fluidity, which reduces cracking during the printing phase. These alloys are suitable for complex geometries and offer a good balance of strength and ductility [27]. HS-Al alloys can be used in L-PBF, but they are more difficult to process and require careful control of laser parameters, build orientation, and sometimes preheating to minimise residual stress and cracking. Post-processing, including stress relief and heat treatment, is often necessary to achieve optimal mechanical properties [28].
Alloys made with the L-PBF method are known to suffer metallurgical and surface defects, including porosity (keyhole and gas), cracks, and a lack of fusion [29]. These imperfections have a negative impact on mechanical properties by increasing microstructural irregularity and stress concentration [30]. As a result, numerous methods for minimising the faults of SLM metals are continually being researched, studying process parameter effects and post-processing treatments. Solution and precipitation hardening heat treatment have been investigated in several studies to determine the effect of L-PBF Al alloy precipitation hardening and pore decreasing control [31].
2.4.1. Al-Si-Mg Alloys
The AlSi10Mg alloys belong to the Al-Si-Mg system, and their typical chemical composition consists of 9.0–11.0% silicon, 0.25–0.45% magnesium, less than 0.25% iron, and small traces of copper, manganese, zinc, and titanium, with aluminium as the balance. The AlSi10Mg hypoeutectic alloy was originally developed for casting, but it has spread in L-PBF applications due to its high silicon content, which enhances laser absorptivity, reduces thermal expansion, and improves melt pool fluidity. These characteristics help minimise residual stresses and prevent cracking during the printing process [32]. Applications include aerospace, automotive, and general engineering components such as brackets, housings, heat exchangers, heat sinks, lightweight enclosures, tooling inserts, and prototypes [33].
In terms of mechanical properties, parts made from L-PBF AlSi10Mg achieve a density of approximately 99.5% of the theoretical value [34]. In their as-built condition, the tensile strength is , and the yield strength , and the elongation is between 3% and 6% [9,35,36]. After heat treatment, such as T6 ageing, the tensile strength typically decreases to between 320 and 420 MPa, the yield strength ranges from 220 to 280 MPa, and the elongation increases to about 8% to 12% [37,38].
2.4.2. Al-Cu Alloys
Aluminium-Copper (Al-Cu) alloys are a commonly used material in the automotive, aerospace, and marine industries thanks to their good mechanical properties-to-density ratio, excellent corrosion resistance, full recyclability, and relatively low cost [39].
The design opportunities of L-PBF, combined with the properties of Al-Cu alloys, could transform many industries through the development of advanced engineering applications, such as high-efficiency heat exchangers, energy storage, and lightweight components [40]. Leveraging AM capabilities such as shape complexity, customisation, on-demand production, and meta-materials, the Al-Cu alloy could further expand its industrial use.
Al-Cu and the SC provided by L-PBF can enable a sustainable alternative to composite materials for advanced lightweight applications. Al-Cu has not been widely adopted in L-PBF due to crack formation during the laser melting process [41]. The production of Al-Cu components in L-PBF has been hindered by micro-crack and void formation during the laser process. This cracking mechanism arises during the melt pool solidification when the thin liquid film that forms on the grain boundaries cannot accommodate the solidification shrinkage. Furthermore, Al-Cu might contain volatile alloying elements such as Zn, Mg, and Li, which can evaporate during the L-PBF process, causing a modification of the chemical composition and consequently of the micro-structure and properties of the material [42].
Several types of metals can be processed with L-PBF, but there are still significant challenges to achieving defect-free components with Al-Cu. Until now, how the design of an Al-Cu component impacts the formation of defects and the quality of printing has never been studied. Researchers have explored process parameters and new Al alloys with moderate success, but have neglected how component geometry affects mechanical properties, void formation, and grain structure. Shape plays a crucial role in L-PBF as it can significantly affect the cooling rate and energy density during laser scanning [43].
2.5. Material Selection
Quantitative methods have been developed to support designers in material selection to meet objectives such as weight reduction, performance enhancement, and cost control in engineering design. Material choice depends on the component’s function; material properties can influence the final decision. For instance, density and cost are general properties, while elastic modulus, yield strength, ultimate strength, failure strength, and compressive strength are mechanical properties. Additionally, melting point, glass transition temperature, and thermal expansion are examples of thermal properties. Material selection is often constrained by the manufacturing process and the material's ability to be processed effectively. In the case of the L-PBF process for metals, the choices are often limited by the alloys' printability and the availability of metal powders in the market.
Material property charts, or Ashby charts, are graphical tools used to compare and analyse the properties of engineering materials to aid materials selection. Each chart plots one material property against another one, typically on logarithmic scales, so materials with similar characteristics occupy distinct regions on the graph. These charts provide a visual overview of the performance and trade-offs among different material classes such as metals, polymers, ceramics, composites, and foams [44].
Rao [45] proposed a structured method to select appropriate materials for a component by combining graph-theoretic concepts with matrix modelling, using a directed graph in which nodes represent criteria and materials, and links convey influence or preference relations. From the graph, a relationship matrix is derived and then manipulated to evaluate how well each material satisfies the network of design criteria. Chatterjee et al. [46] presented a systematic framework for selecting materials in engineering design when multiple conflicting criteria must be considered. They applied two multi-criteria decision-making methods, the compromise ranking method (VIKOR) and the outranking method (ELECTRE), to a set of alternative materials evaluated on several criteria. Giorgetti et al. [47] reviewed and analysed how Axiomatic Design and Multi-Criteria Decision-Making methods can be combined for material selection in mechanical design, especially in scenarios with different levels of information availability about alternatives and criteria. Their work focused on establishing a decision-support framework that helps designers systematically choose materials when facing multiple, often conflicting requirements. Jahan et al. [48] improved the VIKOR method with a new normalisation scheme handling benefit, cost, and target criteria, yielding more realistic material. Through several case studies, they demonstrated that the revised method provides accurate and realistic rankings of materials by reflecting practical design requirements. Anojkumar et al. [49] investigated the use of several multi-criteria decision-making techniques to choose appropriate materials for piping systems within the sugar industry. The authors defined relevant material properties (cost, corrosion resistance, mechanical strength, ease of maintenance, service life, etc.), assigned weights to these criteria, and then applied a set of different methods to rank candidate materials. Their comparative analysis shows how different methods can yield different rankings, and how sensitive the rankings are to the criteria weights and method chosen.
3. Experimental Approach
One key advantage of the Additive Manufacturing process is the possibility to realise complex geometries, such as lattices or TPMS structures, that are difficult or impossible to manufacture conventionally. However, achieving the geometric and dimensional tolerances required in mechanical applications remains a major challenge. This study aims to explore how a component’s shape could affect its mechanical performance while keeping its volume and cross-section constant.
Figure 2 illustrates the workflow of the experimental approach used to analyse the correlation between shape complexity and mechanical behaviour. Test samples with different degrees of SC were designed and produced using L-PBF in both Al-Cu and Al-Si-Mg alloys. The same samples were also produced in PA12 and Resin. While PA12 specimens were produced with the L-PBF process for polymers, Biocompatible Clear Photopolymer Resin specimens were realised with the VAT Photopolymerization process. The use of different materials enhances the analysis of shape complexity and its effect on the specimens' mechanical behaviour. Using an analytical approach, the Shape Complexity of each specimen was evaluated. Thus, each physical specimen was tested by tensile proof, and for the metal specimens, internal porosity was also assessed. A mechanical performance index was defined to compare and analyse the obtained results.
3.1. Design of the Test Specimens
The work considers both specimens with simple geometric designs (called no-complexity) and specimens with increased shape complexity. The following sections outline the methods used to modify and increase the shape complexities. Figure 3 reports the main dimensions, expressed in millimetres, of the no-complexity specimens. Type 0 (Figure 3a) has a thickness of 6mm and has been printed in Al-Si-Mg alloy and Resin (brittle behaviour). Type 1 (Figure 3b) has a thickness of 3 mm and was fabricated in Al-Si-Mg and Al-Cu alloys, and PA12 Nylon.
Using the scheme for Type 0 and Type 1 specimens, seven models were designed with increasing shape complexity, as described in the next sections. Figure 4 presents these models with their nomenclature. Both families of specimens have the same volume and cross-section. All Type 0 specimens have the same volume and cross-sectional area; the same holds for Type 1. This design constraint aims to focus the analysis on the effect of the shape complexity on the mechanical behaviour.
3.1.1. Type 0 Design
In Figure 4, the first three models from left are related to Type 0. The 0_No model is the no-complexity specimen, while 0_Low and 0_High present growing SC. In particular, the 0_Low model is associated with the low-complexity model, and the 0_High model represents the high-complexity specimen for Type 0. Note that all models have the same volume. For 0_Low, the central part is divided into three rods, each 1 mm in length. For 0_High, the central part is divided into six rods, each 0.5 mm in length.
3.1.2. Type 1 Design
Following the criteria of constant volume and cross-section, a method was developed to construct variable-complexity lattice structures for Type 1 models. Maintaining constant volume, a higher SC was obtained due to a lattice structure, which involved a significant increase in surface area (Figure 5).
Figure 6 schematically outlines the steps used to realise the lattice cells in Grasshopper using scripting. The first step determines the volume of an individual unit cell and, consequently, the maximum strut length. The second step defines the volume ratio, which splits the space between the nodes and the struts. In the third step, the spherical node radius is calculated, and in the fourth step, the strut length to join spheres is determined. Finally, in the fifth step, the script can automatically output a unit cell with suitable strut and node dimensions.
3.1.3. Shape Complexity Evaluation
Shape Complexity was evaluated using the index proposed by Slama et al. [18], which is a linear combination of the factors reported in Section 2.3 (Equation 7). This index emphasises the presence of lattice cells in the specimens, clearly differentiating Type 1 samples from Type 0 samples (Figure 9). For the calculation, data were extracted from STL CAD models through a Python script with the open-source library numpy-stl 3.2.0 [50]. Table 2 shows some data extracted from STL CAD models with numpy-stl 3.2.0. Table 3 reports the six factors and the final SCI index calculated from each specimen.
Figure 9 reports the trend for the SCI calculated for each specimen using Slama’s method [18]. The Type 1 specimens show an increased index due to the presence of lattice cells. The difference between Type 0 and Type 1 samples is evident. No-complexity samples seem to have an equal complexity index.
3.2. Materials
Three types of materials were used for the production of the defined specimens: two alloys of aluminium a polyamide, and a resin.
3.2.1. Al-Si-Mg
In the following sections, the term "Al-Si-Mg" specifically refers to the AlSi10Mg alloy, which is an aluminium casting alloy. AlSi10Mg is widely used in AM because it provides high corrosion resistance, low density, and moderate mechanical strength in the final components. The AlSi10Mg alloy has been supplied by the AM powder vendor EOS [51]. Table 4 presents the powder characterisation of the AlSi10Mg alloy used to manufacture Type 0 and Type 1 specimens.
3.2.2. Al-Cu
When Al-Cu is mentioned, it refers to the A205 alloy. A205 is a lightweight aluminium powder derived from the patented A20X™ alloy developed by AMT Ltd. The high cooling rates achieved during L-PBF produce a dense, crack-free, non-dendritic microstructure, resulting in excellent high-temperature performance and fatigue resistance. The A205 alloy has been provided by AM powder dealer Eckart [52]. Table 5 displays the powder characterisation of the A205 alloy used to manufacture Type 1 specimens.
3.2.3. PA12
The term “PA12” refers to Polyamide 12, a high-performance thermoplastic in the nylon family. It is valued for its combination of strength, flexibility, and chemical resistance. PA12 offers strong and durable mechanical properties while remaining flexible enough to withstand repeated stress. This polymeric material has been used to produce Type 1 specimens.
3.2.4. Resin
When Resin is mentioned, it refers to the Biocompatible Clear Photopolymer Resin. This resin is a transparent 3D printing material designed for safe contact with biological tissues. It cures under UV light and is widely used in medical and dental applications. This polymeric material has been used to produce Type 0 specimens.
3.2. Production of Metal Specimens
The metal samples were produced using a Dentas Arrow 3D laser metal printer LMP200 at the University of Maribor. Equation 14 describes the Energy Density factor (), also known as the Andrew number; it represents the amount of energy irradiated per unit area of the powder (). It is a key parameter that influences melting behaviour, part density, and surface quality.
Where is the laser power (), v is the scanning speed (), is the hatch spacing (). This combined parameter is often used to compare different printing setups, given that strongly influences the density, microstructure, mechanical properties, surface quality, and defects in metal parts. This parameter is used to compare combinations of process parameters. Table 6 lists the process parameters used in this study.
The scanning strategy used to produce the samples followed a checkerboard pattern, with the scanning direction rotated by 60° for each successive layer. The samples were fabricated using support bars at least 2 mm thick, with no supports included within the cellular structures. Figure 10 illustrates the print orientation used for the Type 1 Al-Si-Mg and Al-Cu specimens.
Upon completion of the fabrication process, the supports were removed by breaking them off the sample surfaces. Any partially melted or adhered powder particles were subsequently eliminated using sandblasting. Figure 11a shows the Al-Si-Mg and Al-Cu Type 1 specimens, while Figure 11b displays the Al-Si-Mg Type 0 specimens.
Maintaining the same process parameters, scanning strategy, orientations, and cleaning and preparation steps across all specimens reduces the variability in results caused by variations in influencing parameters.
3.2. Production of Polymer Specimens
In addition, the authors repeated the study using test samples made by Selective Laser Sintering in Polyamide (PA12) and by VAT Photopolymerization in Biocompatible Clear Photopolymer Resin to determine whether comparable results can be obtained in polymers. Type 0 resin specimens have been realised using the VAT Photopolymerization 3D printing process, with the ASIGA PRO 4K machine. Type 1 PA12 specimens have been produced with the L-PBF process for polymers, with a layer thickness of 0.075 mm.
4. Results and Discussion
4.1. Tensile Strength of the Samples
A tensile test evaluates the mechanical performance of a material by measuring its response to an increasing uniaxial load until fracture. During testing, force and elongation are continuously recorded to produce a stress–strain curve, from which Young’s modulus, Yield Stress (YS), Ultimate Tensile Stress (UTS), percentage Elongation (E%), ductility, and toughness are obtained.
4.1.1. Al-Si-Mg and Al-Cu Tensile Test
The tensile strength tests on metal specimens were conducted using a Lloyds LR50K Universal Materials Testing Machine. The tests were performed at room temperature at a strain rate of 10 mm/min.
All tensile tests were conducted on as-fabricated specimens, without any post-processing except for the removal of excess metal powders. Figure 12 and Figure 13, together with Table 7, summarise the tensile test results for the Type 0 – Al-Si-Mg specimens. Figure 12 shows Stress-Strain diagrams across the test repetitions, Table 7 reports the mean values, and Figure 13 shows the corresponding histograms. The 0_No specimens exhibit more stable behaviour (orange lines) with respect to 0_Low (green lines) and 0_High (light blue lines).
Figure 14 and Figure 15, along with Table 8, present the data from the tensile tests conducted on Type 1 – Al-Si-Mg specimens. The elongation value for 1_Low (the first repetition) was excluded from the mean calculation because it is significantly higher than the others, exceeding fifty instead of about ten in the other experiments.
Figure 16 and Figure 17, along with Table 9, present data from tensile tests on Type 1 – Al-Cu specimens.
Type 0 – Al-Si-Mg No-complexity specimen presents similar UTS, YS, and E% compared to literature tensile test results. For example, in [38], the authors produced Al-Si-Mg samples, compliant with the standard ASTM E8, with a UTS value between 270 and 370 MPa, dependent on building direction, a YS value between 210 and 230 MPa, and an E% between 2% and 5%.
Type 1 – Al -Si-Mg and Al-Cu No-complexity specimens, as shown in Figure 15 and Figure 16, present non-classical trends, with very low YS values and high E%. The Al-Si-Mg UTS value is aligned with the values in the literature. The Al-Cu UTS with respect to the 360 MPa proposed in [53] is 18% lower, and 26% lower than the 402 MPa presented in [54].
4.1.2. Resin and PA12 Tensile Strengths
Tensile tests on samples made from resin and PA12 were conducted using a Galdabini Quasar 5 machine manufactured by GALDABINI, Italy. The tests were performed at room temperature at a strain rate of 1 mm/min. Figure 18 and Figure 19 present, respectively Type 0 Resin (0_Low) tested specimens and results, and Type 1 PA12 (1_Low) tested specimens and results.
4.2. Analysis of Porosity
One of the key issues with the L-PBF process for metals is the presence of internal porosity in the resulting parts. The causes of porosity can be correlated with combinations of process parameters, impurities in powders and gas, and surface oxidation or contamination. Some emerging problems include lack of fusion, keyhole, gas entrapment, and balling. Quantifying porosity, expressed as a percentage of the analysed surface area, is essential for assessing the overall quality of metal AM components.
Optical microscope Side-On and Top-Down analyses have been conducted on Type 1 specimens; in the following subsections, parts of the figures and data of these analyses are reported.
4.2.1. Al-Si-Mg Specimen Porosity
Figure 20 reports the images and data from the Optical microscope analyses of the Type 1 Al-Si-Mg specimens.
4.2.2. Al-Cu Specimen Porosity
Figure 21 reports the images and data analyses of the Type 1 Al-Cu specimens.
Table 10 reports the mean values of measured internal porosity, taking the average of Side-On and Top-Down measurements for each specimen.
4.3. Mechanical Behaviour and Shape Complexity
This section analyses and discusses the analysis previously presented. The first part presents mechanical performance trends as a function of the SC, introducing a mechanical performance index to merge the mechanical results into a single metric, and evaluates the trends of this index with respect to SC. The second part introduces the measured internal porosity in the study and analyses how this parameter affects indices.
Figure 22 plots the trends in UTS, YS, and E% for Type 0 - Al-Si-Mg and Resin specimens; these samples have the same cross-section despite increasing SC. Porosity measurements have not been conducted for these specimens.
For Al-Si-Mg, mechanical properties remain similar from the No-Complexity (0_No) specimen to the Low-complexity (0_Low) specimen but rapidly decrease for High-complexity (0_High), arriving at a loss of 57% for UTS and 66% for E%. The YS presents the same trend, but the High-complexity loss is lower, about 38%. These values are reported in Section 3.1.1 (Table 6). As complexity increases, evaluated mechanical performance (UTS, YS, and E%) decreases, and the Al-Si-Mg material overall appears to become more brittle. The difference between UTS and YS values decreases, and the strain percentage also diminishes. Despite the SC increment not being particularly elevated (in the absence of lattice and complex surfaces), the loss in mechanical behaviour is significant.
For Resin, the 0_Low specimen exhibits a significant decrease in the UTS, whereas the E% remains almost equal to that of the No-complexity specimen. At 0_High, there is a further decrease in UTS and a 16% reduction in E%. These values are reported in Section 3.1.2 (Figure 19b).
Figure 23 shows the UTS, YS, and E% trends and the relative normalised trends with respect to the CAD cross-section (Type 1 -PA12) and real cross-sections (Type 1 – Al-Si-Mg and Al-Cu), obtained from the mean measured porosity for Type 1 - Al-Si-Mg, Al-Cu, and from the CAD for PA12 specimens. For the Type 1 lattice specimens, the UTS and YS trends exhibit the same behaviour: a rapid decrease from the No-complexity (1_No) to the Low-complexity (1_Low) and a slight increase for Mid-Complexity(1_Mid) and again for High-Complexity (1_High). Only the Al-Si-Mg YS shows a decrease in Mid-complexity compared to Low-complexity. The E% behaviour differs markedly for each material as complexity increases. The Al-Si-Mg E% decreases for Low and Mid-Complexity and increases slightly for High-Complexity. The Al-Cu E% decreases with increasing SC, and the PA12 presents a sinusoidal trend with a growing value for Low-Complexity, a low value for Mid-Complexity and a slight increase for High-Complexity.
To better understand how geometries affect mechanical performance, normalised trends have been included. This involves dividing each value by its cross-sectional measurements. This approach allows evaluation of the effect of each mm² of material as SC increases. For the Al-Si-Mg and Al-Cu Type 1 specimens, CAD and real-porosity normalised values are quite similar due to low numerical differences between these values; only the real ones are reported. Normalised UTS curves present quite similar patterns, a decrease for Low-complexity and a slight increase for Mid and High-Complexity. Similar trends are visible for Al-Cu and PA12 YS; the Al-Si-Mg YS shows a relevant increase for Low-Complexity, even compared to No-Complexity. E% trends exhibit a starting increase for Low-Complexity, a decreasing trend for Mid-Complexity, and again increasing for High-Complexity. Normalised values are reported in Table 22.
To establish a unique correlation between material performance and SC, a Mechanical Performance Index (MPI) has been developed. The driving idea is to find a criterion for aggregating material information obtained from mechanical tests into a single index and to refer increasing-SC specimens to the No-Complexity ones. Within the elastic domain, the YS can be estimated from the Young’s Modulus by assuming a limiting strain of 0,002, corresponding to the conventional 0,2% offset yield criterion. Equation 15 defines the MPI index, where , , and  are, respectively, the ultimate tensile stress, the yield stress, and the elongation % of the i-th specimen. The subscript refers to the no-complexity specimens, used as benchmarks for every single material and specimen type.
Where , , and are constant normalising indices, calculated through the Fuzzy Analytical Hierarchy Process (FAHP), so that the MPI index for the benchmark materials (no-complexity) is always unitary. For the resin, with a brittle behaviour (does not present YS), the recalculated weights are 0,43, , and .
Table 11 reports the MPI values for Type 0 specimens. The increasing SC effect on the Rod-Specimens (Type 0) is shown in Figure 24. The No-Complexity specimens present an MPI of unit value, as the MPI has been constructed, and the MPI decreases with increasing SC. The curves of ductile and brittle materials (Resin) show different behaviour: concave for ductile materials and quasi-linear for brittle materials, presenting more severe losses at increasing SC for ductile materials.
Table 12 reports the value of MPI for Lattice specimens (Type 1). Figure 25 shows the MPI trends as a function of the index.
Type 1 – Al-Si-Mg and PA12 specimens present similar MPI trends as a function of SCI. Starting from the No-Complexity level, the plots show a rapid decrease up to the Low-Complexity level, with a loss of about 60%. At the Mid-Complexity level, they present a further decrease (more pronounced for PA12) and significantly increase at the High-Complexity level, reaching about 53% for Al-Si-Mg and 25% for PA12 of material performance with respect to No-Complexity specimens. The Al-Cu trend shows a 75% loss at the Low-Complexity level and an increase to about 30% relative to No-Complexity specimens at the Mid and High-Complexity levels. These trends suggest that if designers want or need to introduce complexity into their designs, it is better to use a high complexity level rather than a low or mid one.
For tensile testing, a rod sample is ideal for determining mechanical properties. At the same time, a complex geometry is tested to study how a specific component behaves under load, simulating real-world operating conditions.
Figure 26 summarises the previously presented MPI trends by SCI and highlights the SC level for each specimen type analysed. The graph clearly shows how complexity affects different materials and geometries differently. The effect of complexity on mechanical properties is highly nonlinear. While the variation in complexity of Type 0 specimens is significantly smaller than that of Type 1 specimens, the Type 0 ones exhibit a greater loss in MPI values at the same SC levels. This behaviour may be related to geometries.
Type 0 geometry under tensile test is subjected only to traction behaviour, being made of rods only. On the contrary, Type 1 geometry (designed lattice) undergoes a complex combination of stresses, having a complex geometry.
4.3.1. Internal Porosity and Shape Complexity
Internal porosity can significantly reduce mechanical performance by creating weak points inside a material. Pores act as stress concentrators, lowering strength, stiffness, and fatigue life. They can also promote crack initiation and growth, leading to earlier failure under load. The larger or more numerous the pores, the more severe the reduction in mechanical properties.
Table 13 reports the mean internal porosity values for Type 1 metal specimens, including the real cross-sectional areas obtained by subtracting the porosity percentage from the CAD cross-sections. Despite the low precision in realising exact geometries for Mid- and High-Complexity specimens (as shown in Figure 21c), the internal porosity, which plays a crucial role in assessing part quality, shows significantly lower values. The lattice geometries help reduce the high thermal gradients between layers, improving internal porosity.
Figure 27 illustrates the percentage of internal porosity for Type 1 – Al-Si-Mg and Al-Cu as a function of the SC. The Al-Si-Mg curve benefits more than the Al-Cu curve, starting from a higher value of internal porosity and reaching approximately the same values for Low, Mid, and High-Complexity. Analysing this graph, the increment of SC helps in reducing the internal porosity, diminishing part thicknesses, and helping dissipate high thermal gradients that arise in the bulk parts.
To correlate the previously discussed results with the measured internal porosity and understand the effect of this material quality property, Equation 10 has been formalised. This new MPI, called , normalises Equation 16 to correlate tensile results with the real cross-section. The wants to measure how each cross-section mm² contributes to the mechanical performance. Table 14 reports the normalised UTS, YS, E%, and .
Figure 28 shows the trends as a function of the Index. While the Al-Cu curve presents an expected behaviour, with a reduction in performance of circa 20% at Low-Complexity, circa 32% at Mid-Complexity, and 30% at High-Complexity compared to the No-Complexity specimen, the Al-Si-Mg curve presents a complex behaviour. Despite UTS, YS, and E% values (reported in Table 20) being significantly lower than the No-Complexity specimens, when mechanical properties are normalised with respect to the real cross-sections (reported in Table 22), they reveal oscillating results. For Low-Complexity and High-Complexity , the results are 125% and 120%, respectively, compared to No-Complexity results, presenting values higher than the No-Complexity samples. for Mid-Complexity is 77% of the No-Complexity one. These oscillating results suggest that further investigation is necessary.
5. Conclusions
The overall aim of this paper is to establish a correlation between mechanical performance and shape complexity in Additively Manufactured High-Strength Aluminium samples, extending the approach to polyamide and resin ones. The authors designed and produced samples with Al-Si-Mg and Al-Cu at various levels of shape complexity and analysed tensile strength and internal porosity. To strengthen the concept of the influence of shape complexity on mechanical performance, polymer (PA12) and resin specimens have also been realised and tested. Two classes of specimens with increasing shape complexity have been designed: Type 0 with rod structures and Type 1 with lattice structures. The Shape Complexity Index was evaluated using the method proposed by Slama et al. [18]. To identify a correlation between shape complexity and mechanical performance, a performance index, MPI, has been developed to group tensile test results based on UTS, YS, and E%. This index aims to compare specimens with increasing shape complexity to specimens with no complexity. The index has also been normalised with respect to the real specimens' cross-section, obtained from internal porosity measurements, only for metal Type 1 samples, to study the material strength correlated with shape complexity, per mm² of real cross-section. In addition, to understand whether the relationship between shape complexity and mechanical performance can be generalised beyond Al-Si-Mg and Al-Cu alloys, the study has been extended to polymer specimens. Type 0 - Resin specimens, produced using the VAT Photopolymerization process, to study brittle materials and Type 1 - PA12 (Polyamide) realised in L-PBF for polymers, to understand if comparable results to ductile polymers like Al alloys could be found.
The results of this work suggest that there might be a direct correlation between L-PBF part quality, measured using the resulting mechanical performance, and its shape complexity. Independently from the Al-alloy, our results suggest that components with no complexity present a higher percentage of internal porosity. Despite the samples with shape complexities showing lower internal porosity, different to our initial assumptions, the same samples proved lower tensile strength. This seems to suggest that shape complexity significantly reduces the tensile strength at parity of the volume of material, and independently of the alloy. This might confirm that localised stress concentrations have a key role in affecting the mechanical performance of parts. These results imply that design engineers should carefully consider when and how to increase complexity since this might reduce the theoretical performance of materials.
The Al-Si-Mg and Al-Cu lattice specimens present a loss in mechanical performance at low and mid complexity but a gain for high complexity. The Al-Cu lattice specimens appear to suffer more than Al-Si-Mg specimens at high complexity, presenting a higher reduction in mechanical performance. Regardless of the complexity of the shape, Al-Cu appears to offer slightly lower tensile strength compared to Al-Si-Mg. This result is quite remarkable given the significant difference in theoretical tensile strength. This might confirm the importance of defects (surface roughness, voids) and shape (complexity, design of the lattice) over intrinsic material properties in defining the mechanical properties of parts, together with a possible general improvement of the parts produced with an optimisation of the process parameters.
Moreover, this work aims to increase the sustainability of HS-Al components produced via the L-PBF process, providing a sustainable alternative to composite materials for advanced lightweight applications. Since the rationale for L-PBF Al components is the exploitation of shape complexity (e.g. lightweight components), future research will need to investigate how to improve the gap between real and theoretical mechanical properties.
Author Contributions
Conceptualization, P.P., J.W., and I.D.; methodology, M.T., S.D., P.P. and P.C.; validation, M.T., S.D., P.P. and P.C.; formal analysis, M.T., S.D., and P.P.; investigation, P.P., I.D., S.P., P.C. and M.T.; resources, S.P., I.D., P.P. and J.W.; data curation, M.T., I.D. and S.P.; writing—original draft preparation, M.T., S.P. and P.P.; writing—review and editing, P.C., P.P. and M.T.; visualization, P.P., M.T., I.D., P.C. and J.W; supervision, P.P. and J.W.; project administration, P.P. and J.W.; funding acquisition, P.P. and J.W. All authors have read and agreed to the published version of the manuscript.
Funding
This work was supported by the Royal Society [grant number IES\R3\213014] and the Loughborough Material Characterisation Centre Pump Prime program.
Conflicts of Interest
The authors declare no conflicts of interest.
Abbreviations
The following abbreviations are used in this manuscript:
| AM | Additive Manufacturing |
| DfAM | Design for Additive Manufacturing |
| DMLS | Direct Metal Laser Sintering |
| E% | Elongation % |
| FAHP | Fuzzy Analytically Hierarchical Process |
| FFF | Fused Filament Fabrication |
| HS-Al | High Strength Aluminium |
| L-PBF | Laser-Powder Bed Fusion |
| MPI | Mechanical Performance Index |
| SC | Shape Complexity |
| SCI | Shape Complexity Index |
| SLA | Stereolithography |
| SLM | Selective Laser Melting |
| TPMS | Triply Periodic Minimal Surfaces |
| UTS | Ultimate Tensile Stress |
| YS | Yield Stress |
References
- ISO/ASTM 52900:2021; Additive Manufacturing—General Principles—Fundamentals and Vocabulary. ISO/ASTM International: Geneva, Switzerland, 2021.
- Alogla, A.A.; Baumers, M.; Tuck, C.; Elmadih, W. The impact of additive manufacturing on the flexibility of a manufacturing supply chain. Appl. Sci. 2021, 11, 3707. [Google Scholar] [CrossRef]
- Askari, M.; Hutchins, D.A.; Thomas, P.J.; Astolfi, L.; Watson, R.L.; Abdi, M.; Ricci, M.; Laureti, S.; Nie, L.; Freear, S.; Wildman, R.; Tuck, C.; Clarke, M.; Woods, E.; Clare, A.T. Additive manufacturing of metamaterials: A review. Addit. Manuf. 2020, 36, 101562. [Google Scholar] [CrossRef]
- Zhu, L.; Li, N.; Childs, P.R.N. Light-weighting in aerospace component and system design. Propuls. Power Res. 2018, 7, 103–119. [Google Scholar] [CrossRef]
- Jin, H.; Espinosa, H.D. Mechanical metamaterials fabricated from self-assembly: A perspective. J. Appl. Mech. 2023, 91. [Google Scholar] [CrossRef]
- Trovato, M.; Belluomo, L.; Bici, M.; Prist, M.; Campana, F.; Cicconi, P. Machine learning in design for additive manufacturing: A state-of-the-art discussion for a support tool in product design lifecycle. Int. J. Adv. Manuf. Technol. 2025, 137, 2157–2180. [Google Scholar] [CrossRef]
- Alsalla, H.; Hao, L.; Smith, C. Fracture toughness and tensile strength of 316L stainless steel cellular lattice structures manufactured using the selective laser melting technique. Mater. Sci. Eng. A 2016, 669, 1–6. [Google Scholar] [CrossRef]
- Adam, G.A.O.; Zimmer, D. On design for additive manufacturing: Evaluating geometrical limitations. Rapid Prototyp. J. 2015, 21, 662–670. [Google Scholar] [CrossRef]
- Gan, M.X.; Wong, C.H. Practical support structures for selective laser melting. J. Mater. Process. Technol. 2016, 238, 474–484. [Google Scholar] [CrossRef]
- Gao, B.; Zhao, H.; Peng, L.; Sun, Z. A review of research progress in selective laser melting (L-PBF). Micromachines 2023, 14, 57. [Google Scholar] [CrossRef]
- Trevisan, F.; Calignano, F.; Lorusso, M.; Pakkanen, J.; Aversa, A.; Ambrosio, E.P.; Lombardi, M.; Fino, P.; Manfredi, D. On the selective laser melting (L-PBF) of the AlSi10Mg alloy: Process, microstructure, and mechanical properties. Materials 2017, 10, 76. [Google Scholar] [CrossRef]
- Brajlih, T.; Valentan, B.; Balic, J.; Drstvensek, I. Speed and accuracy evaluation of additive manufacturing machines. Rapid Prototyp. J. 2011, 17, 64–75. [Google Scholar] [CrossRef]
- Valentan, B.; Brajlih, T.; Drstvenšek, I.; Balič, J. Development of a part-complexity evaluation model for application in additive fabrication technologies. Stroj. Vestn. J. Mech. Eng. 2011, 57, 709–718. [Google Scholar] [CrossRef]
- Pradel, P.; Bibb, R.; Zhu, Z.; Moultrie, J. Complexity is not for free: The impact of component complexity on additive manufacturing build time. In Proceedings of the Rapid Design, Prototyping & Manufacturing Conference (RDPM2017), Loughborough, UK, 27–28 April 2017. [Google Scholar]
- Greco, A.; Manco, P.; Russo, M.B.; Gerbino, S. Complexity-driven product design: Part 1—Methodological framework and geometrical complexity index. Int. J. Interact. Des. Manuf. 2023, 18, 5441–5456. [Google Scholar] [CrossRef]
- Ali, M.A.; Fidan, I. Investigation of the impact of power consumption, surface roughness, and part complexity in stereolithography and fused filament fabrication. Preprint 2023. [Google Scholar] [CrossRef]
- Matoc, D.A.; Maheta, N.; Kanabar, B.; Sata, A. Hybrid framework for assessing additive manufacturing complexity index: Integration of analytical hierarchy process and machine learning for VAT photopolymerization. Prog. Addit. Manuf. 2025, in press. [Google Scholar] [CrossRef]
- Ben Slama, M.; Chatti, S.; Louhichi, B. Novel method for shape complexity evaluation: A threshold from machining to additive manufacturing in the early design phase. Res. Eng. Des. 2024, 35, 191–214. [Google Scholar] [CrossRef]
- Leary, M.; Mazur, M.; Williams, H.; Yang, E.; Alghamdi, A.; Lozanovski, B.; Zhang, X.; Shidid, D.; Farahbod-Sternahl, L.; Witt, G.; Kelbassa, I.; Choong, P.; Qian, M.; Brandt, M. Inconel 625 lattice structures manufactured by selective laser melting (L-PBF): Mechanical properties, deformation and failure modes. Mater. Des. 2018, 157, 179–199. [Google Scholar] [CrossRef]
- Maconachie, T.; Leary, M.; Lozanovski, B.; Zhang, X.; Qian, M.; Faruque, O.; Brandt, M. L-PBF lattice structures: Properties, performance, applications and challenges. Mater. Des. 2019, 183, 108137. [Google Scholar] [CrossRef]
- Alomar, Z.; Concli, F. A review of the selective laser melting lattice structures and their numerical models. Adv. Eng. Mater. 2020, 22. [Google Scholar] [CrossRef]
- Carrozza, A.; Bircher, B.A.; Aversa, A.; Biamino, S. Investigating complex geometrical features in LPBF-produced parts: A material-based comparison between different titanium alloys. Met. Mater. Int. 2023, 29, 3697–3714. [Google Scholar] [CrossRef]
- Bushra, J.; Budinoff, H.D.; Luna Falcon, P.; Latypov, M. Enhancing design guidelines for metal powder bed fusion: Analyzing geometric features to improve part quality. In Proceedings of the 28th Design for Manufacturing and the Life Cycle Conference (DFMLC), Boston, MA, USA, 2023. [Google Scholar]
- Deep, A.; Miri Beidokhti, M.; Piili, H. Preliminary manufacturability evaluation of complex geometrical parts based on layer thickness in the metal powder bed fusion process. Prog. Addit. Manuf. 2025, 10, 8941–8961. [Google Scholar] [CrossRef]
- Al-Alimi, S.; Yusuf, N.K.; Ghaleb, A.M.; Lajis, M.A.; Shamsudin, S.; Zhou, W.; Altharan, Y.M.; Abdulwahab, H.S.; Saif, Y.; Didane, D.H.; S T T, I.; Adam, A. Recycling aluminium for sustainable development: A review of different processing technologies in green manufacturing. Results Eng. 2024, 23, 102566. [Google Scholar] [CrossRef]
- Sverdrup, H.U.; Ragnarsdottir, K.V.; Koca, D. Aluminium for the future: Modelling the global production, market supply, demand, price and long term development of the global reserves. Resour. Conserv. Recycl. 2015, 103, 139–154. [Google Scholar] [CrossRef]
- Kotadia, H.R.; Gibbons, G.; Das, A.; Howes, P.D. A review of laser powder bed fusion additive manufacturing of aluminium alloys: Microstructure and properties. Addit. Manuf. 2021, 46, 102155. [Google Scholar] [CrossRef]
- Kenevisi, M.S.; Yu, Y.; Lin, F. A review on additive manufacturing of Al–Cu (2xxx) aluminium alloys, processes and defects. Mater. Sci. Technol. 2021, 37, 805–829. [Google Scholar] [CrossRef]
- Kan, W.H.; Chiu, L.N.S.; Lim, C.V.S.; Zhu, Y.; Tian, Y.; Jiang, D.; Huang, A. A critical review on the effects of process-induced porosity on the mechanical properties of alloys fabricated by laser powder bed fusion. J. Mater. Sci. 2022, 57, 9818–9865. [Google Scholar] [CrossRef]
- Koutiri, I.; Pessard, E.; Peyre, P.; Amlou, O.; De Terris, T. Influence of SLM process parameters on the surface finish, porosity rate and fatigue behavior of as-built Inconel 625 parts. J. Mater. Process. Technol. 2018, 255, 536–546. [Google Scholar] [CrossRef]
- Park, T.-H.; Baek, M.-S.; Hyer, H.; Sohn, Y.; Lee, K.-A. Effect of direct aging on the microstructure and tensile properties of AlSi10Mg alloy manufactured by selective laser melting process. Mater. Charact. 2021, 176, 111113. [Google Scholar] [CrossRef]
- Shakil, S.I.; Hadadzadeh, A.; Shalchi Amirkhiz, B.; Pirgazi, H.; Mohammadi, M.; Haghshenas, M. Additive manufactured versus cast AlSi10Mg alloy: Microstructure and micromechanics. Results Mater. 2021, 10, 100178. [Google Scholar] [CrossRef]
- Li, Z.; Kuai, Z.; Bai, P.; Nie, Y.; Fu, G.; Liu, W.; Yang, S. Microstructure and tensile properties of AlSi10Mg alloy manufactured by multi-laser beam selective laser melting (SLM). Metals 2019, 9, 1337. [Google Scholar] [CrossRef]
- Wei, P.; Wei, Z.; Chen, Z.; Du, J.; He, Y.; Li, J.; Zhou, Y. The AlSi10Mg samples produced by selective laser melting: Single track, densification, microstructure and mechanical behavior. Appl. Surf. Sci. 2017, 408, 38–50. [Google Scholar] [CrossRef]
- Park, T.-H.; Baek, M.-S.; Hyer, H.; Sohn, Y.; Lee, K.-A. Effect of direct aging on the microstructure and tensile properties of AlSi10Mg alloy manufactured by selective laser melting process. Mater. Charact. 2021, 176, 111113. [Google Scholar] [CrossRef]
- Kempen, K.; Thijs, L.; Van Humbeeck, J.; Kruth, J.-P. Mechanical properties of AlSi10Mg produced by selective laser melting. Phys. Procedia 2012, 39, 439–446. [Google Scholar] [CrossRef]
- Uzan, N.E.; Shneck, R.; Yeheskel, O.; Frage, N. High-temperature mechanical properties of AlSi10Mg specimens fabricated by additive manufacturing using selective laser melting technologies (AM-SLM). Addit. Manuf. 2018, 24, 257–263. [Google Scholar] [CrossRef]
- Tradowsky, U.; White, J.; Ward, R.M.; Read, N.; Reimers, W.; Attallah, M.M. Selective laser melting of AlSi10Mg: Influence of post-processing on the microstructural and tensile properties development. Mater. Des. 2016, 105, 212–222. [Google Scholar] [CrossRef]
- Cui, L.; Liu, K.; Chen, X.-G. Recent advances in cost-effective aluminum alloys with enhanced mechanical performance for high-temperature applications: A review. Mater. Des. 2025, 253, 113869. [Google Scholar] [CrossRef]
- Li, S.-S.; Yue, X.; Li, Q.-Y.; Peng, H.-L.; Dong, B.-X.; Liu, T.-S.; Yang, H.-Y.; Fan, J.; Shu, S.-L.; Qiu, F.; Jiang, Q.-C. Development and applications of aluminum alloys for aerospace industry. J. Mater. Res. Technol. 2023, 27, 944–983. [Google Scholar] [CrossRef]
- Zhang, J.; Gao, J.; Song, B.; Zhang, L.; Han, C.; Cai, C.; Zhou, K.; Shi, Y. A novel crack-free Ti-modified Al-Cu-Mg alloy designed for selective laser melting. Addit. Manuf. 2021, 38, 101829. [Google Scholar] [CrossRef]
- Yin, J.; Zhang, W.; Ke, L.; Wei, H.; Wang, D.; Yang, L.; Zhu, H.; Dong, P.; Wang, G.; Zeng, X. Vaporization of alloying elements and explosion behavior during laser powder bed fusion of Cu–10Zn alloy. Int. J. Mach. Tools Manuf. 2021, 161, 103686. [Google Scholar] [CrossRef]
- Huang, B.; Tang, H.; Huang, J.; Jia, Y.; Liao, L.; Pang, S.; Zheng, X.; Chen, Z. Influence of laser-based powder bed fusion of metals process parameters on the formation of defects in Al-Zn-Mg-Cu alloy using path analysis. Micromachines 2024, 15, 1121. [Google Scholar] [CrossRef]
- Ashby, M.F. Materials Selection in Mechanical Design, 4th ed.; Butterworth–Heinemann: Oxford, UK, 2011. [Google Scholar]
- Rao, R.V. A material selection model using graph theory and matrix approach. Mater. Sci. Eng. A 2006, 431, 248–255. [Google Scholar] [CrossRef]
- Chatterjee, P.; Athawale, V.M.; Chakraborty, S. Selection of materials using compromise ranking and outranking methods. Mater. Des. 2009, 30, 4043–4053. [Google Scholar] [CrossRef]
- Giorgetti, A.; Rolli, F.; La Battaglia, V.; Marini, S.; Arcidiacono, G. Axiomatic design using multi-criteria decision making for material selection in mechanical design: Application in different scenarios. In Proceedings of the 15th International Conference on Axiomatic Design 2023 (ICAD 2023); Puik, E., Cochran, D.S., Foley, J.T., Foith-Förster, P., Eds.; Springer: Cham, Switzerland; Lecture Notes in Networks and Systems, 2024; Vol. 849, pp. 109–121. [Google Scholar]
- Jahan, A.; Mustapha, F.; Ismail, M.Y.; Sapuan, S.M.; Bahraminasab, M. A comprehensive VIKOR method for material selection. Mater. Des. 2011, 32, 1215–1221. [Google Scholar] [CrossRef]
- Anojkumar, L.; Ilangkumaran, M.; Sasirekha, V. Comparative analysis of MCDM methods for pipe material selection in sugar industry. Expert Syst. Appl. 2014, 41, 2964–2980. [Google Scholar] [CrossRef]
- van der Walt, S. numpy-stl (Version 3.2.0) [Python package]. Python Package Index. Available online: https://pypi.org/project/numpy-stl/ (accessed on 24 October 2025).
- EOS GmbH – Electro Optical Systems. EOS Aluminium AlSi10Mg Material Data Sheet. Available online: https://www.eos.info/metal-solutions/metal-materials/data-sheets/mds-eos-aluminium-alsi10mg (accessed on 17 December 2025).
- Eckart. Additive Manufacturing Metal Powders. Available online: https://www.eckart.net/en/lp-additive-manufacturing-metal-powders (accessed on 9 January 2025).
- Zhang, S.; Zhang, S.; Li, F.; Li, Z.; Wang, Y.; Liu, B. Selective laser melting of Al-Cu-Mn-Mg alloys: Processing and mechanical properties. Metals 2023, 13, 1520. [Google Scholar] [CrossRef]
- Zhang, H.; Zhu, H.; Qi, T.; Hu, Z.; Zeng, X. Selective laser melting of high strength Al-Cu-Mg alloys: Processing, microstructure and mechanical properties. Mater. Sci. Eng. A 2016, 656, 47–54. [Google Scholar] [CrossRef]
Figure 1.
Examples of Strut-based Lattice Structures (a-e) and TPMS Lattice Structures (f-h).
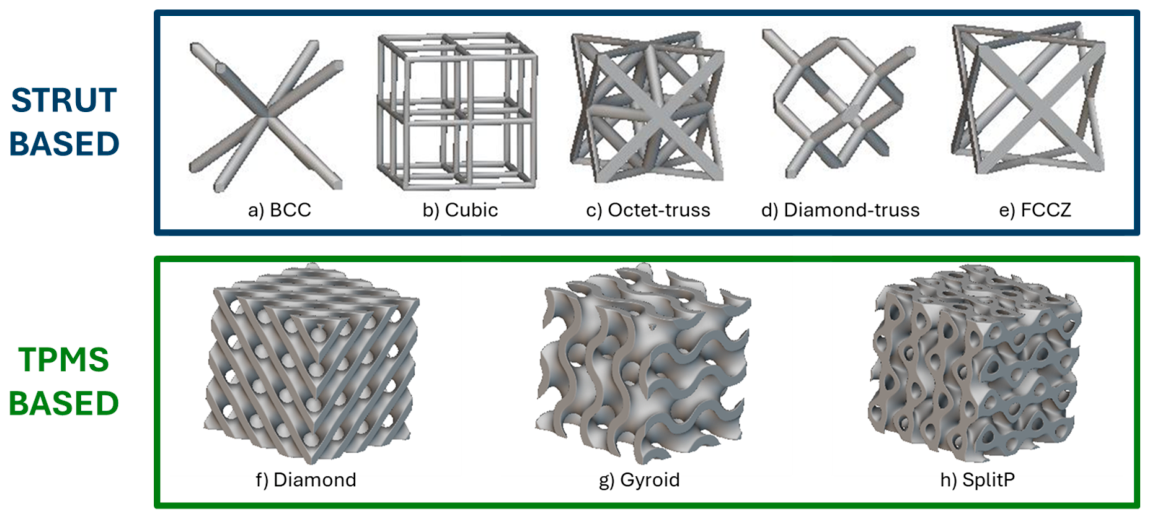
Figure 2.
Experimental approach workflow.
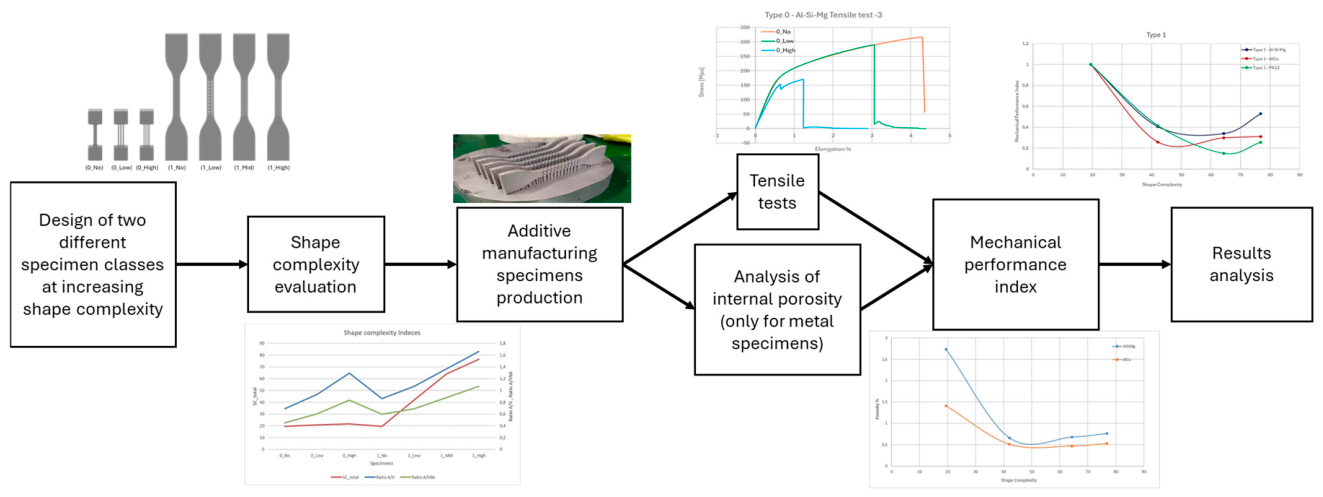
Figure 3.
No-complexity specimens with dimensions in mm: (a) Type 0 specimen has a 6 mm thickness; (b) Type 1 specimen has a 3 mm thickness. Type 0 and Type 1 are used to generate two families of specimens.
Figure 3.
No-complexity specimens with dimensions in mm: (a) Type 0 specimen has a 6 mm thickness; (b) Type 1 specimen has a 3 mm thickness. Type 0 and Type 1 are used to generate two families of specimens.
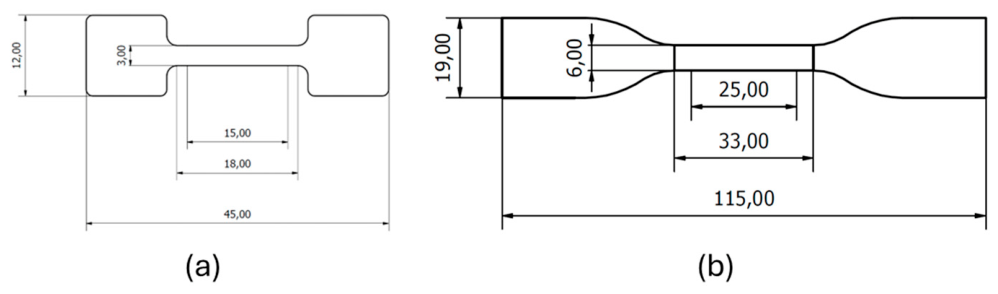
Figure 4.
Nomenclature used for the 3D-printed specimens with increasing complexity.
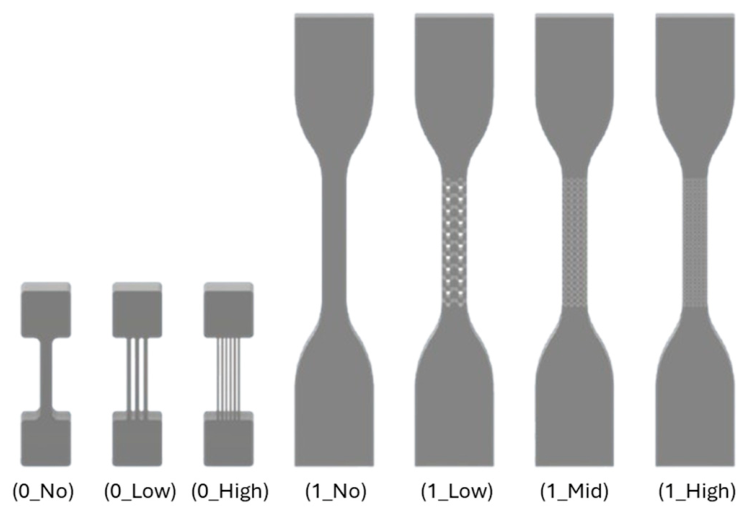
Figure 5.
Increasing complexity scheme for the Type 1 specimens, considering the criteria of constant volume and cross-section.
Figure 5.
Increasing complexity scheme for the Type 1 specimens, considering the criteria of constant volume and cross-section.
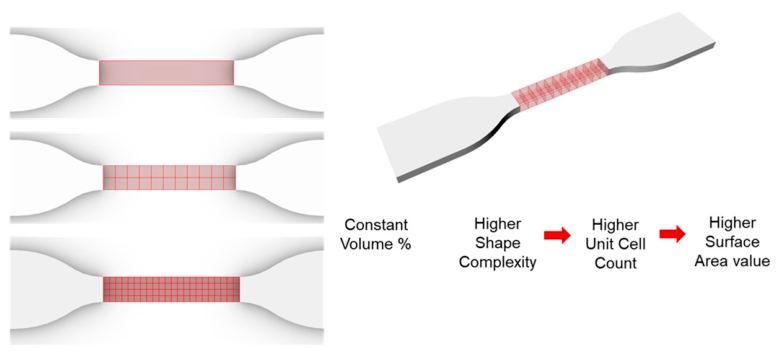
Figure 6.
The workflow used in Grasshopper to generate lattice geometry from the script.
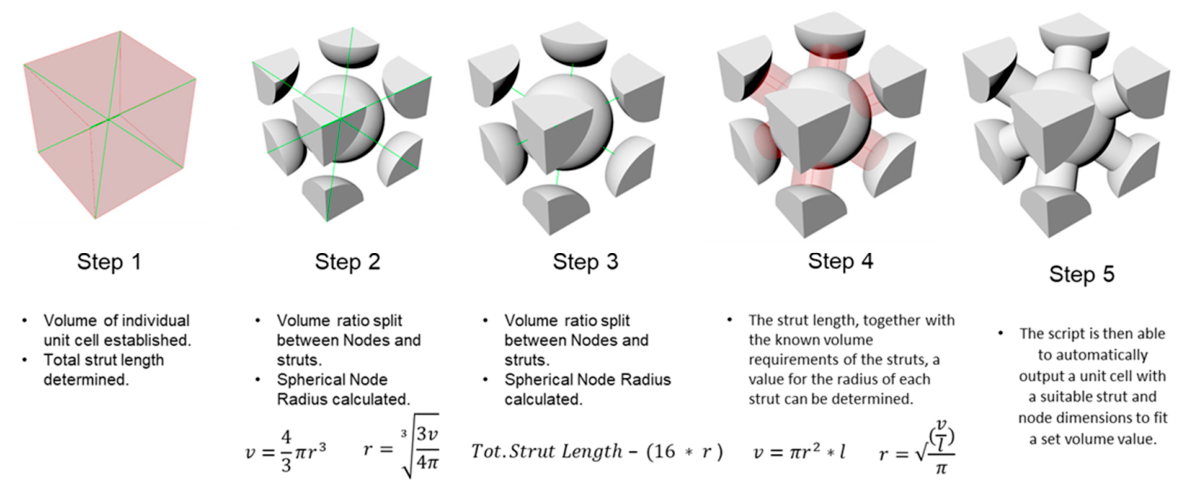
Figure 7.
Lattice geometries obtained with the Grasshopper script.
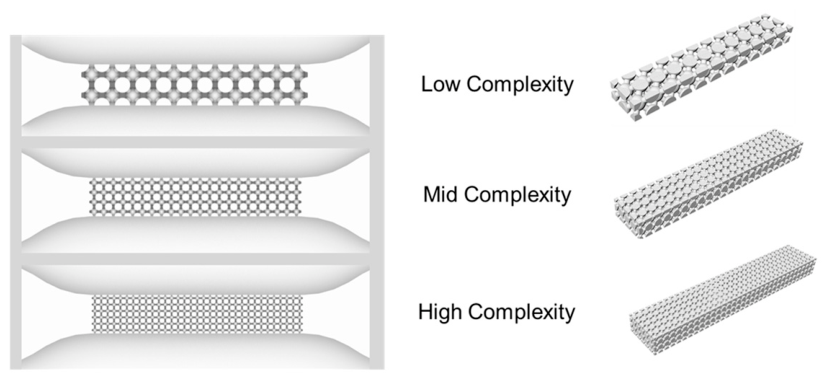
Figure 8.
Two different cross-sections for Type 1 specimens.
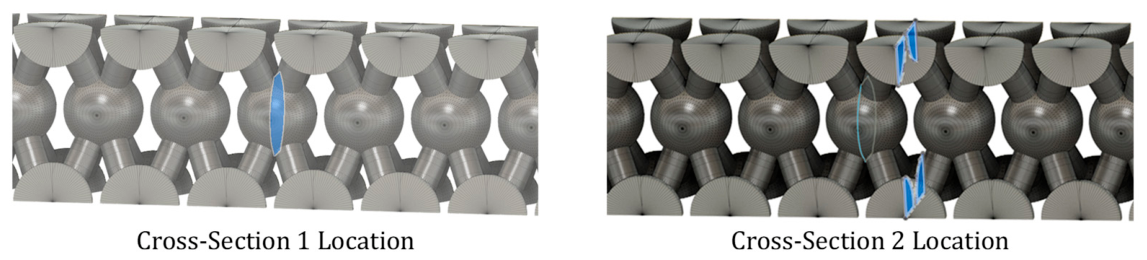
Figure 9.
Shape Complexity Index for each specimen evaluated by Slama’s method [18].
Figure 9.
Shape Complexity Index for each specimen evaluated by Slama’s method [18].
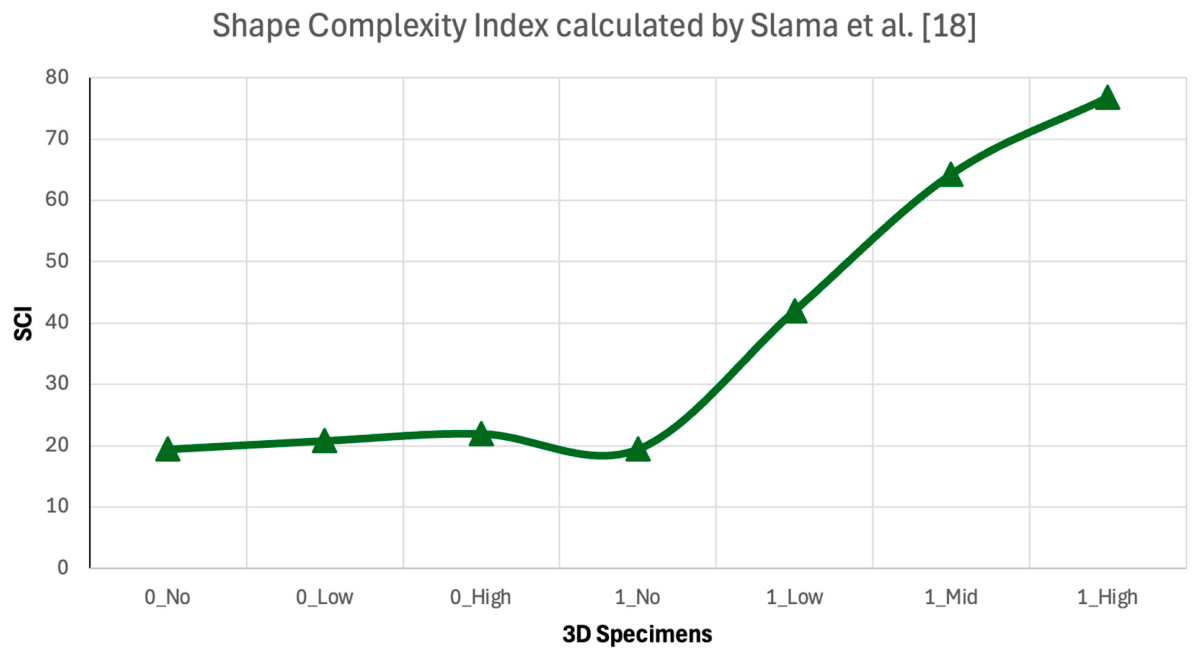
Figure 10.
Print orientation for Al-Si-Mg and Al-Cu specimens.
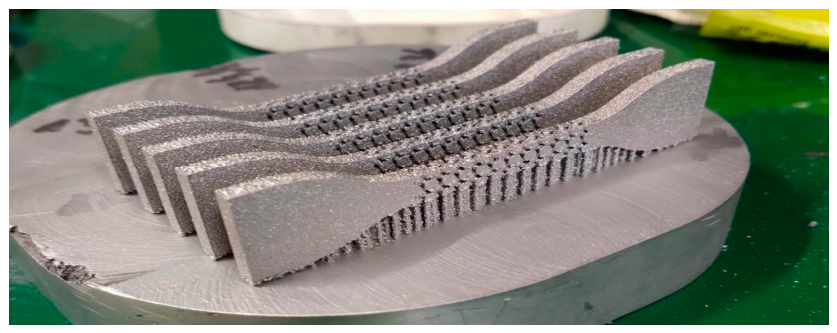
Figure 11.
(a) Al-Si-Mg and Al-Cu Type 1 manufactured specimens; (b) Al-Si-Mg Type 0 manufactured specimens.
Figure 11.
(a) Al-Si-Mg and Al-Cu Type 1 manufactured specimens; (b) Al-Si-Mg Type 0 manufactured specimens.
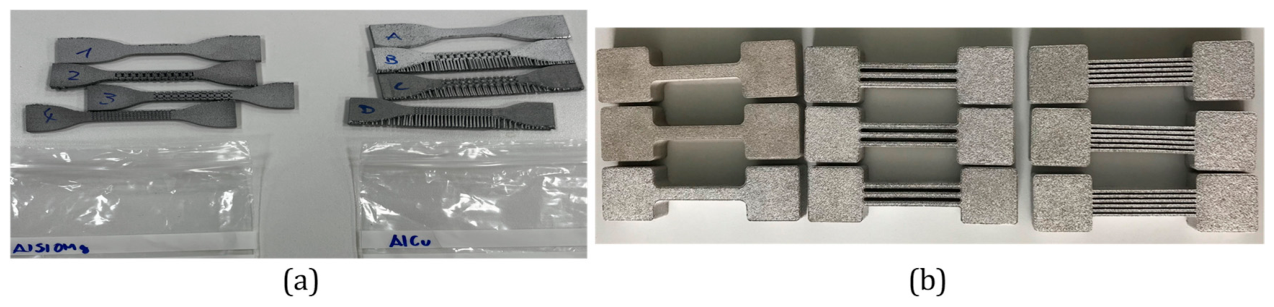
Figure 12.
Stress-strain diagrams for Type 0 - Al-Si-Mg specimens: (a) first repetition; (b) second repetition; (c) third repetition.
Figure 12.
Stress-strain diagrams for Type 0 - Al-Si-Mg specimens: (a) first repetition; (b) second repetition; (c) third repetition.
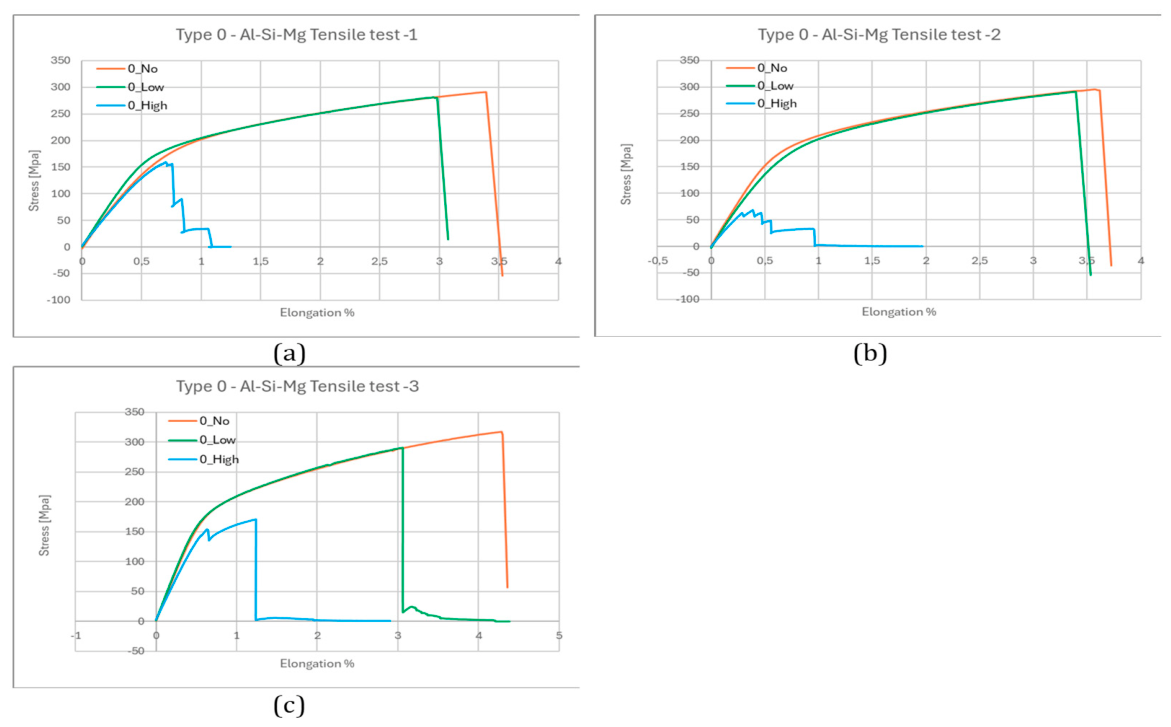
Figure 13.
Type 0- Al-Si-Mg specimens tensile test mean results.
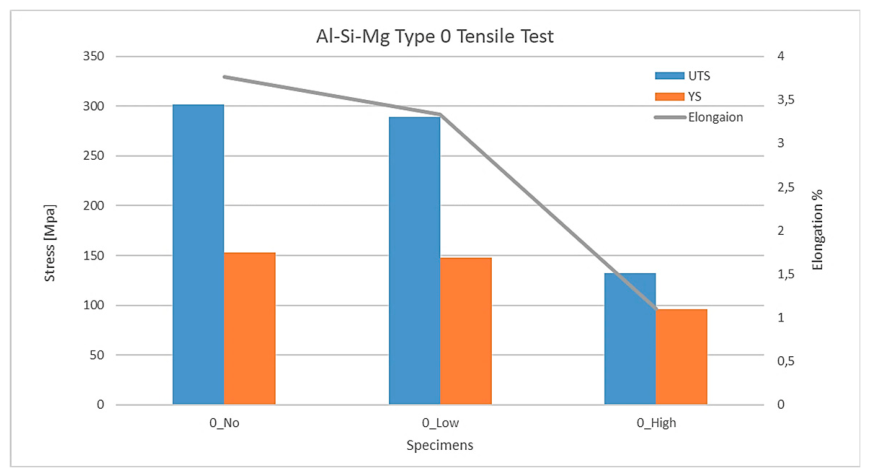
Figure 14.
Stress-Strain diagrams for Type 1 - Al-Si-Mg specimens: (a) first repetition; (b) second repetition; (c) third repetition; (d) fourth repetition.
Figure 14.
Stress-Strain diagrams for Type 1 - Al-Si-Mg specimens: (a) first repetition; (b) second repetition; (c) third repetition; (d) fourth repetition.
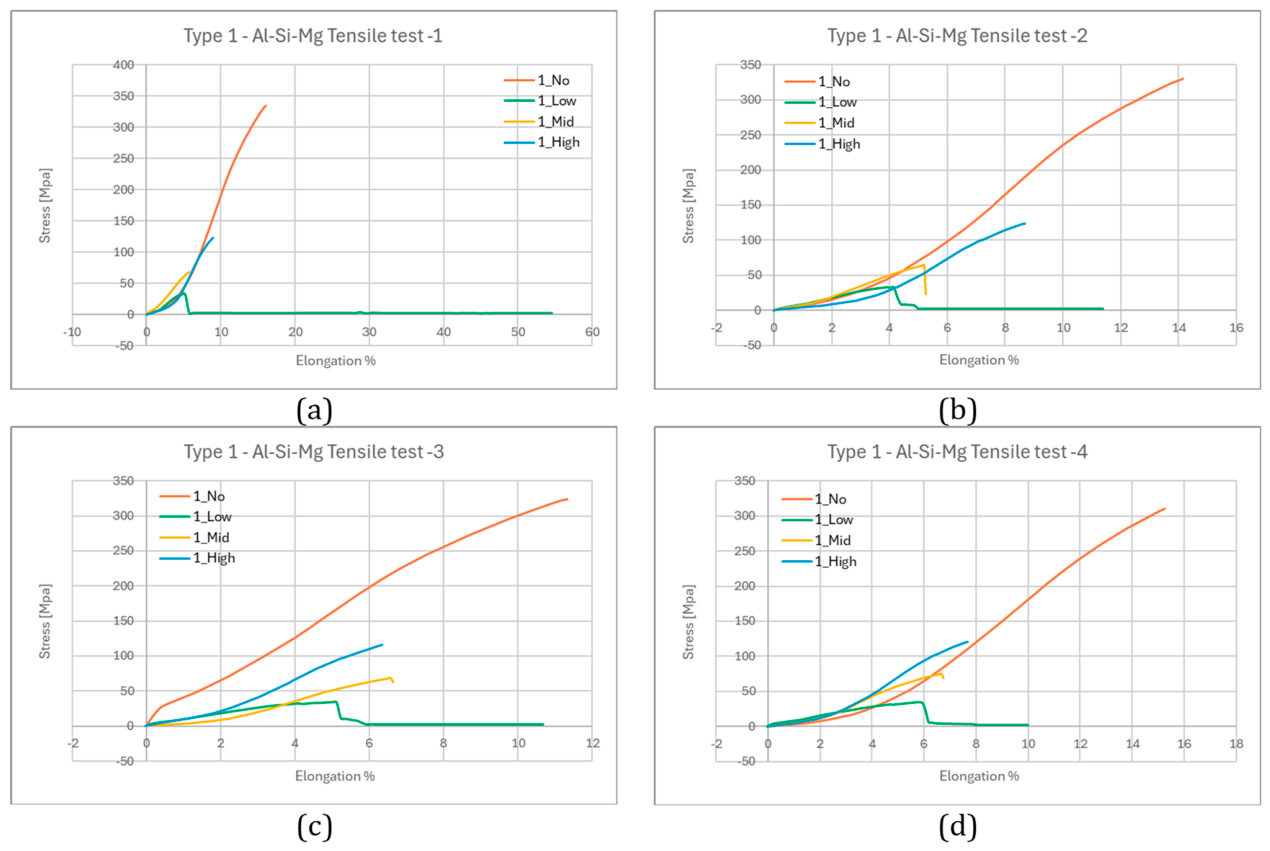
Figure 15.
Type 1- Al-Si-Mg specimen tensile test results.
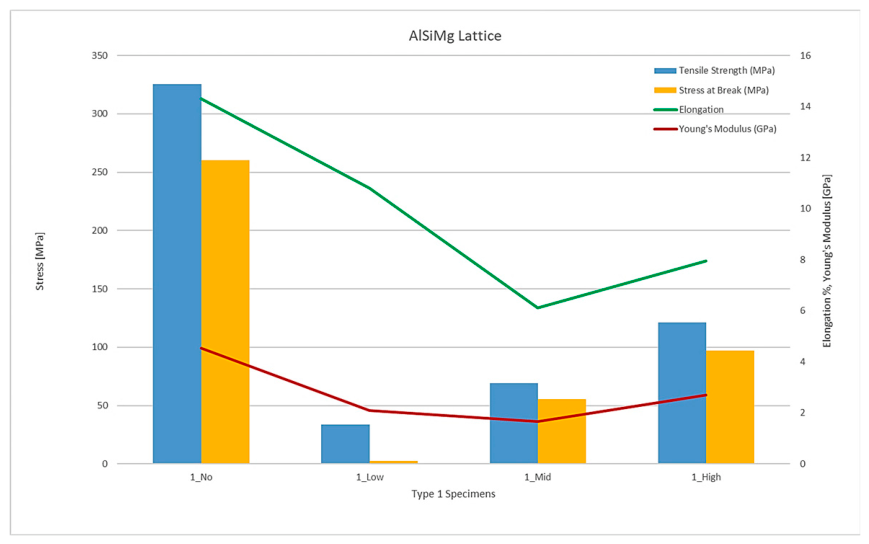
Figure 16.
Stress-strain diagrams for Type 1 - Al-Cu specimens: (a) first repetition; (b) second repetition; (c) third repetition; (d) fourth repetition.
Figure 16.
Stress-strain diagrams for Type 1 - Al-Cu specimens: (a) first repetition; (b) second repetition; (c) third repetition; (d) fourth repetition.
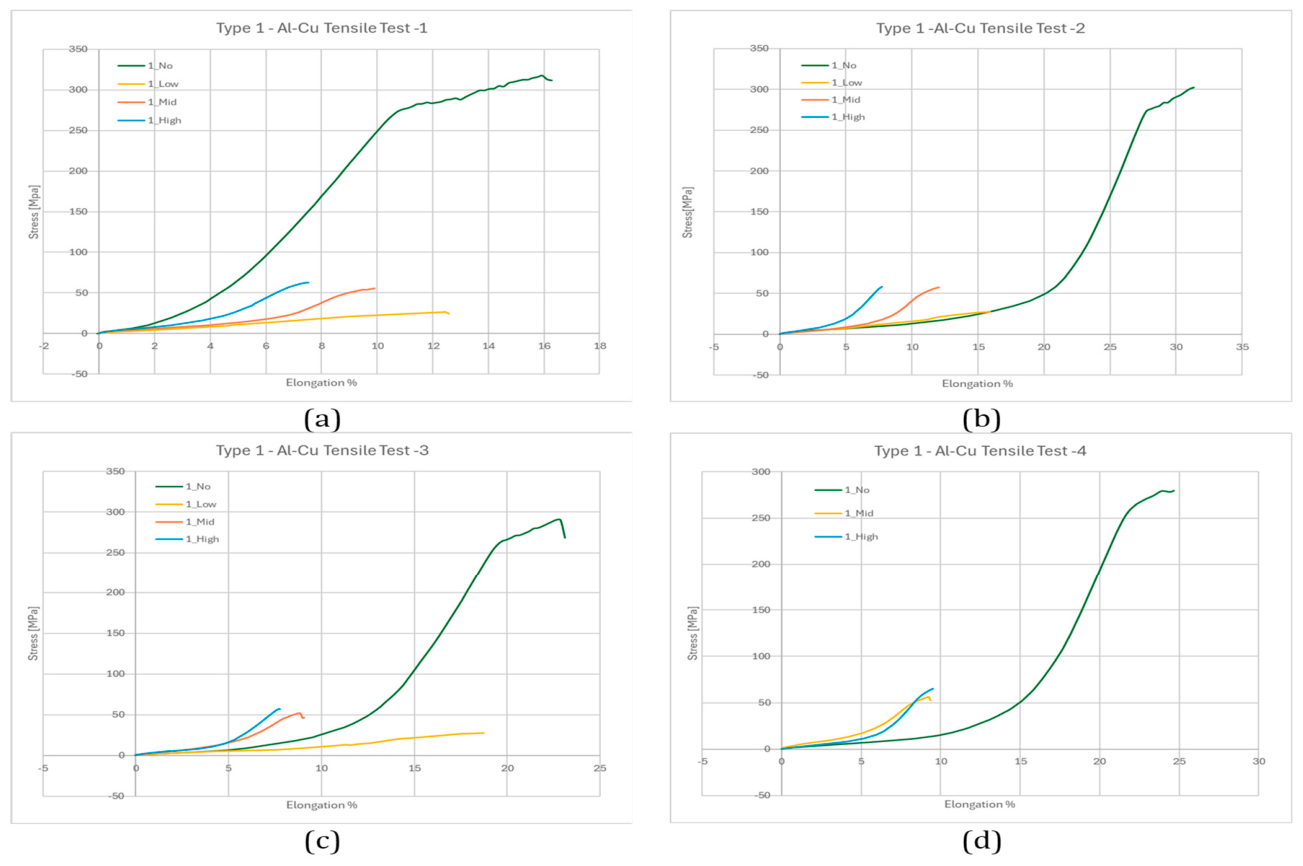
Figure 17.
Type 1- Al-Cu specimens tensile test results.
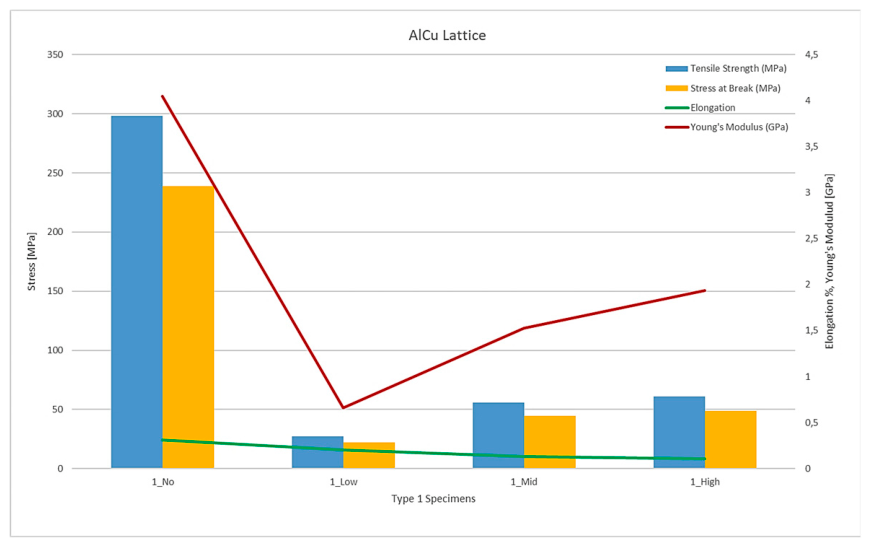
Figure 18.
(a) Type 0 - Resin tested specimens; (b) Type 0- Resin specimens tensile test results.
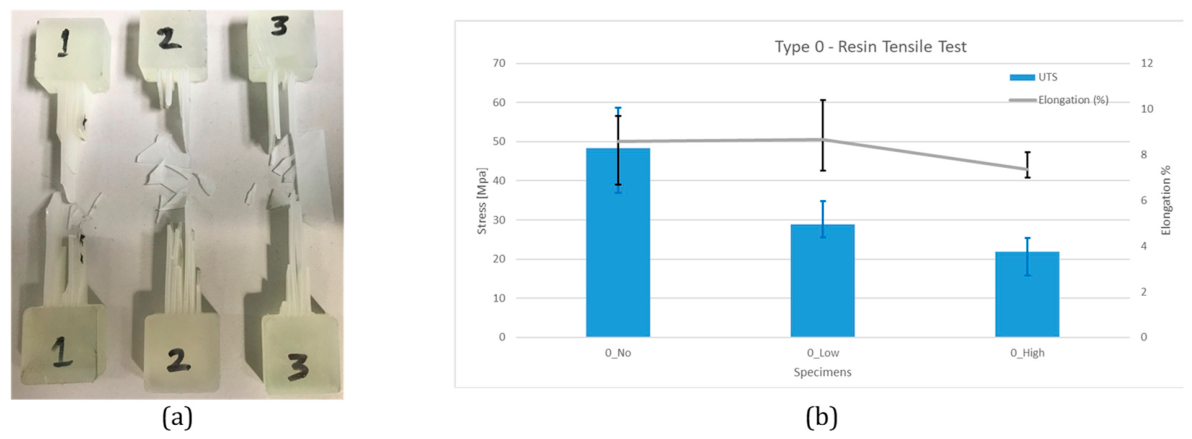
Figure 19.
(a) Type 1 PA12 tested specimens; (b) Type 1- PA12 specimens tensile test results.
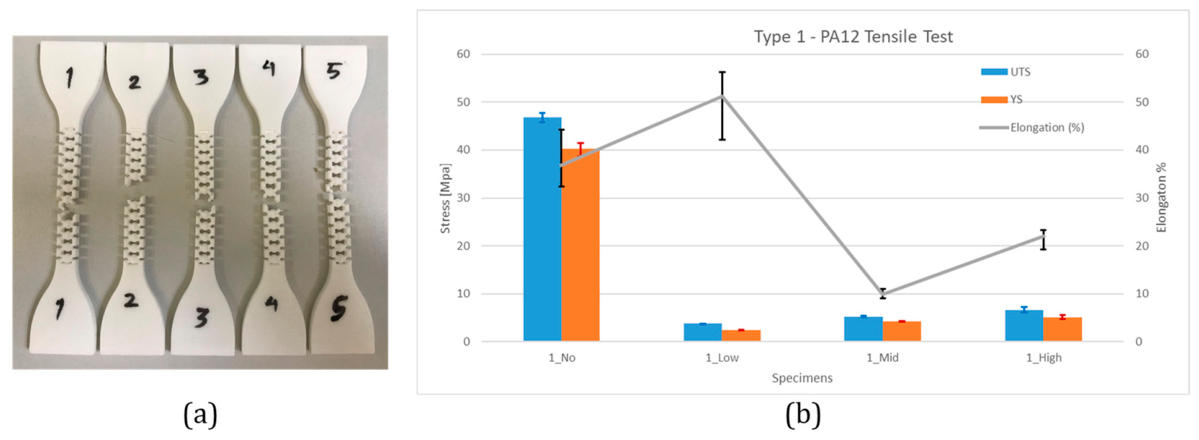
Figure 20.
Optical microscope analyses of the Type1 Al-Si-Mg specimens: (a) 1_No, Side On; (b) 1_Low, Top Down; (c) 1_Mid, Side On; (d) 1_High, Top Down.
Figure 20.
Optical microscope analyses of the Type1 Al-Si-Mg specimens: (a) 1_No, Side On; (b) 1_Low, Top Down; (c) 1_Mid, Side On; (d) 1_High, Top Down.
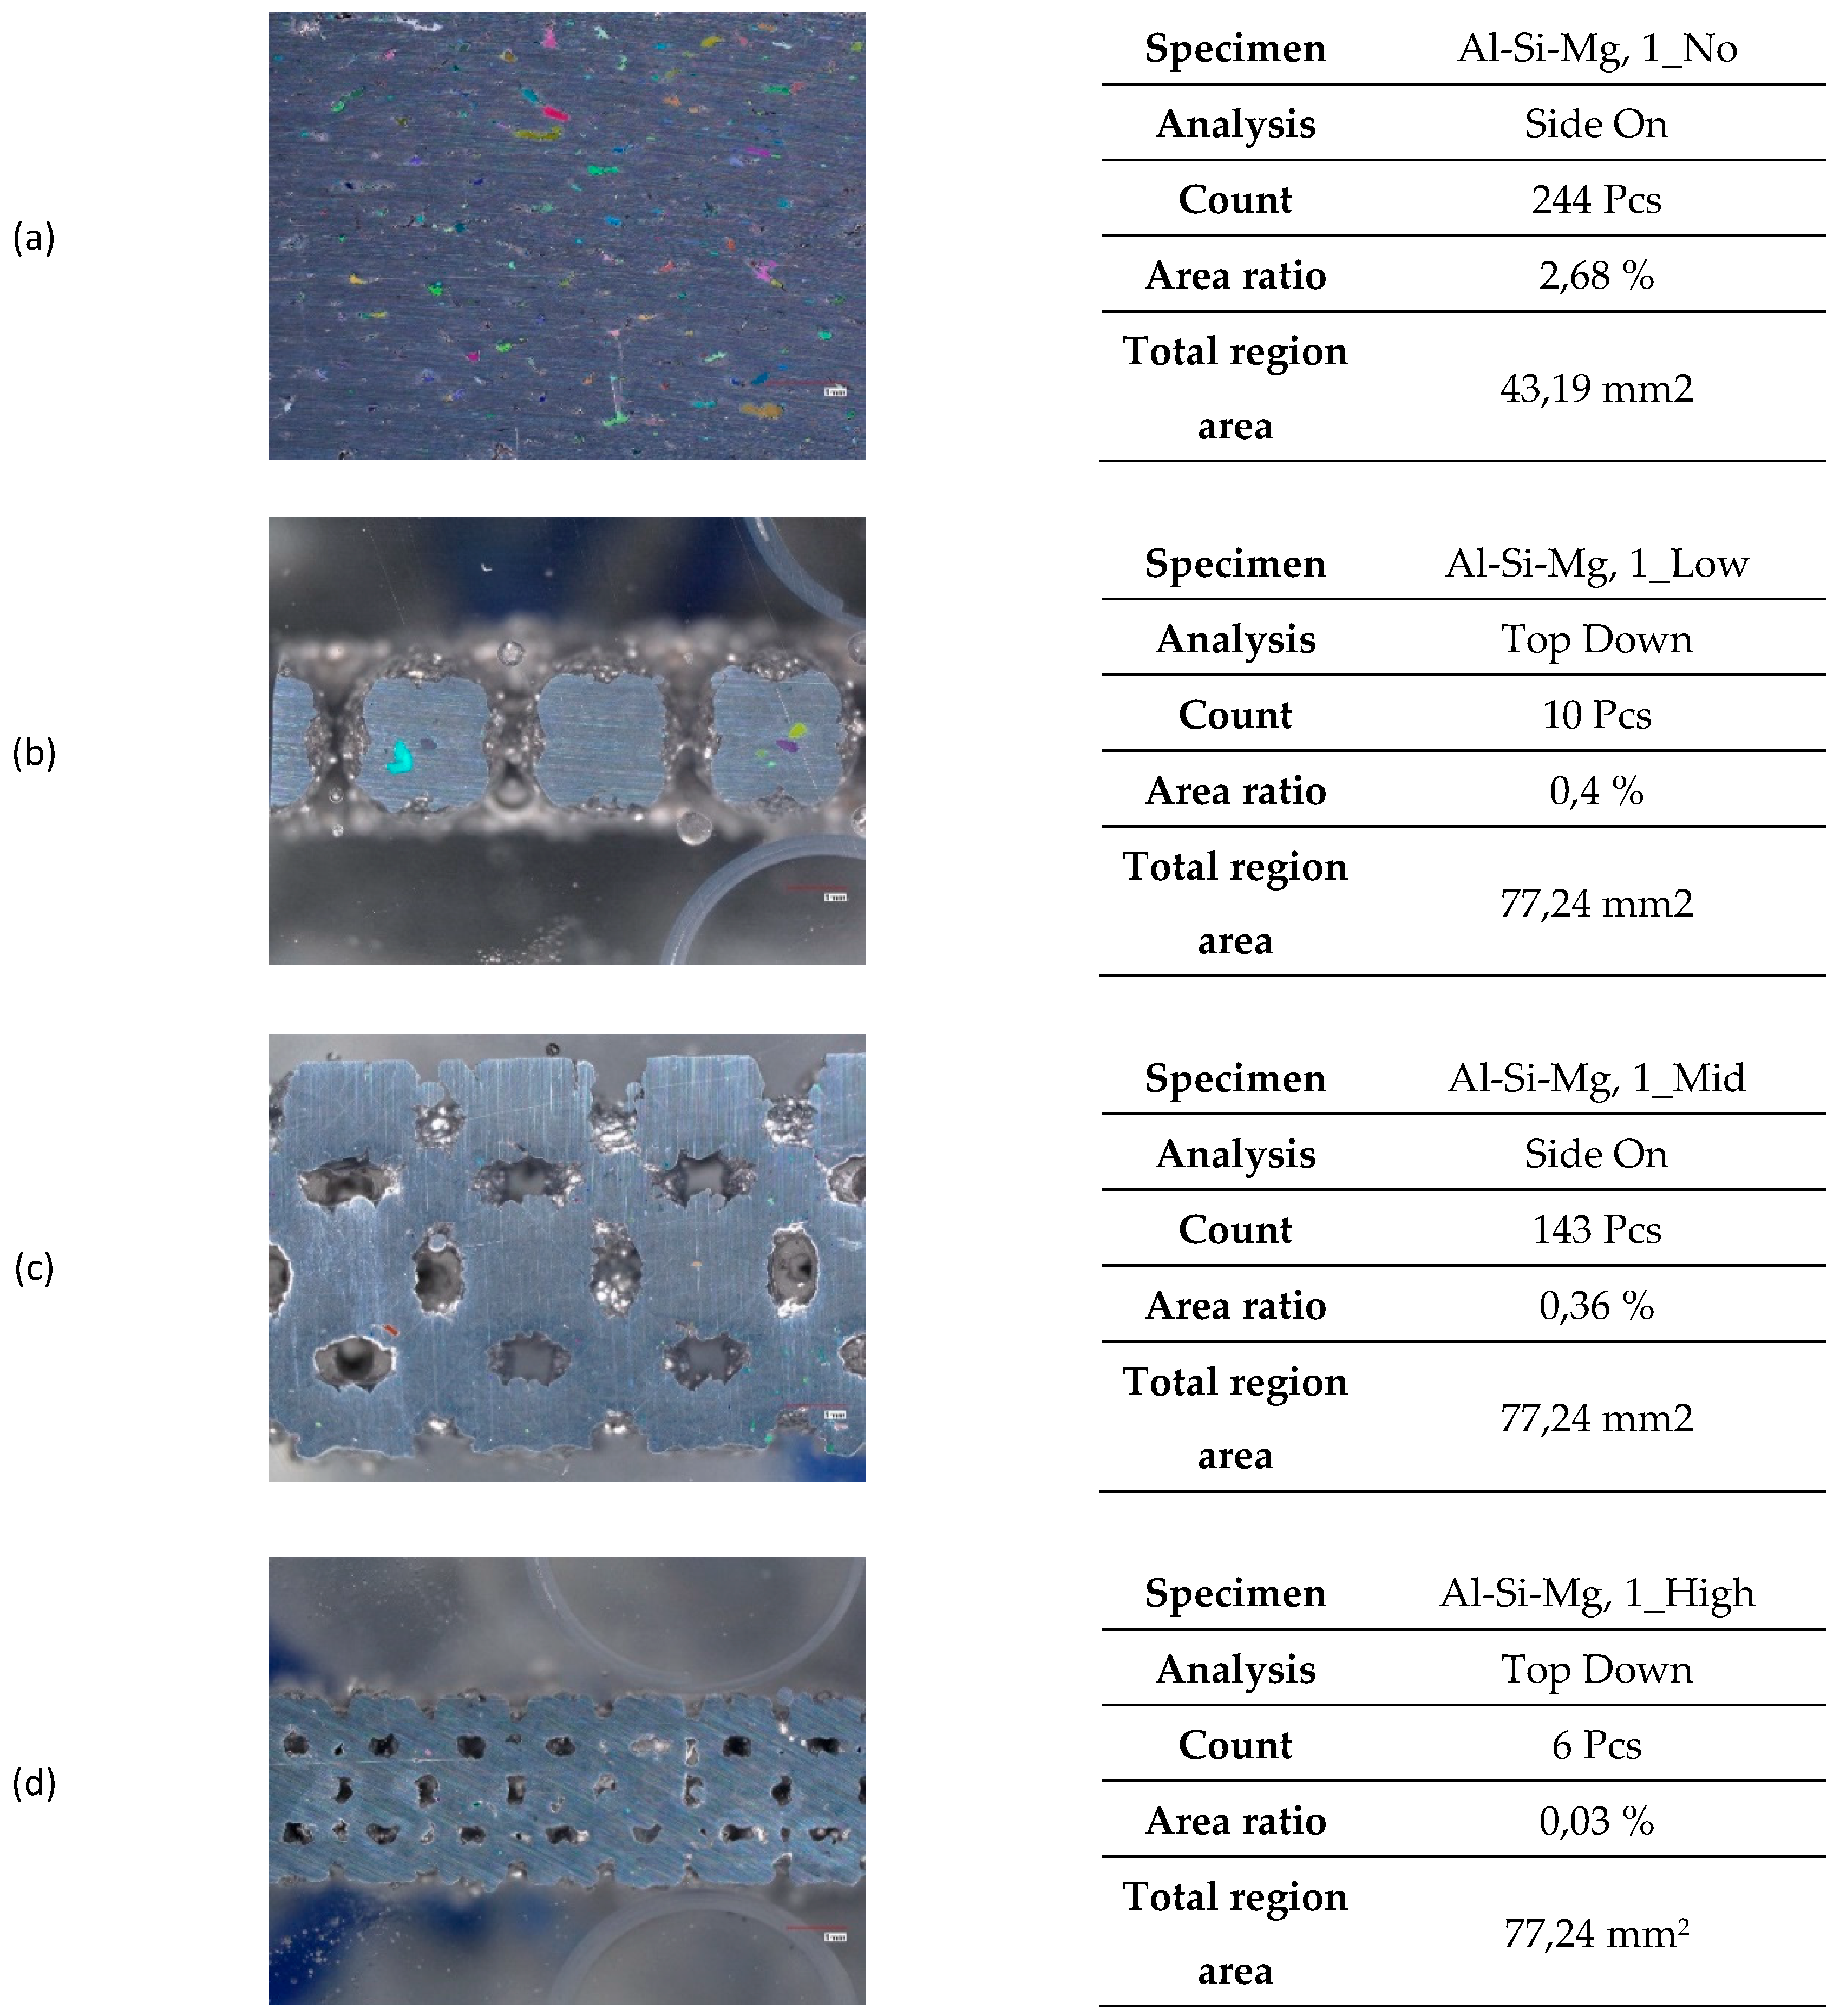
Figure 21.
Optical microscope analyses of the Type 1 Al-Cu specimens: (a) 1_No, Top Down; (b) 1_Low, Side On; (c) 1_Mid, Top Down; (d) 1_High, Side On.
Figure 21.
Optical microscope analyses of the Type 1 Al-Cu specimens: (a) 1_No, Top Down; (b) 1_Low, Side On; (c) 1_Mid, Top Down; (d) 1_High, Side On.
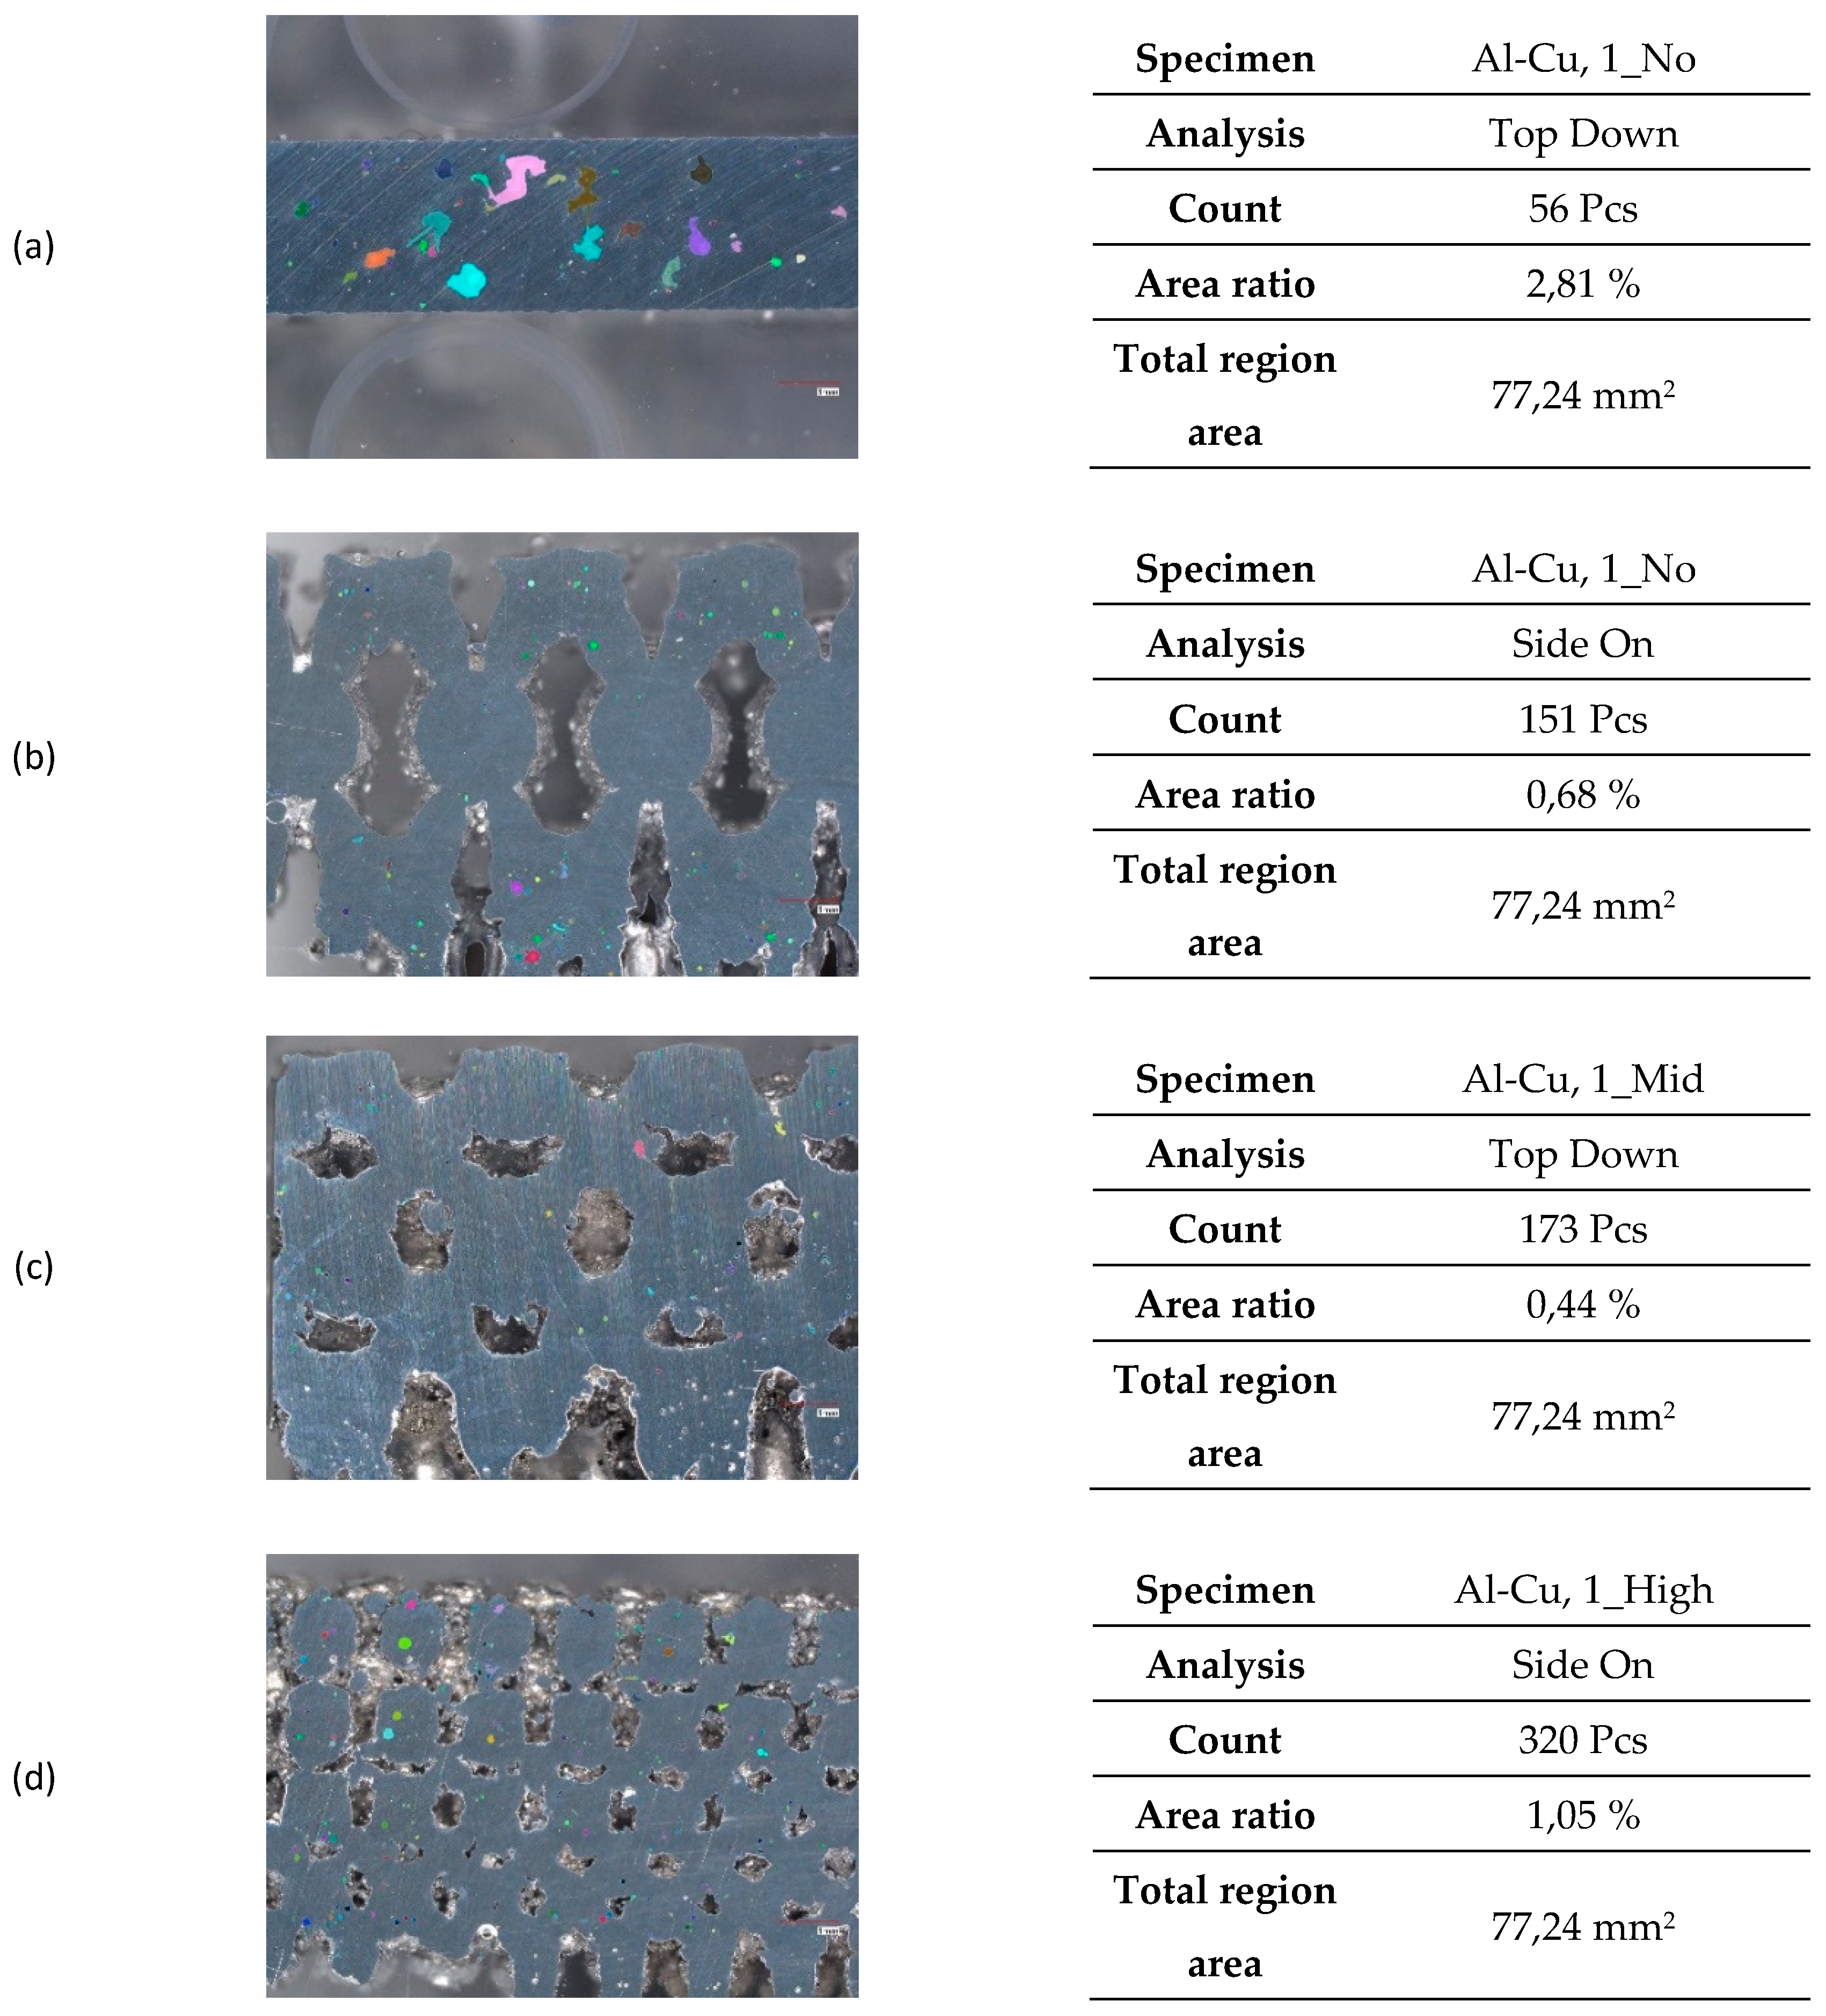
Figure 22.
Type 0 UTS, YS, and E% Trends as a function of Shape Complexity: (a) UTS; (b) YS; (c) E%.
Figure 22.
Type 0 UTS, YS, and E% Trends as a function of Shape Complexity: (a) UTS; (b) YS; (c) E%.
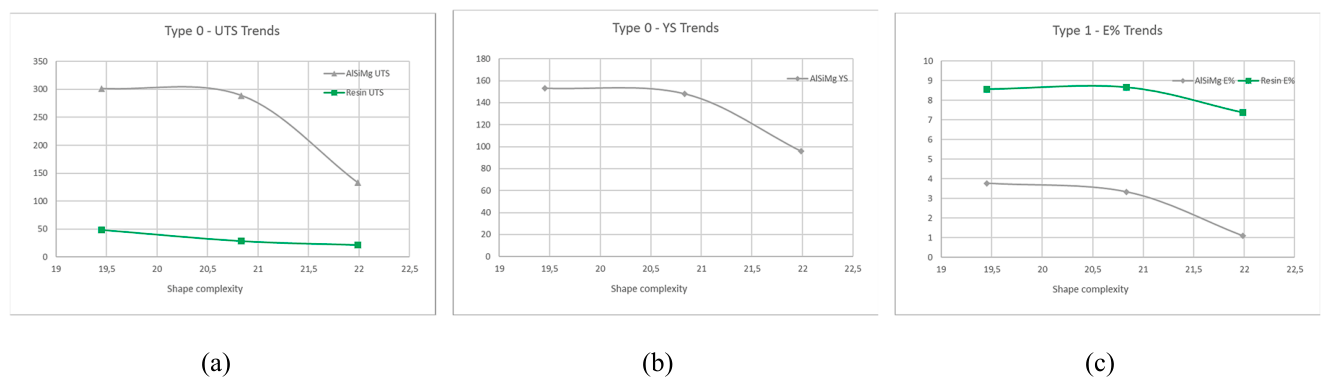
Figure 23.
. Type 1 trends and normalised trends: (a) UTS; (b) UTS normalised; (c) YS; (d) YS normalised; (e)E%; (f) E% normalised.
Figure 23.
. Type 1 trends and normalised trends: (a) UTS; (b) UTS normalised; (c) YS; (d) YS normalised; (e)E%; (f) E% normalised.
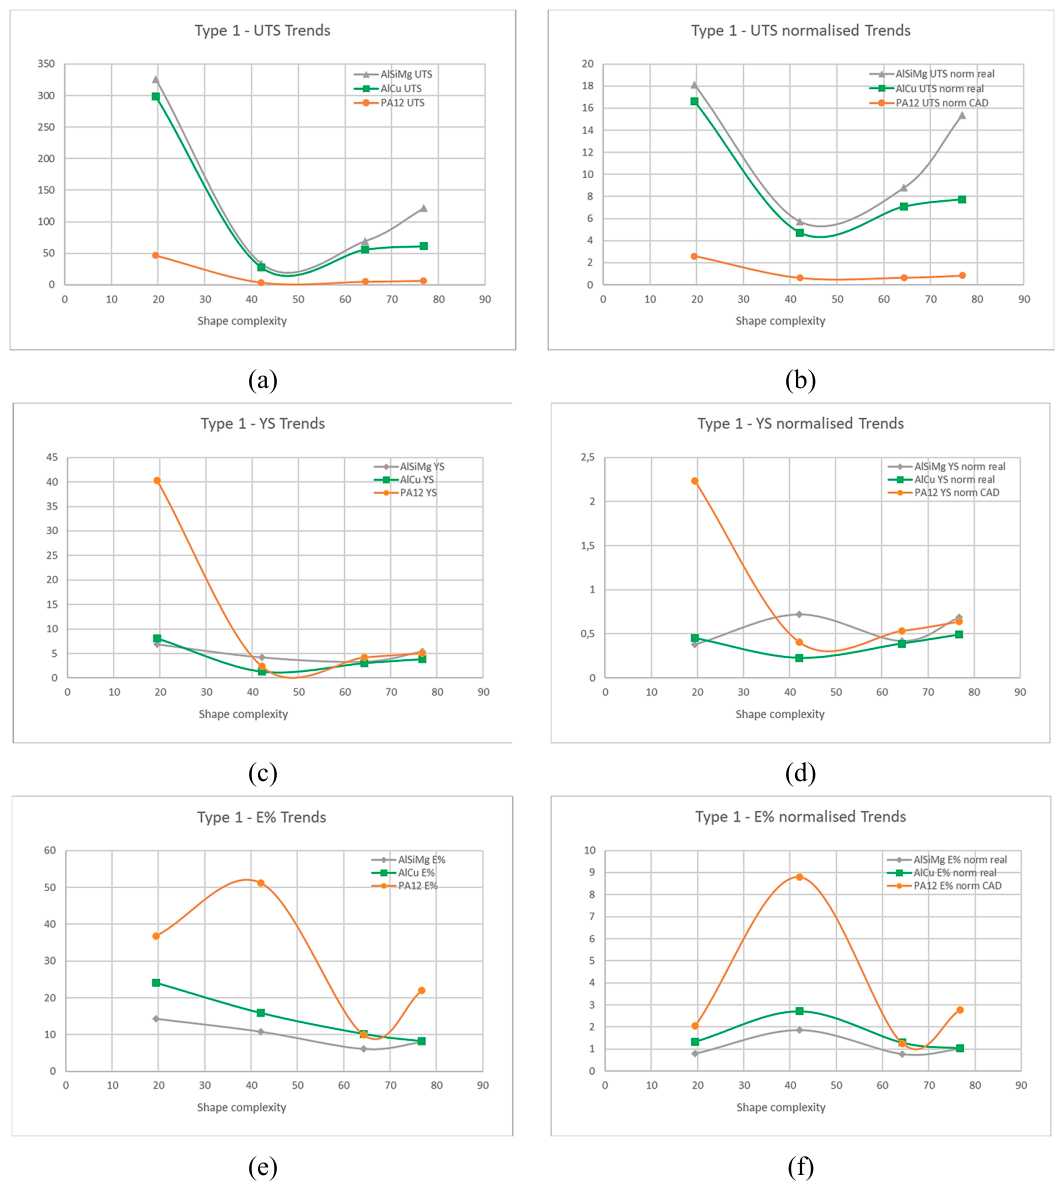
Figure 24.
Type 0 specimens MPI trends as a function of
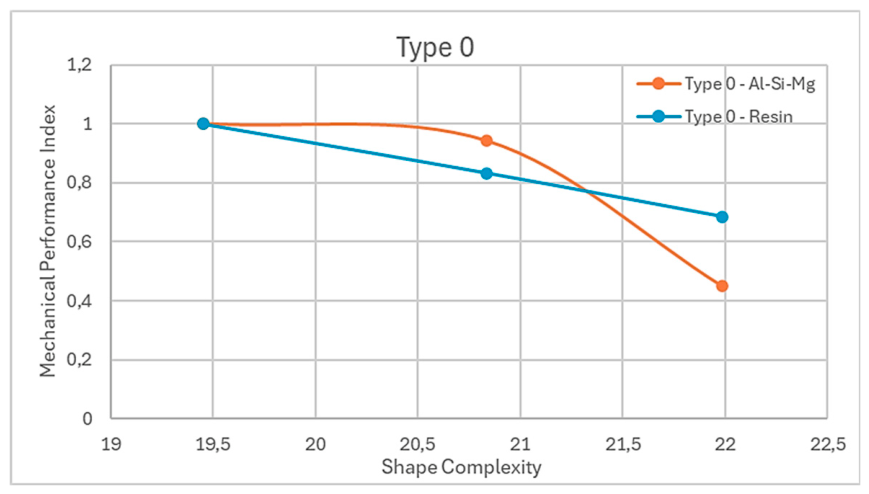
Figure 25.
Trends of MPI as a function of the Shape Complexity Index.
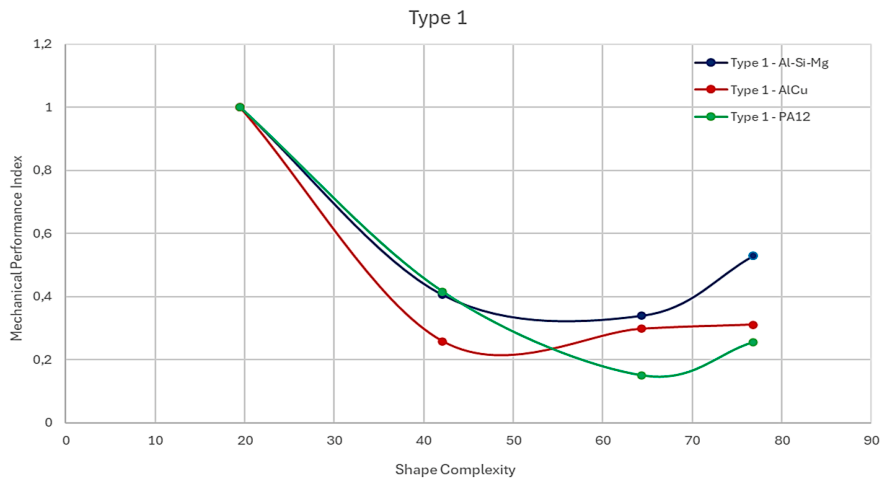
Figure 26.
Type 0 and Type 1 results comparison, highlighting differences in complexity.
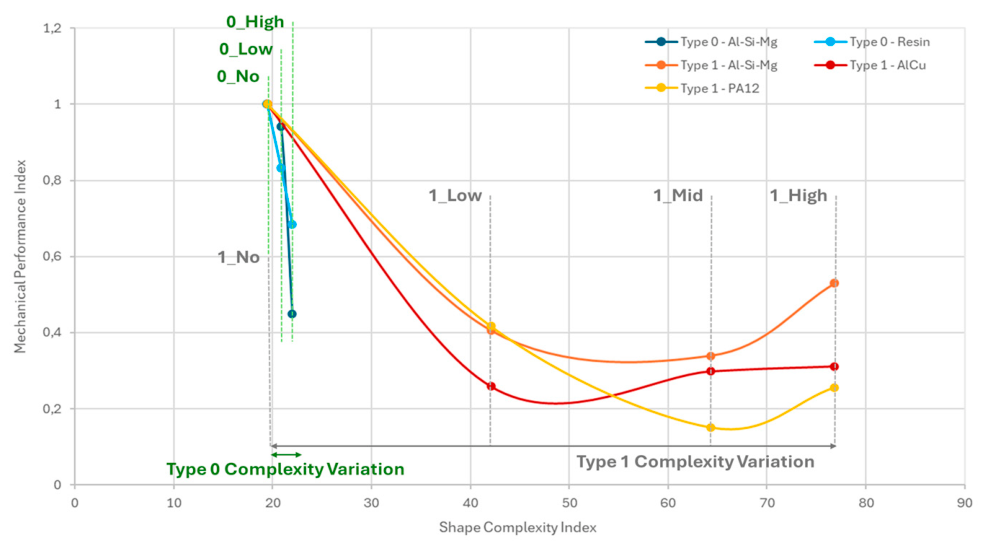
Figure 27.
Porosity trends as a function of the Shape complexity in Type 1 specimens.
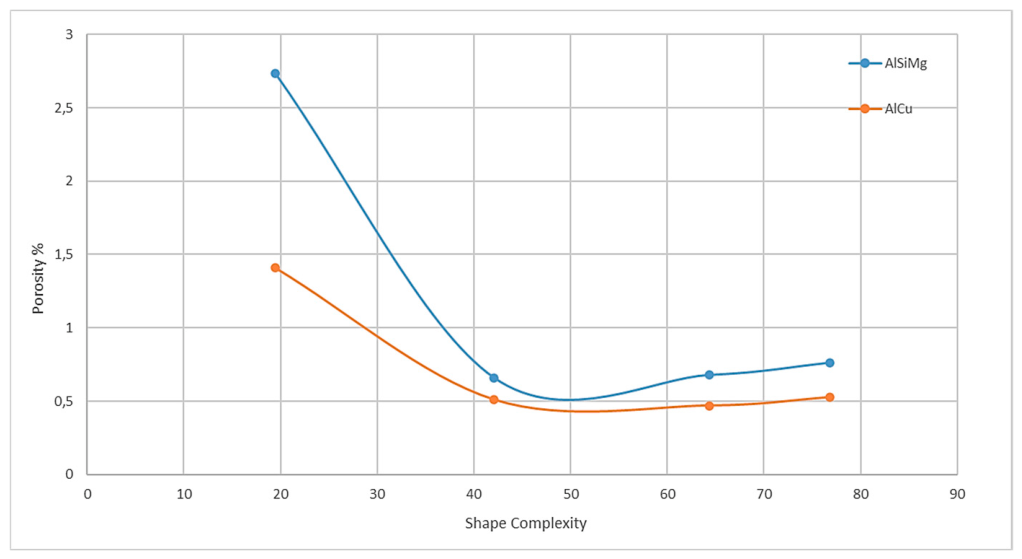
Figure 28.
Trends of as a function of the Index.
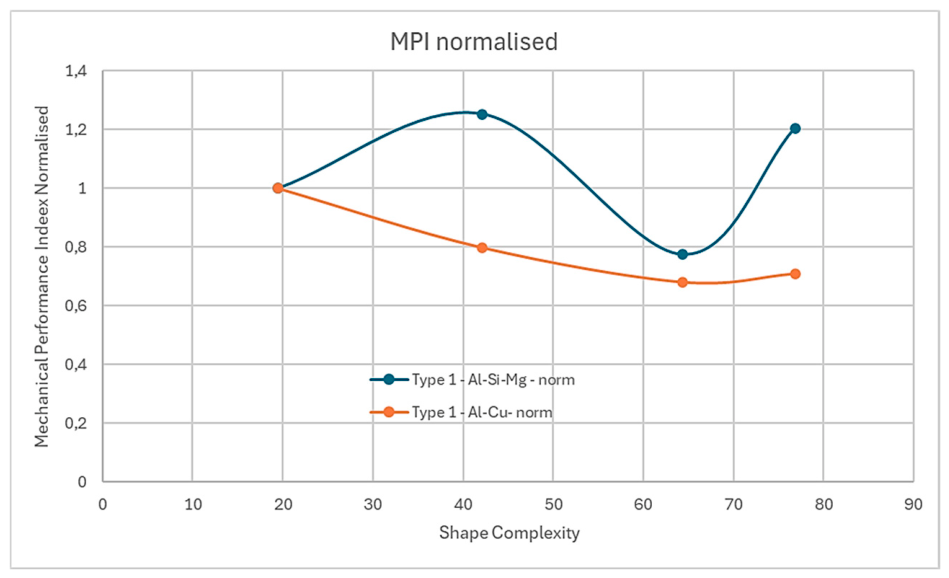

Table 1.
Cross-Section surface area values for specimens 1_Low, 1_Mid, 1_High.
| Sample Type | Cross-Section 1 [mm2] | Cross-Section 2[mm2] |
|---|---|---|
| Low Complexity (1_Low) | 5,87 | 5.79 |
| Mid Complexity (1_Mid) | 7.89 | 7.86 |
| High Complexity (1_High) | 7.90 | 7.91 |
Table 2.
Some specimen data extracted from STL CAD models using numpy-stl 3.2.0.
| Name | Area [mm2] |
Volume [mm3] |
Boundary box [mm3] |
|---|---|---|---|
| 0_No | 1458,170 | 2107,32 | 3240 |
| 0_Low | 1959,480 | 2099,5 | 3240 |
| 0_High | 2714,840 | 2097,46 | 3240 |
| 1_No | 3899,130 | 4511,87 | 6555 |
| 1_Low | 4522,490 | 4223,12 | 6555 |
| 1_Mid | 5775,790 | 4223,12 | 6555 |
| 1_High | 7028,980 | 4223,12 | 6555 |
Table 3.
Shape complexity evaluation for each specimen using the method proposed by Slama et al. [18].
Table 3.
Shape complexity evaluation for each specimen using the method proposed by Slama et al. [18].
| Name | |||||||
|---|---|---|---|---|---|---|---|
| 0_No | 0,350 | 0,324 | 0,933 | 0,000 | 7,536 | 10,311 | 19,454 |
| 0_Low | 0,352 | 0,498 | 0,978 | 0,693 | 7,720 | 10,594 | 20,835 |
| 0_High | 0,353 | 0,638 | 0,989 | 1,253 | 7,910 | 10,844 | 21,986 |
| 1_No | 0,312 | 0,580 | 0,974 | 0,000 | 7,536 | 10,071 | 19,473 |
| 1_Low | 0,356 | 0,653 | 0,992 | 2,918 | 15,854 | 21,298 | 42,072 |
| 1_Mid | 0,356 | 0,729 | 0,996 | 5,421 | 25,544 | 31,285 | 64,330 |
| 1_High | 0,356 | 0,777 | 0,997 | 6,804 | 31,083 | 36,815 | 76,831 |
Table 4.
Al-Si-Mg alloy composition (wt.-%).
| Al | Si | Mg | Fe | Ti | Zn | Pb | Mn | Cu, Ni, Sn | Others, each | Others max. | |||
|---|---|---|---|---|---|---|---|---|---|---|---|---|---|
| Al-Si-Mg (AlSi10Mg) |
Bal. | 9,0-11,0 | 0,2 – 0,45 | ≤0,55 | ≤0,15 | ≤0,10 | ≤0,03 | 0,2 0 – 0,45 | ≤0,05 each |
≤0,05 | ≤0,15 | ||
| Generic particle size distribution | 25 - 70 μm | ||||||||||||
Table 5.
Al-Cu alloy composition (wt.-%).
| Al | Cu | Mg | Ag | Ti | B | Si | Fe | Others, each | Others max. | |
|---|---|---|---|---|---|---|---|---|---|---|
| Al-Cu (A20X®) |
Bal. | 4.2 - 5.0 | 0.2 - 0.33 | 0.6 - 0.9 | 3.00 - 3.85 | 1.25 - 1.55 | 0.1 max. | 0.08 max. | 0.08 max. |
0.17 max. |
| Generic particle size distribution | 20 - 63 μm | |||||||||
Table 6.
Process parameters.
| Parameter | Laser Power |
Scanning Speed |
Hatch Spacing |
Layer Thickness |
Andrew Number |
|---|---|---|---|---|---|
| Value | 190 W | 450 mm/s | 0.049 mm | 0.050 mm | 8,62 J/mm2 |
Table 7.
Type 0- Al-Si-Mg specimens tensile tests mean values results.
| Specimen | UTS [MPa] | YS [MPa] | Elongation % |
|---|---|---|---|
| 0_No | 301,44 | 153 | 3,77 |
| 0_Low | 288,93 | 148 | 3,33 |
| 0_High | 132,56 | 96 | 1,10 |
Table 8.
Type 1- Al-Si-Mg specimens tensile tests mean values results.
| Specimen | Tensile Strength [MPa] | Stress at Break [MPa] | Young's Modulus [GPa] | Elongation |
|---|---|---|---|---|
| 1_No | 325,49 | 260,39 | 3,43 | 14,31 |
| 1_Low | 33,48 | 2,33 | 2,09 | 10,80 |
| 1_Mid | 69,26 | 55,41 | 1,66 | 6,11 |
| 1_High | 121,25 | 97,00 | 2,70 | 7,96 |
Table 9.
Type 1- Al-Cu specimens tensile test mean values.
| Specimen | Tensile Strength [MPa] | Stress at Break [MPa] | Young's Modulus [GPa] | Elongation |
|---|---|---|---|---|
| 1_No | 298,29 | 238,64 | 4,05 | 24,03 |
| 1_Low | 27,45 | 21,96 | 0,66 | 15,84 |
| 1_Mid | 55,63 | 44,51 | 1,53 | 10,16 |
| 1_High | 61,12 | 48,89 | 1,93 | 8,16 |
Table 10.
Mean values of measured internal porosity for each specimen.
| Type 1 | Specimen | Mean Internal Porosity | Type 1 | Specimen | Mean Internal Porosity |
|---|---|---|---|---|---|
| Al-Si-Mg | 1_No | 2,73 % | Al-Cu | 1_No | 1,41 % |
| 1_Low | 0,66 % | 1_Low | 0,51 % | ||
| 1_Mid | 0,68 % | 1_Mid | 0,47 % | ||
| 1_High | 0,76 % | 1_High | 0,53 % |
Table 11.
Type 0 specimens MPI calculation.
| Type 0 | UTS | YS | Elongation | Shape Complexity | MPI | |
|---|---|---|---|---|---|---|
| 0_No | 301,44 | 153,00 | 3,77 | 19,454 | 1 | |
| Al-Si-Mg | 0_Low | 288,93 | 148,00 | 3,33 | 20,835 | 0,94 |
| 0_High | 132,56 | 96,00 | 1,10 | 21,986 | 0,45 | |
| 0_No | 48,30 | / | 8,57 | 19,454 | 1 | |
| Resin | 0_Low | 28,81 | / | 8,67 | 20,835 | 0,83 |
| 0_High | 21,91 | / | 7,37 | 21,986 | 0,69 |
Table 12.
Type 1 specimens MPI evaluation.
| Type 1 | UTS | YS | Elongation | Shape Complexity | MPI | |
|---|---|---|---|---|---|---|
| 1_No | 325,49 | 6,86 | 14,31 | 19,473 | 1 | |
| Al-Si-Mg | 1_Low | 33,48 | 4,19 | 10,80 | 42,072 | 0,41 |
| 1_Mid | 69,26 | 3,31 | 6,11 | 64,330 | 0,34 | |
| 1_High | 121,25 | 5,41 | 7,96 | 76,831 | 0,53 | |
| 1_No | 298,29 | 8,09 | 24,03 | 19,473 | 1 | |
| Al-Cu | 1_Low | 27,45 | 1,32 | 15,84 | 42,072 | 0,26 |
| 1_Mid | 55,63 | 3,06 | 10,16 | 64,330 | 0,30 | |
| 1_High | 61,12 | 3,87 | 8,16 | 76,831 | 0,31 | |
| 1_No | 46,81 | 40,26 | 36,86 | 19,473 | 1 | |
| PA12 | 1_Low | 3,75 | 2,38 | 51,24 | 42,072 | 0,42 |
| 1_Mid | 5,23 | 4,20 | 9,92 | 64,330 | 0,15 | |
| 1_High | 6,64 | 5,04 | 22,00 | 76,831 | 0,26 |
Table 13.
Type 1 specimens MPI evaluation.
| Type 1 | Specimen | CAD Cross Section | Mean Internal porosity % | Real Cross Section |
|---|---|---|---|---|
| Al-Si-Mg | 1_No | 18 | 2,73 | 17,97 |
| 1_Low | 5,83 | 0,66 | 5,82 | |
| 1_Mid | 7,88 | 0,68 | 7,87 | |
| 1_High | 7,9 | 0,76 | 7,89 | |
| Al-Cu | 1_No | 18 | 1,41 | 17,99 |
| 1_Low | 5,83 | 0,51 | 5,82 | |
| 1_Mid | 7,88 | 0,47 | 7,88 | |
| 1_High | 7,9 | 0,53 | 7,89 |
Table 14.
Metal Type 1 tensile test normalised in function of the measured cross-section.
| Type 1 | Shape Complexity | |||||
|---|---|---|---|---|---|---|
| 1_No | 18,11 | 0,38 | 0,80 | 19,473 | 1 | |
| Al-Si-Mg | 1_Low | 5,75 | 0,72 | 1,85 | 42,072 | 1,25 |
| 1_Mid | 8,80 | 0,42 | 0,78 | 64,330 | 0,77 | |
| 1_High | 15,36 | 0,69 | 1,01 | 76,831 | 1,21 | |
| 1_No | 16,58 | 0,45 | 1,34 | 19,473 | 1 | |
| Al-Cu | 1_Low | 4,71 | 0,23 | 2,72 | 42,072 | 0,80 |
| 1_Mid | 7,06 | 0,39 | 1,29 | 64,330 | 0,68 | |
| 1_High | 7,74 | 0,49 | 1,03 | 76,831 | 0,71 |
Disclaimer/Publisher’s Note: The statements, opinions and data contained in all publications are solely those of the individual author(s) and contributor(s) and not of MDPI and/or the editor(s). MDPI and/or the editor(s) disclaim responsibility for any injury to people or property resulting from any ideas, methods, instructions or products referred to in the content. |
© 2026 by the authors. Licensee MDPI, Basel, Switzerland. This article is an open access article distributed under the terms and conditions of the Creative Commons Attribution (CC BY) license (http://creativecommons.org/licenses/by/4.0/).
Copyright: This open access article is published under a Creative Commons CC BY 4.0 license, which permit the free download, distribution, and reuse, provided that the author and preprint are cited in any reuse.