

Submitted:
09 September 2026
Posted:
09 September 2026
You are already at the latest version
Abstract
The increasing complexity of general aviation flight training poses significant challenges to tower controllers, who must reconcile safety separation standards with training efficiency under diverse and often unexpected conflict scenarios. This study proposes a BERT-BiLSTM-XGBoost multimodal feature fusion ensemble learning model that automatically matches optimal allocation schemes based on predicted conflict characteristics, thereby providing real-time decision support for tower controllers. The framework operates in three stages. First, a BERT model extracts high-level semantic features from textual data—including aircraft status descriptions, controller characteristics, pilot profiles, and airspace constraints—by leveraging bidirectional contextual encoding. Second, a Bidirectional Long Short-Term Memory (BiLSTM) network captures temporal dynamic features from sequential aircraft operation data. Third, the extracted semantic and temporal feature vectors are fused and fed into an XGBoost classifier, which performs the final allocation scheme matching. The XGBoost algorithm additionally provides feature importance scores, supporting the traceability requirements of tower control decision-making. Experimental results demonstrate that the proposed model achieves a matching accuracy of 97.2%, substantially outperforming baseline methods including Naive Bayes, linear SVM, and LightGBM. Moreover, the model reduces controller decision-making time by 75–80% in simulated tower control tests, validating its practical utility as an effective decision-support tool for general aviation tower operations.
Keywords:
feature extraction
; automatic matching
; bidirectional encoder representations from transformers (BERT)
; bidirectional long short-term memory (BiLSTM)
; extreme gradient boosting (XGBoost)
1. Introduction
Currently, the rapid expansion of China’s general aviation industry has driven a sustained increase in demand for certified pilots, accompanied by a corresponding growth in flight training volume and task diversity. Tower control serves as the operational core of flight training, and its quality is directly linked to the safety and efficiency of training operations. Unlike scheduled commercial aviation, general aviation flight training involves multiple aircraft types—including fixed-wing aircraft, rotorcraft, and light sport aircraft—concurrently operating within shared airspace, with training maneuvers and emergency procedure drills further complicating the operational environment.
These complexities give rise to more intricate airspace conflict scenarios and a higher frequency of unexpected events. Controllers are required not only to maintain safety separation minima but also to balance the competing objective of training task efficiency. In the absence of effective AI-assisted decision-support tools, allocation decisions remain heavily dependent on subjective judgment and experiential heuristics, leading to excessive workload and elevated safety risks. Automating the matching of allocation schemes based on predicted conflict characteristics offers a promising avenue to provide controllers with timely, accurate recommendations, thereby synergizing human expertise with algorithmic efficiency while substantially reducing workload and enhancing training safety [1].
Existing approaches to tower control decision support can be broadly categorized into three groups. The first group focuses on conflict detection using deep learning techniques. A GAN-LSTM fusion model was proposed in [2] for four-dimensional aircraft trajectory prediction, achieving improved conflict detection accuracy, yet their approach does not incorporate textual information regarding flight environment or personnel characteristics. A multi-dimensional indicator fusion framework was developed in [3] for airspace conflict detection, but the model’s temporal prediction accuracy remains insufficient for dynamic allocation scheme matching. The second group addresses trajectory prediction. Aenerative deep learning with clustering was employed in [4] for four-dimensional trajectory prediction, demonstrating computational efficiency on massive datasets; however, their work stops at prediction and does not extend to conflict resolution or scheme allocation. The third group explores conflict resolution through reinforcement learning. Comprehensive review of deep reinforcement learning methods were provided in [5] and [6] for conflict resolution and established a Markov Decision Process theoretical framework, yet their review does not address the integration of multi-source heterogeneous features—particularly the fusion of textual semantics (e.g., controller and pilot characteristics, airspace constraints) with temporal dynamics for allocation scheme matching.
Despite these advances, a critical research gap remains: no existing study has systematically addressed the automatic matching of tower allocation schemes through the fusion of textual semantic features and time-series operational data in the general aviation context. This gap is particularly significant given that tower controllers’ decisions are shaped not only by real-time aircraft states but also by human factors (controller experience and pilot proficiency) and regulatory constraints—information that is predominantly encoded in textual form.
Parallel to the conflict resolution literature, recent advances in automatic matching models offer relevant technical foundations for allocation scheme matching. A collaboration-aware hybrid learning framework was proposed in [7] that integrates sequential prediction with multi-agent feature matching, demonstrating applicability to multi-factor linkage prediction scenarios. Pre-trained language models were employed in [8], [9] and [10] for text feature extraction, achieving notable improvements in matching accuracy. Deep learning-based matching methods in [11], [12] and [13] have also reported high accuracy in various domains. However, these methods face two common limitations when applied to tower control scenarios: first, they struggle with imbalanced small-sample datasets, where overfitting becomes a serious concern; second, their feature extraction capabilities are often tailored to single modality and insufficient for the multi-source heterogeneous information (textual plus temporal) characteristic of tower control operations.
In conclusion, this paper proposes a BERT-BiLSTM-XGBoost automatic matching model for tower allocation schemes. The novelty of this work is threefold.
First, we reformulate the traditional conflict resolution problem as an automatic allocation scheme matching task. Unlike prior approaches that rely on conflict detection outputs as the sole decision basis, our formulation directly maps conflict characteristics to predefined allocation schemes. This reframing better reflects the actual cognitive process of tower controllers, who typically select from a set of familiar response strategies rather than generating solutions from scratch. It also eliminates the compounding errors that may arise from sequential conflict detection and resolution pipelines.
Second, we establish a multimodal feature fusion framework that integrates textual semantics with time-series structured information. By incorporating controller characteristics, pilot profiles, and airspace restrictions—information traditionally overlooked in purely trajectory-based models—our approach captures decision-relevant factors that are predominantly encoded in textual form. This addresses the incomplete feature representation that plagues single-modality approaches and enhances the quality of multi-source heterogeneous information extraction in tower control contexts.
Third, we introduce XGBoost with inherent regularization for classification matching in small-sample scenarios. The limited availability of tower control training data poses a significant overfitting risk for deep learning models. XGBoost’s built-in regularization constraints effectively mitigate this issue while simultaneously providing feature importance scores. This traceability is critical in safety-critical domains such as air traffic control, where controllers must understand and justify the rationale behind algorithmic recommendations.
2. Automatic Matching Model Based on BERT-BiLSTM-XGBoost
2.1. Text Information Feature Extraction Based on BERT Model
Bidirectional Encoder Representations from Transformers (BERT) [14] enables better adaptation to advanced semantic feature extraction and similarity matching tasks. The specific feature extraction process for the BERT model, after pre-training and fine-tuning, is illustrated in Figure 1:
Step 1: After sample preprocessing, the input is transformed into an embedding sequence formed by the summation of three types of feature vectors, so as to integrate lexical meaning, position and sentence-segment information. For the i-th token in the input sequence, its final input vector is:
Where:
: represents the vector dimension;
: denotes the word embedding vector;
: represents the i-th token;
: represents the segment embedding vector;
: represents the segment index of the i-th token;
: represents the position embedding vector;
: represents the position index of the i-th token.
Step 2: Generate the query (Query), key (Key), and value (Value) matrices through three trainable weight matrices:
Where:
: represents the vector matrix of the entire input sequence;
: is the sequence length;
: are the projection matrices for query, key, and value, all belonging to ;
: is the dimension of a single vector in matrix ;
Step 3: Adopt the bidirectional self-attention mechanism to realize genuine bidirectional context understanding. The attention score is calculated as follows:
Where:
: is the transpose matrix of ;
: is the attention score matrix;
: is the scaling factor;
: represents the normalized exponential function.
Secondly, multiple independent attention heads are operated in parallel, and the outputs are concatenated:
Where:
: represents the output of the i-th attention head;
: is the number of attention heads;
: indicates the concatenation of the h heads along the last dimension (feature dimension);
: is the output projection matrix.
Step 4: After performing standard operations and passing the input through L Transformer layers, BERT ultimately outputs a sequence of contextual word feature vectors with the same length as the input sequence, :
Extract the text sentence features that will be applied to the next step of feature concatenation, :
Where:
: is a special learnable token designed to aggregate a comprehensive representation of the entire input sequence for classification tasks.
2.2. Structured Information Feature Extraction Based on BiLSTM Model
The BERT model has limitations in structured data processing, hence this paper introduces a bidirectional long short-term memory (BiLSTM) network [15,16]. BiLSTM is a temporal neural network composed of forward LSTM and backward LSTM. The LSTM unit comprises input, forget, and output gates that regulate information flow through the cell state. The cell structure of LSTM is shown in Figure 2(a), and the framework diagram of BiLSTM is shown in Figure 2(b):
The hidden state of BiLSTM is the concatenation of the forward propagation and the backward propagation :
Where:
: represents the input vector at time t;
: represents the cell state;
: represents the vertical concatenation of column vectors.
In order to match the text features output by the BERT model, the features are concatenated after being pooled by mean and maximum operations to obtain structured information features :
2.3. Classification Matching Model Based on BERT-BiLSTM-XGBoost
On the basis of feature extraction, this paper introduces the extreme gradient boosting (XGBoost) model for classification matching.
The feature vectors extracted by BERT () and BiLSTM () are concatenated into a unified representation for each sample. While more sophisticated fusion mechanisms exist, concatenation is adopted here for two reasons. First, the semantic and temporal features are complementary rather than overlapping in nature—BERT captures contextual linguistic information while BiLSTM models sequential dynamics—making linear combination sufficient for the subsequent tree-based classifier to learn complex decision boundaries. Second, concatenation preserves the complete information from both modalities without imposing potentially restrictive cross-modal interactions, which is particularly important given the relatively limited-size dataset.
XGBoost [17] leverages its strong nonlinear fitting capabilities and high-dimensional feature processing ability to precisely establish a mapping relationship between fused features and matching schemes; simultaneously, it employs regularization strategies and feature importance evaluation to reduce the risk of overfitting and enhance the model’s generalization performance. The overall model architecture is illustrated in Figure 3:
The specific implementation steps are described as follows:
For the concatenated feature vector , XGBoost makes predictions by integrating K regression trees:
Where:
: represents the feature vector of the i-th sample;
: is the probability predicted by the model;
: is the total number of regression trees;
: represents the output score of the k-th tree for category c.
The objective function is:
Where:
: represents the true label of sample i indicating whether it belongs to category c;
: is the number of leaf nodes in a single tree;
: is the 6-dimensional weight of the j-th leaf node;
: is the regularization coefficient for the number of leaves;
: is the L2 regularization coefficient. N is the number of samples.
Second-order Taylor expansion approximation (at the t-th iteration):
Where:
: represents the gradient vector of the i-th sample;
: represents the Hessian diagonal elements of the i-th sample.
Gradient and Hessian matrix (cross-entropy loss):
Where:
: represents the prediction probability vector for the previous rounds.
Closed-form solution for leaf weights:
Where:
: is the identity matrix.
Splitting gain:
Final category decision:
2.4. Model Hyperparameter Settings
The hyperparameter settings for the modules of BERT, BiLSTM and XGBoost are shown in Table 1:
3. Simulation Experiments and Result Analysis
3.1. Data Acquisition
This paper collects actual flight training samples from Ruicheng General Aviation Airport in recent years, including controller characteristics, pilot characteristics, airspace restrictions, aircraft position, altitude, speed, remaining fuel, allocation schemes, and scheme evaluation results (correct/incorrect). After data cleaning and screening, a total of 4,995 valid samples are obtained.
This dataset has a relatively small to medium sample size for deep neural network models such as BERT and BiLSTM. Although XGBoost’s regularization mechanism helps mitigate the overfitting risk associated with limited samples to some extent, the constrained total number of samples still results in objective limitations, including insufficient learning depth and weak generalization capability.
To mitigate this limitation, we employ a data augmentation strategy that generates simulated tower control samples based on actual flight operation logs. Specifically, we apply controlled perturbations to the real samples—including variations in aircraft initial positions (±5% in spatial coordinates), speed profiles (±10%), and controller response times (±2 seconds)—while preserving the underlying conflict geometry and allocation scheme labels. This approach yields physically plausible variations that expand the coverage of the feature space without introducing unrealistic scenarios. The augmented dataset comprises 14,985 samples in total, with the distribution of each allocation scheme classification maintained at ratios consistent with the original data to avoid class imbalance.
The dataset is divided into training set, validation set and test set according to the ratio of 7:1.5:1.5, with no overlap between different sets.
3.2. Feature Extraction Comparative Analysis
To verify the optimization effect of the BERT-BiLSTM hybrid model, this paper carries out experimental analysis from two dimensions: feature separability and noise robustness.
The ratio of inter-class dispersion to intra-class dispersion [18] allows for a straightforward assessment of how well the features extracted by the model distinguish between different categories. The calculation process of the ratio of inter-class dispersion to intra-class dispersion is as follows:
Calculate the within-class dispersion matrix :
Calculate the between-class dispersion matrix :
The ratio of inter-class dispersion to intra-class dispersion :
Where:
: represents the number of categories;
: represents the number of samples in the i-th category;
: represents the total number of samples;
: represents the j-th feature vector of the i-th category;
: represents the mean vector of the i-th category;
: represents the total mean vector of all samples globally.
The separability indicators of the BERT model and the BERT-BiLSTM model are shown in Table 2:
It can be seen from Table 2 that the inter-class/intra-class dispersion ratio of the BERT-BiLSTM model reaches 0.230, which is about 34% higher than that of the single BERT model (0.172). This indicates that the BERT-BiLSTM hybrid model has better feature extraction ability and discrimination performance, and improves the accuracy of sample information feature extraction.
To verify the feature noise robustness optimization effect of the BERT-BiLSTM model, this paper uses the t-distributed stochastic neighbor embedding (t-SNE) algorithm [19] for noise robustness analysis. t-SNE is a nonlinear dimensionality reduction visualization algorithm for high-dimensional data. t-SNE characterizes the similarity of local neighborhoods using a Gaussian distribution, and the similarity of low-dimensional embeddings using a long-tailed t-distribution. It performs gradient optimization using the KL divergence loss, clustering similar samples in the high-dimensional space into groups, and separating different category samples from each other. Unlike linear dimensionality reduction methods such as Principal Component Analysis (PCA) [20], t-SNE can capture the curved and tangled manifold distribution of high-dimensional data. In this paper, t-SNE is used to reduce the features extracted by BERT and BERT-BiLSTM to two dimensions, and the visualization results are shown in Figure 4:
As shown in Figure 4, the features extracted by BERT show loose internal distribution in some clusters, with blurred boundaries and overlapping boundaries between partial clusters. In addition, there are many isolated points at the bottom and sides, indicating insufficient aggregation of some category samples. The reason is that BERT only captures static semantics through self-attention, and has insufficient modeling ability for temporal dependence and sequential association in text context. The feature vectors of similar texts have large differences, leading to weak clustering convergence effect after dimensionality reduction.
In contrast, the intra-cluster aggregation of BERT-BiLSTM features is significantly improved: samples inside each cluster are highly dense and tightly aggregated, with compact cluster structure and clearer inter-cluster boundaries. The inter-cluster separability is stronger, and there are obvious intervals between different clusters, with almost no overlapping or adhesion between clusters. This demonstrates that BiLSTM deeply mines the bidirectional temporal context information of text, compensates for the shortcomings of BERT, and further widens the feature vector distance between different categories, making the category discrimination boundary clearer.
Compared with the obvious isolated outliers at the bottom of the BERT feature space visualization, there are few scattered samples deviating from the main clusters in the BERT-BiLSTM feature space. To complement the qualitative t-SNE visualization, we computed the silhouette coefficient for both feature sets. The BERT-extracted features yield a silhouette score of 0.026, indicating moderate cluster separation, whereas the BERT-BiLSTM features achieve a significantly higher score of 0.041. This 58% improvement quantitatively confirms the enhanced intra-cluster cohesion and inter-cluster separation observed in the t-SNE plots, demonstrating that the BERT-BiLSTM hybrid model effectively improves feature discrimination ability and representation robustness.
3.3. Ablation Experiment
Following the completion of feature extraction optimization validation, this paper conducts ablation experiments to systematically evaluate the functional value and design rationality of each core module in the BERT-BiLSTM-XGBoost model, quantify the contribution of different components to the final matching performance, and avoid ineffective stacking or redundant design of the model architecture. In these experiments, key components of the model are removed or replaced one by one, and the performance differences between the full model and each ablation baseline are compared. The results of these ablation experiments are presented in Table 3:
The ablation results reveal several important insights. First, replacing the end-to-end classification layers of BERT and BiLSTM with XGBoost improves accuracy by 10.4 and 7.7 percentage points, respectively (BERT: 84.0% → BERT-XGBoost: 94.4%; BiLSTM: 82.8% → BiLSTM-XGBoost: 90.5%). This confirms that XGBoost’s regularization mechanism effectively mitigates overfitting in small-sample scenarios, a critical advantage over standalone neural network classifiers.
Second, the text-only model (BERT-XGBoost, 94.4%) outperforms the time-series-only model (BiLSTM-XGBoost, 90.5%) by 3.9 percentage points. This suggests that semantic information—particularly controller characteristics, pilot profiles, and airspace constraints—carries stronger discriminative power for allocation scheme matching than raw trajectory data alone, validating the core premise of incorporating textual features.
Third, the full multimodal model (BERT-BiLSTM-XGBoost, 97.2%) achieves the highest accuracy, surpassing both single-modality variants. The 2.8 percentage-point improvement over the text-only model and 6.7 percentage-point improvement over the time-series-only model demonstrate that the two modalities provide complementary information: textual features capture contextual decision factors while temporal features encode the dynamic evolution of conflicts. Their fusion yields a more comprehensive representation than either modality alone.
3.4. Matching Performance Analysis
On After completing the ablation experiment, to further verify the superiority of the proposed model, this paper selects Naive Bayes (generative model), linear SVM (discriminative model) and LightGBM (ensemble learning method with balanced accuracy and generalization ability) for comparative analysis. To comprehensively evaluate the classification performance of the models, this paper carries out systematic analysis from three dimensions: confusion matrix comparison, matching accuracy comparison, and ROC curve comparison:
The confusion matrix is used to intuitively show the prediction performance of the classification model on each category. The confusion matrix comparison of the four methods is shown in Figure 5:
The comparison table of matching accuracy is shown in Table 4:
From the confusion matrix comparison chart and the matching accuracy comparison table, it can be seen that the BERT-BiLSTM-XGBoost hybrid model has outstanding performance in all indicators. Compared with the Naive Bayes, Linear SVM, and LightGBM methods, the accuracy has increased by 46.4%, 22.5%, and 0.8% respectively. Although the LightGBM model also shows good performance, considering the limited-size dataset, using the LightGBM model is prone to overfitting. However, the XGBoost model effectively suppresses noise fitting and mitigates overfitting when handling small datasets, resulting in more stable accuracy on the validation set; moreover, the hybrid model demonstrates superior performance in both feature extraction accuracy and semantic understanding, and can output feature importance scores, thereby meeting explainability requirements and better aligning with real-world application needs.
To understand the limitations of the proposed model, we analyzed the misclassified samples in the test set.The most frequent error involves confusion between Scheme 2 (altitude change) and Scheme 5 (flight path change), accounting for 43% of all misclassifications. Manual inspection of these cases indicates that the ambiguity typically arises when an aircraft is approaching runway: both altitude and flight path adjustment are viable conflict resolution strategies, and the distinction often depends on subtle factors such as personal habit and traffic volume—information that is not always fully captured in the current feature set.
Interestingly, errors are disproportionately concentrated in samples with controller experience of less than 5 years (85% of misclassifications), suggesting that the model’s training labels—derived from actual controller decisions—may themselves contain inconsistencies when less experienced controllers are involved. This observation aligns with the simulation results in Section 4, where less experienced controllers showed lower acceptance rates of the model’s recommendations.
These findings point to two directions for future improvement: (1) incorporating additional contextual features, and (2) refining the labeling process by involving multiple expert controllers to establish consensus-based ground truth for ambiguous scenarios.
The Receiver Operating Characteristic (ROC) curve is an important tool for evaluating the performance of classification models. Essentially, it is designed for binary classification, but through extension methods, it can be fully applied to the evaluation of 6-class problems [21]. The comparison diagram of the ROC curves of the four methods is shown in Figure 6:
From the ROC curve comparison diagrams of the four methods, the model in this paper performs the best, with an AUC value of 0.9953. The AUC values of Naive Bayes, Linear SVM, and LightGBM are 0.5085, 0.7861, and 0.9917 respectively. The AUC value is a quantification of the ROC curve, which can reflect the probability that the model gives high scores to positive samples and is more capable of reflecting the true level of the model than accuracy. This indicates that the model in this paper is a more ideal choice and is suitable for scenarios with high classification accuracy requirements in general aviation tower control.
3.5. Timeliness Analysis
When the accuracy meets the requirements, the computing speed is also a key evaluation indicator for the model performance. The comparison table of computing speeds between this model and the LightGBM model is shown in Table 5:
As can be seen from Table 5, the training speed of BERT-BiLSTM-XGBoost is nearly twice as fast as that of LightGBM. After the training is completed, although the inference speeds of both BERT-BiLSTM-XGBoost and LightGBM reach the millisecond level, BERT-BiLSTM-XGBoost is 1.5 times as fast as LightGBM, demonstrating a significant speed advantage. This indicates that the BERT-BiLSTM-XGBoost automatic matching model proposed in this paper fully meets the actual operational requirements in terms of computing speed.
4. Model Application Analysis
To further verify the reliability of the model proposed in this paper, seventy general aviation tower controllers with different years of experience are selected for simulated control tests. By comparing the decision-making time and compliance handling accuracy of the tower controllers in the preset conflict scenarios under the conditions of no model support and with the support of the model (trained on collected samples), the auxiliary role of the model is examined. In addition, the acceptance rate of the controllers towards the allocation scheme is also regarded as an important evaluation dimension. Through this indicator, the practical value of integrating personnel characteristic features in improving the adaptability of the allocation schemes is verified.
Table 6 shows the classification of work experience and the average number of sorties by 70 general aviation tower controllers.
The results of the simulation control test are shown in Table 7:
Several patterns emerge from the simulation results. First, the model’s effectiveness exhibits a clear experience-dependent gradient: for controllers with 5+ years of experience, the model reduces decision time by 75–80% and achieves near-perfect (100%) compliance accuracy; for those with less than 5 years, the reduction is 60–70% and compliance accuracy improves but remains below 90%. This gradient likely reflects the fact that experienced controllers possess stronger situation awareness to interpret and trust the model’s recommendations, whereas novice controllers may lack the confidence to act on algorithmic suggestions.
Second, the acceptance rate of the automatically matched schemes correlates strongly with both controller experience and the accuracy of compliance decisions. This correlation suggests that acceptance is not merely a matter of trust but is grounded in the perceived correctness of the recommendations—controllers are more likely to adopt suggestions that they independently recognize as appropriate.
Third, the fact that even novice controllers benefit from the model (decision time reduced to 1/3–1/4 of baseline) indicates that the model serves a valuable decision-filtering function: even when controllers do not fully accept the specific recommendation, the model narrows the feasible option space, reducing cognitive load and accelerating the decision process.
The results of this simulation test show that the BERT-BiLSTM-XGBoost automatic matching model can significantly shorten the decision-making time for tower controllers, effectively reduce the errors in tower control caused by human experience bias, improve the accuracy of tower control, and provide strong support for tower controllers to implement flight training tower control.
5. Conclusions
To This paper has proposed a BERT-BiLSTM-XGBoost automatic matching model for general aviation tower control allocation schemes. The main contributions are threefold:
(1) reformulating conflict resolution as an allocation scheme matching task that better aligns with controllers’ cognitive processes;
(2) establishing a multimodal feature fusion framework that integrates textual semantics (controller/pilot characteristics, airspace constraints) with time-series operational data;
(3) introducing XGBoost with regularization to address small-sample overfitting while providing feature importance scores for decision traceability.
Experimental results demonstrate that the proposed model achieves 97.2% matching accuracy, outperforming baseline methods, and reduces controller decision-making time by 75–80% in simulated tests. The ablation study confirms the complementary value of textual and temporal features, while error analysis reveals that ambiguity among confusing schemes remains the primary challenge.
Several limitations should be acknowledged. The model’s performance is contingent on the quality and coverage of the training data, and its effectiveness for controllers with limited experience requires further investigation. Future work will focus on:
(1) incorporating critical indicators to resolve the primary ambiguity identified in error analysis;
(2) developing a consensus-based labeling protocol involving multiple expert controllers to establish more reliable ground truth;
(3) extending the framework to multi-aircraft coordination scenarios and evaluating its scalability in high-density operations.
Author Contributions
Conceptualization, Y.R. and G.Z.; methodology, Y.R. and G.Z.; software, Y.R. and J.W.; validation, M.W. and B.Y.; formal analysis, Y.R.; investigation, Y.T.; data curation, Y.R. and G.Z.; writing—original draft preparation, Y.R; writing—review and editing, G.Z.; visualization, Y.R and Y.C;. All authors have read and agreed to the published version of the manuscript.
Funding
This research received no external funding.
Data Availability Statement
The data presented in this study are available from the corresponding author upon request.
Conflicts of Interest
The authors declare no conflicts of interest.
Abbreviations
The following abbreviations are used in this manuscript:
| BERT | Bidirectional Encoder Representations from Transformers |
| BiLSTM | Bidirectional Long Short-Term Memory |
| XGBoost | Extreme Gradient Boosting |
| KL | Kullback–Leibler |
| T-SNE | t-Distributed Stochastic Neighbor Embedding |
| ROC | Receiver Operating Characteristic |
References
- Bastas, A.; Vouros, A. G. Data-Driven Modeling of Air Traffic Controllers’ Policy to Resolve Conflicts [J]. Aerospace 2023, 10(6), 557. [Google Scholar] [CrossRef]
- Chen, B.; Li, Z. M.; Xu, S. T.; et al. A General Airport Conflict Detection and Intelligent Resolution Method Based on GAN-LSTM [J]. Transp. Res. 2026, 12(1), 70–79. [Google Scholar]
- Qin, L. R. Research on Integrated Airspace Conflict Detection and Resolution Based on Flight Conflicts [D]; Civil Aviation Flight University of China: Guanghan, 2024. [Google Scholar]
- Zhang, H.; Liu, Z. Four-dimensional Aircraft Trajectory Prediction With a Generative Deep Learning and Clustering Approach[J]. J. Aerosp. Inf. Syst. 2025, 22(2), 90–102. [Google Scholar] [CrossRef]
- Wang, H. Y.; Lu, Z. Y.; Wang, Z. A Review on Deep Reinforcement Learning Methods for Flight Conflict Resolution [J]. Aeronaut. Comput. Tech. 2026, 56(1), 128–134. [Google Scholar]
- Neto, P. C. E.; Baum, M. D.; Almeida, D. R. J.; et al. Deep Learning in Air Traffic Management (ATM): A Survey on Applications, Opportunities, and Open Challenges [J]. Aerospace 2023, 10(4), 358. [Google Scholar] [CrossRef]
- Chen, L. Y.; Qin, C.; Sun, Y.; et al. Collaboration-aware Hybrid Learning for Knowledge Development Prediction[C]//Proceedings of the ACM Web Conference; ACM: New York, 2024; pp. 3976–3985. [Google Scholar]
- Fang, C. Y.; Qin, C.; Zhang, Q.; et al. RecruitPro: A Pre-trained Language Model With Skill-aware Prompt Learning for Intelligent Recruitment[C]. In //Proceedings of the 29th ACM SIGKDD Conference on Knowledge Discovery and Data Mining; ACM: New York, 2023; pp. 3991–4002. [Google Scholar]
- Guan, Z. H.; Yang, J. Q.; Yang, Y.; et al. JobFormer: Skill-aware Job Recommendation With Semantic-enhanced Transformer[J]. ACM Trans. Knowl. Discov. From Data 2024, 19(1), 1–20. [Google Scholar] [CrossRef]
- Zhang, X.; Bai, L.; Yang, L. N.; et al. Research on Intelligent Job-Applicant Matching in Hospital Recruitment Based on Self-Attention Association Relationship Modeling [J]. J. Guangxi Univ. (Natural Science Edition) 2025, 50(2), 349–360. [Google Scholar]
- Zhu, C.; Zhu, H.; Xiong, H.; et al. Person-Job Fit: Adapting the Right Talent for the Right Job[J]. ACM Trans. Manag. Inf. Syst. 2018, 9(3), 1–17. [Google Scholar]
- Boškoski, P.; Perné, M.; Rameša, M.; et al. Variational Bayes Survival Analysis for Unemployment Modelling[J]. Knowl.-Based Syst. 2021, 229, 1–11. [Google Scholar] [CrossRef]
- Liang, Y.; Peng, Q. R.; Wang, D. B.; et al. Intelligence Education and Talent Cultivation Based on the Analysis of Job Requirements for Data Science [J]. Inf. Sci. Theory Appl. 2021, 44(2), 8–15, 25. [Google Scholar]
- Wang, Z. Y.; Zhang, X. C.; Zhang, X. Q.; et al. Extraction Method for Aviation Accident Reports Based on Dual-loop BERT[J]. J. Dalian Univ. Technol. 2026, 66(4), 331–341. [Google Scholar]
- Zuo, Y. Q. Research on Job-Position Matching Method Based on BiLSTM and XGBoost [D]; Dalian University of Technology: Dalian, 2022. [Google Scholar]
- Chen, S.; Pan, W.; Wang, Y.; et al. Research on the Method of Air Traffic Control Instruction Keyword Extraction Based on the Roberta-Attention-BiLSTM-CRF Model [J]. Aerospace 2025, 12(5), 376. [Google Scholar] [CrossRef]
- Chen, T. Q.; Guestrin, C. XGBoost: A Scalable Tree Boosting System[C]. In Proceedings of the 22nd ACM SIGKDD International Conference on Knowledge Discovery and Data Mining; ACM: New York, 2016; pp. 785–794. [Google Scholar]
- Shen, W. Q.; Liang, Z. H.; Zhang, J. B.; et al. A Dynamic Early Warning Method for Classified Information Security in Wireless Sensor Networks [J]. J. Sens. Technol. 2024, 37(12), 2148–2152. [Google Scholar]
- Mao, X. D.; Dong, H. Y.; Liang, J. P. Fault Diagnosis of Traction Rectifier Based on t-Distributed Stochastic Neighbor Embedding Fusion Optimal Multi-Band Box Dimension[J]. Trans. China Electrotech. Soc. 2025, 40(2), 532–543. [Google Scholar]
- Cao, K. Research on Handwritten Digit Classification and Recognition Technology Based on PCA Neural Network[D]; Lanzhou Jiaotong University: Lanzhou, 2018; pp. 24–36. [Google Scholar]
- Chen, Z. Application of ROC Analysis in Multi-classification Problems [D]; Guangdong University of Technology: Guangzhou, 2022. [Google Scholar]
Figure 1.
BERT Text Information Feature Extraction.
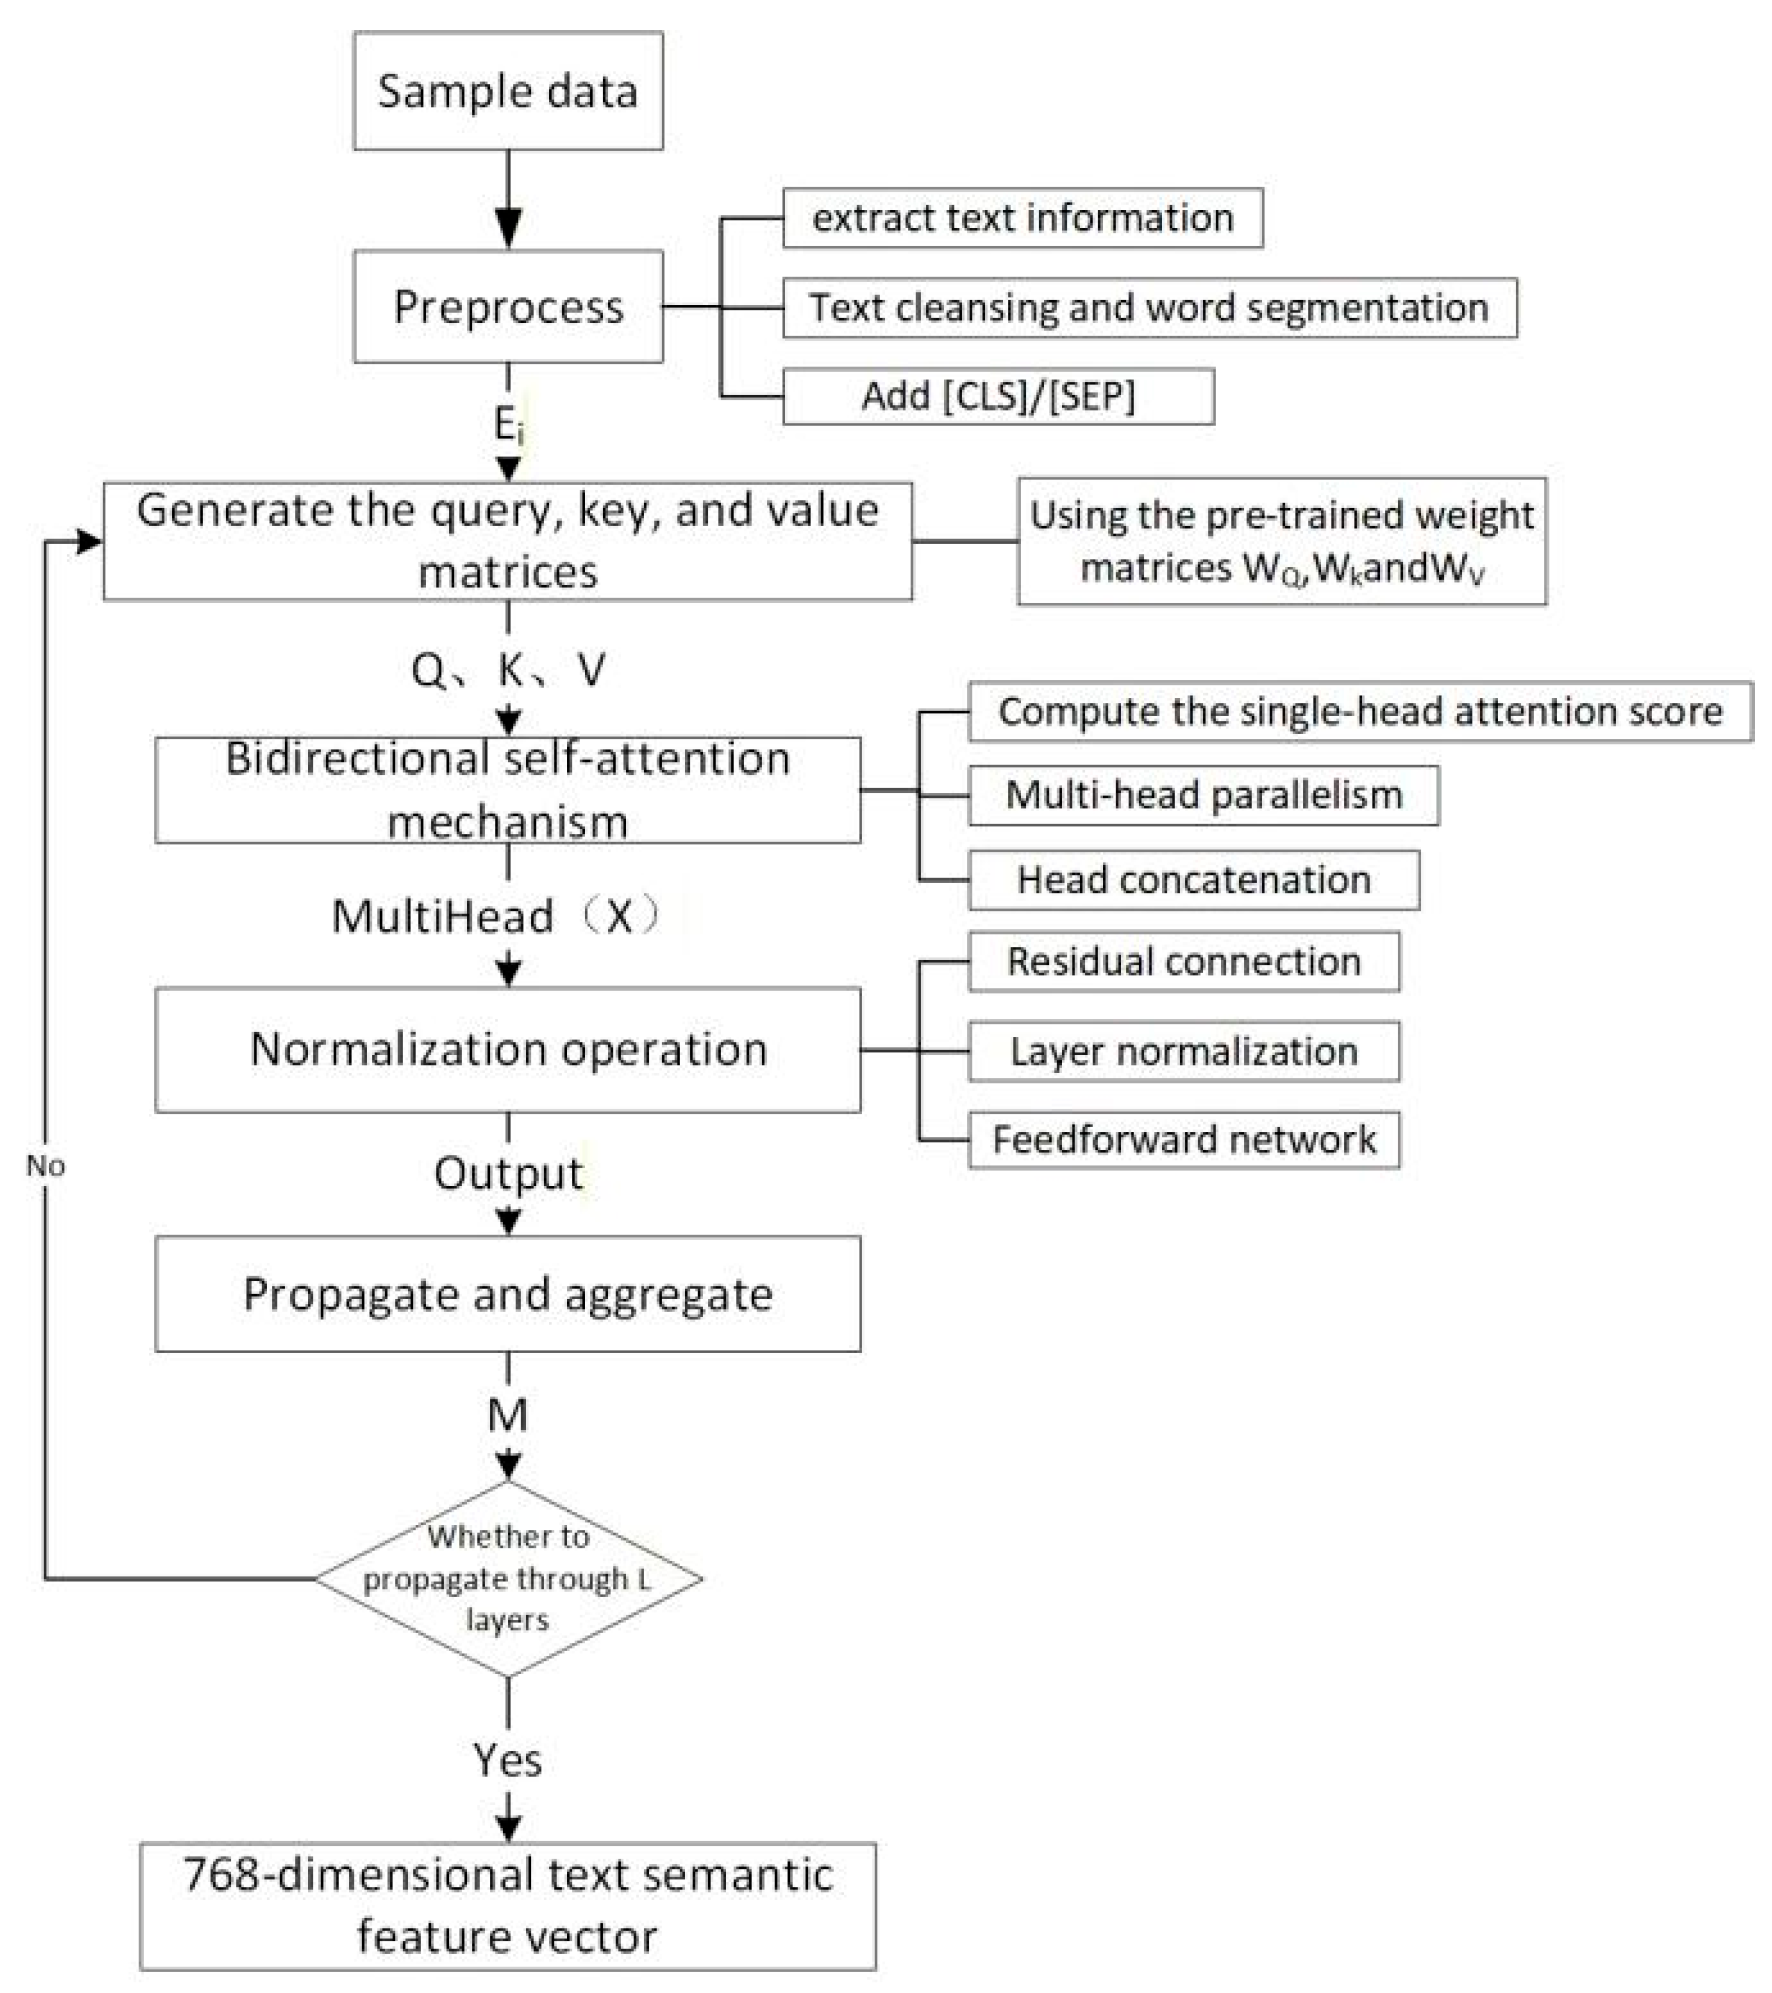
Figure 2.
LSTM unit architecture and BiLSTM framework.
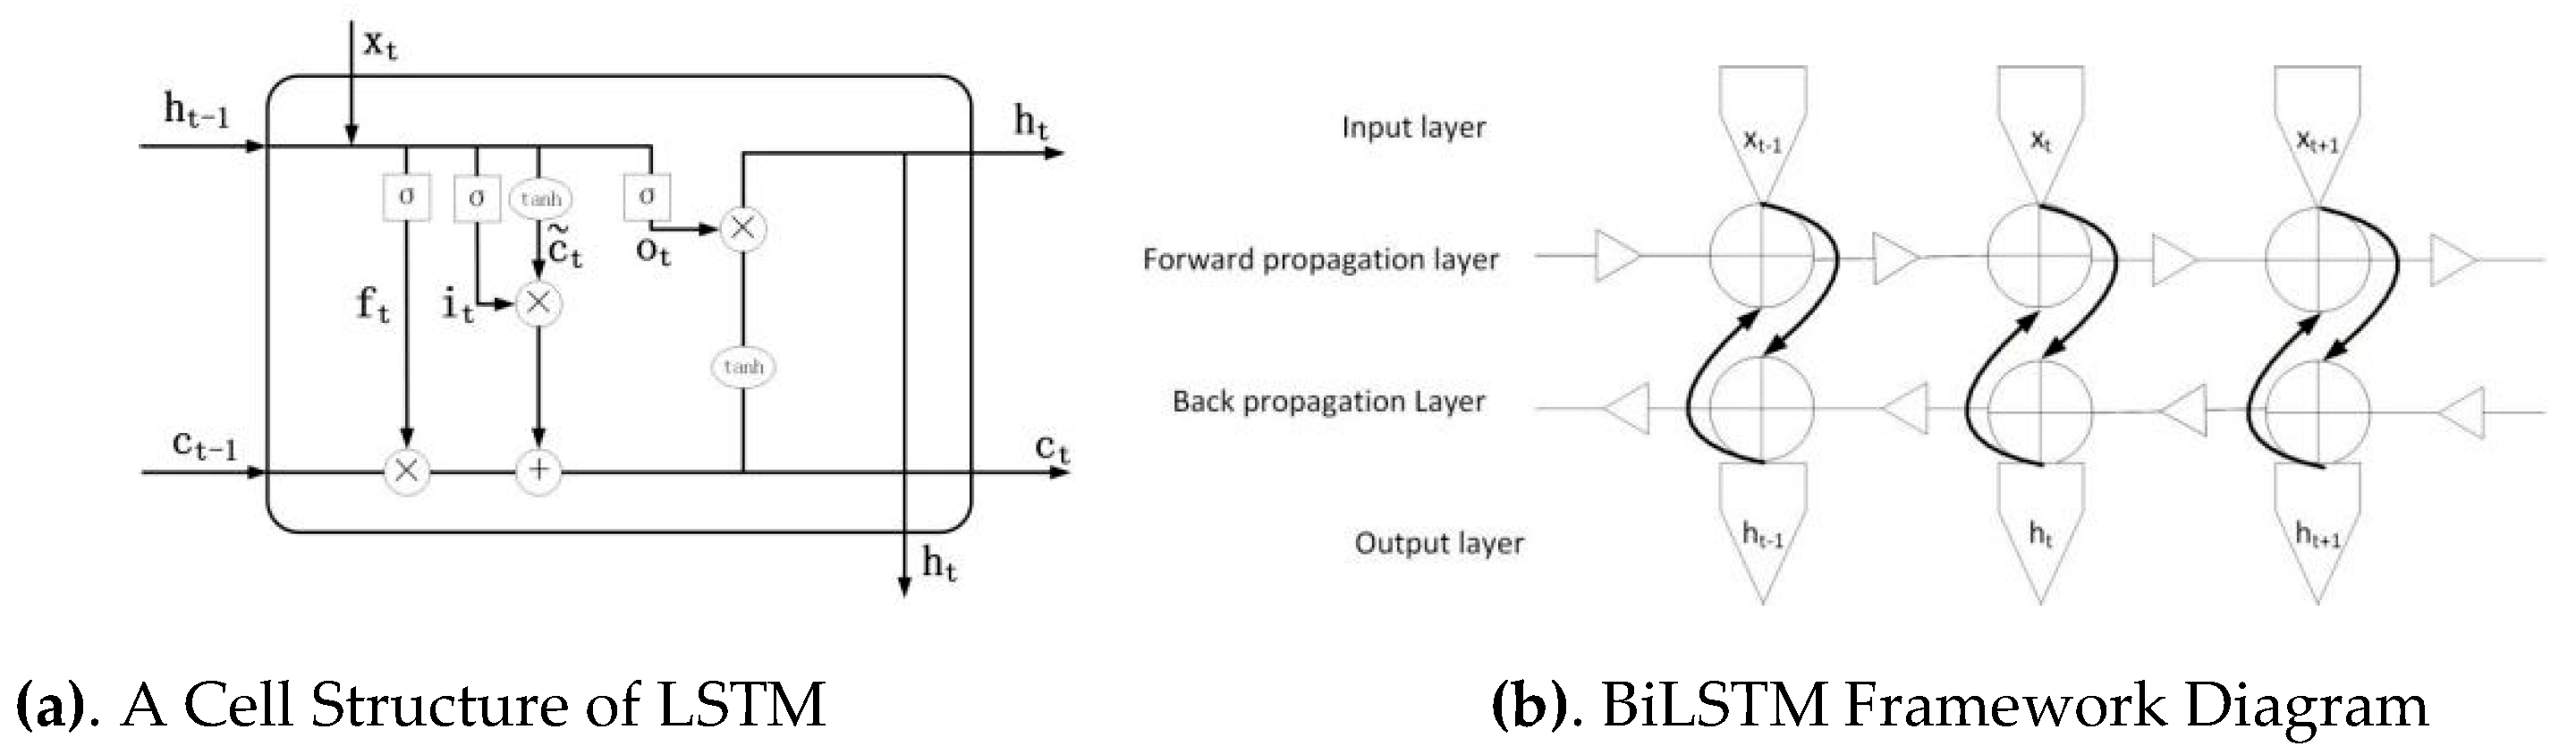
Figure 3.
Model Framework Diagram.
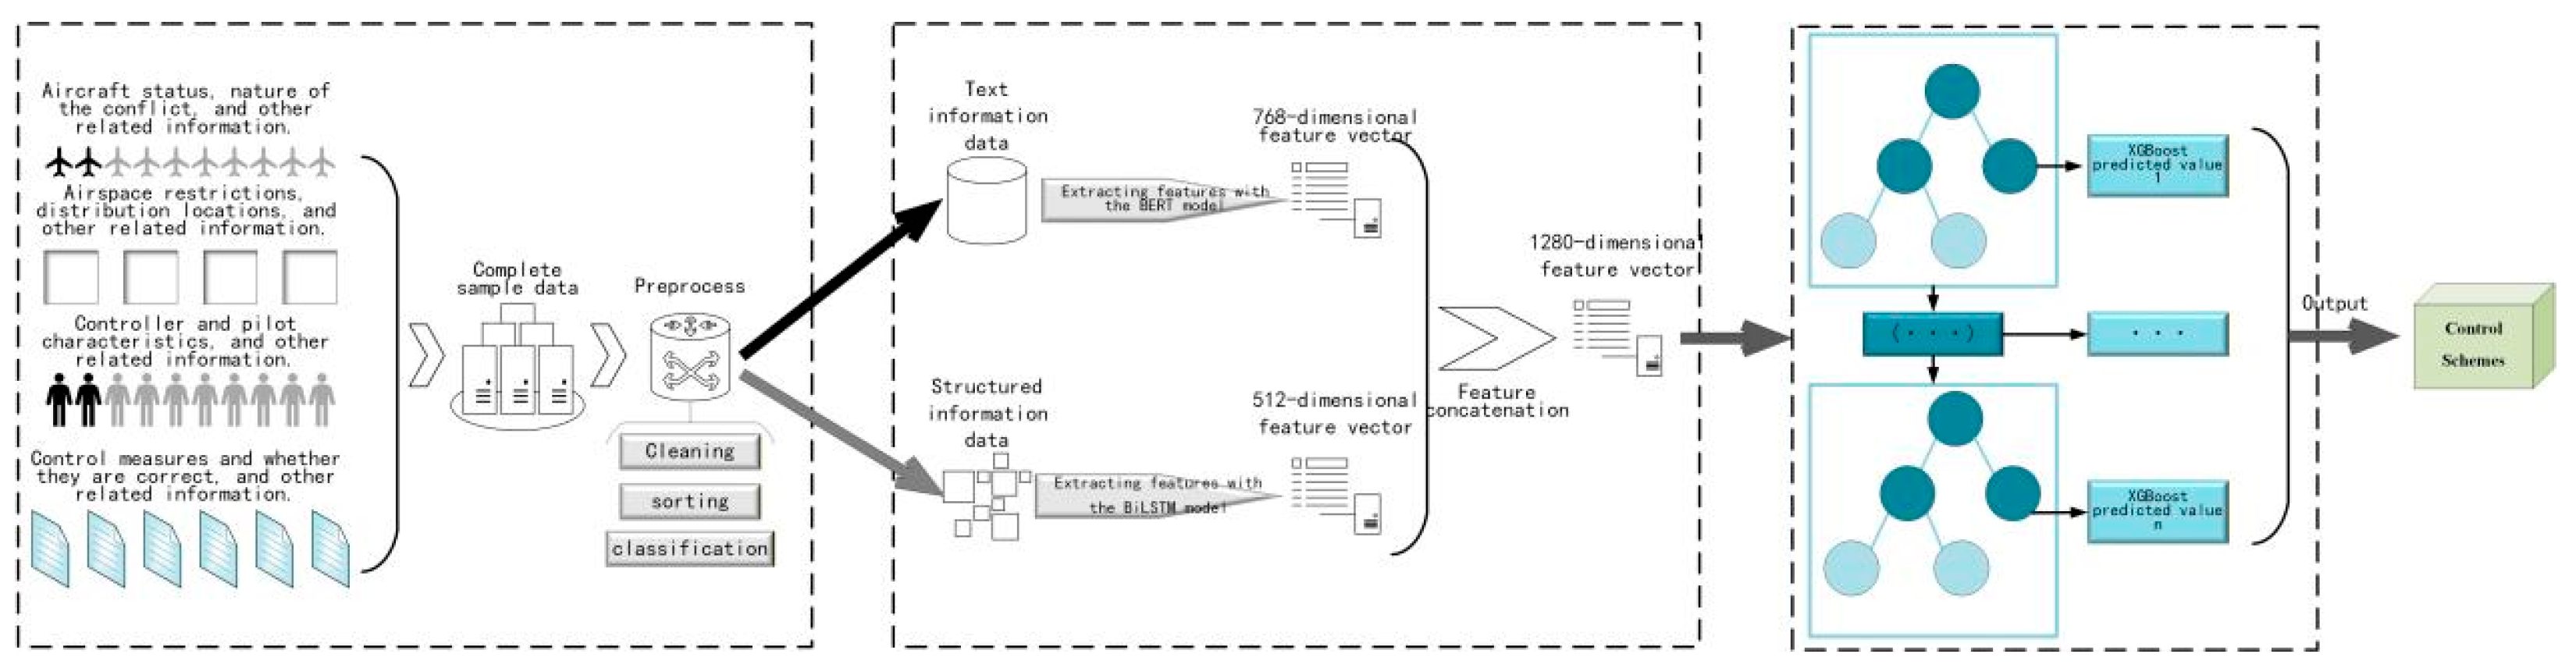
Figure 4.
Two-Dimensional Visualization Result of t-SNE.
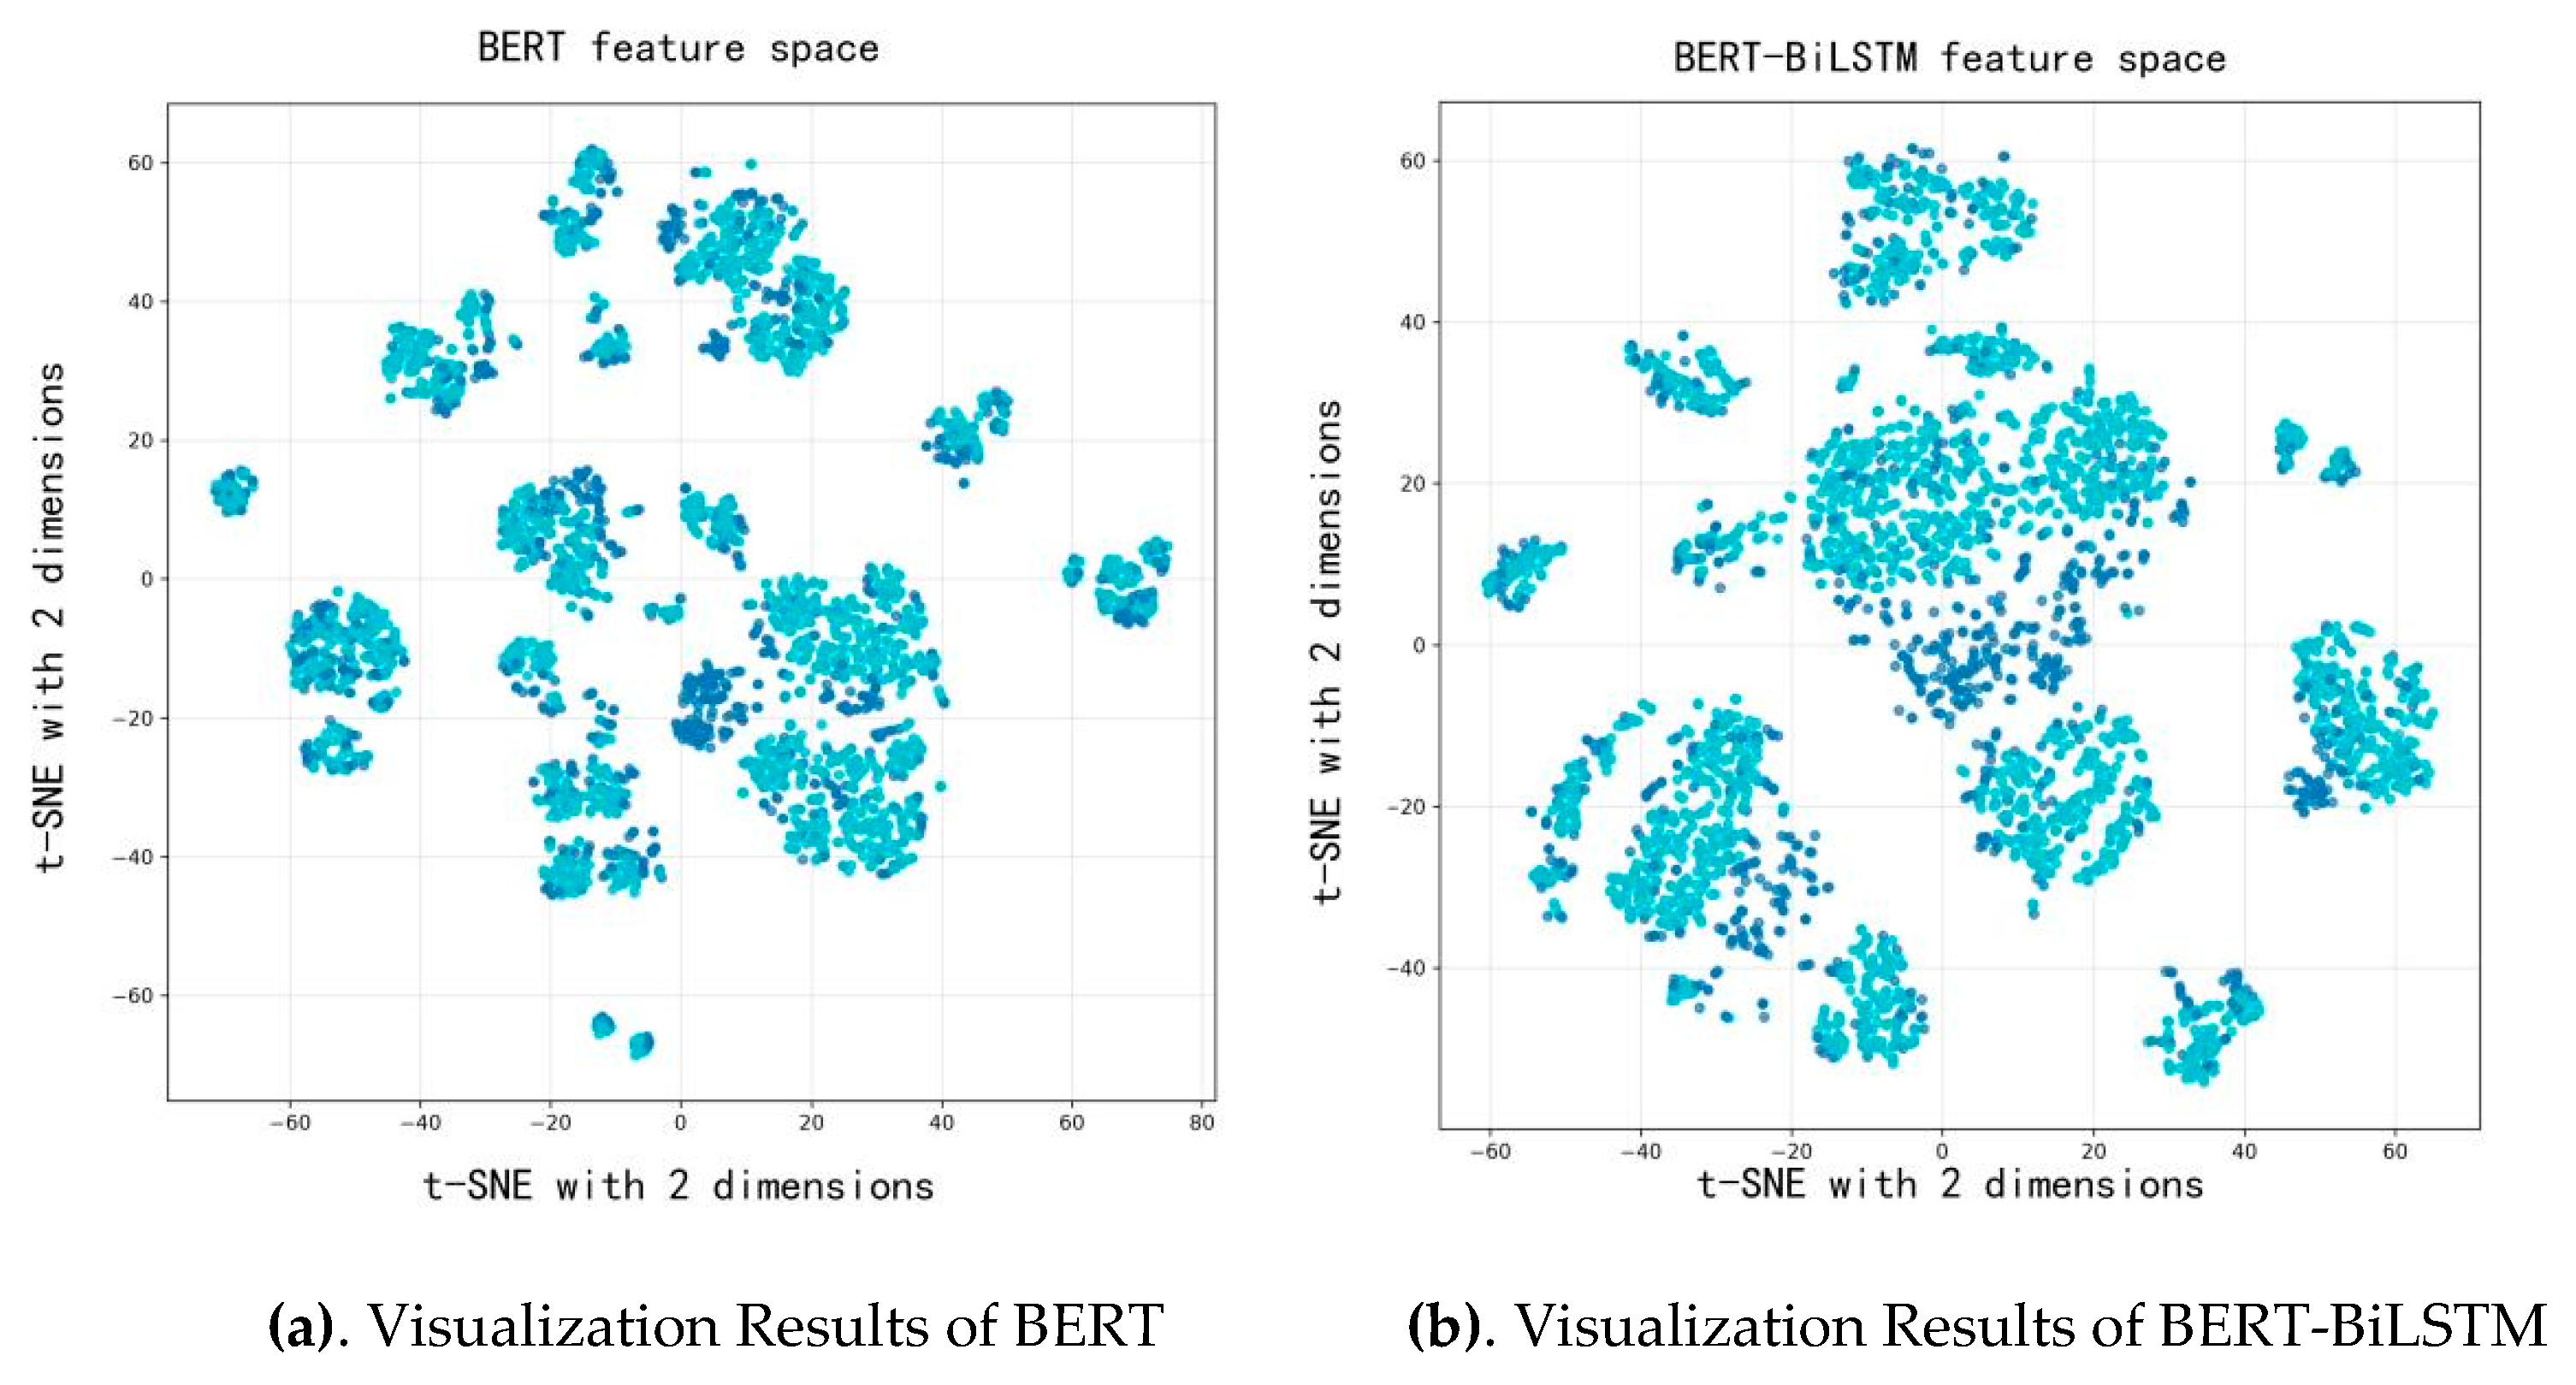
Figure 5.
Confusion Matrix Comparison of the Four Methods.
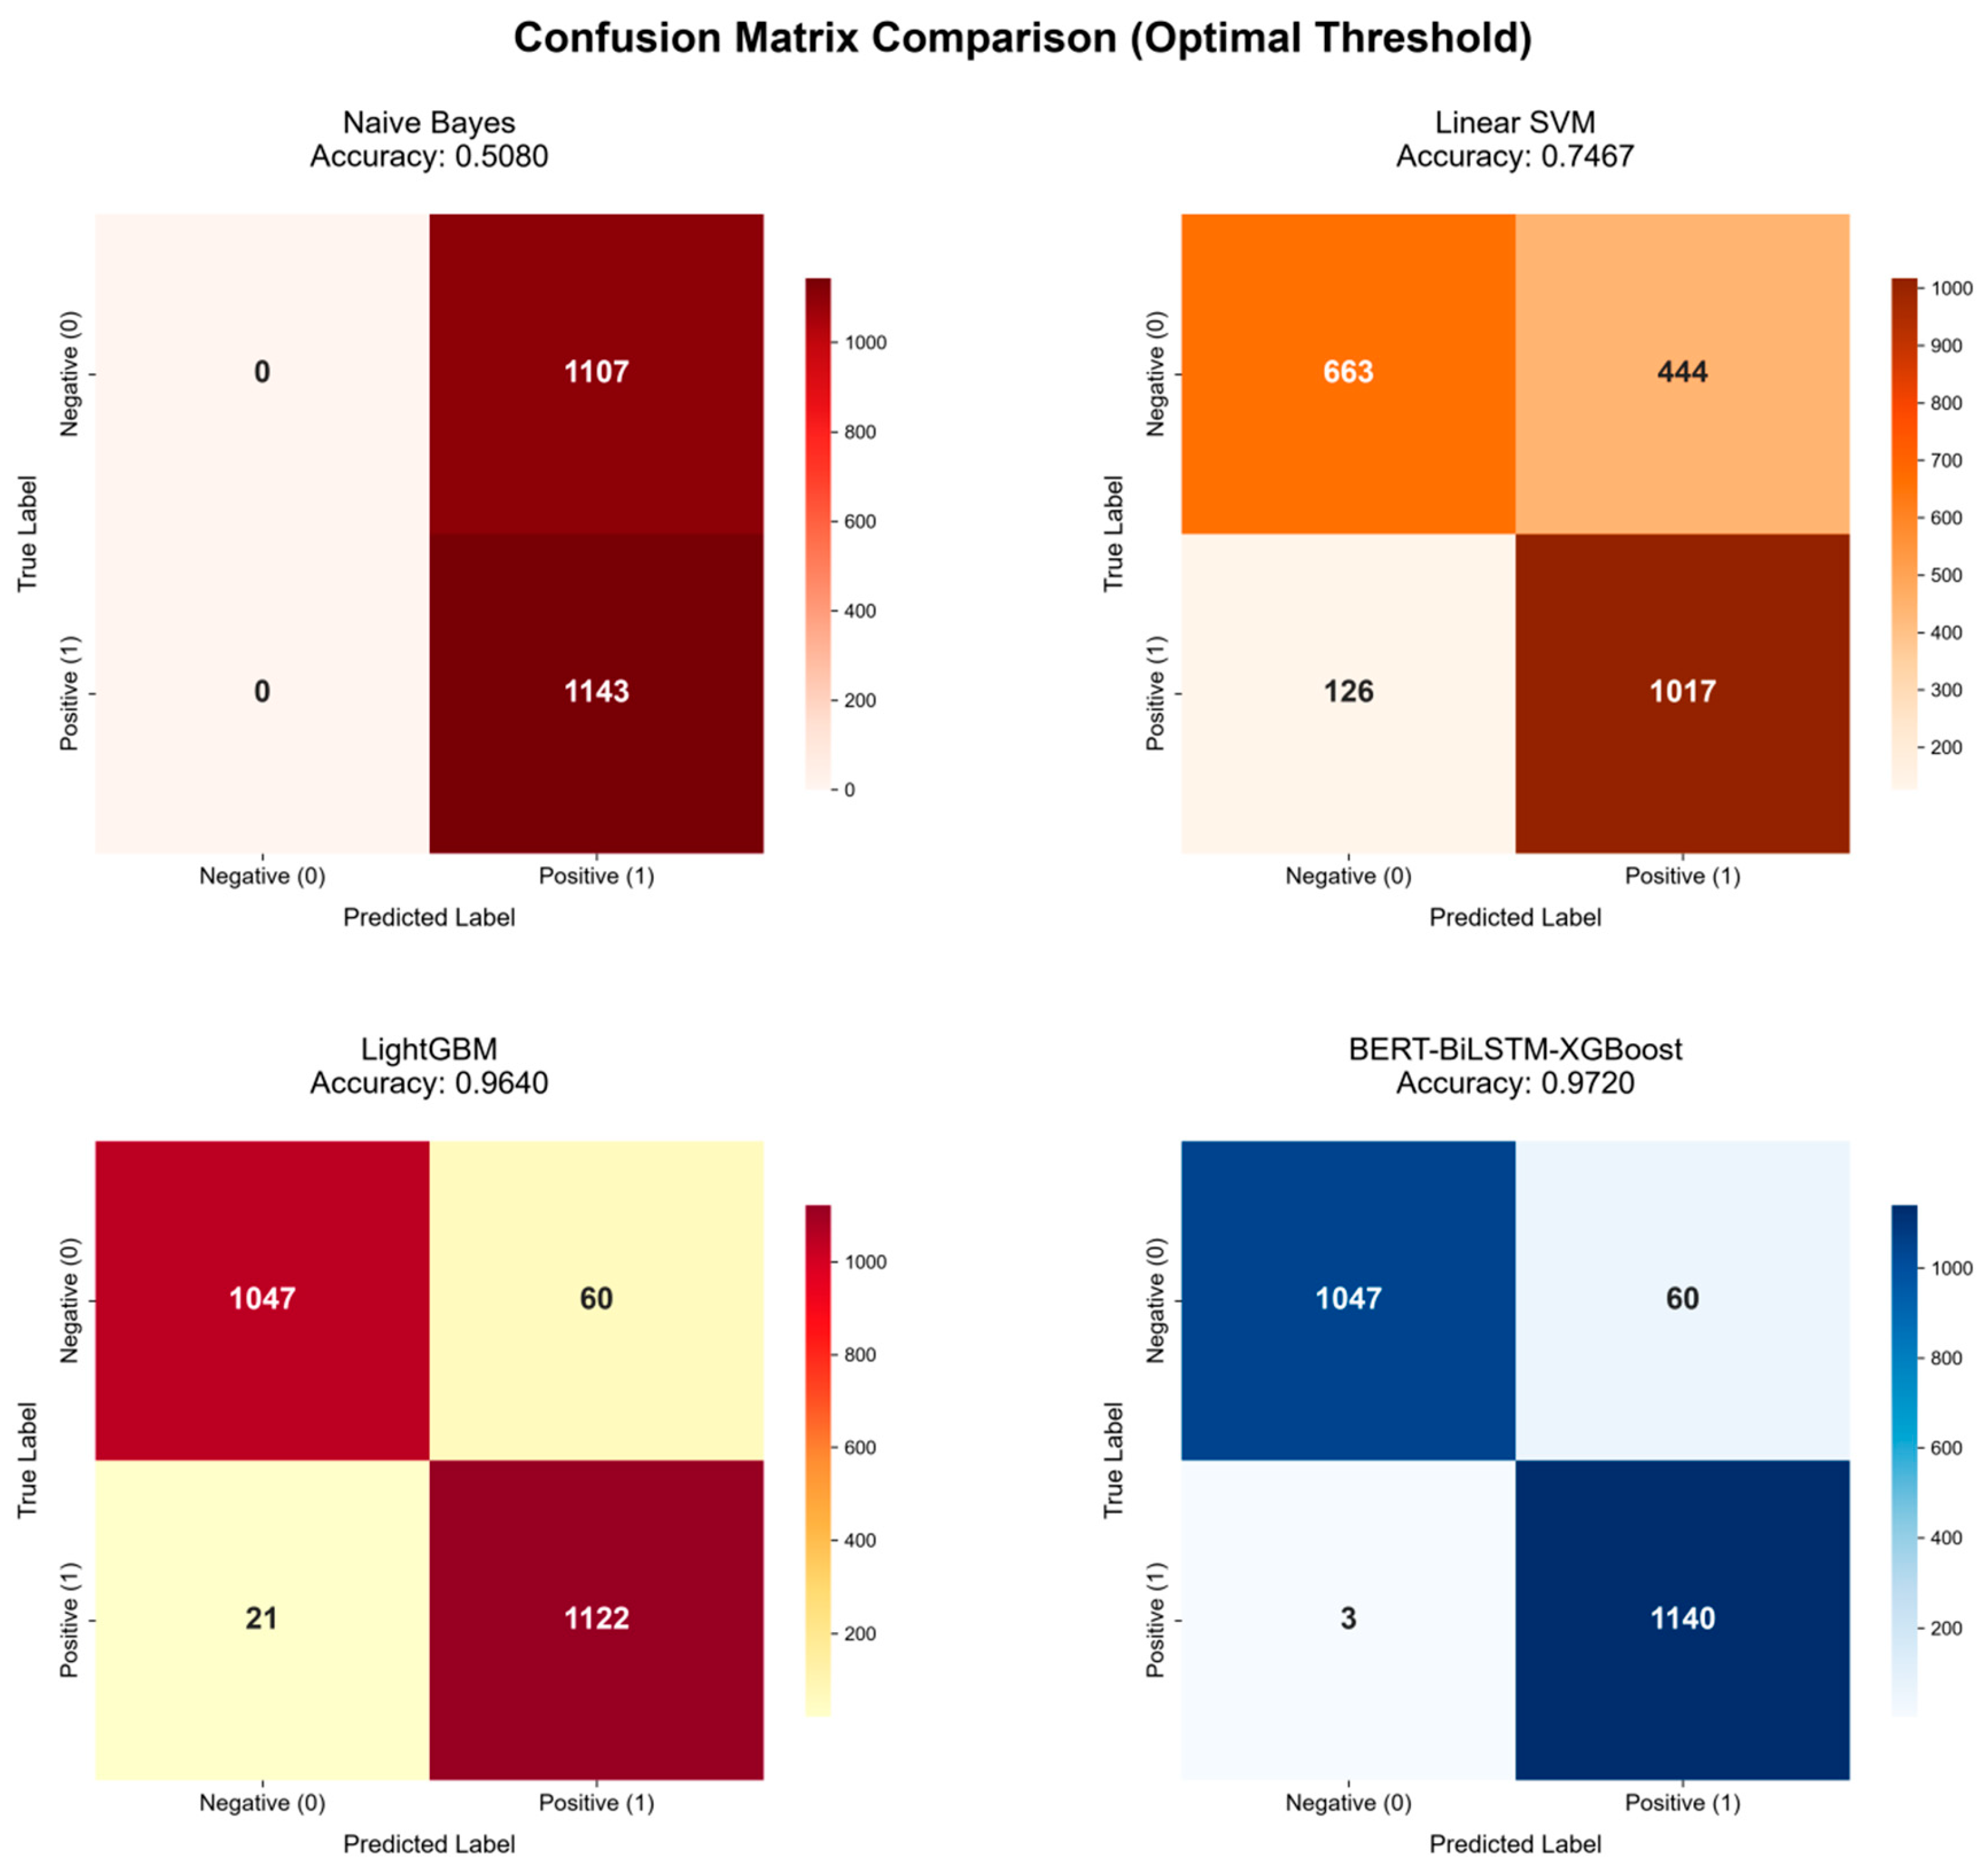
Figure 6.
Comparison Diagram of the ROC Curves of the Four Methods.
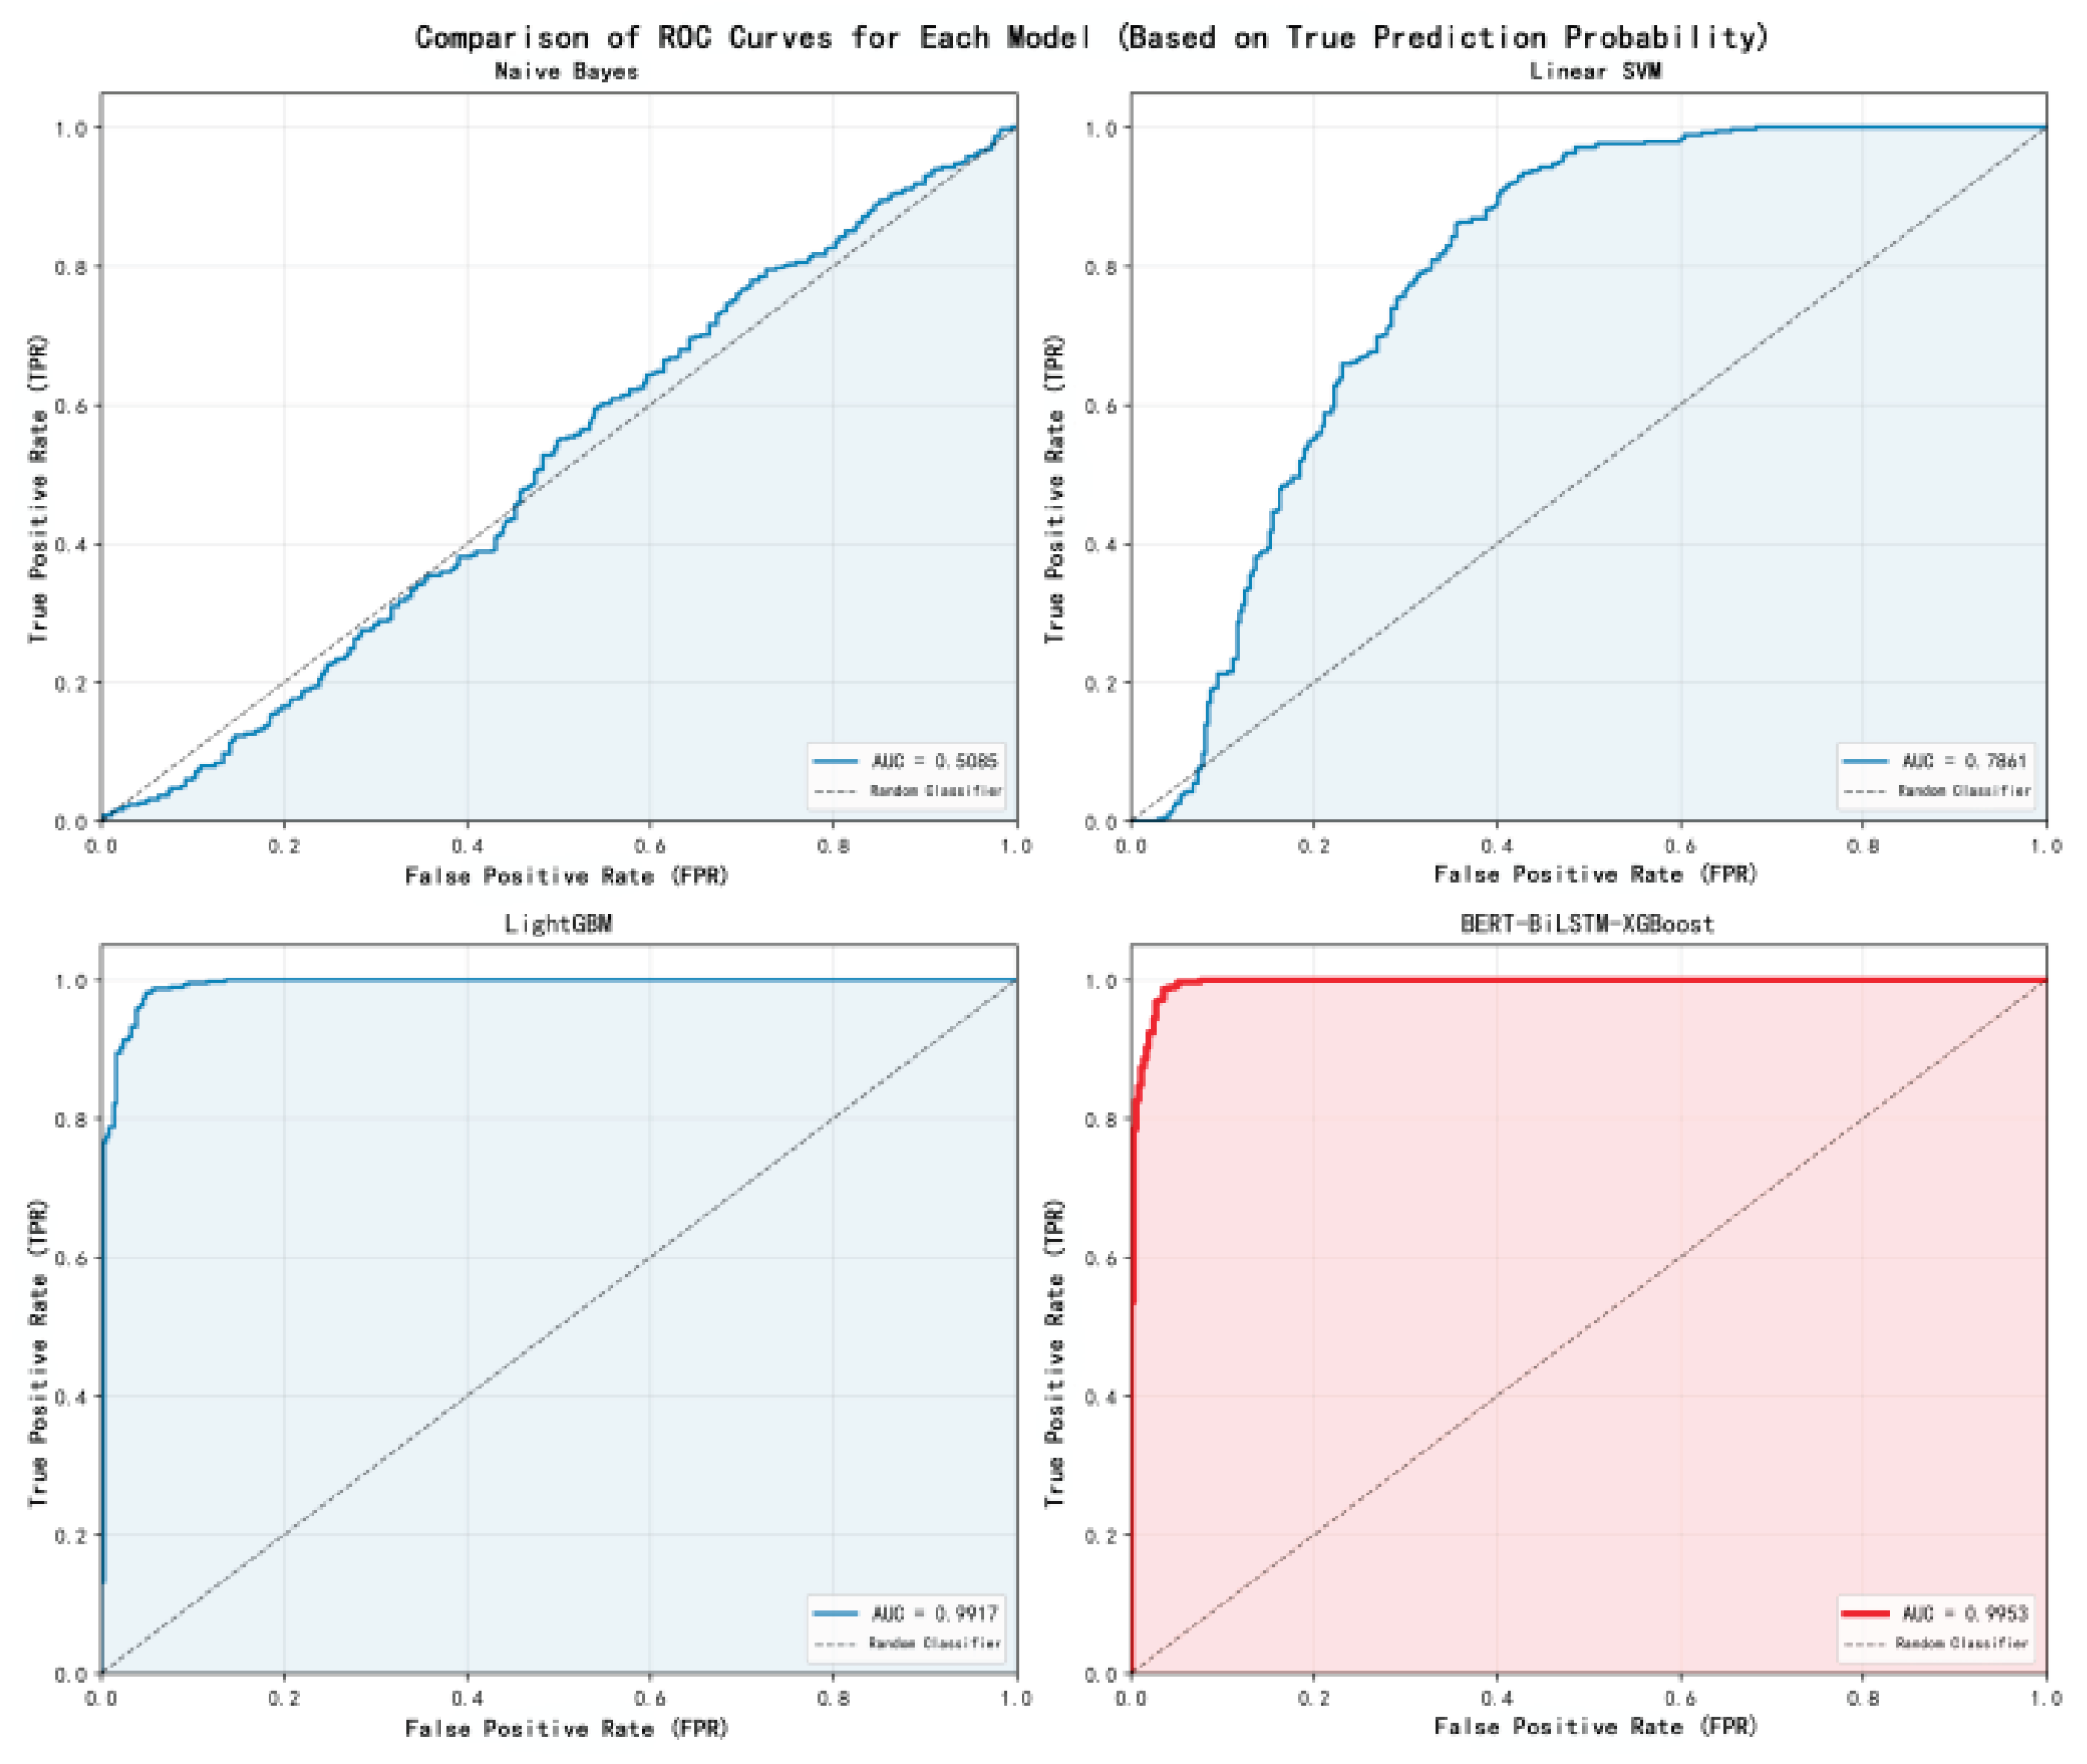

Table 1.
Hyperparameter Settings for the Modules of BERT, BiLSTM and XGBoost.
| Model | Hyperparameter | Value |
|---|---|---|
| BERT | Pre-trained Weights | bert-base-chinese |
| Maximum Sequence Length | 256 | |
| Batch Size | 16 | |
| Fine-tune Learning Rate | 2×10⁻⁵ | |
| Dropout | 0.1 | |
| Output Feature Dimension | 768 | |
| BiLSTM | Number of Hidden Units in a Unidirectional LSTM | 256 |
| Time Step Size | 20 | |
| Batch Size | 16 | |
| Dropout | 0.2 | |
| Activation Function | tanh | |
| Output Feature Dimension | 512 | |
| XGBoost | Objective Function | multi:softprob |
| Number of Categories | 6 | |
| Number of Decision Trees | 180 | |
| Maximum Tree Depth | 6 | |
| Learning Rate | 0.08 | |
| Row Sampling Ratio | 0.8 | |
| Column Sampling Ratio | 0.7 | |
| L1 Regularization Coefficient | 0.1 | |
| L2 Regularization Coefficient | 1.2 | |
| Validation Set Evaluation Metric | mlogloss | |
| Tree Construction Algorithm | hist | |
| Random Seed | 42 |
Table 2.
Separability Indicators.
| Feature Type | Inter-class/Intra-class Distance Ratio |
|---|---|
| BERT | 0.172 |
| BERT-BiLSTM | 0.230 |
Table 3.
Ablation Experiment Results.
| Model | Matching Accuracy |
|---|---|
| BERT | 84.0% |
| BiLSTM | 82.8% |
| BERT-XGBoost | 94.4% |
| BiLSTM-XGBoost | 90.5% |
| BERT-BiLSTM-XGBoost | 97.2% |
Table 4.
Matching Accuracy.
| Matching Method | Matching Accuracy |
|---|---|
| Naive Bayes | 50.8% |
| Linear SVM | 74.7% |
| LightGBM | 96.4% |
| BERT-BiLSTM-XGBoost | 97.2% |
Table 5.
Comparison Table of Computational Speed.
| Matching Method | Training Speed | Inference Speed |
|---|---|---|
| LightGBM | 3.48s | 0.006s |
| BERT-BiLSTM-XGBoost | 1.89s | 0.004s |
Table 6.
Classification of Work Experience and Average Number of Sorties.
| Classification of Work Experience | Number of People | Average Number of Sorties |
|---|---|---|
| 1 year | 10 | 30 |
| 2 years | 10 | 80 |
| 3 years | 10 | 150 |
| 4 years | 10 | 220 |
| 5 years | 10 | 300 |
| 6 years | 10 | 360 |
| more than 6 years | 10 | 500 |
Table 7.
Simulation Control Test Results.
| Classification of Work Experience | Number of Conflict Scenarios | Average Total Time for Decision-Making in Tower Control (without model support) | Average Total Time for Decision-Making in Tower Control (with model support) | Average Accuracy of Compliance Decisions (without model support) | Average Accuracy of Compliance Decisions (with model support) | Average Acceptance Rate of Automatic Matching and Allocation Schemes |
|---|---|---|---|---|---|---|
| more than 6 years | 15 scenarios | 820s | 220s | 87% | 100% | 93% |
| 6 years | 15 scenarios | 900s | 260s | 80% | 100% | 100% |
| 5 years | 15 scenarios | 1080s | 260s | 93% | 100% | 100% |
| 4 years | 15 scenarios | 1030s | 300s | 87% | 93% | 93% |
| 3 years | 15 scenarios | 1220s | 340s | 80% | 87% | 80% |
| 2 years | 15 scenarios | 1350s | 480s | 73% | 87% | 50% |
| 1 year | 15 scenarios | 1480s | 510s | 67% | 80% | 50% |
Disclaimer/Publisher’s Note: The statements, opinions and data contained in all publications are solely those of the individual author(s) and contributor(s) and not of MDPI and/or the editor(s). MDPI and/or the editor(s) disclaim responsibility for any injury to people or property resulting from any ideas, methods, instructions or products referred to in the content. |
© 2026 by the authors. Licensee MDPI, Basel, Switzerland. This article is an open access article distributed under the terms and conditions of the Creative Commons Attribution (CC BY) license (http://creativecommons.org/licenses/by/4.0/).
Copyright: This open access article is published under a Creative Commons CC BY 4.0 license, which permit the free download, distribution, and reuse, provided that the author and preprint are cited in any reuse.