

Submitted:
09 September 2026
Posted:
09 September 2026
You are already at the latest version
Abstract
The Florida citrus industry has collapsed by >90% in two decades, driven primarily by Huanglongbing disease transmitted by the Asian citrus psyllid (ACP). While physical barriers such as citrus under protective screens systems effectively exclude ACP, their high capital costs ($ 43,560/acre) yield payback periods >29 years, making them economically unviable for most growers. This study investigates vertical agrivoltaic shield walls as a self-funding biosecurity solution that combines ACP exclusion with sustainable electricity generation. A case study is presented evaluating a representative small-family farm-sized (35 acres) citrus grove. Structural designs compliant with Building Code and ASCE 7-22 were developed, and two deployment scenarios were simulated in Vero Beach, Florida: perimeter-only fencing (622.6 kW-DC, Case 1) and perimeter plus interior wind shields (954.8 kW-DC, Case 2). Techno-economic analysis under FPL tariffs shows 25-year bill savings of $ 1.27M (Case 1) and $ 1.97M (Case 2) under net metering, invariant across sub-cases. Under the owner-developed deployment, both cases achieve positive ROI on energy economics alone (Case 1: 20.34%, Case 2: 29.51%), while wholesale export under COG-1 is uniformly uneconomic. GIS-based statewide scaling indicates that fence-mounted PV on Florida citrus groves alone could provide 11.9 GW of capacity generating 15.4 TWh annually. This would produce 6% of Florida's electricity consumption or raised to 25.5% if extended to the rest of the state’s farmlands producing 65.03 TWh without sacrificing any growing area. The economic results are promising as they indicate agrivoltaic shield walls can simultaneously combat HLB, diversify farm revenue, and accelerate sustainable and renewable energy generation.
Keywords:
agrivoltaic
; solar photovoltaic
; vertical solar
; solar fencing
; citrus
; Asian citrus psyllids
; dual use
1. Introduction
The Florida citrus industry has declined sharply by over 90% in the last 20 years, falling from 300 million boxes in 2003–2004 to roughly 20 million boxes in 2023–2024 [1]. Florida had 208,183 total acres of citrus for the 2024-25 year, which was another drop of 24% compared to the 2024 growing season [2]. There are several factors explaining the collapse of the Florida citrus industry including: land cost pressure from development with the rising population, high production costs (e.g., increasing costs of fertilizers, pesticides, and irrigation needed for an increasing number of droughts), labor shortages, extreme weather (e.g., hurricanes like Ian in 2022 and Milton in 2024 as well as the 2025 freeze), but the primary component was citrus greening disease [1]. Citrus greening disease also called Huanglongbing (HLB) in the literature, was first spread to South Florida in August 2005 resulting in orange production decrease of 92.5% and grapefruit production decreased by 95.6% [3]. HLB is caused by the intracellular Candidatus Liberibacter species, which is primarily transmitted to the trees by Asian Diaphorina citri (D. citri) and African Trioza erytreae citrus psyllids [4,5]. Although both vectors are capable of transmitting several bacterial species [6], citrus greening disease in Florida is spread mainly by the Asian citrus psyllid (ACP), and this bacterial disease causes i) asymmetrical blotchy mottling and chlorosis of leaves, ii) premature fruit drop, iii) small, lopsided, poorly colored bitter fruit, and iv) progressive tree decline, reduced yield, and eventually tree death [7]. This is not just a problem for Florida. Citrus fruits are cultivated in over 140 countries, with an average yearly production of 161.8 million tons [8,9]. HLB is widely considered the most devastating disease the global citrus industries have ever faced [10]. There is no known cure for infected trees [11]. The primary three-part approach to controlling HLB has been removal of symptomatic trees from the grove, control of the psyllid vectors, and replanting with disease-free nursery stock [12]. In the most extreme situations, China has been effective at controlling the disease by region-wide comprehensive management (rogueing + vector control + replanting) [13]. Many other methods have been investigated to control the disease including trunk injections of oxytetracycline (OTC) that improve yield and fruit quality and in parallel individual protective covers (IPCs), which delay infection for young trees [14]. In addition, thermotherapy, antimicrobial peptides, and transgenic approaches are under investigation [15]. Even with all of these approaches, it is clear HLB is causing severe multi-billion dollar/year citriculture industry losses [16].
Abandoned citrus groves in Florida serve as reservoirs for D. citri, and they can fly long distances despite geographical barriers [17]. Fortunately, they generally fly only at the height of the tree canopies. Thus, one of the most successful approaches to controlling HLB is the use of physical barriers to prevent ACP from reaching the trees [18]. ACP prefer living on the edges of groves and so the border trees are the first to be colonized [19]. ACP barriers can be either living windbreaks (e.g., trees) or artificial screen barriers on the perimeter of groves. The use of living windbreaks significantly decreases the density of ACP on the border of citrus groves [20]. This windbreaks function primarily as physical barriers but may also provide a habitat for natural enemies of ACP [21]. The challenges of live windbreaks are numerous and include time to establish, cost, and their susceptibility to extreme weather (e.g., freezing). A large collaborative group of researchers including Sétamou (Texas A&M University-Kingsville), Martini, Diepenbrock, and Stelinski (University of Florida), Grafton-Cardwell and Rivera (University of California Riverside) are exploring border management strategies [19]. They recommend that screen barriers be built with a fence at least 3.7m (12 ft) high, 9-23m (30-40 ft) away from the border trees with psyllid resistant screens (e.g., high-density polyethylene (HDPE) plastic mesh) [19]. Experiments consisting of deployment of sticky cards at different heights revealed that most >99% of D. citri were collected on traps placed at or below 3.7 m (12 feet) along grove borders [22]. Thus a 3.7 m high fence, if completely encircling a grove, would be expected to effectively exclude the vast majority of psyllids. In a field study conducted in Texas [23], only south and east border fences of a grapefruit grove resulted in 55-98% reduction of ACP numbers relative to a control grove with no border fence. Even more aggressive is the newly introduced citrus under protective screen (CUPS) production systems, which are able to produce disease-free fruit by completely enclosing a grove in a screen house including the roof [24].
Physical barriers like fencing, screens and CUPS, unfortunately, all add to the already high production costs for citrus. This makes Florida citrus more likely to be displaced for more economic activities, including with large scale solar farms [25]. For example, CUPS significantly increases the cost of establishing or maintaining a citrus grove due to the high cost of screen-house construction, which averages $10.76/m2 ($1/ft2) [24]. This amounts to $107,639 per hectare or $43,560/acre and makes economic citrus production very challenging as the gross revenue is $2,500 to $3,500/acre in a typical well-managed mature grove producing 300-400 boxes/year/acre; while production costs about $2,000/acre/year to maintain the trees [26]. Thus, if an acre is only making $500-$1,500/acre/year simple payback for CUPS is over 29 years [27]. What the Florida (and global) citrus industry needs is a free (or better yet profitable), method to erect physical barriers to prevent the ACP from infecting their fruit trees with HLB.
To provide that solution, this article investigates the technical, economic, and scaling potential of utilizing vertical solar photovoltaic walls to surround citrus groves and provide physical barriers to ACP. The solar photovoltaics (PV) in the agrivoltaic shield wall are profitable alone, and this solar electricity profit can be used to subsidize the entire barrier to the ACP. Vertical solar fencing is already in use in agrivoltaics, and only minor modifications would be necessary to make them ACP-tight. First, the physical requirements are detailed. Next, simulations are provided for a case study in Vero Beach Florida for the economic output of such an array. Finally, GIS is used to determine the potential impact on Florida’s electric grid if this practice was adopted state-wide.
2. Methods
2.1. Physical Requirements
The structural designs of the proposed agrivoltaics citrus shield fences are compliant with applicable regulations and standards, which include the Florida Building Code (FBC) and American Society of Civil Engineers (ASCE) guidelines. The following steps detail the design of the agrivoltaics citrus shield fence:
- Design Wind Speed and Risk Category
The vertical PV walls are assigned Risk Category 1 as per FBC Table 1604.5 since the facility is for isolated agricultural use [28]. As Vero Beach is in India River County, the design wind speed (V) is set to 150 mph (refer to FBC Figure 1609.3(1)) [28]. Moreover, following ASCE 7-22 Table 26.6-1 for solid freestanding walls, the wind directionality factor (Kd) is considered 0.85 [29].
- 2.
- Velocity Pressure (qz)
The PV fences are assigned exposure category C (open terrain) considering FBC Section 1609.4.3 [28]. For a height of up to 15 ft, the velocity pressure coefficient (Kz) is considered 0.85 as per ASCE 7-22 Table 26.10-1 [30]. The value of topographic factor (Kzt) is 1.0 for flat terrain following ASCE 7-22 Section 26.8 [31]. Lastly, the ground elevation factor (Ke) is to be kept 1.0 referring to ASCE 7-22 Section 26.9 [32]. The velocity pressure (qz) is given by:
qz=0.00256.Kz.Kzt.Kd.Ke.V2 [kPa]
- 3.
- Wind Load and Bending Moment
To determine the net pressure coefficient or force coefficient (Cn), the aspect ratio is ascertained using the length of the fence used in the case study (363m or 280m) and the fence height (1.134+1.134=2.268m). Since the aspect ratio is greater than 45, is considered 1.3 by assuming Case A for wind load [33]. Following ASCE 7-22 Section 26.11, gust factor (G) of 0.85 is used in the calculations [34]. The design wind load (P) is then calculated using the following equation:
W or P=qz.G.Cn [kPa] (2)
The dead weight (D) of the module is considered to be 0.24 kPa [35]. Using FBC Section 1605.1, the load combination for allowable stress is ascertained as follows:
Load combination=1.0D+0.6W(or P) [kPa] (3)
The distributed wind load (w) is determined by multiplying the load combination by the tributary width (wTributary , which is the width of the module).
w=Load combination x wTributary [kN/m] (4)
The total force (F) is calculated by multiplying w with the height of the structure (which is two times the height of the module – 1.134+1.134).
F=wh [kN] (5)
The maximum moment is calculated using the following equation:
M=Fh/2 [kN.m] (6)
- 4.
- Structural Member Selection and Deflection
The allowable bending stress (Fb) for A-36 steel is 160,000 kN/m2 [36].
The material selection was performed by calculating the section modulus and satisfying:
Srequired > Mmax/Fb [kN.m] (7)
Actual deflection is estimated using the following equation:
Δ=wh4 /8EI [mm] (8)
It is compared with the deflection limit (L/120) where L is equal to the value of h.
- 5.
- Foundation Design
The foundation is designed considering FBC Section 1806.2 for sandy soil (Class 5) with allowable lateral bearing pressure is 100 psf per foot of depth (15.7 kN/m2 per m) [37]. The following formula is used for embedment calculation:
and where
where b=0.45, b is the diameter of round post or footing, d is the depth of embedment in earth, h is the distance in feet from ground surface to point of application of applied lateral force, P is the applied lateral force in pounds, and S1 is the allowable lateral soil-bearing pressure.
d=0.5A{1+[a+(4.36h/A]0.5} [m] (9)
A=2.34P/(S1.b) [m2] (10)
2.2. Simulations and Case Study
A case study was conducted using the Florida Research Center for Agricultural Sustainability. It has 35 acres of citrus groves in the heart of Florida's Indian River Citrus District in Vero Beach, Florida [38] and represents the size of a typical small family farmer-based grove. A satellite image of the grove is shown in Figure 1 with the approximate locations and lengths of agrivoltaic shield walls shown in orange.
For the agrivoltaic setup, two different case study designs were considered.
First, the minimal agrivoltaic setup needed to provide an external barrier to the grove in Case 1 includes setting up fence PV along the perimeter of the Florida Research Center. The North-South (N-S) fences have lengths of 363 m, while East-West (E-W) fences have lengths of 280m each (see Figure 1).
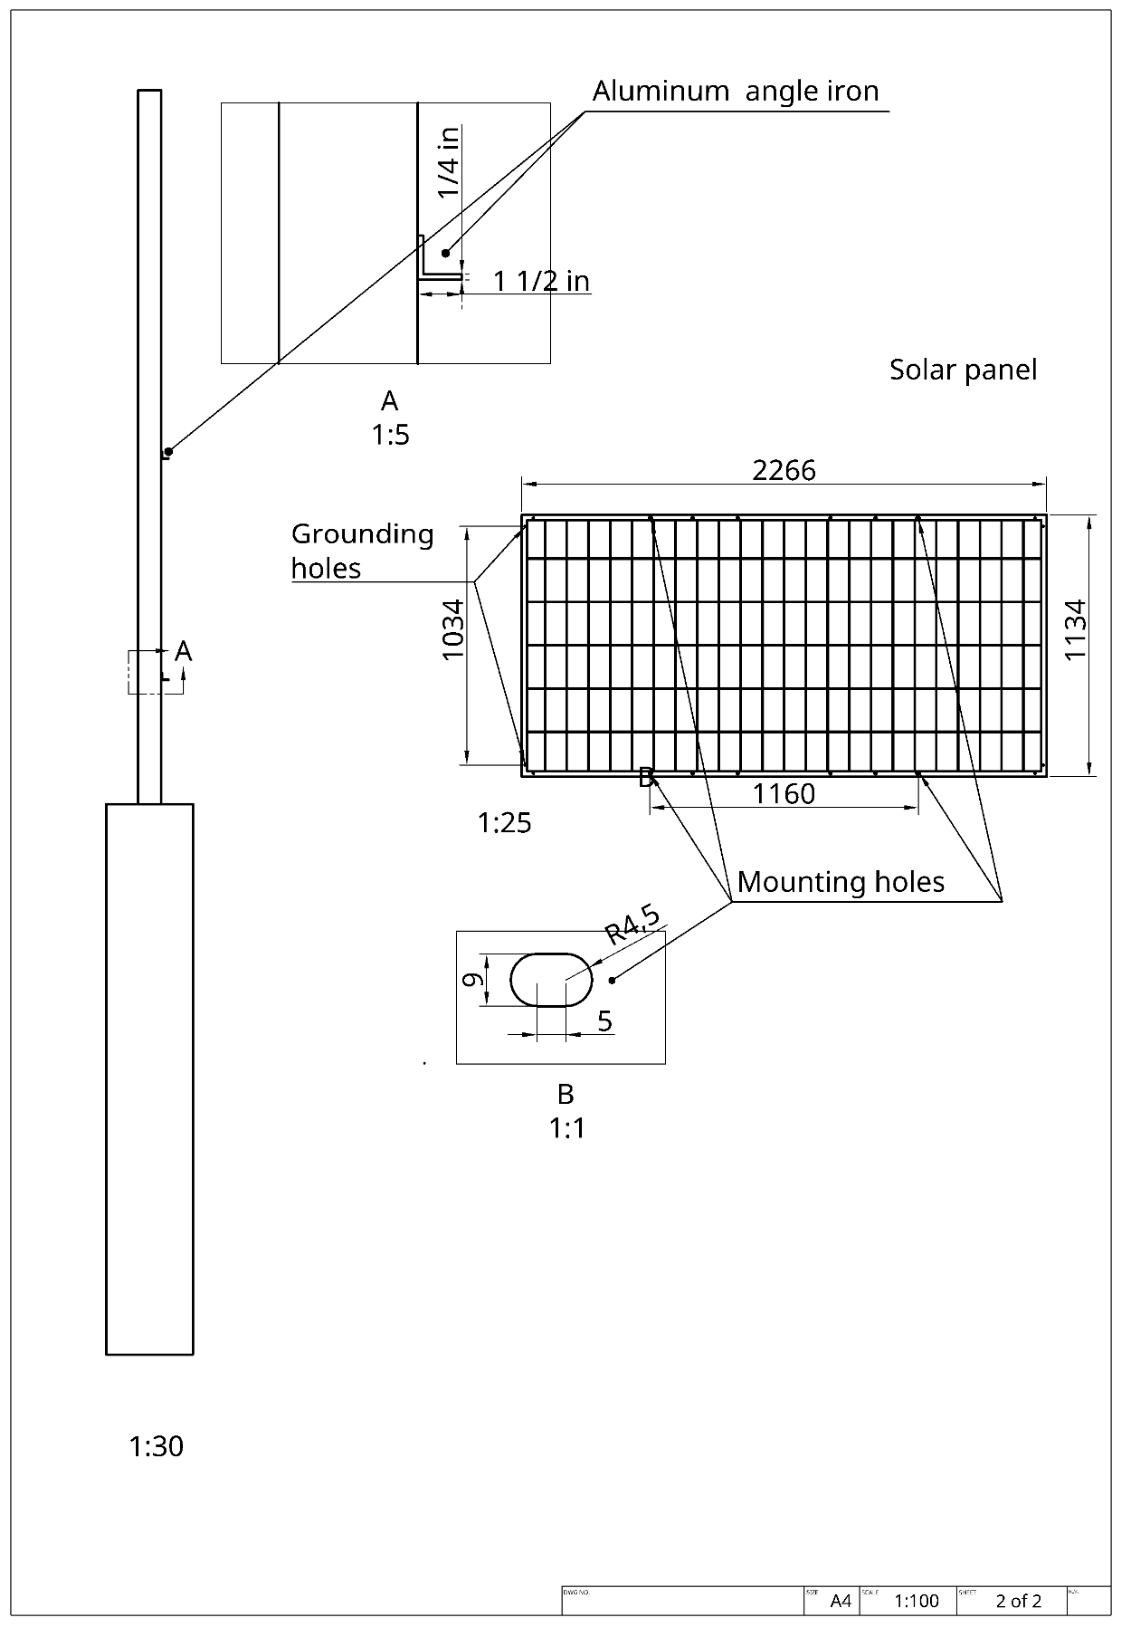
BiHiKu6 CSW-550MB-AG PV modules by CSI Solar Co, Ltd. were selected for the simulations [39]. The dimensions of the module are 2,266mm x 1,134mm. The modules are considered to be installed in portrait layout as shown in Figure 2.
The above fence design consists of two 0.12m x 0.12m fence posts set in concrete footings 2.850m deep. Appendix A contains detailed technical drawings of the fence units. Citrus netting was placed above the panels at a height of 3.7m from the ground. All openings around the PV modules were sealed using addition citrus netting. This design allows the fence to be hermetically sealed while allowing maximum light penetration to the PV modules.
In Case 2, along with the exterior fence, two additional rows of PV wind breaks are also installed in N-S direction with lengths of 343m (considering 10m space on either side for the turning radius of farm equipment). This represents a case of maximizing solar electricity production while still enabling conventional citrus industry equipment to navigate the agrivoltaics grove.
Energy analysis is performed using the open-source System Advisor Model (SAM) [40]. The number of modules along the fence is calculated by dividing the total length of fences with the width of the module (shorter side of the modules since the modules will be installed in portrait orientation). Based on the number of modules and the power rating of each module, the total installed capacity is ascertained (Figure 3).
The input parameters for SAM are detailed in Table 1.
2.3. System Design Economics
The technical and economic viability of deploying a grid-tied PV system is evaluated by outlining the applicable Florida Power & Light (FPL) interconnection rules, rate structures, and available incentives.
Case 1 and Case 2 systems in Table 2 were evaluated exclusively under three tariff frameworks: the Public Utility Regulatory Policies Act of 1978 (PURPA) [43], Qualifying Facility framework [44], and FPL's purchase tariff schedules [45,46,47,48].
Economic analysis includes two scenarios. Scenario A analyzed net metered systems as if the facility matched the output of the PV with almost constant co-located loads e.g., with easily located computing or controlled environmental agriculture. In Scenario B, the facility has no on-site electricity load to offset. All generation is exported directly to FPL under the COG-1 as-available energy tariff at the avoided cost rate of 3.353 cents per kWh [47,48]. To bound the sensitivity of the agrivoltaic economics to capital cost, three CapEx sub-cases are evaluated for each combination of Case (1 or 2) and Scenario (A or B), yielding twelve simulations in total using the PV System Cost Model (PVSCM) Cost Benchmarks [49]. Sub-case 1, the worst-current CapEx, applies the published Modeled Market Price (MMP) of $1,712.12/kW-DC for Case 1 and $1623.48/kW-DC for Case 2, which reflects the price a third-party developer would charge an external customer in the current U.S. market with all eight PVSCM cost categories included (modules, inverters, structural balance of system, electrical balance of system, on-site fieldwork, off-site office work, and developer indirect costs). The operation and maintenance costs (O&M)1 for Case 1 and Case 2 are 29.12 $/kW.yr and 23.91 $/kW.yr, respectively. Sub-case 2 is the breakeven capital cost, defined as the $/W at which the bifacial PV yields zero net profit over the 25-year horizon. Sub-case 3 represents an owner-developed deployment on land already owned by the citrus operator, in which the four sub-elements within the PVSCM “Other” category attributable to a third-party developer entity are removed: sales tax on photovoltaic hardware, exempt under Florida Statute Section 212.08(7)(hh), which provides a permanent state sales and use tax exemption for solar energy systems and their components as certified by the Florida Solar Energy Center [51]; developer profit margin (no third-party markup, as the project is build-to-own); developer management overhead (absorbed within the existing farm operation rather than billed as a separate line item); and developer contingency reserve (the owner bears project risk directly). Unavoidable indirect costs that remain regardless of developer identity are retained at their benchmark values, including permitting, inspection, and interconnection fees, general liability insurance required by Florida Public Service Commission Rule 25-6.065(6)(e) [52], and financing transaction costs. The resulting Sub-case 3 MMP, computed directly from the PVSCM 2024 workbook with these sub-elements zeroed, is $1,444.73/kW-DC for Case 1 and $1,367.44/kW-DC for Case 2. Considering the fact that sub-case 3 is grower owned facility, O&M management fees were excluded in PVSCM model, resulting in O&M costs of 14.9 $/kW.yr for Case 1 and 14.64 $/kW.yr for Case 2.
Energy system configurations were simulated on SAMA [53,54] over a 25-year project lifetime using a rate escalation CAGR of 2% per year [55], and a nominal discount rate of 3.75% [56]. The interconnection rules for Florida are summarized in Appendix B. The bi-facial PV module was modeled into SAMA using pvlib.bifacial.infinite_sheds module [57].
Customer-owned renewable generation within FPL's service territory may interconnect under Florida's net-metering framework (FPSC Rule 25-6.065 [52]) or sell electricity to FPL under two tariff pathways: COG-1 (As-Available Energy, Sheet 10.100) and QS-2 (Firm Capacity and Energy, Sheet 10.300) [48]. Both agrivoltaic cases (529.2 kW AC and 811.6 kW AC) qualify as Tier 3 systems under FPL Tariff Section 9 [46] and, given their sizing at approximately 100% of modelled annual load, are well within the 115% annual consumption cap for net metering [58]. As summarized in Table 3, the three pathways offer distinct compensation structures: under net metering, excess generation exported to the grid is credited at the full GSD-1 retail energy rate (approximately 6.31 cents/kWh [47]), with any unused year-end credits paid out at FPL's COG-1 avoided-cost rate of 3.353 cents/kWh at secondary delivery voltage [48]; under COG-1, all generation is compensated purely at this avoided-cost rate, derived from FPL's fuel charge of 3.201 cents/kWh [47] plus a fixed variable O&M adder of 0.01540 cents/kWh adjusted by a secondary voltage multiplier of 1.0413 [48], with no capacity payments; and under QS-2, capacity payments are added but require firm delivery commitments (94% availability) that a solar-only system cannot reliably meet without battery storage, as noted under Section 366.91(3), Florida Statutes [59]. Given the high capital costs associated with battery storage systems [60] and their adverse impact on project economics, QS-2 was not analyzed in this study. Detailed information on all three pathways and the associated interconnection requirements is available in Appendix C & Appendix D.
2.4. Scaling Agrivoltaic Shield Deployment Throughout Florida
The scaling potential of agrivoltaic shield walls for mitigating ACP intrusion in Florida was explored by adapting a previously developed GIS-based fence-mounted PV simulation framework [61]. The framework is applied here to quantify deployable PV capacity and energy generation along citrus grove perimeters. This is then expanded to other farms in Florida to analyze fence-mounted PV as functional biosecurity infrastructure.
2.4.1. Citrus Grove Identification and Spatial Scope
Crop sequence boundary shapefiles for the year 2023 were obtained from the United States Department of Agriculture National Agriculture Statistics Service (USDA-NASS) [62], and the Florida state boundary data were extracted. The resulting dataset was filtered for citrus and oranges using the land cover code attributed to citrus (72) and oranges (212) located in the metadata file provided by USDA-NASS. This process outputs polygons representing the active citrus and orange groves that will be referred to as citrus dataset in the remainder of the manuscript. The citrus polygons dataset was processed to remove inner holes (i.e. farm roads, barns, etc.) from polygons and dissolve adjacent farms to avoid double-counting common edges in accordance with the methodology. The process is repeated for all farms across Florida to quantify the total farm-fence mounted PV potential across the state.
2.4.2. Fence Geometry Extraction, PV Capacity Estimation, and Annual Energy Simulation
External boundary information, including fence perimeter length and orientation, was extracted for each group of farms resulting from polygons dissolution. The total PV capacity is calculated using the length of the fences as shown in equation (11).
where (W) is the installable capacity on a farm, (W) is the DC rating of a module, is the number of perimeters on a group of farms polygon representation, (m) is the length of perimeter segment , and is the width of the PV module along the fence lengths. Each fence perimeter is considered entirely covered by PV modules in a continuous arrangement with no spacing between modules. A portrait layout configuration, matching the design in Figure 2, was analyzed where the PV modules are arranged vertically.
The orientation of each fence segment was incorporated into the energy simulation. Segment-level azimuth angles, combined with location-specific solar resource data, were used to estimate energy production for each boundary segment. Annual energy generation was computed at the segment level and aggregated to the farm, county, and state levels.
Meteorological data were obtained from the National Solar Radiation Database (NSRDB). County centroids were used to extract representative weather data, under the assumption that solar resource variability within individual counties is limited relative to the spatial scale of the analysis.
3. Results
3.1. Case Studies
3.1.1. Structural Analysis
The velocity pressure is calculated to be 1.99 kPa following Equation 1. Using Equation 2, the calculated value of design wind load was 2.20 kPa. The load combination resulted in a total load of 1.56 kPa while the value of distributed wind load is determined to be 3.53 kN/m. The maximum moment is found out to be 9.08 kN.m. The value of Mmax/Fb is calculated to be 56.8. The section modulus for 120x120x5mm is 84.6. The actual deflection (16.22mm) with 120x120x5mm came out to be within the deflection limit (18.9) and therefore, is considered for fence posts. Considering a diameter of 0.45m, the depth of the foundation is found to be 2.85 m
3.1.2. Energy Analysis
The energy analysis demonstrates that 320 modules can be installed on the N-S fence; with 640 modules total for both fences. Moreover, for the E-W fences, the module count comes out to be 492. The total installed capacity for the N-S and E-W fences is estimated to be 352 kW and 270.6 kW. The energy generation potential for the N-S and E-W fence is determined to be 1373 kWh/kW and 1099 kWh/kW. By using the energy output for 1-kW system and the total installed capacity, the total energy output from N-S and E-W fences comes out to be 483.30 MWh and 297.39 MWh. The total energy output for Case 1 is estimated as 780.69 MWh each year (Figure 4).
For Case 2, an additional 302 modules can be installed on each wind shield – therefore, 604 modules will be mounted on both wind shields. This would result in an installed capacity of 332.2 kW. In terms of energy generation potential, the wind shield will produce 456.11 MWh. The total energy generation potential for Case 2 is 1236.80 MWh/year.
3.2. Economics
3.2.1. Economic Implications of Large-Scale Solar PV (Scenario A: Net Metering)
Scenario A models the agrivoltaics system under FPL's net-metering tariff, with the facility supplying its own electrical load and exchanging surplus and deficit kWh with the grid through monthly netting. The simulation uses the GSD-1 rate schedule effective January 1, 2026 [47] (base charge $33.71 per month, maximum demand charge $12.70 per kW, energy charge 2.825 cents per kWh, environmental charge 0.286 cents per kWh, fuel charge 3.201 cents per kWh, conservation charge $0.49 per kW, capacity charge $0.16 per kW, storm protection charge $1.80 per kW, transition credit -$0.12 per kW). The annual property load is set equal to the annual PV generation (827,119 kWh for Case 1 and 1,300,072 kWh for Case 2), reflecting the policy intent of Rule 25-6.065 [52] and remaining well within FPL's 115 percent annual-consumption sizing guideline [58].
Table 4 summarizes the key outputs of Scenario A across the three CapEx sub-cases of Case 1 and Case 2; the principal economic limitation common to all sub-cases is the FPL demand-charge structure, which is applied to maximum gross import demand and is not offset by PV output during typical peak hours. Quantitatively, under Scenario A with the GSD-1 tariff, the 25-year present-value bill savings reach $1,268,750 (Case 1) and $1,971,600 (Case 2) for all three CapEx sub-cases. Whether these bill savings recover the capital and O&M investment over the 25-year horizon depends on the CapEx sub-case. At Sub-case 1 pricing, both cases are below breakeven with net profit of -$162,259 (Case 1) and -$37,957 (Case 2), and no payback within the lifetime; Case 2 is close to recovery even under this most-conservative CapEx assumption. The Sub-case 2 breakeven CapEx is $1,451.25/kW (Case 1) and $1,583.65/kW (Case 2), reached at 25-year payback. Under Sub-case 3 (owner-developed), both cases reach substantially positive economics: Case 1 achieves ROI of 20.34 percent and net profit of $182,817; Case 2 achieves ROI of 29.51 percent and net profit of $384,985. IRRs are -1.18 percent (Case 1) and -0.18 percent (Case 2) at Sub-case 1 pricing, moving to 1.44 percent and 2.04 percent respectively at Sub-case 3 pricing. The Sub-case 3 advantage over Sub-case 1 reflects both the reduced capital cost from removing developer-attributable indirect cost components and the reduced annual O&M from removing the management fees for the owner-operated configuration, while the demand-charge component of $15.03 per kW, applied to the full gross import peak (94.42 kW and 148.41 kW) and not reduced by PV, contributes $17,030 per year (Case 1) and $26,767 per year (Case 2) of unavoidable cost regardless of CapEx.
3.2.2. Economic Implications of Large-Scale Solar PV (Scenario B, Wholesale Export)
Scenario B models the same two physical systems under the assumption that no on-site electrical load exists, so the agrivoltaics facility delivers all generated AC energy to FPL under the COG-1 As-Available Energy tariff at the secondary-voltage rate of 3.353 cents per kWh. There are no retail electricity purchases, no demand charges, no minimum base charge, and no sales-tax considerations on the export side (COG-1 sales are wholesale and outside the retail sales-tax framework).
Table 5 summarizes the Scenario B outputs across the three CapEx sub-cases. The economics are uniformly unfavorable: at Sub-case 1 pricing both cases produce deeply negative ROIs; the Sub-case 2 breakeven CapEx collapses to $503.17/kW (Case 1) and $635.7/kW (Case 2), which is well below any credible market price for an agrivoltaic system; and even under Sub-case 3 (owner-developed) pricing both cases remain solidly negative. The structural reason Scenario B fails across all sub-cases is that COG-1 compensates exports at 3.353 cents per kWh, which is approximately 53% of the GSD-1 retail energy rate that net-metered exports recover. For this mechanism to work financially from an energy-economics perspective, citrus grove owners therefore need to couple agrivoltaic shields to a co-located load matching their annual PV output (to qualify for net metering) and adopt the owner-developer deployment structure.
The two scenarios produce markedly different project economics, and the divergence is driven almost entirely by the effective per-kWh compensation rate for exported energy, not by differences in PV system cost, generation, or technical performance. Under Scenario A, exports are credited against retail imports at the GSD-1 retail energy rate of approximately 6.312 cents per kWh (excluding the demand-charge component, which is not netted), with only the residual December true-up balance cashed at the COG-1 wholesale rate of 3.353 cents per kWh. Under Scenario B, all exports are paid at COG-1 from the first kWh, with no monthly netting against retail charges.
3.3. Citrus and Statewide Farms Fence-Mounted PV Potential in Florida
According to the data illustrated in Figure 5, 32 counties in Florida have citrus farms in 2023. The average fence-mounted PV capacity across these counties is 0.4 GW with a standard deviation of 0.6 GW, while the average annual energy production is 0.5 TWh with a spread of 0.8 TWh, for the investigated portrait layout. This large dispersion observed across the data is the result of the farms number discrepancy between counties. Polk County, with 2,462 farms after polygons dissolution, exhibits the highest PV capacity with 2.5 GW (3.3 TWh) followed by Highlands and Hardee counties, with 1.5 GW (1.9 TWh) and 1.4 GW (1.8 TWh), respectively. On the other hand, the counties with a single citrus farm displayed the lowest capacity, including Gadsden and Palm Beach counties each with fence-mounted PV capacity of 0.2 MW and 0.4 MW, respectively. These capacities correspond to annual energy potential of 0.3 GWh and 0.5 GWh.
The total citrus farm fence-mounted PV capacity in Florida is estimated at 12 GW, with a resulting annual energy production of 15 TWh, corresponding to 1,272 kWh/kWp yield (Table 6). The annual yield across the state varies from 1,095 kWh/kW for fixed vertical east-west orientation PV to 1,674 kWh/kW for fixed optimal tilt south oriented PV [63]. These results highlight the importance of fence-mounted PV potential despite the orientation being imposed by existing structures as represented in Figure 5b. Moreover, fence-mounted PV requires no additional land transformation and the results in Table 6 indicate that up to 6% of Florida’s electricity consumption in 2024 (255.1 TWh) could be supplied by citrus farms perimeter PV alone.
If fence-mounted PV concept is extended to all farms in Florida, the total capacity increases almost five folds from the citrus case, reaching a capacity potential of 51.1 GW and 65 TWh of annual energy production as reported in Table 6 and Figure 6. This PV potential can provide 25% of the total annual energy consumption of the state in 2024. The mean PV capacity in this case is 0.8 GW (1 TWh) with a standard deviation of 0.8 GW (1TWh). The large spread in power and energy observed across all farms confirms the impact of farms dispersion on aggregated results reported in citrus farms. Polk County remains the county with the most farms (3,866 post-polygon dissolution) as well as the highest PV capacity potential (3.5 GW) and energy production (4.5 TWh). In contrast, Monroe County exhibits the lowest capacity (0.7 MW) and energy production (0.9 GWh) with only two farms. No farm data was available for Franklin and Alachua counties for the year 2024 as illustrated by the grayed area on the maps in Figure 6.
4. Discussion
Due to the incredible disparity between what FPL is paying for solar electricity (3 cents) and what they are charging customers for it (12 cents), being a grid energy provider does not currently make sense. This underpaying of solar electricity has been discussed in detail in the value of solar literature [64,65]. FPL does build their own PV facilities and provides solar paths for their customers [66], presumably at a profit so there may be some opportunities for FPL to partner directly with groves to do vertical systems. For all the rest of citrus grove owners, to avoid going out of business, they need to form partnerships with large loads. Economics only make sense if it can be behind the meter, otherwise the payback time is beyond the lifetime of the PV under warranty as seen in the results. From a practical standpoint this means that citrus grove owners will need to partner with loads that can be moved on premises to have those energy users pay for the fencing needed to protect the citrus crop. In ideal cases, citrus groves adjacent to large energy consumers like industrial manufacturing would be able to form a joint venture. Combining solar with heat pump technology can allow for other uses as well including food drying, biomass processing, and low-temperature manufacturing [67]. Other groves, not so fortunately located, would need to bring in other options.
Co-locating electrical loads with the grove solar shield generation reduces transmission losses and improves the economics by capturing value behind the meter. A growing body of peer-reviewed research identifies several categories of loads that are particularly well-suited to relocation to solar PV output. First, computing loads are increasingly proposed as solar co-located loads [68,69]. Cryptocurrency mining like bitcoin mining in particular has been studied as a good match for PV systems [70] and can also be mounted in mining farm containers that makes them a deployable load [71]. Conventional data centers with workload-shifting capability (training AI models, batch processing) are similarly attractive for even varying the load [72]. Second, solar groves next to highways [73] or fleet depots can be used for electrical vehicle (EV) charging [74]. Perhaps, most applicable would be using agrivoltaic shields co-located to EV fast-charging hubs [75,76]. Finally, long-haul truck depots and bus fleets with predictable midday dwell times are particularly suitable [77]. Citrus PV systems could also be used for powering controlled-environment agriculture, which uses substantial electricity for LED lighting, HVAC, water pumping and dehumidification [78]. There is already precedent for such coupling of agrivoltaics and indoor vertical farming with the agrivoltaic agrotunnel [79]. In addition the citrus region in Florida is suffering from salt water intrusion [80] and reverse-osmosis desalination and municipal water treatment are energy-intensive but tolerant of variable input power when paired with storage tanks making it a good potential for use of future solar energy generation [81]. Finally, green hydrogen production via electrolysis [82] or coupled with other hydrogen generating systems [83] is a potential flexible load. Hydrogen produced on-site can be stored, transported, or used for fertilizer, fuel, or industrial feedstock. Similarly the PV production could be directly coupled to nitrogen fertilizer production [84,85].
Despite the economic limitations and need for load matching associated with the compensation scheme offered by FPL, the GIS scaling results indicate that vertical agrivoltaic fence systems could transform citrus grove boundaries from passive land edges into dual-use infrastructure that provides both energy generation and ACP mitigation. This is particularly relevant for Florida, where HLB has reduced production, increased maintenance costs, and intensified pressure to abandon or convert citrus land over the past decade. Even under current conditions, using 2023 crop data, fence-mounted PV on citrus groves alone could supply approximately 6% of the state’s electricity demand in 2024. This potential could increase if grove restoration occurs, suggesting a reinforcing feedback mechanism in which protected groves support agricultural recovery, which in turn expands the available perimeter for PV deployment and increases total energy generation. Beyond citrus, the approach can be extended to other crop systems in Florida, where perimeter-based PV could serve as both an energy source and a plant protection strategy. More broadly, these results highlight that farm boundaries, windbreaks, and fence lines represent an underutilized class of linear infrastructure that can support distributed solar deployment, particularly in applications where protection, access control, or biosecurity already justify perimeter investment.
4.1. Limitations
This study only considered the theoretical potential of agrivoltaic shield technologies to protect Florida citrus. The windbreak tested experimentally to date were made of mesh and open to wind flow to avoid turbulence, which would be expected to reduces efficacy [19]. This however needs to be tested. It remains to be determined whether 1200 m of solid 2.27m wall of PV and mesh netting up to the range of flight of ACP is sufficient to protect citrus trees from greening or whether the solid bottom of the shield would cause enough turbulence that could allow the ACP to fly over the wall. Future work is needed with both computational fluid dynamics and experiments to verify the protective effects would be possible without also covering the top surface of the grove with mesh netting as well.
The GIS results should be interpreted as a spatial scaling estimate rather than a deployment-ready design. The analysis assumes full-perimeter coverage, representing an upper-bound scenario; in practice, fence-mounted PV deployments for citrus grove protection may be partial, phased, or targeted to high-risk edges depending on ACP pressure, prevailing wind, access requirements, and farm operations. Continuous PV coverage along mapped boundaries also neglects real-world interruptions such as gates, equipment clearances, setbacks from tree rows, and drainage features. The preprocessing approach, including polygon dissolution and hole removal, avoids double counting of shared boundaries but removes internal edges, which may lead to a conservative estimate of total PV potential in fragmented farm systems. At the modeling level, the use of county-centroid weather data and uniform system assumptions does not capture local variability in irradiance, shading from vegetation, or microclimatic effects. In addition, the representation of vertical PV performance does not explicitly account for soiling, mismatch losses along extended fence runs, or degradation mechanisms specific to agricultural environments, as accurate loss modeling and site-specific performance characterization were beyond the scope of this large-scale GIS assessment but can be integrated into future work
4.2. Future Work
From a system integration perspective, the GIS analysis assumes that PV-based barriers are functionally comparable to existing ACP mitigation strategies, although most prior studies have focused on permeable mesh screens rather than solid or semi-solid structures [86,87]. As a result, the interaction between PV walls, airflow, and psyllid transport remains uncertain and requires experimental validation. Thus, the most critical area of future work is the need for experimental tests to show that this mechanism of protecting citrus groves from greening is technically viable. This means careful experiments in which ACP are not allowed to circumvent the wall. The same double-door or foyer entrances used in CUPS [24] can be adopted for the PV fencing and if experiments determine the necessity because of turbulence then the system can be enclosed by HDPE mesh on the top.
The economic analysis used Florida as an example, but because of FPLs rate schedule and compensation scheme solar is only marginally economic. In other regions, PV generation is compensated at much closer rate to the VOS and should make such shielding systems far more economic. Future work is needed to extend the analysis and example provided here to other citrus regions (e.g. China, Brazil, India, Mexico, Spain, etc.).
Future GIS research can also focus on integrating pest dynamics and airflow modeling to identify priority farm edges where fence mounted PV would be the most effective for limiting pest intrusion. Additionally, further work is needed to couple spatial deployment with techno-economic analysis, extending beyond electricity production to account for the co-benefits of pest mitigation enabled by dual-use fence-mounted PV systems [88].
It should be emphasized that the present techno-economic analysis evaluates only the energy revenues and avoided electricity costs of the agrivoltaic shield system. Two additional economic streams that motivate the shield concept in the first place are not yet quantified: (i) the avoided biosecurity capital expenditure relative to conventional ACP-exclusion infrastructure such as CUPS systems at $43,560/acre [24,27], which the agrivoltaic shield substitutes for through its perimeter physical-barrier function; and (ii) the recovered or preserved citrus yield enabled by reduced ACP transmission of HLB. Even partial recovery of pre-HLB yields would generate annual revenue that substantially exceeds the energy-side cash flows reported here. Once these two streams are integrated into the techno-economic framework, the agrivoltaic shield system is expected to demonstrate substantially stronger economics as an integrated biosecurity-and-energy infrastructure rather than as a pure energy project, positioning the central claim of self-funding biosecurity in the strict sense where the avoided infrastructure cost alone exceeds the system's capital expenditure independent of energy revenue. Quantification of this integrated economic case, drawing on the recent PRISMA review of co-benefits in dual-use solar PV systems [88], is the principal direction of follow-up work.
5. Conclusions
This study evaluated the technical and economic feasibility of vertical agrivoltaic shield walls as a dual-use solution to protect citrus groves from ACP intrusion while generating renewable electricity. Structural analysis confirmed that 2.27 m tall PV fences using A-36 steel posts meet Florida Building Code and ASCE 7-22 wind load requirements at 150 mph design speeds. The Vero Beach case study of a typical citrus grove showed that perimeter-only deployment (Case 1) yields over 600 kW-DC producing 563 MWh/year, while adding interior wind shields (Case 2) increases capacity to nearly 1MW-DC and generation to 861 MWh/year. Energy economic analysis under a three-sub-case capital-cost sensitivity sweep showed that profitability depends jointly on the compensation pathway and the project ownership structure. Under FPL net metering (Scenario A), 25-year bill savings versus the grid-only baseline reach $1.27M (Case 1) and $1.97M (Case 2) across all three CapEx sub-cases, and capital recovery is achieved with substantial margin under the owner-developed deployment: Sub-case 3 yields ROI of 20.34 percent for Case 1, and ROI of 29.51 percent for Case 2. At third-party developer pricing, both cases are below breakeven on energy alone, though Case 2 is close to recovery even under this most-conservative CapEx assumption. Wholesale export under COG-1 (Scenario B) produces substantially worse energy returns across all CapEx sub-cases because the avoided-cost rate is approximately half of the retail energy rate that net-metered exports recover. Citrus growers in Florida must therefore couple agrivoltaic shields with co-located loads matching annual PV output and adopt the owner-developer deployment structure to capture full economic value on energy alone; with both policy levers in place, the agrivoltaic shields are self-financing for both configurations evaluated. GIS scaling analysis showed that statewide deployment on Florida citrus groves alone could provide 11.9 GW of capacity generating 15.4 TWh annually, equivalent to 6% of Florida's 2024 electricity consumption. Agrivoltaic shield walls thus offer citrus growers a self-funding biosecurity infrastructure that can simultaneously combat HLB, diversify farm revenue, and accelerate Florida's clean energy transition. If this approach is extended to all Florida farms over 50 GW and 65 TWh (25.5% of state demand) would be generated while actively improving food output making agrivoltaics fences worth exploring outside of citrus as well.
Acknowledgments
This work was supported by the Natural Sciences and Engineering Research Council of Canada and the Thompson Endowment.
Appendix A. Detailed drawings of the shield walls
Figure A1.
Structural drawing of the shield walls for ACP.
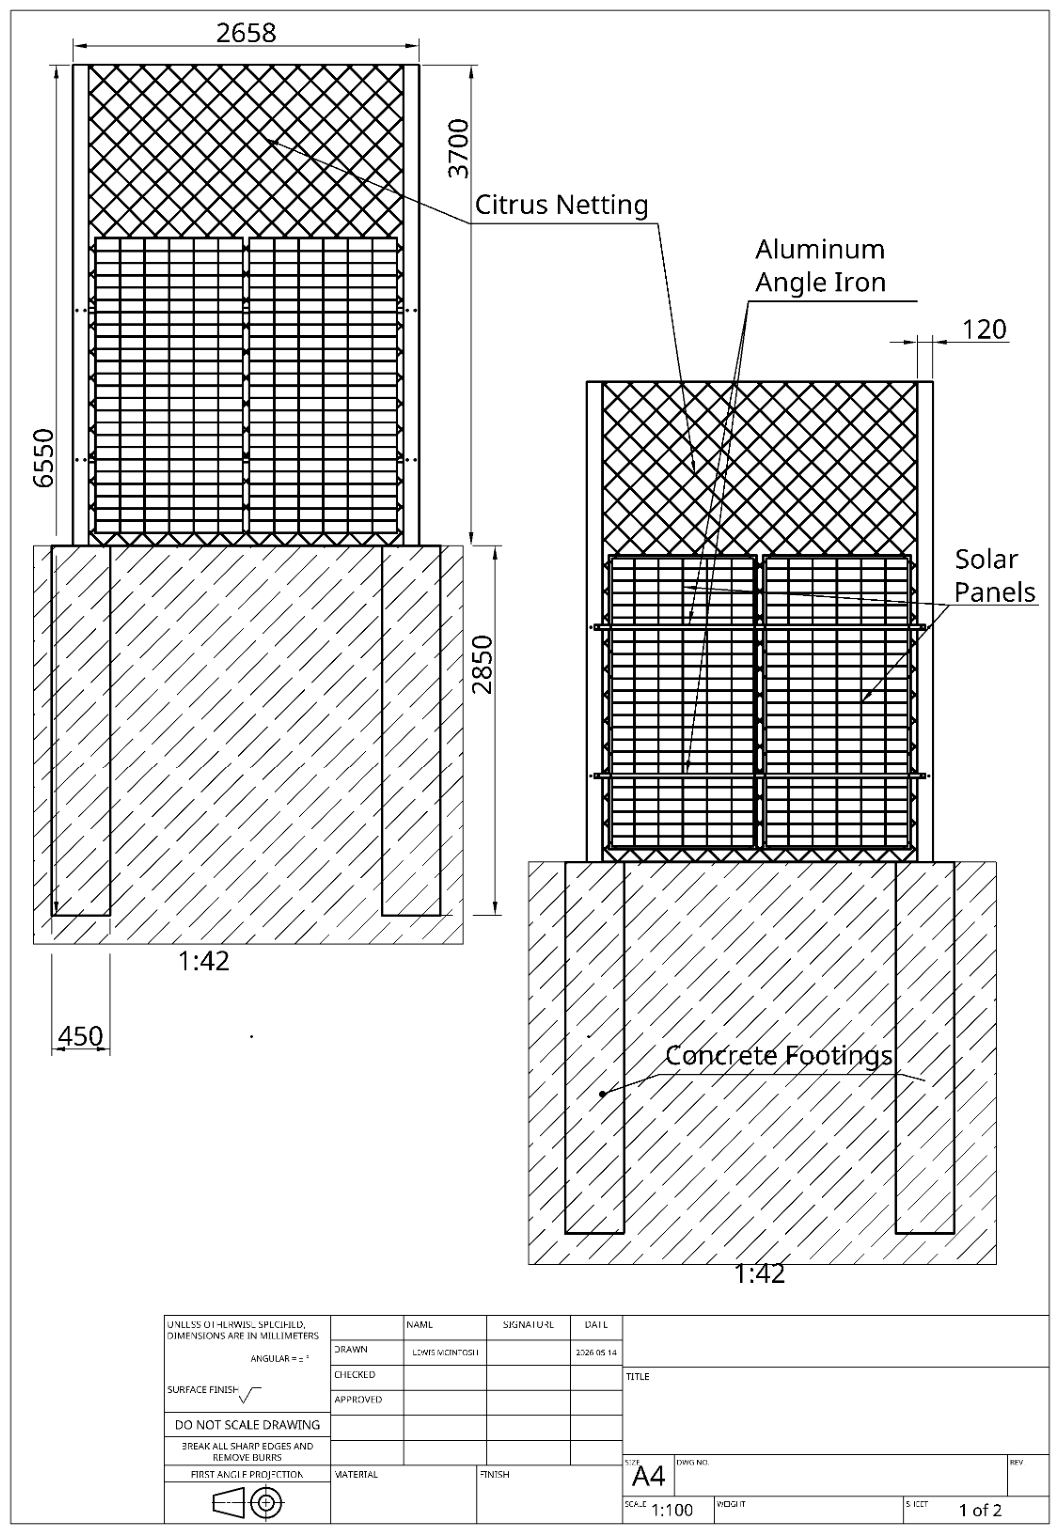
Figure A2.
Detailed drawing for the installation for solar PV modules on square posts.
Appendix B. Interconnection Rules
Sales Tax Exemption for Agricultural Facilities
Under Florida Statute Section 212.08(5)(b) [51], electricity used directly or indirectly in the production and processing of agricultural farm products on a farm is exempt from Florida's 6% state sales and use tax. Indian River County applies an additional 1% local discretionary surtax, bringing the combined tax rate applicable to most commercial electricity customers to 7%. All subsequent economic analysis in this report assumes this exemption is in place.
Legal and Regulatory Framework
Grid interconnection for customer-owned renewable energy systems in Florida are governed by: Florida Public Service Commission Rule 25-6.065 [89], Florida Administrative Code (net metering rule); FPL Electric Tariff Section 6, General Rules and Regulations for Electric Service (service agreements, parallel generation); FPL Electric Tariff Section 8, Rate Schedules (GS-1 and related billing adjustment clauses) [45]; and the FPL Interconnection Agreement for Customer-Owned Renewable Generation (Tier 1, 2, and 3 versions, available at [58]). All tariff documents are effective January 1, 2026, and are approved by the Florida Public Service Commission.
Parallel Generation Requirements (Tariff Section 6, Rule 4.5 and 4.6)
FPL Tariff Section 6, Rule 1.6(4) [45] requires FPL pre-approval of any grid-connected generation system before the system is energized. Key technical requirements include:
- All inverters must be certified to UL 1741 and comply with IEEE 1547, including automatic anti-islanding disconnection within 2 seconds of a grid outage.
- All solar PV systems must comply with National Electric Code (NEC) Article 690 for PV systems.
- Interconnections directly into the utility transformer or meter enclosure are not permitted.
Battery storage systems, if installed, must be UL 1741 certified and a permanent placard reading 'Battery storage utilized in this facility' must be affixed to the meter enclosure.
The AC ratings are derived by applying the standard 0.85 DC-to-AC derating factor as specified in FPL's interconnection agreements [90]. Both cases result in AC outputs below 1 MW, which has material implications for the FERC certification pathway described in section 2.3.8.1.
Florida implements PURPA through the Florida Public Service Commission (FPSC) pursuant to Chapter 366 [91], Florida Statutes, and Florida Administrative Code (FAC) Rules 25-17.082 through 25-17.310 [92,93]. The key state statutes and rules are:
- Section 366.91, Florida Statutes: Requires each public utility to continuously offer a purchase contract to producers of renewable energy. Mandates that payment provisions for energy and capacity be based on the utility's full avoided costs. Requires a minimum contract term of 10 years for firm capacity contracts. Provides that prudent and reasonable costs associated with a qualifying facility energy contract shall be recovered from ratepayers through the appropriate cost-recovery clause mechanism administered by the FPSC.
- Rule 25-17.082, F.A.C.: Establishes general interconnection requirements and obligations of investor-owned utilities toward qualifying facilities.
- Rule 25-17.250, F.A.C.: Requires FPL to continuously offer a Standard Offer Contract for purchase of firm capacity and energy from Renewable Energy Facilities and qualifying facilities with design capacities of 100 kW or less, based on the next avoidable fossil-fueled generating unit identified in FPL's Ten-Year Site Plan.
- Rule 25-17.0825, F.A.C.: Defines the methodology for calculating As-Available Energy avoided costs, which forms the basis of FPL's COG-1 energy payment rate.
Qualifying Facility Certification
A Qualifying Facility under PURPA [44] is defined in 18 C.F.R. Section 292.101(b) as either a qualifying small power production facility or a qualifying cogeneration facility. Both case 1 and 2 systems qualify as small power production facilities because they use renewable solar energy, and both have AC outputs well below the 80 MW statutory ceiling for small power production QFs established in 16 U.S.C. Section 796(17)(C).
Under 18 C.F.R. Section 292.204, a small power production facility qualifies if: (a) the primary energy source is a renewable resource (solar, wind, biomass, hydro, geothermal, waste) or a combination thereof; (b) the power production capacity does not exceed 80 MW; and (c) no more than 50% of the equity interest in the facility is held by an electric utility or electric utility holding company (or any combination thereof). Both case studies satisfy all three criteria.
The certification requirement depends on the facility's net power production capacity. Under 18 C.F.R. Section 292.207, the relevant threshold for mandatory FERC filing is 1 MW (1,000 kW) of net AC output. Applying the 0.85 DC-to-AC derating factor, both cases fall below this threshold:
- Case 1: 622.6 kW-DC x 0.85 = 529.2 kW-AC < 1 MW FERC filing threshold.
- Case 2: 954.8 kW-DC x 0.85 = 811.6 kW-AC < 1 MW FERC filing threshold.
For facilities below 1 MW AC, the owner may either: (a) self-certify by filing FERC Form 556 electronically at no cost (FERC eFiling system, available at ferc.gov); or (b) seek FPSC certification as a qualifying facility under Rule 25-17.080(1), F.A.C., which is the Florida-specific alternative. Under the FPL Standard Offer Contract (Docket 20250056-EQ, Sheet 9.032)[94], a qualifying facility with a design capacity of 100 kW or less must also maintain FPSC certification throughout the contract term; for larger facilities such as Florida Research Center for Agricultural Sustainability (FLARES) Cases 1 and 2, FERC self-certification or FERC Commission certification under 18 C.F.R. Section 292.207 is the primary mechanism.
FERC Form 556 requires the facility owner to provide: facility location, technology type, installed capacity, fuel type, ownership information (to confirm the 50% utility ownership limit is not exceeded), and the expected commencement of operation date. There is no filing fee for self-certifications (18 C.F.R. Section 292.207(a)). Upon filing, QF status is effective immediately and FPL's mandatory purchase obligation activates.
Under both the FPL Standard Offer Contract (Sheet 9.032) and FERC regulations, the QF owner must maintain qualifying status throughout the contract term. On or before March 31 of each year, the agrivoltaics owner must provide FPL a certificate signed by an officer certifying that the facility has continuously maintained qualifying status. FPL retains the right to inspect the facility and examine relevant records to verify qualifying status at any time during the contract term.
Appendix C. Three Pathways to Sell Power to FPL
Pathway A: Net Metering
Customer-owned renewable generation in FPL's service territory can interconnect under Florida's net-metering framework, governed by Florida Public Service Commission Rule 25-6.065 [52], and implemented through FPL Tariff Section 9, Sheets 9.050 to 9.080 (Tier 1, 2, and 3 Standard Interconnection Agreements)[46]. Unlike the COG-1 and QS-2 pathways, net metering is designed for behind-the-meter generation whose primary purpose is offsetting the customer's own retail consumption, not wholesale sale.
Under Rule 25-6.065, customer-owned renewable generators are stratified into three tiers by gross AC nameplate rating, where gross power rating equals total installed DC capacity multiplied by 0.85. Tier 1 covers systems up to 10 kW AC, Tier 2 covers systems greater than 10 kW and less than or equal to 100 kW AC, and Tier 3 covers systems greater than 100 kW and less than or equal to 2 MW AC. Applying the 0.85 derating factor, FLARES Case 1 (529.2 kW AC) and Case 2 (811.6 kW AC) both fall within Tier 3, which is the largest class eligible for expedited interconnection and net metering in Florida.
Two structural eligibility constraints in Rule 25-6.065 apply directly to the FLARES cases. First, paragraph (4)(a)1 limits the gross power rating to no more than 90 percent of the customer's existing utility distribution service rating, which means the service drop must be sized to at least 588 kW (Case 1) and 902 kW (Case 2). Second, FPL's published net-metering guidelines indicate that a system is generally expected to produce no more than 115 percent of the customer's annual kWh consumption [58]. For FLARES, the modelled annual property load of 827,119 kWh (Case 1) and 1,300,072 kWh (Case 2) is essentially identical to the corresponding annual PV generation, so both systems sit at approximately 100 percent of annual consumption, well within the 115 percent cap and consistent with the policy intent that net-metered generation be primarily for self-consumption rather than wholesale sale.
Under Rule 25-6.065(8) and the FPL Tier 3 Interconnection Agreement (Sheet 9.065 et seq.), the billing mechanics for a net-metered Tier 3 customer on rate schedule GSD-1 are as follows:
- A bi-directional meter, installed by FPL at no cost to the customer per Rule 25-6.065(8)(b), measures the difference between energy supplied by FPL and energy delivered by the customer to the grid each billing cycle.
- For any billing period in which on-site consumption exceeds generation, the customer pays the standard GSD-1 retail rate [47] (energy, fuel, environmental, capacity, conservation, and storm-protection charges) for the net kWh imported, plus the full demand charge based on the maximum measured demand during the billing period. Demand charges are not offset by exports.
- For any billing period in which generation exceeds on-site consumption, the excess kWh carries forward as a credit at the customer's retail energy rate to the next billing period, in accordance with Rule 25-6.065(8)(e).
- At the end of each calendar year (December billing cycle for FPL), any remaining unused kWh credits are paid out to the customer at the COG-1 As-Available Energy rate, currently 3.353 cents per kWh at secondary delivery voltage [48]. This is the same wholesale avoided-cost rate analyzed in Pathway B.
The economic implication of the December true-up is that a system sized to match annual consumption, as both FLARES cases are, recovers most exported kWh at the full retail energy rate (approximately 6.31 cents per kWh under GSD-1 for 2026 [47]) through monthly netting, with only the residual unused credits in December cashed at 3.353 cents per kWh. Oversizing the system would push more kWh into the December true-up and dilute the effective compensation rate toward the avoided-cost floor. This is the central economic reason that net metering favors load-matched sizing.
A material limitation of net metering for the FLARES cases is that FPL's monthly demand charge ($12.70 per kW for GSD-1, plus $1.80 per kW storm protection, $0.49 per kW conservation, $0.16 per kW capacity, less $0.12 per kW transition credit, for a net of $15.03 per kW [47]) is applied to the customer's billing-period maximum gross import demand, not the net import. Because peak demand at a citrus operation typically coincides with morning or evening hours when irrigation pumps and packing equipment operate at low PV output, the on-site solar provides little reduction in monthly billing demand. Demand charges therefore remain a fixed cost burden and are the principal reason that the net-metering economics do not fully approach the headline 6.31 cents per kWh retail energy credit.
Net metering also preserves the sales-tax exemption under Florida Statute Section 212.08(5)(b)(1) for the agricultural electricity purchased by the customer (i.e. on the net import). Energy exported and netted against consumption is not separately taxed.
Pathway B: COG-1 Schedule (As-Available Energy)
Once QF certification is obtained and an interconnection agreement is executed, there are two distinct tariff pathways to sell electricity to FPL. These are not mutually exclusive over time but, once selected, a change in billing method may only occur under specific conditions set out in FPL Tariff Section 10 [48]. FPL Tariff Schedule COG-1, As-Available Energy (Sheet 10.100), effective January 1, 2026 [48], is available to any qualifying cogeneration or small power production facility located within the State of Florida producing energy for sale to FPL on a non-firm, as-available basis. As-Available Energy is defined by FPSC Rule 25-17.0825, F.A.C. as energy produced and sold by a qualifying facility on an hour-by-hour basis for which contractual commitments as to time, quantity, or reliability of delivery are not required.
Under COG-1, FPL purchases electricity at a unit cost in cents per kilowatt-hour based on the Company's actual hourly avoided energy costs, before the sale of interchange energy, calculated in accordance with FPSC Rule 25-17.0825, F.A.C. Avoided energy costs include incremental fuel, identifiable variable operation and maintenance expense, and identifiable variable utility power purchases. Demonstrable Company administrative costs required to calculate as-available energy costs may be deducted from payments.
No capacity payments are made under COG-1. The payment is purely for energy, valued at what it costs FPL to generate that same energy from its own marginal generating unit, which for FPL is primarily natural gas. The rate is therefore highly correlated with natural gas prices on the Florida Gas Transmission Zone 3 pipeline and fluctuates hour by hour.
For facilities with an installed capacity of 100 kW or more (which applies to both cases), an hourly recording meter is mandatory under Sheet 10.102. Monthly payments are made by the 20th business day following the end of each billing period and are accompanied by a schedule showing kWh sold and the applicable as-available energy rates applied each hour.
The qualifying facility, bears all costs required for interconnection, including metering. The qualifying facility may elect to pay interconnection costs in full upon completion, by monthly invoices for costs progressively incurred, or through equal monthly installments over no more than 36 months upon a showing of creditworthiness (Tariff Sheet 10.103).
The avoided cost energy rate payable to the agrivoltaics owner under either pathway is derived from two officially published components found in FPL's approved Electric Retail Tariff, effective January 1, 2026, approved by the Florida Public Service Commission in Docket Nos. 20250011-EI and associated dockets.
The first component is FPL's fuel charge, which represents the exact per-kWh fuel cost passed through to customers and is structurally identical to the avoided fuel cost FPL would incur if it purchased energy from a qualifying facility instead of generating it from natural gas. For the GS-1 rate schedule applicable to the cases owned by a commercial customer, the fuel charge effective January 1, 2026, is 3.201 cents per kWh, as published in FPL Tariff Section 8, Sheet 8.030 (Seventieth Revised Sheet, Docket 20250011-EI)[47].
The second component is the fixed variable operation and maintenance (O&M) adder specified in FPL COG-1 Tariff Sheet 10.101 (Fifty-Third Revised Sheet, effective January 1, 2026): 'As-Available Energy cost payments will include 0.01540 cents per kWh for variable operation and maintenance expenses.' This O&M adder is fixed and does not fluctuate with natural gas prices [48].
Combining these two components yields the total estimated avoided energy rate of 3.2164 cents/kWh.
A delivery voltage adjustment is then applied per Tariff Sheet 10.101. For secondary voltage delivery, which applies to both cases given their sub-1 MW scale, the multiplier is 1.0413 [48], so, the adjusted effective rate (secondary voltage) is 3.350 cents/kWh.
Pathway C: QS-2 Schedule (Firm Capacity and Energy)
FPL Tariff Schedule QS-2, Firm Capacity and Energy (Sheet 10.300 et seq.) [48], is available to qualifying facilities that commit to deliver firm power on a reliable schedule tied to FPL's identified avoided generating unit. Under the current Standard Offer Contract (Docket 20250056-EQ, effective April 1, 2025, expiring April 1, 2026), the FPL avoided unit is a 469 MW combustion turbine with an in-service date of June 1, 2032.
Under QS-2, the agrivoltaics owner would receive both capacity payments and energy payments in exchange for meeting minimum performance standards of 94% availability during both on-peak and all hours, as measured against the avoided unit's operating profile. The contract term must be no less than 10 years after the in-service date of the avoided unit (June 1, 2032), making the minimum term effectively through approximately 2042.
The energy rate under QS-2 has two options available to the qualifying facility seller: Option A, based on the Company's actual hourly avoided energy costs calculated in accordance with FPSC Rule 25-17.0825, F.A.C., identical in methodology to the COG-1 rate; and Option B, based on the Company's year-by-year projection of system incremental fuel costs, plus a fuel market volatility risk premium mutually agreed upon by FPL and the qualifying facility no later than November 15 of each preceding year. Option B provides greater price predictability but requires annual renegotiation of the risk premium.
Capacity payments under QS-2 are determined by the characteristics of the 2032 avoided unit and are published in Tariff Sheet 10.311.1, titled '2032 Avoided Unit Fixed Value of Deferral Payments.' The capacity payment schedule reflects the net present value of the costs FPL avoids by not building the avoided combustion turbine, allocated over the contract term. Multiple capacity payment options are available (Normal, Early, Early Levelized, Levelized, and Deferred) with identical net present values but different time profiles, giving the qualifying facility flexibility to select the payment stream best suited to its financial needs.
Solar PV facilities face important considerations under QS-2: because solar generation does not have a firm, dispatchable output, FLARES must commit to meeting the 94% availability standard, which for an intermittent resource may require battery storage or generator backup to guarantee firm delivery. Without storage, a solar-only system cannot reliably meet the on-peak performance thresholds required to qualify for full capacity payments, as FPL's on-peak hours (12 noon to 9:00 PM ET, April through October) do not perfectly align with peak solar production, and evening capacity cannot be guaranteed without storage. Section 366.91(3), Florida Statutes [59], provides that capacity payments are not required if the operational characteristics of the renewable energy generator make it unlikely to provide any capacity value to the utility.
Appendix D. Interconnection Requirements
Grid interconnection for both system cases must satisfy three concurrent regulatory layers: (i) FPSC Rules 25-6.065 (net metering and customer-owned renewable generation) [52] and 25-17.082 through 25-17.310 (QF interconnection) [92,93]; (ii) FPL Electric Tariff Sections 6, 9, and 10 (General Rules, Standard Interconnection Agreements, and Cogeneration Rate Schedules COG-1, QS-2)[45,46,48,58]; and (iii) FERC regulations under 18 C.F.R. Part 292 for QF certification [95]. The following technical and procedural requirements apply to both Case 1 (529.2 kW AC) and Case 2 (811.6 kW AC) regardless of which sales pathway is selected:
- Tier classification. Both cases are Tier 3 systems under Rule 25-6.065(4)(a), defined as customer-owned renewable generation greater than 100 kW and less than or equal to 2 MW AC. Tier 3 systems require execution of the FPL Tier 3 Interconnection Agreement (Sheet 9.065 et seq.) prior to energization.
- Three-phase service. Systems with a gross power rating of 50 kW AC or greater must interconnect at 120/208 V or 277/480 V three-phase WYE, per FPL Engineering Service Standards and Rule 25-6.065(7). If three-phase service is not currently available at the meter, the customer bears the cost of utility upgrades.
- Inverter and protection standards. All inverters must be tested and listed by a nationally recognized testing laboratory for continuous interactive operation in compliance with IEEE 1547, IEEE 1547.1, and UL 1741, per Rule 25-6.065(3) and Tier 3 Agreement Section 3.1. Anti-islanding disconnection must occur automatically upon loss of grid voltage. All PV equipment must comply with National Electric Code Article 690.
- Manual disconnect switch. A visible load-break manual disconnect switch, lockable in the open position with a single FPL utility padlock and accessible to FPL personnel at all times, must be installed adjacent to the FPL meter socket per Tier 3 Agreement Section 5.1. The same disconnect is required under the QS-2 Standard Offer Contract.
- Liability insurance. The customer must maintain general liability insurance for personal injury and property damage of not less than $2 million throughout the term of the Tier 3 Interconnection Agreement, per Rule 25-6.065(6)(e) and Tier 3 Agreement Section 13.1.
- Application fees and Fast Track screening. Tier 3 requires a $1,000 application fee per Tier 3 Agreement Section 2.3. FPL performs a Fast Track screening (Attachment 3 of the Tier 3 Agreement) testing, among other criteria, that aggregate generation on the radial distribution circuit does not exceed 15 percent of line-section annual peak load, that the proposed system contributes no more than 10 percent of distribution-circuit fault current, and that protective devices do not exceed 87.5 percent of short-circuit interrupting capability. If the system fails any Fast Track screen, an Interconnection Study is required at a $2,000 fee, refundable to actual cost.
- Service capacity limit. Gross power rating must not exceed 90 percent of the customer's utility distribution service rating per Rule 25-6.065(4)(a)1 and Tier 3 Agreement Section 2.1. For FLARES, this requires the FPL service drop to be sized at no less than approximately 588 kW (Case 1) and 902 kW (Case 2).
- Metering. Pathways B and C (COG-1, QS-2) require an hourly recording meter for facilities of 100 kW installed capacity or greater, per COG-1 Tariff Sheet 10.102. Pathway A (net metering) requires a bi-directional meter installed by FPL at no cost to the customer per Rule 25-6.065(8)(b).
- Building-code certification. The customer must obtain and provide to FPL local building-code official certification that the installation is permitted, inspected, and approved for both electrical and mechanical compliance, per Tier 3 Agreement Section 3.5. Operation prior to FPL bi-directional meter installation is prohibited.
- Cost responsibility. Under all three pathways, the customer bears the full cost of interconnection facilities and any distribution upgrades identified through the Fast Track or Interconnection Study process, per Tier 3 Agreement Section 9.1 (net metering) and COG-1 Tariff Sheet 10.103 (cogeneration purchase). Monthly variable O&M of FPL interconnection facilities is recovered at 0.000 percent of metering equipment cost, 0.086 percent of distribution equipment cost, and 0.039 percent of transmission equipment cost.
- Performance security (QS-2 only). A QS-2 firm-capacity contract additionally requires a surety bond, letter of credit, or comparable assurance acceptable to FPL per Standard Offer Contract Sheet 9.040. Failure to achieve the Capacity Delivery Date entitles FPL to the full security amount as liquidated damages.
- Sizing cap (Pathway A only). Net-metered systems are generally expected to be sized so that estimated annual generation does not exceed 115 percent of the customer's annual kWh consumption. Both FLARES cases at approximately 100 percent of modelled annual load satisfy this constraint.
Both systems are below the 1 MW AC threshold in 18 C.F.R. Section 292.207, allowing self-certification as a Qualifying Facility via FERC Form 556 at no cost, as discussed in Section 2.3.8.1.
| 1 | Excluding land lease costs, exempting 80% property tax on the just value of any installed renewable energy device for nonresidential real property based on Florida Statutes § 193.624 [50]. |
References
- Cooper, D. Florida Citrus Decline Detailed - Florida Citrus Industry Magazine. Citrus Ind. Mag. 2025. [Google Scholar]
- Halladay, K. Florida Citrus Acreage and Production Decline Again. Available online: https://www.thepacker.com/news/produce-crops/florida-citrus-acreage-and-production-decline-again (accessed on 20 March 2026).
- Layden, J.R. and L. 20 Years of Citrus Greening Has Beaten Florida Industry to a Pulp. Few Resilient Growers Remain. Available online: https://www.news-press.com/story/news/local/2025/07/30/florida-citrus-acreage-low-hurricanes-greening-industry/84530562007/ (accessed on 20 March 2026).
- Alquézar, B.; Carmona, L.; Bennici, S.; Peña, L. Engineering of Citrus to Obtain Huanglongbing Resistance. Curr. Opin. Biotechnol. 2021, 70, 196–203. [Google Scholar] [CrossRef] [PubMed]
- Bové, J.M. Huanglongbing: A Destructive, Newly-Emerging, Century-Old Disease of Citrus. J. Plant Pathol. 2006, 88, 7–37. [Google Scholar]
- Citrus Huanglongbing: Review, Present Status and Future Strategies | Springer Nature Link. Available online: https://link.springer.com/chapter/10.1007/1-4020-2606-4_4 (accessed on 20 March 2026).
- Limayem, A.; Martin, E.M.; Shankar, S. Study on the Citrus Greening Disease: Current Challenges and Novel Therapies. Microb. Pathog. 2024, 192, 106688. [Google Scholar] [CrossRef] [PubMed]
- Gonzatto, M.P.; Santos, J.S. Introductory Chapter: World Citrus Production and Research. In Citrus Research - Horticultural and Human Health Aspects; IntechOpen, 2023; ISBN 978-1-80355-805-9. [Google Scholar]
- Zhong, G.; Nicolosi, E. Citrus Origin, Diffusion, and Economic Importance. In The Citrus Genome; Gentile, A., La Malfa, S., Deng, Z., Eds.; Springer International Publishing: Cham, 2020; pp. 5–21. ISBN 978-3-030-15308-3. [Google Scholar]
- Citrus Huanglongbing: A Newly Relevant Disease Presents Unprecedented Challenges | Phytopathology®. Available online: https://apsjournals.apsnet.org/doi/10.1094/PHYTO-12-12-0331-RVW (accessed on 20 March 2026).
- Tardivo, C.; Monus, B.; Pugina, G.; Strauss, S.L.; Alferez, F.; Albrecht, U. Delaying Candidatus Liberibacter Asiaticus Infection of Citrus Trees through Use of Individual Protective Covers and Systemic Delivery of Oxytetracycline. Front. Plant Sci. 2025, 16. [Google Scholar] [CrossRef] [PubMed]
- Pazolini, K.; Arruda, J.H.; Chinelato, G.A.; Filho, A.B.; Belasque, J. Temporal Progress of Huanglongbing Epidemics and the Effect of Noncommercial Inoculum Sources on Citrus Orchards in São Paulo State, Brazil. Plant Dis. 2021, 105, 2472–2483. [Google Scholar] [CrossRef] [PubMed]
- Candidatus Liberibacter Asiaticus (Citrus Greening) | CABI Compendium. Available online: https://www.cabidigitallibrary.org/doi/10.1079/cabicompendium.16565 (accessed on 20 March 2026).
- Tardivo, C.; Monus, B.; Pugina, G.; Strauss, S.L.; Alferez, F.; Albrecht, U. Delaying Candidatus Liberibacter Asiaticus Infection of Citrus Trees through Use of Individual Protective Covers and Systemic Delivery of Oxytetracycline. Front. Plant Sci. 2025, 16. [Google Scholar] [CrossRef] [PubMed]
- Yang, K.; Hu, B.; Zhang, W.; Yuan, T.; Xu, Y. Recent Progress in the Understanding of Citrus Huanglongbing: From the Perspective of Pathogen and Citrus Host. Mol. Breed. 2024, 44, 77. [Google Scholar] [CrossRef] [PubMed]
- Limayem, A.; Martin, E.M.; Shankar, S. Study on the Citrus Greening Disease: Current Challenges and Novel Therapies. Microb. Pathog. 2024, 192, 106688. [Google Scholar] [CrossRef] [PubMed]
- Lewis-Rosenblum, H.; Martini, X.; Tiwari, S.; Stelinski, L.L. Seasonal Movement Patterns and Long-Range Dispersal of Asian Citrus Psyllid in Florida Citrus. J. Econ. Entomol. 2015, 108, 3–10. [Google Scholar] [CrossRef] [PubMed]
- Stelinski, L.L. Ecological Aspects of the Vector-Borne Bacterial Disease, Citrus Greening (Huanglongbing): Dispersal and Host Use by Asian Citrus Psyllid, Diaphorina Citri Kuwayama. Insects 2019, 10. [Google Scholar] [CrossRef] [PubMed]
- Center, U.C.R. and E. Psyllid Management. Available online: https://crec.ifas.ufl.edu/people/faculty/lukasz-stelinski/stelinski-laboratory/psyllid-management/ (accessed on 21 March 2026).
- Martini, X.; Pelz-Stelinski, K.S.; Stelinski, L.L. Absence of Windbreaks and Replanting Citrus in Solid Sets Increase Density of Asian Citrus Psyllid Populations. Agric. Ecosyst. Environ. 2015, 212, 168–174. [Google Scholar] [CrossRef]
- Patt, J.M. Occurrence of Coccinellids That Prey on Diaphorina Citri (Hemiptera: Liviidae) on Euphorbia Heterophylla (Euphorbiaceae) and Chamaecrista Fasciculata (Fabaceae) in a South Florida Residential Area. flen 2018, 101, 131–134. [Google Scholar] [CrossRef]
- Sétamou, M.; Alabi, O.J.; Tofangsazi, N.; Grafton-Cardwell, E. COPF: Citrus Orchard Perimeter Fencing as a Strategy for Reducing Asian Citrus Psyllid (Hemiptera:Liviidae) Infestation. J. Appl. Entomol. 2018, 142, 959–966. [Google Scholar] [CrossRef]
- Qureshi, J.A.; Stansly, P.A. Asian Citrus Psyllid: Biology, Ecology and Management of the Huanglongbing Vector; CABI, 2020; ISBN 978-1-78639-408-8. [Google Scholar]
- CMG19/HS1304: 2025–2026; Florida Citrus Production Guide: Citrus under Protective Screen (CUPS) Production Systems. Available online: https://ask.ifas.ufl.edu/publication/HS1304 (accessed on 22 March 2026).
- Solar Energy Farm Expected to Be Built on Former Citrus Land near Vero. Available online: https://www.tcpalm.com/story/news/local/indian-river-county/2025/06/12/solar-energy-farm-expected-to-be-built-on-former-citrus-land-near-vero/84122932007/ (accessed on 20 March 2026).
- Bayles, T. Chapter 10: The Fading Small Grove. Available online: https://www.heraldtribune.com/story/news/2008/12/16/chapter-10-the-fading-small-grove/64610801007/ (accessed on 22 March 2026).
- Slater, N. Vernia Solar Energy Center Expected to Be Built West of Vero Beach, Serve 15,000 Homes. Available online: https://www.tcpalm.com/story/news/local/indian-river-county/2025/06/12/solar-energy-farm-expected-to-be-built-on-former-citrus-land-near-vero/84122932007/ (accessed on 3 May 2026).
- Florida Building Code Chapter 16 Structural Design - 2023 Florida Building Code, Building, Eighth Edition. Available online: https://codes.iccsafe.org/content/FLBC2023P2/chapter-16-structural-design (accessed on 8 April 2026).
- Engineering Express About ASCE 7’s Directionality Factor Kd. Eng. Express 2026.
- ASCE Amplify Velocity Pressure Coefficient. Available online: https://amplify.asce.org/popup-data?apath=/asceworks/standard/9780784415788/part/provisions/standard-chapter/s26/standard-sec-ver/s26.10.1.ver.atom (accessed on 8 April 2026).
- ASCE Amplify Topographic Factor. Available online: https://amplify.asce.org/popup-data?apath=/asceworks/standard/9780784415788/part/provisions/standard-chapter/s26/standard-sec-ver/s26.8.2.ver.atom (accessed on 8 April 2026).
- Metwally, I. Calculating Wind Loads on Buildings Using the Envelope Procedure of ASCE 7-22 Code 2026. [PubMed]
- Rosencutter, C. Wind Loads on Freestanding Walls. In Meca Enterprises; 2021. [Google Scholar]
- ASCE Amplify Gust Factor. Available online: https://amplify.asce.org/popup-data?apath=/asceworks/standard/9780784415788/part/commentary/commentary-chapter/sc26/commentary-sec-errata/sc26.11.err.atom (accessed on 8 April 2026).
- CanmetENERGY/Housing, Buildings and Communities National Resources Canada Solar Ready Guidelines. 2013.
- Hunsone Allowable Bending Stress Of Steel 2024
- UpCodes Chapter 18 Soils and Foundations: 2020 FBC - Building, 7th Edition. Available online: https://up.codes/viewer/florida/fl-building-code-2020/chapter/18/soils-and-foundations#18 (accessed on 9 April 2026).
- Florida Research Center for Agricultural Sustainability - Home Page. Available online: http://www.flaresearch.com/Welcome.html (accessed on 22 March 2026).
- CSI Solar Co; Ltd. BiHiKu6 CSW-550MB-AG 2020.
- National Laboratory of the Rockies Welcome - System Advisor Model - SAM. Available online: https://sam.nlr.gov/ (accessed on 15 March 2026).
- Government of Canada; C.E.R. CER – ARCHIVED – Economics of Solar Power in Canada – Appendix A: Methods. Available online: https://www.rec-cer.gc.ca/en/data-analysis/energy-commodities/electricity/report/archive/solar-power-economics/economics-solar-power-in-canada-appendix-methods.html (accessed on 10 April 2026).
- Gallardo, F.; García, J.; Monforti Ferrario, A.; Comodi, G.; Chiu, J.N.W. Assessing Sizing Optimality of OFF-GRID AC-Linked Solar PV-PEM Systems for Hydrogen Production. Int. J. Hydrogen Energy 2022, 47, 27303–27325. [Google Scholar] [CrossRef]
- 16 U.S. Code § 824a-3 - Cogeneration and Small Power Production. Available online: https://www.law.cornell.edu/uscode/text/16/824a-3 (accessed on 3 May 2026).
- PURPA Qualifying Facilities | Federal Energy Regulatory Commission. Available online: https://www.ferc.gov/qf (accessed on 3 May 2026).
- FPL Rates | Retail Regulatory, Rates, Rules and Tariffs. Available online: https://www.fpl.com/rates/retail-tariffs.html (accessed on 14 March 2026).
- FPL FPL Tariff Section 9. Standard Interconnection Agreements (Sheets 9.050 to 9.080, Tier 1, 2, and 3) 2022.
- FPL FPL Electric Tariff Section 8, Fifty-Fourth Revised Sheet No. 8.105 (GSD-1 General Service Demand.
- FPL FPL Electric Tariff Section 10, Sheet 10.100-10.103 (COG-1 As-Available Energy Schedule, Fourth Revised Sheet 10.100). 2026. [PubMed]
- Basore, P. Q1-2024 Solar Cost Benchmarks 2025. [PubMed]
- Florida Statutes Statutes & Constitution: Assessment of Renewable Energy Source Devices. Available online: https://www.leg.state.fl.us/Statutes/index.cfm?App_mode=Display_Statute&URL=0100-0199/0193/Sections/0193.624.html (accessed on 4 June 2026).
- Florida Department of Revenue Florida Dept. of Revenue - Sales Tax Incentives. Available online: https://floridarevenue.com/taxes/taxesfees/Pages/sales_tax_incent.aspx (accessed on 14 March 2026).
- Adopted via Order PSC-08-0161-FOF-EI, Docket 070674-EI; PUBLIC SERVICE COMMISSION FPSC Rule 25-6.065, F.A.C. Interconnection and Net Metering of Customer-Owned Renewable Generation. 2008.
- Sadat, S.A.; Takahashi, J.; Pearce, J.M. A Free and Open-Source Microgrid Optimization Tool: SAMA the Solar Alone Multi-Objective Advisor. Energy Convers. Manag. 2023, 298, 117686. [Google Scholar] [CrossRef]
- Sadat, S.A. Sas1997/SAMA 2025. [CrossRef]
- Monetary Policy Report. Available online: https://www.bankofcanada.ca/2023/07/mpr-2023-07-12/ (accessed on 11 June 2024).
- Federal Reserve Discount Window Current Discount Rates. Available online: https://www.frbdiscountwindow.org/ (accessed on 15 April 2025).
- Mikofski, M.A.; Darawali, R.; Hamer, M.; Neubert, A.; Newmiller, J. Bifacial Performance Modeling in Large Arrays. In Proceedings of the 2019 IEEE 46th Photovoltaic Specialists Conference (PVSC); IEEE: Chicago, IL, USA, June 2019; pp. 1282–1287. [Google Scholar]
- FPL Clean Energy | Net Metering Guidelines. Available online: https://www.fpl.com/clean-energy/net-metering/guidelines.html (accessed on 14 March 2026).
- Florida Legislature Chapter 366 Section 91 - 2024 Florida Statutes. Available online: https://www.flsenate.gov/Laws/Statutes/2024/366.91 (accessed on 11 May 2026).
- Cole, W.; Ramasamy, V.; Turan, M. Cost Projections for Utility-Scale Battery Storage: 2025 Update. 2025. [Google Scholar] [CrossRef]
- Hayibo, K.S.; Pearce, J.M. A GIS-Driven Framework for Quantifying Agricultural Fence-Mounted Solar Photovoltaic Energy Potential 2026. [CrossRef]
- USDA - National Agricultural Statistics Service - Crop Sequence Boundaries (CSB). Available online: https://www.nass.usda.gov/Research_and_Science/Crop-Sequence-Boundaries/ (accessed on 3 May 2026).
- Gilman, P.; DiOrio, N.A.; Freeman, J.M.; Janzou, S.; Dobos, A.; Ryberg, D. p. NREL/TP--6A20-67399; SAM Photovoltaic Model Technical Reference 2016 Update. 2018; p. 1429291.
- Pitt, D.; Michaud, G. Assessing the Value of Distributed Solar Energy Generation. Curr. Sustain. Renew. Energy Rep. 2015, 2, 105–113. [Google Scholar] [CrossRef]
- Hayibo, K.S.; Pearce, J.M. A Review of the Value of Solar Methodology with a Case Study of the U.S. VOS. Renew. Sustain. Energy Rev. 2021, 137, 110599. [Google Scholar] [CrossRef]
- FPL | Energy My Way | Solar. Available online: https://www.fpl.com/energy-my-way/solar.html (accessed on 13 May 2026).
- Ad, D.; N, B.; M, S.K.; Subbiah, G.; Singh, R.P.; K, K.P. Enhancing Solar Drying Systems through Integrated Thermal Energy Storage and Solar-Assisted Heat Pump Technologies: A Pathway to Sustainable Food Processing. Results Eng. 2025, 28, 107125. [Google Scholar] [CrossRef]
- Tu, R.; Wang, L.; Liu, L. Performance and Configuration Optimization for a Grid-Connected PV Power Supply System with Demand-Supply Matching in a Data Center’s Centralized Water-Cooling System. Sol. Energy 2024, 276, 112667. [Google Scholar] [CrossRef]
- Figini, E.; Paolone, M. Achieving Dispatchability in Data Centers: Carbon and Cost-Aware Sizing of Energy Storage and Local Photovoltaic Generation. Sustain. Energy Grids Netw. 2025, 43, 101920. [Google Scholar] [CrossRef]
- Keshavarzfard, R.; Zinati Yazdi, S.A. Techno-Economic Assessments of a Cogeneration System of Large-Scale Solar Photovoltaic Energy and Bitcoin Cryptocurrency Mining. Sol. Energy 2025, 302, 114019. [Google Scholar] [CrossRef]
- McDonald, M.T.; Hayibo, K.S.; Hafting, F.; Pearce, J. Economics of Open-Source Solar Photovoltaic Powered Cryptocurrency Mining. Ledger 2023, 8. [Google Scholar] [CrossRef]
- Li, X.; Jia, R. Energy-Aware Scheduling Algorithm Optimization for AI Workloads in Data Centers Based on Renewable Energy Supply Prediction. J. Comput. Innov. Appl. 2024, 2, 56–65. [Google Scholar]
- Hammam, A.H.; Nayel, M.A.; Mohamed, M.A. Optimal Design of Sizing and Allocations for Highway Electric Vehicle Charging Stations Based on a PV System. Appl. Energy 2024, 376, 124284. [Google Scholar] [CrossRef]
- Bhatti, A.R.; Salam, Z.; Aziz, M.J.B.A.; Yee, K.P.; Ashique, R.H. Electric Vehicles Charging Using Photovoltaic: Status and Technological Review. Renew. Sustain. Energy Rev. 2016, 54, 34–47. [Google Scholar] [CrossRef]
- Nikkhah, M.H.; Lotfi, H.; Samadi, M.; Hajiabadi, M.E. Energy Hub Management Considering Demand Response, Distributed Generation, and Electric Vehicle Charging Station. Int. Trans. Electr. Energy Syst. 2023, 2023, 9042957. [Google Scholar] [CrossRef]
- Alfraidi, W.; Alaql, F.; AlMuhanna, K.; Farh, H.M.H.; Al-Shamma’a, A.A. Designing EV Charging Energy Hubs to Meet Flexibility Requirements in Smart Grids. World Electr. Veh. J. 2025, 16, 43. [Google Scholar] [CrossRef]
- Leeuwen, V.; Sebastiaan, B. Modelling of Battery Electric Truck Charging Strategies at a Logistical Facility for Regional-Haul Operations in Sweden over a Year. 2025. [Google Scholar] [PubMed]
- Engler, N.; Krarti, M. Review of Energy Efficiency in Controlled Environment Agriculture. Renew. Sustain. Energy Rev. 2021, 141, 110786. [Google Scholar] [CrossRef]
- Asgari, N.; Jamil, U.; Pearce, J.M. Net Zero Agrivoltaic Arrays for Agrotunnel Vertical Growing Systems: Energy Analysis and System Sizing. Sustainability 2024, 16, 6120. [Google Scholar] [CrossRef]
- Haque, S.E. The Effects of Climate Variability on Florida’s Major Water Resources. Sustainability 2023, 15, 11364. [Google Scholar] [CrossRef]
- Almajali, Tareq Abdel Hameed; Ismail, F.B.; Gunnasegaran, P.A.; Kazem, H.A.; Shurafa, S.M.A.; Al-Muhsen, N.F.O. Solar-Powered Advances in Water Desalination: A Comprehensive Review of Recent Research. Appl. Sol. Energy 2025, 61, 117–145. [Google Scholar] [CrossRef]
- Ouabi, H.; Lajouad, R.; Kissaoui, M.; El Magri, A. Hydrogen Production by Water Electrolysis Driven by a Photovoltaic Source: A Review. E-Prime-Adv. Electr. Eng. Electron. Energy 2024, 8, 100608. [Google Scholar] [CrossRef]
- Roy, R.; Antonini, G.; Hayibo, K.S.; Rahman, M.M.; Khan, S.; Tian, W.; Boutilier, M.S.H.; Zhang, W.; Zheng, Y.; Bassi, A.; et al. Comparative Techno-Environmental Analysis of Grey, Blue, Green/Yellow and Pale-Blue Hydrogen Production. Int. J. Hydrogen Energy 2025, 116, 200–210. [Google Scholar] [CrossRef]
- Du, Z.; Denkenberger, D.; Pearce, J.M. Solar Photovoltaic Powered On-Site Ammonia Production for Nitrogen Fertilization. Sol. Energy 2015, 122, 562–568. [Google Scholar] [CrossRef]
- Comer, B.M.; Fuentes, P.; Dimkpa, C.O.; Liu, Y.-H.; Fernandez, C.A.; Arora, P.; Realff, M.; Singh, U.; Hatzell, M.C.; Medford, A.J. Prospects and Challenges for Solar Fertilizers. Joule 2019, 3, 1578–1605. [Google Scholar] [CrossRef]
- Gaire, S.; Albrecht, U.; Batuman, O.; Qureshi, J.; Zekri, M.; Alferez, F. Individual Protective Covers (IPCs) to Prevent Asian Citrus Psyllid and Candidatus Liberibacter Asiaticus from Establishing in Newly Planted Citrus Trees. Crop Prot. 2022, 152, 105862. [Google Scholar] [CrossRef]
- Alferez, F.; Albrecht, U.; Gaire, S.; Batuman, O.; Qureshi, J.; Zekri, M. Individual Protective Covers (IPCs) for Young Tree Protection from the HLB Vector, the Asian Citrus Psyllid: HS1425, 10/2021. EDIS 2021 2021. [Google Scholar] [CrossRef]
- Hayibo, K.S.; Jamil, U.; Pearce, J.M. Additional Value of Non-Electricity Generating Services (Co-Benefits) Provided by Non-Conventional Dual Use Solar Photovoltaic Systems: A PRISMA Review. Renew. Sustain. Energy Rev. 2025, 222, 116021. [Google Scholar] [CrossRef]
- LII / Legal Information Institute. Fla. Admin. Code Ann. R. 25-6.065 - Interconnection and Metering of Customer-Owned Renewable Generation. Available online: https://www.law.cornell.edu/regulations/florida/Fla-Admin-Code-Ann-R-25-6-065 (accessed on 14 March 2026).
- Www.Floridapsc.Com - /Pscfiles/Library/Filings/2025/02518-2025/. Available online: https://www.floridapsc.com/pscfiles/library/filings/2025/02518-2025/ (accessed on 3 May 2026).
- Chapter 366 Section 91 - 2024 Florida Statutes - The Florida Senate. Available online: https://www.flsenate.gov/Laws/Statutes/2024/366.91 (accessed on 3 May 2026).
- Fla. Admin. Code Ann. R. 25-17.310 - Dispute Resolution. Available online: https://www.law.cornell.edu/regulations/florida/Fla-Admin-Code-Ann-R-25-17-310 (accessed on 3 May 2026).
- Fla. Admin. Code Ann. R. 25-17.0825 - As-Available Energy. Available online: https://www.law.cornell.edu/regulations/florida/Fla-Admin-Code-Ann-R-25-17-0825 (accessed on 3 May 2026).
- FPL Florida Power & Light Company’s Petition for Approval of a Renewable Energy Tariff and Standard Offer Contract 2025
- 18 CFR Part 292 -- Regulations Under Sections 201 and 210 of the Public Utility Regulatory Policies Act of 1978 with Regard to Small Power Production and Cogeneration. Available online: https://www.ecfr.gov/current/title-18/part-292 (accessed on 11 May 2026).
Figure 1.
Lengths of the fences in the N-S and E-W direction.
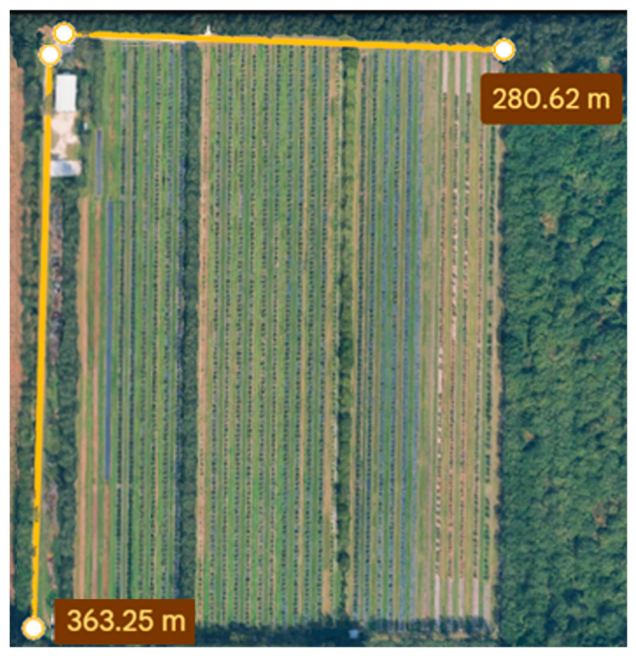
Figure 2.
a) Drawing of each fence unit. A rendering of the front (b) and back (c) of the PV fence.
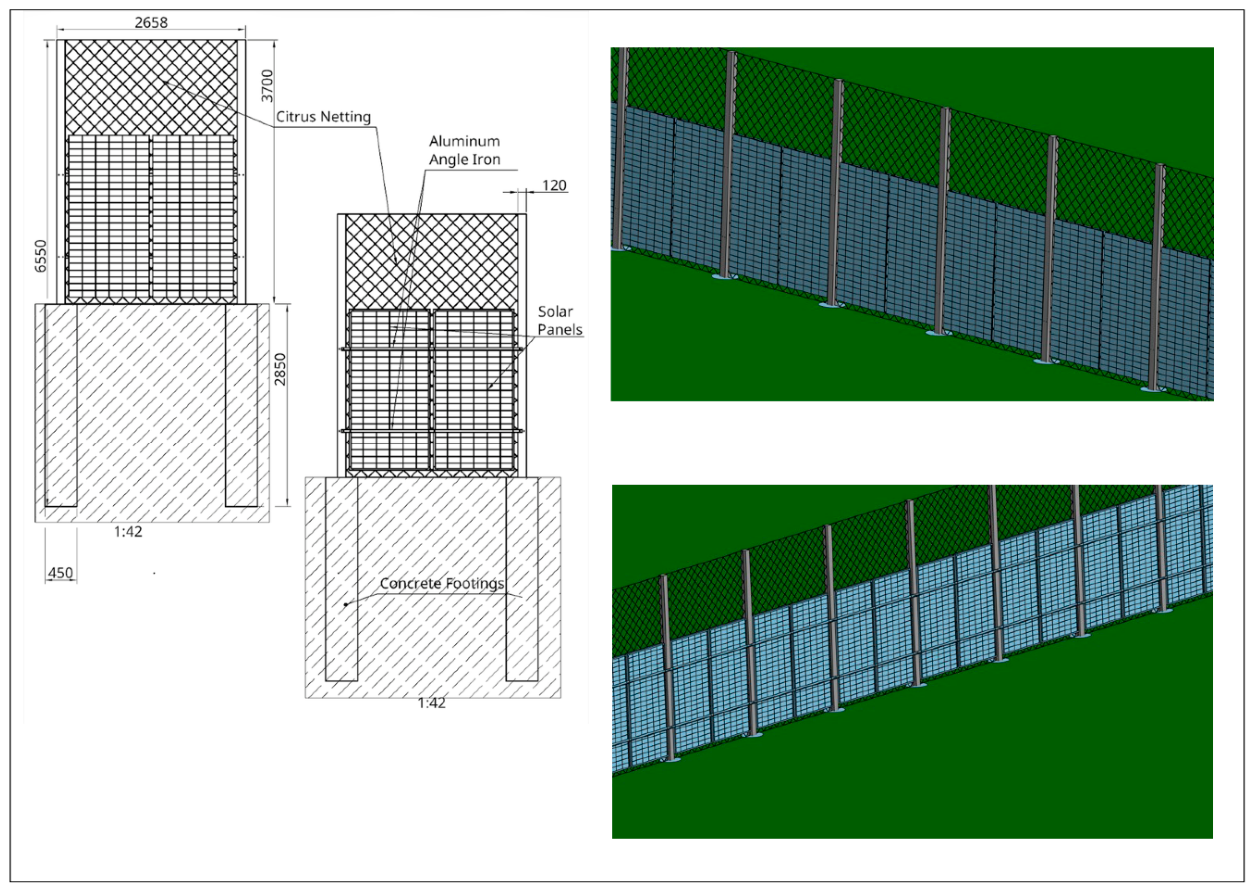
Figure 3.
The placement of solar PV modules in a) Case 1, and b) Case 2.
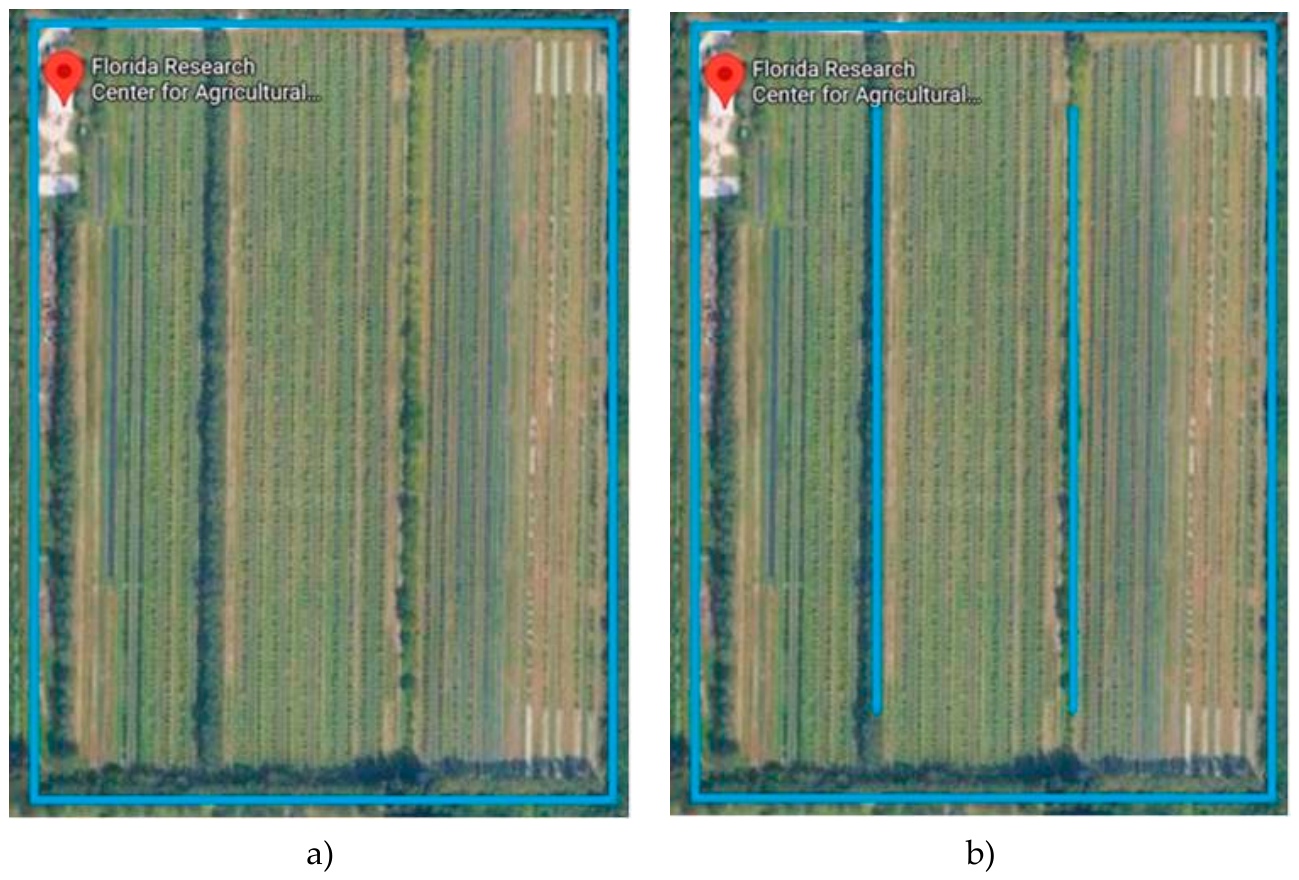
Figure 4.
Monthly energy output per kW of PV installed for the N-S,E-W fences, and wind shields.
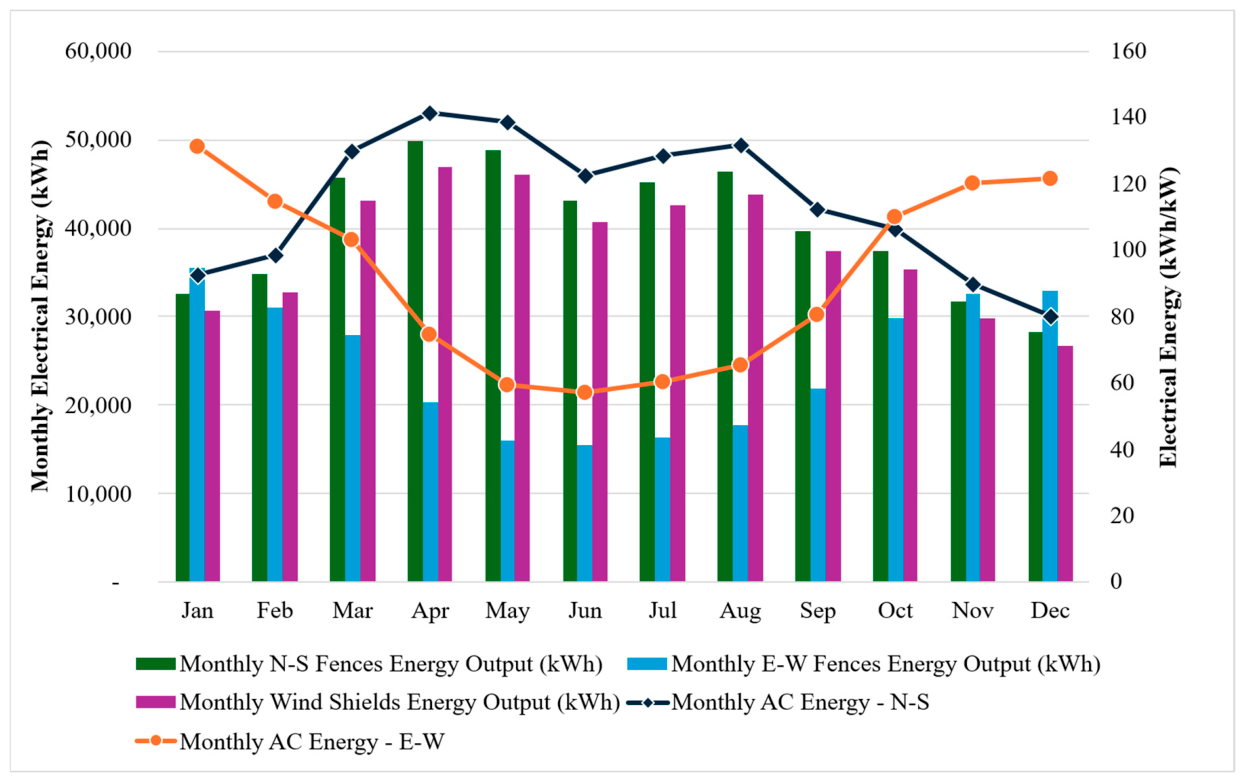
Figure 5.
GIS Simulation result of citrus farms fence PV capacity and energy production. (a) Citrus farms spatial distribution in the Florida. (b) Module-weighted fence azimuth distribution. (c) Potential fence PV capacity. (d) Fence PV annual energy production.
Figure 5.
GIS Simulation result of citrus farms fence PV capacity and energy production. (a) Citrus farms spatial distribution in the Florida. (b) Module-weighted fence azimuth distribution. (c) Potential fence PV capacity. (d) Fence PV annual energy production.
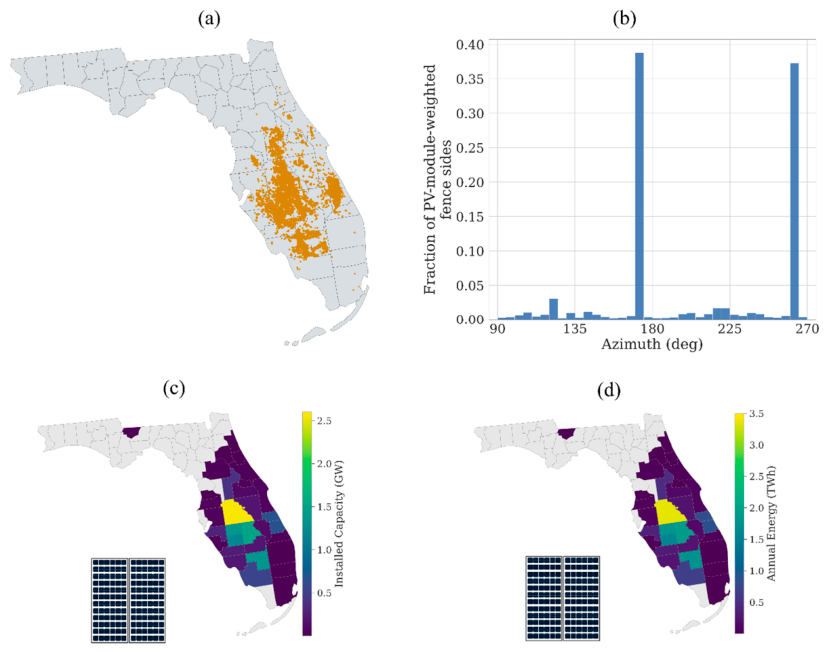
Figure 6.
Fence mounted PV potential in all farms across the state of Florida. (a) PV capacity. (b) Annual energy production.
Figure 6.
Fence mounted PV potential in all farms across the state of Florida. (a) PV capacity. (b) Annual energy production.
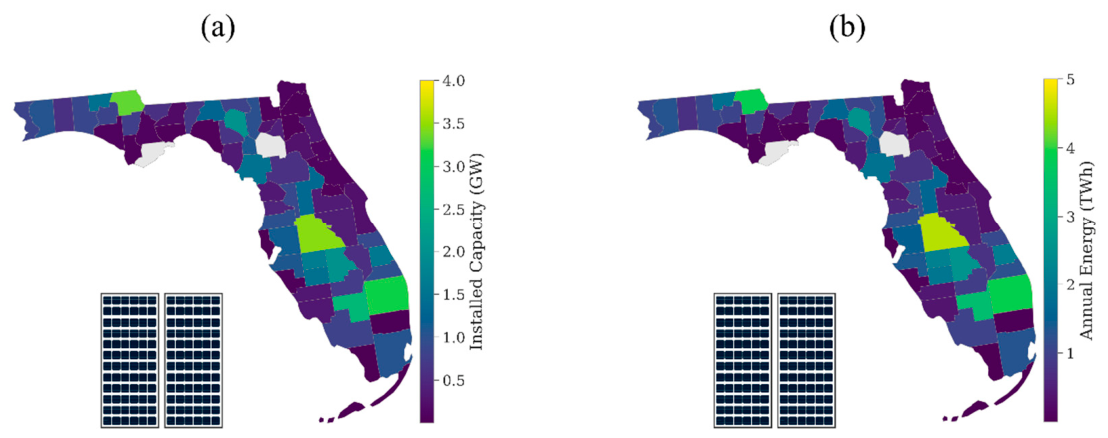

Table 1.
SAM input parameters for case study energy simulations.
| Parameters | N-S Fences/Wind Shields | E-W Fences | |
|---|---|---|---|
| PV Module | BiHiKu6 CSW-550MB-AG by CSI Solar Co, Ltd. [39] | ||
| Module Type | Mono crystalline silicon - bifacial | ||
| Bifaciality | 0.7 | ||
| Tracking & Orientation | Fixed | Fixed | |
| Azimuth | 90o | 180 o | |
| Tilt Angle | 90 o | ||
| DC Power Rating | 0.81 kWdc | ||
| DC to AC Ratio | 0.91 | ||
| Soiling Losses | 5% [41] | ||
| Inverter | Northern Electric & Power Co Ltd.: BDM-550 [240V] | ||
| DC Power Losses | 4.4% [42] | ||
| AC Power Losses | 1% [42] | ||
Table 2.
PV system cases for grid connection to FPL.
| Parameter | Case 1 (perimeter only) | Case 2 (maximize power) |
|---|---|---|
| DC system size | 622.6 kW-DC | 954.8 kW-DC |
| AC derating | 0.85 | 0.85 |
| PURPA Qualifying Facility tier | Small Power Production (<1 MW) | Small Power Production (<1 MW) |
| FERC Form 556 required? | Optional (< 1 MW AC) | Optional (< 1 MW AC) |
| Applicable FPL pathway | Net metering, COG-1, QS-2 Standard Offer Contract | Net metering, COG-1, QS-2 Standard Offer Contract |
Table 3.
Different options to get compensation for selling power to the grid.
| Feature | Net Metering (Rule 25-6.065, Tier 3) | COG-1 (As-Available Energy) | QS-2 (Firm Capacity and Energy) |
|---|---|---|---|
| Contract required? | Yes, FPL Tier 3 Interconnection Agreement (Sheet 9.065 et seq.); no minimum contract term | No, available immediately under tariff | Yes, minimum 10-year Standard Offer Contract |
| Energy payment rate | Exports netted against imports at full GSD-1 retail energy rate (~6.31 cents/kWh); year-end unused credits cashed at COG-1 rate (~3.35 cents/kWh) | Actual hourly avoided cost, ~3.35 cents/kWh (fuel + O&M) | Actual hourly avoided cost (same as COG-1 basis) during and outside dispatch hours |
| Capacity payment | None; demand charge continues to apply on gross import per Rule 25-6.065(8)(h) | None | Yes, in $/kW-month, based on 469 MW CT avoided unit (2032 in-service date) |
| Price certainty | High for monthly-netted exports (set annually by GSD-1 tariff); volatile for the residual cashed at year-end true-up | Volatile, tracks natural gas prices hourly | Option B: fixed annual projection agreed Nov 15 each year; Option A: actual hourly costs |
| Performance requirement | None; intermittent solar output acceptable | None | 94% availability on-peak and all hours; performance security required |
| Contract offer expiry | Ongoing under Rule 25-6.065; no expiry while system remains interconnected | Ongoing under tariff | April 1, 2026 (current Standard Offer Contract) |
| Metering required | Bi-directional meter installed by FPL at no cost to customers per Rule 25-6.065(8)(b) | Hourly recording meter (mandatory >= 100 kW installed capacity) | Same as COG-1 plus additional performance metering |
| Best suited for | Behind-the-meter generation sized at or below 115% of annual consumption to offset on-site load; not for stand-alone wholesale sale | Flexible, no-commitment energy sales; simpler to implement | Maximizing revenue with capacity payments; requires firm delivery commitment |
Table 4.
Scenario A outputs by SAMA.
| Metric (Scenario A: Net Metering, GSD-1) | Case 1 | Case 2 | ||||
|---|---|---|---|---|---|---|
| Sub-Case 1 (NREL Benchmark) | Sub-Case 2 (Breakeven: $1451.25/kW) | Sub-Case 3 (Owner-developed agrivoltaic deployment) | Sub-Case 1 (NREL Benchmark) | Sub-Case 2 (Breakeven: $1583.65/kW) | Sub-Case 3 (Owner-developed agrivoltaic deployment) | |
| DC system size | 622.6 kW | 622.6 kW | 622.6 kW | 954.8 kW | 954.8 kW | 954.8 kW |
| Inverter capacity | 622.6 kW | 622.6 kW | 622.6 kW | 954.8 kW | 954.8 kW | 954.8 kW |
| Battery storage | None | None | None | None | None | None |
| Annual PV generation (DC) | 827,118 | 827,118 | 827,118 | 1,300,095 | 1,300,095 | 1,300,095 |
| Annual PV generation (AC) | 781,047 kWh | 781,047 kWh | 781,047 kWh | 1,227,680 kWh | 1,227,680 kWh | 1,227,680 kWh |
| Annual property load | 827,119 kWh | 827,119 kWh | 827,119 kWh | 1,300,072 kWh | 1,300,072 kWh | 1,300,072 kWh |
| Annual kWh bought from FPL | 466,106 | 466,106 | 466,106 | 733,475 | 733,475 | 733,475 |
| Annual kWh sold to FPL (net-metered) | 420,035 | 420,035 | 420,035 | 661,083 | 661,083 | 661,083 |
| Annual peak demand (with HES) | 94.42 kW | 94.42 kW | 94.42 kW | 148.41 kW | 148.41 kW | 148.41 kW |
| Annual demand charge (Year 1) | $17,030 | $17,030 | $17,030 | $26,767 | $26,767 | $26,767 |
| Initial capital cost | $1,064,943 | $902,681 | $898,625 | $1,548,611 | $1,512,069 | $1,304,378 |
| Total O&M cost over 25 years (PV) | $366,067 | $366,067 | $187,307 | $460,947 | $460,947 | $282,236 |
| System Net Present Costs (NPC) | $1,957,519 | $1,795,258 | $1,612,443 | $2,859,760 | $2,821,767 | $2,436,817 |
| Grid-only baseline NPC | $1,795,261 | $1,795,261 | $1,795,261 | $2,821,803 | $2,821,803 | $2,821,803 |
| 25-year total savings (Present Value) | $1,268,750 | $1,268,750 | $1,268,750 | $1,971,600 | $1,971,600 | $1,971,600 |
| Year 1 savings (Present Value) | $49,068 | $49,068 | $49,068 | $76,251 | $76,251 | $76,251 |
| Savings versus grid-only (25-year) | 70.7 % | 70.7 % | 70.7 % | 69.9 % | 69.9 % | 69.9 % |
| LCOE (with HES) | $0.08 / kWh | $0.07 / kWh | $0.06 / kWh | $0.07 / kWh | $0.07 / kWh | $0.07 / kWh |
| IRR | -1.18 % | 0 % | 1.44% | -0.18% | 0% | 2.04% |
| Simple payback period | None | 25 yrs | 22 yrs | None | 25 yrs | 20 yrs |
| Total net profit (25-year, PV) | $-162259 | $2.69 | $182,817 | $-37,957 | $35 | $384,985 |
| ROI | -15.24 % | 0% | 20.34% | -2.45 % | 0 | 29.51% |
Table 5.
Scenario B outputs by SAMA.
| Metric (Scenario B: Wholesale Export, COG-1) | Case 1 | Case 2 | ||||
|---|---|---|---|---|---|---|
| Sub-Case 1 (NREL Benchmark) | Sub-Case 2 (Breakeven: $503.17/kW) | Sub-Case 3 (Owner-developed agrivoltaic deployment) | Sub-Case 1 (NREL Benchmark) | Sub-Case 2 (Breakeven: $635.7/kW) | Sub-Case 3 (Owner-developed agrivoltaic deployment) | |
| DC system size | 622.6 kW | 622.6 kW | 622.6 kW | 954.8 kW | 954.8 kW | 954.8 kW |
| Inverter capacity | 622.6 kW | 622.6 kW | 622.6 kW | 954.8 kW | 954.8 kW | 954.8 kW |
| Battery storage | None | None | None | None | None | None |
| Annual PV generation (DC) | 827,118 kWh | 827,118 kWh | 827,118 kWh | 1,300,095 kWh | 1,300,095 kWh | 1,300,095 kWh |
| Annual kWh sold to FPL (COG-1) | 781,047 | 781,047 | 781,047 | 1,227,680 | 1,227,680 | 1,227,680 |
| FPL wholesale COG-1 rate (secondary voltage) | 3.353 cents / kWh | 3.353 cents / kWh | 3.353 cents / kWh | 3.353 cents / kWh | 3.353 cents / kWh | 3.353 cents / kWh |
| Initial capital cost | $1,064,943 | $312973 | $898,625 | $1,548,611 | $606,384 | $1,304,378 |
| Total O&M cost over 25 years (PV) | $366,067 | $366,067 | $187,307 | $460,948 | $460,948 | $282,236 |
| 25-year grid earnings (Present Value) | $679,044 | $679,044 | $679,044 | $1,067,347 | $1,067,347 | $1,067,347 |
| Year 1 monthly average grid earnings (PV) | $2,188/ month | $2,188/ month | $2,188/ month | $3,440 / month | $3,440 / month | $3,440 / month |
| NPC | $751965 | -$4.73 | $406,889 | $942,211 | -15.89 | $519,268 |
| LCOE | $0.05 / kWh | $0 / kWh | $0.03 / kWh | $0.04 / kWh | 0 | $0.02/kWh |
| IRR | -7.31% | 0 | -4.05% | -5.90 % | 0 | -3.46% |
| Simple payback period | No payback within 25 years | 25 yrs | No payback within 25 years | No payback within 25 years | 25 yrs | No payback within 25 years |
| Total net profit (25-year, PV) | -$751965 | 4.73 | -$406,889 | -$942,211 | 15.89 | -$519,268 |
| ROI | -70.61% | 0 | -45.28% | -60.84% | 0 | -39.81% |
Table 6.
Florida fence PV capacity GIS simulation results summary.
| Dataset | Citrus Farms | All Farms |
|---|---|---|
| Fence PV Capacity (GW) | 11.91 | 51.61 |
| Energy Production (TWh) | 15.40 | 65.03 |
| Energy Yield (kWh/kWp) | 1,272.01 | 1,254.20 |
| Total Fence Length (thousands of km) | 24.77 | 107.49 |
| Total Farms Area (km²) | 2,654.81 | 10,707.03 |
| Linear Packing Factor (W/m) | 480.66 | 480.00 |
| Energy Density (Wh/m²) | 11,211.06 | 9,821.61 |
| Energy Consumption in Florida in 2024 (TWh) | 255.1 | 255.1 |
| Percent Coverage by Farm Fence-Mounted PV (%) | 6.04 | 25.49 |
Disclaimer/Publisher’s Note: The statements, opinions and data contained in all publications are solely those of the individual author(s) and contributor(s) and not of MDPI and/or the editor(s). MDPI and/or the editor(s) disclaim responsibility for any injury to people or property resulting from any ideas, methods, instructions or products referred to in the content. |
© 2026 by the authors. Licensee MDPI, Basel, Switzerland. This article is an open access article distributed under the terms and conditions of the Creative Commons Attribution (CC BY) license (http://creativecommons.org/licenses/by/4.0/).
Copyright: This open access article is published under a Creative Commons CC BY 4.0 license, which permit the free download, distribution, and reuse, provided that the author and preprint are cited in any reuse.