

Submitted:
09 September 2026
Posted:
09 September 2026
You are already at the latest version
Abstract
The aim of this study was to develop a technology for the magnetron synthesis of hafnium carbonitride coatings and to develop a method for determining the melting temperature of the synthesized coating material that correlates with the melting temperatures of the corresponding bulk materials. Using magnetron sputtering, a coating with a composition of 53 at.% Hf, 27 at.% C, and 20 at.% N was obtained. X-ray diffraction and electron microscopy studies were performed to characterize the synthesized coatings. The results demonstrated the feasibility of magnetron synthesis of hafnium carbonitride coatings with a specified stoichiometric composition. The nitrogen concentration in the plasma-forming gas required for the onset of Hf–C–N compound formation was determined. A method for determining the melting temperature of thin-film coatings was developed, providing an approach for determining the melting temperatures of new materials in thin-film form.
Keywords:
hafnium carbonitride
; Hf–C–N coatings
; magnetron sputtering
; thin films
; X-ray diffraction
; lattice parameter
; melting temperature
; refractory materials
1. Introduction
Currently, the development of the aerospace industry and the demand for increasingly high-temperature turbines have stimulated the search for new materials with high melting temperatures [1,2,3,4,5]. In 2015, a study was published [6] in which the Hf–Ta–C system was investigated using electronic-structure calculations. This system includes compounds with some of the highest melting temperatures known to date. The study identified the key chemical factors contributing to high melting temperatures. Based on these factors, a class of materials potentially exhibiting even higher melting temperatures was proposed, and molecular dynamics calculations were used to determine the composition corresponding to the maximum melting temperature. It was found that a hafnium carbonitride coating with a composition of 53 at.% Hf, 27 at.% C, and 20 at.% N should have a melting temperature of approximately 4500 K. The application of such coatings in turbine engineering could increase the operating temperature and, consequently, the efficiency of electricity generation [7,8]. The use of hafnium carbonitride coatings in space technology to protect rocket-nozzle surfaces against burn-through could enable an increase in the temperature and exhaust velocity of the working gases, thereby increasing the payload that can be delivered into orbit. In addition, coatings with ultrahigh melting temperatures are required to protect the surfaces of hypersonic vehicles [9]. In our study, thin-film Hf–C–N coatings were prepared by magnetron deposition. However, experimental methods for investigating the thermophysical properties of materials, particularly their melting temperatures under stationary conditions, are generally limited to temperatures of approximately 3300 K. These limitations are associated with technical difficulties such as chemical reactions, surface contamination, heat transfer, evaporation, loss of mechanical strength and electrical conductivity, and other effects that become significant as a sample is maintained at high temperatures for extended periods. Therefore, various dynamic experimental methods are commonly employed to investigate the behavior of the thermophysical properties of refractory materials near their melting points [11,12]. However, in the present case, the thin-film form of the material prevents the direct application of melting-temperature measurement methods developed for bulk materials. Therefore, we propose a method for determining the melting temperature of thin-film materials deposited by magnetron sputtering.
2. Materials and Methods
To prepare coating samples of the Hf–C–N system, an ion-plasma system with two independent magnetron sputtering systems was developed [13], the schematic of which is shown in Figure 1. The setup consists of a vacuum chamber, on the walls of which planar direct-current (DC) magnetrons are mounted. The sputtering targets serve as cathodes, behind which water-cooled magnetic systems are located. Inside the vacuum chamber, a rotating cylinder is mounted to hold the substrates and move them relative to the magnetrons. For the preparation of hafnium–carbon system coating samples, a rotation speed of 10 revolutions per minute was selected. Thus, during the sputtering process, which lasted 40–60 minutes for coatings of this system, each substrate passed by the hafnium and carbon sputtering magnetrons 400–600 times. The experimental setup is described in more detail in [10].
The sample preparation involved the sequential operations of simultaneous sputtering of hafnium and carbon targets in an Ar–N2 gas low-pressure plasma and the deposition of sputtered materials from hafnium and carbon over the course of the sputtering time.
The substrate temperature during sample formation did not exceed 100 °C. In the experiments, hafnium (99.96 wt. %) and carbon (99.99 wt. %) were used as targets, with diameters of 40 mm and thicknesses of 4 mm.
The ratio and thickness of the deposited components were controlled by the weight and the amount of sputtered and deposited metal during the formation of the coating and, in parallel, by Rutherford backscattering of 14N ions using a DC-60 accelerator from the Eurasian University (Nur-Sultan, Kazakhstan).
X-ray diffraction (XRD) measurements were conducted on a Bruker D8 “Discover” X-ray diffractometer manufactured in the USA. The X-ray beam, originating from a copper target, was collimated using a parabolic multilayer mirror and a pyrolytic graphite monochromator set to isolate Cu K radiation. The data were collected in Bragg–Brentano geometry (–2) over an angular range of – with a step size of 0.01°.
Electron microscopy studies were carried out using the JSM-8230 electron probe microanalyzer (JEOL, Japan).
3. Results
Our previous study investigated the structure and properties of hafnium carbide thin films produced by magnetron deposition [13]. In that work, a four-channel ion-plasma system was also used for the synthesis of the coating samples. The system consisted of a vacuum chamber, a gas-mixture supply system, a magnetron deposition system, and a sample-positioning system [14]. For the synthesis of hafnium carbonitride films, a chamber equipped with four coaxially arranged magnetrons was used. To increase the synthesis rate, the chamber was equipped with hafnium and carbon targets according to the configuration shown in Figure 1. This arrangement makes it possible to approximately double the deposition rate of the components and, at the same time, reduce the temperature inside the vacuum chamber during coating synthesis. In contrast to the previous experiment, in which hafnium and carbon were sputtered in an inert argon atmosphere, an argon–nitrogen gas mixture was used in the present study to facilitate nitride formation.
To subsequently obtain a hafnium carbonitride coating with a composition of 53 at.% Hf, 27 at.% C, and 20 at.% N, it was first necessary to establish the deposition conditions for hafnium carbide with a hafnium-to-carbon ratio of 66.2 at.% Hf and 33.8 at.% C. To achieve this composition, we used our previously obtained data on the sputtering conditions for hafnium and carbon [13]. Based on these data, the required power supplied to the magnetrons was calculated to obtain a coating with the desired hafnium-to-carbon ratio.
To incorporate nitrogen into the coating, hafnium and carbon were sputtered in an argon–nitrogen atmosphere. As a result, a hafnium–carbon coating with a composition of 66.2 at.% Hf and 33.8 at.% C was obtained. X-ray diffraction analysis showed that, under these conditions, a hafnium carbide coating was formed, represented by a hafnium carbide phase with a face-centered cubic (FCC) crystal structure. The lattice parameter of the unit cell was determined to be nm.
According to measurements of the amount of material sputtered from the hafnium and carbon targets, determined gravimetrically from the change in target mass before and after sputtering, the obtained deposition conditions provide the required hafnium-to-carbon ratio. These Hf–C coating synthesis conditions will subsequently make it possible to vary the nitrogen content in the argon–nitrogen gas mixture and thereby synthesize coatings with the desired stoichiometric composition.
To establish the sputtering conditions for hafnium and carbon in a nitrogen-containing plasma-forming gas and obtain hafnium carbonitride, it was necessary to synthesize Hf–C coatings at different nitrogen concentrations in the plasma-forming gas in order to increase the nitrogen content in the compound to 20 at.%. An experiment was carried out to synthesize Hf–C coatings while varying the nitrogen concentration in the plasma-forming gas from 30 to 5 vol.%, with the power supplied to the hafnium and carbon magnetrons kept constant. The nitrogen content in the gas mixture was varied from 30 to 5 vol.% while maintaining the other deposition parameters constant, including the power supplied to the magnetrons and the gas pressure in the vacuum chamber.
X-ray diffraction analysis of the Hf–C–N coating synthesized at a nitrogen concentration of 30 vol.% in the plasma-forming gas showed the formation of a cubic hafnium nitride phase with a lattice parameter of nm, together with a small amount of a cubic hafnium carbide phase with a lattice parameter of nm. The hafnium nitride phase was predominant in the coating. A further decrease in the nitrogen concentration in the plasma-forming gas to 25 vol.% resulted in a slight decrease in the lattice parameter of the hafnium nitride phase to nm and a slight increase in the lattice parameter of the hafnium carbide phase to nm. At nitrogen concentrations ranging from 20 to 10 vol.% in the plasma-forming gas, the formation of a cubic phase with a lattice parameter of nm was observed, accompanied by broadened diffraction peaks in the X-ray diffractogram (Figure 2). It was not possible to unambiguously assign this phase to either hafnium nitride or hafnium carbide. Most likely, this phase results from the superposition of the HfC and HfN crystal lattices due to the structural similarity of these two phases.
At nitrogen concentrations of 15 and 10 vol.%, only a slight change in the lattice parameter was observed, with nm at 15 vol.% N and nm at 10 vol.% N. As the nitrogen concentration in the plasma-forming gas decreased, an increase in the coating texture along the (111) crystallographic direction was observed. A further decrease in the nitrogen concentration in the plasma-forming gas to 5 vol.% resulted in the formation of a hexagonal hafnium carbide phase in the coating, with unit-cell parameters of nm and nm (Figure 2).
The experimental results, together with the results of microprobe analysis of the hafnium carbonitride samples and the phase composition of the coatings, are presented in Table 1.
The data presented in Table 1 and the X-ray diffraction results indicate that the most active nitridation of hafnium and carbon occurs at nitrogen concentrations of 10–15 vol.% in the plasma-forming gas. At higher nitrogen concentrations, the nitridation process slows down. These results demonstrate that the nitrogen content in the gas phase directly affects the nitridation process in the Hf–C–N system. Accordingly, controlling the nitrogen concentration in the plasma-forming gas makes it possible to control the stoichiometry of the Hf–C–N system. At nitrogen concentrations of 10–15 vol.% in the plasma-forming gas, a cubic (FCC) structure is formed, which exhibits a composition closest to the target hafnium carbonitride composition of 53 at.% Hf, 27 at.% C, and 20 at.% N. Therefore, Hf–C–N coatings were subsequently synthesized at nitrogen concentrations of 14, 13, 12, and 11 vol.% in the plasma-forming gas, followed by X-ray diffraction analysis.
According to the X-ray diffraction analysis, varying the nitrogen concentration in the plasma-forming gas from 14 to 13 vol.% (Figure 3) resulted in the formation of a face-centered cubic (FCC) phase in the coating. A further decrease in the nitrogen concentration did not change the phase composition of the coating but resulted only in a slight variation in the lattice parameter (Table 2). When the nitrogen concentration was reduced to 12 and 11 vol.%, a sharp decrease in the nitrogen content of the coating was observed. Thus, a nitrogen concentration of 13 vol.% in the plasma-forming gas can be considered the threshold for the onset of the nitridation reaction during magnetron synthesis of this type of coating. Therefore, we found that the coating obtained by ion-plasma synthesis at a nitrogen concentration of 14 vol.% in the plasma-forming gas has a composition closest to that of the target hafnium carbonitride alloy with a composition of 53 at.% Hf, 27 at.% C, and 20 at.% N.
According to electron microscopy studies, the coatings exhibit a fine-grained structure with an average grain size of approximately 30 nm and a uniform surface coverage. Figure 4 shows a micrograph of the surface of the film synthesized at a nitrogen concentration of 14 vol.% in the plasma-forming gas. No large inclusions of hafnium carbide or carbon were detected, which confirms the X-ray diffraction results indicating the presence of a single-phase Hf–C–N coating. All other Hf–C–N thin-film coatings exhibited a similar surface morphology to that shown in Figure 4.
3.1. Determination of the Melting Temperature of Thin-Film Coatings
The next objective was to estimate the potential melting temperature of the synthesized Hf–C–N coatings when scaling the synthesis from thin films to bulk materials. Existing techniques for investigating the melting behavior of thin films, including nanocalorimetry, high-temperature X-ray diffraction (HT-XRD), and ellipsometry, characterize melting directly in the thin-film state. Moreover, the melting temperature of thin films depends on their thickness and decreases as the film thickness approaches the dimensions of the unit cell. The influence of the substrate on which the coating is deposited must also be taken into account, which further complicates the analysis.
The main idea of our research is to synthesize new model (laboratory-scale) materials and alloys by magnetron deposition in the form of thin films, followed by scaling them up to bulk materials. This approach could enable the development and application of new materials and alloys for the production of components with unique properties. Therefore, it became necessary to estimate the potential melting temperature of the synthesized materials for their subsequent application in bulk form.
Based on this consideration, we developed a method for measuring the melting temperature of thin-film coatings of refractory metals and their alloys. To investigate the melting temperatures of the coatings, thin films of various metals with a thickness of 0.5 m were synthesized and deposited onto glass substrates. The deposition was performed through a mask of a specific shape, as shown in Figure 5.
The thin-film metal samples with known melting temperatures—Cu, Nb, Mo, V, Hf, and W—as well as the HfC and HfCN coatings synthesized in this study, were subsequently prepared using the mask shown in Figure 5.
The melting temperature was measured by passing a current pulse through a narrow section of the film (Figure 6). When a critical voltage was reached, the current pulse caused a micro-explosion of the film. The current pulse was generated using a laboratory-developed setup consisting of a power supply, capacitors, an electronic switching device, and measurement instrumentation (Figure 6).
The power supply is used to charge the capacitors, which have a total capacitance of 412 F. After the capacitors are charged to the required voltage, pressing the electronic switch mechanically closes the circuit, allowing the current pulse from the charged capacitors to pass through the circuit containing the sample.
After the film melts and the circuit is interrupted, the voltage at which the break occurs is recorded. The voltage of the current pulse is selected experimentally for each material by gradually increasing the voltage until the narrow section of the sample is destroyed. As a result of melting caused by the high energy accumulated in the capacitors and the high electrical resistance of the material in the narrow section, a break is formed in the film, interrupting the current flow throughout the circuit.
The process is recorded by an oscilloscope through two channels. The first channel is connected to voltage taps located at the sample terminals to minimize external influences and provide a more accurate determination of the voltage across the narrow section of the sample. The second channel is connected to a 0.1 shunt resistor located as close as possible to the sample mounting point, allowing the current to be subsequently calculated.
The oscilloscope records the voltage signals and stores the data in the memory of a connected computer, from which the recorded signals are subsequently converted into digital data for further analysis. A general view of the laboratory setup is shown in Figure 7.
Next, reference voltage points corresponding to the failure of the narrow sections of films made of metals with known melting temperatures, namely W, Mo, V, Nb, and Cu, were determined. These data were then used to calibrate the measurement method. Figure 8 presents the results obtained after calibration of the method for determining the melting temperature () of thin films using metals with known melting temperatures.
The obtained data made it possible to measure the melting temperatures of Hf and HfC coatings. Since the melting temperatures of these materials are well established, these measurements also provided an additional validation of the reliability of the proposed method (Figure 9). As a result, the melting temperatures of thin-film coatings synthesized by magnetron deposition were determined, including the Hf–C–N coating with a stoichiometric composition of 53 at.% Hf, 27 at.% C, and 20 at.% N.
4. Conclusions
As a result of the study, Hf–C–N coatings were synthesized by magnetron sputtering while varying the composition of the plasma-forming gas over a nitrogen concentration range of 5–30 vol.%. The nitrogen concentration in the plasma-forming gas required to form an Hf–C–N phase with a stoichiometric composition of 53 at.% Hf, 27 at.% C, and 20 at.% N was determined. X-ray diffraction studies were performed to characterize the structural and phase transformations occurring with changes in the nitrogen concentration in the plasma-forming gas during magnetron deposition. A method for measuring the melting temperature of thin-film coatings of refractory metals and their alloys was developed. The melting temperatures of thin-film coatings synthesized by magnetron deposition were determined, including the Hf–C–N coating with a stoichiometric composition of 53 at.% Hf, 27 at.% C, and 20 at.% N. The results obtained suggest that further development of the proposed method for measuring the melting temperature of thin films produced by magnetron deposition may provide a basis for predicting the melting temperatures of new materials and alloys when scaling their synthesis from thin films to bulk materials.
Funding
This research was funded by the Ministry of Science and Higher Education of the Republic of Kazakhstan under Program No. BR24993119.
References
- Padture, N.P.; Gell, M.; Jordan, E.H. Thermal barrier coatings for gas-turbine engine applications. Science 2002, 296, 280–284. [CrossRef]
- Perepezko, J.H. The hotter the engine, the better. Science 2009, 326, 1068. [CrossRef]
- Lu, K. The future of metals. Science 2010, 328, 319. [CrossRef]
- Liu, G.; Zhang, G.J.; Jiang, F.; Ding, X.D.; Sun, Y.J.; Sun, J.; Ma, E. Nanostructured high-strength molybdenum alloys with unprecedented tensile ductility. Nature Materials 2013, 12, 344–350. [CrossRef]
- Wuchina, E.; Opila, E.; Opeka, M.; Fahrenholtz, W.; Talmy, I. UHTCs: Ultra-high temperature ceramic materials for extreme environment applications. Electrochemical Society Interface 2007, 16, 30–36.
- Hong, Q.-J. Prediction of the material with highest known melting point from ab initio molecular dynamics calculations. Physical Review B 2015, 92, 020104(R).
- Marino, K.A.; Hinnemann, B.; Carter, E.A. Atomic-scale insight and design principles for turbine engine thermal barrier coatings from theory. Proceedings of the National Academy of Sciences of the United States of America 2011, 108, 5480–5487.
- Padture, N.P.; Gell, M.; Jordan, E.H. Thermal barrier coatings for gas-turbine engine applications. Science 2002, 296, 280–284. [CrossRef]
- Nieto, A.; Kumar, A.; Lahiri, D.; Zhang, C.; Seal, S.; Agarwal, A. Oxidation behavior of graphene nanoplatelet reinforced tantalum carbide composites in high temperature plasma flow. Carbon 2014, 67, 398–408. [CrossRef]
- Tuleushev, A.Zh.; Tuleushev, Yu.Zh.; Volodin, V.N. Nanoscale alloying in metal films. Physics of Metals and Metallography 2004, 97, 49–57.
- Lebedev, S.V.; Savvatimskiy, A.I. Metals in the process of rapid heating by electric current of high density. Physics-Uspekhi 1984, 144, 215–250.
- Boivineau, V.; Pottlacher, G. Thermophysical properties of metals at very high temperatures obtained by dynamic heating techniques: Recent advances. International Journal of Materials and Product Technology 2006, 26, 217–246.
- Tuleushev, Y.Z.; Volodin, V.N.; Pen’kov, F.M.; et al. Structure and phase composition of sputtered films of hafnium–carbon alloys. Physics of Metals and Metallography 2019, 120, 943–948. [CrossRef]
- Tuleushev, Yu.Zh.; Volodin, V.N.; Zhakanbayev, E.A.; Gorlachyov, I.D.; Suslov, E.E. Magnetron technology for preparation of tape superconductors with Nb3Ge coating. Vacuum 2023, 208, 111711. [CrossRef]
Figure 1.
Schematic arrangement of the targets in the vacuum chamber. (a) Magnetrons equipped with hafnium targets; (b) magnetrons equipped with carbon targets; (c) viewing window.
Figure 1.
Schematic arrangement of the targets in the vacuum chamber. (a) Magnetrons equipped with hafnium targets; (b) magnetrons equipped with carbon targets; (c) viewing window.
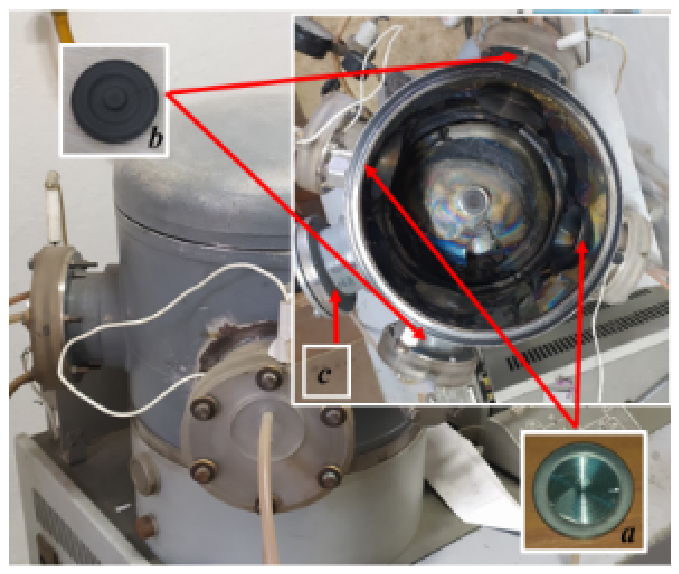
Figure 2.
X-ray diffraction patterns of Hf–C–N coatings synthesized at different nitrogen concentrations in the plasma-forming gas. X – HfCN; ⧫ – HfC; • – Al2O3; (a) 20 vol.% N2; (b) 15 vol.% N2; (c) 10 vol.% N2; (d) 5 vol.% N2.
Figure 2.
X-ray diffraction patterns of Hf–C–N coatings synthesized at different nitrogen concentrations in the plasma-forming gas. X – HfCN; ⧫ – HfC; • – Al2O3; (a) 20 vol.% N2; (b) 15 vol.% N2; (c) 10 vol.% N2; (d) 5 vol.% N2.
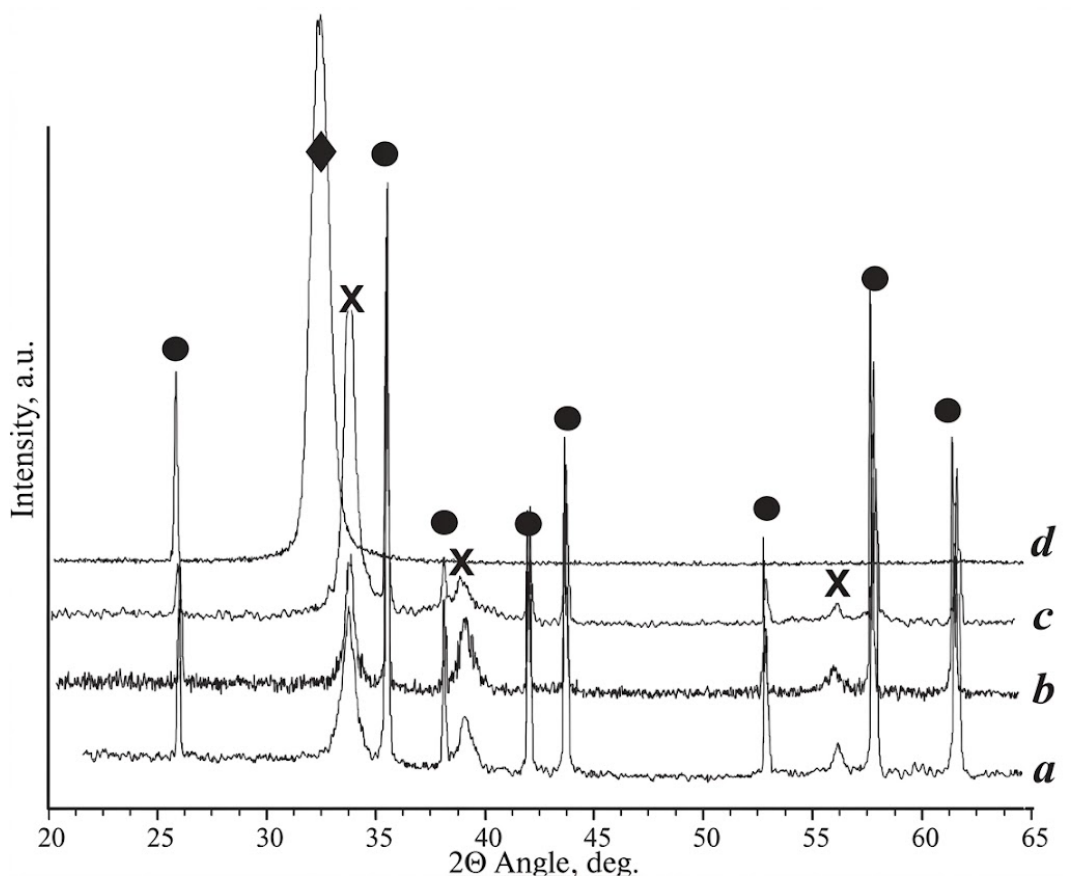
Figure 3.
X-ray diffraction patterns of Hf–C–N coatings synthesized at nitrogen concentrations of 14 (a) and 13 (b) vol.% in the plasma-forming gas. ▾ – cubic (FCC) HfCN phase; • – Al2O3.
Figure 3.
X-ray diffraction patterns of Hf–C–N coatings synthesized at nitrogen concentrations of 14 (a) and 13 (b) vol.% in the plasma-forming gas. ▾ – cubic (FCC) HfCN phase; • – Al2O3.
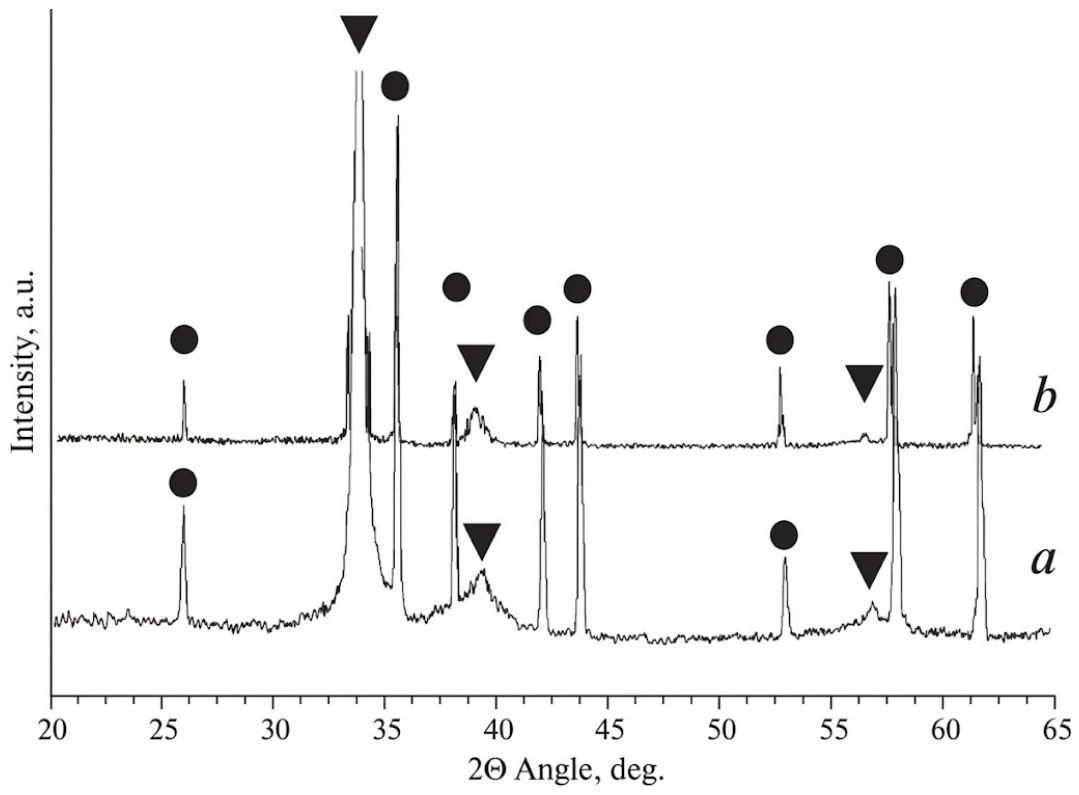
Figure 4.
Surface morphology of the Hf–C–N film synthesized at a nitrogen concentration of 14 vol.% in the plasma-forming gas.
Figure 4.
Surface morphology of the Hf–C–N film synthesized at a nitrogen concentration of 14 vol.% in the plasma-forming gas.
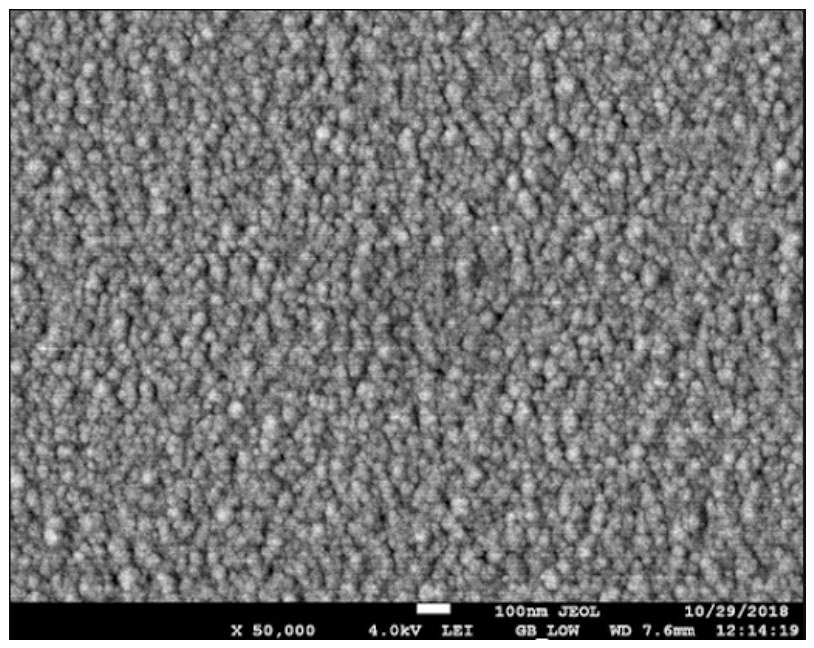
Figure 5.
Steel mask for the deposition of patterned coatings and a coating sample after deposition: (a) steel mask; (b) coating sample after deposition. 1 – steel mask; 2 – Polycor (Al2O3 substrate).
Figure 5.
Steel mask for the deposition of patterned coatings and a coating sample after deposition: (a) steel mask; (b) coating sample after deposition. 1 – steel mask; 2 – Polycor (Al2O3 substrate).
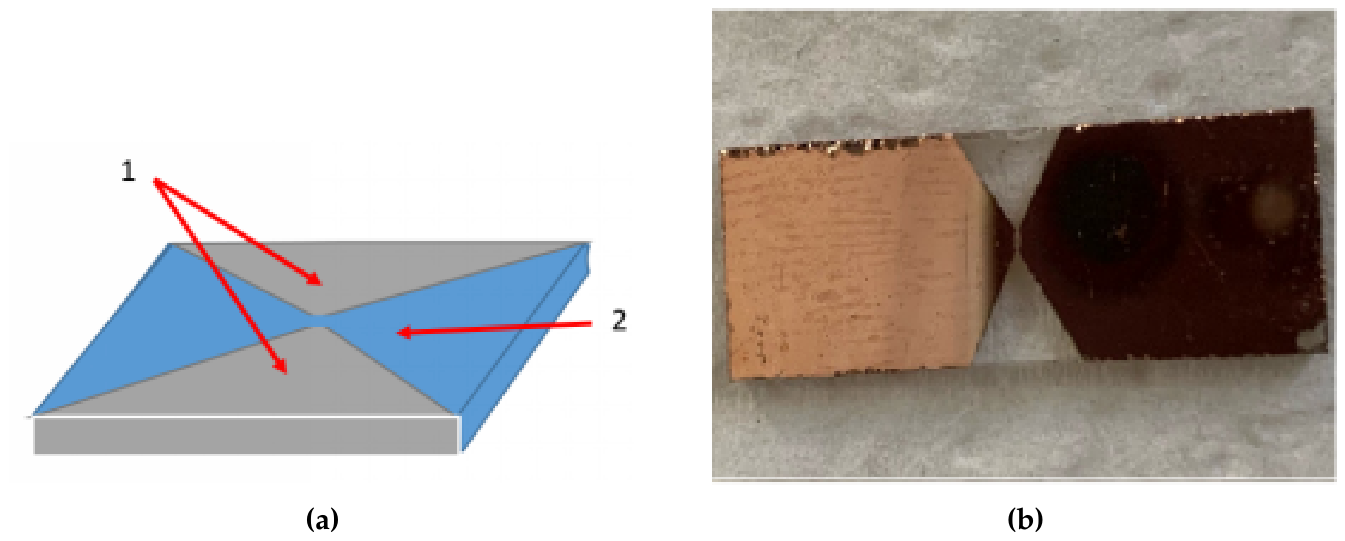
Figure 6.
System for measuring voltage and current during melting of a thin metallic film: (a) system operation schematic; (b) control unit schematic.
Figure 6.
System for measuring voltage and current during melting of a thin metallic film: (a) system operation schematic; (b) control unit schematic.
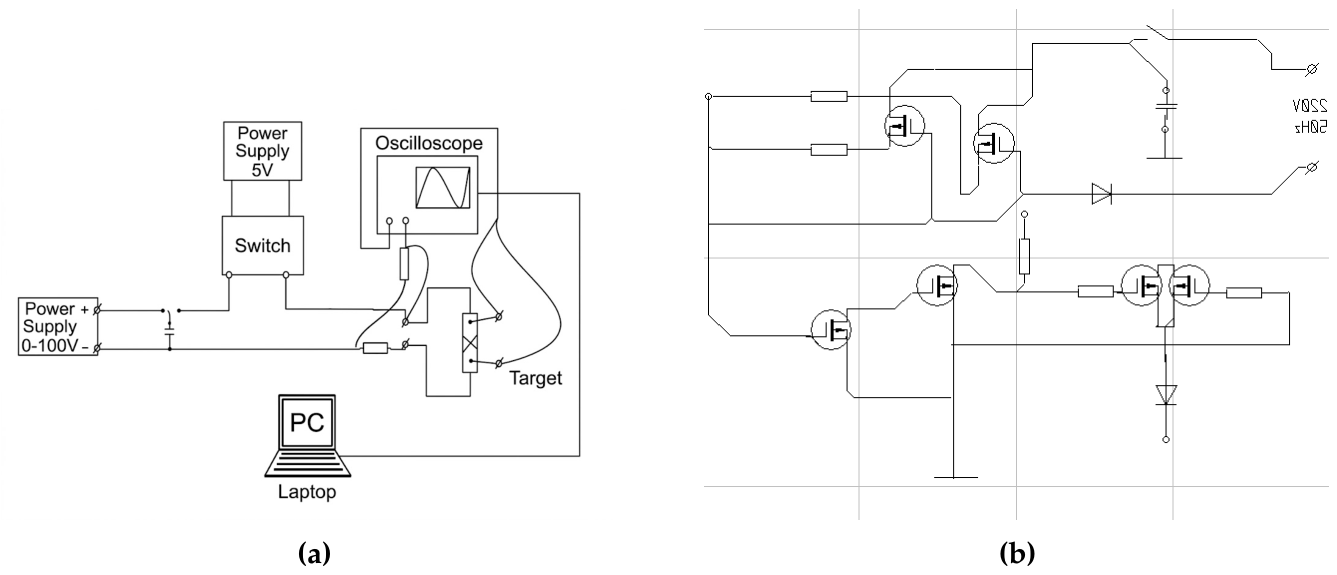
Figure 7.
General view of the experimental setup for measuring the melting temperature of thin-film coatings. (a) Triggering switch; (b) sample mounting system; (c) coating deposited for the measurements (Cu).
Figure 7.
General view of the experimental setup for measuring the melting temperature of thin-film coatings. (a) Triggering switch; (b) sample mounting system; (c) coating deposited for the measurements (Cu).
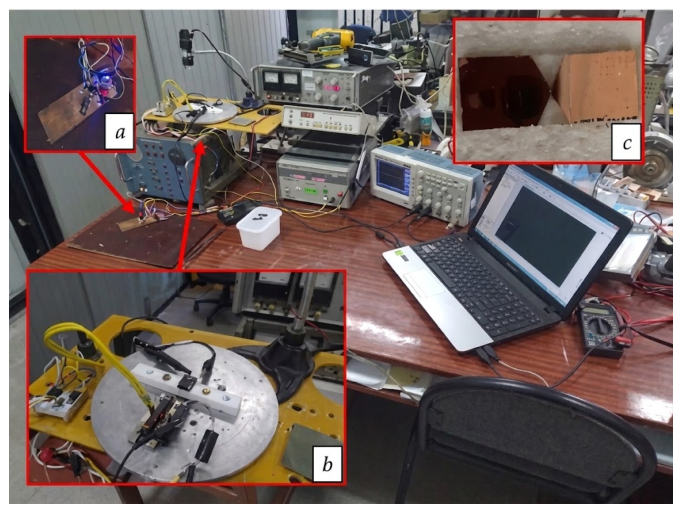
Figure 8.
Melting temperatures of coatings of metals with known melting temperatures obtained after calibration of the measurement method.
Figure 8.
Melting temperatures of coatings of metals with known melting temperatures obtained after calibration of the measurement method.
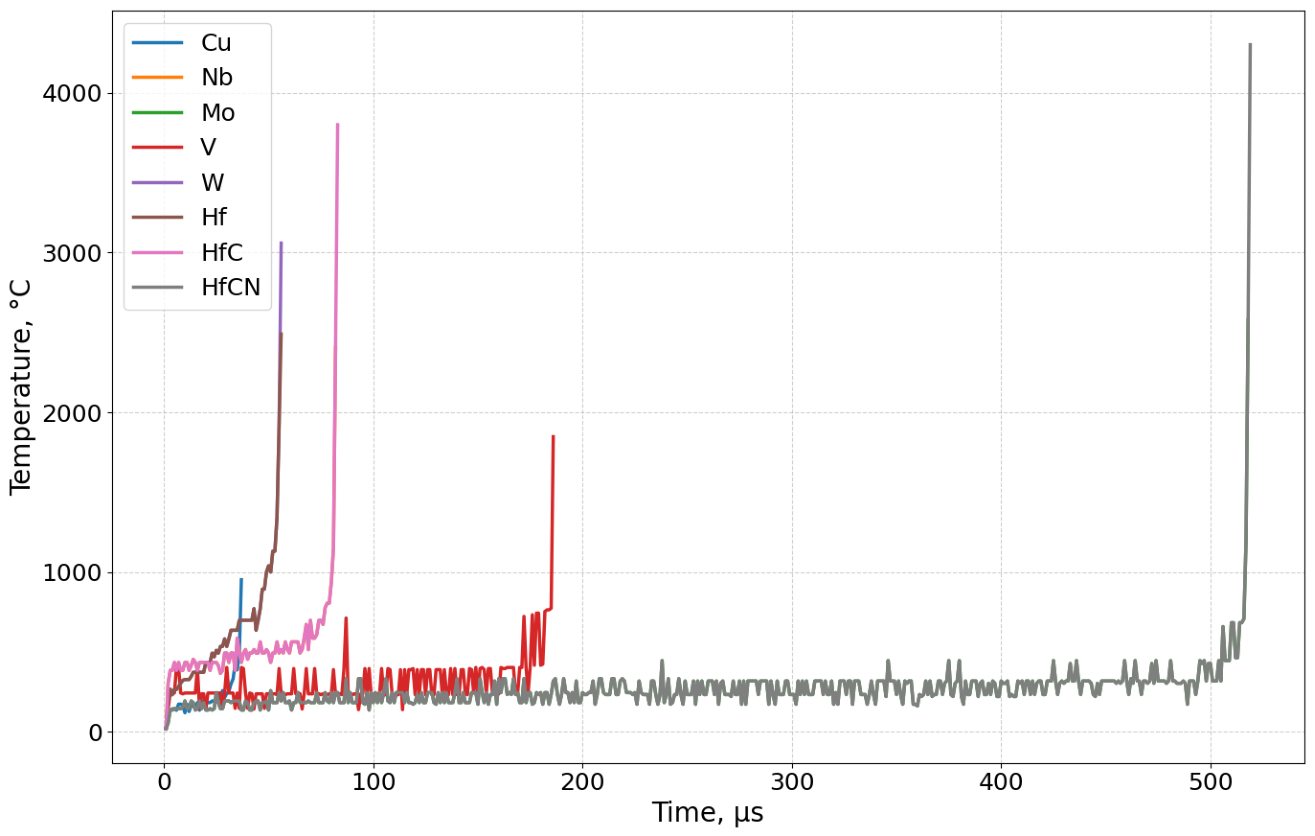
Figure 9.
Melting temperatures of Hf, HfC, and Hf–C–N thin-film coatings determined using the proposed method.
Figure 9.
Melting temperatures of Hf, HfC, and Hf–C–N thin-film coatings determined using the proposed method.
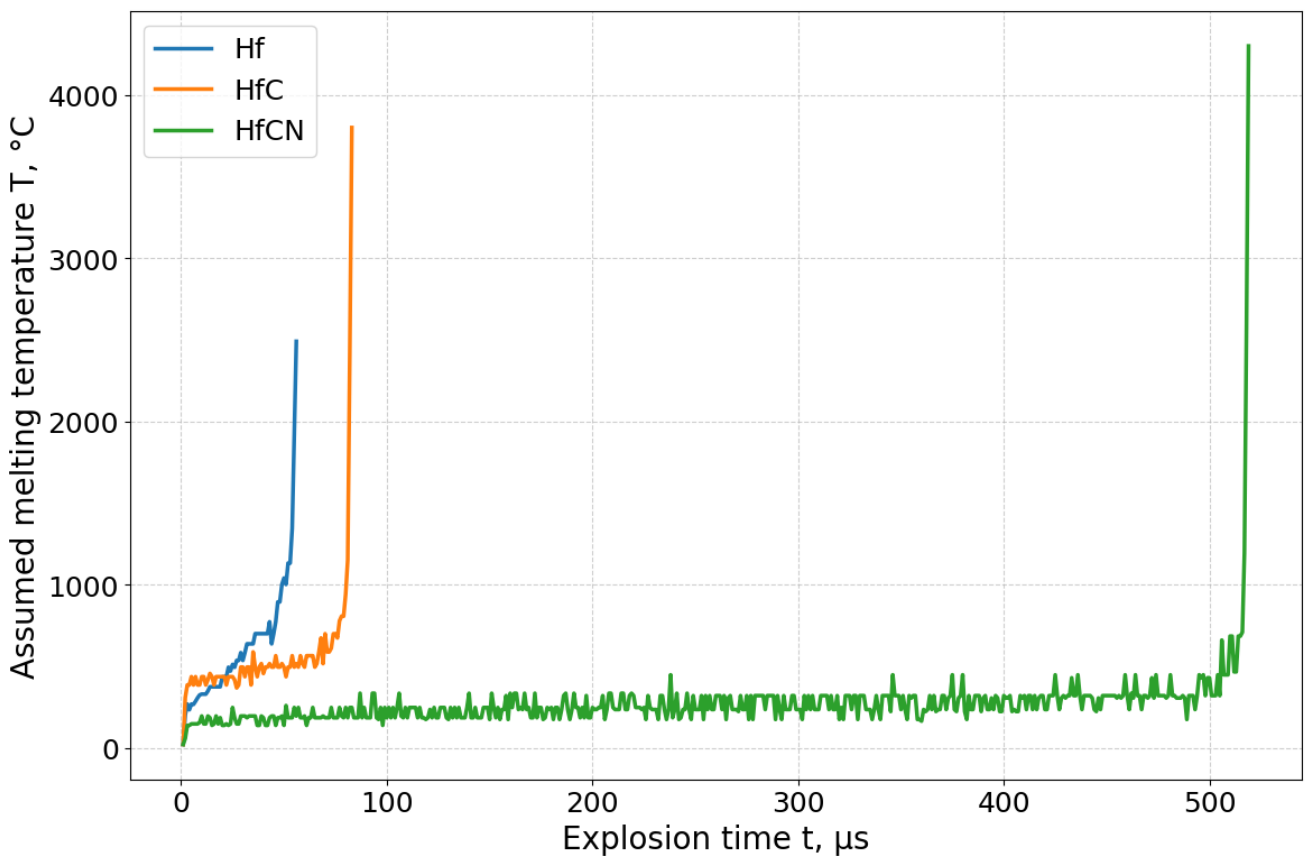

Table 1.
Results of microprobe analysis of hafnium carbonitride samples.
| Nitrogen concentration in the plasma-forming gas, vol.% | Nitrogen concentration in the sample, at.% | Observed phases | Lattice parameter, nm |
|---|---|---|---|
| 30 | 23.04 | HfN, HfC | ; |
| 25 | 22.79 | HfN, HfC | ; |
| 20 | 22.34 | HfCN | |
| 15 | 21.08 | HfCN | |
| 10 | 18.81 | HfCN | |
| 5 | 8.15 | HfC | ; |
Table 2.
Variation of the lattice parameter with decreasing nitrogen concentration in the plasma-forming gas.
Table 2.
Variation of the lattice parameter with decreasing nitrogen concentration in the plasma-forming gas.
| Nitrogen concentration in the plasma-forming gas, vol.% | Nitrogen concentration in the sample, at.% | Observed phases | Lattice parameter, nm |
|---|---|---|---|
| 14 | 20.08 | HfCN | |
| 13 | 19.46 | HfCN | |
| 12 | 16.13 | HfCN | |
| 11 | 11.04 | HfCN |
Disclaimer/Publisher’s Note: The statements, opinions and data contained in all publications are solely those of the individual author(s) and contributor(s) and not of MDPI and/or the editor(s). MDPI and/or the editor(s) disclaim responsibility for any injury to people or property resulting from any ideas, methods, instructions or products referred to in the content. |
© 2026 by the authors. Licensee MDPI, Basel, Switzerland. This article is an open access article distributed under the terms and conditions of the Creative Commons Attribution (CC BY) license (http://creativecommons.org/licenses/by/4.0/).
Copyright: This open access article is published under a Creative Commons CC BY 4.0 license, which permit the free download, distribution, and reuse, provided that the author and preprint are cited in any reuse.