

Submitted:
08 September 2026
Posted:
09 September 2026
You are already at the latest version
Abstract
Arginine-deprivation therapy exploits the arginine auxotrophy of numerous tumor types, positioning arginase (EC 3.5.3.1) as a next-generation antitumor biocatalyst. Robust continuous activity assays are essential to drive the rational design of new drug formulations and support clinical diagnostics, where arginase serves as a disease biomarker and an indicator of macrophage polarization states. However, current evaluation relies on indirect, stop-and-develop colorimetric assays that cannot resolve real-time kinetics in complex, turbid media. Here, we developed two label-free, real-time kinetic assays that monitor the native substrate and product directly: far-UV absorbance and circular dichroism (CD) at 205 nm, and FTIR tracking the guanidinium (~1630–1675 cm–1) and carboxylate/amine bands of L-arginine and L-ornithine. These methods eliminate the need for coupled enzymes and chromogenic reagents. Both approaches resolved the full progress curve of arginine hydrolysis in a single run and returned Michaelis-Menten parameters consistent with literature values, featuring detection limits down to 0.025 U/mL. To demonstrate our methodology in complex microheterogeneous media, we evaluated a liposomal arginase formulation (lipo-ARG), a relevant delivery system for targeting hepatocellular carcinoma. Kinetic testing revealed that encapsulation enhances the enzyme's operational stability, increasing its functional persistence by up to 200-fold under stress. To elucidate this stabilization mechanism, we analyzed thermograms, conformational dynamics, and protein structures. CD spectroscopy and thermodynamic analysis demonstrated strong structural protection: while the free enzyme completely unfolds and aggregates under acute thermal stress, the liposomal formulation retains a significant portion of its intact secondary structure even at 80 °C. The lipid bilayer acts as a rigid molecular scaffold, raising the unfolding enthalpy from 156 to 466 kJ/mol and preventing bulk aggregation. Structural locking correlates with the sustained residual catalytic activity of the liposomal enzyme. The developed continuous assays successfully validate liposome encapsulation as an effective strategy for creating robust enzyme formulations for oncotherapy.
Keywords:
arginase
; arginine deprivation therapy
; circular dichroism
; FTIR spectroscopy
; enzyme kinetics
; liposomal enzyme
; thermal denaturation
; secondary structure
1. Introduction
L-Arginase (L-arginine amidinohydrolase, EC 3.5.3.1) catalyzes the Mn²⁺-dependent hydrolysis of L-arginine to L-ornithine and urea, the terminal cytosolic step of the hepatic urea cycle [1,2,3,4,5,6,7,8,9]. Two isoforms are expressed in mammals: cytosolic arginase-1 (Arg1), highly expressed in hepatocytes and central to ureagenesis and ammonia detoxification, and mitochondrial arginase-2 (Arg2), first identified in kidney [10], which supplies L-ornithine, polyamines, proline, and glutamate to extrahepatic tissues [2,7]. Despite differing subcellular localization and tissue specificity, the two isoforms share ~60% sequence identity and a conserved catalytic machinery: a binuclear Mn²⁺ center coordinated by His-101, Asp-124, His-126, Asp-128, Asp-232, and Asp-234 (human Arg1 numbering) [4]. Both isoforms assemble as homotrimers (Arg1) or, after mitochondrial import and N-terminal presequence cleavage, a topologically equivalent homotrimer (Arg2), with nearly identical inter-subunit contacts and active-site geometry at the monomer level [11]. Each monomer adopts an α/β fold topologically related to the Rossmann fold — a central eight-stranded parallel β-sheet flanked by α-helices on both faces [12]. Catalysis proceeds through nucleophilic attack of a Mn²⁺-bridging hydroxide ion on the guanidinium carbon of L-arginine, generating a tetrahedral intermediate that is electrostatically stabilized by the binuclear Mn(II) center; His-141-mediated proton transfer then cleaves the C–N bond, releasing urea and leaving L-ornithine [3,13,14]. The reaction is thermodynamically essentially irreversible (ΔG° ≈ −15 kcal/mol) [3]. Human arginases display strict metal specificity: substitution of Mn²⁺ by Co²⁺, Ni²⁺, or other bivalent cations abolishes native-metal catalytic activity outright, although, notably, Co²⁺-substituted human Arg1 has been engineered into a distinct, clinically advanced high-activity variant with a shifted pH optimum (pegzilarginase; Table 1) [1,11].
Beyond nitrogen homeostasis, arginase has attracted substantial interest as a therapeutic protein because a broad range of malignancies — including hepatocellular carcinoma, melanoma, and several sarcomas — are arginine-auxotrophic, lacking sufficient argininosuccinate synthetase and/or argininosuccinate lyase activity to resynthesize arginine from citrulline. Systemic depletion of extracellular arginine by an exogenous, catalytically active arginase starves these tumor cells of an essential amino acid, arresting proliferation and triggering non-apoptotic cell death [5,15], while sparing most normal tissues that retain arginine-recycling capacity. This has motivated a series of engineered arginase biologics, summarized comparatively in Table 1.
While engineering strategies such as metal substitution (e.g., Co²⁺-substituted pegzilarginase) have been employed to enhance catalytic efficiency, they introduce potential safety and efficacy concerns. Specifically, non-native metal substitution raises issues of potential heavy-metal toxicity upon in vivo release.
An alternative and highly promising strategy is to preserve the native Mn²⁺ active site but encapsulate the enzyme within a lipid-based nanocarrier (bottom row, Table 1). This approach is particularly relevant given that the tumor interstitium is significantly more acidic than physiological blood, which further suppresses the systemic activity of the free enzyme. Liposomal formulations provide an excellent platform to overcome these biological barriers. They can be engineered for selective accumulation in tumor tissues and liver metastases, while their lipid bilayers facilitate direct intracellular delivery of the biocatalyst through membrane fusion, directly targeting cancer cells. Developing various specialized formulations is critical for achieving this selective accumulation; however, rationally designing and optimizing these liposomal platforms requires continuous, precise measurement of the encapsulated enzyme’s activity. Therefore, developing a high-throughput, reagent-free analytical method capable of functioning in complex, turbid lipid media is an urgent prerequisite for advancing these targeted nanocarriers.
Beyond its therapeutic relevance, arginase is increasingly recognized as a bioanalytical marker in its own right - its activity serves as a diagnostic indicator in hepatic, cardiovascular, and immune-related pathologies, and as a critical process parameter during biopharmaceutical production and formulation control. A second bottleneck in arginase research and the central analytical motivation of this study is the absence of simple, direct, real-time assays for catalytic activity. The great majority of published arginase assays fall into three classes: (i) residual-substrate colorimetric assays (Sakaguchi-type reactions of L-arginine with 8-hydroxyquinoline/hypobromite [19], or with p-nitrophenylglyoxal [20]); (ii) product-based colorimetric assays, most commonly detection of urea via the diacetyl monoxime reaction [21,22] or detection of L-ornithine via ninhydrin (Chinard reaction) [23,24]; and (iii) coupled enzymatic/electrochemical schemes, such as the arginase→urease→glutamate dehydrogenase cascade (Ozer method) [25] or potentiometric/ion-selective-electrode and pH-stat assays that rely on urease-generated ammonium [26]. All of these approaches are indirect: they require a reaction-stopping step, an auxiliary chromogenic or enzymatic reagent, and/or elevated temperature for color development, and none of them reports the reaction as it proceeds in real time on the native substrate/product pair. Spectroscopic methods that directly exploit the intrinsic optical signatures of L-arginine and L-ornithine – far-UV absorbance/CD and IR (ATR-FTIR) – have been used to monitor other enzymatic reactions in real time and in optically complex media such as blood and plasma [27,28,29], but, to our knowledge, have not previously been described for arginase.
To demonstrate the practical value of this analytical approach for formulation testing, we apply it to a concrete case study: a liposomal form of arginase-1 (lipo-ARG), using the new native-substrate assays to quantitatively evaluate how encapsulation affects the enzyme’s catalytic efficiency at its alkaline pH optimum. Finally, to comprehensively characterize this delivery system, far-UV CD spectroscopy - established above as a real-time activity probe - is additionally applied in its classical structural role, acquiring temperature-resolved CD thermograms of free vs liposomal arginase. Rather than reducing this to a single “denaturation” endpoint, these thermograms are used to resolve the underlying structural transitions - conformational destabilization, aggregation, cofactor dissociation, subunit dissociation, and the specific unfolding mechanism - and to determine how liposomal formulation modulates each of these processes. By translating raw ellipticity data into quantitative, temperature-resolved metrics of structural retention and deriving van’t Hoff thermodynamic parameters, we intend to determine whether liposomal encapsulation predominantly enhances intrinsic conformational stability, modulates the local catalytic microenvironment, or operates through a combination of both mechanisms.
For bioanalytical chemistry, these results are expected to deliver a broadly transferable toolkit: reagent-free, real-time spectroscopic assays extendable to other enzymes lacking convenient native chromophores, together with a structural-thermodynamic framework for assessing how nanocarrier encapsulation affects biocatalyst stability and function.
2. Materials and Methods
2.1. Reagents
L-Arginine (Sigma-Aldrich, BioUltra, ≥99.5%) and L-ornithine monohydrochloride (Sigma-Aldrich, ≥99%) were used as the substrate and reference product, respectively. L-α-phosphatidylcholine was purchased from Sigma-Aldrich (St. Louis, MO, USA), and cardiolipin was obtained from Avanti Polar Lipids (Alabaster, AL, USA). Lyophilized arginase-1 from bovine liver (SDS-PAGE purity ≥90%, retaining ≥90% activity after 7 days at 37 °C) was employed for all enzymatic assays. Arginase-1 was pre-activated with MnCl2 to ensure the full population and stabilization of its essential binuclear Mn2+ active site. At the experimental substrate concentrations (1–30 mM), the free-base amino group of L-arginine inherently shifts the solution pH to approximately 9.1, which closely approximates the enzyme’s alkaline pH optimum (~9.5). To ensure strict pH stability across all experiments without introducing spectral interference in the targeted CD and FTIR windows, 1 mM CHES was included in all assay solutions. This approach circumvents the need for high concentrations of conventional buffer salts, whose intrinsic vibrational and optical bands could otherwise obscure the monitored signals. Consequently, all kinetic parameters reported in this study were determined under these CHES-stabilized alkaline conditions (pH ~9.1) rather than at the physiological pH of 7.4.
2.2. Preparation of Liposomal Arginase (Lipo-ARG)
The Mn-activated enzyme was encapsulated in phospholipid vesicles composed of phosphatidylcholine and cardiolipin at an 80:20 mol% ratio. These liposomes were prepared via the thin-lipid-film hydration method, with the lipid and pre-activated enzyme combined at a 3:1 mass ratio (w/w) during the hydration step. Sequential membrane extrusion, first through a 400 nm and subsequently through a 200 nm polycarbonate membrane, was employed to narrow and homogenize the vesicle size distribution.
Given the average molar mass of the 80:20 lipid mixture (≈910 g/mol), comprising egg yolk L-α-phosphatidylcholine (composed predominantly of palmitic (16:0), oleic (18:1), and linoleic (18:2) acids) and bovine heart cardiolipin (predominantly tetralinoleoyl, 18:2)—and the molar mass of trimeric arginase-1 (≈105 kDa, the catalytically active oligomeric state), this 3:1 mass loading corresponds to a lipid-to-protein molar ratio of ~345:1 (mol lipid per mol arginase trimer; ~115:1 per arginase monomer), a ratio optimized for efficient bilayer formation and high liposomal stability. Dynamic light scattering (DLS) analysis confirmed a uniform vesicle population with a Z-average hydrodynamic diameter of 165 ± 12 nm and a low polydispersity index (PDI) of 0.14 ± 0.02. The incorporation of cardiolipin imparted a strong negative surface charge, yielding a zeta potential of −35 ± 4 mV, which ensures excellent colloidal stability. Measurements were conducted using a Zetasizer Nano S (Malvern Instruments, Worcestershire, UK) equipped with a 4 mW He–Ne laser (633 nm) at a fixed scattering angle of 173° and a temperature of 25 °C. Experimental data processing and analysis were performed using Zetasizer Software (v. 8.02). The optimized lipid-to-protein ratio facilitated a high encapsulation efficiency, with 43 ± 5% of the active enzyme successfully loaded into the liposomes. This efficiency was determined by separating the unencapsulated arginase from the liposomal fraction via dialysis using a 300 kDa molecular weight cutoff (MWCO) cassette, and subsequently quantifying the free protein in the dialysate by measuring its intrinsic tryptophan fluorescence. Crucially, this physical encapsulation strategy did not require any chemical modification of the protein, thereby fully preserving the native Mn2+ active site – a distinct advantage over the covalent PEGylation and metal-substitution strategies currently utilized in other models.
2.3. Real-Time Activity Assay by CD Spectroscopy
CD measurements were performed on a Jasco J-815 CD spectrometer (JASCO, Tokyo, Japan) with a thermostated cell. Far-UV CD and absorbance spectra (180–250 nm) of 1–20 mM L-arginine and L-ornithine in water were first recorded to select diagnostic analytical wavelengths. Absorbance at 200 nm and CD ellipticity at 205 nm were selected as the analytical wavelengths for kinetic monitoring (2-min step). Reactions were initiated by adding arginase (final concentration 0.001–0.1 mg/mL) to 1–20 mM L-arginine in water (self-buffered at pH ≈ 9.1 by the substrate itself and 1 mM CHES) in a 1-mm-pathlength quartz cuvette at 37 °C, and the decay of the arginine signal / rise of the ornithine signal was followed continuously for free arginase and lipo-ARG. Using the mass-balance relation [Orn] = C₀(Arg) − [Arg], kinetic traces were converted into product-accumulation curves, and initial rates (v₀) were obtained from the slope of the initial linear segment.
Kinetic parameters were obtained by two independent routes. In the integrated (Walker–Schmidt) approach, the closed-form solution of the Michaelis–Menten rate equation,
was fit directly to the substrate-depletion time course [S](t) (with [S]₀ the initial arginine concentration), avoiding the need to differentiate noisy experimental traces to obtain instantaneous rates. As a cross-check, the same dataset was fit by numerical integration of the differential rate equation including linear competitive product inhibition by L-ornithine,
with [P] = [S]₀ − [S] and Ki the ornithine inhibition constant, solved numerically and fit to the experimental [S](t) trace by nonlinear least squares. Both approaches were applied identically to the CD- and FTIR-monitored datasets.
KM×ln([S]₀/[S]) + ([S]₀ − [S]) = Vmax·t,
d[S]/dt = −Vmax·[S] / {KM×(1 + [P]/Ki) + [S]},
2.4. Real-Time Activity Assay by ATR-FTIR Spectroscopy
FTIR spectra were recorded on a Tensor 27 FTIR spectrometer (Bruker, Germany) with an MCT detector (liquid-N₂-cooled) and a thermostated BioATR II cell (ZnSe single-reflection element, 37 °C, Huber thermostat). Reference spectra of 30 mM L-arginine and L-ornithine in water (self-buffered at pH ≈ 9.1 by the substrate itself and 1 mM CHES) (4000–850 cm⁻¹, 1 cm⁻¹ resolution, 70 scans, background-subtracted) identified diagnostic bands. This mutual spectral exclusivity of the 1690 cm⁻¹ guanidinium doublet (present only in arginine) is the structural basis for FTIR kinetic monitoring.
For kinetic runs, a 30-µL aliquot of L-arginine (1-30 mM) was applied to the ATR element and the reaction initiated by adding arginase; spectra were collected every 60 s for free arginase and liposomal arginase. In both datasets, the initial spectrum (0 min) shows the full-intensity guanidinium doublet (1630/1675 cm⁻¹, ATR units normalized to 1.0), which progressively collapses into the single, ornithine-dominated envelope (maximum near 1600 cm⁻¹) as the reaction proceeds. Band-intensity changes over time were converted to product-formation curves, v₀ was obtained as above, and Km/Vmax were extracted by the same integrated-kinetics and differential-equation (product-inhibition) approaches used for the CD assay.
2.5. Analytical Figures of Merit (LOD/LOQ)
Molar absorption coefficients of arginine and ornithine at 200 nm were 2587 and 646 M⁻¹·cm⁻¹, respectively (difference coefficient 1941 M⁻¹·cm⁻¹). Detection (LOD) and quantification (LOQ) limits, expressed as the minimum resolvable reaction rate (U/mL) under substrate-saturating conditions, were calculated from the signal change between successive measurements relative to baseline noise, for all three modalities (CD, absorbance at 200 nm, FTIR).
2.6. Thermal Denaturation and Secondary-Structure Analysis
Far-UV CD spectra (200–260 nm) of free arginase and lipo-ARG (2 mg/mL) were recorded from 20 to 80 °C in 10 °C increments, alongside the corresponding UV absorbance spectra. To precisely monitor the structural transition from the native α/β fold to an unfolded state while compensating for potential temperature-induced baseline drift and liposomal light scattering, a differential analytical approach was utilized. Rather than relying on a single wavelength, the structural shift was quantified using the difference in ellipticity between the random coil diagnostic region (200 nm) and the α-helix diagnostic minimum (222 nm), defined as Δθ = θ₂₀₀ − θ₂₂₂. As thermal denaturation progresses, the unfolding of α-helices reduces the negative signal at 222 nm, while the concomitant accumulation of random coil structures significantly increases the negative signal at 200 nm. This simultaneous bidirectional signal change maximizes the sensitivity of the Δθ parameter to the unfolding event. To express secondary-structure loss independently of the absolute CD amplitudes of the two formulations, each dataset was normalized to its own native (20 °C) and heat-denatured (80 °C) endpoints to determine the unfolded fraction:
θ_unfolded(T) = [Δθ(20 °C) − Δθ(T)] / [Δθ(20 °C) − Δθ(80 °C)].
The apparent melting temperature (Tm) and unfolding thermodynamics (ΔH, ΔS) were derived from a van’t Hoff plot of R·ln K (where K = θ_unfolded / (1 − θ_unfolded)) against 1/T, fitted to the linear equation R·ln K = −ΔH/T + ΔS.
2.7. Kinetics of Irreversible Thermal Inactivation
To determine the kinetics of irreversible thermal inactivation, samples of free arginase and liposomal arginase (lipo-ARG) were incubated in a thermostated water bath at constant temperatures of 55 °C and 70 °C. At predefined time intervals (ranging from 0 to 60 min), aliquots were withdrawn and immediately transferred to an ice bath. This rapid cooling step was strictly employed to quench the thermal denaturation process and prevent any further conformational degradation prior to analysis. Following the ice-cooling step, the residual catalytic activity A of each aliquot was measured using the developed continuous far-UV CD assay at 37 °C, tracking the ellipticity decay at 205 nm. To ensure zero-order kinetic conditions with respect to the substrate, all inactivation measurements were conducted at a saturating L-arginine concentration of 15 mM. The residual activity was expressed as a ratio (A/A0), where A0 represents the absolute initial activity of the corresponding unheated control sample. The apparent first-order inactivation rate constants (kin) were derived from the slopes of the initial linear phase of the semi-logarithmic plots representing –ln(A/A0) as a function of incubation time. The activation energy of inactivation Ea was subsequently calculated from these temperature-dependent rate constants using the Arrhenius equation.
2.8. Data Processing and Statistical Analysis
The quantitative deconvolution of the protein secondary structure (estimating the percentage fractions of α-helices, β-sheets, β-turns, and random coils) was performed by processing the far-UV CD spectra through the CDNN secondary structure analysis software. Kinetic modeling, including the extraction of Michaelis-Menten parameters (Vmax, KM) via non-linear regression of the integrated rate equations, as well as the calculation of thermodynamic unfolding parameters (ΔH, ΔS) from the linear van’t Hoff plots, was executed using OriginPro software (OriginLab Corporation). All analytical measurements, including enzymatic kinetic assays, dynamic light scattering, and thermal denaturation experiments, were performed in at least three independent biological or technical replicates (n ≥ 3). Experimental data are presented as the arithmetic mean ± standard deviation (SD). The goodness-of-fit for all linear and non-linear regression models was evaluated based on the coefficient of determination (R²), with a threshold of R² ≥ 0.95 utilized as the criterion for the robust extraction of kinetic and thermodynamic constants.
3. Results
3.1. Catalytic Mechanism of Arginase and Rationale for Label-Free Spectroscopic Monitoring
Arginase is a metalloenzyme that catalyzes the final step of the urea cycle, specifically the hydrolysis of the semi-essential amino acid L-arginine to yield L-ornithine and urea. As depicted in Figure 1, the active site of arginase features a highly conserved binuclear manganese cluster that is essential for its catalytic function. The enzymatic cycle is initiated by the binding of L-arginine in the active site cavity, where it is optimally positioned by a network of hydrogen bonds.
The core catalytic event involves a metal-bridging hydroxide ion, which is coordinated by the two manganese ions and further stabilized by interactions with surrounding conserved residues, notably Asp-128. This hydroxide ion acts as a potent nucleophile, attacking the central carbon atom of the planar guanidinium group of L-arginine. This nucleophilic attack generates a tetrahedral intermediate. Subsequently, dynamic proton transfer events—facilitated by the neighboring His-141 and Glu-277 residues—trigger the collapse of this intermediate. This leads to the cleavage of the C–N bond, the release of L-ornithine and urea, and the eventual regeneration of the nucleophilic hydroxide via the binding and deprotonation of a new water molecule.
The biochemical conversion of L-arginine to L-ornithine involves a profound structural and electronic change: the loss of the large, highly basic, and resonance-stabilized guanidinium group, which is replaced by a simple primary amine in the product. This specific structural transformation provides an ideal foundation for real-time, reagent-free reaction monitoring. Because the substrate and the primary product possess significantly different optical and vibrational properties, we hypothesized that their distinct far-UV CD and FTIR spectroscopies could be applied to directly track the hydrolytic kinetics in real-time, without the need for coupled enzymatic assays or exogenous chemical labels.
3.2. Spectroscopic Differentiation of the Substrate and Product and Assignment of Spectral Transitions
To establish the foundation for a reagent-free kinetic assay, the individual optical properties of the substrate (L-arginine) and the product (L-ornithine) were characterized in detail. Figure 2 presents the far-UV circular dichroism (CD) and UV absorption spectra of 10 mM aqueous solutions of both amino acids, revealing the profound spectral changes induced by the cleavage of the guanidinium group.
The UV absorption spectra (Figure 2b) demonstrate a pronounced differentiation driven by the specific chromophores present in each molecule. L-arginine exhibits a broad absorption profile that maintains high signal intensity up to approximately 210 nm. This extended absorbance is primarily attributed to the highly delocalized π-electron system of the guanidinium group, which undergoes strong π→π* and n→π* transitions in the deep UV that tail significantly into the >200 nm region. The carboxylate group (-COO⁻) also contributes to this absorption. The hydrolysis product, L-ornithine, lacks this conjugated guanidinium system. Its UV spectrum is fundamentally simplified and relies almost entirely on the absorption of the carboxylate group, resulting in a significant blue shift with a sharp decline in absorbance at wavelengths greater than 195 nm. The wavelength of 200 nm was selected for UV absorption monitoring to provide optimal contrast. At this wavelength the calculated molar extinction coefficients at 200 nm are approximately 2650 M⁻¹ cm⁻¹ for L-arginine and 750 M⁻¹ cm⁻¹ for L-ornithine. This difference of more than 3.5-fold makes this wavelength highly sensitive for recording substrate depletion.
The CD spectra (Figure 2a) reflect how these chromophores behave within the chiral environment dictated by the α-carbon. L-arginine (red line) displays a complex profile featuring a sharp local minimum at ~198 nm and a broad, intense positive maximum in the 205–210 nm range. This profile is the result of overlapping π→π* and n→π* transitions of the carboxylate group combined with the intrinsic chiral transitions of the bulky, positively charged guanidinium side chain. When L-arginine is converted to L-ornithine (blue line), the removal of the guanidinium group drastically alters the chiral optical signature. The complex profile disappears, and the spectrum smooths into a single positive band driven by the standard carboxylate transitions. For quantitative kinetic monitoring using CD, 205 nm was selected as the optimal optical window. This specific wavelength offers an excellent signal-to-noise ratio compared to the shorter wavelength region (<200 nm), where intense absorption from the buffer solution and atmospheric oxygen significantly degrades signal quality. Furthermore, 205 nm provides an optimal and easily recordable difference in the CD signal. The L-arginine and L-ornithine molar ellipticities were determined as 2900 deg cm² dmol⁻¹ and 1700 deg cm² dmol⁻¹, respectively. Expressed as molar circular dichroism (Δε), this corresponds to 0.88 M⁻¹ cm⁻¹ for L-arginine versus 0.52 M⁻¹ cm⁻¹ for L-ornithine. Combined monitoring at 200 nm (UV absorption) and 205 nm (CD) effectively isolates the substrate’s structural transformation, providing optimal, interference-free windows for real-time kinetic analysis.
To apply this toolkit to biomedical formulations, we selected liposomes due to their propensity to target the liver—the primary site of hepatocellular carcinoma and metastases, which are the main clinical indications for arginase therapy. We evaluated free arginase and liposomal arginase, including an enzyme-free negative control to rule out spontaneous hydrolysis. Since the highly scattering, turbid lipid matrix could potentially obscure the far-UV diagnostic spectra, the lipo-ARG formulation was synthesized and characterized to confirm the analytical method’s applicability to complex media.
3.3. Preparation and Characterization of Liposomal Formulations
The successful encapsulation of the Mn-activated enzyme into phospholipid vesicles was achieved using a thin-lipid-film hydration method followed by sequential extrusion. The chosen lipid matrix comprised phosphatidylcholine (PC) and cardiolipin (CL) at an 80:20 molar ratio.
The key physicochemical characteristics of the resulting lipo-ARG formulation are summarized in Table 2.
The inclusion of CL was specifically intended to impart a strong negative surface charge to the resulting vesicles, which is a critical parameter for preventing aggregation and ensuring long-term colloidal stability. Following sequential extrusion through 400 nm and 200 nm polycarbonate membranes, dynamic light scattering analysis confirmed the formation of a highly uniform vesicle population. The liposomes exhibited a Z-average hydrodynamic diameter of 165 ± 12 nm paired with a low polydispersity index of 0.14 ± 0.02. Furthermore, the zeta potential of the lipo-ARG formulation was measured at –35 ± 4 mV. When compared to empty control PC:CL liposomes, which typically exhibit a significantly more negative zeta potential (approximately –50 mV), this distinct positive shift provides direct evidence of charge compensation. It confirms the active involvement of the anionic cardiolipin headgroups in electrostatically binding the protein and its associated cations. Nevertheless, the remaining net negative charge of –35 mV confirms the anticipated electrostatic stabilization provided by the CL component, remaining well within the required range to prevent vesicle aggregation.
The separation of the unencapsulated arginase via dialysis using a 300 kDa cutoff membrane enabled the accurate quantification of the encapsulation efficiency, which reached 43 ± 5%. Consequently, the final, purified liposome formulation possesses an optimized lipid-to-protein mass ratio of 3:1, corresponding to a molar ratio of approximately 345:1 per arginase trimer. This robust loading capacity is achieved through both aqueous core entrapment and interfacial binding. Specifically, the excess of essential Mn2+ ions associated with the enzyme likely forms robust electrostatic bridges with the highly anionic cardiolipin domains, actively recruiting and firmly anchoring arginase to the bilayer surface. This physical encapsulation strategy preserves the natural catalytic conformation of the enzyme while providing necessary steric and electrostatic shielding, offering a substantial functional advantage over existing covalent PEGylation or metal-substitution techniques.
3.4. Real-Time Kinetic Monitoring of Free and Liposomal Arginase via CD and UV Spectroscopy
To quantitatively evaluate the catalytic performance of both free and encapsulated arginase, the continuous enzymatic hydrolysis of 20 mM L-arginine was monitored in real-time. Figure 3 displays the time-resolved spectral changes recorded over a 20-min reaction period. For both the free (Figure 3a) and liposomal (Figure 3b) enzyme preparations, a progressive, time-dependent decrease in the CD ellipticity was observed. As the reaction proceeded, the characteristic bimodal profile of L-arginine gradually flattened, smoothly transitioning toward the spectral signature of the product, L-ornithine.
Concurrently, the time-dependent UV absorption spectra for both the free (Figure 3c) and liposomal (Figure 3d) arginase exhibited a rapid, steady decay in absorbance, directly reflecting the cleavage of the strongly absorbing guanidinium moiety. Notably, the UV absorption spectra in both cases enter a region of severe detector saturation (photometric overflow) at wavelengths below 195-200 nm. This massive general over-absorption is primarily driven by the extremely high intrinsic absorbance of the concentrated substrate (20 mM L-arginine) combined with the inherent absorption of the aqueous medium in the deep-UV region. This is a fundamental optical limitation of the system as a whole, which is only further compounded by the turbidity of the lipid vesicles in the liposomal sample (Figure 3d). Consequently, the spectral region below 200 nm is analytically unreliable and is intentionally excluded from the quantitative evaluation. The carefully selected diagnostic wavelength of 200 nm is positioned optimally at the edge of this saturation threshold, completely bypassing the deep-UV noise while remaining within the reliable linear dynamic range of the spectrometer. The successful acquisition of these dynamic spectra at 200 nm confirms that the phospholipid bilayer permits unimpeded substrate influx and product efflux while remaining sufficiently optically transparent in the precise diagnostic measurement windows required for accurate kinetic tracking.
By converting the time-dependent spectral changes into product concentrations, comparative kinetic progress curves were constructed (Figure 3e). Both enzyme formulations demonstrated a characteristic kinetic profile featuring a rapid initial phase of product accumulation that gradually plateaued as the initial 20 mM substrate was consumed. The trajectory of the progress curve for free arginase (black circles) indicates a marginally steeper initial reaction rate compared to that of the liposomal arginase (red squares). Control experiments performed under identical conditions in the absence of the enzyme exhibited absolutely no spectral changes over the observation period, confirming that no spontaneous hydrolysis of L-arginine occurs and that the recorded signal decay is strictly driven by the enzymatic reaction.
Because the kinetics were evaluated over the full reaction time-course, the depletion of the substrate is accompanied by the substantial accumulation of L-ornithine, a known competitive inhibitor of mammalian arginases. Therefore, the kinetic parameters were derived by non-linear regression using the numerical integration of the differential rate equation that explicitly accounts for competitive product inhibition:
where [P] = [S]0 − [S], and Ki is the inhibition constant for L-ornithine. The fitting model successfully resolved the inhibition constants for both formulations directly from the full progress curves. For the free enzyme, the inhibition constant is comparable to the Michaelis constant (Ki = 3.55 ± 0.30 mM), which significantly modulates the curvature of the progress curve in its later stages. Interestingly, for the liposomal formulation, the Ki value notably increased to 5.20 ± 0.45 mM. This apparent reduction in product inhibition suggests that the phospholipid bilayer microenvironment either facilitates the rapid outward diffusion of L-ornithine or sterically limits its rebinding at the compartmentalized active site. The resulting statistical errors for the extracted parameters were thoroughly analyzed to confirm the robustness of this kinetic model.
d[S]/dt = −Vmax × [S] / { KM × (1 + [P]/Ki) + [S]}
The quantitative kinetic parameters extracted from these models are summarized in Table 3. The native, free arginase exhibited a maximum reaction velocity (Vmax) of 9.45 ± 0.42 mM/min and a turnover number kcat of 276 s⁻¹. Liposomal arginase, showed a minor reduction in Vmax to 8.57 mM/min, corresponding to a kcat of 250 s⁻¹. The standard deviations for Vmax and kcat are relatively small (approximately 4–5%), indicating a high precision of the fitting model across the entire progress curve. Importantly, the statistical errors for the liposomal formulation (e.g., ± 0.38 mM/min for Vmax) are strictly comparable to those of the free enzyme (± 0.42 mM/min). This confirms that the highly scattering liposomal matrix does not introduce significant optical noise or systemic artifacts into the calculated parameters. Notably, the Michaelis constant KM remained essentially unchanged between the free (3.60 ± 0.25 mM) and liposomal (3.65 ± 0.27 mM) formulations. As a result, the overall catalytic efficiency kcat / KM of the liposomal arginase was determined to be (6.8 ± 0.5) × 10⁴ s⁻¹M⁻¹, demonstrating that the encapsulated enzyme retains approximately 90% of the native catalytic efficiency observed for the free enzyme (7.6 ± 0.6) × 10⁴ s⁻¹M⁻¹. The concurrent increase in the Ki value for the liposomal form provides an additional functional advantage by delaying the onset of product inhibition during continuous catalytic turnover in confined environments.
To validate the accuracy of the proposed reagent-free continuous CD assay, these kinetic parameters for the native bovine arginase were compared with standard literature values acquired using traditional end-point colorimetric methods, such as the diacetyl monoxime assay utilized for urea quantification. The calculated KM value of 3.60 mM and the kcat of 276 s⁻¹ are in excellent agreement with previously reported kinetic constants for bovine liver arginase (arginase I) [3], which typically displays a KM ranging from 2.0 to 4.5 mM and a turnover number between 200 and 350 s⁻¹ depending on the specific experimental buffer and temperature conditions. Furthermore, these values align closely with the catalytic profiles of other well-characterized mammalian arginases, such as human arginase I, for which literature sources generally report a comparable KM of approximately 2.0 to 4.0 mM. The strong correlation between the CD-derived kinetic parameters and the established colorimetric literature data for these homologous enzymes confirms that the direct spectroscopic monitoring of the L-arginine to L-ornithine conversion provides a highly accurate and reliable measurement of continuous enzymatic activity without the need for auxiliary reagents or structural derivatization.
3.5. ATR-FTIR Spectroscopic Monitoring of Substrate Depletion and Product Formation
To complement the far-UV CD measurements, attenuated total reflectance Fourier-transform infrared (ATR-FTIR) spectroscopy was developed as an orthogonal analytical method to monitor the enzymatic reaction. This approach is fundamentally based on tracking the dynamic changes in specific vibrational peak intensities that directly correspond to the depletion of the L-arginine substrate and the concomitant accumulation of the L-ornithine product over the course of the hydrolysis process. Figure 4a presents the reference ATR-FTIR spectra of 30 mM L-arginine and 30 mM L-ornithine, with the comprehensive vibrational band assignments detailed in Table 4.
The infrared spectrum of L-arginine is strongly characterized by the asymmetric stretching modes of the guanidinium group (νas CN₃H₅⁺), which appear as a prominent high-frequency component at ~1675 cm⁻¹ and a low-frequency component at ~1630 cm⁻¹. An additional unique envelope is present at 1050–980 cm⁻¹, corresponding to aliphatic backbone and side-chain stretches. Conversely, the spectrum of the product, L-ornithine, lacks these guanidinium signatures entirely. Instead, it is dominated by strong product-specific bands, most notably the carboxylate asymmetric stretch (νas COO⁻) at ~1605 cm⁻¹, the ammonium bending mode (δs NH₃⁺) at ~1520 cm⁻¹, and the symmetric carboxylate stretch (νs COO⁻) at ~1410 cm⁻¹. The distinct separation between the substrate-specific ~1675 cm⁻¹ band and the product-specific ~1520 cm⁻¹ band provides an optimal, interference-free system for quantitative kinetic tracking.
The real-time catalytic conversion of 20 mM L-arginine was continuously monitored by recording sequential FTIR spectra. For the reaction catalyzed by free arginase (Figure 4b), the time-resolved spectra over 13 minutes revealed a systematic, progressive depletion of the substrate-specific guanidinium bands, accompanied by the proportional emergence of the ornithine-specific bands. An identical spectral evolution was successfully recorded for the liposomal arginase formulation over 9 minutes (Figure 4c). The clear detection of these vibrational transitions in the encapsulated sample confirms that the presence of the phospholipid bilayer does not obscure the diagnostic infrared windows, thereby allowing direct tracking of intra-liposomal substrate processing. By integrating the changes in the diagnostic absorption bands, kinetic progress curves detailing product accumulation over time were constructed (Figure 4d).
The kinetic parameters derived from FTIR data are summarized in Table 4. Native free arginase exhibited KM of 1.34 ± 0.10 mM, and a turnover number of 314 ± 16 s⁻¹, yielding a catalytic efficiency of (2.3 ± 0.2) × 10⁵ s⁻¹M⁻¹. Upon liposomal encapsulation, the apparent KM slightly increased to 2.08 mM, and the turnover number experienced a minor reduction to 285 ± 14 s⁻¹. Consequently, catalytic efficiency of the liposomal arginase was determined to be 1.37 × 10⁵ s⁻¹M⁻¹. FTIR-derived parameters corroborate the findings of the CD assay, confirming that the enzyme retains a high degree of its native catalytic capacity following incorporation into the lipid vesicles.
The FTIR-derived turnover numbers kcat remain in reasonable agreement with the CD assay (314 ± 16 s⁻¹ versus 276 ± 12 s⁻¹ for the native enzyme), some discrepancy between the Michaelis constants is observed. Specifically, the apparent KM for free arginase dropped from 3.60 mM in the CD assay to 1.34 mM in the FTIR measurement. This variation does not indicate a flaw in the catalytic model, but rather stems directly from the fundamental physical differences between the two measurement modalities.

Table 5.
Kinetic parameters of arginine hydrolysis determined using FTIR. Data are presented as mean ± SD. The initial substrate concentration was [S]0 = 30 mM. Enzyme concentrations were [E]0 = 0.004 mg/mL for free arginase and 0.015 mg/mL for liposomal arginase. The catalytic constant was calculated assuming a monomer molecular weight of ~35 kDa for arginase.
Table 5.
Kinetic parameters of arginine hydrolysis determined using FTIR. Data are presented as mean ± SD. The initial substrate concentration was [S]0 = 30 mM. Enzyme concentrations were [E]0 = 0.004 mg/mL for free arginase and 0.015 mg/mL for liposomal arginase. The catalytic constant was calculated assuming a monomer molecular weight of ~35 kDa for arginase.
| Parameter | Native arginase | Liposomal arginase |
| KM, mM | 1.34 ± 0.10 | 2.08 ± 0.15 |
| kcat, s–1 | 314 ± 16 | 285 ± 14 |
| kcat /KM, s–1×M–1 | (2.3 ± 0.2) × 10⁵ | (1.37 ± 0.11) × 10⁵ |
Unlike the isotropic bulk solution environment in a CD cuvette, ATR-FTIR exclusively probes a restricted 1–2 µm evanescent field at the surface of the ZnSe crystal. Free arginase is highly prone to rapid surface adsorption, concentrating the enzyme at the solid-liquid interface. This localized surface crowding alters the microenvironment compared to bulk diffusion, frequently resulting in an artificially lowered apparent KM (reflecting an increased localized substrate collision rate). Therefore, while absolute kinetic constants derived from the ATR interface naturally diverge from classical bulk measurements due to these interfacial phenomena, the FTIR modality remains an indispensable and robust tool for tracking relative kinetic trends in turbid liposomal suspensions where conventional optical methods fail.
3.6. Influence of Liposome Encapsulation on the Conformational Properties and Stability of Arginase
To determine whether the phospholipid bilayer alters the conformational stability of the enzyme, the thermal denaturation of free and liposomal arginase (2 mg/mL) was monitored from 20 to 80 °C by far-UV CD and UV absorption spectroscopy (Figure 5).
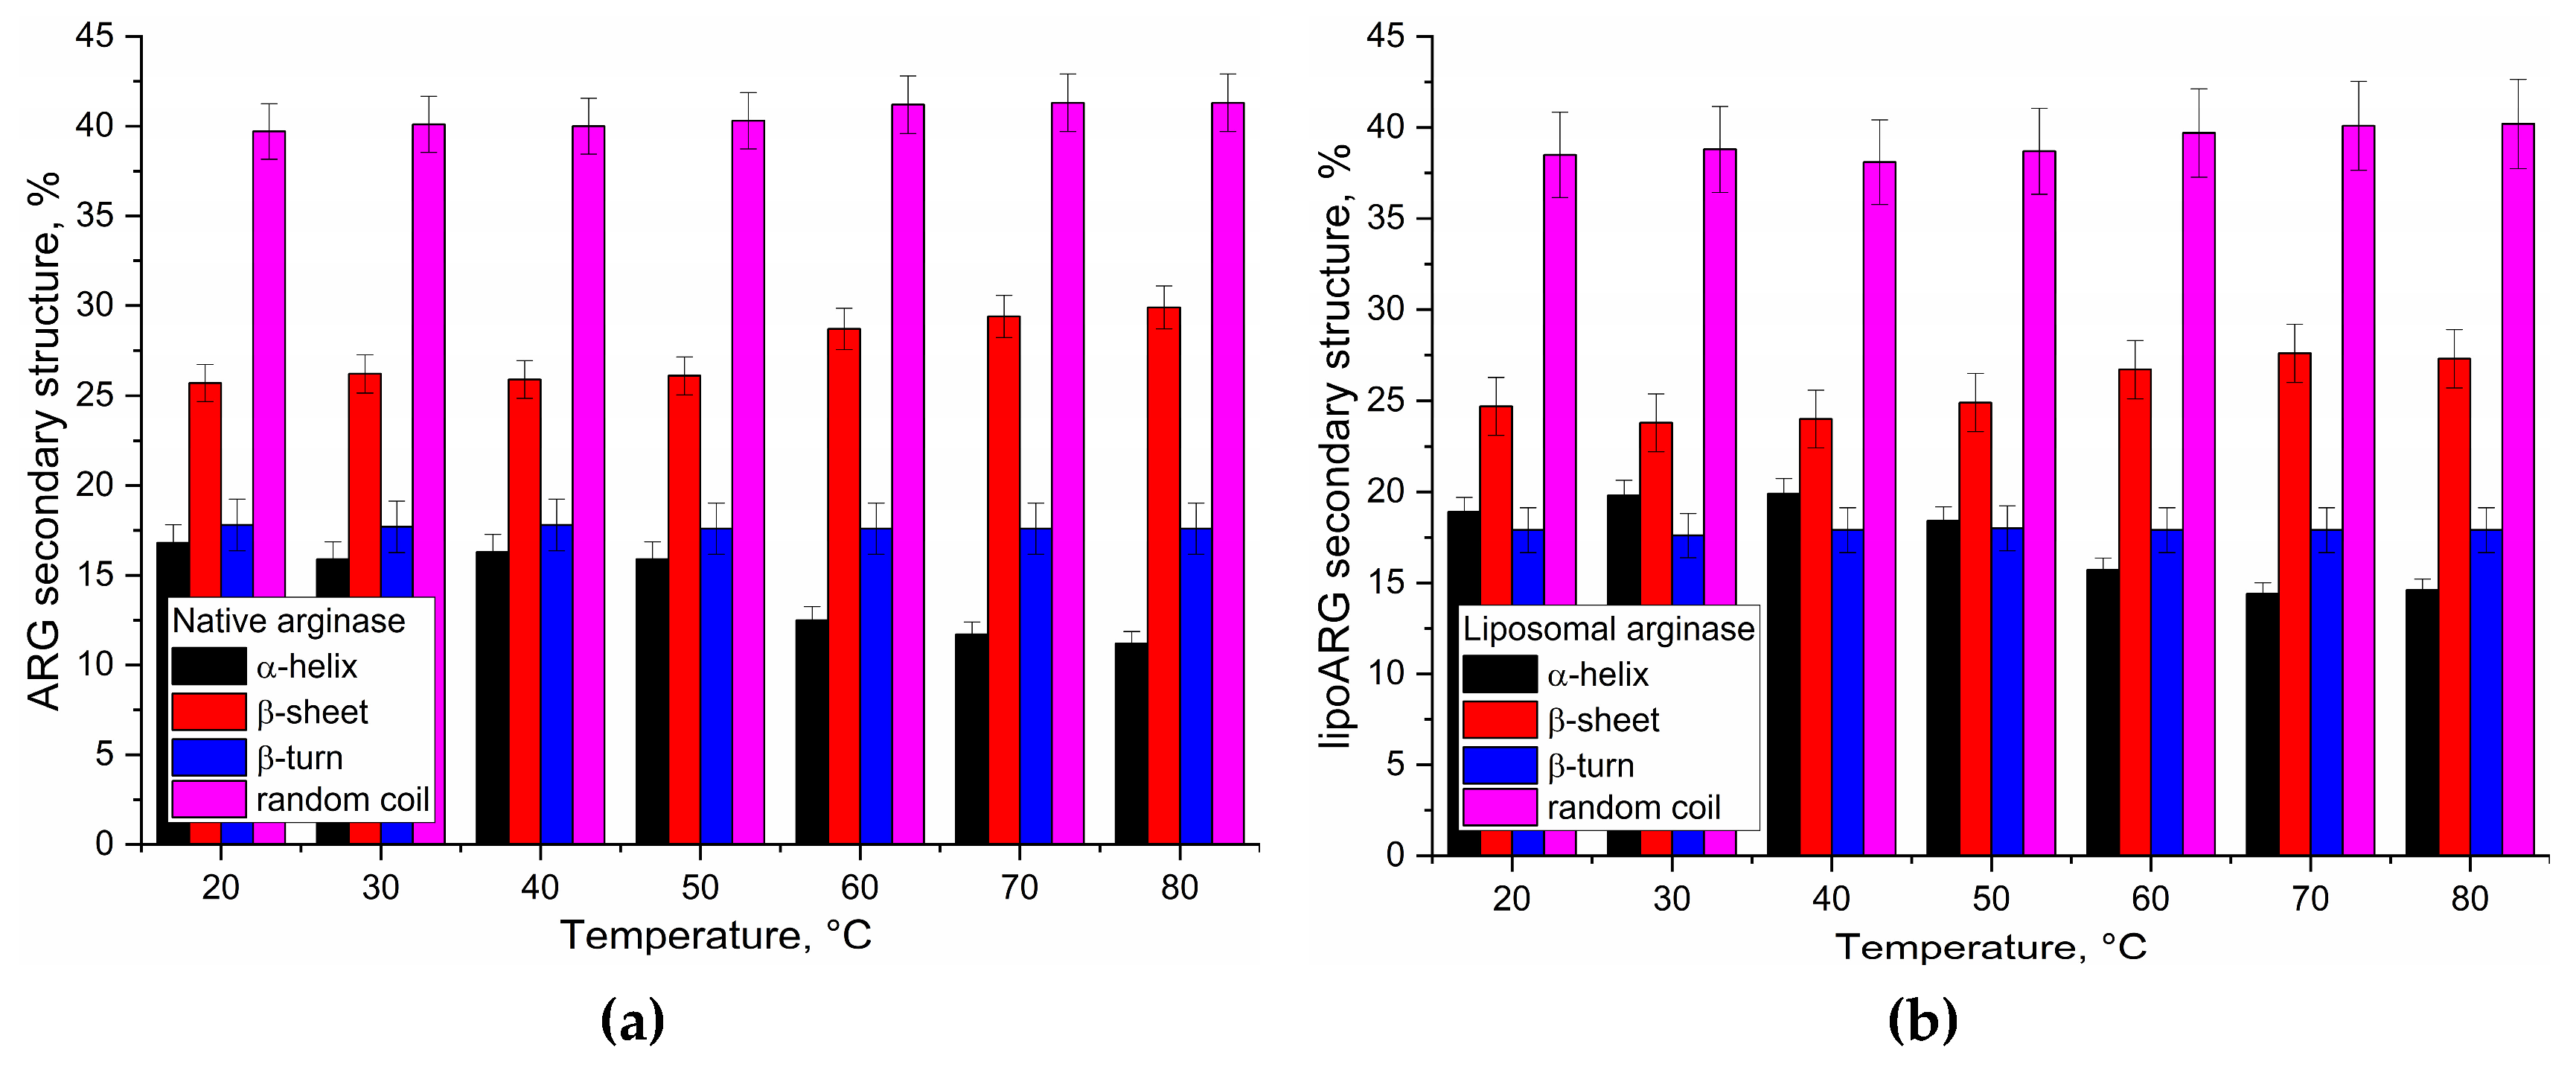
To quantitatively determine the influence of liposomes on the secondary structure and its resistance to thermal denaturation, a CDNN deconvolution of the CD spectra was performed. Although the raw spectra exhibit apparent visual differences due to the intense optical scattering of the lipid vesicles, the CDNN algorithm effectively normalizes these amplitude variations. The deconvolution analysis reveals that at baseline temperatures (20–50 °C), the secondary-structure composition of lipo-ARG (α-helix ~18–20%, β-sheet ~24–25%, β-turn ~18%, random coil ~38–39%) is structurally highly consistent with that of the free enzyme (α-helix ~16–17%, β-sheet ~26%, β-turn ~18%, random coil ~40%). Therefore, the liposomal formulation successfully preserves the native structural fold upon encapsulation.
Above 50 °C, the thermal denaturation trajectories of the two formulations diverge significantly. Free arginase experiences severe structural degradation, losing approximately one-third of its helical content (dropping from ~16% at 50 °C to ~11% at 80 °C). This lost helical structure is primarily redistributed into β-sheets, which increase from ~26% to ~30%. This structural transition is consistent with the collapse of the characteristic 208/222 nm double minimum into a single broad minimum near 215 nm in the raw spectra, providing a clear spectroscopic marker for progressive intermolecular β-aggregation.
In stark contrast, the liposomal formulation exhibits profoundly enhanced structural stability under identical thermal stress. For lipo-ARG, the α-helical content is strongly conserved, decreasing only from ~18.5% at 50 °C to ~14.5% at 80 °C, while the β-sheet fraction experiences a vastly suppressed expansion, shifting only from ~25% to ~27%. These quantitative findings definitively confirm that anchoring the enzyme within the phospholipid bilayer severely restricts large-scale unfolding and almost entirely prevents heat-induced β-aggregation, rendering the liposomal formulation significantly more stable than the native enzyme under acute thermal stress.
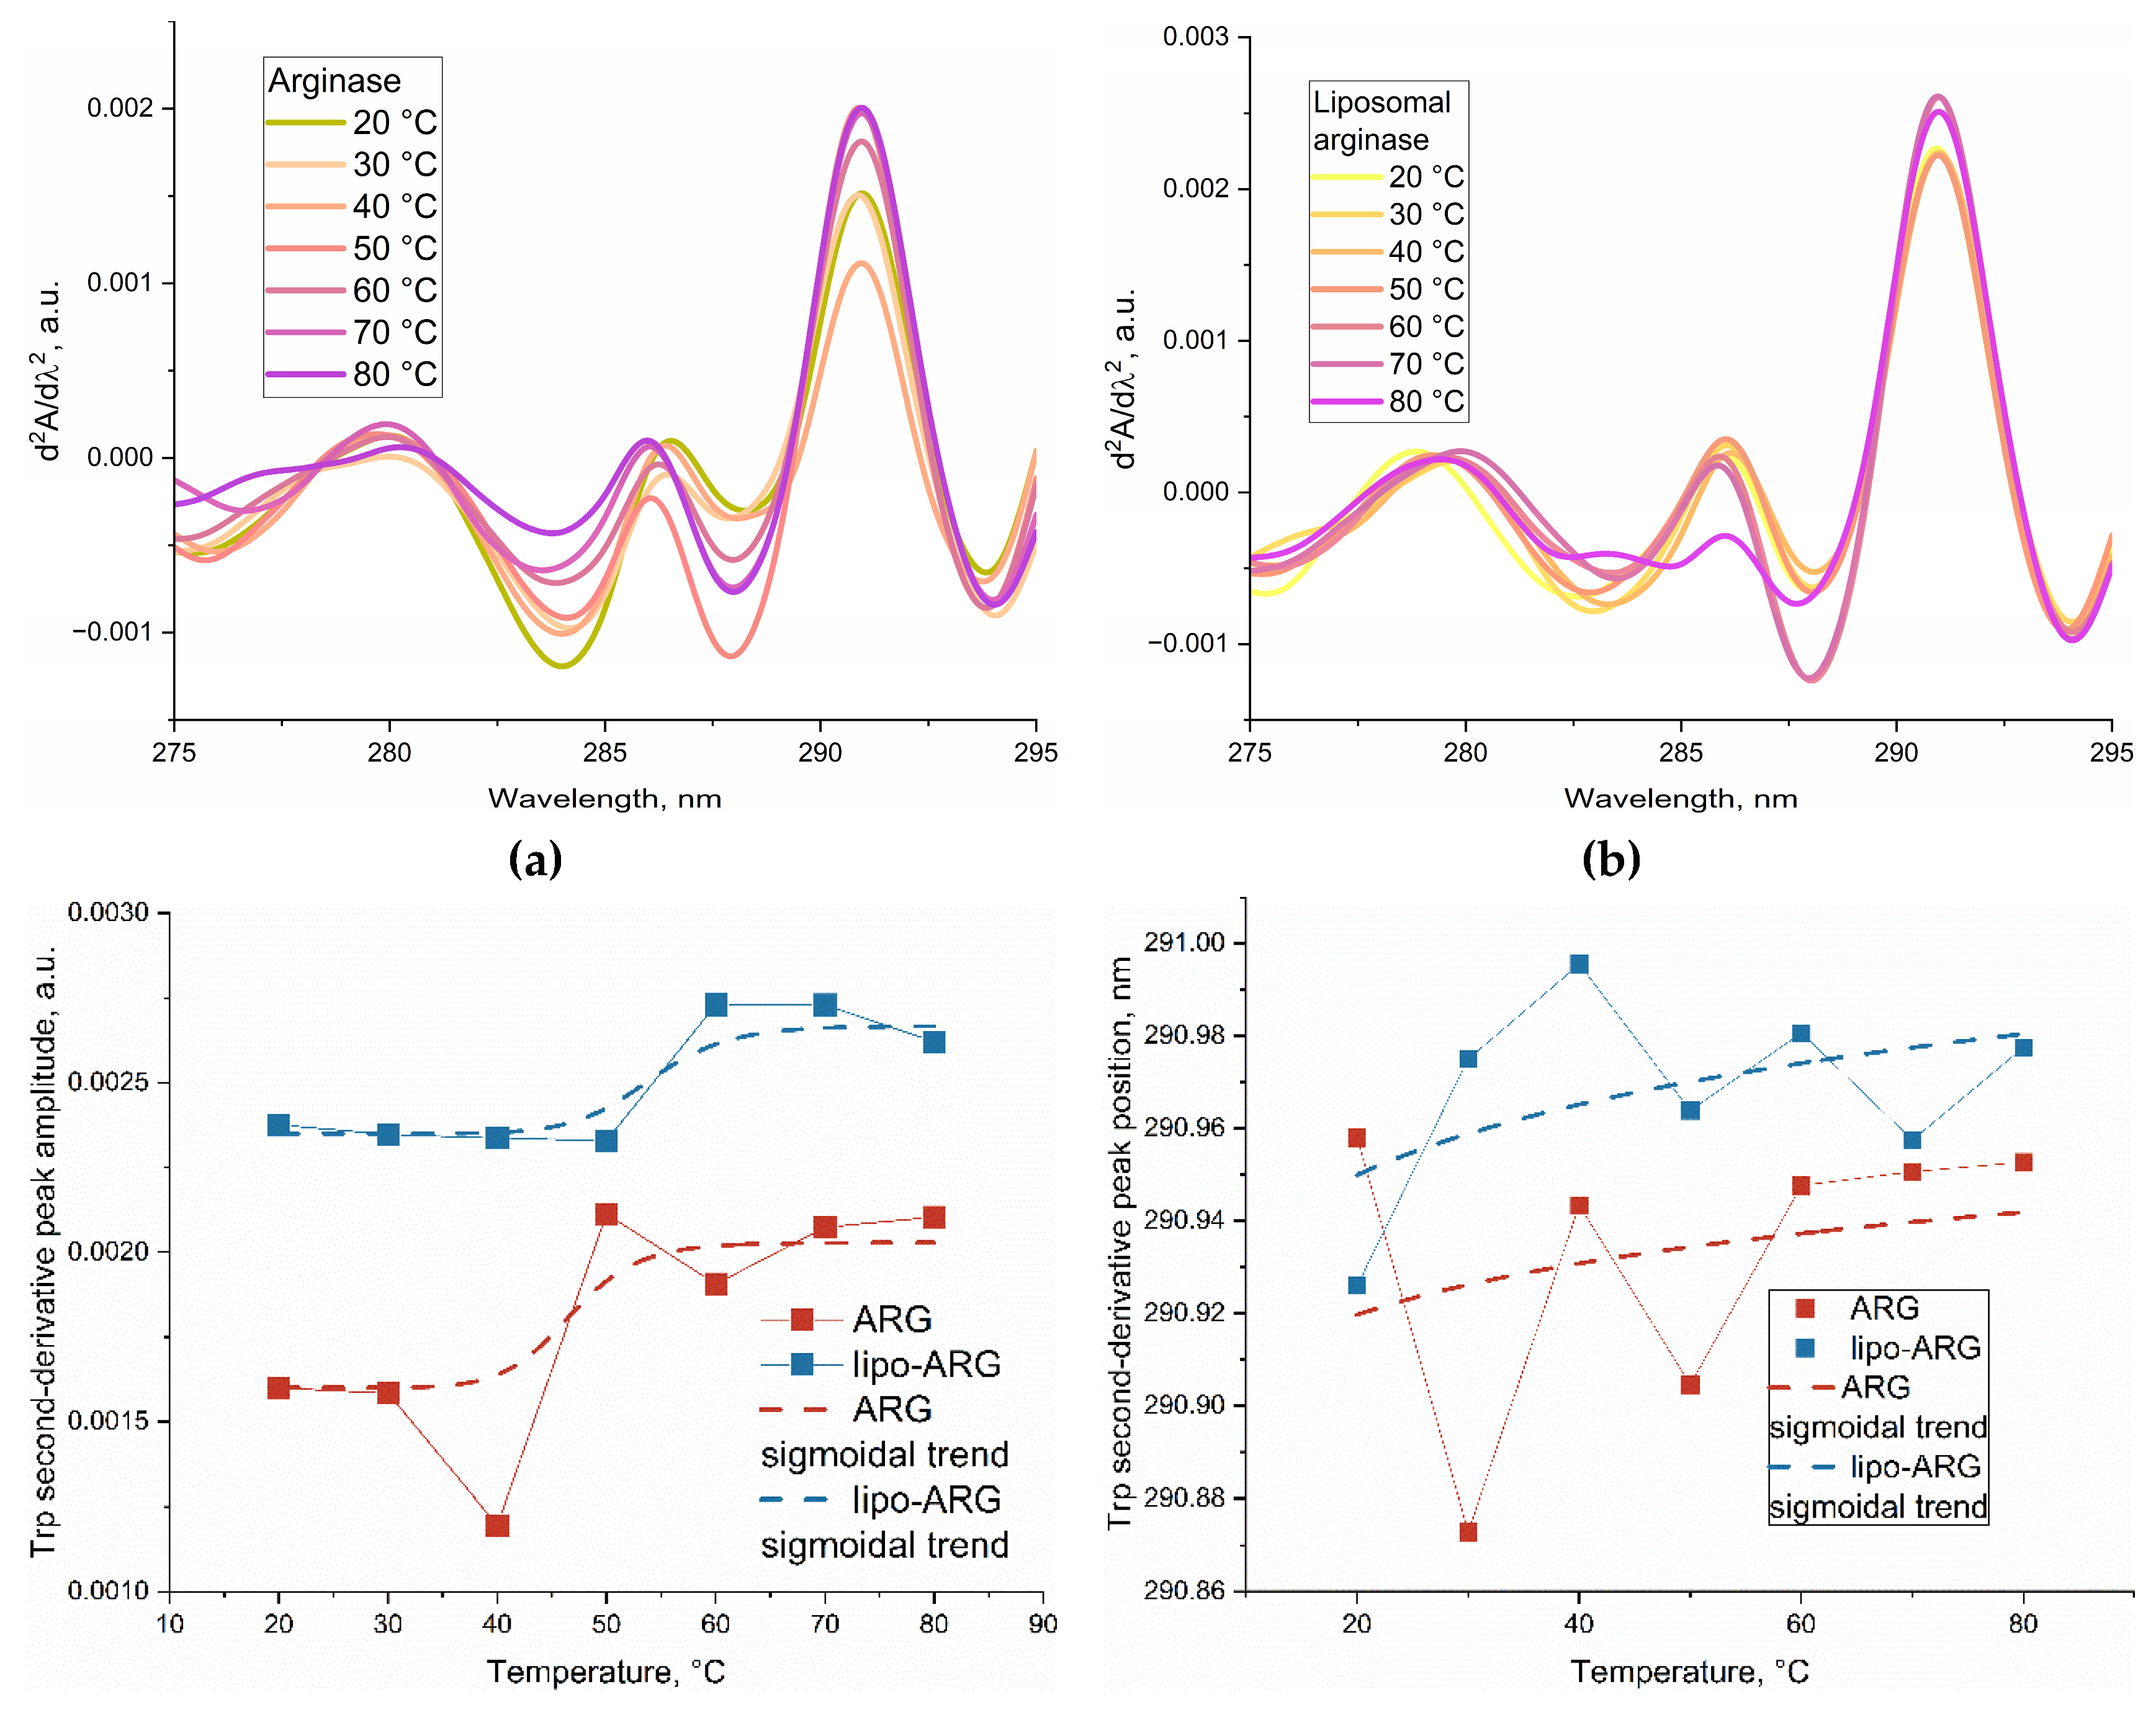
Having established that the liposomal bilayer successfully preserves the secondary structure of arginase, we next sought to evaluate whether this protective effect extends to the tertiary packing and the local environment of aromatic residues. To achieve this, we employed second-derivative UV absorption spectroscopy, which provides an independent, scattering-free readout of the tryptophan (Trp, ~291 nm) and tyrosine (Tyr, ~283 nm) signatures, effectively bypassing the amplitude distortions caused by liposomal turbidity (Figure 7a,b).
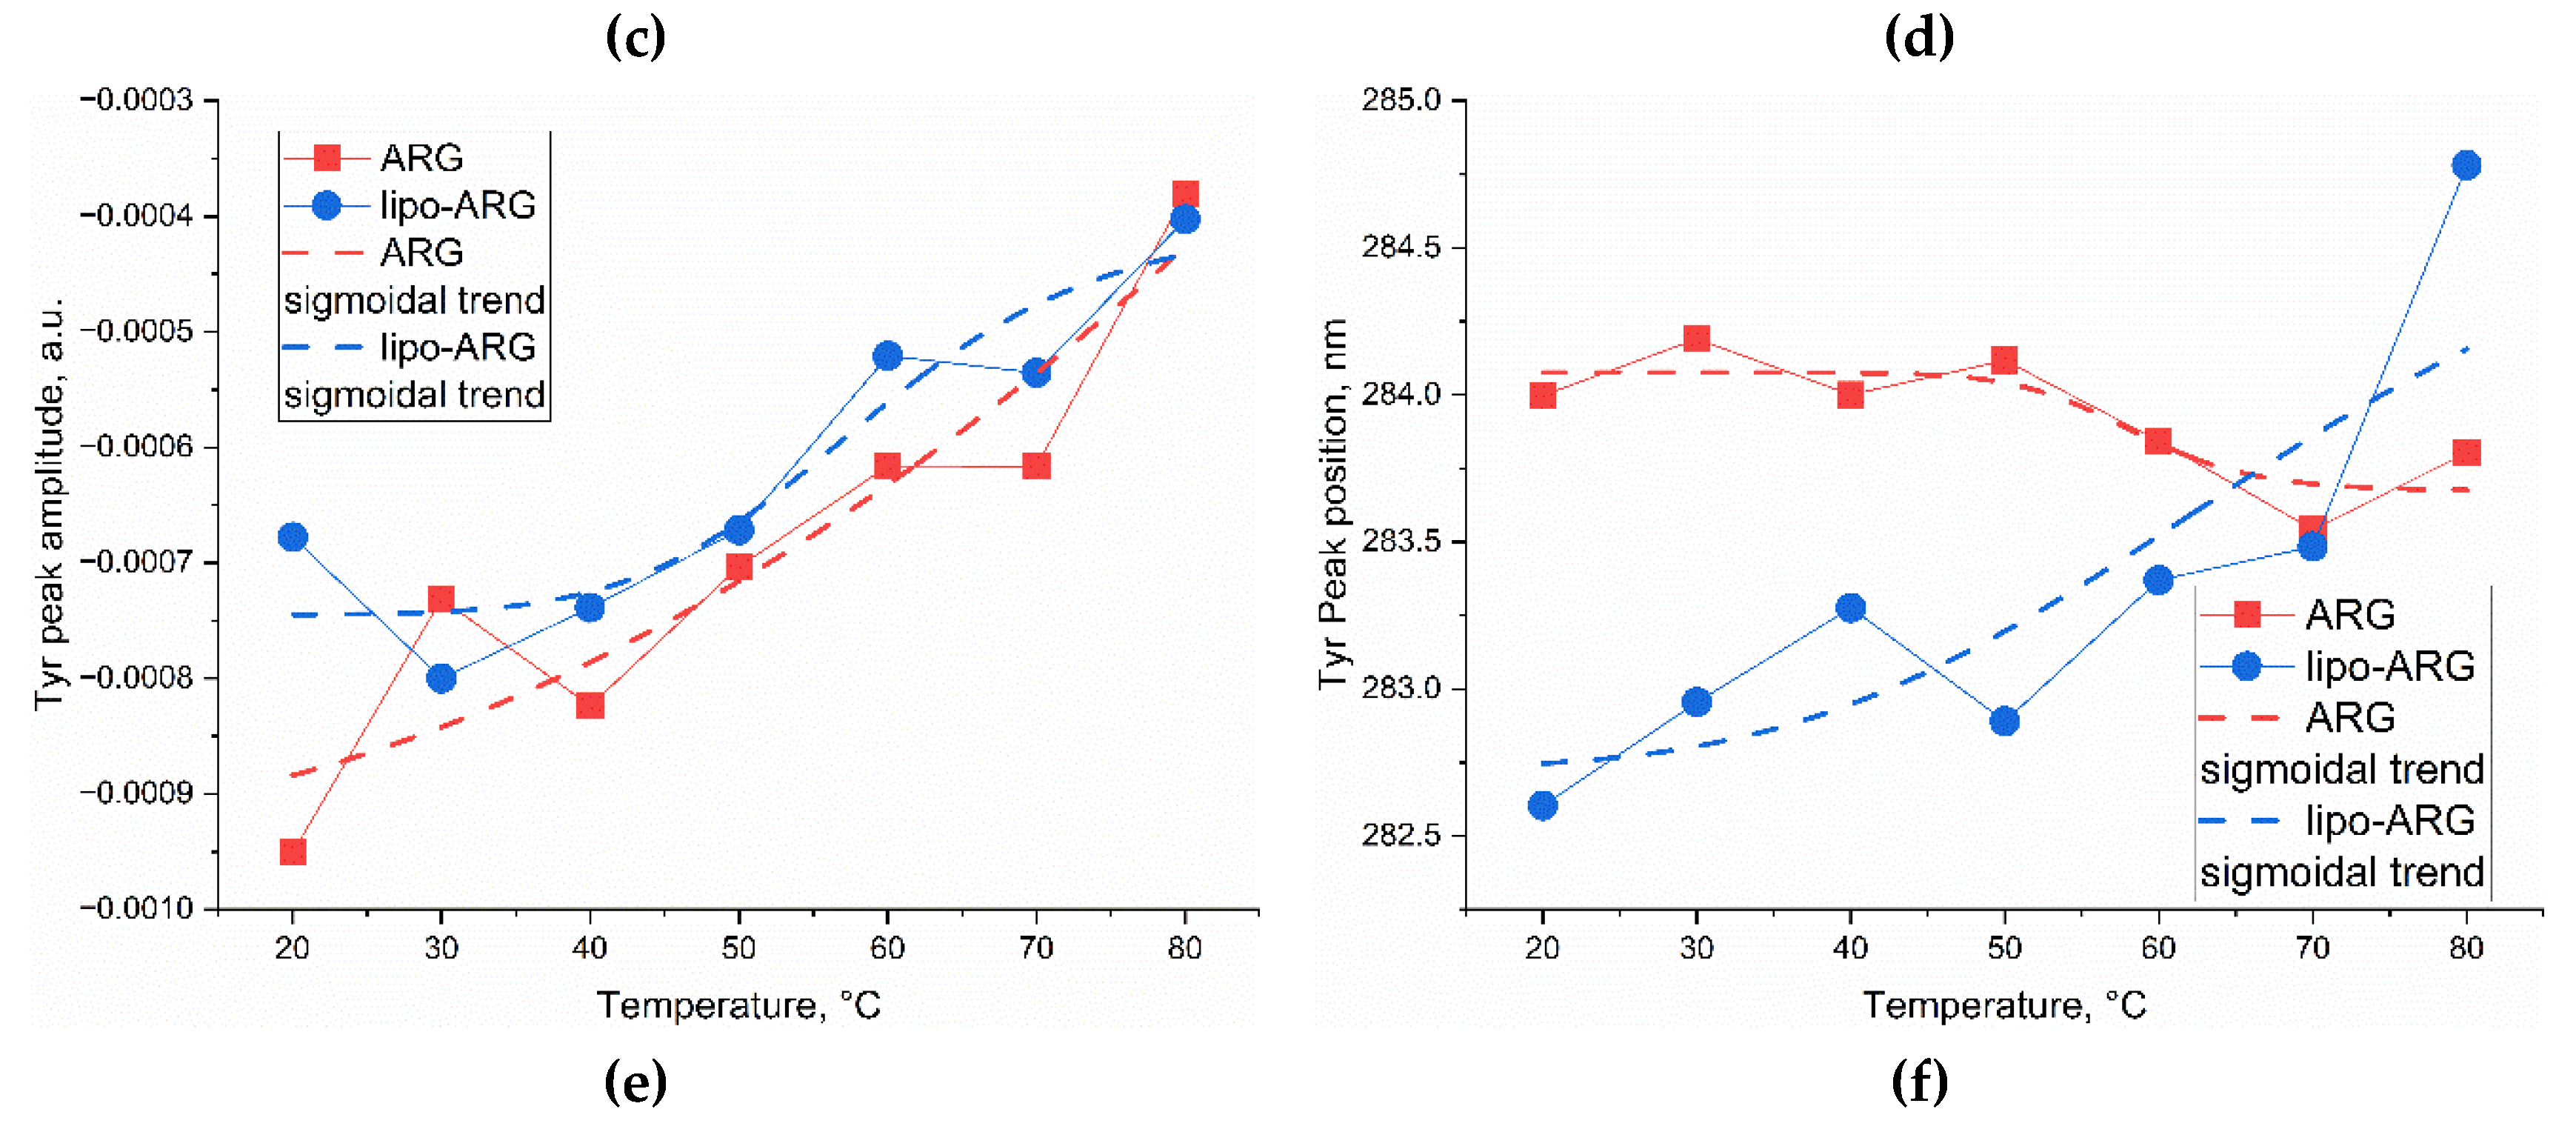
Focusing first on the hydrophobic core, we observed that across the 20–80 °C heating range, the position of the Trp second-derivative peak remained invariant (290.9 ± 0.1 nm) for both formulations (Figure 7d). This stability indicates that thermal unfolding does not fully expose the internal indole rings to the bulk solvent. However, the peak amplitude—a sensitive reporter of local structural perturbation—increased by ~30% for the free arginase upon heating (Figure 7c), consistent with a progressive loosening of the tertiary packing. In contrast, the encapsulated arginase exhibited a ~45% higher baseline amplitude at 20 °C (0.0024 a.u.), implying that the membrane anchoring itself intrinsically perturbs the resting Trp environment. More importantly, this amplitude increased by only 10–15% upon subsequent heating (Figure 7c), confirming that liposomal encapsulation severely dampens the thermal response of the protein core without altering its overall fold class.
Figure 7.
CDNN-deconvoluted secondary-structure composition (α-helix, β-sheet, β-turn, random coil; normalized to 100%) of (a) free arginase and (b) liposomal arginase as a function of temperature 20–80 °C.
Figure 7.
CDNN-deconvoluted secondary-structure composition (α-helix, β-sheet, β-turn, random coil; normalized to 100%) of (a) free arginase and (b) liposomal arginase as a function of temperature 20–80 °C.
While the Trp signal primarily reflects the stabilization of the internal protein core, monitoring the tyrosine (Tyr) signature provided critical insights into the external protein-lipid interface. Specifically, in the liposomal formulation, the Tyr peak position exhibited a distinct, progressive wavelength shift (from ~282.6 to ~284.8 nm) that synchronized precisely with the thermal melting of the lipid bilayer (Figure 7f). This targeted spectral shift strongly suggests that Tyr residues are directly engaged at the binding interface, effectively anchoring the enzyme to the membrane. In stark contrast, the Tyr peak position of the free native enzyme remained relatively static (~284.0 nm) across the same temperature range (Figure 7f). Devoid of this stabilizing lipid interface, the free native enzyme simply undergoes global structural collapse, leading to the aggregation previously observed in CD spectra.
Figure 7.
Second-derivative UV absorption analysis of the Trp/Tyr region (250–300 nm) of free (ARG) and liposomal (lipo-ARG) arginase at 20–80 °C. Second-derivative spectra of (a) ARG and (b) lipo-ARG at all seven temperatures. (c) Amplitude and (d) position of the Trp second-derivative peak (≈291 nm) versus temperature. (e) Amplitude and (f) position of the Tyr second-derivative peak (≈283 nm) versus temperature.
Figure 7.
Second-derivative UV absorption analysis of the Trp/Tyr region (250–300 nm) of free (ARG) and liposomal (lipo-ARG) arginase at 20–80 °C. Second-derivative spectra of (a) ARG and (b) lipo-ARG at all seven temperatures. (c) Amplitude and (d) position of the Trp second-derivative peak (≈291 nm) versus temperature. (e) Amplitude and (f) position of the Tyr second-derivative peak (≈283 nm) versus temperature.
So, scattering-free readouts perfectly complement the CDNN analysis, confirming a dual mechanism of liposomal protection: the preservation of the secondary fold and the locking of the tertiary core via direct membrane anchoring. Since we have now biophysically established that the lipid matrix effectively prevents heat-induced structural aggregation, the logical next step is to evaluate how this macromolecular lockdown translates into functional resilience. To this end, we subsequently investigated the kinetics of thermal inactivation to quantify the preservation of residual catalytic activity.
3.7. Kinetics of Irreversible Thermal Inactivation and Functional Stabilization of Liposomal Arginase
Given the thermodynamic restriction of global unfolding established above, we next asked how it translates into resistance to irreversible thermal inactivation. Free and liposomal arginase were incubated at 55 °C and 70 °C, cooled, and residual activity (A/A₀) was measured by the CD assay at a saturating substrate concentration (15 mM, zero-order conditions; Figure 8).
To determine how the observed structural protection translates into sustained functional resilience, the kinetics of irreversible thermal inactivation were evaluated. In semi-logarithmic coordinates, the inactivation trajectories immediately reveal fundamentally different degradation mechanisms for the two formulations.
The free arginase exhibits a predominantly first-order exponential decay during the initial heating phase, but noticeably deviates from strict linearity by approximately 15% in the later stages of the incubation. This kinetic deviation perfectly corroborates our CD spectroscopy and CDNN deconvolution findings, which identified a concurrent 15% shift toward intermolecular antiparallel beta-sheet structures. Because thermal aggregation is an intermolecular process, it inherently distorts the strictly unimolecular kinetics of simple unfolding, progressively accelerating the loss of activity and pulling the terminal residual activity down to 54% (at 70 °C for 60 min).
Conversely, the liposomal formulation demonstrates a highly pronounced biphasic inactivation profile, serving as direct kinetic evidence for the presence of two distinct enzyme populations: a labile surface-associated fraction and a highly stable, structurally integrated core. During the first 15 min, lipo-ARG inactivates symbiotically, and even marginally faster than the free enzyme (kin = 0.014 vs. 0.010 min⁻¹ at 55 °C; Table 6). This initial rapid phase is attributed to the minor, loosely bound external fraction that resides at the lipid-water interface, remaining fully exposed to the solvent and acute thermal stress without the thermodynamic benefit of deep membrane anchoring.
Beyond 15 min, however, the liposomal inactivation curve deviates sharply below the initial linear trend and rapidly approaches a stable horizontal plateau. Once the loosely associated external fraction is thermally depleted, the deeply anchored core fraction entirely dominates the catalytic response. Protected from intermolecular collisions and subsequent aggregation by strict physical isolation within the cardiolipin-enriched bilayer, this conformationally locked intra-liposomal population remains robustly active for the remainder of the incubation. Consequently, the liposomal formulation achieves significantly higher terminal residual activity (e.g., 70% vs. 62% at 55 °C), definitively proving that the macromolecular confinement successfully bypasses the aggregation pathway.
3.8. Activation Energy and Mechanistic Pathways of Thermal Inactivation
The activation energy of inactivation, Eₐ, was obtained from the initial-phase rate constants at 328.15 K and 343.15 K (Arrhenius relationship; Figure 8b). The rate-constant ratio between the two temperatures is identical for free arginase (0.015/0.010) and for the initial phase of lipo-ARG (0.021/0.014), giving the same Eₐ ≈ 25.3 kJ/mol for both.
This value is far below the ΔH of global unfolding (156–466 kJ/mol, Section 3.6), showing that the rate-limiting step for early activity loss is not macroscopic unfolding but a localized event — most likely a conformational fluctuation at the binuclear Mn²⁺ active site or disruption of a peripheral hydrogen-bond network.
The identical Eₐ for free arginase and the initial phase of lipo-ARG confirms that this vulnerable subpopulation is surface-adsorbed or loosely bound enzyme experiencing an environment equivalent to bulk solvent, rather than the membrane-embedded core.
Once this fraction is depleted, the mechanisms diverge. Free arginase continues to inactivate via irreversible aggregation, consistent with the shift toward intermolecular β-sheet content observed by CD and CDNN deconvolution at high temperature (Figure 6a, Section 3.6). Physical isolation of enzymes within separate liposomes abolishes the intermolecular collisions required for this pathway.
Multipoint anchoring to the bilayer also imposes steric constraints on the deeply embedded core, driving its apparent inactivation rate toward zero: the dominant mechanism shifts from an aggregation-driven cascade to conformational locking, securing the long-term catalytic viability of the formulation.
4. Discussion
The development of real-time, reagent-free kinetic assays is critical for advancing therapeutic and diagnostic enzymology. For amino-acid-depleting biologic drugs like arginase, accurate assessment of catalytic activity within complex nanocarriers directly dictates clinical efficacy. Historically, measuring arginase kinetics relied on disruptive, multi-step chemical methods. We overcame this fundamental limitation by validating a multimodal spectroscopic platform—utilizing far-UV absorbance, circular dichroism, and Fourier-transform infrared spectroscopy—to directly and continuously monitor L-arginine hydrolysis. This approach successfully extends our label-free analytical paradigm, previously established for L-asparaginase, directly to the arginase system.
The clinical significance of this continuous methodology extends far beyond formulation screening, as arginase serves as a fundamental disease biomarker. Its expression strictly regulates alternative macrophage activation, making dynamic shifts in arginase activity a primary indicator of the macrophage polarization states that drive the pathogenesis of respiratory and joint disorders. By eliminating the structural interference and artifacts of traditional end-point assays, our real-time optical readout provides a transformative analytical engine for targeted diagnostic platforms designed to profile these specific macrophage populations with unprecedented kinetic resolution.
Furthermore, this direct measurement strategy is absolutely indispensable for the rational design of next-generation delivery systems. Advanced nanocarriers, such as the liposomes evaluated in this study, inherently create formidable optical barriers (turbidity and light scattering) that severely confound standard colorimetric evaluations. Our multimodal approach seamlessly bypasses this lipid interference, allowing us to uncover the profound conformational restriction and long-term thermodynamic stabilization that arginase achieves upon encapsulation. Ultimately, by bridging the gap between structural biophysics and pharmaceutical science, this label-free framework accelerates the development of both highly resilient enzyme therapeutics and precision clinical diagnostics.
4.1. Analytical Sensitivity and the Selection of Spectroscopic Modalities
The establishment of any novel kinetic assay necessitates a rigorous evaluation of its analytical figures of merit (Table 7). The selection of an appropriate spectroscopic technique represents a fundamental trade-off between absolute analytical sensitivity and optical tolerance to the sample matrix.
Our data demonstrate that tracking the reaction via far-UV absorbance at 200 nm provides the highest absolute sensitivity, yielding an LOD of 0.026 ± 0.001 U/mL and an LOQ of 0.085 ± 0.003 U/mL. This extreme sensitivity makes it an ideal choice for evaluating highly purified, low-concentration free enzyme preparations. However, this modality is acutely susceptible to Rayleigh scattering and non-specific deep-UV absorption, strictly limiting its application to perfectly clear, homogenous aqueous solutions.
Far-UV CD spectroscopy offers an intermediate sensitivity profile (LOD 0.31 ± 0.02 U/mL) but introduces a critical structural dimension. Unlike simple scalar absorbance, CD provides vector-like chiral information. Monitoring the ellipticity change at 205 nm allows for the direct tracking of the chiral perturbation induced by the hydrolytic cleavage of the bulky guanidinium group. More importantly, CD establishes a dual-modality analytical platform: the identical instrument and sample setup can be utilized to seamlessly transition from assessing the kinetic function of the enzyme to evaluating its thermal stability and secondary structure preservation.
Conversely, ATR-FTIR spectroscopy exhibited the highest LOD among the three methods (0.47 ± 0.05 U/mL). However, this apparent limitation in absolute sensitivity is entirely offset by its unparalleled tolerance for highly scattering, turbid media, a characteristic that becomes indispensable when analyzing encapsulated therapeutics.
4.2. Overcoming the Limitations of Classical and Discontinuous Assays
A critical comparison with existing methodologies (Table 8) reveals the profound methodological advantages of the spectroscopic techniques proposed herein. Historically, the evaluation of arginase kinetics has depended on destructive, end-point chemical derivatizations. For example, the Sakaguchi reaction [19] and the p-nitrophenylglyoxal assay [20] quantify residual arginine but suffer from narrow dynamic ranges, variable color yields, and the harsh oxidative degradation of the target molecules. Similarly, assays designed to detect the reaction products, such as the ninhydrin method for L-ornithine [23,24] or the diacetyl monoxime assay for urea [21,22], require aggressive stopping steps involving extreme heat (boiling) and highly concentrated acids. These severe conditions instantly denature the enzyme, fundamentally precluding real-time kinetic monitoring and requiring labor-intensive, multi-tube setups simply to reconstruct a single kinetic progress curve.
While continuous reaction monitoring can theoretically be achieved using the Ozer coupled-enzyme assay [25] or potentiometric and pH-stat titrations [26], these approaches introduce significant new vulnerabilities. Coupled assays rely on a fragile cascade of auxiliary enzymes (urease and glutamate dehydrogenase) and expensive cofactors, making them highly susceptible to false readouts caused by matrix components inhibiting the secondary enzymes rather than the arginase itself. Potentiometric methods, though continuous, track secondary bulk-solution phenomena (proton fluxes or ammonium generation) rather than the direct primary cleavage of the substrate, and frequently suffer from sensor fouling. In stark contrast, our CD and FTIR approaches track the primary chemical event – the hydrolysis of the L-arginine guanidinium group – in real-time, in a single measurement run, and completely without the addition of exogenous chemical reagents or enzymatic cascades.
4.3. ATR-FTIR: Resolving the Analytical Bottleneck in Nanomedicine Formulation
The most formidable analytical bottleneck in the contemporary development of therapeutic enzymes lies in evaluating their activity once encapsulated within complex, highly turbid drug delivery vehicles. Both conventional UV absorbance and far-UV CD methodologies degrade entirely in the presence of intact liposomal suspensions due to overwhelming optical scattering and non-specific lipid absorption. We previously encountered this exact methodological barrier during our investigations into liposomal, conjugated and nanogel L-asparaginase formulations, where standard spectrophotometric Nesslerization assays proved completely unviable without first aggressively lysing the lipid vesicles to extract the enzyme [28,30,31].
In the present study, ATR-FTIR spectroscopy successfully bypasses this barrier, emerging as an exceptionally robust analytical tool for heterogeneous media. By continuously monitoring the decay of the substrate-specific guanidinium vibrational bands (1630–1675 cm⁻¹) and the concomitant rise of the ornithine-specific modes, we successfully generated high-resolution kinetic profiles for the encapsulated enzyme without any sample pre-treatment. The physical basis for this success lies in the ATR geometry itself: the infrared beam generates an evanescent wave that penetrates only a few micrometers into the sample in contact with the internal reflection element. Consequently, it measures the localized chemical composition at the interface while remaining nearly entirely blind to the bulk optical scattering that confounds transmission techniques. This distinct optical property allowed us to directly and continuously monitor the catalytic turnover of arginase in situ within the optically dense phosphatidylcholine/cardiolipin suspension. The kinetic data confirmed that the intact phospholipid boundary permits unimpeded substrate influx and product efflux, preserving ~90% of the native enzyme’s catalytic efficiency.
Ultimately, the integration of far-UV absorbance, CD, and ATR-FTIR spectroscopy provides a comprehensive, label-free analytical toolkit that addresses the full spectrum of arginase research requirements. While UV absorbance provides ultimate sensitivity for purified systems, and CD uniquely bridges kinetic function with thermodynamic structural analysis, ATR-FTIR provides a critical breakthrough for the evaluation of turbid, next-generation nanomedicines. By eliminating the reliance on destructive chemical derivatization, these continuous spectroscopic methods significantly streamline the biochemical evaluation of antineoplastic enzymes, accelerating the crucial transition from fundamental biophysical engineering to advanced preclinical formulation.
4.4. Liposomal Arginase Formulation
While liposomal arginase undergoes a qualitatively similar structural transition—marked by a reduction in the alpha-helix fraction from 20% to 14.6%—the overall amplitude of this unfolding event is profoundly attenuated. Across all temperatures exceeding 50 °C, the encapsulated enzyme consistently retains 3 to 4 percentage points more helical content than its free counterpart, indicating that the lipid bilayer imposes strict conformational constraints on the protein architecture. This restricted mobility is quantitatively reflected in the unfolding equilibrium constant (K = [D]/[N], representing the ratio of denatured to native protein fractions) and the subsequent van’t Hoff analysis. Under severe thermal stress at 80 °C, the free enzyme reaches an equilibrium constant of K = 0.7, signifying a substantial population shift toward the denatured state. In striking contrast, the unfolding trajectory of lipo-ARG reaches a premature plateau at K = 0.4. By remaining well below unity, this value definitively proves that the native, folded conformation persists as the dominant state even at extreme temperatures, effectively rendering global denaturation thermodynamically inaccessible.
The thermodynamic parameters further illuminate this stabilization mechanism. Upon encapsulation, the enthalpy of unfolding ΔH experiences a nearly threefold increase, escalating from 156 to 466 kJ/mol. This immense energetic penalty is elegantly offset by a proportionally larger entropy gain (ΔS), which rises from 467 to 1400 J/(mol K) (Table 6). Such robust enthalpy-entropy compensation serves as the classic thermodynamic hallmark of a cooperative, multipoint lipid-protein interface. To unfold the encapsulated arginase, the system must simultaneously sever a vast network of strong protein-lipid interactions. This collective rupture drives the massive enthalpic cost while concurrently liberating an abundance of structural degrees of freedom, explaining the profound entropic surge. As a result, the net free-energy barrier and the apparent melting temperature (Tm) exhibit a far more moderate shift than the drastic isolated change in ΔH would otherwise predict.
In practical terms, the phospholipid bilayer functions not merely as a passive insulating shell, but as an active, rigid stabilizing scaffold. This macromolecular locking mechanism directly translates into enhanced functional resilience, endowing the liposomal formulation with significantly higher residual catalytic activity following sustained thermal assault.
5. Conclusions
Evaluating amino-acid-depleting enzymes is traditionally bottlenecked by indirect, discontinuous assays. To overcome this, we established a multimodal, reagent-free spectroscopic toolkit (far-UV absorbance, CD, and ATR-FTIR) that directly and continuously tracks L-arginine hydrolysis, eliminating the need for stopping reagents or coupled-enzyme cascades.
Applying this platform to highly scattering liposomal arginase revealed that physical encapsulation within a phosphatidylcholine/cardiolipin bilayer preserves ~90% of the native catalytic efficiency. Crucially, the lipid nanocarrier increases the enzyme’s functional persistence under thermal stress by orders of magnitude (up to 200 fold).
Thermodynamic and kinetic evaluations elucidated the molecular mechanism driving this massive stabilization. While the free enzyme undergoes initial structural unfolding that progressively triggers intermolecular beta-sheet aggregation, the encapsulated enzyme retains 40–50% of its native architecture even at 80 °C. Spatial confinement within the liposomal core effectively prevents intermolecular collisions and induces a massive enthalpic barrier to denaturation. This profound thermodynamic protection directly translates into significantly higher residual catalytic activity.
This label-free analytical framework represents a significant methodological leap for therapeutic enzymology. It secures rapid, continuous kinetic readouts even in severely turbid nanomedicine formulations, accelerating the optimization and clinical deployment of targeted delivery systems. Furthermore, these methodologies offer profound diagnostic potential, enabling the precise evaluation of arginase activity as a clinical biomarker in complex biological matrices, including blood and tissue samples.
Author Contributions
Conceptualization, E.V.K. and I.D.Z.; methodology, I.D.Z., P.I.N., and E.V.K.; formal analysis, I.D.Z.; investigation, I.D.Z., P.I.N. and E.V.K.; data curation, I.D.Z.; writing—original draft preparation, I.D.Z.; writing—review and editing, E.V.K.; project supervision, E.V.K.; funding acquisition, E.V.K. All authors have read and agreed to the published version of the manuscript.
Acknowledgments
This work was performed using the equipment FTIR microscope MICRAN-3 (Simex, Novosibirsk, Russia), Jasco J-815 CD Spectrometer (JASCO, Tokyo, Japan), AFM microscope NTEGRA II (NT-MDT Spectrum Instruments, Moscow, Russia), and confocal laser scanning microscope FluoView FV1000 (Olympus, Tokyo, Japan) of the program of Moscow State University development.
Funding
This research received no external funding.
Data Availability Statement
The original contributions presented in this study are included in the article. Further inquiries can be directed to the corresponding author.
Conflicts of Interest
The authors declare no conflicts of interest.
References
- Mortier, J.; Prévost, J.R.C.; Sydow, D.; Teuchert, S.; Omieczynski, C.; Bermudez, M.; Frédérick, R.; Wolber, G. Arginase Structure and Inhibition: Catalytic Site Plasticity Reveals New Modulation Possibilities. Sci. Rep. 2017, 7, 13616. [Google Scholar] [CrossRef]
- Durante, W.; Johnson, F.K.; Johnson, R.A. ARGINASE: A CRITICAL REGULATOR OF NITRIC OXIDE SYNTHESIS AND VASCULAR FUNCTION. Clin. Exp. Pharmacol. Physiol. 2007, 34, 906–911. [Google Scholar] [CrossRef]
- Ash, D.E. Structure and Function of Arginases. J. Nutr. 2004, 134, 2760S–2764S. [Google Scholar] [CrossRef]
- Christianson, D.W. Arginase: Structure, Mechanism, and Physiological Role in Male and Female Sexual Arousal. Acc. Chem. Res. 2005, 38, 191–201. [Google Scholar] [CrossRef]
- Marzęta-Assas, P.; Jacenik, D.; Zasłona, Z. Pathophysiology of Arginases in Cancer and Efforts in Their Pharmacological Inhibition. Int. J. Mol. Sci. 2024, 25. [Google Scholar] [CrossRef]
- Li, M.; Qin, J.; Xiong, K.; Jiang, B.; Zhang, T. Review of Arginase as a Promising Biocatalyst: Characteristics, Preparation, Applications and Future Challenges. Crit. Rev. Biotechnol. 2022, 42, 651–667. [Google Scholar] [CrossRef]
- Li, Z.; Wang, L.; Ren, Y.; Huang, Y.; Liu, W.; Lv, Z.; Qian, L.; Yu, Y.; Xiong, Y. Arginase: Shedding Light on the Mechanisms and Opportunities in Cardiovascular Diseases. Cell Death Discov. 2022, 8, 1–14. [Google Scholar] [CrossRef]
- Ino, Y.; Yamazaki-itoh, R.; Oguro, S.; Shimada, K.; Kosuge, T.; Zavada, J.; Kanai, Y.; Hiraoka, N. Arginase II Expressed in Cancer-Associated Fibroblasts Indicates Tissue Hypoxia and Predicts Poor Outcome in Patients with Pancreatic Cancer. 2013, 8. [Google Scholar] [CrossRef]
- Porembska, Z.; Luboiński, G.; Chrzanowska, A.; Mielczarek, M.; Magnuska, J.; Barańczyk-Kuźma, A. Arginase in Patients with Breast Cancer. Clin. Chim. Acta 2003, 328, 105–111. [Google Scholar] [CrossRef]
- Kaysen, G.A.; Strecker, H.J. Purification and Properties of Arginase of Rat Kidney. Biochem. J. 1973, 133, 779–788. [Google Scholar] [CrossRef]
- Heuser, S.K.; Li, J.; Pudewell, S.; LoBue, A.; Li, Z.; Cortese-Krott, M.M. Biochemistry, Pharmacology, and in Vivo Function of Arginases. Pharmacol. Rev. 2025, 77, 100015. [Google Scholar] [CrossRef]
- Dowling, D.P.; Ilies, M.; Olszewski, K.L.; Portugal, S.; Mota, M.M.; Llinás, M.; Christianson, D.W. Crystal Structure of Arginase from Plasmodium Falciparum and Implications for l -Arginine Depletion in Malarial Infection. Biochemistry 2010, 49, 5600–5608. [Google Scholar] [CrossRef]
- Sekula, B. The Neighboring Subunit Is Engaged to Stabilize the Substrate in the Active Site of Plant Arginases. Front. Plant Sci. 2020, 11, 1–12. [Google Scholar] [CrossRef]
- Mudedla, S.K.; Ghosh, B.; Dhoke, G. V.; Oh, S.; Wu, S. QM/MM Simulations for the Broken-Symmetry Catalytic Reaction Mechanism of Human Arginase I. ACS Omega 2022, 7, 32536–32548. [Google Scholar] [CrossRef]
- Changou, C.A.; Chen, Y.R.; Xing, L.; Yen, Y.; Chuang, F.Y.S.; Cheng, R.H.; Bold, R.J.; Ann, D.K.; Kung, H.J. Arginine Starvation-Associated Atypical Cellular Death Involves Mitochondrial Dysfunction, Nuclear DNA Leakage, and Chromatin Autophagy. Proc. Natl. Acad. Sci. U. S. A. 2014, 111, 14147–14152. [Google Scholar] [CrossRef]
- Sparkes, R.S.; Dizikes, G.J.; Klisak, I.; Grody, W.W.; Mohandas, T.; Heinzmann, C.; Zollman, S.; Lusis, A.J.; Cederbaum, S.D. The Gene for Human Liver Arginase (ARG1) Is Assigned to Chromosome Band 6q23. Am. J. Hum. Genet. 1986, 39, 186–193. [Google Scholar]
- Cheng, P.N.M.; Lam, T.L.; Lam, W.M.; Tsui, S.M.; Cheng, A.W.M.; Lo, W.H.; Leung, Y.C. Pegylated Recombinant Human Arginase (RhArg-Peg5,000mw) Inhibits the in Vitro and in Vivo Proliferation of Human Hepatocellular Carcinoma through Arginine Depletion. Cancer Res. 2007, 67, 309–317. [Google Scholar] [CrossRef]
- Stone, E.M.; Glazer, E.S.; Chantranupong, L.; Cherukuri, P.; Breece, R.M.; Tierney, D.L.; Curley, S.A.; Iverson, B.L.; Georgiou, G. Replacing Mn 2+ with Co 2+ in Human Arginase I Enhances Cytotoxicity toward l -Arginine Auxotrophic Cancer Cell Lines. ACS Chem. Biol. 2010, 5, 333–342. [Google Scholar] [CrossRef]
- Loeb, W.F.; Stuhlman, R.A. A Colorimetric Method for the Determination of Serum Arginase Activity. Clin. Chem. 1969, 15, 162–169. [Google Scholar] [CrossRef]
- Aminlari, M. A Novel Colorimetric Method for Assaying Arginase Activity. Clin. Biochem. 1992, 25, 431–436. [Google Scholar] [CrossRef]
- Langenfeld, N.J.; Payne, L.E.; Bugbee, B. Colorimetric Determination of Urea Using Diacetyl Monoxime with Strong Acids. PLoS ONE 2021, 16, 1–7. [Google Scholar] [CrossRef]
- Satoh, P.S.; Ito, Y. Quantitative Rapid Microassay of Arginase. Anal. Biochem. 1968, 23, 219–229. [Google Scholar] [CrossRef]
- Iyamu, E.W.; Asakura, T.; Woods, G.M. A Colorimetric Microplate Assay Method for High-Throughput Analysis of Arginase Activity in Vitro. Anal. Biochem. 2008, 383, 332–334. [Google Scholar] [CrossRef]
- Smith, N.J.; Maddahfar, M.; Gunasegaran, B.; McGuire, H.M.; Fazekas de St Groth, B. A High-Throughput Colorimetric Microplate Assay for Determination of Plasma Arginase Activity. Methods Mol. Biol. 2023, Vol. 2620, 273–286. [Google Scholar] [CrossRef]
- Özer, N. A New Enzyme-Coupled Spectrophotometric Method for the Determination of Arginase Activity. Biochem. Med. 1985, 33, 367–371. [Google Scholar] [CrossRef]
- Urbanowicz, M.; Sadowska, K.; Paziewska-Nowak, A.; Sołdatowska, A.; Pijanowska, D.G. Biosensor Based on Coupled Enzyme Reactions for Determination of Arginase Activity. Bioelectrochemistry 2022, 146, 108137. [Google Scholar] [CrossRef]
- Dabrowska, A.; Schwaighofer, A.; Lendl, B. Mid-Infrared Dispersion Spectroscopy as a Tool for Monitoring Time-Resolved Chemical Reactions on the Examples of Enzyme Kinetics and Mutarotation of Sugars. Appl. Spectrosc. 2024, 78, 982–992. [Google Scholar] [CrossRef]
- Zlotnikov, I.D.; Kudryashova, E. V. A Novel Approach for the Activity Assessment of L-Asparaginase Formulations When Dealing with Complex Biological Samples. Int. J. Mol. Sci. 2025, 26. [Google Scholar] [CrossRef]
- Kudryashova, E. V.; Pokrovskaya, M. V.; Alexandrova, S.S.; Vinogradov, A.A.; Sokolov, N.N. FTIR-Based L-Asparaginase Activity Assay Enables Continuous Measurements in Optically Dense Media Including Blood Plasma. Anal. Biochem. 2020, 598, 113694. [Google Scholar] [CrossRef]
- Zlotnikov, I.D.; Shishparyonok, A.N.; Pokrovskaya, M. V.; Alexandrova, S.S.; Zhdanov, D.D.; Kudryashova, E. V Structural Features Underlying the Mismatch Between Catalytic and Cytostatic Properties in L-Asparaginase from Rhodospirillum Rubrum. Catalysts 2025, 15, 476. [Google Scholar] [CrossRef]
- Zlotnikov, I.D.; Ezhov, A.A.; Kudryashova, E. V. Receptor-Mediated Internalization of L-Asparaginase into Tumor Cells Is Suppressed by Polyamines. Int. J. Mol. Sci. 2025, 26. [Google Scholar] [CrossRef]
Figure 1.
Proposed catalytic mechanism of L-arginine hydrolysis by arginase. The reaction occurs at the active site featuring a binuclear manganese cluster (Mn2+A and Mn2+B) and involves key conserved residues (Asp-128, His-141, and Glu-277). The mechanism proceeds via the nucleophilic attack of a metal-bridging hydroxide ion on the guanidinium group of L-arginine, leading to the formation of a tetrahedral intermediate, followed by the subsequent release of L-ornithine and urea. Adapted from [4].
Figure 1.
Proposed catalytic mechanism of L-arginine hydrolysis by arginase. The reaction occurs at the active site featuring a binuclear manganese cluster (Mn2+A and Mn2+B) and involves key conserved residues (Asp-128, His-141, and Glu-277). The mechanism proceeds via the nucleophilic attack of a metal-bridging hydroxide ion on the guanidinium group of L-arginine, leading to the formation of a tetrahedral intermediate, followed by the subsequent release of L-ornithine and urea. Adapted from [4].
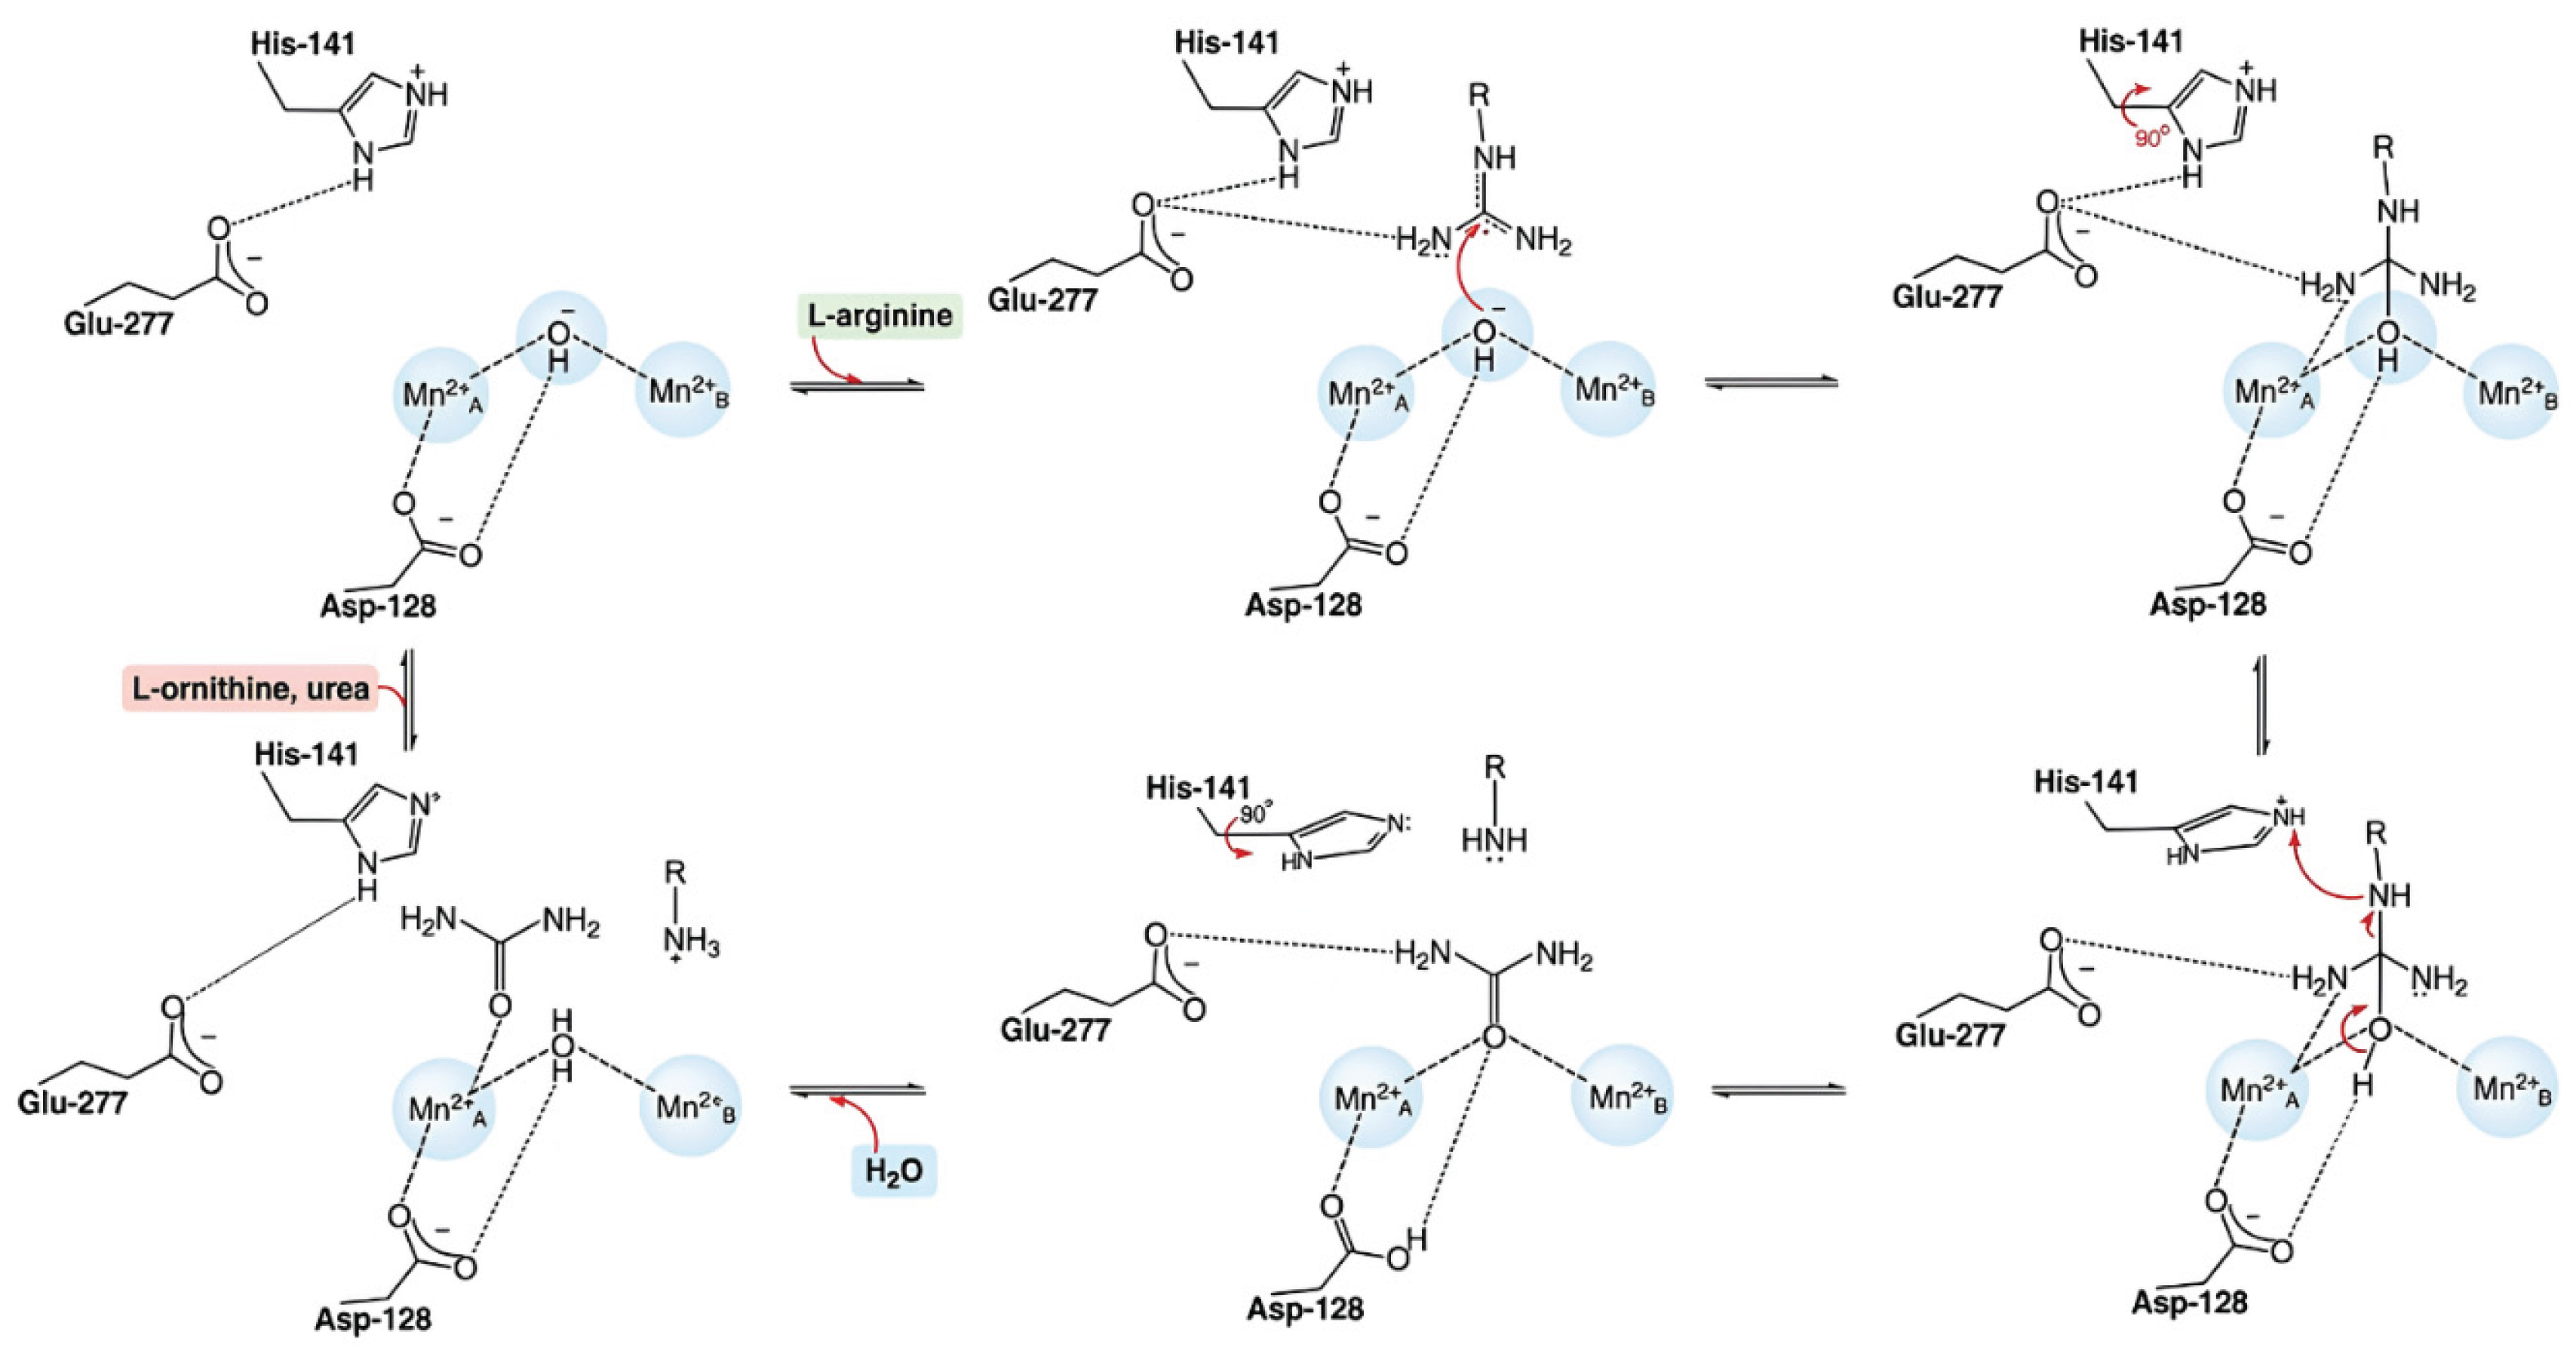
Figure 2.
Spectroscopic characterization of the substrate and the product. (a) Circular dichroism (CD) and (b) UV absorption spectra of 10 mM L-arginine (black line) and 10 mM L-ornithine (red line) in aqueous solutions.
Figure 2.
Spectroscopic characterization of the substrate and the product. (a) Circular dichroism (CD) and (b) UV absorption spectra of 10 mM L-arginine (black line) and 10 mM L-ornithine (red line) in aqueous solutions.
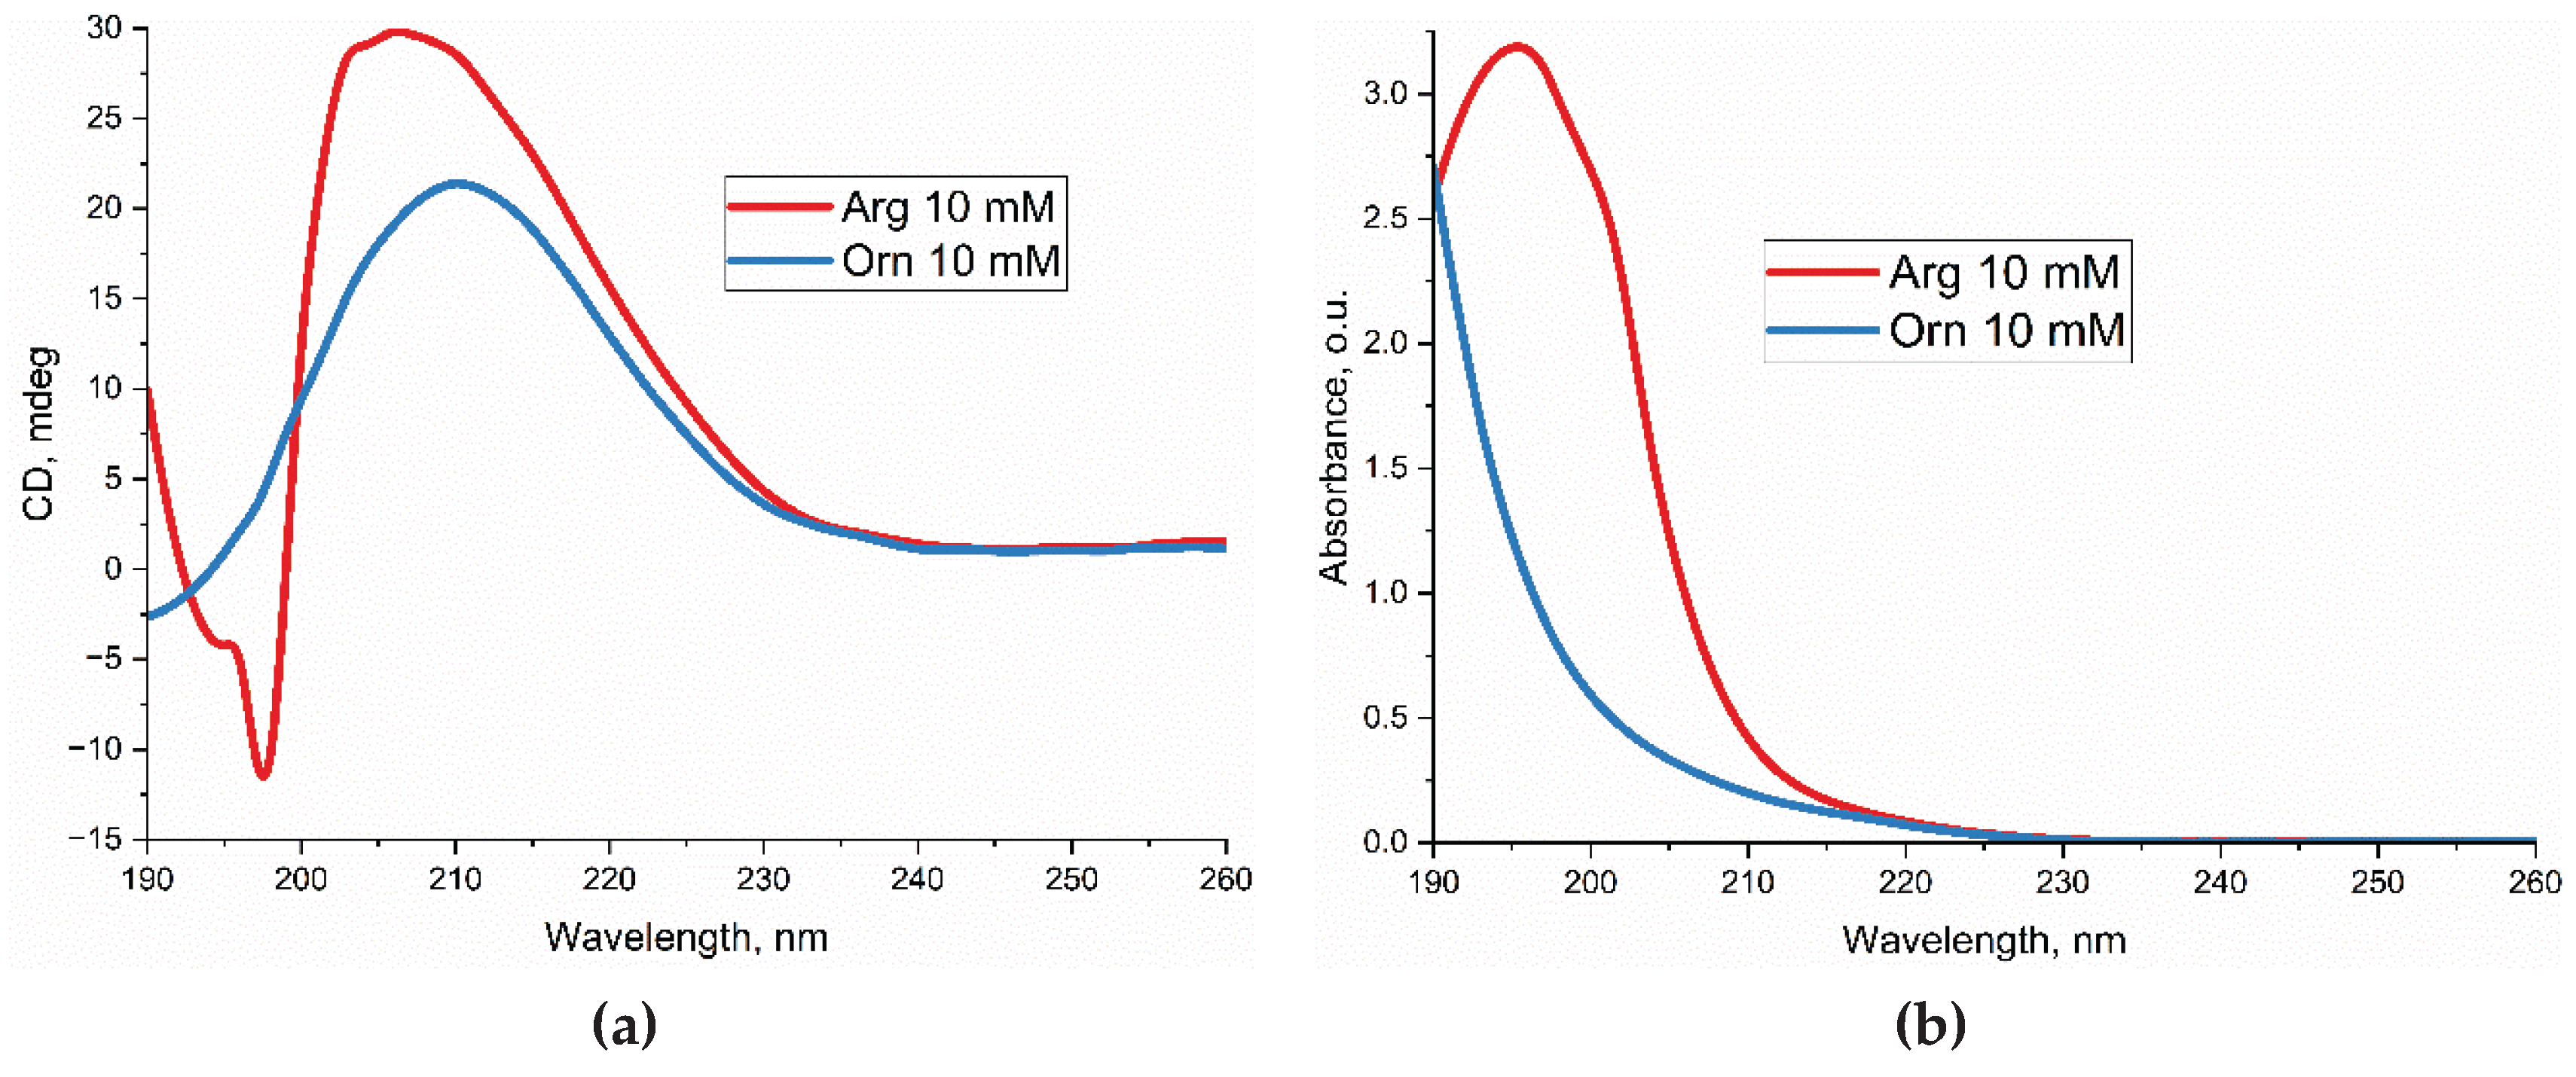
Figure 3.
Real-time monitoring of L-arginine hydrolysis by free and liposomal arginase using CD and UV spectroscopy. Time-dependent CD spectra of 20 mM L-arginine incubated with (a) free arginase and (b) liposomal arginase. Corresponding time-dependent UV absorption spectra for (c) free arginase and (d) liposomal arginase. Spectra were recorded over a 20-min period. (e) Kinetic curves depicting product concentration over time derived from the spectral data for free arginase (black circles) and liposomal arginase (red squares), fitted to a kinetic model.
Figure 3.
Real-time monitoring of L-arginine hydrolysis by free and liposomal arginase using CD and UV spectroscopy. Time-dependent CD spectra of 20 mM L-arginine incubated with (a) free arginase and (b) liposomal arginase. Corresponding time-dependent UV absorption spectra for (c) free arginase and (d) liposomal arginase. Spectra were recorded over a 20-min period. (e) Kinetic curves depicting product concentration over time derived from the spectral data for free arginase (black circles) and liposomal arginase (red squares), fitted to a kinetic model.
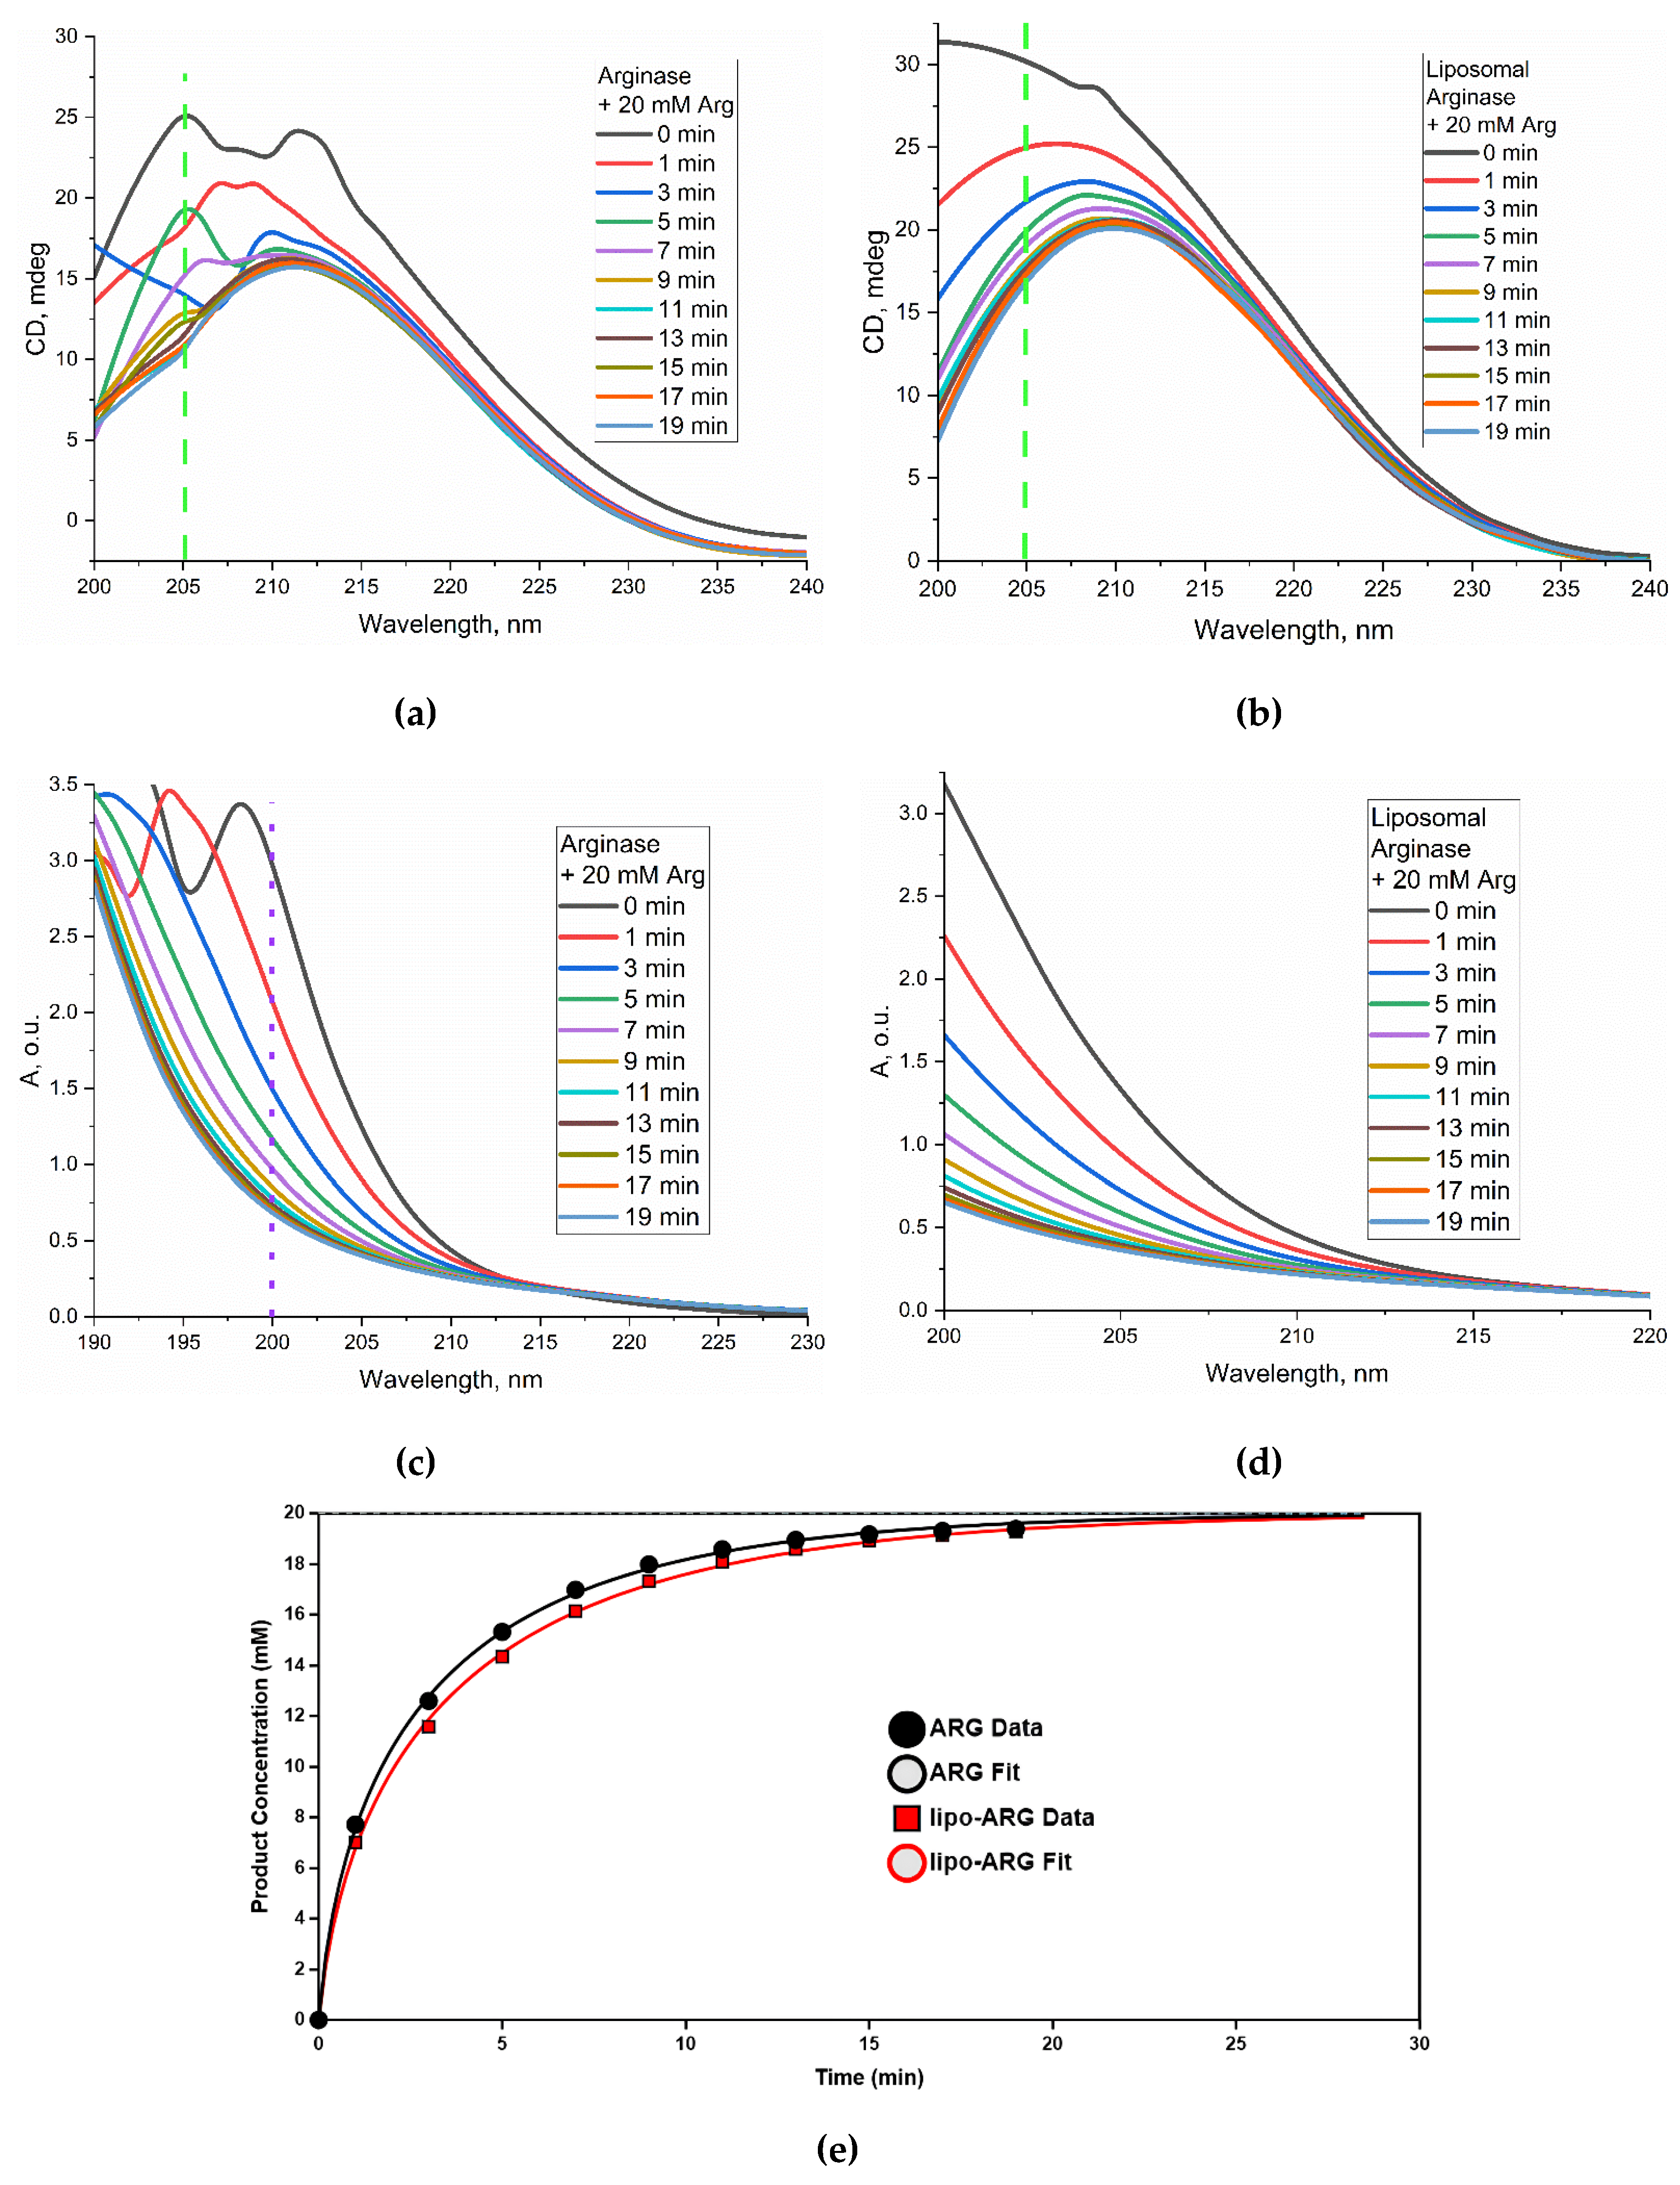
Figure 4.
ATR-FTIR spectroscopic analysis of arginase catalytic kinetics. (a) Reference ATR-FTIR spectra of 30 mM L-arginine (dark grey) and 30 mM L-ornithine (light grey) displaying major vibrational band assignments, accompanied by the chemical structures of the substrate and product to illustrate the cleaved guanidinium moiety. Time-resolved ATR-FTIR spectra tracking the hydrolysis of 20 mM L-arginine catalyzed by (b) 0.5 µg of free arginase and (c) 2 µg of liposomal arginase. Arrows indicate the direction of spectral changes over time: the downward decay of the substrate bands (1630/1675 cm⁻¹) and the upward emergence of the product band (~1605 cm⁻¹). (d) Kinetic curves of product accumulation over time derived from the FTIR spectra for free arginase (black circles) and liposomal arginase (red squares). The differing curve trajectories directly reflect the deliberate application of different enzyme doses (0.5 µg versus 2 µg) in order to test and validate the dynamic range and versatility of the developed spectroscopic method.
Figure 4.
ATR-FTIR spectroscopic analysis of arginase catalytic kinetics. (a) Reference ATR-FTIR spectra of 30 mM L-arginine (dark grey) and 30 mM L-ornithine (light grey) displaying major vibrational band assignments, accompanied by the chemical structures of the substrate and product to illustrate the cleaved guanidinium moiety. Time-resolved ATR-FTIR spectra tracking the hydrolysis of 20 mM L-arginine catalyzed by (b) 0.5 µg of free arginase and (c) 2 µg of liposomal arginase. Arrows indicate the direction of spectral changes over time: the downward decay of the substrate bands (1630/1675 cm⁻¹) and the upward emergence of the product band (~1605 cm⁻¹). (d) Kinetic curves of product accumulation over time derived from the FTIR spectra for free arginase (black circles) and liposomal arginase (red squares). The differing curve trajectories directly reflect the deliberate application of different enzyme doses (0.5 µg versus 2 µg) in order to test and validate the dynamic range and versatility of the developed spectroscopic method.
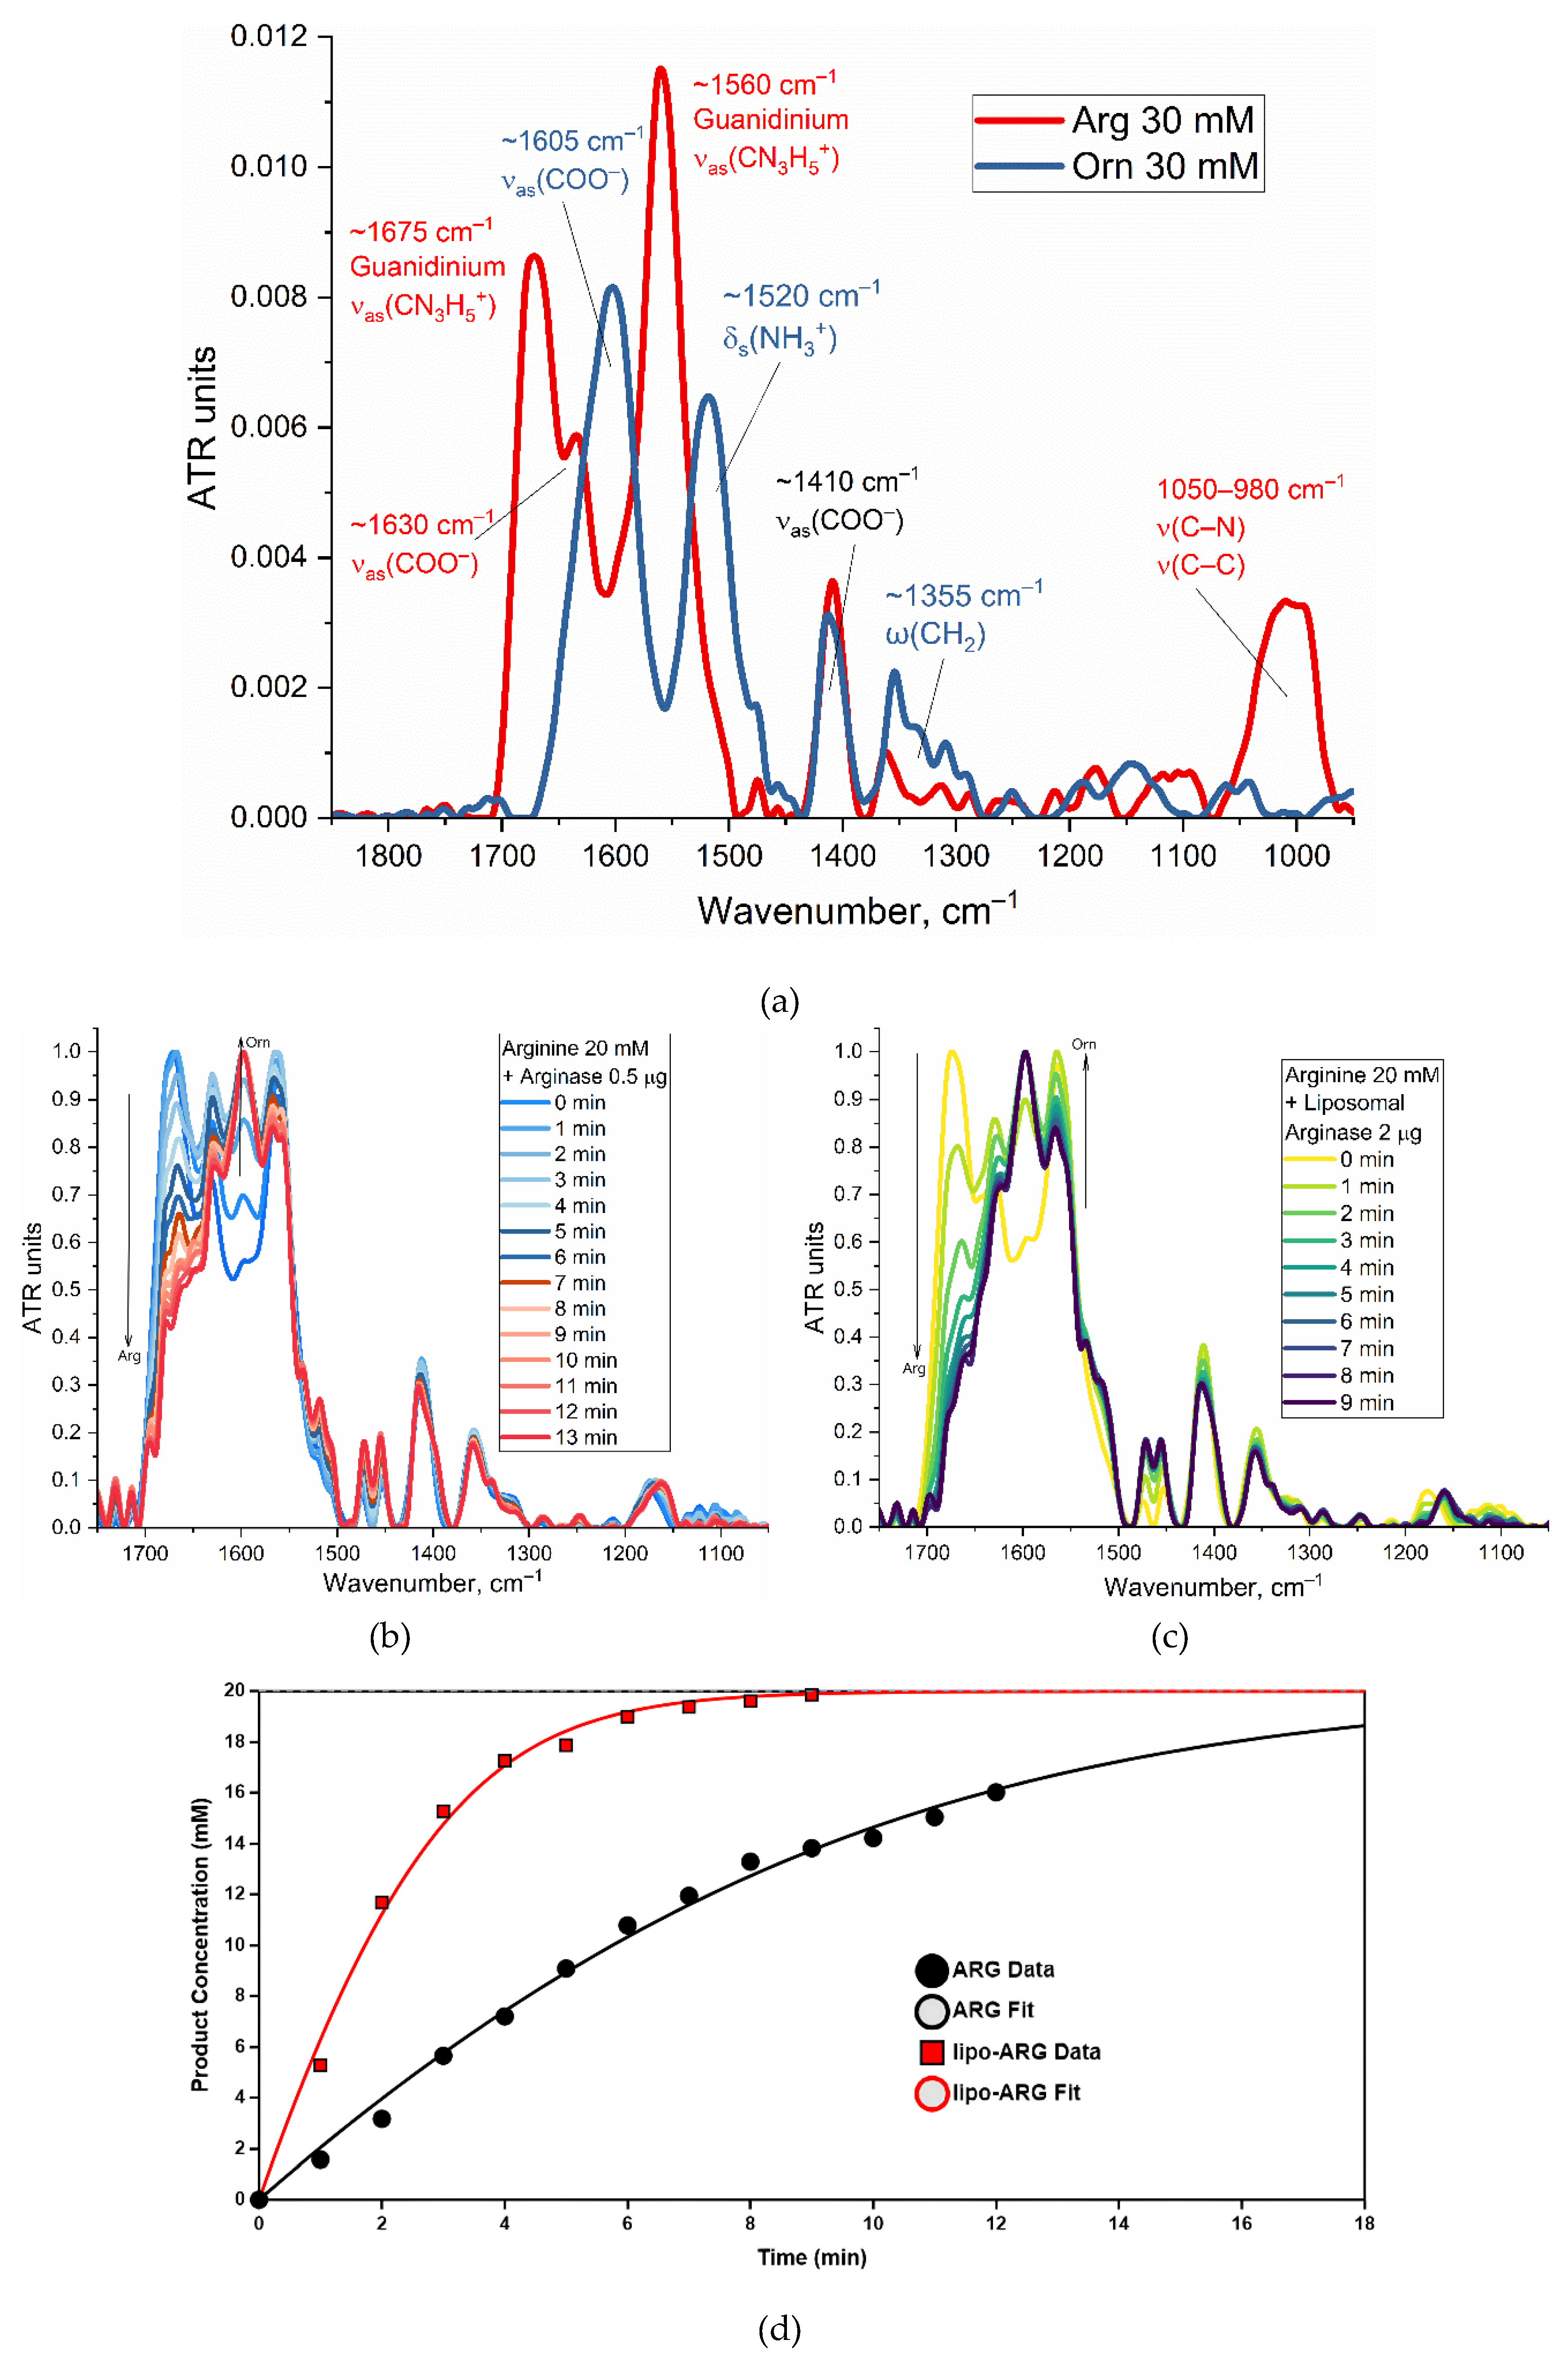
Figure 5.
Thermal stability and thermodynamic analysis of free and liposomal arginase. Temperature-dependent CD spectra (20–80 °C) of (a) free arginase and (b) liposomal arginase (2 mg/mL). (c) Fraction of unfolded protein (equilibrium constant K) versus temperature for free (ARG) and liposomal (lipo-ARG) arginase. (d) Van’t Hoff plot (R·ln K vs. T⁻¹) used to obtain the enthalpy (ΔH) and entropy (ΔS) of unfolding (Table 8).
Figure 5.
Thermal stability and thermodynamic analysis of free and liposomal arginase. Temperature-dependent CD spectra (20–80 °C) of (a) free arginase and (b) liposomal arginase (2 mg/mL). (c) Fraction of unfolded protein (equilibrium constant K) versus temperature for free (ARG) and liposomal (lipo-ARG) arginase. (d) Van’t Hoff plot (R·ln K vs. T⁻¹) used to obtain the enthalpy (ΔH) and entropy (ΔS) of unfolding (Table 8).
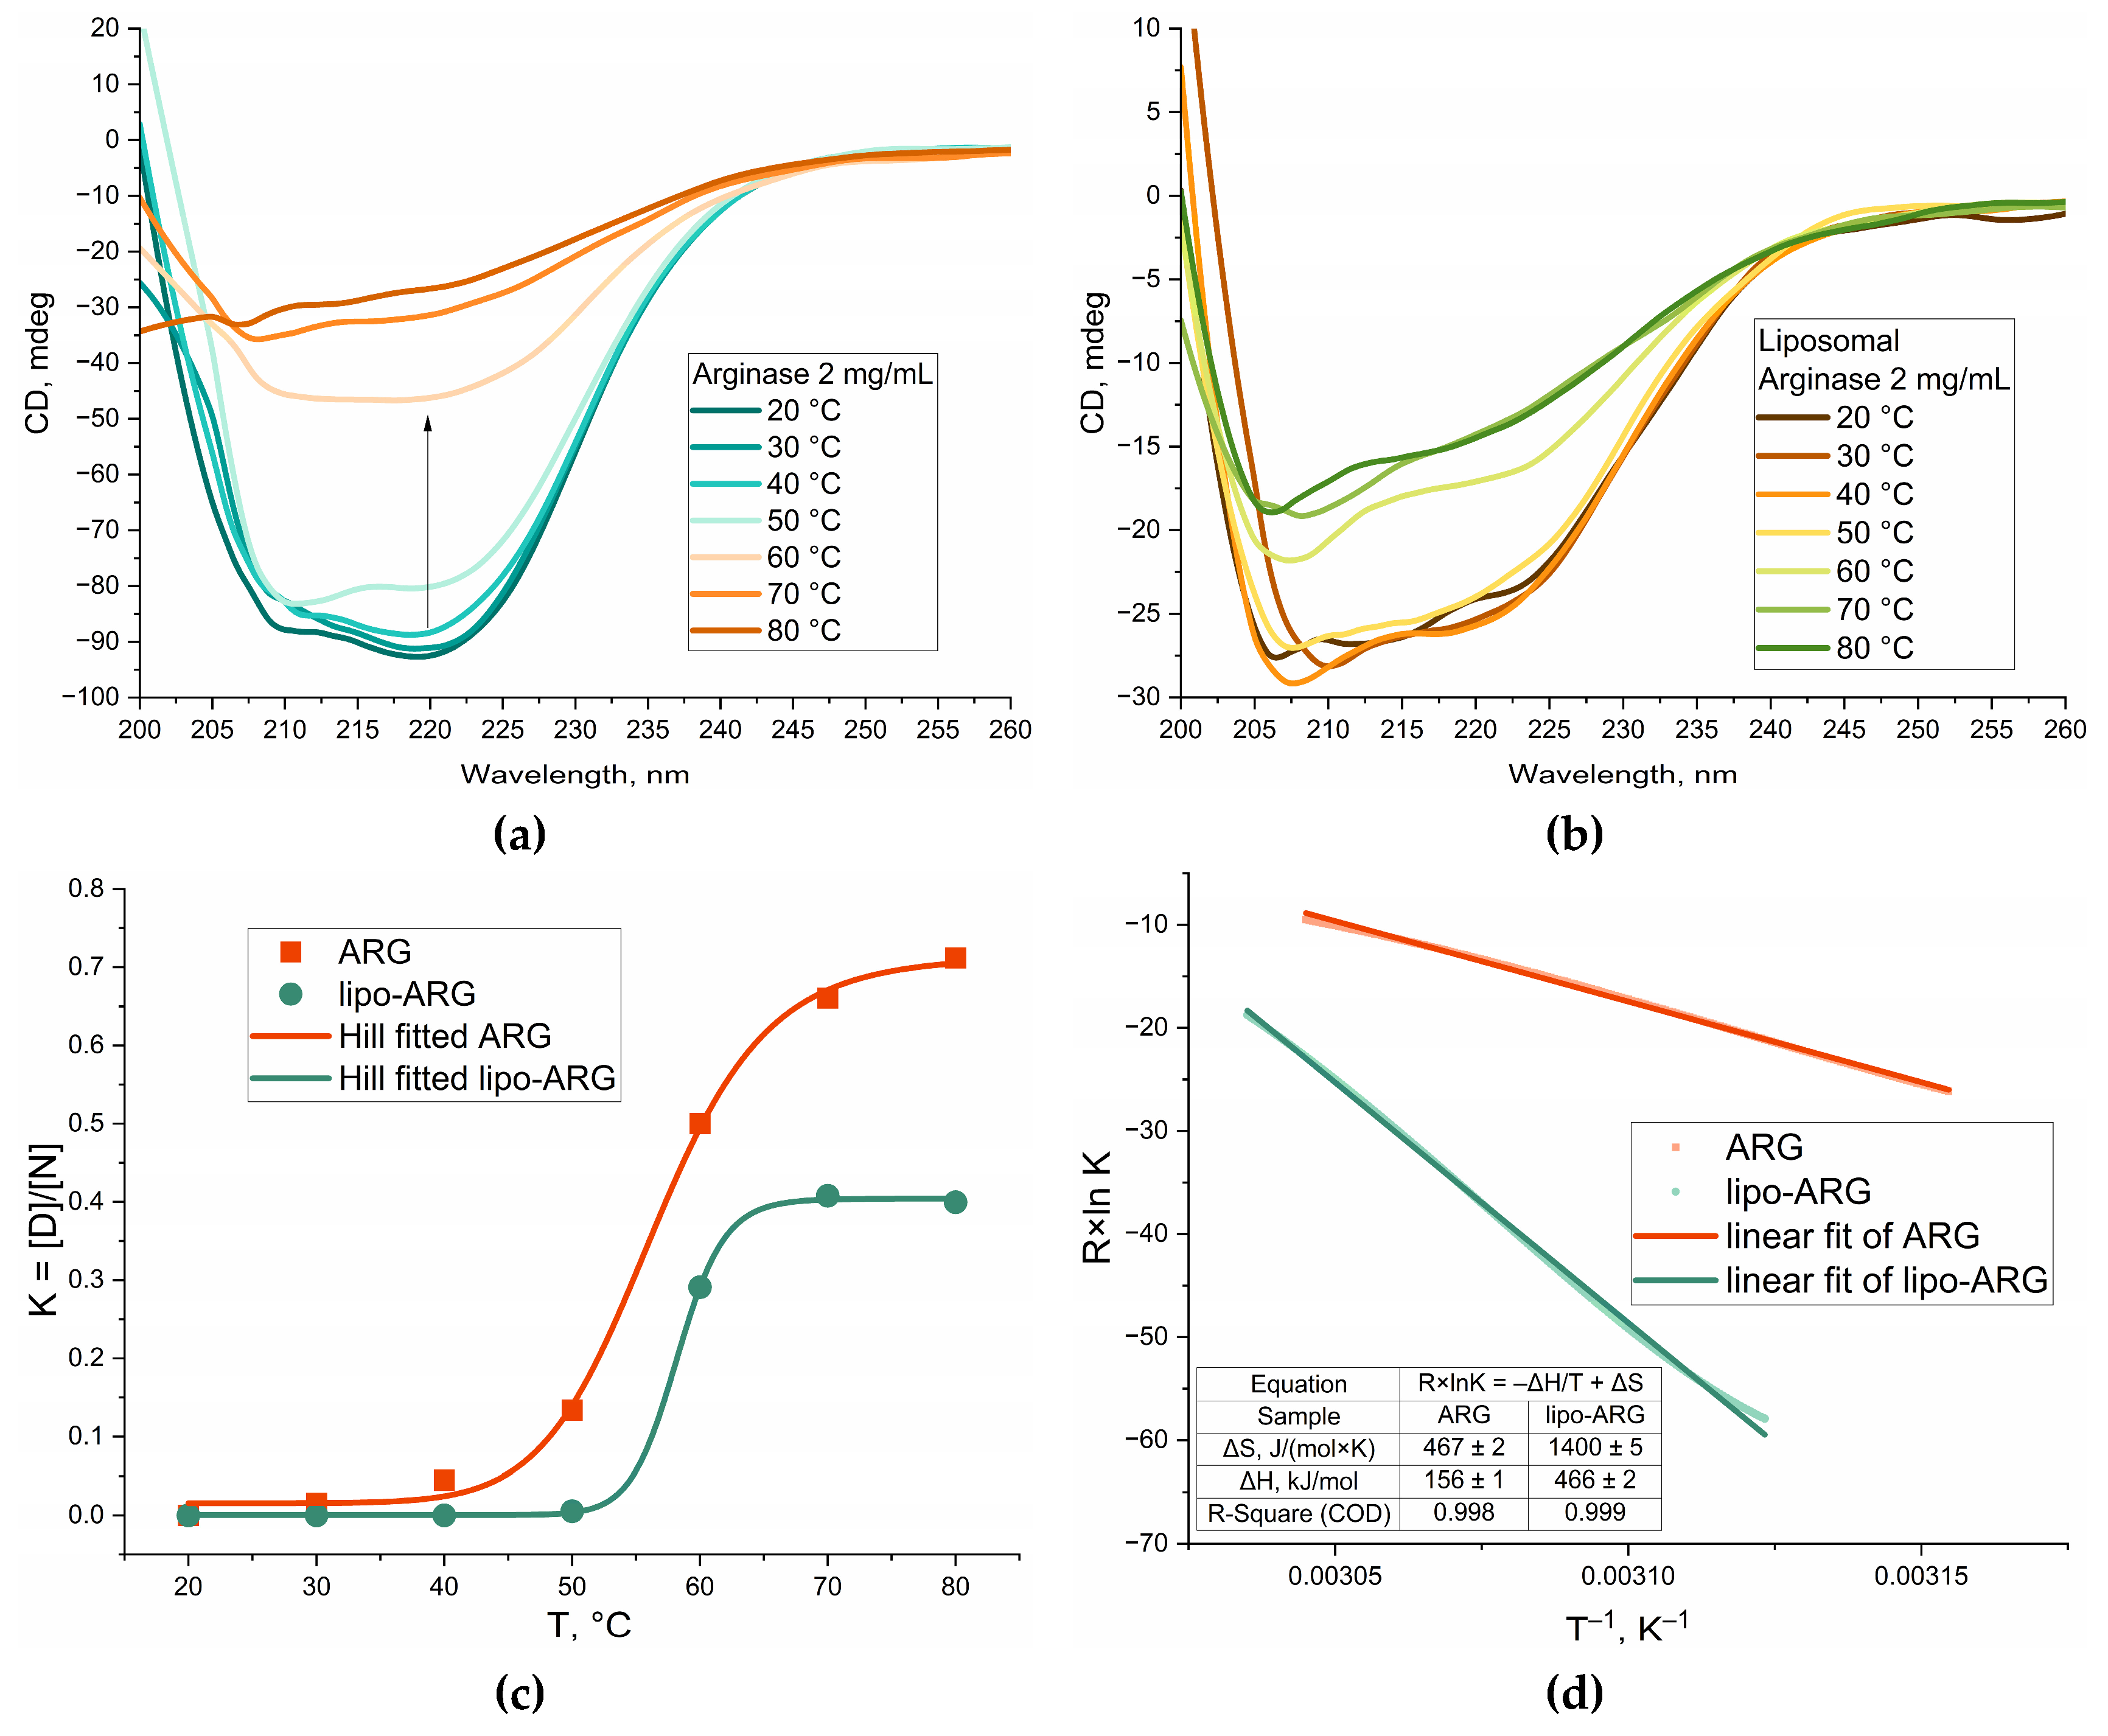
Figure 8.
Kinetics of irreversible thermal inactivation of arginase. (a) Residual activity (A/A₀) versus incubation time for free and liposomal arginase at 55 °C and 70 °C, measured after cooling. (b) Semi-logarithmic plot ln(A/A₀) vs. time; increasing values correspond to decreasing activity) resolving the biphasic inactivation of lipo-ARG. Dashed lines are linear fits to the initial phase (0–15 min) used to extract kin (Table 6).
Figure 8.
Kinetics of irreversible thermal inactivation of arginase. (a) Residual activity (A/A₀) versus incubation time for free and liposomal arginase at 55 °C and 70 °C, measured after cooling. (b) Semi-logarithmic plot ln(A/A₀) vs. time; increasing values correspond to decreasing activity) resolving the biphasic inactivation of lipo-ARG. Dashed lines are linear fits to the initial phase (0–15 min) used to extract kin (Table 6).
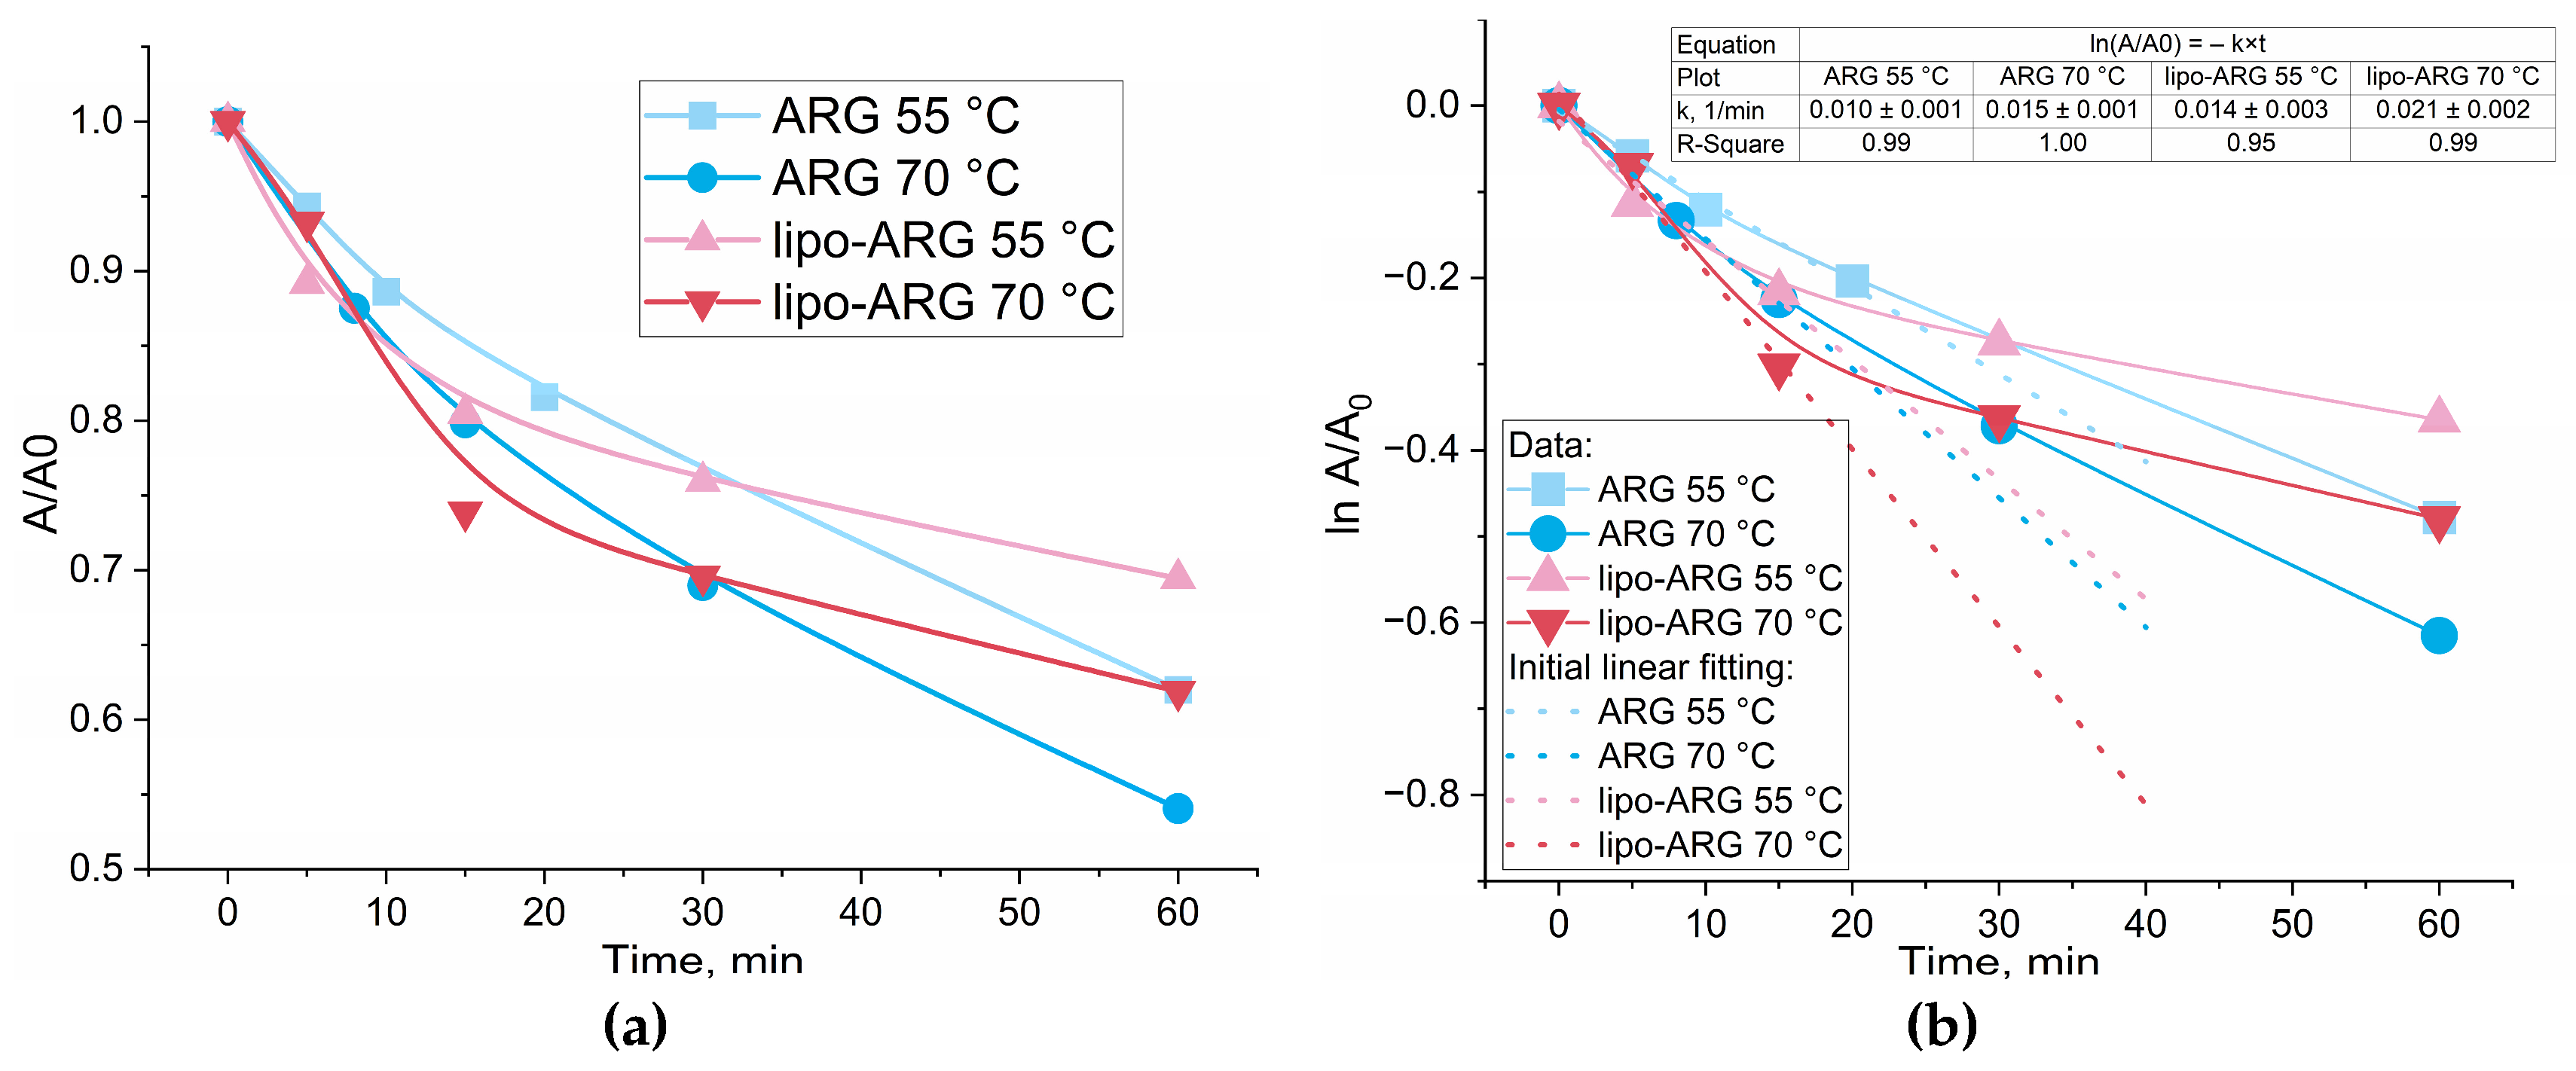
Table 1.
Comparative kinetic parameters of arginase variants at optimal and physiological conditions.
Table 1.
Comparative kinetic parameters of arginase variants at optimal and physiological conditions.
| Enzyme | Origin | pH optimum | Activity at pH 7.4 (% of max)* | KMat pH 7.4 (mM) | kcat at pH 7.4 (s⁻¹) | kcat / KMat pH 7.4 (mM⁻¹s⁻¹) | Delivery profile & therapeutic significance | Ref. |
| Bovine ARG | Bovine liver | 9.4–9.5 | ~10–15% | ~2–3.4 | ~20–30 | ~5–10 | Historical reference model; strong structural stability but high immunogenicity; poor catalytic efficiency at blood pH limits direct clinical use | [3,16] |
| Rat ARG1 | Rat liver | 9.4–9.7 | ~10–15% | ~1.0 | ~25–35 | ~4–10 | Crucial preclinical in vivo model; baseline for macrophage-related immune response studies; native activity at pH 7.4 suppressed | [10] |
| Human ARG1 (native, Mn²⁺) | Human (native) | ~9.0 | ~10–15% | 2.3 ± 0.3 | 300 ± 12 | 129 ± 20 | Gold standard for targeted arginine depletion; severely limited by rapid clearance, proteolysis, and low systemic activity at physiological pH | [5,16] |
| BCT-100 | PEGylated hARG1 (Mn²⁺) | 9.0 | ~10–15% | ~2.0–4.0 | ~25–30 | ~8–15 | PEGylation increases half-life and shields from proteases, but does not solve the fundamental low catalytic efficiency at blood pH | [17] |
| Pegzilarginase (AEB1102) | Co²⁺-substituted PEG-hARG1 | ~7.5 | 100% (by design) | 0.19 ± 0.04 | 240 ± 14 | 1270 ± 330 | Co²⁺-for-Mn²⁺ substitution lowers KM and shifts the pH-dependence, boosting kcat / KM ~10-fold at pH 7.4 relative to the native Mn²⁺ enzyme | [18] |
|
LipoARG (this study) |
Liposomal formulation | 9.0–9.5 | Locally enhanced | ~2–3 | Preserved core activity | Modulated by bilayer kinetics | Lipid bilayer protects the enzyme corona and alters substrate diffusion; enables cellular uptake and localized action within the tumor microenvironment | this work |
*Estimated percentage of residual catalytic activity at physiological pH (7.4) relative to the enzyme’s absolute maximum activity at its alkaline pH optimum (~9.5), except for the Human ARG1 and Pegzilarginase rows, where kcat / KM values are direct literature measurements at pH 7.4 [18].
Table 2.
Physicochemical characteristics of the liposomal arginase (lipo-ARG) formulation.
| Parameter | Value |
| Lipid composition (mol%) | PC : CL (80:20) |
| Final lipid-to-protein mass ratio (w/w) | 3:1 |
| Final lipid-to-protein molar ratio | ~345:1 (per arginase trimer) |
| Z-average hydrodynamic diameter (nm) | 165 ± 12 |
| Polydispersity index (PDI) | 0.14 ± 0.02 |
| Zeta potential (mV) | −35 ± 4 |
| Enzyme capsulation efficiency (%) | 43 ± 5 |
Table 3.
Kinetic parameters of arginase activity obtained by CD spectroscopy. Data are presented as mean ± SD. The kinetic parameters were calculated using non-linear least-squares fitting of the full product accumulation curves to the differential rate equation incorporating competitive product inhibition. The initial substrate concentration was [S]0 = 20 mM, and the enzyme concentration was [E]0 = 0.02 mg/mL. The catalytic constant was calculated assuming a monomer molecular weight of ~35 kDa for arginase.
Table 3.
Kinetic parameters of arginase activity obtained by CD spectroscopy. Data are presented as mean ± SD. The kinetic parameters were calculated using non-linear least-squares fitting of the full product accumulation curves to the differential rate equation incorporating competitive product inhibition. The initial substrate concentration was [S]0 = 20 mM, and the enzyme concentration was [E]0 = 0.02 mg/mL. The catalytic constant was calculated assuming a monomer molecular weight of ~35 kDa for arginase.
| Parameter | Native arginase | Liposomal arginase |
| Vmax, mM/min | 9.45 ± 0.42 | 8.57 ± 0.38 |
| KM, mM | 3.60 ± 0.25 | 3.65 ± 0.27 |
| Ki, mM | 3.55 ± 0.30 | 5.20 ± 0.45 |
| kcat, s–1 | 276 ± 12 | 250 ± 11 |
| kcat /KM, s–1×M–1 | (7.6 ± 0.6) × 10⁴ | (6.8 ± 0.5) × 10⁴ |
Table 4.
FTIR band assignment of L-arginine (substrate) and L-ornithine (product), 850–1750 cm⁻¹.
| Wavenumber, cm⁻¹ | Vibrational mode | L-Arginine | L-Ornithine | Diagnostic use in kinetic monitoring |
| ~1675 | νas CN₃H₅⁺ (guanidinium, high-frequency component) | Strong | Absent | Substrate-specific; decay tracks arginine consumption |
| ~1630 | νas CN₃H₅⁺ (guanidinium, low-frequency component); overlapping νas COO⁻ (Arg) | Strong (doublet component + carboxylate overlap) | Absent (guanidinium); weak (carboxylate only) | Substrate-specific; the 1630/1675 cm⁻¹ doublet is the primary kinetic marker for L-Arg |
| ~1605 | νas COO⁻ (carboxylate) | Weak/overlapping | Strong | Product-specific; rises as ornithine accumulates |
| ~1520 | δs NH₃⁺ (ammonium bending) | Absent | Strong | Product-specific; confirms the α-amino/δ-amino ammonium environment unique to ornithine |
| ~1410 | νs COO⁻ (carboxylate, symmetric) | Weak | Strong | Product-specific; complements the 1605 cm⁻¹ band for ornithine quantification |
| ~1355 | ω CH₂ (methylene wagging) | Weak | Strong | Product-specific; reports on the shorter, more flexible ornithine side chain |
| 1050–980 | ν C–N / C–C (aliphatic backbone/side-chain stretch) | Present (unique envelope) | negligible | Substrate-specific secondary marker, confirms the guanidinium-doublet assignment |
Table 8.
Summary of thermodynamic and kinetic parameters of thermal unfolding and inactivation for free and liposomal arginase.
Table 8.
Summary of thermodynamic and kinetic parameters of thermal unfolding and inactivation for free and liposomal arginase.
| Parameter | Free ARG | lipo-ARG |
| ΔH, unfolding (kJ/mol) | 156 | 466 |
| ΔS, unfolding (J/(mol·K)) | 467 | 1400 |
| K, unfolding at 80 °C | 0.7 | 0.4 |
| k_in, 55 °C, initial phase (min⁻¹) | 0.010 ± 0.001 | 0.014 ± 0.003 |
| k_in, 70 °C, initial phase (min⁻¹) | 0.015 ± 0.001 | 0.021 ± 0.002 |
| Eₐ, inactivation, initial phase (kJ/mol) | 25 | 25 |
| Residual activity, 55 °C / 60 min (%) | 62 | 70 |
| Residual activity, 70 °C / 60 min (%) | 54 | 62 |
Table 7.
Limits of detection (LOD) and quantification (LOQ) of arginase activity under substrate-saturating conditions.
Table 7.
Limits of detection (LOD) and quantification (LOQ) of arginase activity under substrate-saturating conditions.
| Figure of merit | CD spectroscopy | Absorbance (200 nm) | FTIR spectroscopy |
| LOD, U/mL | 0.31 ± 0.02 | 0.026 ± 0.001 | 0.47 ± 0.05 |
| LOQ, U/mL | 1.05 ± 0.07 | 0.085 ± 0.003 | 1.57 ± 0.17 |
Table 8.
Comparative overview of methods for determining arginase activity.
| Method (class) | Detection principle | Reagents / conditions | Stopping step | Typical analysis time per data point | Sensitivity / detection range | Real-time | Applicability in optically dense media | Key limitation |
| Sakaguchi (residual arginine) [19] | Guanidinium + hypobromite/1-naphthol → colored adduct, Abs ~500 nm | NaOBr, 1-naphthol/8-hydroxyquinoline | Yes | ~10–30 min color development | Qualitative to semi-quantitative; slow, variable color yield | No | Poor | Classical reaction is inherently non-quantitative; guanidinium groups partly destroyed by the oxidant |
| p-Nitrophenylglyoxal (residual arginine) [20] | Arginine + p-nitrophenylglyoxal/ascorbate → chromophore, Abs 475 nm | p-Nitrophenylglyoxal, Na-ascorbate | Yes | ~30 min at pH 9.0, 30 °C | Linear 0.03–0.33 mM arginine | No | Poor | Endpoint-only; narrow linear range; alkaline incubation step |
| Ninhydrin/Chinard (L-ornithine) [23,24] | Ornithine + ninhydrin → chromophore, Abs ~515 nm | Ninhydrin reagent, heating step | Yes | ~15–60 min per plate/tube | Detection limit ~0.02 µmol urea equivalent (microplate variant) | No | Poor | Endpoint assay; multiple tubes/wells needed to reconstruct a rate; ninhydrin also reacts with free amines/contaminating amino acids |
| Diacetyl monoxime (product, urea) [21,22] | Urea + diacetyl monoxime (strong acid, heat) → diazine chromophore, Abs ~540 nm | Diacetyl monoxime, strong acid, heat | Yes | ~20–30 min heating step | Sub-mM urea, method-dependent | No | Poor | Requires strong acid/heat; interference from ammonia and other reactive nitrogen species |
| Ozer coupled-enzyme assay (product, urea→NH₄⁺) [25] | Arginase → urease → glutamate dehydrogenase; NAD(P)H oxidation followed at 340 nm | Urease, glutamate dehydrogenase, NAD(P)H, 2-oxoglutarate | No (continuous spectrophotometric) | Continuous monitoring, ~5–10 min per run | Linear 0.06–0.30 U/0.5 mL | Yes | Poor | Requires two auxiliary enzymes and a cofactor; cross-reactivity/inhibition by sample matrix components affecting urease or GDH |
| Potentiometric/ISE and pH-stat (product, NH₄⁺/H⁺) [26] | Urease-generated NH₄⁺ detected by ion-selective electrode, or H⁺ release followed by pH-stat titration | Urease (biosensor), titrant | No | Continuous, ~5–15 min per run | Sub-mM to mM range, electrode-dependent | Yes | Moderate (electrode largely insensitive to turbidity) | Electrode drift/fouling; indirect (reports urease/proton chemistry, not arginine/ornithine directly) |
| Far-UV CD, this work (native substrate/product, 205 nm) | Direct ellipticity of L-Arg vs L-Orn | None (label-free) | No | Continuous, single run (~5–30 min total) | LOD 0.31 ± 0.02 U/mL; LOQ 1.05 ± 0.07 U/mL | Yes | Poor–moderate (requires optically clear, low-scattering sample) | Lower sensitivity than absorbance; CD signal of the enzyme itself can superimpose on substrate/product bands |
| Far-UV absorbance, this work (native substrate/product, 200 nm) | Direct UV absorbance of L-Arg vs L-Orn | None (label-free) | No | Continuous, single run | LOD 0.026 ± 0.001 U/mL; LOQ 0.085 ± 0.003 U/mL | Yes | Poor | Requires optically clear sample; not usable directly on liposomal suspensions |
| ATR-FTIR, this work (native substrate/product, 1630–1675 cm⁻¹ guanidinium band) | Direct mid-IR absorbance of the arginine guanidinium doublet vs the ornithine carboxylate/ammonium envelope | None (label-free) | No | Continuous, single run (~5–30 min total) | LOD 0.47 ± 0.05 U/mL; LOQ 1.57 ± 0.17 U/mL | Yes | Good | Lower sensitivity than absorbance |
Disclaimer/Publisher’s Note: The statements, opinions and data contained in all publications are solely those of the individual author(s) and contributor(s) and not of MDPI and/or the editor(s). MDPI and/or the editor(s) disclaim responsibility for any injury to people or property resulting from any ideas, methods, instructions or products referred to in the content. |
© 2026 by the authors. Licensee MDPI, Basel, Switzerland. This article is an open access article distributed under the terms and conditions of the Creative Commons Attribution (CC BY) license (http://creativecommons.org/licenses/by/4.0/).
Copyright: This open access article is published under a Creative Commons CC BY 4.0 license, which permit the free download, distribution, and reuse, provided that the author and preprint are cited in any reuse.