

Submitted:
07 September 2026
Posted:
08 September 2026
You are already at the latest version
Abstract
Gearbox noise, vibration, and harshness (NVH) simulation has progressed substantially beyond nominal transmission-error prediction. Contemporary approaches can incorporate manufacturing and assembly tolerances, measured tooth geometry, flexible gear-shaft-bearing-housing interactions, variable-speed operation, acoustic radiation, surrogate modeling, psychoacoustic metrics, and physical-virtual model updating. In parallel, industrial gear production is moving toward near-100% tooth inspection, order-based waviness analysis, process monitoring, virtual end-of-line (EOL) assessment, and manufacturing feedback. Consequently, many capabilities frequently described as future directions already exist individually. This critical review therefore addresses a different question: how strongly are increasingly integrated production-NVH architectures supported by physical evidence? A targeted evidence set of 46 external scientific, doctoral, industrial, and patent sources was classified using a two-dimensional Architecture x Evidence framework. Architectural integration ranges from nominal simulation to unit-specific NVH digital twins and closed-loop manufacturing, whereas evidence maturity ranges independently from conceptual disclosure to component validation, same-unit production validation, population-level validation, and intervention validation. Thirteen of the 46 coded sources reached highly integrated architecture levels A4-A5, yet none reached the E3-E5 range under the adopted criteria. Four traceability requirements are identified for credible production-oriented NVH digital twins: part, physical, spectral, and statistical traceability. Major open problems include propagation of measured joint production distributions, separation of excitation and transfer-path variability, NVH-preserving reduction of high-density tooth metrology, physics-preserving order-map surrogates, quality-control validation of virtual EOL systems, and controlled demonstration that model-selected manufacturing interventions reduce measured acoustic risk. The next generation of gearbox NVH simulation is therefore expected to be defined less by increasing the numerical complexity of an ideal virtual gearbox and more by strengthening the evidence connecting virtual predictions with real manufactured units and production populations.
Keywords:
gearbox NVH
; manufacturing variability
; digital twin
; virtual EOL
; measured gear geometry
; production variability
; order analysis
; uncertainty quantification
; surrogate modeling
; gear whine
1. Introduction
Electrified drivetrains have fundamentally changed the acoustic environment of road vehicles. Reduced combustion-engine masking, high rotational speeds, and increasing structural integration make comparatively low-amplitude periodic excitation from gears, bearings, electric machines, and power electronics more perceptually relevant. At the same time, gearbox simulation has progressed from nominal transmission-error calculations toward measured-geometry contact models, flexible multibody dynamics, vibroacoustics, and perceptual prediction. [1,2,3,8,9]
Manufacturing and assembly variability are now explicitly represented through deterministic deviations, uncertainty propagation, robust design, and surrogate modeling, while virtual-EOL strategies have emerged for electric-drive applications. [4,5,6,7]
Production-oriented evidence extends further downstream: EOL response has been related to vehicle-level sound quality, gearbox digital-twin models can be updated using physical data, and industrial architectures already combine production metrology, model-based prediction, and feedback. [10,11,12,13,14,15,16]
G -> TE -> F_mesh -> F_bearing -> v_housing -> p_acoustic
In this source-to-response chain, G denotes the relevant gear geometry, TE the transmission error, F_mesh the dynamic gear-mesh excitation, F_bearing the force transmitted through the bearing interfaces, v_housing the structural response, and p_acoustic the resulting acoustic field.
X_real = X_nom + ΔX_manufacturing + ΔX_assembly
Y_NVH,i = f(X_real,i, q_i)
Nominally identical drive units can therefore exhibit different transmission-error spectra, bearing forces, resonance amplitudes, housing vibration, radiated sound, and perceived tonal quality. The relevant research question has consequently changed. It is no longer simply whether manufacturing variability can be represented or whether a virtual EOL model can be constructed; it is whether increasingly integrated production-NVH architectures are supported by evidence showing that they reproduce, explain, and ultimately improve the behavior of real manufactured units and production populations.
1.1. Relationship to Existing Reviews
Recent reviews have already examined manufacturing and mounting uncertainties, micro- and macrogeometry, optimization, and robustness in spur and helical gear NVH. The present work therefore does not repeat a general survey of tolerance effects. Instead, it shifts the unit of analysis from deviation-to-response toward manufactured-unit-to-digital-representation-to-validation-evidence, and expands the scope to production metrology, virtual EOL, unit traceability, digital-twin updating, patent activity, manufacturing feedback, population validation, and order-domain traceability. [17]
deviation -> gear response
manufactured unit -> digital representation -> validation evidence
1.2. Objectives and Research Questions
- RQ1. Which manufacturing-aware gearbox NVH capabilities have been conceptually proposed, numerically demonstrated, experimentally validated, and validated on physical production populations?
- RQ2. How does architectural integration maturity compare with the maturity of the corresponding experimental evidence?
- RQ3. Which validation stages remain weak between manufacturing-state information and unit-specific EOL prediction?
- RQ4. Can a common order-domain representation provide traceability between manufacturing processes, tooth-surface geometry, simulated excitation, and measured EOL response?
- RQ5. What evidence is required before a virtual EOL model can credibly replace or reduce physical EOL testing?
- RQ6. Which research directions are required to progress from integrated digital-twin architecture toward evidence-validated production NVH twins?
2. Review Methodology
2.1. Review Approach
This work is structured as a targeted critical review and research perspective rather than a formal systematic review or meta-analysis. The objective is not publication-frequency estimation. Representative evidence was selected to identify capabilities that are already demonstrated, claims that remain insufficiently supported, and combinations of capabilities that appear substantially less mature than their individual components. Recent literature from approximately 2021-2026 received particular attention, while earlier sources were retained when they demonstrated capabilities that might otherwise incorrectly be presented as new.
2.2. Evidence Classes
Four source classes were included: peer-reviewed scientific literature, doctoral dissertations, industrial technical evidence, and patent literature. Peer-reviewed work forms the principal scientific evidential basis. Doctoral dissertations were included where they provided unusually detailed integrated methods or validation. Industrial sources were used to assess implementation maturity such as all-tooth inspection, waviness/order analysis, process monitoring, and manufacturing correction. Patent disclosure was interpreted as architectural evidence, not as proof of predictive accuracy.
2.3. Evidence Taxonomy

Table 1.
Evidence coding taxonomy used for the targeted source set.
| Code | Capability |
| MG | Measured physical geometry |
| TR | Tooth-resolved representation |
| PD | Real production data |
| UT | Unit/part traceability |
| TP | Tolerance population/uncertainty quantification |
| CP | Gear-contact physics/TE |
| SD | System dynamics |
| FS | Flexible structures |
| VS | Variable-speed analysis |
| AC | Acoustic prediction |
| EO | End-of-line relationship |
| PV | Perceptual/psychoacoustic endpoint |
| SU | Surrogate or machine-learning model |
| DT | Digital-twin/model updating |
| MF | Manufacturing feedback |
| EV | Experimental validation |
For the detailed evidence database, each capability can be coded as 0 = absent, 1 = partial or indirect, and 2 = explicitly demonstrated. A separate primary Architecture and Evidence level was assigned to each coded source for the occupancy analysis.
2.4. Architecture Maturity
A0 - Nominal deterministic simulation
X_nom -> Y
Nominal design is evaluated without explicit production variation.
A1 - Variability-aware design
p_assumed(X) -> p(Y)
Manufacturing or assembly deviations are represented statistically.
A2 - As-built simulation
X_measured,i -> Y_i
Measured geometry or physical state of a particular manufactured component is introduced.
A3 - Virtual EOL
X_i -> Y_virtualEOL,i
High-fidelity or surrogate models predict quality-relevant quantities before or instead of selected physical EOL testing.
A4 - Unit-specific NVH digital twin
Manufacturing_i + Geometry_i + Assembly_i + Model_i -> Y_EOL,pred,i
The model becomes explicitly tied to the manufactured unit.
A5 - Closed-loop manufacturing integration
Prediction -> Attribution -> Manufacturing correction
Prediction becomes actionable and feeds back to production.
2.5. Evidence Maturity
E0 - Conceptual evidence. Architecture, patent, workflow, or simulation architecture without direct physical validation of the relevant claim.
E1 - Component validation. A local physical quantity such as contact pattern or TE is experimentally validated.
E2 - System validation. Intermediate or final system quantities such as bearing-interface response, housing vibration, or SPL are compared with measurements.
E3 - Same-unit production validation. The physical unit represented by the model is explicitly the same unit measured downstream.
E4 - Production-population validation. Unit-specific and distributional agreement are evaluated over a manufactured population.
E5 - Intervention validation. A model-selected manufacturing action is implemented and shown experimentally to reduce physical NVH risk.
M = (A, E)
2.6. Interpretation of Empty Cells
The targeted evidence set is not an exhaustive bibliometric census. Accordingly, an empty Architecture x Evidence cell means that no sufficiently explicit example was identified in the reviewed public evidence set. It does not prove that the capability does not exist in proprietary industrial practice.
3. State of the Art: Capabilities That Are Already Established or Emerging
3.1. Manufacturing-Aware Contact Simulation and Robust Design
Manufacturing and assembly deviations are represented using deterministic and probabilistic methods, including global sensitivity analysis, production-aware tolerance optimization, Monte Carlo methods, Latin Hypercube sampling, DoE, ANOVA, and surrogate response surfaces. The evidence therefore shows that uncertainty propagation itself is not the principal unresolved problem. [4,5,6,18,19]
p_assumed(X) ?≈ p_production(X)
The more demanding question is whether the assumed joint distribution is representative of the real manufactured population and whether its propagated NVH distribution matches physical production scatter.
3.2. Measured Geometry and Tooth Individuality
Measured tooth geometry has been introduced into LTCA, three-dimensional contact models, double-flank-derived analytical representations, hypoid-gear simulations, and measured-error transmission-error models. Some approaches average measured profiles, whereas others preserve substantially more tooth-specific or three-dimensional information. [1,2,35,45,46]
Tooth-resolved representation is therefore not a novelty claim by itself. The stronger research problem is production-scaled, NVH-preserving representation of dense geometry. Surrogate work based on generalized topography deviations and controlled tooth-to-tooth microgeometry scattering further demonstrates that the spatial structure of deviations can be deliberately parameterized. [6,20]
3.3. Flexible System Dynamics and Acoustics
Validated elastic multibody and system-level models increasingly include flexible gears, shafts, bearings, housings, variable-speed excitation, and acoustic radiation. Recent work also combines full-system NVH optimization, physics-informed acoustic surrogates, prototype validation, and perceptual assessment. [3,8,21,22,23,32]
The excitation-transfer-radiation chain is therefore no longer a purely conceptual roadmap. The remaining challenge is to repeat this chain for real production units while retaining correspondence between the measured input state and the downstream physical response.
3.4. Virtual EOL
High-fidelity virtual EOL has been demonstrated using transient electric-drive models, large DoE campaigns, high-performance computing, and surrogate models. A separate virtual-EOL framework uses measured topographies of the gears intended for assembly, a full-system elastic multibody model, and a neural-network surrogate to predict acoustic behavior before final assembly. [7,47]
These studies demonstrate that virtual EOL itself is an existing capability. The unresolved issue is the depth of physical same-unit and production-population validation required before virtual predictions can replace or reduce physical quality gates.
3.5. Production Metrology and Order-Domain Manufacturing Control
Industrial production technology has progressed toward all-tooth inspection, advanced waviness/order analysis, ghost-order identification, and closed-loop correction. Patent families additionally describe manufacturing-axis data transformed into predicted EOL orders, rolling-test and manufacturing data expressed in common order coordinates, AI-assisted order attribution, selective NVH-oriented metrology, and production tolerance definition from EOL good/bad populations. [16,26,27,28,29,30,31]
These sources show that empirical manufacturing-to-order traceability is already an industrial reality in selected implementations. The scientific opportunity is to fill the intermediate causal physics between surface deviation, transmission error, transmitted force, and system response.
3.6. Digital-Twin Updating and Data-Driven Adaptation
Gearbox digital-twin research already includes physical-virtual data fusion, parameter updating, domain adaptation, graph-based real-time surrogates, and mechanism-plus-data adaptive residual correction. These capabilities are strongest in fault diagnosis, health monitoring, and structural-response prediction rather than manufacturing-induced production NVH. [12,13,14,33,34]
The gap is therefore an application-integration gap rather than a generic absence of digital-twin model updating.
3.7. Wear and Lifecycle Evolution
Geometry-dependent NVH does not end at the manufacturing state. Recent work explicitly couples three-dimensional tooth-surface geometry with wear and nonlinear dynamics, while inhomogeneous wear models show that spatially non-uniform degradation can alter vibration behavior. [24,25]
G = G(t), NVH = NVH[G(t)]
Lifecycle modeling is an important extension, but the immediate production problem remains the credible prediction of G0 -> NVH0 across real manufactured populations.
4. Results
4.1. Architecture x Evidence Occupancy
The coded evidence set contains 46 external sources. The contextual review in Ref. [17] was used to position the present contribution relative to existing review literature but was intentionally excluded from the occupancy counts.
The largest concentration occurs around A1-A3 and E1-E2, corresponding to manufacturing-aware physical simulation, as-built models, system dynamics, acoustics, and component/system validation. Highly integrated architecture is also visible: 13 of the 46 coded sources were assigned to A4-A5.
N = 46
N(A >= 4) = 13 (28.3%)
N(A >= 4 and E >= 3) = 0
No source in the targeted evidence set simultaneously reached high architectural integration and same-unit production, population, or intervention-level validation according to the adopted definitions. This is the principal quantitative observation of the review.
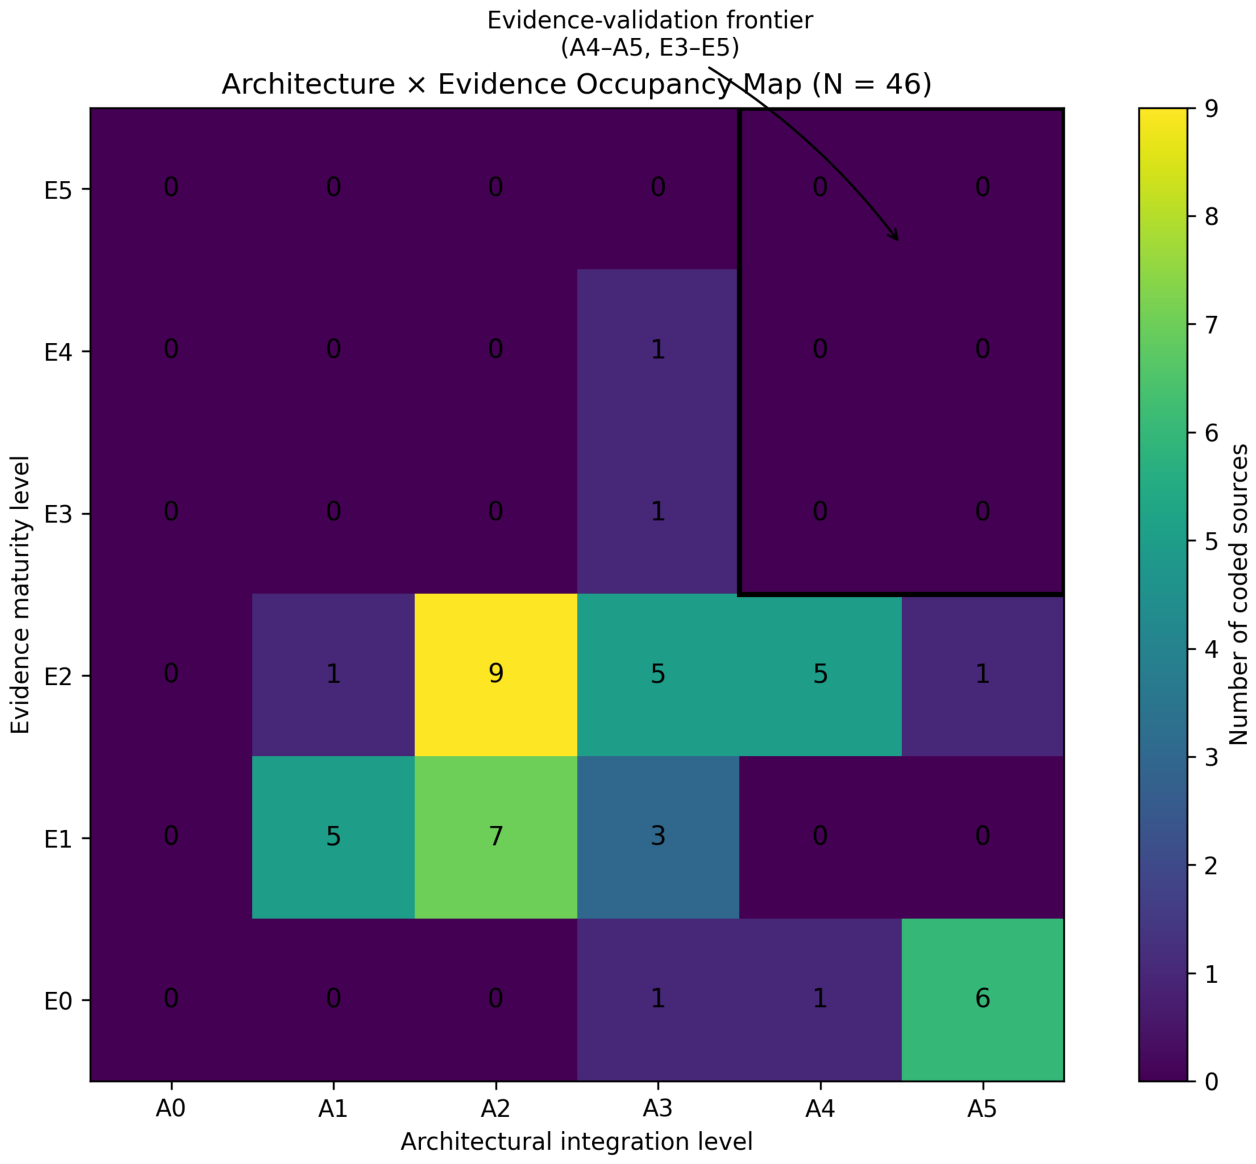
Figure 1.
Architecture x Evidence occupancy map derived from the 46-source targeted evidence set. Architectural integration and validation maturity were coded independently. The outlined A4-A5/E3-E5 region represents the evidence-validation frontier: highly integrated architectures are increasingly represented, whereas same-unit production, population-level, and intervention validation remain sparsely populated in the reviewed public evidence set.
Figure 1.
Architecture x Evidence occupancy map derived from the 46-source targeted evidence set. Architectural integration and validation maturity were coded independently. The outlined A4-A5/E3-E5 region represents the evidence-validation frontier: highly integrated architectures are increasingly represented, whereas same-unit production, population-level, and intervention validation remain sparsely populated in the reviewed public evidence set.
4.2. Architecture-Evidence Asymmetry
The empty upper-right region should not be interpreted as the absence of advanced production digital-twin architectures. On the contrary, recent patents and industrial implementations describe unit-specific data, acoustic digital twins, virtual EOL, pass/fail decisions, order-based process attribution, and manufacturing adjustment. The asymmetry instead indicates that architectural integration is advancing faster than publicly demonstrated production-level validation. [15,16,26,27,28,29,30,31]
Architecture maturity > public evidence maturity (high-integration region)
4.3. Claim-Evidence Gradient
The evidence synthesis also reveals a systematic decline in support as claims move from conceptual/simulation capability toward same-unit validation, population validation, and intervention validation. Manufacturing variability-to-excitation and measured geometry-to-TE are strongly supported, whereas population NVH prediction, unit-specific acoustic twins, virtual replacement of physical EOL, and closed-loop intervention validation have substantially thinner public evidence.
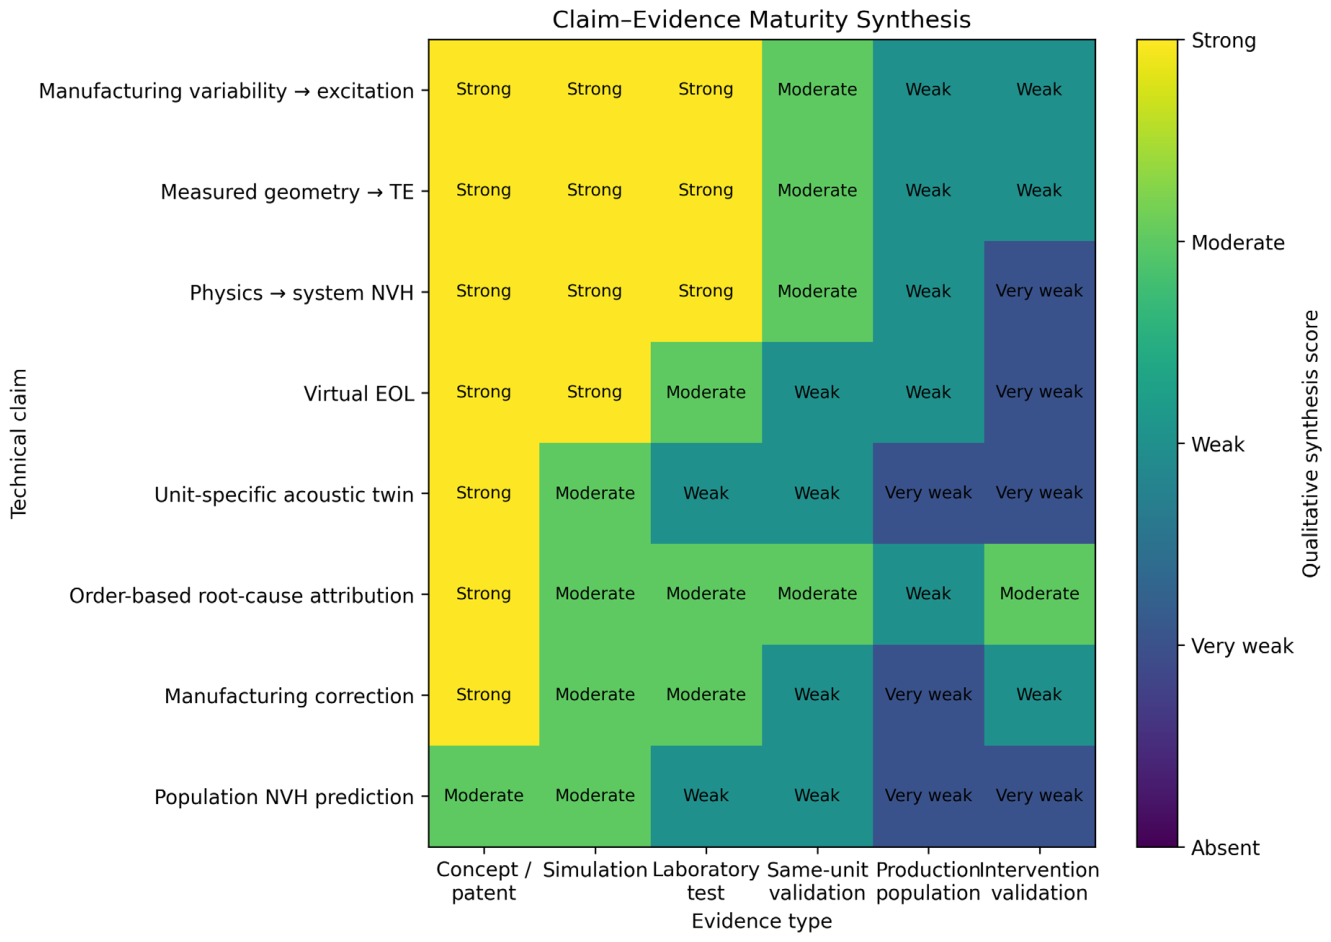
Figure 2.
Claim-Evidence maturity synthesis. Cells qualitatively summarize the strength of evidence identified for each technical claim across successive validation levels, from conceptual or patent disclosure to intervention validation. The figure is an evidence synthesis rather than a bibliometric frequency map.
Figure 2.
Claim-Evidence maturity synthesis. Cells qualitatively summarize the strength of evidence identified for each technical claim across successive validation levels, from conceptual or patent disclosure to intervention validation. The figure is an evidence synthesis rather than a bibliometric frequency map.
4.4. Order-Domain Traceability
Manufacturing, metrology, rolling-test, and EOL data can already share common order-domain information in industrial practice. However, empirical order correspondence does not by itself establish the causal physical sequence from measured surface deviation through transmission error and transmitted forces to structural and acoustic response. [16,26,27,28,29,30,31]
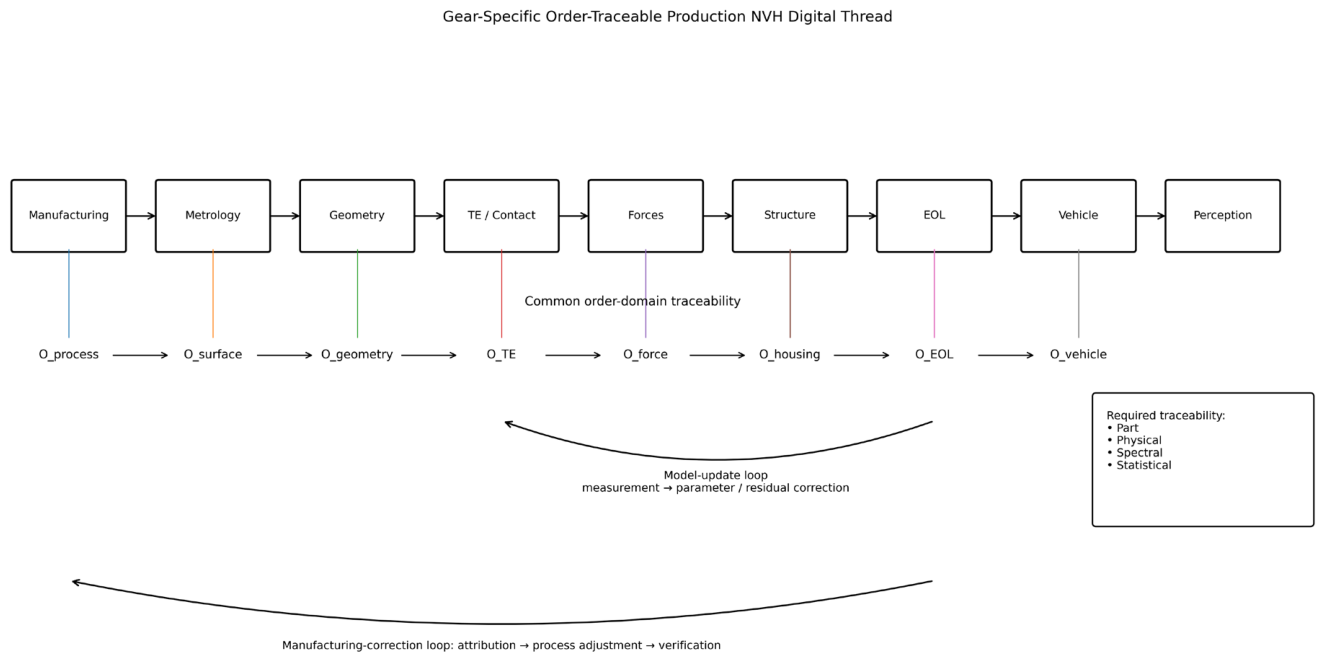
O_process -> O_surface -> O_TE -> O_force -> O_housing -> O_EOL
Figure 3 proposes a gear-specific production digital thread in which physical and spectral traceability coexist, while model-updating and manufacturing-correction loops remain distinct.
4.5. Evidence from High-Speed, Perceptual, and Production Datasets
Additional evidence confirms that several adjacent capabilities are already mature enough that they should not be framed generically as future work. Excitation-oriented tolerancing has been addressed in dedicated doctoral research; stepped planetary stages have been optimized under manufacturing and assembly deviations with test-rig validation; high-speed electromechanical gearbox dynamics have been investigated experimentally; optimized gear NVH has been validated beyond measurement uncertainty; and real industrial EV-reducer datasets now provide multi-machine, multi-batch manufacturing-quality information. [36,37,38,39,40,41,42,43,44]
These results further reinforce the central conclusion: the opportunity lies in integrating mature sub-capabilities with deeper production-unit and population evidence, not in presenting those sub-capabilities individually as novel.
5. Discussion
5.1. From Technology Gaps to Evidence Gaps
The review shows that many previously proposed technology gaps have become outdated. Manufacturing-aware contact simulation, measured geometry, tooth-resolved modeling, UQ, flexible drivetrain NVH, acoustic prediction, surrogate modeling, virtual EOL, digital-twin updating, production metrology, and manufacturing feedback are all represented in contemporary research or industrial development.
integrated capability -> validated capability
The more defensible frontier is therefore evidence depth rather than the mere existence of additional model components.
5.2. Predictive Credibility and Four Traceability Requirements
C_prediction = f(F_model, F_input, T_part, T_physical, T_spectral, F_statistical, D_validation)
Here, F_model represents numerical fidelity, F_input the fidelity of physical inputs, T_part part traceability, T_physical physical causality, T_spectral order-domain correspondence, F_statistical population fidelity, and D_validation validation depth. A highly detailed numerical model cannot indefinitely compensate for weak production grounding.
Part traceability. All relevant data belong to the same physical unit.
Part_i: Process_i -> Geometry_i -> Assembly_i -> EOL_i
Physical traceability. The intermediate causal mechanism is retained.
Process -> Geometry -> Contact -> Force -> Response
Spectral traceability. Periodic features are followed through a common order-domain representation.
O_process -> O_geometry -> O_TE -> O_force -> O_EOL
Statistical traceability. The virtual population corresponds to the physical population.
p(X_model) ≈ p(X_production), p(Y_model) ≈ p(Y_production)
5.3. Assumed Versus Measured Production Distributions
Many uncertainty studies use statistically independent variables. Real manufacturing can create covariance through common tooling, tool wear, machine drift, thermal history, batch, fixture state, dressing condition, and assembly sequence.
p_production(x1,...,xn) != Π p(xj)
A high-value testable question is whether measured joint production distributions reproduce EOL scatter more accurately than conventional independently sampled drawing tolerances.
5.4. Excitation Versus Transfer-Path Variability
Y_i(ω) = H_i(ω) F_i(ω)
Var(Y) = Var_F + Var_H + Var_interaction + Var_measurement
The F-side contains gear excitation effects such as tooth geometry, pitch, runout, waviness, and contact state. The H-side contains bearing preload and clearance, shaft alignment, housing properties, assembly state, and mounting conditions. Identical EOL symptoms can therefore require fundamentally different corrective actions depending on whether variability originates in excitation or the transfer path.
5.5. NVH-Preserving Geometry Reduction
Δg(θ,u,v) -> z_NVH
dim(z_NVH) << dim(Δg), Y(z_NVH) ≈ Y(Δg)
Production-scale use of complete tooth-surface metrology requires a reduced representation that retains mesh harmonics, tooth-to-tooth modulation, waviness, runout, localized deviations, sidebands, and ghost-order-generating components. This is more demanding than generic dimensionality reduction.
5.6. Physics-Preserving Surrogates
X -> Y(O,n,T)
Scalar metrics such as R2, RMSE, or MAE can hide errors in spectral mechanism. A production NVH surrogate should preserve dominant order, order amplitude, sideband spacing, resonance crossing, and order-dependent scatter.
ΔO_peak, ΔA_O, Δn_res, Δσ_O
These physics-preserving metrics should complement conventional regression accuracy.
5.7. Virtual EOL as a Quality-Control Problem
If virtual EOL is intended to reduce or replace a physical quality-control test, the relevant validation problem is ultimately classification rather than regression alone.
Sensitivity, Specificity, False Reject Rate, False Pass Rate
False pass is particularly critical because it permits an acoustically non-conforming physical unit to be accepted. An impressive R2 for a simulation surrogate is therefore insufficient evidence that a physical EOL quality gate can safely be removed.
5.8. Minimum Validation Protocol
Gate 1 - Geometry/contact. Validate measured geometry, contact pattern, and STE/DTE.
Geometry_i -> TE_i
Gate 2 - Interface force. Validate transmitted force or a suitable interface-response proxy.
TE_i -> F_bearing,i
Gate 3 - Structural response. Validate order amplitudes and resonance crossings.
F_i -> a_housing,i
Gate 4 - EOL response. Compare the same physical units.
a_housing,i -> Y_EOL,i
Gate 5 - Population. Evaluate μ_O, σ_O, P95,O, P(NOK), and relevant covariance.
i = 1,...,N
5.9. Controlled Variability and Acoustic Quality
Targeted tooth-to-tooth microgeometry scattering demonstrates that manufacturing variation can also be deliberately engineered to redistribute spectral energy. Therefore, minimum geometric deviation or minimum peak-to-peak TE does not automatically imply minimum tonality. [20]
min TE_pp != necessarily min Tonality
The distinction between uncontrolled manufacturing variability and designed acoustic variability should be preserved. Future optimization may therefore combine tonality, loudness, variance, manufacturing cost, durability, and efficiency.
5.10. Lifecycle Extension
G_0 -> NVH_0 -> Wear -> G_1 -> NVH_1
6. Priority Research Agenda
Priority 1 - Same-unit digital thread. Process_i -> Geometry_i -> Simulation_i -> EOL_i.
Priority 2 - Population replication. Repeat the same-unit chain for i = 1,...,N.
Priority 3 - Measured production distributions. Compare p_assumed(X) with p_production(X).
Priority 4 - Variance decomposition. Separate Var_F from Var_H and interaction effects.
Priority 5 - NVH-preserving metrology reduction. Convert dense all-tooth data into simulation-ready variables without losing order topology.
Priority 6 - Order-preserving surrogates. Predict complete variable-speed order maps rather than scalar KPIs only.
Priority 7 - Production-quality virtual-EOL validation. Quantify false-pass and false-reject rates.
Priority 8 - Physical order traceability. Validate O_process -> O_surface -> O_TE -> O_force -> O_EOL.
Priority 9 - Intervention validation. Test whether model-selected manufacturing corrections reduce measured NVH.
Priority 10 - Lifecycle and perceptual extension. Extend the validated production framework toward wear and customer-relevant sound quality.
7. Limitations
The quantitative evidence map requires careful interpretation. First, the 46-source set is a targeted critical evidence sample rather than an exhaustive systematic bibliometric database; cell occupancy therefore should not be interpreted as publication prevalence. Second, heterogeneous source types were intentionally included, and patents or industrial technical evidence do not provide the same scientific proof as peer-reviewed experiments. Third, assigning one primary (A,E) coordinate reduces multidimensional studies to their dominant claim. Fourth, proprietary industrial implementations may possess substantially greater validation than is publicly disclosed. The empty high-integration/high-evidence cells should therefore be read as limited publicly identified evidence, not as proven technological absence.
8. Conclusions
Gearbox NVH simulation has advanced substantially beyond nominal deterministic design. Manufacturing-aware contact simulation, measured tooth geometry, tooth-resolved representations, uncertainty propagation, flexible drivetrain dynamics, acoustic prediction, surrogate modeling, virtual EOL, digital-twin updating, production metrology, and manufacturing feedback are all represented in contemporary research or industrial development.
The principal research gap is therefore no longer adequately described as a lack of manufacturing awareness or digital-twin architecture. Instead, the evidence points toward an architecture-evidence gap.
N(A >= 4) = 13
N(A >= 4 and E >= 3) = 0
Within the targeted 46-source coded set, highly integrated architectures are visible, but corresponding public evidence for same-unit production validation, production-population validation, and controlled intervention remains substantially weaker.
Part + Physical + Spectral + Statistical traceability
Architecturally capable twin -> Evidence-validated production twin
Future studies should therefore prioritize measured production distributions, unit-specific validation, excitation-versus-transfer-path variance decomposition, NVH-preserving geometry reduction, order-preserving surrogate models, virtual-EOL quality-control metrics, and experimentally verified manufacturing interventions. The next generation of gearbox NVH simulation will be defined less by how precisely an ideal gearbox can be represented and more by how convincingly the digital model can be shown to represent, explain, and ultimately improve the acoustic behavior of real manufactured populations.
Table 2.
Coded Evidence Matrix. The 46 coded sources used for the Architecture x Evidence occupancy analysis are listed below. Reference [17] is the contextual comparison review and is not part of the 46-source coded set.
Table 2.
Coded Evidence Matrix. The 46 coded sources used for the Architecture x Evidence occupancy analysis are listed below. Reference [17] is the contextual comparison review and is not part of the 46-source coded set.
| Ref. | Source/title | Year | Type | A | E | Evidence codes |
| [1] | Im, D.. Analysis of gear transmission error in helical gear using enhanced tooth contact analysis model considering measured tooth profile errors | 2025 | Peer-reviewed | A2 | E1 | MG, CP, EV |
| [2] | Grünberger, J.. Multibody simulation of spur gears using 3D contact modeling and real-world tooth geometry | 2026 | Peer-reviewed | A2 | E2 | MG, TR, CP, SD, EV |
| [3] | Wischmann, S.. Validation of models for calculating the NVH behavior of gearbox systems in an elastic multibody simulation | 2025 | Peer-reviewed | A2 | E2 | CP, SD, FS, VS, AC, EV |
| [4] | Oberneder, F.. The impact of manufacturing deviations on gearbox performance using a global sensitivity analysis | 2026 | Peer-reviewed | A1 | E1 | TP, CP, SU |
| [5] | Roth, L.. Design of profile corrections and tolerances in cylindrical gears for noise-sensitive applications in line with production efforts | 2025 | Peer-reviewed | A1 | E1 | TP, CP, SU |
| [6] | Willecke, M.. Surrogate model based prediction of transmission error characteristics based on generalized topography deviations | 2023 | Peer-reviewed | A2 | E1 | TR, CP, SU |
| [7] | Klarin, M.. Understanding End-of-Line NVH Scatter Bands in Electric Drives with High-Precision Simulations | 2025 | SAE technical paper | A3 | E1 | TP, CP, SD, FS, VS, SU, EO |
| [8] | Li, S.. A new method for analyzing gearbox vibration and noise in electric drive systems based on different modal forms | 2026 | Peer-reviewed | A3 | E2 | CP, SD, FS, VS, AC, EV |
| [9] | Souza, T.. The use of an artificial neural network for assessing tone perception in electric powertrain NVH | 2024 | Peer-reviewed | A3 | E2 | SD, FS, AC, PV, SU, EV |
| [10] | Su, C.. Correlation of the sound quality and vibration of end of line testing for automatic transmission | 2024 | Peer-reviewed | A3 | E4 | PD, UT, EO, PV, EV |
| [11] | Arvanitis, A.. Predicting Electric Vehicle Interior Noise Quality from Drive Unit End-of-Line Vibration Testing | 2026 | SAE technical paper | A3 | E3 | PD, UT, EO, PV, EV |
| [12] | Xia, J.. Digital twin-assisted gearbox dynamic model updating toward fault diagnosis | 2023 | Peer-reviewed | A4 | E2 | SD, DT, SU, EV |
| [13] | Xia, J.. A novel digital twin-driven approach based on physical-virtual data fusion for gearbox fault diagnosis | 2023 | Peer-reviewed | A4 | E2 | SD, DT, SU, EV |
| [14] | Zhu, P.. Digital twin-enabled entropy regularized wavelet attention domain adaptation network for gearboxes fault diagnosis without fault data | 2025 | Peer-reviewed | A4 | E2 | SD, DT, SU, EV |
| [15] | Magna International Inc.. Digital twin for manufacturing | 2026 | Patent | A5 | E0 | PD, UT, DT, AC, MF |
| [16] | Turich, A.. E-Drive Gear Inspection and Noise Analysis | 2022 | Industrial technical evidence | A5 | E2 | MG, TR, PD, MF |
| [18] | De Smet, B.. Reducing Tolerance-Induced Spread on Transmission Error in Planetary Gear Stages Using Monte Carlo Simulations and Surrogate Models Acquired From a Design of Experiments Approach | 2025 | Peer-reviewed | A1 | E1 | TP, CP, SU |
| [19] | Najib, R.. Assessing the impact of manufacturing uncertainties on the static and dynamic response of spur gear pairs | 2024 | Peer-reviewed | A1 | E2 | TP, CP, EV |
| [20] | Mann, A.. Targeted micro geometry scattering for NVH optimization of cylindrical gears in continuous generating grinding | 2025 | Peer-reviewed | A2 | E1 | TR, CP, MF |
| [21] | Cheng, et al.. Towards precise and rapid gearbox noise prediction: a physics-informed region-aware acoustic predictor | 2026 | Peer-reviewed | A3 | E2 | AC, SU, DT, EV |
| [22] | Cianciotta, L.. Multi-Objective Optimization of Gear Design of E-Axles to Improve Noise Emission and Load Distribution | 2025 | Peer-reviewed | A3 | E2 | CP, SD, FS, AC, EV |
| [23] | He, et al.. Optimization of Lightweight Gear Blanks to Improve NVH for an Electric Drive Unit | 2026 | SAE technical paper | A3 | E2 | CP, SD, FS, VS, AC, PV, EV |
| [24] | Liu, C.. Influence of Tooth Surface Wear on Dynamic Characteristics of Gear Systems Considering Three-Dimensional Tooth Surface Geometric Errors | 2025 | Peer-reviewed | A2 | E1 | MG, CP, SD |
| [25] | Brethee, K. F.. Nonlinear Characterisation of Wind Turbine Gearbox Vibration Dynamics Driven by Inhomogeneous Helical Gear Wear | 2026 | Peer-reviewed | A2 | E1 | CP, SD, VS |
| [26] | Reishauer AG. Method of monitoring the condition of a gear cutting machine | 2023 | Patent | A5 | E0 | PD, UT, EO, MF |
| [27] | Klingelnberg AG. Analysis of gear cutting process by means of roller testing | 2025 | Patent | A5 | E0 | PD, UT, EO, MF |
| [28] | Klingelnberg AG. Method and manufacturing system | 2026 | Patent | A5 | E0 | MG, TR, PD, UT, MF |
| [29] | Klingelnberg AG. Method and device for order analysis | 2026 | Patent | A5 | E0 | PD, EO, SU, MF |
| [30] | KISSsoft AG. Method for determining the expected noise emissions of a gear pair | 2025 | Patent | A4 | E0 | MG, TR, CP, AC |
| [31] | Klingelnberg AG. Device for rolling testing for spur wheels | 2025 | Patent | A5 | E0 | PD, UT, EO, MF |
| [32] | Mughal, H.. Comprehensive tribodynamic analysis of lubricated gear contacts for direct identification of gear whine noise in electric drive units | 2025 | Peer-reviewed | A2 | E2 | CP, SD, AC, EV |
| [33] | Zhu, B.. Digital twin surrogate modeling for real-time monitoring of gear transmissions using a dynamic graph attention network | 2026 | Peer-reviewed | A4 | E2 | SD, SU, DT, EV |
| [34] | Zhang, P.. A mechanism and data-driven adaptive update framework for digital twin model of electric drive assembly gear transmission system | 2026 | Peer-reviewed | A4 | E2 | SD, SU, DT, EV |
| [35] | Wang, et al.. A Novel Method for Obtaining Analytical Parameters Based on Double-Flank Measurement | 2024 | Peer-reviewed | A2 | E2 | MG, PD, EV |
| [36] | Nohl, et al.. Quasi-static modeling of long-wave axis deviations in planetary gears for transmission error signal analysis | 2025 | Peer-reviewed | A1 | E1 | TP, CP |
| [37] | Ahmad, M.. Anregungsgerechte Auslegung und Tolerierung von schnelllaufenden Getrieben unter Berücksichtigung kurz- und langwelliger Verzahnungsabweichungen | 2023 | Dissertation | A1 | E1 | TR, TP, CP |
| [38] | Westphal, C.. Gear Design for Stepped Planetary Gear Stages | 2026 | Dissertation | A2 | E2 | TP, CP, SD, FS, EV |
| [39] | Schweigert, C.. High-Speed Gearboxes for Electromechanical Drivetrains | 2025 | Dissertation | A2 | E2 | SD, VS, EV |
| [40] | Mabrouk, M.. Optimizing gear NVH performance using genetic algorithm-based on tooth profile modification and a comparative analysis of simulation and experimental outcomes | 2026 | Peer-reviewed | A2 | E2 | CP, AC, EV |
| [41] | Xie, A.. Multi-objective micro-geometry optimization of high-speed e-drive gears for NVH and strength | 2026 | Peer-reviewed | A2 | E2 | CP, VS, EV |
| [42] | Ge, et al.. Multifield coupled dynamics modeling and vibration characteristics of electric-vehicle electric drive systems | 2024 | Peer-reviewed | A3 | E1 | CP, SD, VS |
| [43] | Souza, T.. Design of electric powertrains to achieve NVH performance using autoencoders and a physical meaningful latent space | 2025 | Peer-reviewed | A3 | E1 | AC, PV, SU |
| [44] | Guo, et al.. A dynamic meshing transmission dataset for manufacturing quality inspection of electric vehicle reducer gears | 2026 | Peer-reviewed data descriptor | A2 | E2 | PD, VS, SU, EV |
| [45] | Liang, et al.. Modelling method, simulation and experimental verification of hypoid gear involved tooth surface deviation under manufacturing process | 2023 | Peer-reviewed | A2 | E1 | MG, CP, EV |
| [46] | Zhang, et al.. Transmission error modeling and analysis of herringbone gear drive based on the measured manufacturing errors | 2025 | Peer-reviewed | A2 | E1 | MG, CP, EV |
| [47] | Willecke, M.. Virtual End of Line Test: Prediction of the Acoustic Behavior of Gearboxes Based on Topographic Deviations Using Neural Networks | 2023 | Conference technical paper | A3 | E0 | MG, TR, CP, SD, SU, EO |
References
- Im, D.; Chung, W.-J.; Lee, H.; et al. (2025). Analysis of gear transmission error in helical gear using enhanced tooth contact analysis model considering measured tooth profile errors. Scientific Reports, 15, 5981. [CrossRef]
- Grünberger, J.; Steiner, W.; Witteveen, W. (2026). Multibody simulation of spur gears using 3D contact modeling and real-world tooth geometry. Engineering Research, 90, 22. [CrossRef]
- Wischmann, S.; Mann, A.; Jacobs, G.; et al. (2025). Validation of models for calculating the NVH behavior of gearbox systems in an elastic multibody simulation. Engineering Research, 89, 33. [CrossRef]
- Oberneder, F.; Papadopoulos, T.; Strobl, P.; Otto, M.; Stahl, K. (2026). The impact of manufacturing deviations on gearbox performance using a global sensitivity analysis. Engineering Research, 90, 20. [CrossRef]
- Roth, L.; Westphal, C.; Brecher, C. (2025). Design of profile corrections and tolerances in cylindrical gears for noise-sensitive applications in line with production efforts. Engineering Research, 89, 11. [CrossRef]
- Willecke, M.; Brimmers, J.; Brecher, C. (2023). Surrogate model based prediction of transmission error characteristics based on generalized topography deviations. Forschung im Ingenieurwesen, 87, 431–440. [CrossRef]
- Klarin, M.; Schweiger, C.; Resch, M. (2025). Understanding End-of-Line NVH Scatter Bands in Electric Drives with High-Precision Simulations. SAE Technical Paper, 2025-01-0406. [CrossRef]
- Li, S.; Zuo, S.; Yin, B.; Jin, M.; Li, H.; Liu, C.; Shi, L. (2026). A new method for analyzing gearbox vibration and noise in electric drive systems based on different modal forms. Journal of Vibration and Control, 32, 2446–2460. [CrossRef]
- Souza, T.; et al. (2024). The use of an artificial neural network for assessing tone perception in electric powertrain NVH. Meccanica, 59, 433–459. [CrossRef]
- Su, C.; Liu, D.; Zhao, H.; Yuan, Y.; Song, T. (2024). Correlation of the sound quality and vibration of end of line testing for automatic transmission. Measurement and Control, 57, 1405–1416. [CrossRef]
- Arvanitis, A.; Jangid, A. (2026). Predicting Electric Vehicle Interior Noise Quality from Drive Unit End-of-Line Vibration Testing. SAE Technical Paper, 2026-01-0223. [CrossRef]
- Xia, J.; Huang, R.; Liao, Y.; Li, J.; Chen, Z.; Li, W. (2023). Digital twin-assisted gearbox dynamic model updating toward fault diagnosis. Frontiers of Mechanical Engineering, 18, 32. [CrossRef]
- Xia, J.; Huang, R.; Chen, Z.; He, G.; Li, W. (2023). A novel digital twin-driven approach based on physical-virtual data fusion for gearbox fault diagnosis. Reliability Engineering & System Safety, 240, 109542. [CrossRef]
- Zhu, P.; Deng, L.; Tang, B.; Yang, Q.; Li, Q. (2025). Digital twin-enabled entropy regularized wavelet attention domain adaptation network for gearboxes fault diagnosis without fault data. Advanced Engineering Informatics, 64, 103055. [CrossRef]
- Magna International Inc. (2026). Digital twin for manufacturing. EP4679200A1. Available at: https://patents.google.com/patent/EP4679200A1/en.
- Turich, A.; Gleason Corporation. (2022). E-Drive Gear Inspection and Noise Analysis. Gear Technology. Available at: https://www.geartechnology.com/e-drive-gear-inspection-and-noise-analysis.
- Najib, R.; Neufond, J.; Franco, F.; Petrone, G.; De Rosa, S. (2025). Effect of manufacturing tolerances and uncertainties on the NVH response of spur and helical gears: A review. Proceedings of the Institution of Mechanical Engineers, Part C: Journal of Mechanical Engineering Science, 239(16), 6648–6676. [CrossRef]
- De Smet, B.; Marco I. Jordan, J.; Blockmans, B.; Becht, P.; De Bie, N.; Naets, F. (2025). Reducing Tolerance-Induced Spread on Transmission Error in Planetary Gear Stages Using Monte Carlo Simulations and Surrogate Models Acquired From a Design of Experiments Approach. Wind Energy, 28, e70064. [CrossRef]
- Najib, R.; Neufond, J.; Franco, F.; Petrone, G.; De Rosa, S. (2024). Assessing the impact of manufacturing uncertainties on the static and dynamic response of spur gear pairs. Mechanics Based Design of Structures and Machines, 52, 6973–7003. [CrossRef]
- Mann, A.; Westphal, C.; Brecher, C. (2025). Targeted micro geometry scattering for NVH optimization of cylindrical gears in continuous generating grinding. Engineering Research, 89, 94. [CrossRef]
- Cheng, et al. (2026). Towards precise and rapid gearbox noise prediction: a physics-informed region-aware acoustic predictor. Measurement Science and Technology, 37, 086003. [CrossRef]
- Cianciotta, L.; Cirelli, M.; Valentini, P. P. (2025). Multi-Objective Optimization of Gear Design of E-Axles to Improve Noise Emission and Load Distribution. Machines, 13, 330. [CrossRef]
- He, et al. (2026). Optimization of Lightweight Gear Blanks to Improve NVH for an Electric Drive Unit. SAE Technical Paper, 2026-01-0001. [CrossRef]
- Liu, C.; et al. (2025). Influence of Tooth Surface Wear on Dynamic Characteristics of Gear Systems Considering Three-Dimensional Tooth Surface Geometric Errors. Shock and Vibration, 2025, 2539671. [CrossRef]
- Brethee, K. F.; Ibrahim, G. R.; Albarbar, A. (2026). Nonlinear Characterisation of Wind Turbine Gearbox Vibration Dynamics Driven by Inhomogeneous Helical Gear Wear. Vibration, 9, 20. [CrossRef]
- Reishauer AG (2023). Method of monitoring the condition of a gear cutting machine. WO2023061851A1/US20240335894A1. Available at: https://patents.google.com/patent/US20240335894A1/en.
- Klingelnberg AG (2025). Analysis of gear cutting process by means of roller testing. EP4592011A1. Available at: https://patents.google.com/patent/EP4592011A1/en.
- Klingelnberg AG (2026). Method and manufacturing system. EP4563964B1. Available at: https://patents.google.com/patent/EP4563964B1/en.
- Klingelnberg AG (2026). Method and device for order analysis. DE102024131238A1/US20260118217A1. Available at: https://patents.google.com/patent/US20260118217A1/en.
- KISSsoft AG (2025). Method for determining the expected noise emissions of a gear pair. WO2023208958A1/EP4515200A1/US20250271328A1. Available at: https://patents.google.com/patent/US20250271328A1/en.
- Klingelnberg AG (2025). Device for rolling testing for spur wheels. EP4647738A1. Available at: https://patents.google.com/patent/EP4647738A1/en.
- Mughal, H.; Dolatabadi, N.; Rahmani, R.; King, P.; Gnanakumarr, M.; Varnier, O. (2025). Comprehensive tribodynamic analysis of lubricated gear contacts for direct identification of gear whine noise in electric drive units. Mechanical Systems and Signal Processing, 236, 113054. [CrossRef]
- Zhu, B.; Chao, Q.; Wang, Z.; Xia, P.; Liu, C. (2026). Digital twin surrogate modeling for real-time monitoring of gear transmissions using a dynamic graph attention network. Advanced Engineering Informatics, 72, 104509. [CrossRef]
- Zhang, P.; Chen, R.; Liang, D.; Ran, M.; Li, H.; Ai, Y.; Gao, L. (2026). A mechanism and data-driven adaptive update framework for digital twin model of electric drive assembly gear transmission system. Journal of Vibration and Control, OnlineFirst. [CrossRef]
- Wang, et al. (2024). A Novel Method for Obtaining Analytical Parameters Based on Double-Flank Measurement. Sensors, 24, 2734. [CrossRef]
- Nohl, et al. (2025). Quasi-static modeling of long-wave axis deviations in planetary gears for transmission error signal analysis. Engineering Research, 89, 9. [CrossRef]
- Ahmad, M. (2023). Anregungsgerechte Auslegung und Tolerierung von schnelllaufenden Getrieben unter Berücksichtigung kurz- und langwelliger Verzahnungsabweichungen. RWTH Aachen University. [CrossRef]
- Westphal, C. (2026). Gear Design for Stepped Planetary Gear Stages. RWTH Aachen University. [CrossRef]
- Schweigert, C. (2025). High-Speed Gearboxes for Electromechanical Drivetrains. Technical University of Munich. Available at: https://mediatum.ub.tum.de/1751631.
- Mabrouk, M.; Ning, P.; Zheng, D.; Wang, T.; Wu, H.; Altabey, W. A.; Kouritem, S. A. (2026). Optimizing gear NVH performance using genetic algorithm-based on tooth profile modification and a comparative analysis of simulation and experimental outcomes. Measurement, 258, 119163. [CrossRef]
- Xie, A.; Liu, X.; Liu, J.; Zhang, G.; et al. (2026). Multi-objective micro-geometry optimization of high-speed e-drive gears for NVH and strength. Results in Engineering, 30, 109647. [CrossRef]
- Ge, et al. (2024). Multifield coupled dynamics modeling and vibration characteristics of electric-vehicle electric drive systems. Nonlinear Dynamics, 112. [CrossRef]
- Souza, T.; et al. (2025). Design of electric powertrains to achieve NVH performance using autoencoders and a physical meaningful latent space. Neural Computing and Applications, 37, 10287–10308. [CrossRef]
- Guo, et al. (2026). A dynamic meshing transmission dataset for manufacturing quality inspection of electric vehicle reducer gears. Scientific Data, 13, 510. [CrossRef]
- Liang, et al. (2023). Modelling method, simulation and experimental verification of hypoid gear involved tooth surface deviation under manufacturing process. Mechanism and Machine Theory, 182, 105248. [CrossRef]
- Zhang, et al. (2025). Transmission error modeling and analysis of herringbone gear drive based on the measured manufacturing errors. Transactions of the Canadian Society for Mechanical Engineering, 49, 13–23. [CrossRef]
- Willecke, M.; Brimmers, J.; Brecher, C. (2023). Virtual End of Line Test: Prediction of the Acoustic Behavior of Gearboxes Based on Topographic Deviations Using Neural Networks. AGMA Fall Technical Meeting, 23FTM16. Available at: https://publications.rwth-aachen.de/record/975007/.
Figure 3.
Proposed gear-specific order-traceable production NVH digital thread. Manufacturing, metrology, tooth geometry, contact excitation, system forces, structural response, EOL testing, vehicle response, and perception are connected through a parallel order-domain representation. Separate feedback paths are shown for physical-virtual model updating and manufacturing-process correction.
Figure 3.
Proposed gear-specific order-traceable production NVH digital thread. Manufacturing, metrology, tooth geometry, contact excitation, system forces, structural response, EOL testing, vehicle response, and perception are connected through a parallel order-domain representation. Separate feedback paths are shown for physical-virtual model updating and manufacturing-process correction.
Disclaimer/Publisher’s Note: The statements, opinions and data contained in all publications are solely those of the individual author(s) and contributor(s) and not of MDPI and/or the editor(s). MDPI and/or the editor(s) disclaim responsibility for any injury to people or property resulting from any ideas, methods, instructions or products referred to in the content. |
© 2026 by the authors. Licensee MDPI, Basel, Switzerland. This article is an open access article distributed under the terms and conditions of the Creative Commons Attribution (CC BY) license (http://creativecommons.org/licenses/by/4.0/).
Copyright: This open access article is published under a Creative Commons CC BY 4.0 license, which permit the free download, distribution, and reuse, provided that the author and preprint are cited in any reuse.