

Submitted:
08 September 2026
Posted:
08 September 2026
You are already at the latest version
Abstract
Aim: Estrone (E1) is of particular interest as most breast cancers are diagnosed after menopause, the period in which E1 becomes the dominant estrogen. Triple-negative breast cancer (TNBC) is a highly invasive cancer which lacks hormone receptors for estrogen (ER), progesterone (PR), and HER2 (human epidermal growth factor receptor-2). Unfortunately, there are no applicable therapeutic targeted treatments for TNBC. The present study investigated the effects of estrogen hormone, estrone sulfate (E1S), on cancer cells. The hypothesis is that E1S engages in non-classical biased G protein-coupled estrogen receptor (GPER) signaling in TNBC MDA-MB-231 cells, estrogen receptor-positive MCF-7 breast cancer cells, and pancreatic PANC-1 cancer cells which express estrogen, progesterone, and androgen receptors. It is hypothesized that E1S binding to GPER potentiates a biased heterodimerization with GPCR neuromedin B receptor (NMBR) to activate matrix metalloproteinase 9 (MMP9) and neuraminidase 1 (Neu1), a signaling paradigm with previously established stoichiometry conducive to biased downstream signaling of receptor tyrosine kinase (RTK) and Toll-like (TLR) receptors. Methods: Here, sialidase and colocalization assays were performed on breast MDA-MB-231 and MCF-7 cells and pancreatic PANC-1 cancer cells. An epithelial-to-mesenchymal (EMT) transition, a tunneling nanotube assay, and a scratch wound assay were conducted to elucidate the cellular behaviors of E1S. A RawBlue reporter macrophage cell line was used to measure NFκB activity using the secreted embryonic alkaline phosphatase (SEAP) assay, and cellular viability and metabolic activity were measured using the AlamarBlue assay. Results: E1S induced NMBR/MMP9/Neu1 signaling in MDA-MB-231, MCF-7, PANC-1 and RawBlue cells. E1S increased E-cadherin expression, reduced N-cadherin and vimentin expression, decreased tunneling nanotube density, and reduced scratch wound migration. E1S increased SEAP activity, suggestive of increased nuclear factor-κB (NF-κB) and activator protein-1 (AP-1)-mediated transcription. E1S treatment did not affect cell viability and metabolic activity in MDA-MB-231 cells using the AlamarBlue assay, in a dose-dependent manner. Conclusions: Biased, temporal GPER signaling has significant implications for breast cancer cellular behavior, which may be leveraged to inform therapeutic strategies for an aggressive form of breast cancer.
Keywords:
estrone
; MDA-MB-231
; MCF-7
; PANC-1 and RawBlue cells
; epithelial-to-mesenchymal (EMT) transition
; a tunneling nanotube assay
; and a scratch wound
1. Introduction
Breast cancers are hormone-dependent diseases [1,2]. Nearly 70–80% of breast cancers express ERs and/or PRs [1,2]. This association reflects the role of estrogens in altering the breast architecture and development [3]. For example, the rudimentary mammary structure formed during the prenatal period is transformed into the mature mammary gland following the onset of puberty in females [3]. This transformation, characterized by ductal development, fat deposition, and connective tissue growth, is largely orchestrated by estrogens. Growth hormone (GH) and insulin-like growth factor-1 (IGF-1) also play significant but comparatively auxiliary roles [1,3]. Notably, alterations of the breast structure by estrogen are not exclusively benign; in fact, clinical and experimental data show that estrogen is integral to the proliferation and progression of breast cancer [1,2]. In various malignant breast cells, the ER signaling pathway promotes proliferative and pro-survival signals, and inhibits apoptosis by upregulating Bcl-2, an anti-apoptotic proto-oncogene [1].
However, the role of estrogen in cancers lacking ERs and PRs is limited and inconsistent [4,5,6,7,8]. Therefore, given the significant role of estrogens in breast development and cancer, it is imperative to distinguish the unique biological properties of endogenous estrogens and to analyze how these estrogens affect cancers that do not rely on classical estrogen signaling pathways. The term estrogen refers to a class of sex hormones primarily involved in the development and regulation of the female reproductive system [9,10]. Estrogens are ubiquitous and therefore impact nearly all physiological systems and tissues, including the neuroendocrine, skeletal, immune, and cardiovascular systems [9,10,11]. Four endogenous forms of estrogen exist: estrone (E1), estradiol (E2), estriol (E3), and estetrol (E4), which vary in potency and abundance throughout a female’s lifetime [9,11,12]. Differences in potency reflect variations in agonist affinity for cognate receptors and intrinsic efficacy, which together influence the magnitude and nature of downstream signaling responses [9,11,12]. From puberty to menopause, E2 is the predominant estrogen hormone and is widely recognized as the most potent estrogen due to its high affinity for ERs [12]. Conversely, E1 dominates during the postmenopausal period [12]. E3 has intermediate potency and predominates during pregnancy [12]. The least potent estrogen, E4, is regarded as the “estrogen of fetal life”, as the fetal liver synthesizes it and is solely present during pregnancy [11]. As such, levels of E4 are relatively high in the fetus, but lower in maternal circulation [11].
Of the various forms of estrogen, E1 is of particular interest as most breast cancers are diagnosed after menopause, the period in which E1 becomes the dominant estrogen [13]. However, E1 is estimated to have a relative potency of less than 10% that of E2 in conventional ligand-binding assays and in vitro bioassays; its circulating serum concentrations may be 100-fold greater than those of E2 in postmenopausal women [14,15]. Triple negative breast cancer (TNBC), however, is most frequently diagnosed in premenopausal women, a demographic in which E2 predominates [16]. Therefore, due to its high potency and relevance in the premenopausal window, the effects of E2 have been more extensively characterized than those of E1 [14,15]. As E2 has already been comprehensively studied, analyzing the effect of E1 in its vastly abundant storage form on TNBC is critical to address gaps in the literature. Examining the role of E1 may elucidate potential non-classical signaling pathways independent of ERs, PRs, and HER2 that may influence TNBC development and progression. Importantly, this use of non-classical estrogen signaling is not limited to the postmenopausal period and may be broadly applicable across age groups.
In postmenopausal women, this marked reduction in serum estrogen levels results from the cessation of ovarian E2 production [17]. Consequently, estrogen synthesis primarily occurs in peripheral adipose tissue as E1 [17]. In adipose tissue and, to a lesser degree, in bone, breast, and brain, E1 is produced by the aromatization of adrenal androstenedione [13,17]. Notably, while ovarian-synthesized estrogen is largely released into the bloodstream, estrogen produced in extragonadal sites has localized effects, acting as a paracrine and/or intracrine factor to maintain tissue-specific functions [12].
Studies have shown that 2-hydroxyestrone and 2-hydroxyestradiol inhibit cell growth and proliferation [18]. Thus, 2-hydroxyestrone has been coined a “good estrogen” by some researchers [19]. The sulfation of estrogen is noteworthy because it facilitates estrogen storage in breast tissue [12,20]. Estrogen sulfotransferase (SULT1E1) catalyzes the sulfation of E1 and E2 with high efficiency [21]. Estrogen sulfatase (STS) mediates the reverse desulfation reaction to reactivate estrogens [21]. In fact, estrone sulfate (E1S) is the most abundant circulating estrogen in adults and serves as an inactive reservoir that provides E1 and E2 [22,23]. E1 can be reduced to E2 by 17β-hydroxysteroid dehydrogenases 1 (HSD17B1), whereas the reverse oxidation of E2 to E1 is mediated by 17β-hydroxysteroid dehydrogenases 2 (HSD17B2) [24].
In summary, in premenopausal women, the ovaries are the primary site of estrogen production [24]. Conversely, in postmenopausal women, ovarian production of estrogen ceases [24]. As such, the most potent estrogen, E2, diminishes in serum and is no longer able to overshadow E1S, the primary circulating steroid throughout adulthood [15,25,26]. Following this estrogenic shift, the main source of active estrogen in any tissue is due to local conversion [24]. In the breast, conversion is facilitated by SULT1E1 and 17β-hydroxysteroid dehydrogenases [24]. Correspondingly, the relative expression of enzymes and the availability of substrates determine the balance and overall effect of sex steroids in local tissues [24].
Estrogens act through two types of receptors: (i) classical nuclear receptors and (ii) cell surface membrane receptors [12,27,28]. Classical nuclear receptors include estrogen receptor α (ERα) and estrogen receptor β (ERβ) [12,27,28]. Cell membrane receptors include G protein-coupled estrogen receptors (GPER) [12,27,28].
ERα is predominantly expressed in the gonadal organs, including the breast, uterus, ovary, prostate, and testes [12,27,28]. However, the receptor is also expressed at lower levels in bone, kidney, liver, adipose tissue, and brain [12,27,28]. Notably, TNBCs do not express ERα but may express variable levels of ERβ and often overexpress the human epidermal growth factor receptor (EGFR), even though HER2 is not expressed [4,16,29,30,31]. ERβ is more commonly expressed in non-gonadal organs, including the colon, bone marrow, lungs, bladder, brain, and vascular endothelium [12,27,28]. In contrast, GPERs are present in several tissues throughout the body, including but not limited to the breasts, brain, uterus, ovaries, vascular system, kidneys, and the central and peripheral nervous systems [12,27,28,32].
ER-dependent signaling can be categorized into ligand-dependent or ligand-independent, and as genomic or non-genomic, depending on how signaling is initiated and the resulting cellular event (e.g., altered gene expression or the initiation of signaling cascades) [12,27,28]. In the classical, direct pathway, estrogen binds to ERs [12,27,28]. As a result, the estrogen-ER homo- or heterodimeric complex translocates to the nucleus. It binds to estrogen response elements (EREs) located in or near target gene promoters to modulate gene expression [12,27,28].
Estrogen biology is multifaceted and employs signaling mechanisms beyond classical ER-dependent signaling, particularly in cancers such as TNBC that lack ERα and variably express ERβ [4,16,29]. Nevertheless, TNBC still responds to estrogenic cues [4,16,29]. Therefore, conceptualizing how E1S, the widely abundant storage form of E1, engages in non-classical signaling pathways to influence cancer progression is essential [4,16,29]. Consequently, defining these pathways may advance our understanding of estrogen-driven signaling in cancer cells and reveal new therapeutic opportunities.
Taken together, the findings of the present study support a novel signaling model in which E1S-mediated partial or weak agonism at GPERs results in biased responses involving the NMBR/MMP9/Neu1 signaling axis of RTK receptors, thereby altering TNBC and other cancer progression. GPCRs can operate within multi-receptor complexes that include other GPCRs, RTKs, MMPs, and Neu1 [33]. The prior documented involvement of NMBR/MMP9/Neu1 signaling, particularly through receptor desialylation and activation, provides a mechanistic framework through which GPER signaling may alter cellular outcomes in a biased manner [33]. In the proposed signaling model, E1S interacts with GPERs to form a heteromer complex with NMBR, thereby activating MMP9-Neu1 crosstalk and subsequent RTK and TLR downstream signaling.
2. Materials and Methods
2.1. Cell Lines
The MDA-MB-231 (ATCC® HTB-26™, Manassas, VA 20110-2209, U.S.A.) cell line was used. MDA-MB-231 is a TNBC cell line obtained from a pleural effusion of a 51-year-old Caucasian female with metastatic mammary adenocarcinoma [34,35]. MCF-7 is a human, epithelial morphology, estrogen- and progesterone-receptor-positive breast cancer cell line (ATCC HTB-22TM, Manassas, VA 20110-2209, U.S.A.). PANC-1 (human, epithelial morphology, ATCC CRL-1469TM, Manassas, VA, U.S.A.) is an isolated from pancreatic duct epithelioid carcinoma. The RAW-BlueTM cell line (InvivoGen, San Diego, CA, U.S.A.) was also used to assess NF-κB-dependent signaling. The RAW-BlueTM cell line is a mouse macrophage reporter cell line derived from murine RAW 264.7 macrophages that stably expresses an optimized secreted embryonic alkaline phosphatase (SEAP) reporter gene inducible by NF-κB and AP-1 [36]. To ensure appropriate gene expression, RAW-BlueTM cells were cultured in a medium containing Zeocin as the selectable marker.
Cell lines were cultured in Dulbecco’s Modified Eagle Medium (DMEM; Gibco, Rockville, MD, U.S.A.) with the addition of 10% fetal bovine serum (FBS; HyClone, Logan, UT, U.S.A.) and 5 μg/mL PlasmocinTM (InvivoGen, San Diego, CA, U.S.A.) to reduce the risk of contamination by mycoplasma. All cells were cultured in T-75 tissue culture flasks at 37 °C in a humidified incubator with 5% CO2. At approximately 70–80% confluency, cells were passaged at least 5 times after thawing to allow recovery from cryopreservation and to stabilize growth and signaling parameters prior to experimental use.
2.2. Reagents
Estrone-3-sulfate sodium salt (E1S) was purchased from MedChemExpress (Monmouth Junction, NJ, U.S.A.). E1S powder was dissolved in phosphate-buffered saline (PBS) to prepare a 5 mg/mL stock solution, which was aliquoted and stored at −20 °C. Immediately before treatment, stock solutions were diluted in PBS or serum-starved medium to the desired concentration. GPCR NMBR was antagonized with the specific antagonist BIM-23127 at 30 nM (Tocris Bioscience, Bristol, UK). MMP9 activity was inhibited using a selective MMP9 inhibitor (MMP9i; 2 μM; GLPBIO Technology, Montclair, CA, U.S.A.). Neu1 activity was inhibited using oseltamivir phosphate (OP; 300 μg/mL; ≥99% purity, Batch No. MBAS20014A; Active Pharma Sciences Ltd., New Mangalore, Karnataka, India).
2.3. Sialidase Assay
MDA-MB-231 cells were seeded onto 12 mm circular glass coverslips in sterile 24-well tissue culture plates (Falcon; Becton, Dickinson & Company, Mississauga, ON, Canada). Cells were maintained in conditioned medium and incubated at 37 °C in a humidified atmosphere containing 5% CO2 until ~70–80% confluence, as optimized for the live cell sialidase assay [35]. After medium removal, cells were washed with PBS and incubated in serum-free DMEM for 60 min to minimize the effects of exogenous factors in FBS. Subsequently, 4 μL of the fluorogenic sialidase substrate, 2-(4-methylumbelliferyl)-α-D-N-acetylneuraminic acid (4-MUNANA; 0.318 mM; Biosynth International Inc., Itasca, IL, U.S.A.), diluted in Tris-buffered saline (TBS), was added to control samples. For treated samples, all compounds were added in a final volume of 4 μL. Accordingly, 4-MUNANA was co-applied with either EGF (30 ng/mL) or E1S (0.1–50 nM). Subsequent assays were conducted in the presence of pathway-specific inhibitors. NMBR was antagonized with BIM-23127 at 30 nM (Tocris Bioscience, Bristol, UK). MMP9 activity was inhibited using a selective MMP9 inhibitor (MMP9i; 2 μM; GLPBIO Technology, Montclair, CA, U.S.A.). Neu1 activity was inhibited using oseltamivir phosphate (OP; 300 μg/mL; ≥99% purity, Batch No. MBAS20014A; Active Pharma Sciences Ltd., New Mangalore, Karnataka, India). After adding all relevant compounds, coverslips bearing adherent cells were inverted onto microscope slides.
Fluorescence was detected using excitation and emission wavelengths of 365–380 nm and 445–454 nm, respectively, with a Zeiss Imager M2 epifluorescent microscope equipped with a 10× objective to capture fluorescent and phase-contrast images (Carl Zeiss Canada Ltd., Toronto, Canada). All images were captured approximately one minute after treatment with 4-MUNANA and E1S alone or with inhibitors. Mean fluorescence intensity was quantified from 50 peripheral regions per cell across three images per slide (N=3–4) using ImageJ software (version 1.5g, Java 1.8.0_345, 64-bit). Each experiment was performed in triplicate.
2.4. Colocalization Assay
Cells were seeded onto 12 mm circular glass coverslips placed in sterile flat-bottom 24-well tissue culture plates (Falcon; Becton, Dickinson & Company, Mississauga, ON, Canada). Cells were grown in complete growth medium, incubated at 37 °C in a humidified atmosphere containing 5% CO2 until ~70–80% confluence was reached. Subsequently, the cells were serum-starved for 24 h, fixed using 4% paraformaldehyde (PFA) for 20 min, washed, and permeabilized with 0.2% Triton X-100 for 5 min at room temperature. Cells were then blocked with 4% bovine serum albumin (BSA) in 0.05% Tween-20 in Tris-buffered saline (TBST) solution for 24 h at 4–5 °C.
The fixed cells were incubated with rabbit recombinant monoclonal anti-G protein-coupled receptor-30 conjugated with Alexa Fluor® 594 antibody (ab311828; Abcam Inc. 152 Grove Street, Suite 1100, Waltham, MA 02453, U.S.A.) and a mouse monoclonal IgG anti-Neu-1 Alexa FluorTM 488-conjugated antibody (sc-166824, Santa Cruz Technologies, Dallas, TX, U.S.A.) at 1:20 dilution, with gentle rocking at 4–5 °C for 24 h.
The coverslips with the stained adherent cells were then mounted onto microscope slides on 3 μL of VECTASHIELD DAPI mounting medium (DAPI; VECTH1500, MJS BioLynx Inc., Brockville, ON, Canada). Images were then captured using a Zeiss M2 epifluorescent microscope (40× objective magnification, 488 nm and 594 nm excitation wavelengths; Carl Zeiss Canada Ltd., Toronto, ON, Canada). The Pearson correlation coefficient, demonstrating the colocalization of the two fluorescent-antibody channels, was determined using AxioVision software, Rel. 4.6. A correlation value of 0.5-1.0 indicates a significant positive relationship.
2.5. EMT Assay
Cells were seeded onto 12 mm circular glass coverslips placed in sterile 24-well tissue culture plates (Falcon; Becton, Dickinson & Company, Mississauga, ON, Canada). Cells were grown in complete growth medium and incubated at 37 °C in a humidified atmosphere containing 5% CO2 until ~70–80% confluence was reached. Subsequently, control samples were treated with 300 μL of serum-free medium, while treated cells were exposed to 300 μL of E1S (10 nM) diluted in serum-free medium for 24 h. Cells were washed with 1x PBS and fixed with 4% PFA for 20 min at room temperature. Cells were then washed and permeabilized with 0.2% Triton X-100 for 5 min at 37 °C. After incubation, the cells were washed and blocked with 4% BSA in 0.05% TBST for 20 min at room temperature. Following washing and blocking, cells were incubated with antibodies targeting EMT-associated markers, including anti-E-cadherin (Alexa Fluor 594), anti-N-cadherin (Alexa Fluor 594), or anti-vimentin (Alexa Fluor 594) (Santa Cruz Biotechnology, Dallas, TX, U.S.A.), for 24 h at 4–5 °C. All antibodies were used at a 1:50 dilution from a 200 μg/mL stock. The coverslips bearing adherent cells were mounted onto microscope slides with 3 μL of DAPI mounting media. Images of the slides were immediately captured using Zeiss M2 epi-fluorescent microscopy (20× objective) using the appropriate excitation and emission settings for Alexa Fluor 594 and DAPI. The fluorescence density for each EMT marker was computed in Corel Photo-Paint, with background fluorescence subtracted from the mean fluorescence of the entire image, and the resulting difference multiplied by the pixel density.
2.6. Tunneling Nanotube Assay
Cells were seeded onto 12 mm circular glass coverslips placed in sterile 24-well tissue culture plates (Falcon; Becton, Dickinson & Company, Mississauga, ON, Canada) and grown to ~70–80% confluence. The cells were first serum-starved (medium without FBS) for 3 hrs before incubation with E1S (10 nM). For combined E1S and OP treatment, cells were pre-treated with OP (300 μg/mL) for 15 min prior to E1S addition. Control wells were incubated in serum-free media. Cells were then washed and treated with CellMaskTM Orange Actin Tracking Stain (A57244, Invitrogen, Thermo Fisher Scientific Inc., Waltham, MA, U.S.A.) with excitation at 545 nm for 10 min, washed, fixed with 4% PFA, and incubated at 4 ◦C for 24 h. The following day, cells were washed, and coverslips with attached cells were inverted onto a slide with Vectashield DAPI fluorescent mounting medium (VECTH1500, MJS BioLynx Inc., Brockville, ON, Canada) to stain the nuclei. Slides were immediately visualized using Zeiss M2 epifluorescent microscopy (20× objective magnification; Carl Zeiss Canada Ltd., Toronto, ON, Canada). Cell projections were differentiated from the rest of the cell body using Cell Profiler and ImageJ (Version 23.1.0.389). Fluorescence density was further quantified in Corel Photo-Paint X8, Version 24.3.0.57, using the same density equation as previously reported by Baghaie et al. [37].
2.7. NF-κB-Dependent Secreted Embryonic Alkaline Phosphatase Assay (SEAP)
A suspension of 1×10^6 RAW-BlueTM cells/mL was prepared. Of this, 100 μL (~100,000 cells) was added to each well of a flat-bottom 96-well plate and incubated at 37 °C with 5% CO2 for approximately 4 h to allow cell adherence. Negative control wells were treated with 100 μL of growth medium with Zeocin. Positive control wells were treated with lipopolysaccharide (LPS; 5 μg/mL; Sigma-Aldrich, Millipore Sigma Canada Ltd., Oakville, ON, Canada). Estrogen-treated cells were exposed to 100 μL of E1S (10 nM). Under inhibitory conditions, cells were first treated with BIM-23127, MMP9i, or OP for 15 min, followed by stimulation with 50 μL of E1S (10 nM), yielding a total treatment volume of 100 μL. Thereafter, plates were incubated at 37 °C for 18–24 hours. SEAP activity was quantified with QUANTI-BlueTM reagent (InvivoGen) in accordance with the manufacturer’s instructions. Firstly, 180 μL of the reagent was added to each well of a new 96-well plate, followed by 20 μL of supernatant collected from the RAW-BlueTM-treated cells. Plates were then incubated at 37 °C for approximately 4 h to allow the signal to develop sufficiently. After the incubation period, SEAP activity was measured by spectrophotometry (SpectraMax 250, Molecular Devices, Sunnyvale, California 94089, U.S.A.) at 650 nm.
2.8. AlamarBlue Viability Assay and Metabolic Activity
E1S-induced viability or cytotoxicity was determined using the AlamarBlue assay, as previously described [38]. Cells were seeded at 20,000 cells per well in flat-bottom 96-well plates. Cells were incubated at 37 ◦C in 5% CO2 for 24 h before treatment with E1S or an untreated vehicle control. Cell viability was measured using an AlamarBlue assay (Invitrogen; Thermo Fisher Scientific, Eugene, OR, U.S.A.). Cells were treated with 100 μL of E1S at varying concentrations (0.1–50 nM) diluted in serum-starved medium. Control cells were treated with 100 μL of medium with FBS. Medium with FBS was also added to wells without cells to obtain a blank medium control. Subsequently, cells were incubated for 24 hours at 37 °C with 5% CO2. Following the incubation period, each well was treated with 10 μL of AlamarBlue reagent and incubated for 4 hours. The absorbance was recorded at 560 nm (excitation) and 590 nm (emission) using a SpectraMax 250 spectrophotometer. The results were calculated by subtracting fluorescence from the blank media control and compared to the untreated control. The viability of cells was then ascertained using the following formula:
| [(Absorbance of treated cells) − (media absorbance)] |
| [(Absorbance of control cells) − (media absorbance)] × 100 |
2.9. Statistical Analysis
All statistical analyses were performed using GraphPad Prism (version 10, 2025). All analyses were presented as the mean ± the standard error of the mean (SEM). To analyze any differences between two or more independent experimental groups, a one-way analysis of variance (ANOVA) was used at a 95% confidence level, followed by Fisher’s uncorrected LSD post hoc test. Statistical significance was denoted using asterisks, wherein p<0.05, unless otherwise stated.
3. Results
3.1. E1S Binding GPER Induces Sialidase Activity
A novel crosstalk between neuraminidase-1 (Neu-1) and matrix metalloproteinase-9 (MMP-9) was reported to be in alliance with the GPCR neuromedin B (NMBR), which is essential for ligand-induced receptor tyrosine kinase (RTK) activation and cellular signaling [39]. It is noteworthy to determine whether binding of E1S to GPER on the cell surface can induce downstream signaling via conformational changes in the signaling paradigm depicted in Figure 1.
Here, live MDA-MB-231 triple negative breast (TNBC) cancer cells were added to epidermal growth factor (EGF, 30 µg/mL) and different concentrations (50, 10, 1, and 0.1 nM) of E1S, or untreated, together with sialidase substrate 4-MUNANA (emission 450 nm, excitation 365 nm) for 1 min (Figure 2A and B). Phase-contrast images showed cells, while fluorescent blue images revealed sialidase activity surrounding the live cells. The data revealed that the control, untreated live cells had negligible, low sialidase activity compared with the positive control EGF treated cells and the treated cells with E1S (p < 0.0001). The treated cells with E1S induced sialidase activity, suggesting that sialidase activity is as the result of E1S binding to its GPER receptor forming a heteromer complex with GPCR NMBR-MMP9-Neu-1 signaling platform, as depicted in Figure 1. To test this hypothesis, we investigated whether oseltamivir phosphate (OP), MMP9 (MMP9i) and NMBR (BIM23) would inhibit E1S-induced Neu-1 sialidase activity. The data depicted in Figure 2C and D provide support of the hypothesis where the addition of OP, MMP9i, and BIM23 to E1S-treated cells significantly blocked the sialidase activity induced by the E1S. Notably, OP and MMP9i decreased E1S-induced sialidase activity to the levels lower than the untreated control (Figure 2D). The inhibitors alone did not have cytotoxic effects on the cells (Figure 2C, D). In addition, all the phase contrast images showed confluent live cell images. These findings support the hypothesis that the NMBR-MMP-9-Neu1 signaling platform regulates E1S-induced glycosylated RTK receptors, as depicted in Figure 1. TNBC MDA-MB-231 breast cancer cells lack estrogen, progesterone, and HER2 receptors. The G-protein-coupled estrogen receptor (GPER) is expressed in MDA-MB-231 cells and is a potential therapeutic target [40]. It is highly aggressive, invasive, and mesenchymal-like. On the other hand, MCF-7 breast cancer cells are sensitive to estrogen (E2), which promotes their proliferation. MCF-7 cells (ER-positive breast cancer) also express the G protein-coupled estrogen receptor (GPER/GPR30), which plays a complex, often paradoxical, role in cancer progression [41]. Here, we investigated whether GPER/GPR30, a GPCR implicated in E1S receptor binding, is involved in the Neu-1-MMP-9-GPCR crosstalk in MCF-7 cells. Live MCF-7 cancer cells were incubated with different concentrations (250, 125, 62.5, and 31.25 µg/mL) of E1S or untreated, together with the sialidase substrate 4-MUNANA (emission 450 nm, excitation 365nm) for 1 min (Figure 3A). Interestingly, E1S induced sialidase activity in MCF-7 cells, which was significantly inhibited by BIM23, MMP9i, and OP (Figure 3A, B).
Jiang et al. [42] recently reported a disproportionate rise in the incidence of pancreatic cancer in younger women, which was predominantly attributed to pancreatic ductal adenocarcinoma (PDAC) and less to pancreatic neuroendocrine tumors (PanNET). To this end, we investigated the effects of E1S-induced sialidase activity on PANC-1 pancreatic cancer cells, a human pancreatic ductal adenocarcinoma cell line. PANC-1 cells also express both ERα and GPER1, and studies have shown that GPER activation in pancreatic cancer cells, including PANC-1, can inhibit proliferation [43,44]. Here, we investigated whether E1S receptor binding on PANC-1 cells is implicated in the Neu-1-MMP-9-GPCR crosstalk. Live PANC-1 cancer cells were added to different indicated concentrations of E1S or untreated, together with sialidase substrate 4-MUNANA (emission 450 nm, excitation 365nm) for 1 min (Figure 4A). Interestingly, E1S induced sialidase activity in PANC-1 cells, and this activity was significantly inhibited by BIM23, MMP9i, and OP (Figure 4A, B).
3.2. GPER Receptor Co-Localizes with Neu1 on the Cell Surface of Naïve Unstimulated MDA-MB-231, MCF-7, and Less with PANC-1 Cells
Filardo et al. [45] reported that estrogen action requires GPER (GPR30) to release pro-heparan-bound EGF from the cell membrane surface via Gβγ-subunit-dependent transactivation of the epidermal growth factor receptor (EGFR). We have reported that EGFR receptors are regulated by the molecular organizational signaling platform of Neu1 and MMP-9 crosstalk in alliance with GPCR on the cell surface [46] as well as with neurotrophin factor-induced TrkA [47], insulin [33,35,39,48], and Toll-like (TLR) [49,50] for receptor activation and cellular signaling. Here, we investigated whether GPER forms a complex with the signaling platform of Neu1 and MMP-9, in alliance with the NMBR GPCR, at the cell surface. As depicted in Figure 5, GPER receptors co-localize with Neu-1 in naïve MDA-MB-231 and MCF-7 breast cancer cells, but to a lesser extent in PANC-1 pancreatic cancer cells. Here, we used the Pearson correlation coefficient, which measures the linear association between two variables. The degree of convergence was quantitatively analyzed using the Pearson correlation coefficient, where r = 0.70–0.89 indicates a strong correlation and r = 0.9–1.00 indicates a very strong linear correlation [51]. The Pearson correlation coefficient for GPER-Neu-1 colocalization was 0.7874 for MDA-MB-231 (Figure 5C), 0.8037 for MCF-7 (Figure 5F), and 0.3865 for PANC-1 cells (Figure 5I), affirming GPER-Neu-1 receptor proximity. These findings suggest spatial proximity between GPER and Neu1, supporting their interaction in the proposed signaling platform depicted in Figure 1.
The data in Figure 5 provide support for E1S GPER receptors involved in the proposed biased GPCR NMBR-MMP9-Neu-1 signaling paradigm as depicted in Figure 1. Interestingly, E1S GPER receptors co-localizing with Neu-1 may be also poised to assume biased active states involving receptor tyrosine kinases (RTKs) and Toll-like receptors (TLRs), with subsequent NF-kB activation. Regulation of these GPER-active states may be mediated by endogenous E1 binding to orthosteric or distinct allosteric sites [15], leading to distinct functional selectivity or ‘biased agonism.’ These results provide novel molecular insights into the intricate heteromer GPER interaction with other GPCR receptors at the resting state. This intriguing concept of GPER forming heteromers with different GPCRs underscores biased agonism, particularly through distinct receptor-G protein coupling [15,25].
3.3. E1S Significantly Alters Cancer Cell Phenotype to Induce Tunneling Nanotubes (TNTs) in MDA-MB-231 Cells
To assess the phenotypic impact of E1S on cancer cells, we investigated its ability to form tunneling nanotubes (TNTs) at 10 nM in MDA-MB-231 cells after 24 h in culture. We performed an assay using a CellMask membrane stain with an excitation of 554 nm. The results indicate that treating MDA-MB-231 cells with E1S (10nM) significantly decreased the density of cellular projections compared to the untreated control (Figure 6A and B, TNT images). Treating MDA-MB-231 cells with E1S (50nM) resulted in a marked but not significant decrease in the density of cellular projections compared to the untreated control (Figure 6A and 6 B, TNT images). The increase in the number of cellular projections can also be visualized in Figure 1C and D (TNT images). Following E1S and 300 ug/mL OP treatment, small, thin projections form between neighboring cells and over longer distances, with a significant decrease in TNTs (Figure 6). Additionally, OP treatment alone did not significantly affect the cell phenotype (Figure 6E, F).
3.3. E1S Increases Epithelial and Decreases Mesenchymal Markers in MDA-MB-231 and MCF-7 Breast Cancer Cells
The sialidase and colocalization assays aim to determine whether E1S employs the proposed GPER/NMBR/MMP9/Neu1 signaling axis in MDA-MB-231 and MCF-7 cells. Collectively, the findings from the sialidase and colocalization assays suggest that E1S may interact with GPER to induce sialidase activity in a manner dependent on NMBR, MMP9, and Neu1. To assess the effect of GPER/NMBR/MMP/Neu1 signaling on cellular behaviors associated with cancer progression, an epithelial-mesenchymal transition (EMT) assay was performed. As seen in Figure 7 (A, B), the treatment of MDA-MB-231 cells with E1S (10 nM) for 24 h significantly increased E-cadherin, which is associated with an epithelial, less invasive cellular phenotype. Conversely, E1S (10 nM) treatment for 24 h significantly decreased the expression of N-cadherin and vimentin, cell markers commonly associated with a mesenchymal, pro-migratory cellular phenotype.
As shown in Figure 7 (C, D), treatment of MCF-7 cells with E1S (10 nM) for 24 h resulted in a slight, non-significant increase in E-cadherin. Conversely, E1S (10 nM) treatment for 24 h significantly decreased the expression of N-cadherin and vimentin, cell markers commonly associated with a mesenchymal, pro-migratory cellular phenotype.
3.4. E1S Induces Upregulation of the NF-kB Pathway in RAW-BlueTM Reporter Cells
To determine the mechanism(s) of E1S-induced EMT in MDA-MB-231 and MCF-7 breast cancer cells, we investigated its effect on nuclear factor-κB (NF-κB) signaling. Estrone (E1) is the dominant estrogen following menopause, and it has been shown to play a significant role in promoting EMT in ER+ cancers. E1 induces pro-metastatic gene expression, increases inflammatory responses, and promotes the conversion of epithelial cells into mobile, invasive mesenchymal cells [13]. This finding elegantly supports the conceptual framework by proposing that the biased E1 GPER-NMBR-Neu1-MMP9 signaling platform, as depicted in Figure 1, is activated by NF-kB [53], which is implicated in the upregulation of EMT markers and metastasis.
To test whether E1S GPER-NMBR-Neu1-MMP9 signaling platform induces the downstream NF-kB activity, we used a mouse macrophage reporter cell line (RAW-Blue™ cells) that stably expresses a secreted embryonic alkaline phosphatase (SEAP) gene inducible by the NF-kB and activator protein-1 (AP-1) transcription factors. AP-1 regulates the expression of genes in response to various stimulus, such as cytokines, growth factors, stress, and bacterial and viral infections. Activated RAW-Blue™ cells secret SEAP, which is detectable and quantifiable with QUANTI-Blue™, a SEAP detection medium. The data in Figure 8 (B and C) clearly demonstrate that E1S-treated RAW-Blue™ cells induced SEAP secretion which was inhibited by BIM-23, MMP-9i, and OP, and, therefore, reduced NF-kB activity compared to E1S alone. To confirm that RawBlue cells have an active SEAP reporter, lipopolysaccharide (LPS) treated cells induced SEAP activity (Figure 8A).
Qureshi et al. [13] have reported that estrone (E1), the primary estrogen in postmenopausal women, drives ER+ breast cancer metastasis by promoting EMT. Produced largely in adipose tissue, E1 stimulates cancer cell invasion and acts as a pro-inflammatory agent to accelerate metastasis, particularly in obese, postmenopausal individuals. Bergers and Fendt [52] reported that metastasizing cancer cells can surreptitiously adapt their metabolic activity during their metastatic invasion. Gorski et al. [53] reported that cyclin E1 affects cancer metabolism and is significantly associated with chemoresistance. By initiating invasion-related communications, cancer cells can rewire their metabolism to promote proliferation and migration and to counter metabolic stress during progression [54]. During this reprogramming process, cancer cells’ metabolism and other cellular activities are integrated and mutually regulated by tunneling nanotube (TNT) communication, thereby altering specific metabolic drivers of tumor growth and progression [25,54].
To this end, we investigated the metabolic activity of MDA-MB-231 cells following E1S treatment. E1S treatment did not affect cell viability and metabolic activity in MDA-MB-231 cells, as assessed by the AlamarBlue assay in a dose-dependent manner (Figure 9). Additionally, cell viability remained at 80–95% with E1S treatment, similar to that in the untreated control, indicating that E1S did not cause nonspecific cell death.
3.5. E1S Inhibited the Migratory Potential of Breast MDA-MB-231, MCF-7, and Pancreatic PANC-1 Cancer Cells in a Scratch Wound Assay
The data in Figure 7 clearly demonstrate that E1S significantly reduced the expression of the invasive EMT markers N-cadherin and vimentin in MB-231 cells after 24 h of exposure. These observations suggest that E1S may also affect the migratory potential of these cancer cells. The data in Figure 10 depict the migratory rate of E1S from the scratch wound area over 24 h. The untreated MDA-MB-231 control cells showed near-complete wound closure at 2.88 ± 0.48 μm/h within 24 h (Figure 10A, B). In contrast, the wound closure rate in E1S-treated MDA-MB-231 cells was significantly inhibited at 0.1, 1, 10, and 50 nM, with inhibition occurring within 24 h. These data suggest that E1S significantly inhibited the migration of MDA-MB-231 cancer cells, potentially by abrogating EMT-mediated metastasis, as shown in Figure 7.
Similarly, the untreated MCF-7 (Figure 10C, D) control cells showed near-complete wound closure at 19.80 ± 2.26 μm/h within 24 h (Figure 10C). Interestingly, the wound closure rate in E1S-treated MCF-7 cells at the indicated dosages was significantly inhibited compared to untreated control cells, with all effects occurring within 24 h (Figure 10D). Similarly, the wound closure rate for E1S-treated PANC-1 cells (Figure 10E, F) at the indicated dosages was significantly inhibited compared to untreated control cells, with all effects occurring within 24 h (Figure 10F). These data suggest that E1S-treated cells exerted a significant inhibitory effect on the migration and potential invasiveness of MDA-MB-231, MCF-7 breast cancer cells, and pancreatic PANC-1 cancer cells, as these cells had already undergone EMT.
4. Discussion
Fuentes and Silveyra [55] have reviewed the molecular events governing regulation of gene expression via the nuclear estrogen receptors (ERα and ERβ) and the membrane estrogen receptor (GPER1). Estrogen can activate intracellular signaling cascades by interacting with GPER1 and/or ERα and ERβ. In addition, estrogen-mediated signaling events can be divided into genomic and non-genomic events. Genomic effects involve the migration of estrogen receptor complexes into the cell nucleus, while non-genomic effects involve indirect regulation of gene expression via various intracellular signaling pathways. More recently, the non-genomic effects of estrogen involve a new type of estrogen-binding protein, the G protein-coupled estrogen receptor-1 (GPER1), or membrane estrogen receptor [55].
GPCRs comprise the largest family of cell-surface signal-transduction molecules in mammalian cells. They have long been implicated in the transactivation of RTKs in the absence of respective growth factors, particularly for the receptors that bind epidermal growth factor, platelet-derived growth factors, fibroblast growth factor, and neurotrophins [56]. Delcourt and colleagues provide an eloquent review of the molecular mechanisms underlying this novel cross-communication between GPCRs and RTKs [57]. Reciprocally, growth factor signaling through RTKs also utilizes GPCR signaling molecules to initiate the molecular signaling platform underlying a novel Neu1-MMP-9 crosstalk in alliance with RTK on the cell surface. We identified this novel GPCR-signaling platform as critically essential for neurotrophin factor-induced TrkA [48], insulin [34,36,40,49], and Toll-like receptor (TLR) [50,51] receptor activation and cellular signaling. These findings have revealed a novel concept in which GPCR activation is essential for growth-factor RTK and pathogen-sensing TLR activation. The mechanism(s) here involves the formation of a functional signaling complex between the GPCR-RTK and GPCR-TLR partners.
Here, we provide novel evidence that estrone (E1S) significantly and dose-dependently induces sialidase activity in live MDA-MB-231, MCF-7, and PANC-1 cancer cells in vitro (Figure 2, Figure 3 and Figure 4). To support our hypothesis that E1S induces Neu-1 specifically, we used three specific Neu-1 inhibitors, BIM-23127, MMP-9i, and OP, and found sialidase activity to be blocked. Moreover, these findings support our proposed signaling paradigm (Figure 1), in which E1S-binding GPER induces crosstalk between NMBR, MMP9, and Neu-1 sialidase. To confirm these results, a colocalization assay was used to determine E1S GPER’s proximity to Neu-1 on the cell surface. The results firmly established that E1S GPER and Neu-1 form a complex, supporting our hypothesis. The results of the colocalization assay indicate strong-to-very strong colocalization between GPER and Neu1. By triangulating the close spatial proximity between GPER and Neu1 observed in the colocalization assay with the pathway dependence observed in inhibitor-sensitive sialidase assays, the functional interaction between GPER and Neu1 is presumed in the NMBR/MMP9/Neu1 signaling paradigm [58]. However, the physical interaction between GPER and Neu1 can only be inferred from colocalization and cannot be confirmed without additional assays such as co-immunoprecipitation. Alternatively, bioluminescence resonance energy transfer (BRET) can facilitate visualization of protein interactions in living cells [59]. BRET imaging relies on a luminescent donor that transfers energy to an acceptor molecule, the fluorescence acceptor, under permissive distances (<10 nm) and proper orientations [116]. Moreover, given the contentious localization of GPER, a time-course analysis with additional cell-type markers may yield intriguing and valuable results [68,81].
Previous studies have highlighted Neu-1’s role in tumorigenesis and metastasis [39]. We hypothesized that E1S affects the expression of EMT markers, including E-cadherin, vimentin, and N-cadherin, involving the NMBR-MMP9-Neu1 signaling paradigm. The data depicted in Figure 7 clearly demonstrate that E1S increases the epithelial E-cadherin marker and decreases the mesenchymal vimentin and N-cadherin markers in MDA-MB-231 and MCF-7 breast cancer cells. Currently, the literature on GPER suggests that its functional consequences in TNBC are highly context-dependent and variable [23,60]. Some studies report that GPER is involved in pro-cancerous pathways, whereas other groups report that activation may inhibit breast cancer proliferation [23,60]. Importantly, the pro-adhesive phenotype observed does not contradict previous findings, given the novelty of the present research and the potential E1S agonism of GPER in breast cancer cells.
To further elaborate on the observed findings from the EMT assays, we found that E1S shifted the pro-migratory phenotype of MDA-MB-231 cells into a more epithelial, less invasive phenotype through upregulating E-cadherin and downregulating N-cadherin and vimentin (Figure 10). EMT typically involves a loss of adhesion molecules, such as E-cadherin, and a concomitant upregulation of mesenchymal markers, including N-cadherin and vimentin [61]. In particular, elevated vimentin expression is associated with aggressive phenotypes and poorer prognoses in invasive breast cancer, especially in TNBC [61,62]. However, the paradoxical role of E-cadherin has also been reported [61]. It is generally assumed that E-cadherin is uniformly lost during breast cancer invasion; however, histological findings indicate that several solid tumor types retain E-cadherin expression, and most metastatic carcinomas collectively invade from the primary tumor [61]. For instance, in a retrospective observational study, high E-cadherin expression and vimentin expression were associated with decreased recurrence-free survival (RFS) and overall survival (OS) [61]. Therefore, hybrid EMT states are associated with particularly invasive cancers [61,62]. This observation may be attributable to the precise combinatorial expression pattern of specific EMT markers, which influence the extent of cell migration and metastasis [61,62]. Notably, in this study, vimentin expression decreased alongside N-cadherin, whereas E-cadherin expression increased with E1S treatment at different dosages. This expression profile may be associated with the decreased cell migration we observed in scratch wound assays following E1S treatment (Figure 10).
Nevertheless, when interpreting EMT and scratch wound data, an important consideration is our consistent use of 2D cell culture models, which do not fully replicate the in vivo environment [63]. For instance, 2D models exhibit altered cell polarity and phenotypic diversity that do not mimic the natural tumor architecture [63]. As such, conducting further experiments in 3D culture models and animal models, despite potential challenges with reproducibility and interpretation, may increase the translation ability of the findings to in vivo environments [63].
Another phenotypic alteration observed in the present study was a decrease in tunneling nanotube formation in response to E1S stimulation. This lack of tunneling nanotube formation may correlate with a more epithelial, less invasive cellular phenotype. However, a direct causal relationship between tunneling nanotube formation and EMT marker expression cannot be established unless EMT markers are monitored in parallel with direct inhibition of tunneling nanotube formation, such as through pharmacological targeting of the tunneling nanotube F-actin core [64,65].
Nevertheless, more broadly, the observed increases in E-cadherin expression, alongside reductions in N-cadherin, vimentin, and tunneling nanotube expression, may be conventionally associated with the attenuation of NF-κB- and AP-1-dependent transcriptional mechanisms. However, E1S stimulation was associated with increased SEAP activity, suggestive of increased NF-κB/AP-1 transcription, which may appear paradoxical. It is hypothesized that E1S may elicit a temporally constrained or context-dependent NF-κB/AP-1 transcriptional response, possibly mediated by rapid, non-genomic GPER signaling. This transient, biased E1S-mediated activation may support specific transcriptional patterns and the co-activation of alternative pathways, enabling limited proliferative and survival programs without attaining the signaling amplitude or duration required to drive EMT and invasion.
Metastasizing cancer cells can surreptitiously adapt to their metabolic activity during their invasion by inducing EMT markers. Cancer cells can initiate communication pathways that facilitate invasion and reprogram cellular activities. During this reprogramming process, cancer cells’ metabolism and other cellular activities are integrated and mutually regulated through tunneling nanotube communication, thereby altering specific metabolic drivers of tumor growth and progression. One critical aspect of cancer progression is cell viability. Understanding cell viability is crucial in cancer research, as it affects cell proliferation, growth, and metastasis, and helps determine the efficacy of potential therapeutics [28,31]. The AlamarBlue assay found that E1S did not affect cell viability in the MDA-MB-231 cell line (Figure 9). An important finding in these experiments is that BIM-23, MMP-9i, and OP did not affect cell viability compared with untreated controls. These findings are noteworthy because they indicate that E1 did not affect cancer cell viability. Moreover, it indicates that E1S has no effect on viability or metabolic functional drivers, but blocks invasion-related communication by activating Neu-1.
Altogether, these findings support a novel model in which E1S engages rapid, non-genomic, functionally biased GPER signaling to promote transient NF-κB and AP-1 activity. The resulting response, with constrained amplitude and duration, is consistent with the observed decrease in tunneling nanotubes, the upregulation of epithelial markers, and the suppression of mesenchymal markers. Therefore, E1S-induced GPER activation may enable precise control of NF-κB and AP-1 activity, which fail to match the sustained signaling threshold required to drive EMT, cancer cell migration, and tunneling nanotube formation. These observations highlight the importance of acknowledging dynamic, temporal signaling mechanisms in determining downstream cellular outcomes.
5. Limitations
While the study provides novel insights into the role of E1S-mediated signaling in sialidase activity, EMT phenotypes, tunneling nanotube behavior, and SEAP activity, several limitations should be considered. For instance, E1S was the only agonist used. To better reflect the physiological relevance of GPER, a broader range of agonists should be used. Furthermore, although breast and pancreatic cancer cells were used, no GPER antagonists were used in this study. Similarly, the use of 3D culture systems in vivo models may more accurately recapitulate the complex interplay of factors present in the TME.
6. Conclusions
The role of ovarian hormones in modulating the progression of breast cancers has been purported since 1895 [66]. However, the role of weaker estrogens, such as E1 in its predominant storage form, E1S, and their respective signaling pathways has been understudied. Using sialidase and colocalization assays, the present study found that E1S promotes biased GPER signaling via the NMBR/MMP9/Neu1 pathway in MDA-MB-231, MCF-7, and PANC-1 cells. In the TNBC cell line, E1S treatment increased E-cadherin and decreased N-cadherin and vimentin. Exposure to E1S also decreased the density of tunneling nanotubes, suggesting reduced intercellular communication and reduced transmission of materials conducive to metastasis.
However, despite the observed shift toward a more epithelial phenotype and reduced tunneling nanotube projections, SEAP activity increased. This apparently paradoxical increase in SEAP activity and concomitant reduction of pro-migratory characteristics may be explained through temporal, dynamic signaling wherein the weak, conjugated E1 hormone, E1S, transiently activates NF-κB and AP-1 through the fast-acting GPER in a manner that is too modest in duration and magnitude to drive EMT, cellular migration, and intercellular communication. Therefore, altogether, these findings suggest that signaling through GPER and NMBR/MMP9/Neu1 is biased, with the effects on cellular behavior dependent on the strength and duration of the activating ligand. This biased signaling may be leveraged to treat breast and pancreatic cancers, wherein ligands of varying strengths, such as E1S, and their downstream signaling mechanisms can be investigated and exploited to mitigate cancer progression.
Author Contributions
Conceptualization, I.W. Y.L. and M.R.S.; Methodology, I.W. Y.L. and M.R.S.; Software, I.W. Y.L. and M.R.S.; Validation, I.W. Y.L. and M.R.S.; Formal analysis, I.W. Y.L. and M.R.S.; Investigation, I.W. Y.L. and M.R.S.; Resources, M.R.S.; Data curation, I.W. Y.L. and M.R.S.; Writing—original draft, I.W. Y.L. and M.R.S.; Writing—review & editing, I.W. Y.L. and M.R.S.; Visualization, I.W. Y.L. and M.R.S.; Supervision, M..R.S.; Project administration, M.R.S.; Funding acquisition, M.R.S. All authors have read and agreed to the published version of the manuscript.
Funding
This work was supported by grants to M.R.S. from the Natural Sciences and Engineering Research Council of Canada (NSERC) Grant # RGPIN-2020-03869 and NSERC Alliance COVID-19 Grant # ALLRP-550110–20. The APC was funded by NSERC Grant # RGPIN 2020-3869. The funder(s) had no role in study design, data collection and analysis, decision to publish, or preparation of the manuscript.
Institutional Review Board Statement
Not applicable.
Informed Consent Statement
Not applicable.
Data Availability Statement
All data needed to evaluate the paper’s conclusions are present. The preclinical data sets generated and analyzed during the current study are not publicly available but can be obtained from the corresponding author upon reasonable request. The data will be provided following the review and approval of a research proposal, Statistical Analysis Plan, and execution of a Data Sharing Agreement. The data will be accessible for 12 months for approved requests, subject to possible extensions; contact szewczuk@queensu.ca for more information on the process or to submit a request.
Acknowledgments
IW is the recipient of the Graduate Research Fellowship, Faculty of Health Sciences Graduate Fund, Learning Track Excellence Award: Global and Population Health, Dean’s Honour List (2021-2024), Dean’s Honour List with Distinction (2021), and the Principal’s Scholarship (2020). YL is the recipient of the 2022–2023 Dean’s Honor List, the E.D. Merkley Prize in Mathematics, and the M.C. Urquhart Book Prize in Economics. All authors have read and agreed to the published version of the manuscript. All authors acknowledge the educational and scholarly alliance of the Graduate Program in Experimental Medicine and the Health Sciences.
Conflicts of Interest
none.
List of Abbreviations and Symbols
| 4-MU | 4-methylumbelliferone. |
| 4-MUNANA | 2-(4-methylumbelliferyl)-α-D-N-acetylneuraminic acid. |
| AC | Adenylyl cyclase. |
| Akt | Protein kinase B. |
| ANOVA | One-way analysis of variance |
| AP-1 | Activator protein-1. |
| Bcl-2 | B-cell lymphoma 2. |
| BRCA1 | Breast cancer type 1 susceptibility gene |
| BRCA2 | Breast cancer type 2 susceptibility gene. |
| BRET | Bioluminescence-based resonance energy transfer. |
| BSA | Bovine serum albumin. |
| cAMP | Cyclic adenosine monophosphate. |
| E-cadherin | Epithelial cadherin. |
| E1 | Estrone. |
| E1S | Estrone sulfate. |
| E2 | Estradiol. |
| E3 | Estriol. |
| E4 | Estetrol. |
| EBP | Elastin-binding protein |
| EGF | Epidermal growth factor. |
| EMT-ATFs | EMT-activating transcription factors. |
| EMT | Epithelial-to-mesenchymal. |
| ER | Estrogen receptor. |
| ERK1/2 | Extracellular signal-regulated kinases 1/2. |
| ERα | Estrogen receptor α |
| ERβ | Estrogen receptor β. |
| EZH2 | Enhancer of Zeste Homolog 2 |
| GPCR | G protein-coupled receptor. |
| GPER | G protein-coupled estrogen receptor |
| GPR30 | Orphan G protein-coupled receptor |
| GRK | G protein-coupled receptor kinase. |
| HB-EGF | Heparin-binding epidermal growth factor. |
| EGFR | Human epidermal growth factor receptor. |
| HER2 | Human epidermal growth factor receptor 2. |
| HSD17B1 | 17β-hydroxysteroid dehydrogenases 1. |
| HSD17B2 | 17β-hydroxysteroid dehydrogenases 2. |
| IGF-1 | Insulin-like growth factor-1. |
| IGF-R1 | Insulin-like growth factor receptor-1. |
| IKK | IκB kinase. |
| IL-8 | Interleukin-8. |
| IM | immunomodulatory. |
| IR | Insulin receptor. |
| IRα | Insulin receptor α. |
| IκB | Inhibitor of κB. |
| LBD | Ligand binding domain. |
| LPA | Lysophosphatidic acid. |
| LPS | Lipopolysaccharide. |
| MAPK | Mitogen-activated protein kinase. |
| MMP | Matrix metalloproteinase. |
| MMP9 | Matrix metalloproteinase 9 MMP9i: MMP9 inhibitor. |
| MSL | Mesenchymal stem-like. |
| mTOR | Mammalian target of rapamycin. |
| N-cadherin | Neural cadherin. |
| Neu1 | Neuraminidase 1. |
| NF-κB | Nuclear factor-κB |
| NMB | Neuromedin. |
| NMBR | Neuromedin B receptor |
| OP | Oseltamivir phosphate. |
| OS | Overall survival. |
| PBS | Phosphate-buffered saline. |
| PD-1 | Programmed cell death protein |
| PD-L1 | Programmed death-ligand 1 |
| PDGF | Platelet-derived growth factor |
| PFA | Paraformaldehyde. |
| PI3K | Phosphoinositide 3-kinase. |
| PIK3CA | Phosphatidylinositol 4,5-bisphosphate 3-kinase catalytic subunit alpha. |
| PIP2 | Phosphatidylinositol 4,5-bisphosphate |
| PIP3 | Phosphatidylinositol 3,4,5-trisphosphate. |
| PKA | Protein kinase A. |
| PKC | Protein kinase C. |
| PPCA | Protective protein cathepsin A. |
| PR | Progesterone receptor. |
| RB1 | Retinoblastoma. |
| RKIP | Raf-1 kinase protein inhibitor. |
| RTK | Receptor tyrosine kinase. |
| SEAP | Secreted embryonic alkaline phosphatase. |
| SG | Sacituzumab govitecan. |
| STS | Estrogen sulfatase |
| TBS | Tris-buffered saline. |
| TBST | Tween-20 in Tris-buffered saline |
| TGF-β | Transforming growth factor-β. |
| TLR | Toll-like receptor. |
| TNBC | Triple-negative breast cancer |
| TNF-α | Tumor necrosis factor-α |
| TP53 | Tumor protein p53. |
| TrkA | Tropomyosin receptor kinase A. |
| VEGF | Vascular endothelial growth factor. |
| ZEB1/2 | Zinc finger E-box binding homeobox 1/2. |
References
- Al-Shami, K.; Awadi, S.; Khamees, A.a.; Alsheikh, A.M.; Al-Sharif, S.; Ala’ Bereshy, R.; Al-Eitan, S.F.; Banikhaled, S.H.; Al-Qudimat, A.R.; Al-Zoubi, R.M.; et al. Estrogens and the risk of breast cancer: A narrative review of literature. Heliyon 2023, 9, e20224. [Google Scholar] [CrossRef] [PubMed]
- Kim, J.; Munster, P.N. Estrogens and breast cancer. Ann. Oncol. 2025, 36, 134–148. [Google Scholar] [CrossRef] [PubMed]
- Berliere, M.; Coche, M.; Lacroix, C.; Riggi, J.; Coyette, M.; Coulie, J.; Galant, C.; Fellah, L.; Leconte, I.; Maiter, D.; et al. Effects of Hormones on Breast Development and Breast Cancer Risk in Transgender Women. Cancers 2022, 15, 245. [Google Scholar] [CrossRef] [PubMed]
- Treeck, O.; Schüler-Toprak, S.; Ortmann, O. Estrogen Actions in Triple-Negative Breast Cancer. Cells 2020, 9, 2358. [Google Scholar] [CrossRef] [PubMed]
- Zhang, D.; Chen, H.; Wang, J.; Ji, J.; Imam, M.; Zhang, Z.; Yan, S. Current progress and prospects for G protein-coupled estrogen receptor in triple-negative breast cancer. Front. Cell Dev. Biol. 2024, 12. [Google Scholar] [CrossRef] [PubMed]
- Corti, C.; Binboğa Kurt, B.; Koca, B.; Rahman, T.; Conforti, F.; Pala, L.; Bianchini, G.; Criscitiello, C.; Curigliano, G.; Garrido-Castro, A.C.; et al. Estrogen Signaling in Early-Stage Breast Cancer: Impact on Neoadjuvant Chemotherapy and Immunotherapy. Cancer Treat. Rev. 2025, 132, 102852. [Google Scholar] [CrossRef] [PubMed]
- Sellitto, A.; D’Agostino, Y.; Alexandrova, E.; Lamberti, J.; Pecoraro, G.; Memoli, D.; Rocco, D.; Coviello, E.; Giurato, G.; Nassa, G.; et al. Insights into the Role of Estrogen Receptor β in Triple-Negative Breast Cancer. Cancers 2020, 12, 1477. [Google Scholar] [CrossRef] [PubMed]
- van Barele, M.; Heemskerk-Gerritsen, B.A.M.; Louwers, Y.V.; Vastbinder, M.B.; Martens, J.W.M.; Hooning, M.J.; Jager, A. Estrogens and Progestogens in Triple Negative Breast Cancer: Do They Harm? Cancers 2021, 13, 2506. [Google Scholar] [CrossRef] [PubMed]
- Harding, A.T.; Heaton, N.S. The Impact of Estrogens and Their Receptors on Immunity and Inflammation during Infection. Cancers 2022, 14, 909. [Google Scholar] [CrossRef] [PubMed]
- Hamilton, K.J.; Hewitt, S.C.; Arao, Y.; Korach, K.S. Estrogen Hormone Biology. Curr. Top. Dev. Biol. 2017, 125, 109–146. [Google Scholar] [CrossRef] [PubMed]
- Gérard, C.; Arnal, J.-F.; Jost, M.; Douxfils, J.; Lenfant, F.; Fontaine, C.; Houtman, R.; Archer, D.F.; Reid, R.L.; Lobo, R.A.; et al. Profile of estetrol, a promising native estrogen for oral contraception and the relief of climacteric symptoms of menopause. Expert Rev. Clin. Pharmacol. 2022, 15, 121–137. [Google Scholar] [CrossRef] [PubMed]
- Cui, J.; Shen, Y.; Li, R. Estrogen synthesis and signaling pathways during ageing: from periphery to brain. Trends Mol. Med. 2013, 19, 197–209. [Google Scholar] [CrossRef] [PubMed]
- Qureshi, R.; Picon-Ruiz, M.; Sho, M.; Van Booven, D.; Nunes de Paiva, V.; Diaz-Ruano, A.B.; Ince, T.A.; Slingerland, J. Estrone, the major postmenopausal estrogen, binds ERa to induce SNAI2, epithelial-to-mesenchymal transition, and ER+ breast cancer metastasis. Cell Rep. 2022, 41, 111672. [Google Scholar] [CrossRef] [PubMed]
- Davis, S.R.; Martinez-Garcia, A.; Robinson, P.J.; Handelsman, D.J.; Desai, R.; Wolfe, R.; Bell, R.J. Estrone Is a Strong Predictor of Circulating Estradiol in Women Age 70 Years and Older. J. Clin. Endocrinol. Metab. 2020, 105, e3348–e3354. [Google Scholar] [CrossRef] [PubMed]
- Jeyakumar, M.; Carlson, K.E.; Gunther, J.R.; Katzenellenbogen, J.A. Exploration of Dimensions of Estrogen Potency. J. Biol. Chem. 2011, 286, 12971–12982. [Google Scholar] [CrossRef] [PubMed]
- Jie, H.; Ma, W.; Huang, C. Diagnosis, Prognosis, and Treatment of Triple-Negative Breast Cancer: A Review. Breast Cancer (Dove Med Press) 2025, 17, 265–274. [Google Scholar] [CrossRef] [PubMed]
- Diaz-Ruano, A.B.; Martinez-Alarcon, N.; Perán, M.; Benabdellah, K.; Garcia-Martinez, M.d.l.Á.; Preda, O.; Ramirez-Tortosa, C.; Gonzalez-Hernandez, A.; Marchal, J.A.; Picon-Ruiz, M. Estradiol and Estrone Have Different Biological Functions to Induce NF-κB-Driven Inflammation, EMT and Stemness in ER+ Cancer Cells. Int. J. Mol. Sci. 2023, 24, 1221. [Google Scholar] [CrossRef] [PubMed]
- Schneider, J.; Huh, M.M.; Bradlow, H.L.; Fishman, J. Antiestrogen action of 2-hydroxyestrone on MCF-7 human breast cancer cells. J. Biol. Chem. 1984, 259, 4840–4845. [Google Scholar] [CrossRef]
- Bradlow, H.L.; Telang, N.T.; Sepkovic, D.W.; Osborne, M.P. 2-hydroxyestrone: the ‘good’ estrogen. J. Endocrinol. 1996, 150 Suppl, S259–265. [Google Scholar] [CrossRef]
- Gilligan, L.C.; Rahman, H.P.; Hewitt, A.-M.; Sitch, A.J.; Gondal, A.; Arvaniti, A.; Taylor, A.E.; Read, M.L.; Morton, D.G.; Foster, P.A. Estrogen Activation by Steroid Sulfatase Increases Colorectal Cancer Proliferation via GPER. J. Clin. Endocrinol. Metab. 2017, 102, 4435–4447. [Google Scholar] [CrossRef] [PubMed]
- Xu, Y.; Liu, X.; Guo, F.; Ning, Y.; Zhi, X.; Wang, X.; Chen, S.; Yin, L.; Li, X. Effect of estrogen sulfation by SULT1E1 and PAPSS on the development of estrogen-dependent cancers. Cancer Sci. 2012, 103, 1000–1009. [Google Scholar] [CrossRef] [PubMed]
- Muir, M.; Romalo, G.; Wolf, L.; Elger, W.; Schweikert, H.-U. Estrone sulfate is a major source of local estrogen formation in human bone. J. Clin. Endocrinol. Metab. 2004, 89, 4685–4692. [Google Scholar] [CrossRef] [PubMed]
- Rezvanpour, A.; Don-Wauchope, A.C. Clinical implications of estrone sulfate measurement in laboratory medicine. Crit. Rev. Clin. Lab. Sci. 2017, 54, 73–86. [Google Scholar] [CrossRef] [PubMed]
- Hilborn, E.; Stål, O.; Jansson, A. Estrogen and androgen-converting enzymes 17β-hydroxysteroid dehydrogenase and their involvement in cancer: with a special focus on 17β-hydroxysteroid dehydrogenase type 1, 2, and breast cancer. Oncotarget 2017, 8, 30552–30562. [Google Scholar] [CrossRef] [PubMed]
- Stricker, R.; Eberhart, R.; Chevailler, M.-C.; Quinn, F.A.; Bischof, P.; Stricker, R. Establishment of detailed reference values for luteinizing hormone, follicle stimulating hormone, estradiol, and progesterone during different phases of the menstrual cycle on the Abbott ARCHITECT analyzer. Clin. Chem. Lab Med. 2006, 44, 883–887. [Google Scholar] [CrossRef] [PubMed]
- Khosla, S.; Atkinson, E.J.; Melton, L.J.; Riggs, B.L. Effects of age and estrogen status on serum parathyroid hormone levels and biochemical markers of bone turnover in women: a population-based study. J. Clin. Endocrinol. Metab. 1997, 82, 1522–1527. [Google Scholar] [CrossRef] [PubMed]
- Vrtačnik, P.; Ostanek, B.; Mencej-Bedrač, S.; Marc, J. The many faces of estrogen signaling. Biochem Med. 2014, 24, 329–342. [Google Scholar] [CrossRef] [PubMed]
- Heldring, N.; Pike, A.; Andersson, S.; Matthews, J.; Cheng, G.; Hartman, J.; Tujague, M.; Ström, A.; Treuter, E.; Warner, M.; et al. Estrogen Receptors: How Do They Signal and What Are Their Targets. Physiol. Rev. 2007, 87, 905–931. [Google Scholar] [CrossRef] [PubMed]
- Dass, S.A.; Tan, K.L.; Selva Rajan, R.; Mokhtar, N.F.; Mohd Adzmi, E.R.; Wan Abdul Rahman, W.F.; Tengku Din, T.; Balakrishnan, V. Triple Negative Breast Cancer: A Review of Present and Future Diagnostic Modalities. Medicina 2021, 57. [Google Scholar] [CrossRef] [PubMed]
- Almansour, N.M. Triple-Negative Breast Cancer: A Brief Review About Epidemiology, Risk Factors, Signaling Pathways, Treatment and Role of Artificial Intelligence. Front Mol. Biosci. 2022, 9, 836417. [Google Scholar] [CrossRef] [PubMed]
- Girgert, R.; Emons, G.; Gründker, C. Inactivation of GPR30 reduces growth of triple-negative breast cancer cells: possible application in targeted therapy. Breast Cancer Res. Treat. 2012, 134, 199–205. [Google Scholar] [CrossRef] [PubMed]
- Abou-Ismail, M.Y.; Sridhar, D.C.; Nayak, L. Estrogen and Thrombosis: a Bench to Bedside Review. Thromb. Res. 2020, 192, 40–51. [Google Scholar] [CrossRef] [PubMed]
- Haxho, F.; Haq, S.; Szewczuk, M.R. Biased G protein-coupled receptor agonism mediates Neu1 sialidase and matrix metalloproteinase-9 crosstalk to induce transactivation of insulin receptor signaling. Cell. Signal. 2018, 43, 71–84. [Google Scholar] [CrossRef] [PubMed]
- Chavez, K.J.; Garimella, S.V.; Lipkowitz, S. Triple Negative Breast Cancer Cell Lines: One Tool in the Search for Better Treatment of Triple Negative Breast Cancer. Breast Dis. 2010, 32, 35–48. [Google Scholar] [CrossRef] [PubMed]
- Haxho, F.; Allison, S.; Alghamdi, F.; Brodhagen, L.; Kuta, V.E.L.; Abdulkhalek, S.; Neufeld, R.J.; Szewczuk, M.R. Oseltamivir phosphate monotherapy ablates tumor neovascularization, growth, and metastasis in mouse model of human triple-negative breast adenocarcinoma. Breast Cancer (Dove Med Press) 2014, 6, 191–203. [Google Scholar] [CrossRef] [PubMed]
- Zhang, Y.; Karki, R.; Igwe, O.J. Toll-like receptor 4 signaling: A common pathway for interactions between prooxidants and extracellular disulfide high mobility group box 1 (HMGB1) protein-coupled activation. Biochem Pharmacol. 2015, 98, 132–143. [Google Scholar] [CrossRef] [PubMed]
- Baghaie, L.; Bunsick, D.A.; Aucoin, E.B.; Skapinker, E.; Yaish, A.M.; Li, Y.; Harless, W.W.; Szewczuk, M.R. Pro-Inflammatory Cytokines Transactivate Glycosylated Cytokine Receptors on Cancer Cells to Induce Epithelial-Mesenchymal Transition to the Metastatic Phenotype. Cancers 2025, 17. [Google Scholar] [CrossRef] [PubMed]
- Qorri, B.; Mokhtari, R.B.; Harless, W.W.; Szewczuk, M.R. Next Generation of Cancer Drug Repurposing: Therapeutic Combination of Aspirin and Oseltamivir Phosphate Potentiates Gemcitabine to Disable Key Survival Pathways Critical for Pancreatic Cancer Progression. Cancers 2022, 14, 1374. [Google Scholar] [CrossRef] [PubMed]
- Haxho, F.; Neufeld, R.J.; Szewczuk, M.R. Neuraminidase-1: a novel therapeutic target in multistage tumorigenesis. Oncotarget 2016, 7, 40860–40881. [Google Scholar] [CrossRef] [PubMed]
- Huang, R.; Li, J.; Pan, F.; Zhang, B.; Yao, Y. The activation of GPER inhibits cells proliferation, invasion and EMT of triple-negative breast cancer via CD151/miR-199a-3p bio-axis. Am. J. Transl. Res. 2020, 12, 32–44. [Google Scholar] [PubMed]
- Vo, D.H.; Hartig, R.; Weinert, S.; Haybaeck, J.; Nass, N. G-Protein-Coupled Estrogen Receptor (GPER)-Specific Agonist G1 Induces ER Stress Leading to Cell Death in MCF-7 Cells. Biomolecules 2019, 9. [Google Scholar] [CrossRef] [PubMed]
- Jiang, Y.; Abboud, Y.; Liang, J.; Larson, B.; Osipov, A.; Gong, J.; Hendifar, A.E.; Atkins, K.; Liu, Q.; Nissen, N.N.; et al. The Disproportionate Rise in Pancreatic Cancer in Younger Women Is Due to a Rise in Adenocarcinoma and Not Neuroendocrine Tumors: A Nationwide Time-Trend Analysis Using 2001-2018 United States Cancer Statistics Databases. Cancers 2024, 16. [Google Scholar] [CrossRef] [PubMed]
- Zhu, P.; Liao, L.-Y.; Zhao, T.-T.; Mo, X.-M.; Chen, G.G.; Liu, Z.-M. GPER/ERK&AKT/NF-κB pathway is involved in cadmium-induced proliferation, invasion and migration of GPER-positive thyroid cancer cells. Mol. Cell. Endocrinol. 2017, 442, 68–80. [Google Scholar] [CrossRef] [PubMed]
- Chen, Z.-J.; Wei, W.; Jiang, G.-M.; Liu, H.; Wei, W.-D.; Yang, X.; Wu, Y.-M.; Liu, H.; Wong, C.K.C.; Du, J.; et al. Activation of GPER suppresses epithelial mesenchymal transition of triple negative breast cancer cells via NF-κB signals. Mol. Oncol. 2016, 10, 775–788. [Google Scholar] [CrossRef] [PubMed]
- Filardo, E.J.; Quinn, J.A.; Bland, K.I.; Frackelton, A.R., Jr. Estrogen-Induced Activation of Erk-1 and Erk-2 Requires the G Protein-Coupled Receptor Homolog, GPR30, and Occurs via Trans-Activation of the Epidermal Growth Factor Receptor through Release of HB-EGF. Mol. Endocrinol. 2000, 14, 1649–1660. [Google Scholar] [CrossRef] [PubMed]
- Gilmour, A.M.; Abdulkhalek, S.; Cheng, T.S.W.; Alghamdi, F.; Jayanth, P.; O’Shea, L.K.; Geen, O.; Arvizu, L.A.; Szewczuk, M.R. A novel epidermal growth factor receptor-signaling platform and its targeted translation in pancreatic cancer. Cell. Signal. 2013, 25, 2587–2603. [Google Scholar] [CrossRef] [PubMed]
- Jayanth, P.; Amith, S.R.; Gee, K.; Szewczuk, M.R. Neu1 sialidase and matrix metalloproteinase-9 cross-talk is essential for neurotrophin activation of Trk receptors and cellular signaling. Cell. Signal. 2010, 22, 1193–1205. [Google Scholar] [CrossRef] [PubMed]
- Alghamdi, F.; Guo, M.; Abdulkhalek, S.; Crawford, N.; Amith, S.R.; Szewczuk, M.R. A novel insulin receptor-signaling platform and its link to insulin resistance and type 2 diabetes. Cell. Signal. 2014, 26, 1355–1368. [Google Scholar] [CrossRef] [PubMed]
- Abdulkhalek, S.; Amith, S.R.; Franchuk, S.L.; Jayanth, P.; Guo, M.; Finlay, T.; Gilmour, A.; Guzzo, C.; Gee, K.; Beyaert, R.; et al. Neu1 sialidase and matrix metalloproteinase-9 cross-talk is essential for Toll-like receptor activation and cellular signaling. J. Biol. Chem. 2011, 286, 36532–36549. [Google Scholar] [CrossRef] [PubMed]
- Abdulkhalek, S.; Guo, M.; Amith, S.R.; Jayanth, P.; Szewczuk, M.R. G-protein coupled receptor agonists mediate Neu1 sialidase and matrix metalloproteinase-9 cross-talk to induce transactivation of TOLL-like receptors and cellular signaling. Cell. Signal. 2012, 24, 2035–2042. [Google Scholar] [CrossRef] [PubMed]
- Schober, P.; Boer, C.; Schwarte, L.A. Correlation Coefficients: Appropriate Use and Interpretation. Anesth. Analg. 2018, 126, 1763. [Google Scholar] [CrossRef] [PubMed]
- Bergers, G.; Fendt, S.-M. The metabolism of cancer cells during metastasis. Nat. Rev. Cancer 2021, 21, 162–180. [Google Scholar] [CrossRef] [PubMed]
- Gorski, J.W.; Ueland, F.R.; Kolesar, J.M. CCNE1 Amplification as a Predictive Biomarker of Chemotherapy Resistance in Epithelial Ovarian Cancer. Diagnostics 2020, 10. [Google Scholar] [CrossRef] [PubMed]
- Lu, J.; Zheng, X.; Li, F.; Yu, Y.; Chen, Z.; Liu, Z.; Wang, Z.; Xu, H.; Yang, W. Tunneling nanotubes promote intercellular mitochondria transfer followed by increased invasiveness in bladder cancer cells. Oncotarget 2017, 8, 15539–15552. [Google Scholar] [CrossRef] [PubMed]
- Fuentes, N.; Silveyra, P. Estrogen receptor signaling mechanisms. Adv. Protein Chem. Struct. Biol. 2019, 116, 135–170. [Google Scholar] [CrossRef] [PubMed]
- Shah, B.H.; Catt, K.J. GPCR-mediated transactivation of RTKs in the CNS: mechanisms and consequences. Trends Neurosci. 2004, 27, 48–53. [Google Scholar] [CrossRef] [PubMed]
- Delcourt, N.; Bockaert, J.; Marin, P. GPCR-jacking: from a new route in RTK signalling to a new concept in GPCR activation. Trends Pharmacol. Sci. 2007, 28, 602–607. [Google Scholar] [CrossRef] [PubMed]
- Bai, D.; Ueno, L.; Vogt, P.K. Akt-mediated regulation of NFκB and the essentialness of NFκB for the oncogenicity of PI3K and Akt. Int. J. Cancer 2009, 125, 2863–2870. [Google Scholar] [CrossRef] [PubMed]
- Kobayashi, H.; Picard, L.-P.; Schönegge, A.-M.; Bouvier, M. Bioluminescence resonance energy transfer–based imaging of protein–protein interactions in living cells. Nat. Protoc. 2019, 14, 1084–1107. [Google Scholar] [CrossRef] [PubMed]
- Weißenborn, C.; Ignatov, T.; Ochel, H.-J.; Costa, S.D.; Zenclussen, A.C.; Ignatova, Z.; Ignatov, A. GPER functions as a tumor suppressor in triple-negative breast cancer cells. J. Cancer Res. Clin. Oncol. 2014, 140, 713–723. [Google Scholar] [CrossRef] [PubMed]
- Yamashita, N.; Tokunaga, E.; Iimori, M.; Inoue, Y.; Tanaka, K.; Kitao, H.; Saeki, H.; Oki, E.; Maehara, Y. Epithelial Paradox: Clinical Significance of Coexpression of E-cadherin and Vimentin With Regard to Invasion and Metastasis of Breast Cancer. Clin. Breast Cancer 2018, 18, e1003–e1009. [Google Scholar] [CrossRef] [PubMed]
- Yamashita, N.; Tokunaga, E.; Kitao, H.; Hisamatsu, Y.; Taketani, K.; Akiyoshi, S.; Okada, S.; Aishima, S.; Morita, M.; Maehara, Y. Vimentin as a poor prognostic factor for triple-negative breast cancer. J. Cancer Res. Clin. Oncol. 2013, 139, 739–746. [Google Scholar] [CrossRef] [PubMed]
- Kapałczyńska, M.; Kolenda, T.; Przybyła, W.; Zajączkowska, M.; Teresiak, A.; Filas, V.; Ibbs, M.; Bliźniak, R.; Łuczewski, Ł.; Lamperska, K. 2D and 3D cell cultures – a comparison of different types of cancer cell cultures. Arch. Med. Sci. 2018, 14, 910–919. [Google Scholar] [CrossRef] [PubMed]
- Chen, M.; Zhao, D. Invisible Bridges: Unveiling the Role and Prospects of Tunneling Nanotubes in Cancer Therapy. Mol. Pharm. 2024, 21, 5413–5429. [Google Scholar] [CrossRef] [PubMed]
- Franchi, M.; Piperigkou, Z.; Riti, E.; Masola, V.; Onisto, M.; Karamanos, N.K. Long filopodia and tunneling nanotubes define new phenotypes of breast cancer cells in 3D cultures. Matrix Biol. Plus 2020, 6-7, 100026. [Google Scholar] [CrossRef] [PubMed]
- Ben-Dror, J.; Shalamov, M.; Sonnenblick, A. The History of Early Breast Cancer Treatment. Genes 2022, 13, 960. [Google Scholar] [CrossRef] [PubMed]
Figure 1.
E1S binding to GPER is depicted in the Neu-1-MMP-9-GPCR signaling crosstalk. E1S GPER is illustrated here with locations of orthosteric and allosteric binding sites. E1S can bind to any allosteric or orthosteric sites. E1S binding to GPER can induce conformational changes in the GPER, forming a higher-order oligomerization with GPCR NMBR-MMP-9-Neu-1 which in turn activates Neu-1 by releasing the elastin-binding protein (EBP) from its complex with Neu-1 and protective protein cathepsin A (PPCA). Activated Neu-1 cleaves α-2,3 sialic acid removing steric hindrance from the terminal glycosyl residue of the RTK receptor, which in turn induces the E1S-dependent signal from the E1S-binding GPER receptor. Inhibitors of various components of this signaling paradigm are oseltamivir phosphate (OP; inhibitor of Neu-1), MMP9i (MMP-9 inhibitor), and BIM 23127 (NMBR inhibitor). Abbreviations: RTK: receptor tyrosine kinase; GPCR: G-protein-coupled receptor; MMP-9: matrix metalloprotease-9; Neu-1: neuraminidase-1; PPCA: protective protein cathepsin A; EBP: elastin-binding protein; Citation. Modified in part from Research and Reports in Biochemistry 2013:3 17–30c 2013 Abdulkhalek et al., https://doi.org/10.2147/RRBC.S28430 (accessed on 7 January 2013), publisher and licensee Dove Medical Press Ltd. This is an open-access article that permits unrestricted non-commercial use, provided the original work is properly cited.
Figure 1.
E1S binding to GPER is depicted in the Neu-1-MMP-9-GPCR signaling crosstalk. E1S GPER is illustrated here with locations of orthosteric and allosteric binding sites. E1S can bind to any allosteric or orthosteric sites. E1S binding to GPER can induce conformational changes in the GPER, forming a higher-order oligomerization with GPCR NMBR-MMP-9-Neu-1 which in turn activates Neu-1 by releasing the elastin-binding protein (EBP) from its complex with Neu-1 and protective protein cathepsin A (PPCA). Activated Neu-1 cleaves α-2,3 sialic acid removing steric hindrance from the terminal glycosyl residue of the RTK receptor, which in turn induces the E1S-dependent signal from the E1S-binding GPER receptor. Inhibitors of various components of this signaling paradigm are oseltamivir phosphate (OP; inhibitor of Neu-1), MMP9i (MMP-9 inhibitor), and BIM 23127 (NMBR inhibitor). Abbreviations: RTK: receptor tyrosine kinase; GPCR: G-protein-coupled receptor; MMP-9: matrix metalloprotease-9; Neu-1: neuraminidase-1; PPCA: protective protein cathepsin A; EBP: elastin-binding protein; Citation. Modified in part from Research and Reports in Biochemistry 2013:3 17–30c 2013 Abdulkhalek et al., https://doi.org/10.2147/RRBC.S28430 (accessed on 7 January 2013), publisher and licensee Dove Medical Press Ltd. This is an open-access article that permits unrestricted non-commercial use, provided the original work is properly cited.
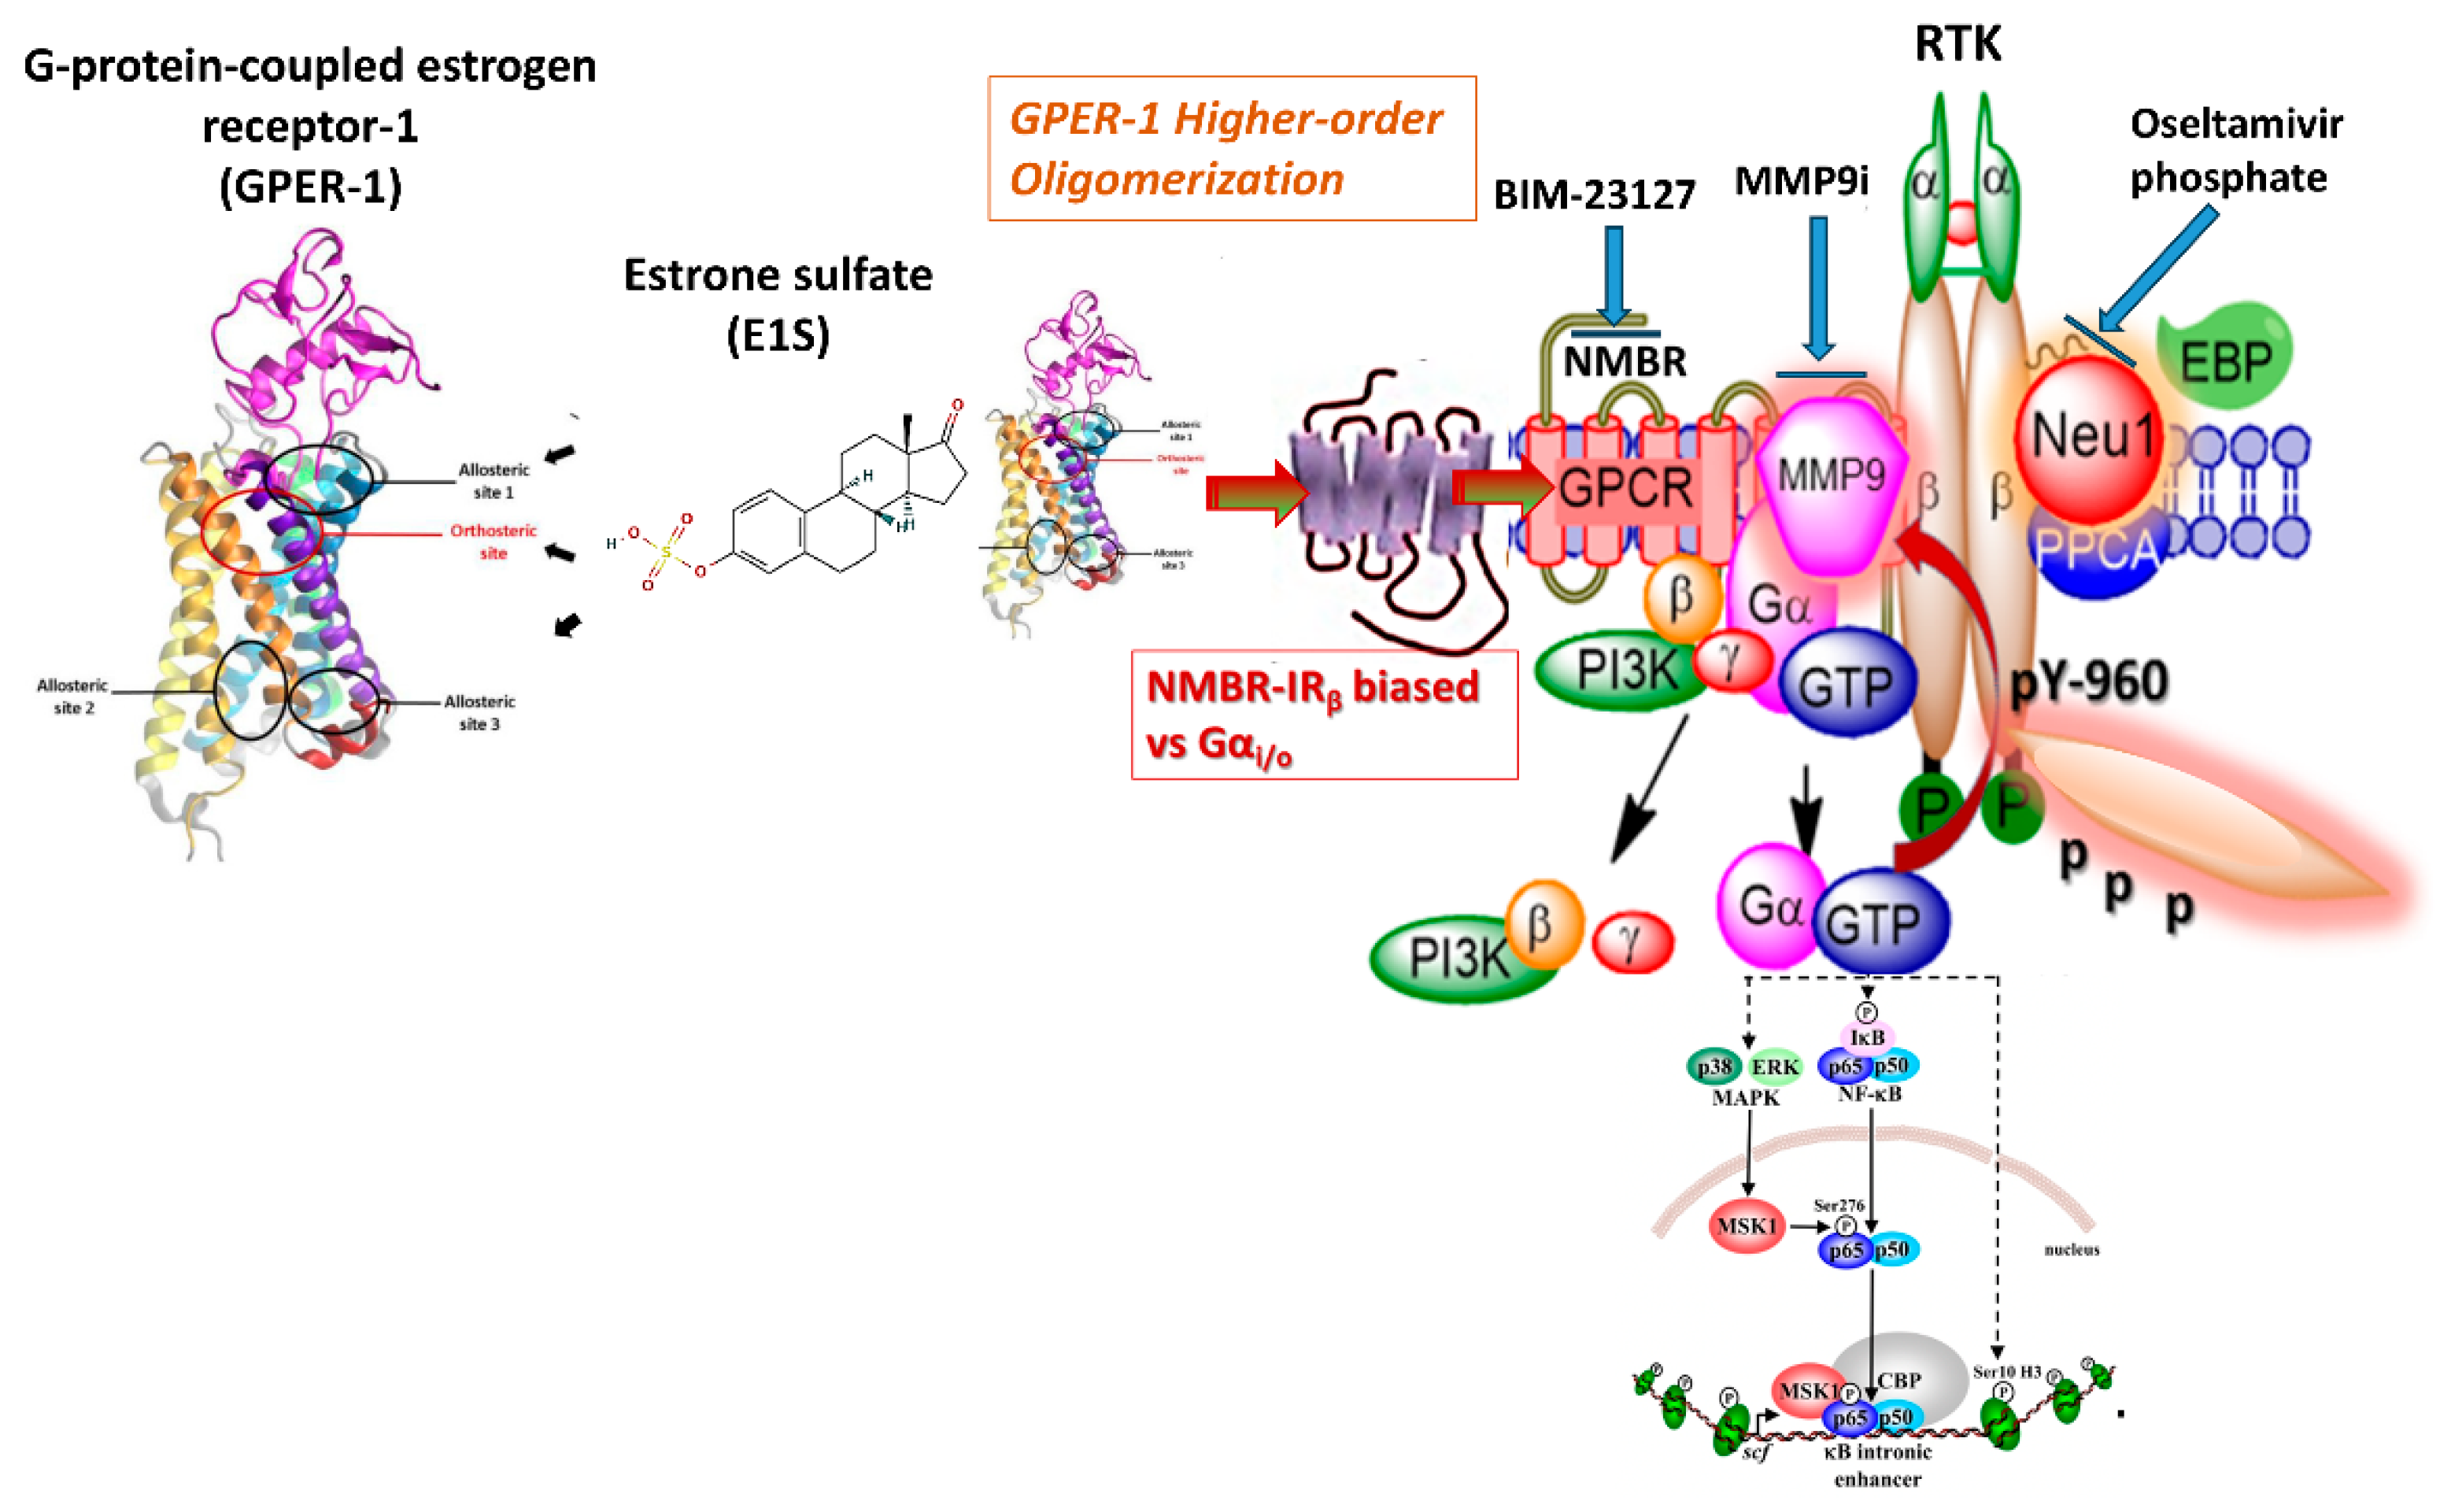
Figure 2.
E1S induces Neu1 sialidase activity in MDA-MB-231 triple negative breast cancer cells. (A) After adding 4-MUNANA, MDA-MB-231 cells were treated with EGF as a positive control or with various concentrations of E1S (0.1–50 nM). Fluorescent images were captured using epi-fluorescent microscopy using excitation and emission wavelengths of 365–380 nm and 445–454 nm, respectively using 10× objective (scale bar). (B) Compared with untreated controls, E1S treated cells increased fluorescence suggesting Neu1 sialidase activity. (C) E1S (10 nM)-treated cells together with either BIM23 (30 nM), MMP9i (2 µM) or OP (300 µg/mL) significantly inhibited sialidase activity as depicted in (D). Sialidase activity with the three inhibitors alone is shown in (E) and (D). A normal QQ plot assesses the dataset normality to verify a normal distribution (B and D). ImageJ software was used to calculate the mean fluorescence of 50 points surrounding the cells’ periphery across four images (n=4). The graphical depiction of the mean ± SEM florescence density demonstrates that E1S upregulates sialidase activity (p<0.0001, N=4), with asterisks signifying statistical significance. Statistical significance among the six independent groups was assessed using ANOVA and Fisher’s uncorrected LSD post hoc test at the 95% confidence level. The data presented were consistent across three independent experiments.
Figure 2.
E1S induces Neu1 sialidase activity in MDA-MB-231 triple negative breast cancer cells. (A) After adding 4-MUNANA, MDA-MB-231 cells were treated with EGF as a positive control or with various concentrations of E1S (0.1–50 nM). Fluorescent images were captured using epi-fluorescent microscopy using excitation and emission wavelengths of 365–380 nm and 445–454 nm, respectively using 10× objective (scale bar). (B) Compared with untreated controls, E1S treated cells increased fluorescence suggesting Neu1 sialidase activity. (C) E1S (10 nM)-treated cells together with either BIM23 (30 nM), MMP9i (2 µM) or OP (300 µg/mL) significantly inhibited sialidase activity as depicted in (D). Sialidase activity with the three inhibitors alone is shown in (E) and (D). A normal QQ plot assesses the dataset normality to verify a normal distribution (B and D). ImageJ software was used to calculate the mean fluorescence of 50 points surrounding the cells’ periphery across four images (n=4). The graphical depiction of the mean ± SEM florescence density demonstrates that E1S upregulates sialidase activity (p<0.0001, N=4), with asterisks signifying statistical significance. Statistical significance among the six independent groups was assessed using ANOVA and Fisher’s uncorrected LSD post hoc test at the 95% confidence level. The data presented were consistent across three independent experiments.
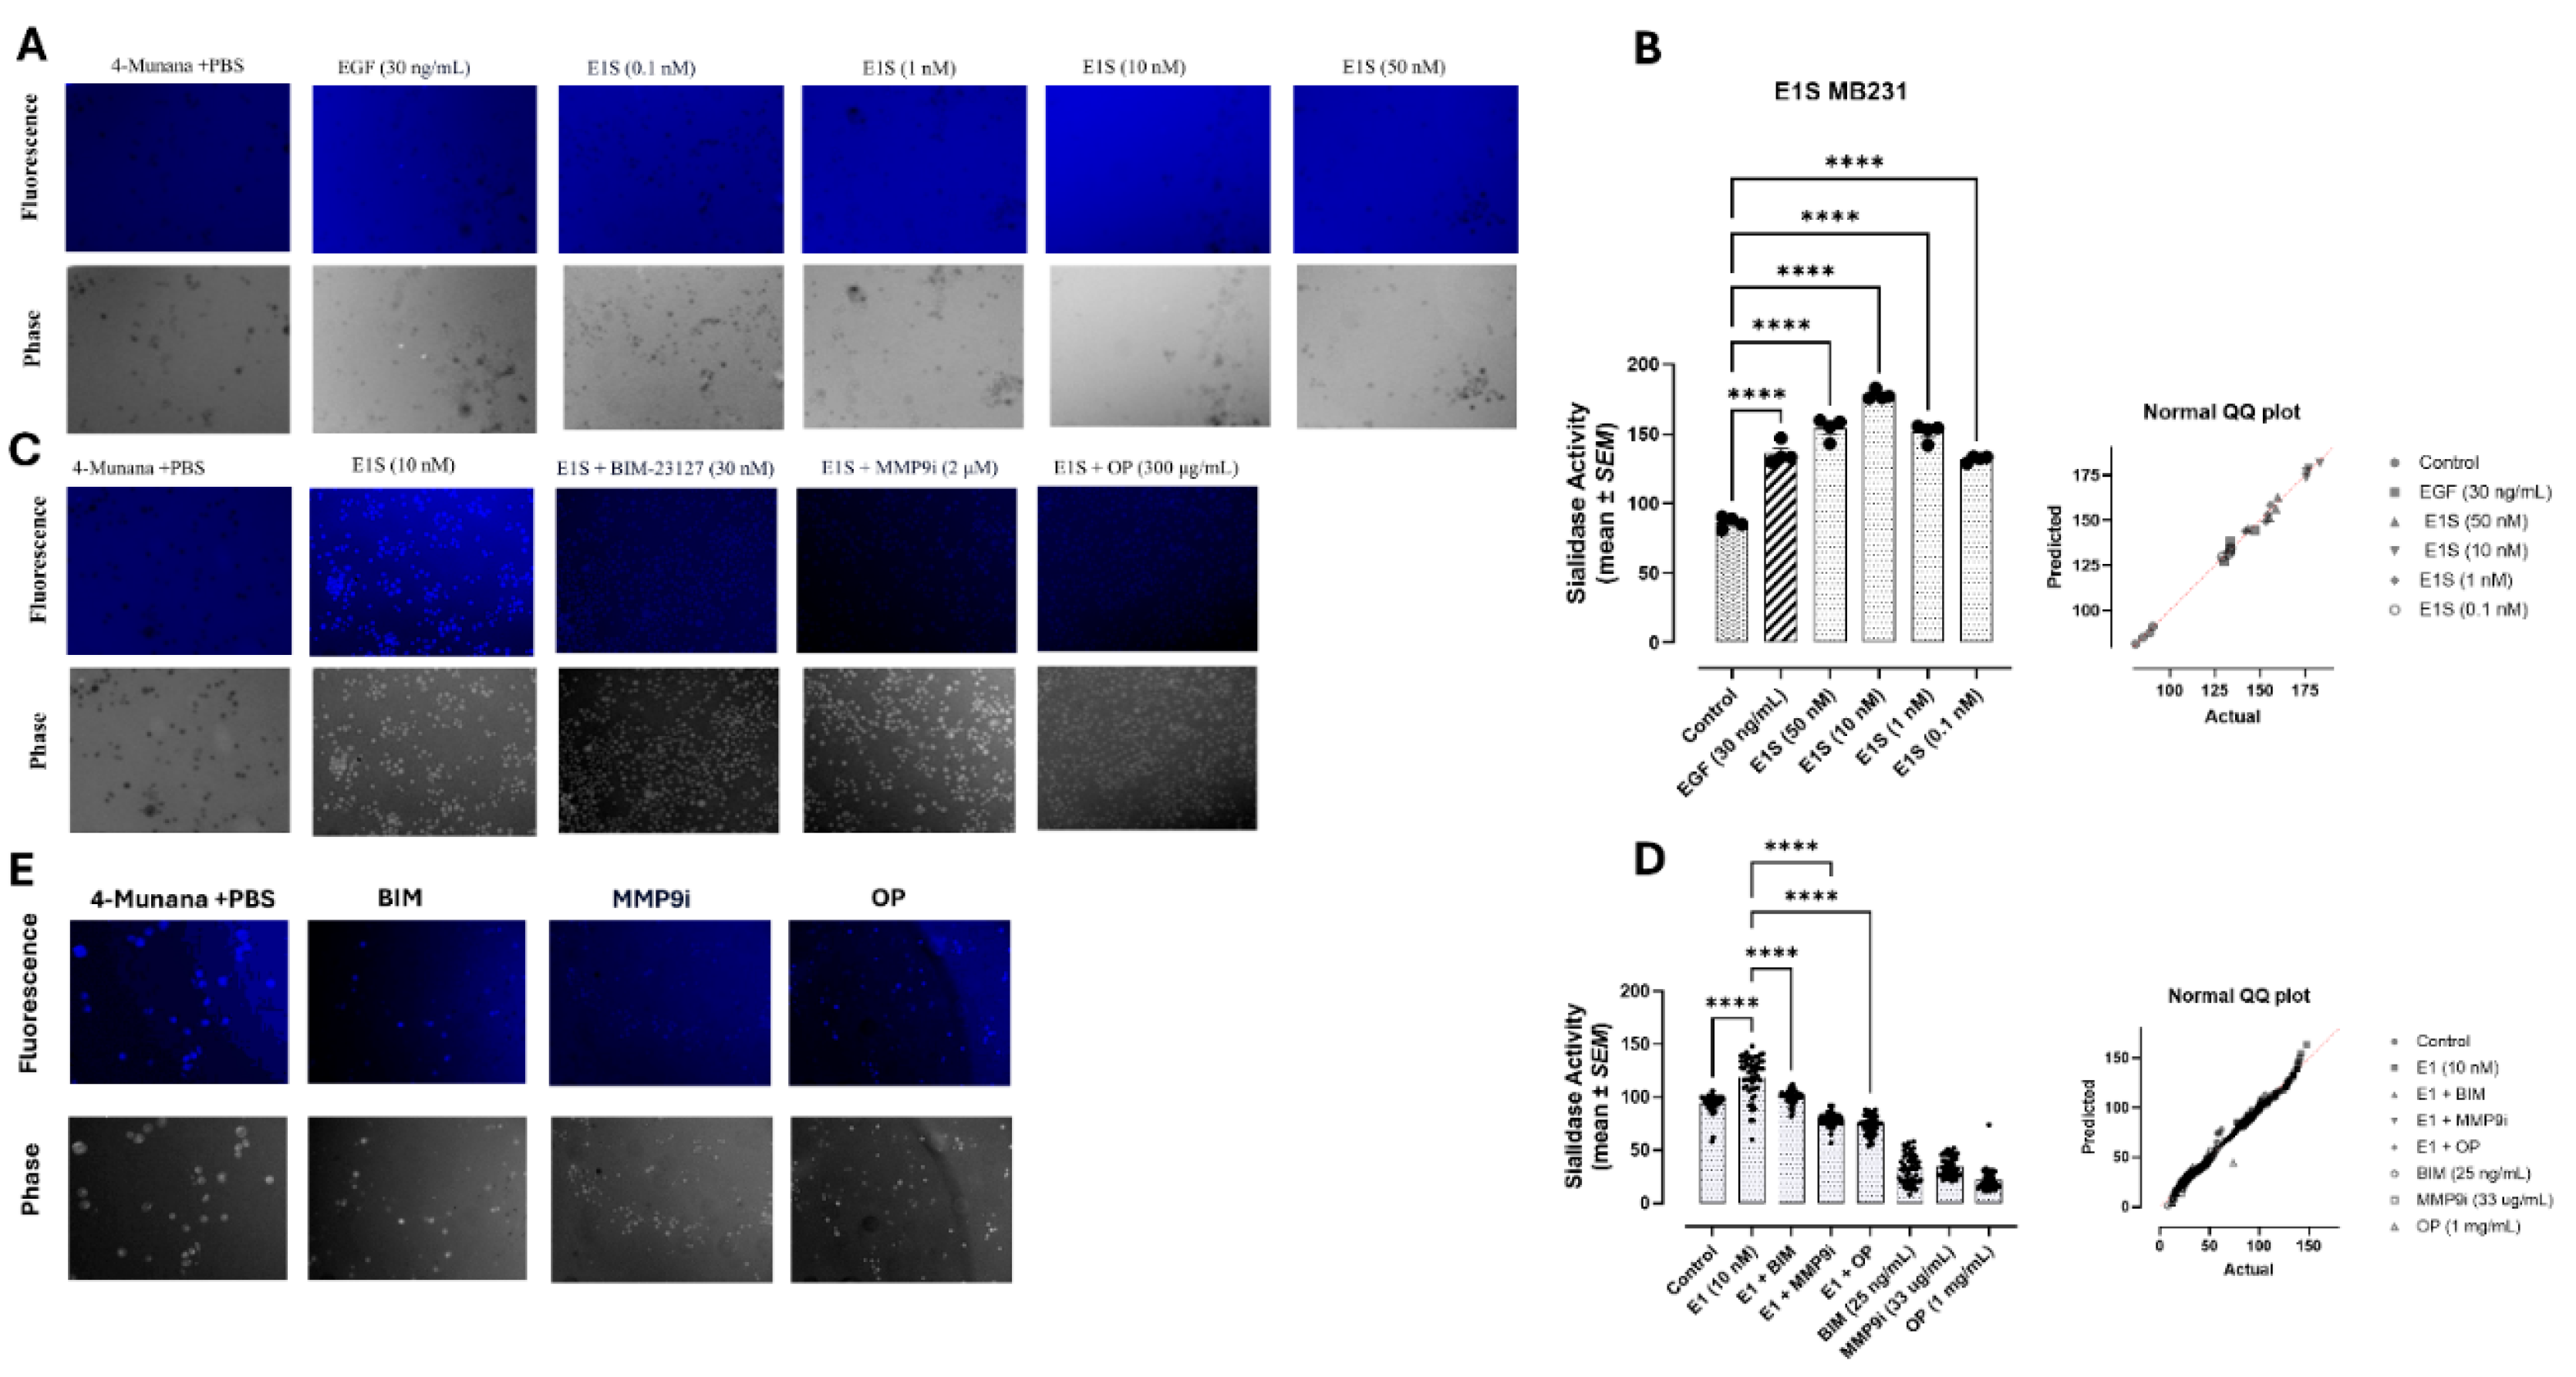
Figure 3.
E1S induces Neu1 sialidase activity in MCF-7 breast cancer cells. (A) After treatment with 4-MUNANA, MCF-7 cells were exposed to various concentrations of E1S (31.25-250 µg/mL). Fluorescent images were captured using epi-fluorescent microscopy using excitation and emission wavelengths of 365–380 nm and 445–454 nm, respectively, and a 10× objective (scale bar). (B) Compared with untreated controls, treatment with E1S increased fluorescence, suggesting increased 4-MU and, therefore, increased Neu1 sialidase activity. E1S-treated cells at 62.5 ug/mL together with BIM23 (30 nM). MMP9i (2 µM) and OP (300 µg/mL) significantly inhibited sialidase activity as depicted in (A, B). A normal QQ plot assesses the normality of a dataset, assuming it follows a normal distribution (B). ImageJ software was used to calculate the mean florescence of 50 points surrounding the cells’ periphery across four images (n=4). The graphical depiction of the mean ± SEM florescence density demonstrates that E1S upregulates sialidase activity (p<0.0001, n=4), with asterisks signifying statistical significance. Statistical significance among the six independent groups was assessed using ANOVA and Fisher’s uncorrected LSD post hoc test at 95% confidence. The data presented were consistent across three independent experiments.
Figure 3.
E1S induces Neu1 sialidase activity in MCF-7 breast cancer cells. (A) After treatment with 4-MUNANA, MCF-7 cells were exposed to various concentrations of E1S (31.25-250 µg/mL). Fluorescent images were captured using epi-fluorescent microscopy using excitation and emission wavelengths of 365–380 nm and 445–454 nm, respectively, and a 10× objective (scale bar). (B) Compared with untreated controls, treatment with E1S increased fluorescence, suggesting increased 4-MU and, therefore, increased Neu1 sialidase activity. E1S-treated cells at 62.5 ug/mL together with BIM23 (30 nM). MMP9i (2 µM) and OP (300 µg/mL) significantly inhibited sialidase activity as depicted in (A, B). A normal QQ plot assesses the normality of a dataset, assuming it follows a normal distribution (B). ImageJ software was used to calculate the mean florescence of 50 points surrounding the cells’ periphery across four images (n=4). The graphical depiction of the mean ± SEM florescence density demonstrates that E1S upregulates sialidase activity (p<0.0001, n=4), with asterisks signifying statistical significance. Statistical significance among the six independent groups was assessed using ANOVA and Fisher’s uncorrected LSD post hoc test at 95% confidence. The data presented were consistent across three independent experiments.
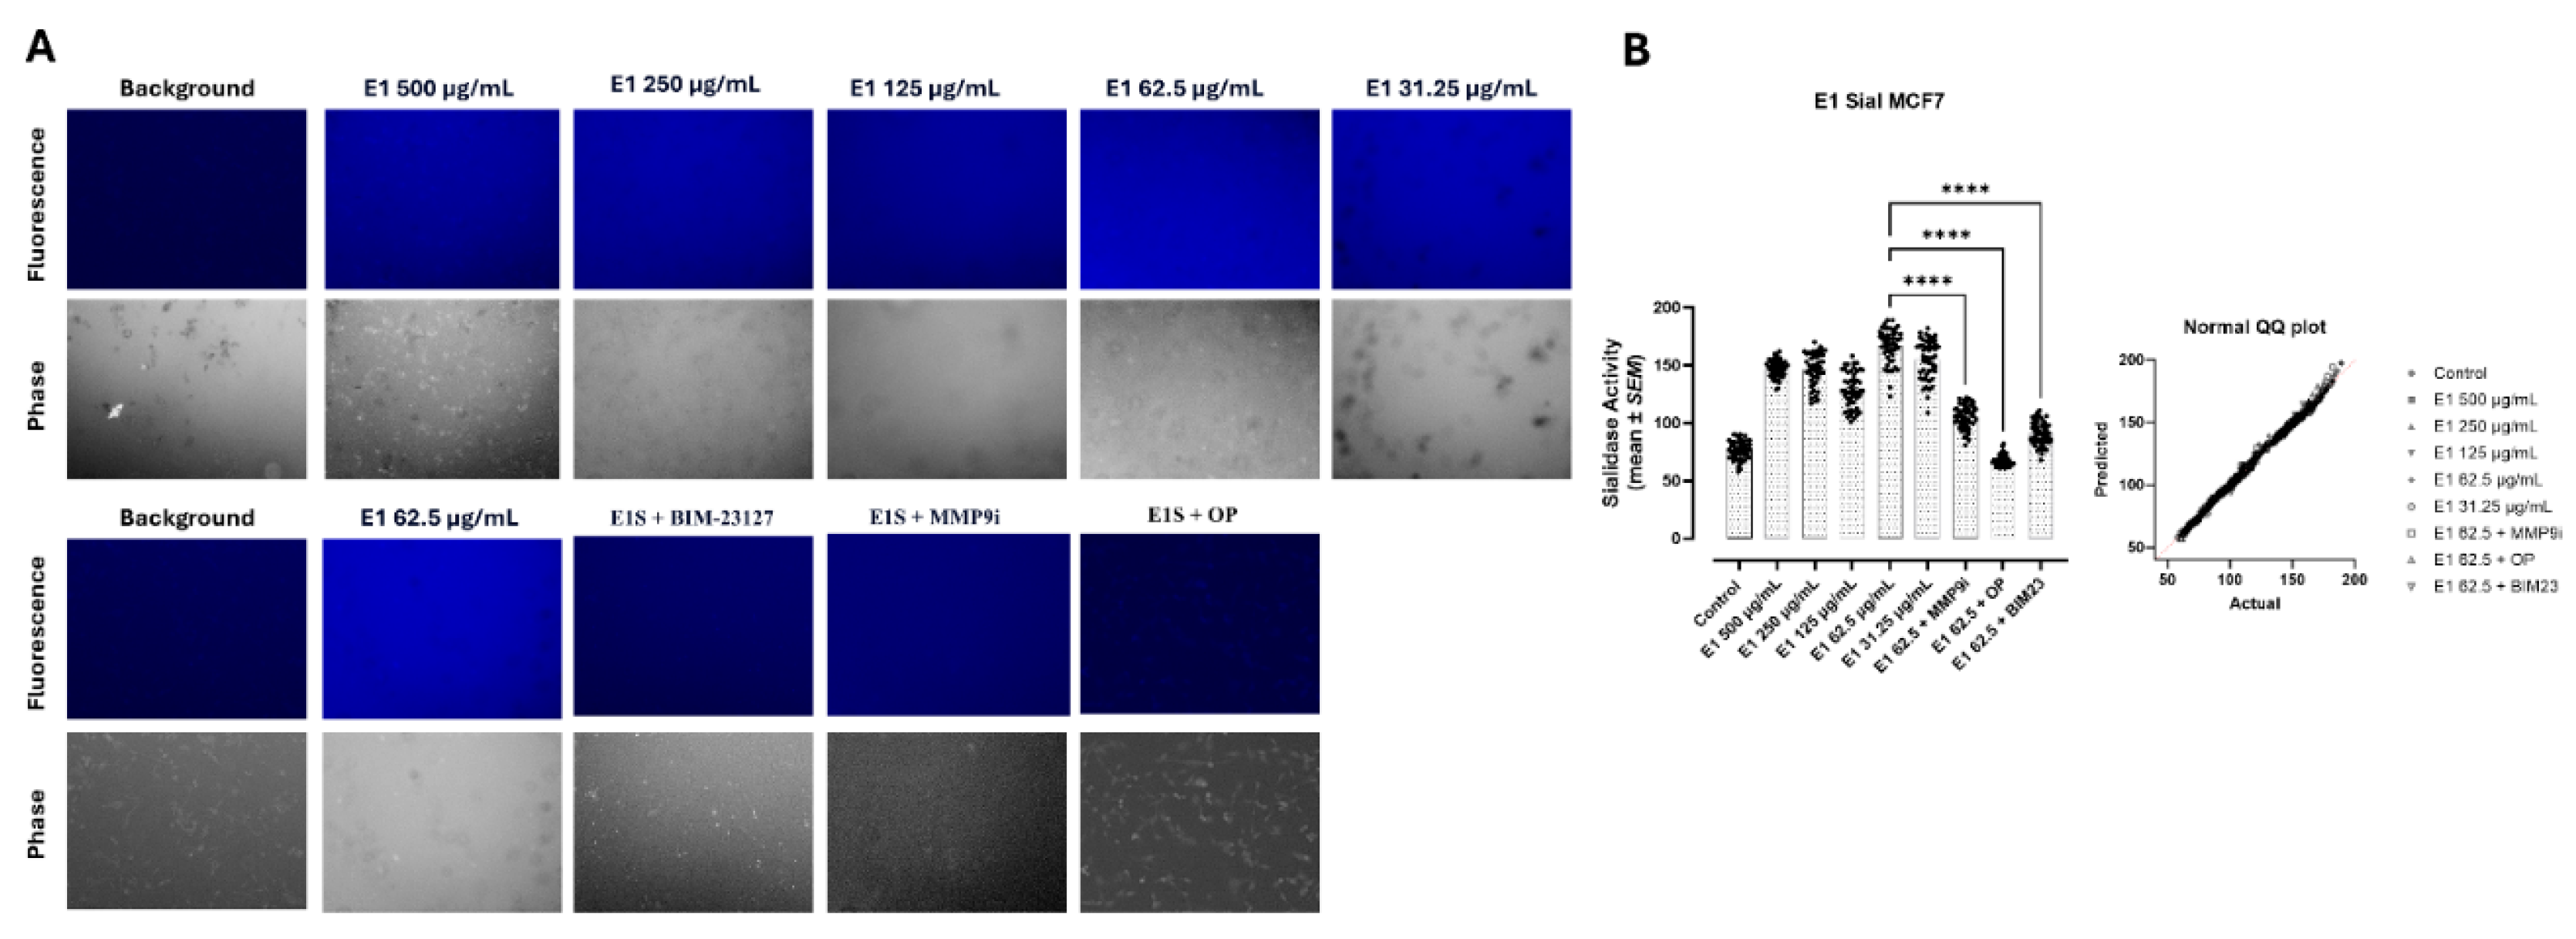
Figure 4.
E1S induces Neu1 sialidase activity in PANC-1 pancreatic cancer cells. (A) After treatment with 4-MUNANA, PANC-1 cells were exposed to various concentrations of E1S (2.18-35 µg/mL). Fluorescent images were captured using epi-fluorescent microscopy using excitation and emission wavelengths of 365–380 nm and 445–454 nm, respectively, and a 10× objective (scale bar). (B) Compared with untreated controls, treatment with E1S increased fluorescence, suggesting increased 4-MU and, therefore, Neu1 sialidase activity. E1S-treated cells at 8.75 ug/mL together with BIM23 (30 nM). MMP9i (2 µM) and OP (300 µg/mL) significantly inhibited sialidase activity as depicted in (A, B). A normal QQ plot assesses the normality of a dataset, assuming it follows a normal distribution (B). ImageJ software was used to calculate the mean florescence of 50 points surrounding the cells’ periphery across four images (n=4). The graphical depiction of the mean ± SEM florescence density demonstrates that E1S upregulates sialidase activity (p<0.0001, n=4), with asterisks signifying statistical significance. Statistical significance among the six independent groups was assessed using ANOVA and Fisher’s uncorrected LSD post hoc test at 95% confidence. The data presented were consistent across three independent experiments.
Figure 4.
E1S induces Neu1 sialidase activity in PANC-1 pancreatic cancer cells. (A) After treatment with 4-MUNANA, PANC-1 cells were exposed to various concentrations of E1S (2.18-35 µg/mL). Fluorescent images were captured using epi-fluorescent microscopy using excitation and emission wavelengths of 365–380 nm and 445–454 nm, respectively, and a 10× objective (scale bar). (B) Compared with untreated controls, treatment with E1S increased fluorescence, suggesting increased 4-MU and, therefore, Neu1 sialidase activity. E1S-treated cells at 8.75 ug/mL together with BIM23 (30 nM). MMP9i (2 µM) and OP (300 µg/mL) significantly inhibited sialidase activity as depicted in (A, B). A normal QQ plot assesses the normality of a dataset, assuming it follows a normal distribution (B). ImageJ software was used to calculate the mean florescence of 50 points surrounding the cells’ periphery across four images (n=4). The graphical depiction of the mean ± SEM florescence density demonstrates that E1S upregulates sialidase activity (p<0.0001, n=4), with asterisks signifying statistical significance. Statistical significance among the six independent groups was assessed using ANOVA and Fisher’s uncorrected LSD post hoc test at 95% confidence. The data presented were consistent across three independent experiments.
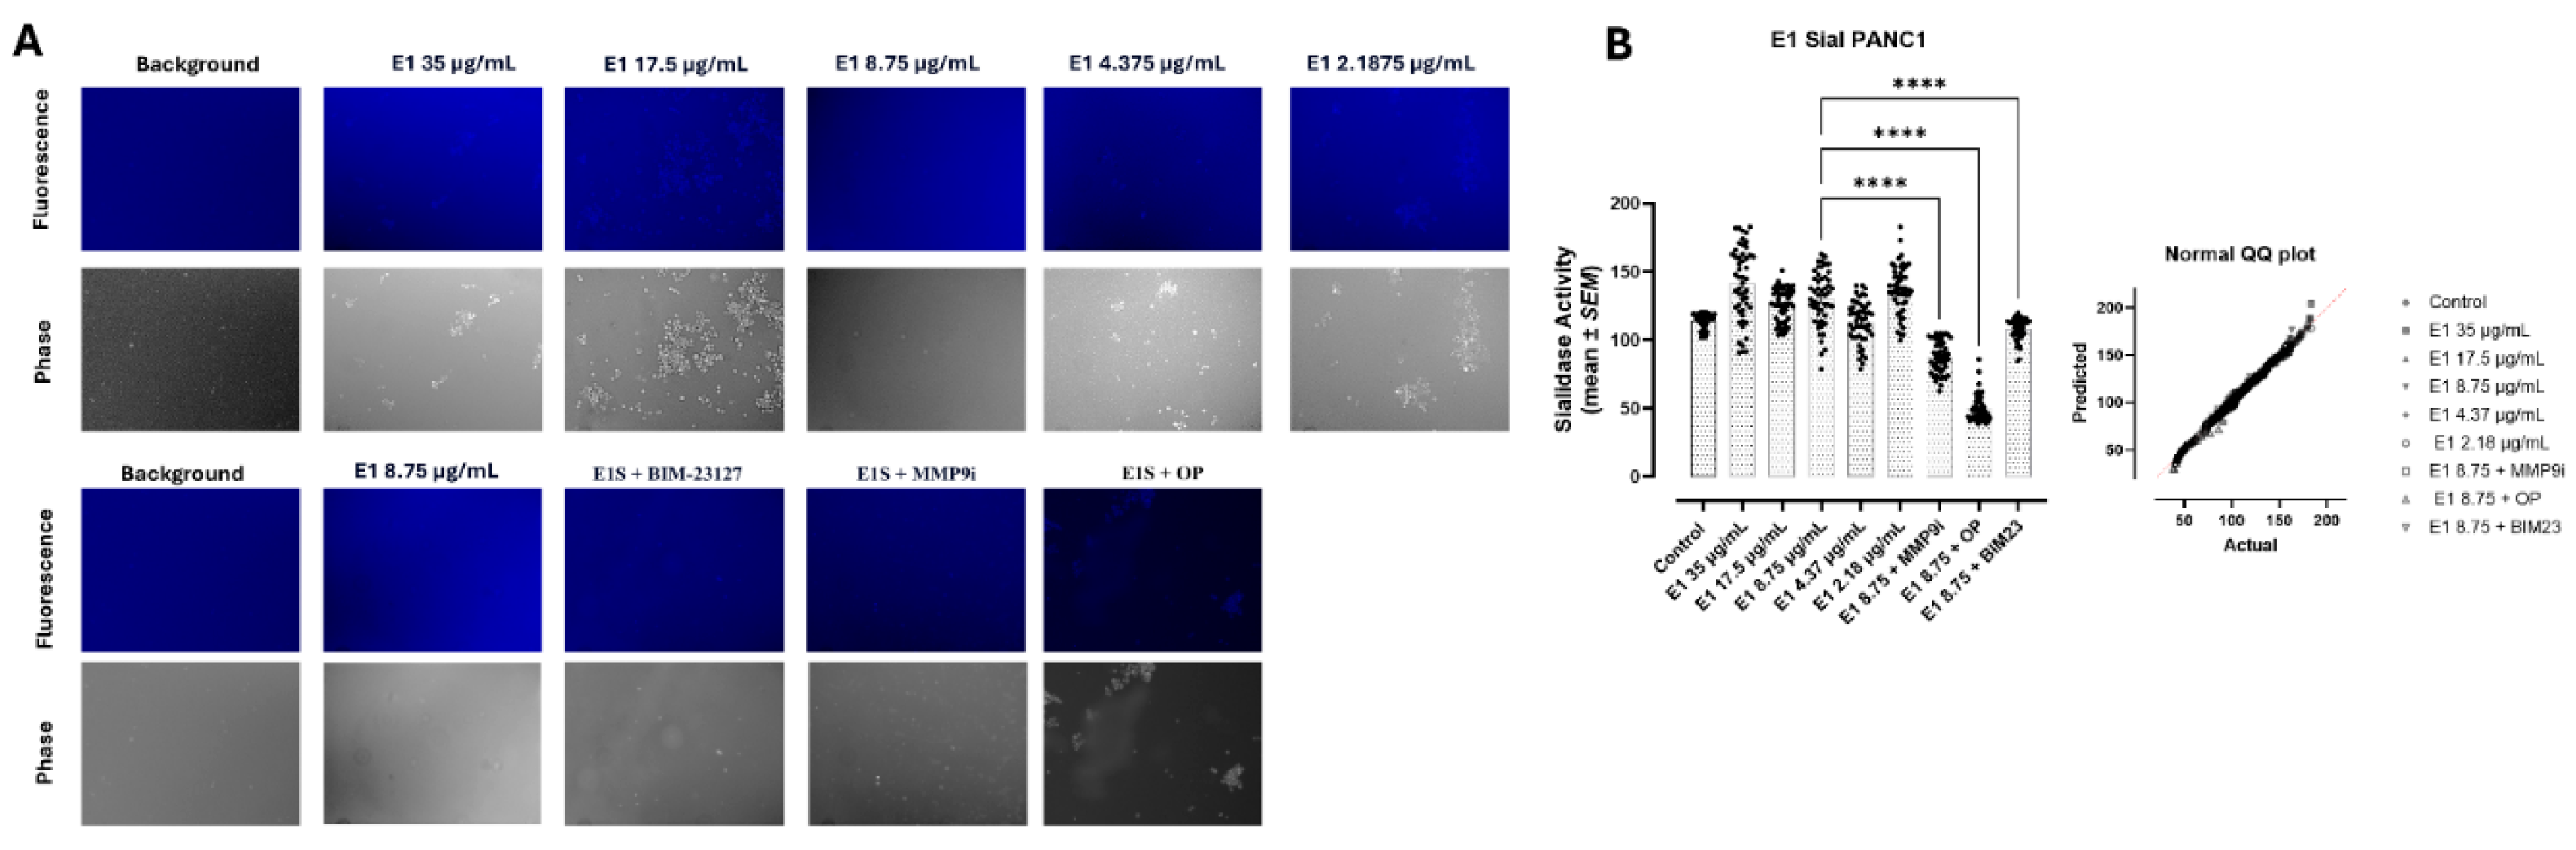
Figure 5.
GPER Co-localizes with Neu1 in MDA-MB-231 (A-C), MCF-7 (D-F), and PANC-1 (G-I) Cancer Cells. (A, D, and G)) 20× and 40× objective immunofluorescence images of GPER-Neu1 with DAPI. For colocalization analysis, cells were fixed, permeabilized, blocked, and immunostained with anti-GPER conjugated with Alexa Fluor 594 (red) and anti-Neu1 conjugated with Alexa Fluor 488 (green). The circle of cells is enhanced. Colocalization was quantified using AxioVision imaging software to compute the Pearson correlation coefficient, measuring the linear association between two variables (20x objective, scale bar). The Pearson correlation coefficient for colocalization between GPER and Neu-1 was 0.7874 in MDA-MB-231 (C), 0.8037 in MCF-7 (F), and 0.3865 in PANC-1 cells (I). A normal QQ plot assesses the normality of a dataset, assuming it follows a normal distribution (C, F, and I). The Pearson correlation coefficient ranged from 0.8 to 0.9, suggesting a strong association between GPER and Neu1.
Figure 5.
GPER Co-localizes with Neu1 in MDA-MB-231 (A-C), MCF-7 (D-F), and PANC-1 (G-I) Cancer Cells. (A, D, and G)) 20× and 40× objective immunofluorescence images of GPER-Neu1 with DAPI. For colocalization analysis, cells were fixed, permeabilized, blocked, and immunostained with anti-GPER conjugated with Alexa Fluor 594 (red) and anti-Neu1 conjugated with Alexa Fluor 488 (green). The circle of cells is enhanced. Colocalization was quantified using AxioVision imaging software to compute the Pearson correlation coefficient, measuring the linear association between two variables (20x objective, scale bar). The Pearson correlation coefficient for colocalization between GPER and Neu-1 was 0.7874 in MDA-MB-231 (C), 0.8037 in MCF-7 (F), and 0.3865 in PANC-1 cells (I). A normal QQ plot assesses the normality of a dataset, assuming it follows a normal distribution (C, F, and I). The Pearson correlation coefficient ranged from 0.8 to 0.9, suggesting a strong association between GPER and Neu1.
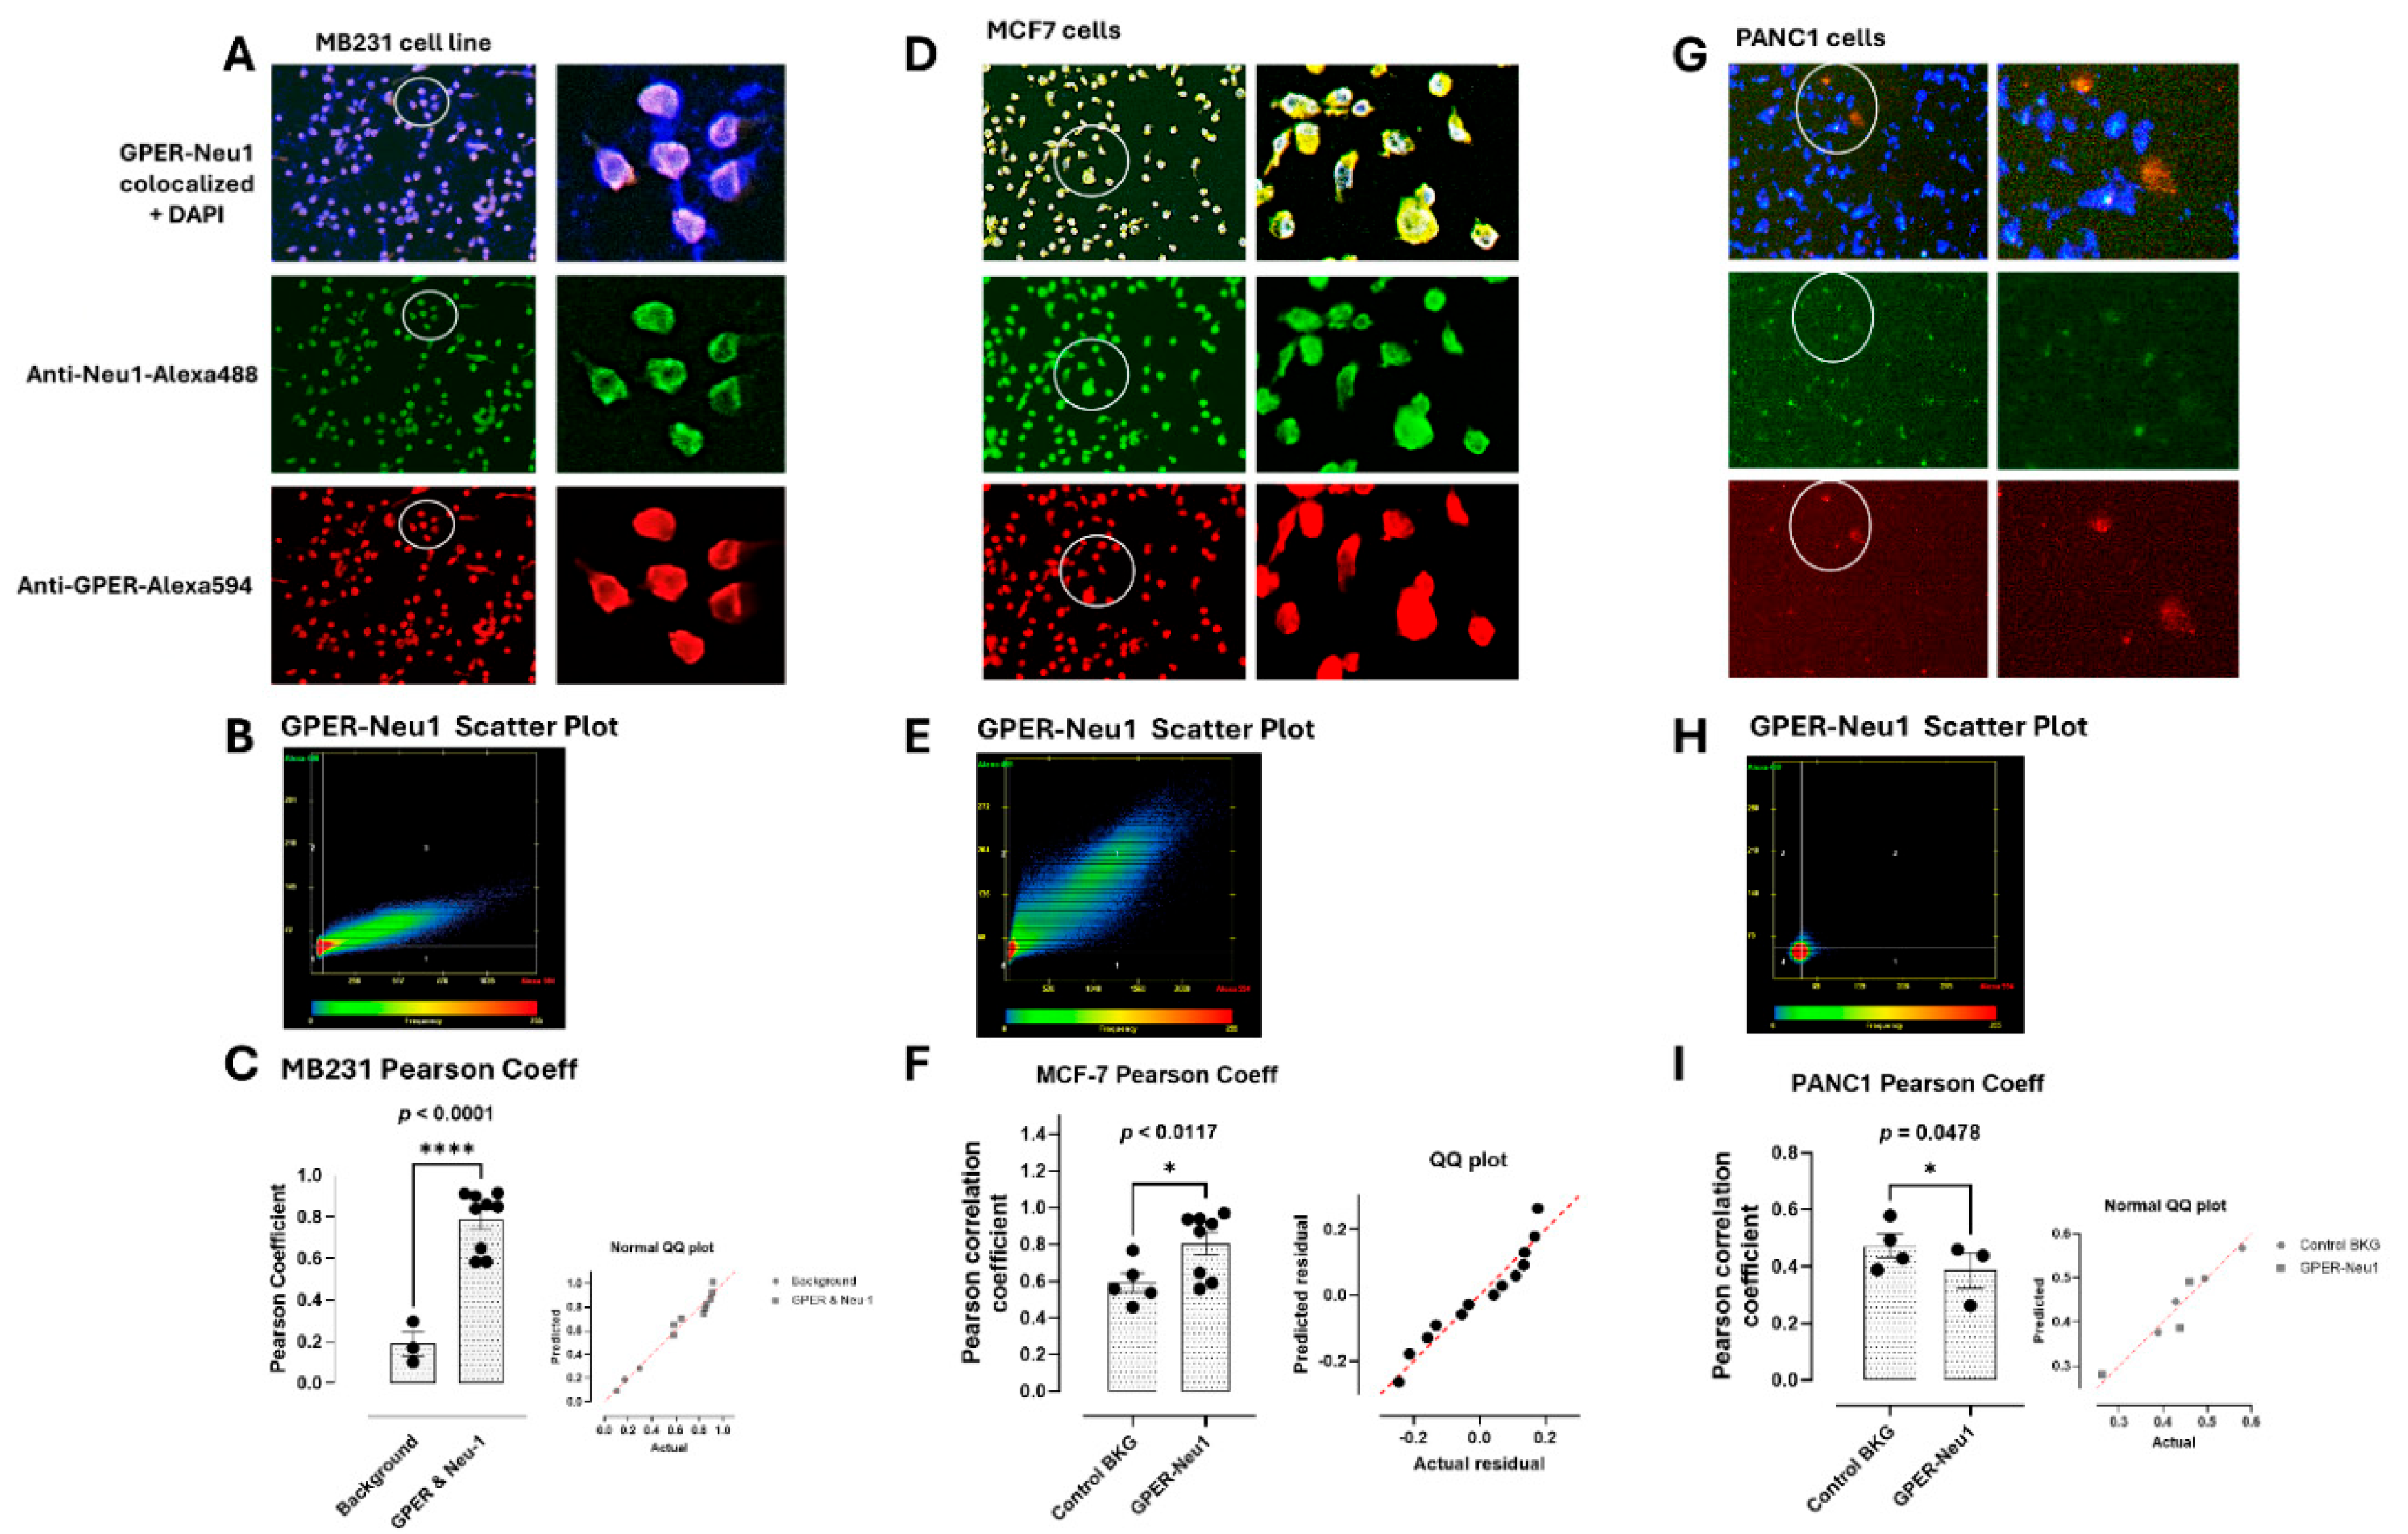
Figure 6.
E1S significantly alters the cancer cell phenotype, inducing the formation of tunneling nanotubes (TNTs) in MDA-MB-231 cells. (A, C, and E) Representative CellMask + DAPI and TNT quantification images of cell size and projections following synthetic cannabinoid treatment. Slide images were observed using Zeiss M2 epifluorescent microscopy (20× magnification, scale bar), with images captured under the Rhodamine (554 nm) channel. The images were enhanced (TNT images), and the TNT image cell projections were differentiated using ImageJ. (B, D, and F) The projections were quantified using Corel Photo-Paint. (E and F) Representative TNT images of cells treated with 300 ug/mL oseltamivir phosphate (OP). A normal QQ plot assesses the normality of a dataset, assuming it follows a normal distribution (B, D, and F). Quantification of TNTs for 15 min before E1S treatment. ** p < 0.01, ns = not significant.
Figure 6.
E1S significantly alters the cancer cell phenotype, inducing the formation of tunneling nanotubes (TNTs) in MDA-MB-231 cells. (A, C, and E) Representative CellMask + DAPI and TNT quantification images of cell size and projections following synthetic cannabinoid treatment. Slide images were observed using Zeiss M2 epifluorescent microscopy (20× magnification, scale bar), with images captured under the Rhodamine (554 nm) channel. The images were enhanced (TNT images), and the TNT image cell projections were differentiated using ImageJ. (B, D, and F) The projections were quantified using Corel Photo-Paint. (E and F) Representative TNT images of cells treated with 300 ug/mL oseltamivir phosphate (OP). A normal QQ plot assesses the normality of a dataset, assuming it follows a normal distribution (B, D, and F). Quantification of TNTs for 15 min before E1S treatment. ** p < 0.01, ns = not significant.
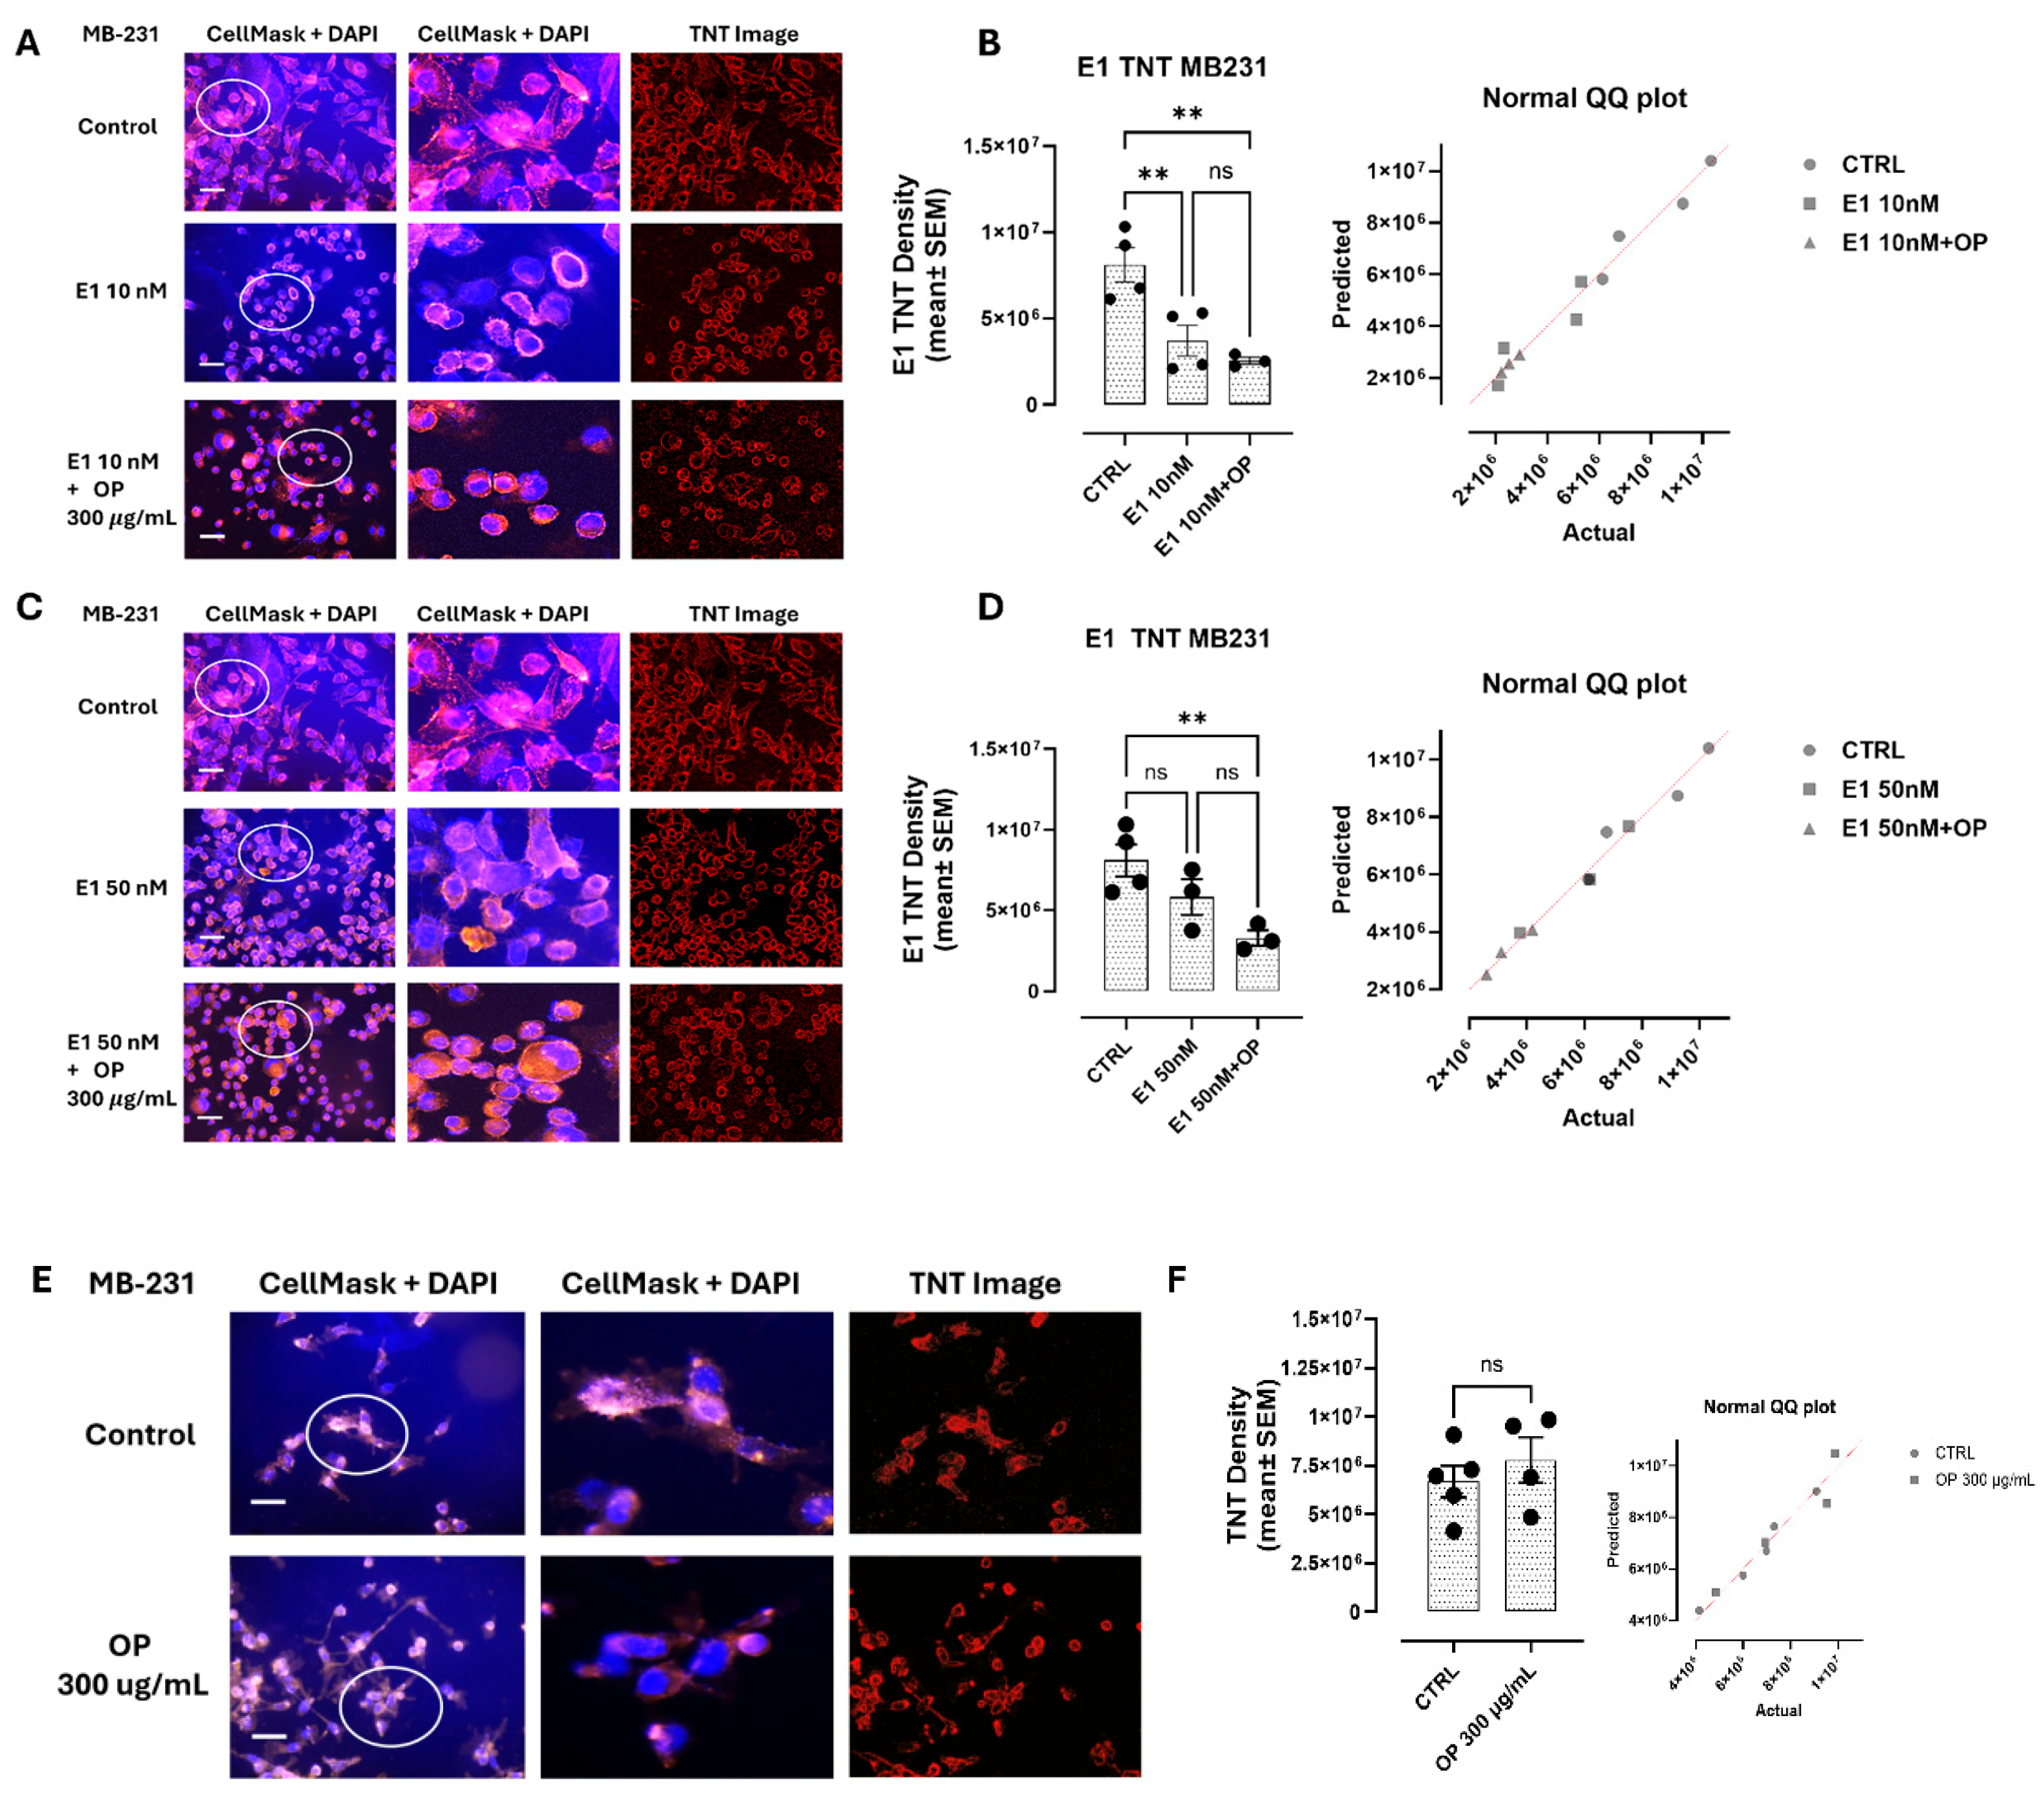
Figure 7.
E1S Increases Epithelial Markers and Decreases Mesenchymal Markers in MDA-MB-231 (A, B) and MCF-7 (C, D) Breast Cancer Cells. Cells were treated with primary antibodies conjugated with Alexa Fluor 594 (excitation/emission ~594/~617 nm; appears as red fluorescence) to detect E-cadherin, N-cadherin, or vimentin. Fluorescence imaging using epi-fluorescent microscopy (20× objective, scale bar) shows that E1S-treatment (10 nM) increased E-cadherin and decreased N-cadherin and vimentin in MDA-MB-231 and MCF-7 cells. All images were analyzed in Corel Photo-Paint, in which the background fluorescence was subtracted from the mean fluorescence of the entire image, and the resulting difference was multiplied by the pixel density. A normal QQ plot assesses the normality of a dataset, assuming it follows a normal distribution (B and D). The data presented are representative of three independent experiments. Statistical significance between independent groups was assessed using ANOVA and Fisher’s uncorrected LSD post hoc test at 95% confidence (p<0.05, N=3–6).
Figure 7.
E1S Increases Epithelial Markers and Decreases Mesenchymal Markers in MDA-MB-231 (A, B) and MCF-7 (C, D) Breast Cancer Cells. Cells were treated with primary antibodies conjugated with Alexa Fluor 594 (excitation/emission ~594/~617 nm; appears as red fluorescence) to detect E-cadherin, N-cadherin, or vimentin. Fluorescence imaging using epi-fluorescent microscopy (20× objective, scale bar) shows that E1S-treatment (10 nM) increased E-cadherin and decreased N-cadherin and vimentin in MDA-MB-231 and MCF-7 cells. All images were analyzed in Corel Photo-Paint, in which the background fluorescence was subtracted from the mean fluorescence of the entire image, and the resulting difference was multiplied by the pixel density. A normal QQ plot assesses the normality of a dataset, assuming it follows a normal distribution (B and D). The data presented are representative of three independent experiments. Statistical significance between independent groups was assessed using ANOVA and Fisher’s uncorrected LSD post hoc test at 95% confidence (p<0.05, N=3–6).
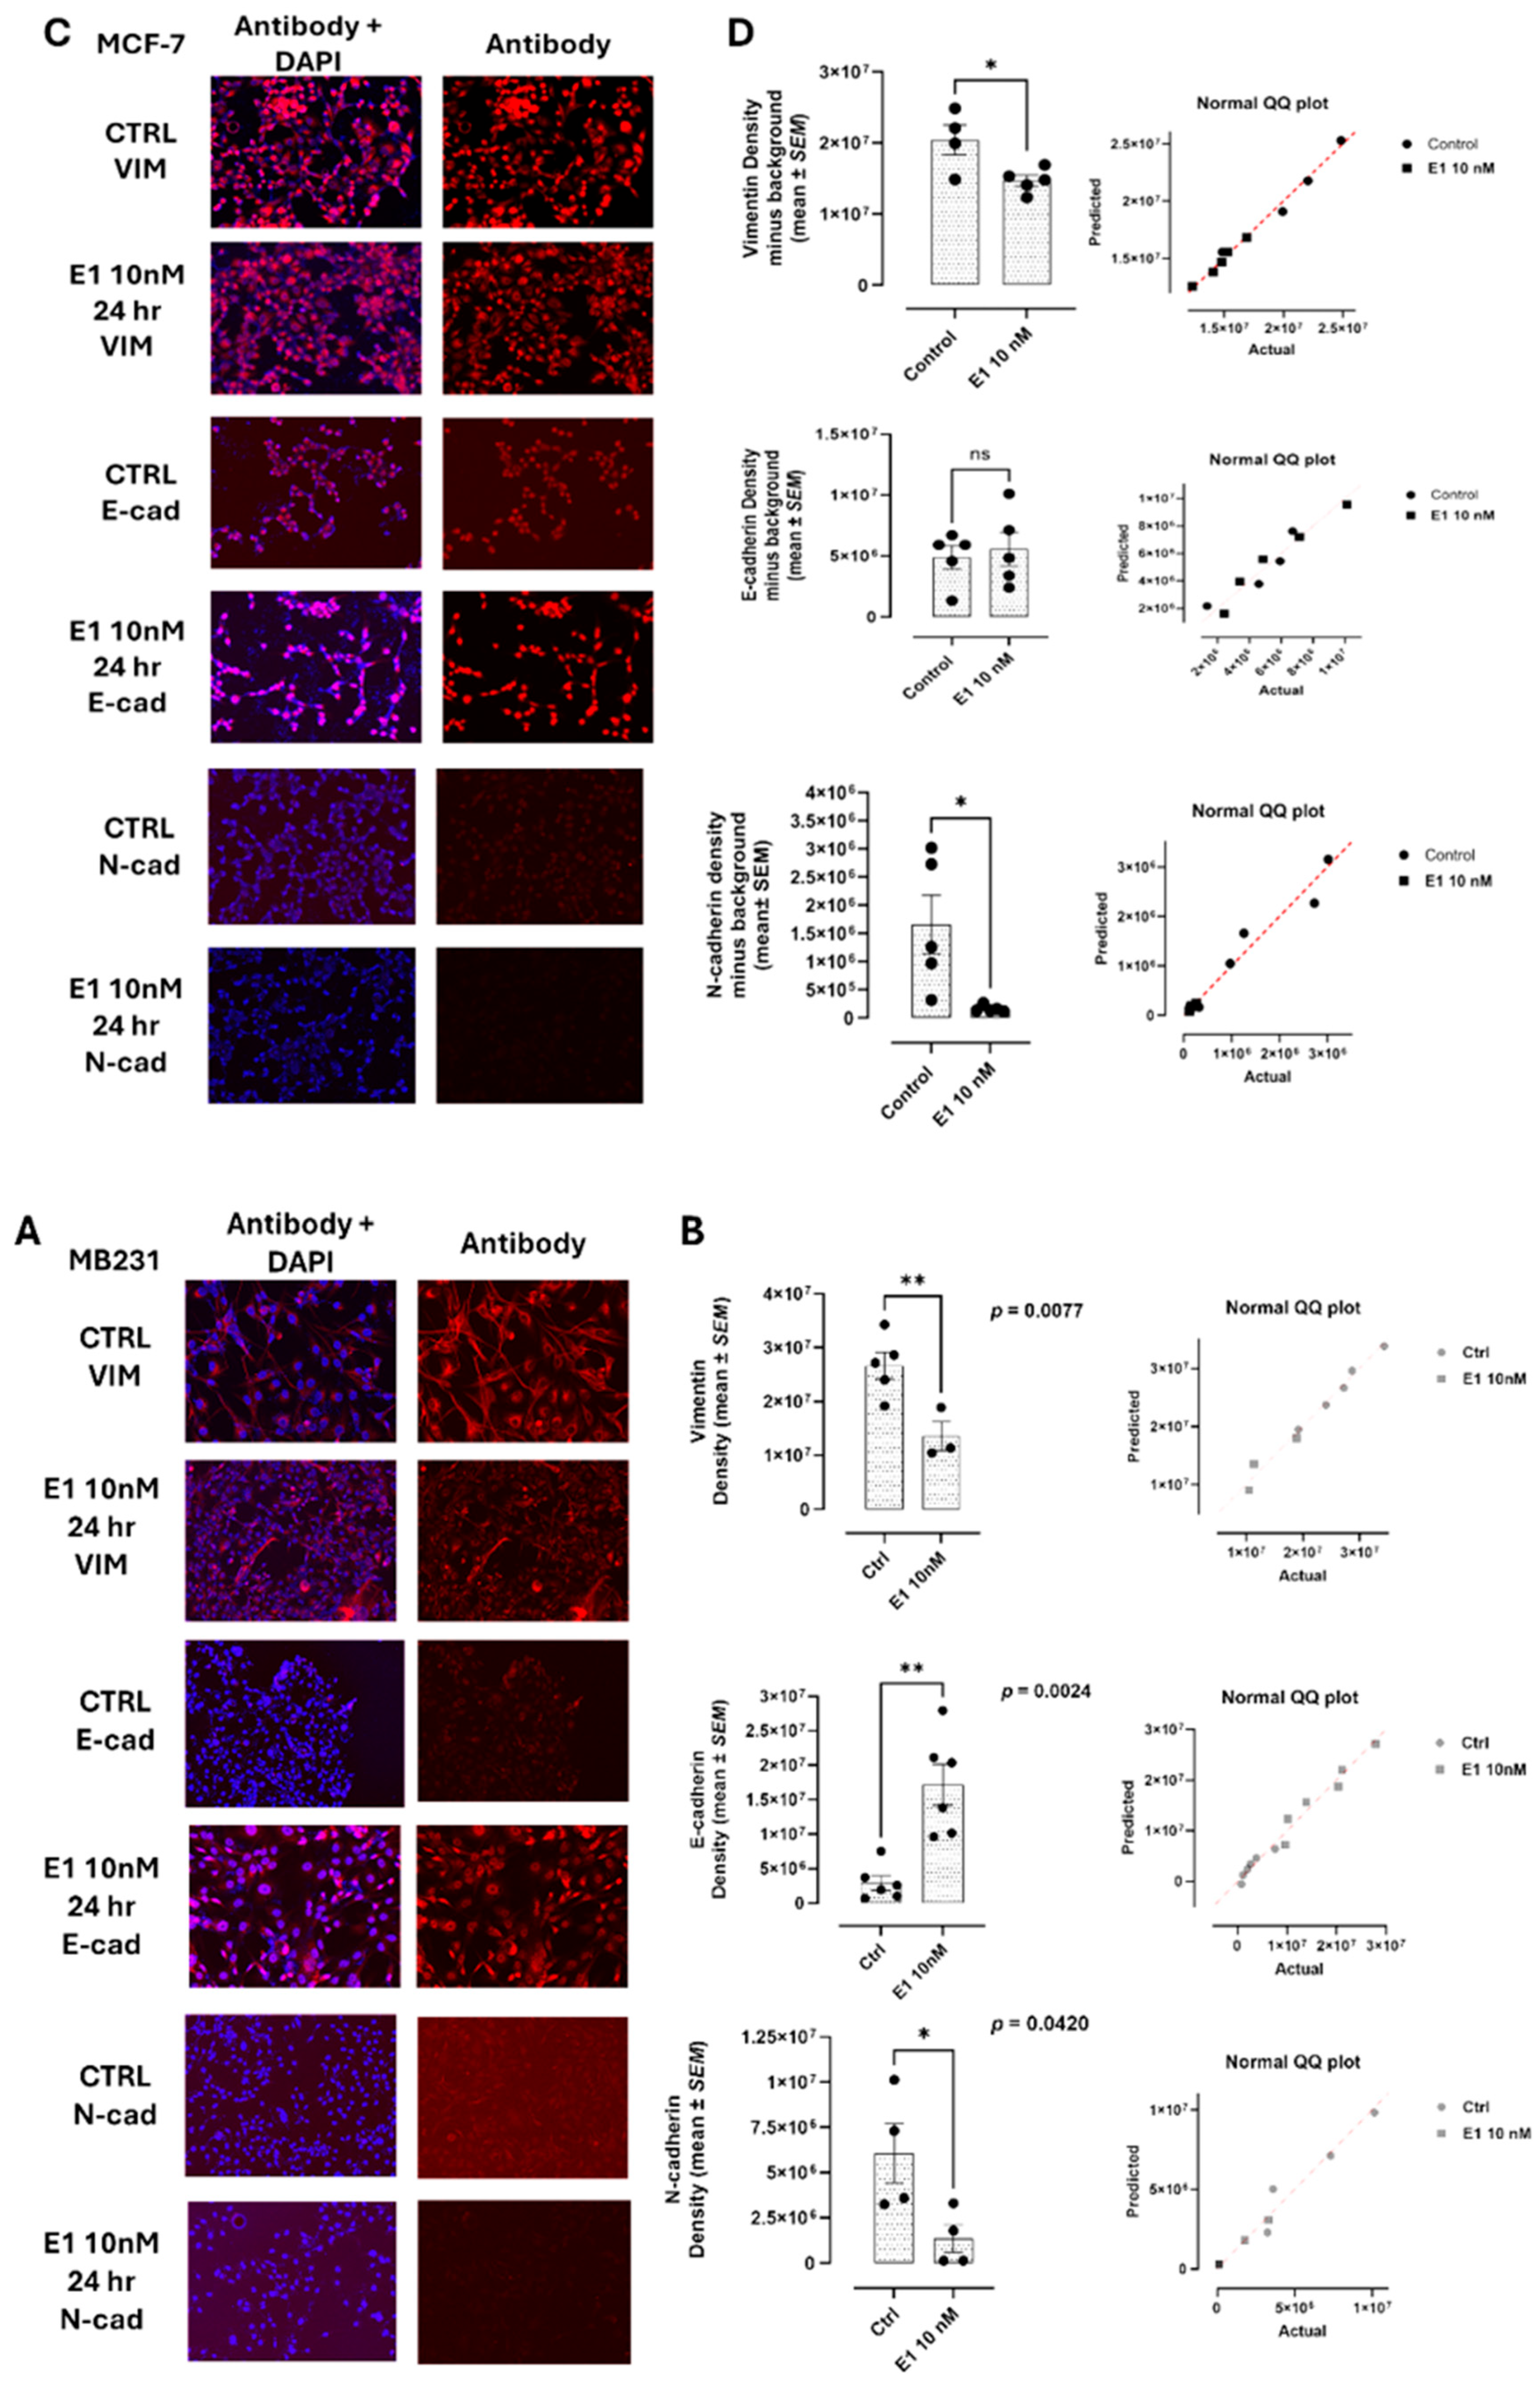
Figure 8.
E1S treated NF-kB reported RawBlue cells revealed NF-kB induced SEAP expression and secretion, which is inhibited by inhibitors BIM23, MMP9i, and OP. Quantitative spectrophotometric analysis of E1S-induced SEAP activity in the culture medium was performed using QUANTI-BlueTM reagent. The relative SEAP activity was calculated as the fold change for each compound (SEAP activity in medium from treated cells minus background divided by SEAP activity in medium from untreated cells minus background). A normal QQ plot assesses the dataset normality to confirm it follows a normal distribution (C). Results are the means of three separate experiments. As indicated by the asterisks, statistical significance was determined using ANOVA and Fisher’s uncorrected LSD post hoc test at a confidence level of 95%. *** p < 0.001.
Figure 8.
E1S treated NF-kB reported RawBlue cells revealed NF-kB induced SEAP expression and secretion, which is inhibited by inhibitors BIM23, MMP9i, and OP. Quantitative spectrophotometric analysis of E1S-induced SEAP activity in the culture medium was performed using QUANTI-BlueTM reagent. The relative SEAP activity was calculated as the fold change for each compound (SEAP activity in medium from treated cells minus background divided by SEAP activity in medium from untreated cells minus background). A normal QQ plot assesses the dataset normality to confirm it follows a normal distribution (C). Results are the means of three separate experiments. As indicated by the asterisks, statistical significance was determined using ANOVA and Fisher’s uncorrected LSD post hoc test at a confidence level of 95%. *** p < 0.001.
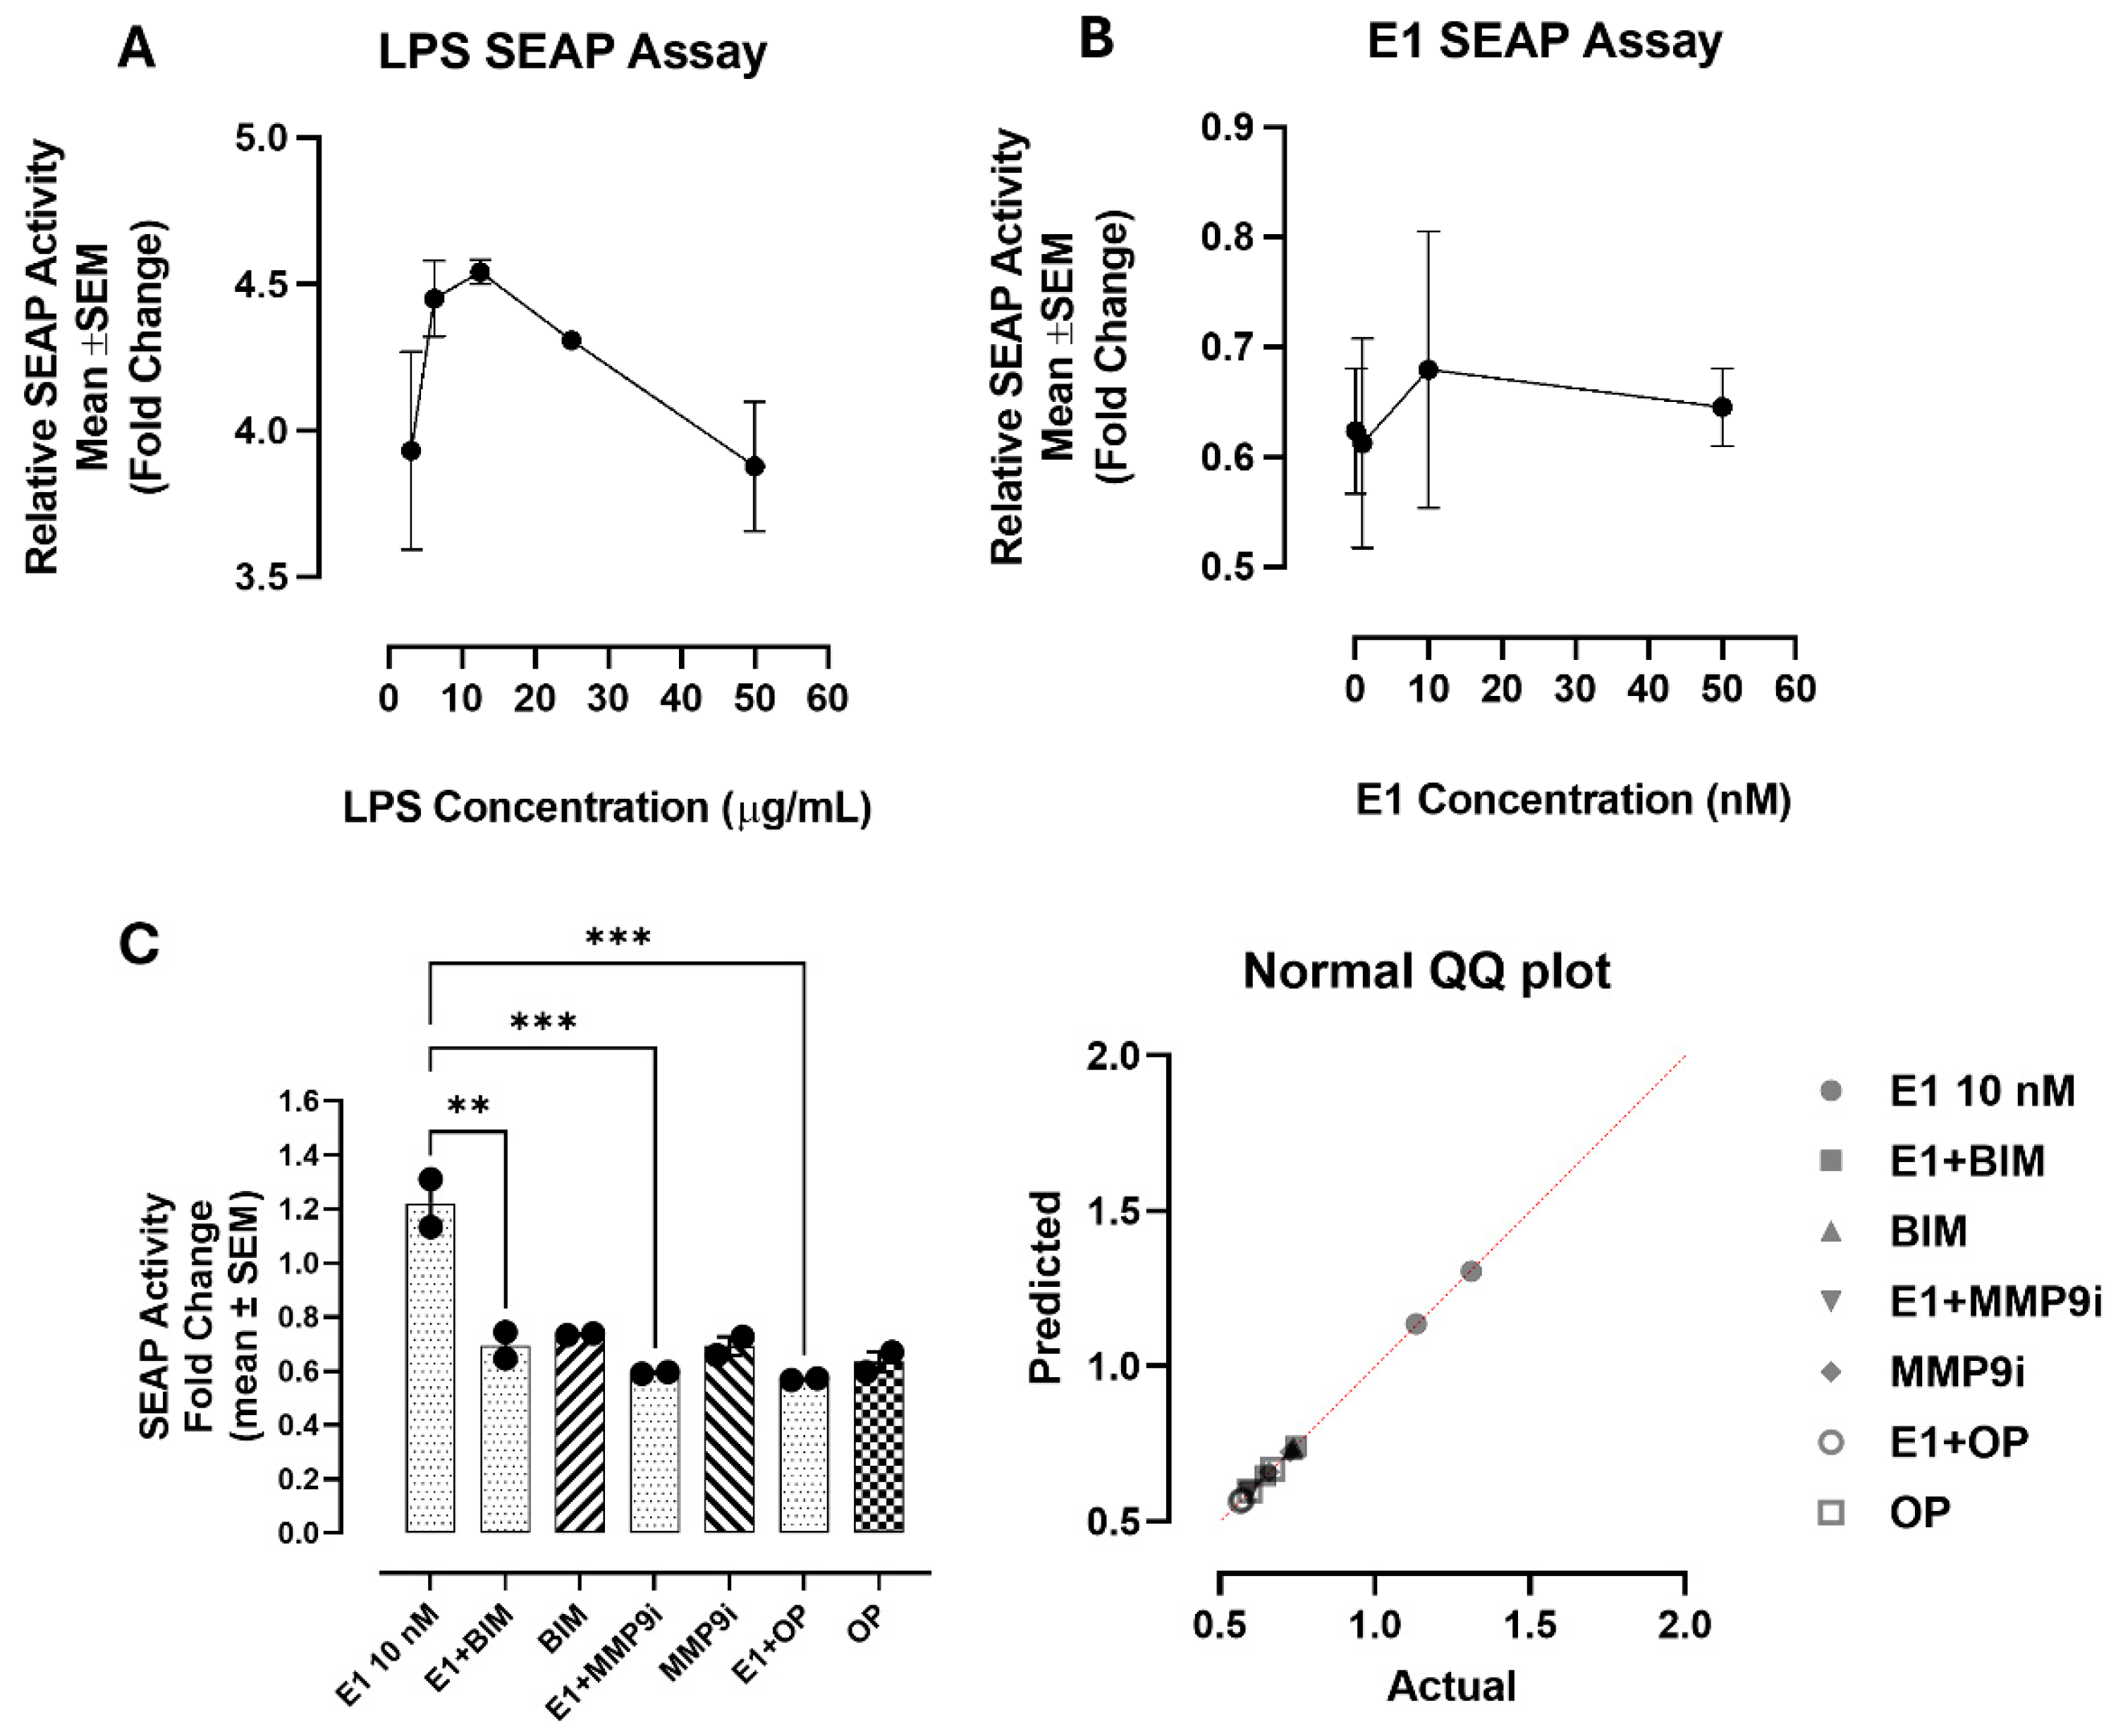
Figure 9.
E1S treatment did not affect cell viability and metabolic activity in MDA-MB-231 cells using the AlamarBlue assay, in a dose-dependent manner. Cells were plated at ~20,000 cells per well in a flat-bottom 96-well plate containing conditioned culture medium for 24 h at 37 ◦C and 5% CO2. Following incubation, the cells were treated with 90 μL of each E1S at the indicated doses in FBS-free medium for 15 min before E1S stimulation. Controls had medium with FBS only. A total of 10 μL of AlamarBlue reagent was added to each well, and the mixture was incubated for 4 h. The absorbance was measured at 570 nm using a spectrophotometer. Data are represented as the mean ± SEM of 3 independent experiments performed in triplicate. Cell viability was determined as the fluorescence corrected for the blank media control divided by the untreated cellular control. A normal QQ plot assesses the normality of a dataset, assuming it follows a normal distribution. Statistical significance was calculated with ANOVA and Fisher’s uncorrected LSD post hoc test at a confidence level of 95%. ns = non-significant.
Figure 9.
E1S treatment did not affect cell viability and metabolic activity in MDA-MB-231 cells using the AlamarBlue assay, in a dose-dependent manner. Cells were plated at ~20,000 cells per well in a flat-bottom 96-well plate containing conditioned culture medium for 24 h at 37 ◦C and 5% CO2. Following incubation, the cells were treated with 90 μL of each E1S at the indicated doses in FBS-free medium for 15 min before E1S stimulation. Controls had medium with FBS only. A total of 10 μL of AlamarBlue reagent was added to each well, and the mixture was incubated for 4 h. The absorbance was measured at 570 nm using a spectrophotometer. Data are represented as the mean ± SEM of 3 independent experiments performed in triplicate. Cell viability was determined as the fluorescence corrected for the blank media control divided by the untreated cellular control. A normal QQ plot assesses the normality of a dataset, assuming it follows a normal distribution. Statistical significance was calculated with ANOVA and Fisher’s uncorrected LSD post hoc test at a confidence level of 95%. ns = non-significant.
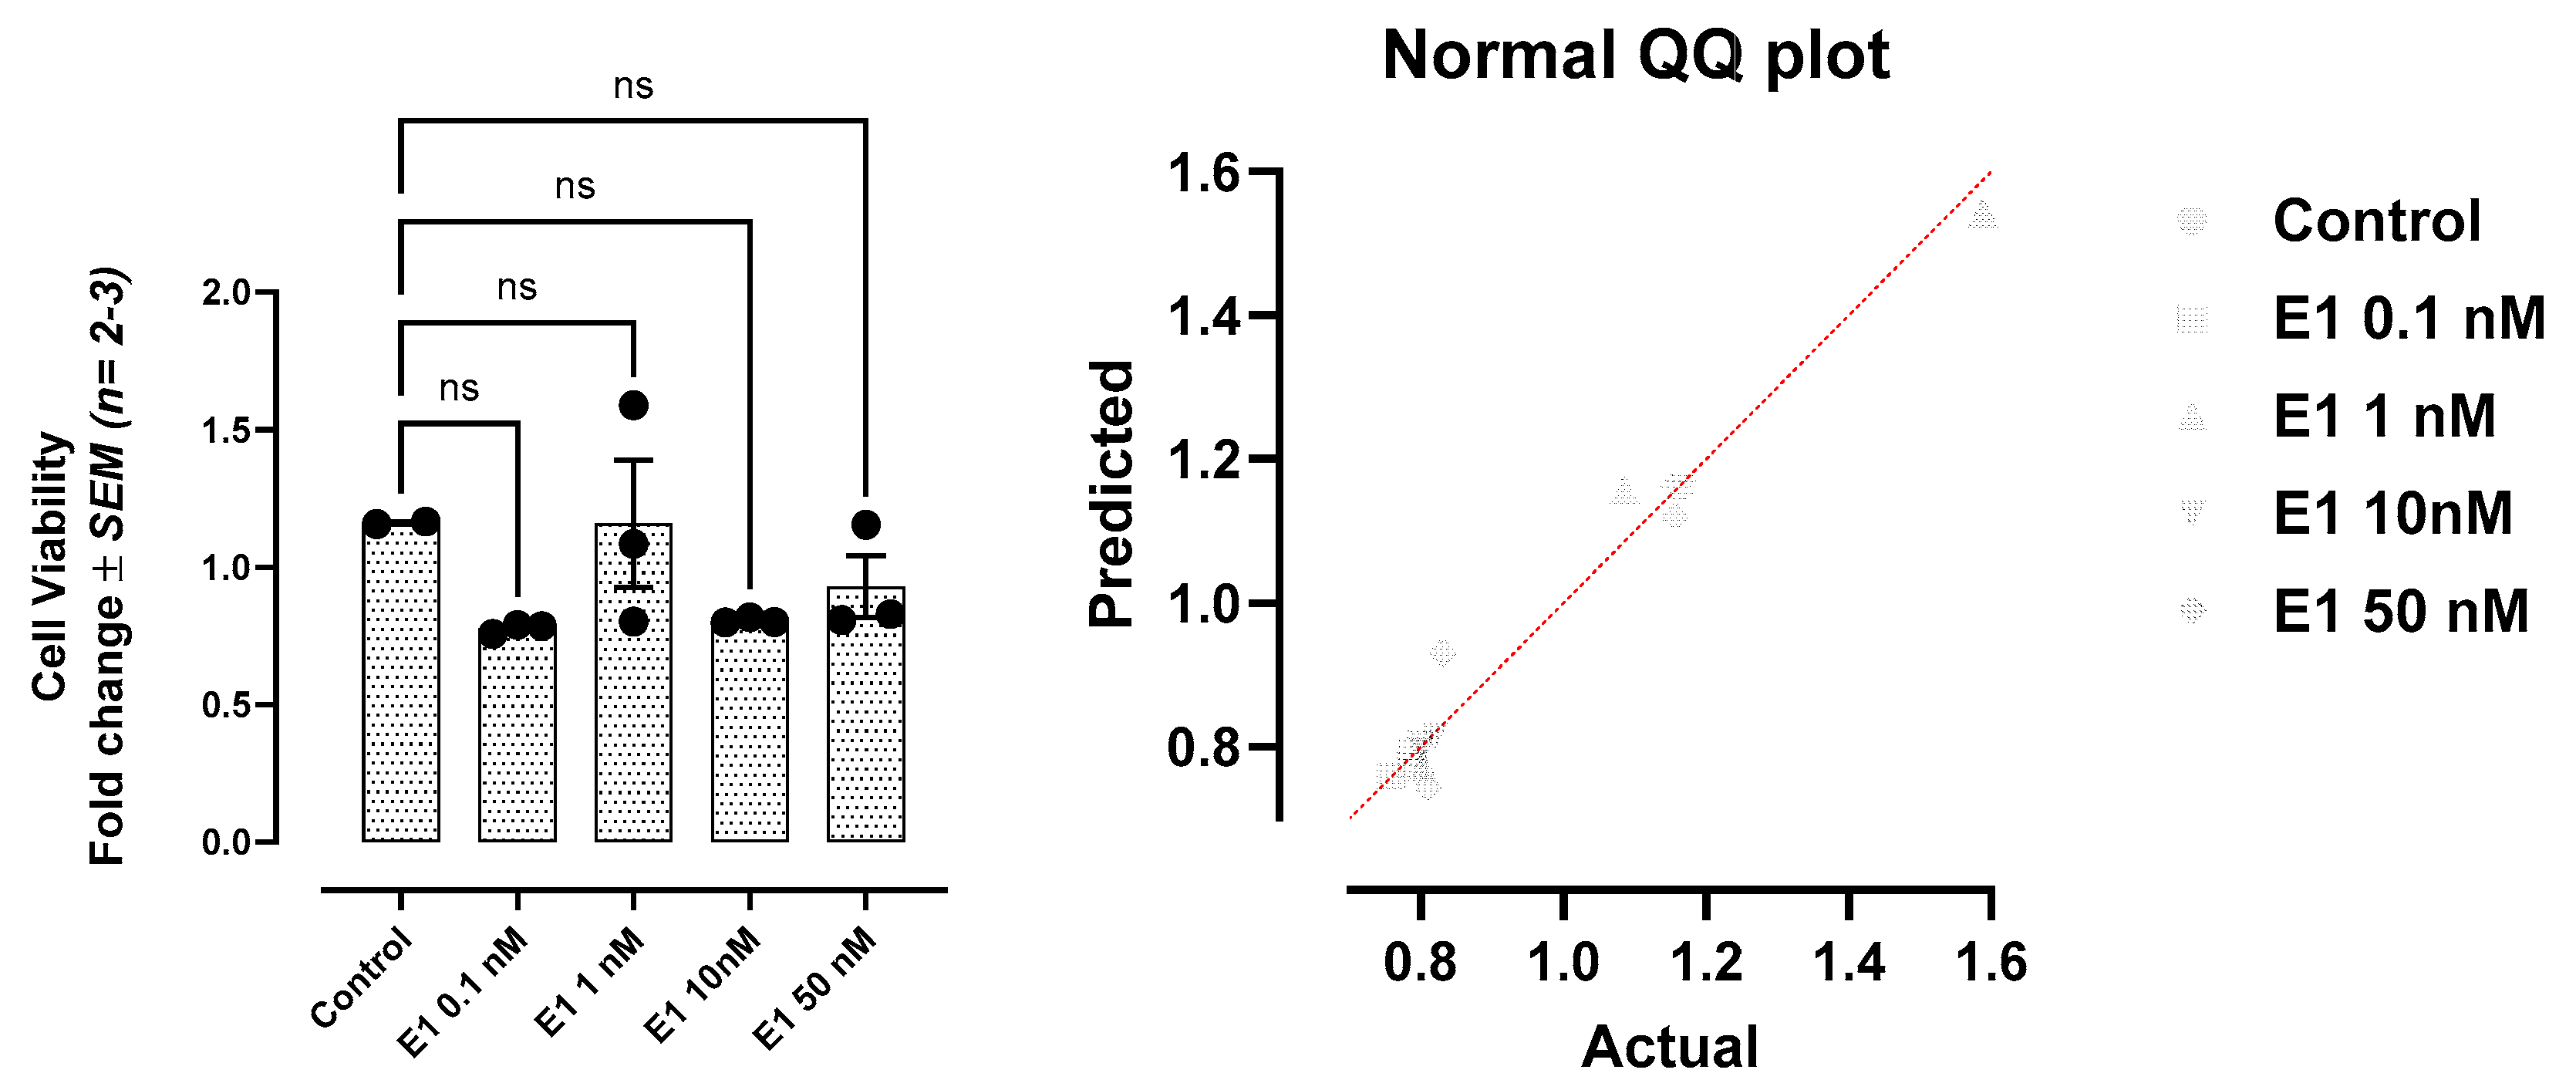
Figure 10.
E1S ablates the migratory potential of (A) MDA-MB-231, (B) MCF-7, and (C) pancreatic PANC-1 cancer cells in a scratch wound assay. Cells were cultured in a 50 mm glass-bottom MatTek culture dish and allowed to adhere to 90% confluence on the glass slide in an incubator at 37 ◦C and 5% CO2. A sterile pipette tip created a scratch wound, and non-adherent cells were removed after washing. The control cells were supplemented with a medium containing 5% fetal bovine serum (FBS). In contrast, the treated cells were supplemented with E1S at the indicated dosages. Imaging was taken with a Nikon Eclipse Ti2 microscope (4× magnification, scale bar) every hour for the first 6 h and at 24 h after the creation of the scratch wound. The wound width was measured at 6–8 points per image using the microscope NIS-Elements AR software, version 5.21.00, and the results were analyzed to create a simple linear regression (red dashed line). GraphPad Prism 10 was used to measure the rate of wound closure, expressed as μm/h. The slope of the linear regression line is the rate of wound gap closure in μm/h ± standard error of the slope. A normal QQ plot assesses the normality of a dataset, assuming it follows a normal distribution. The quantified data represent two to three independent experiments displaying similar results. Statistical significance, as indicated by asterisks, was calculated with ANOVA and Fisher’s LSD uncorrected multiple comparisons at a confidence level of 95%. **** p < 0.0001, and *** p < 0.001.
Figure 10.
E1S ablates the migratory potential of (A) MDA-MB-231, (B) MCF-7, and (C) pancreatic PANC-1 cancer cells in a scratch wound assay. Cells were cultured in a 50 mm glass-bottom MatTek culture dish and allowed to adhere to 90% confluence on the glass slide in an incubator at 37 ◦C and 5% CO2. A sterile pipette tip created a scratch wound, and non-adherent cells were removed after washing. The control cells were supplemented with a medium containing 5% fetal bovine serum (FBS). In contrast, the treated cells were supplemented with E1S at the indicated dosages. Imaging was taken with a Nikon Eclipse Ti2 microscope (4× magnification, scale bar) every hour for the first 6 h and at 24 h after the creation of the scratch wound. The wound width was measured at 6–8 points per image using the microscope NIS-Elements AR software, version 5.21.00, and the results were analyzed to create a simple linear regression (red dashed line). GraphPad Prism 10 was used to measure the rate of wound closure, expressed as μm/h. The slope of the linear regression line is the rate of wound gap closure in μm/h ± standard error of the slope. A normal QQ plot assesses the normality of a dataset, assuming it follows a normal distribution. The quantified data represent two to three independent experiments displaying similar results. Statistical significance, as indicated by asterisks, was calculated with ANOVA and Fisher’s LSD uncorrected multiple comparisons at a confidence level of 95%. **** p < 0.0001, and *** p < 0.001.
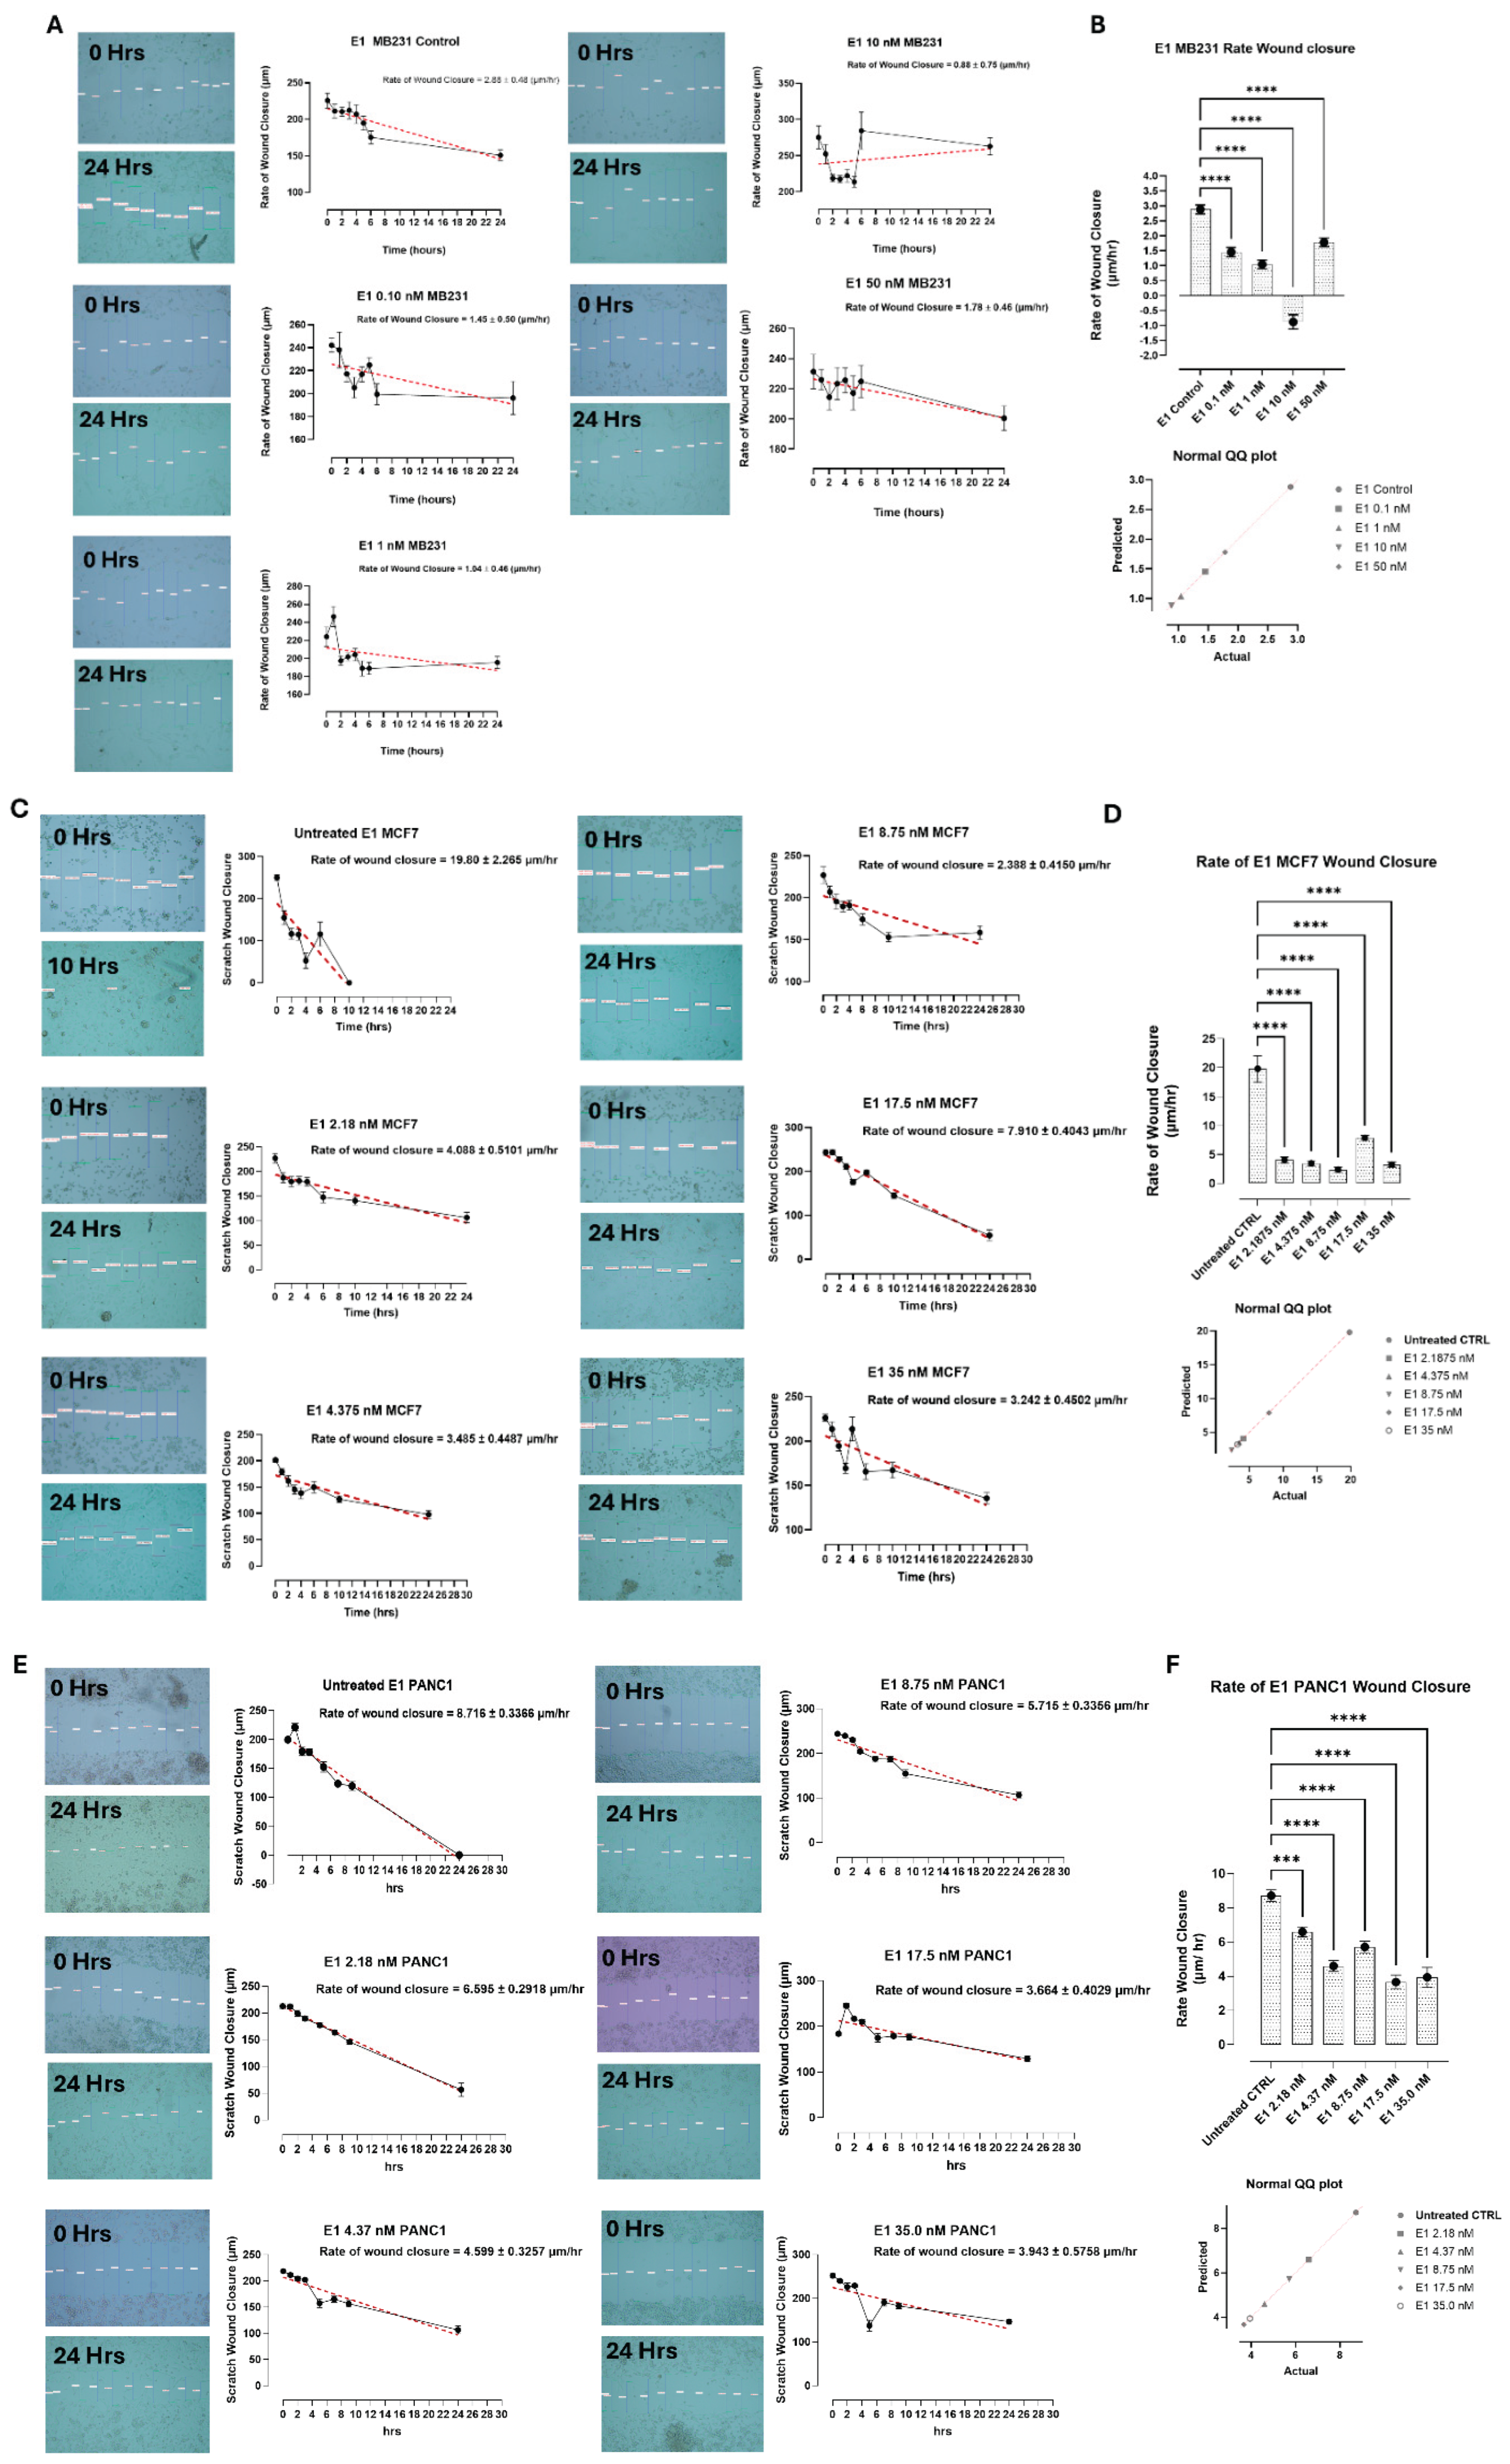
Disclaimer/Publisher’s Note: The statements, opinions and data contained in all publications are solely those of the individual author(s) and contributor(s) and not of MDPI and/or the editor(s). MDPI and/or the editor(s) disclaim responsibility for any injury to people or property resulting from any ideas, methods, instructions or products referred to in the content. |
© 2026 by the authors. Licensee MDPI, Basel, Switzerland. This article is an open access article distributed under the terms and conditions of the Creative Commons Attribution (CC BY) license (http://creativecommons.org/licenses/by/4.0/).
Copyright: This open access article is published under a Creative Commons CC BY 4.0 license, which permit the free download, distribution, and reuse, provided that the author and preprint are cited in any reuse.