
Submitted:
07 September 2026
Posted:
08 September 2026
You are already at the latest version
Abstract
The agri-food industry faces increasing challenges to serve a rapidly growing population amidst intense climate change. Precision agriculture in the era of the 4th industrial revolution relies on digital data that is quickly and reliably generated. Unlike laboratory-bound wet chemistry methods, portable near infrared spectroscopy (NIRS) could provide rapid, non-destructive and on-the-spot assessment of crops with increasing regional importance, such as sweet potatoes. The present study aimed at developing an industrially feasible method by combining the NIR spectra of intact sweet potato samples and chemometrics to predict sweet potato characteristics. Samples from three sweet potato cultivars were stored at three different storage temperatures for one month with eight sampling occasions. Moisture content, total phenolic and total starch content were assessed to serve as reference. Spectra of tubers were recorded with a benchtop and a portable device with different arrangements: through-skin (intact), on cut-surface and on powdered samples. Models to differentiate between cultivars, storage conditions and predict reference parameters were built using principal component analysis (PCA), linear discriminant analysis (LDA) and partial least squares regression (PLSR) with rigorous cross- and test-set validation. Feasible regression models with up to 0.8 R2P could only be reached by using benchtop spectral data on powdered samples. Classification models, however, could reach 79.25% correct prediction to separate sweet potato cultivars by using the handheld spectral data recorded on the surface of intact tubers. The present results imply that handheld NIRS in combination with chemometrics could reach industrially feasible models to rapidly and nondestructively identify sweet potato cultivars, even those that show high physical similarities. The method presented here could be integrated into track and tracing systems where on-the-spot evaluations are necessary to ascertain product identity throughout the entire supply chain.
Keywords:
portable NIRS
; postharvest monitoring
; chemometrics
; farm to fork
; Industry 4.0
; IoT
1. Introduction
The concept of the fourth industrial revolution (Industry 4.0), a significant technological expansion of the 21st century, has first been terminologically introduced and summarized at the Hannover Fair in Germany in 2011 [1]. Whereas the first three industrial revolutions advanced humankind through water/steam engines, electricity and automation, the fourth one focuses on the communication and cooperation of manufacturing units to improve product quality and production efficiency simultaneously via a more precise use of resources [2]. Due to the rapid growth of human population, the concurrent influence of climate change and the fact that our planet’s resources are finite, the agri-food industry faces a pressing challenge to serve a growing demand while minimizing negative environmental impact. While the term “precision agriculture” (PA) has been in use for several decades, it has evolved alongside the technological merits of Industry 4.0 to generate and effectively use tremendous amount of data to support data-driven decision making and precise intervention via “smart” actuators [3,4]. These interventions can only happen effectively if data is also generated effectively; preferably in real time without disrupting supply chains and ecological balance [5].
PA naturally involves the optimal selection of crops for any given environment. Sweet potato (Ipomoea batatas [L.] Lam) is a fibrous and starchy tuber crop with a Latin American origin, that is currently cultivated in over 100 countries worldwide and referred to as the World’s 7th most important food crop in terms of production [6]. While past sweet potato production was clearly dominated by China peaking over 125 million metric tons in 1999 [7,8], due to a sharp decline in acreage in China, the ratio of production is projected to be more even worldwide in the coming decade [9]. This shift is further promoted by the effects of global warming: elevated CO2 levels can drastically increase yields in certain areas while regions previously not suitable for cultivation may reach optimal temperature levels to warrant production [10]. This means that new, region-specific cultivars will likely emerge with the need to differentiate domestic production from import.
Sweet potato is a nutrient-rich root crop that supplies starch together with dietary fiber, minerals, vitamins and bioactive compounds within the same food matrix [11,12]. Its nutritional value is strongly influenced by flesh color and genotype: orange-fleshed sweet potato is rich in provitamin A carotenoids and has been shown to improve vitamin A status in children, while biofortified orange-fleshed varieties have been promoted as a practical food-based strategy for reducing vitamin A deficiency in sub-Saharan Africa [13,14]. Purple-fleshed sweet potato provides an additional functional advantage because it contains anthocyanins and other phenolic compounds that have been studied for antioxidant activity, stability, bioactivity and food applications [15]. These nutritional and phytochemical features support the view of sweet potato as more than a staple carbohydrate; it is a naturally nutrient-dense crop that can contribute to micronutrient intake, dietary diversification and functional food development [11,12].
Its value becomes even more important when the roots are milled into powder, because sweet potato flour provides a stable, versatile ingredient for developing porridges, bakery products, snacks, composite flours and other functional foods without losing the basic nutritional identity of the crop [16]. In powdered form, it can be used to improve nutritional value, natural color, antioxidant contribution and functional properties such as thickening and gelling behavior [16]. This is particularly important for health-oriented product development, since flour and powder forms can be incorporated into porridges, bakery products, snacks and composite flours while retaining key crop-specific attributes, depending on the cultivar and processing conditions [12,16]. From a precision nutrition perspective, sweet potato is also relevant because its glycemic behavior is affected by cooking method, with reported glycemic index values differing among boiled, baked, roasted, fried, steamed and microwaved preparations [17]. Since postprandial glycemic responses vary substantially among individuals, sweet potato powders and flour-based products could be designed more deliberately by selecting appropriate flesh types, drying methods, particle characteristics and formulations to support specific nutritional goals, including provitamin A delivery, polyphenol intake and moderation of glucose response [17,18].
Whether sold raw or as processed product or ingredient, the increase in domestic production combined with the recent advancements and opportunities of PA advocate for developments regarding sweet potato supply chains both from quality control and a traceability point of view. The post-harvest handling of these crops is particularly important to ensure a steady supply year-long, especially since market price gradually increases in subsequent months after harvest [19]. Proper handling will not only preserve the freshness of tubers but will promote an adequate level of saccharification—the gradual biochemical change of starch to soluble sugars [20]. Saccharification is necessary for the development of the characteristic sweet taste, improves possibilities of processing due to the increase in sugar content and determines economic value [21].
The optimal temperature is between 13-16 °C and the optimal relative humidity is 80-85% for most sweet potato varieties during storage [22,23]. Prolonged storage under 10 °C could result in the hardening of the parenchyma (lignification), while storage above 20 °C might result in sprouting [22], both potentially diminishing product quality. α- and β-amylases, enzymes with an important role in saccharification, have shown increased activity in early stages of optimal storage [24,25], which decreases over longer storage [23]. Lower than optimal storage temperature can result in enzyme inactivation and the inhibition of starch to sugar conversion [26], while higher than optimal temperature could result in amplified metabolic activity, higher respiration rates and a loss in mass [27].
Monitoring the physical and chemical changes during sweet potato storage is important to verify proper handling and determine ideal further processing steps. Sweet potato quality characterization commonly relies on laboratory reference methods which remain important for accurate quantification. However, they are destructive, time-consuming and not well suited to rapid screening during breeding, storage, grading or processing [28,29,30]. Near-infrared spectroscopy (NIRS) has therefore gained considerable attention as a rapid, non-destructive tool for sweet potato quality evaluation. When combined with appropriate chemometric models, NIRS can estimate several quality attributes from spectral information with minimal sample preparation [29,30,31]. Previous studies have demonstrated its application for predicting dry matter, starch, sucrose, protein, β-carotene, minerals, starch thermal properties, noodle quality and sugars in sweet potato roots and derived products [28,32,33,34]. However, much of the existing work has been based on prepared materials, including starch isolates, freeze-dried powders, milled flours and homogenized samples. While such preparation improves spectral repeatability and model development, it does not fully reflect the conditions under which sweet potato roots are handled after harvest or assessed before processing [30,35,36].
The present study addresses this gap by testing NIRS under conditions that more closely represent practical sweet potato handling. This includes multiple cultivars subjected to different storage conditions and measured using multiple spectral acquisition arrangements, including freshly cut surfaces and intact roots. The study also aimed to test an affordable handheld NIR instrument together with a benchtop device to determine analytical reliability across cultivar, storage, presentation mode and instrument type. This provides more realistic basis for translating NIRS from controlled laboratory calibration to postharvest quality monitoring, rapid grading and processing decisions. In the longer term, robust models developed under these conditions could support digital traceability systems in which spectral predictions are linked with cultivar identity, batch information, storage history and location data for IoT-enabled decision-making across the sweet potato value chain [37,38].
2. Materials and Methods
2.1. Sample Acquisition and Handling
A total of 156 sweet potato tubers were acquired from a certified local producer (Ozsváth-Agro Kft.), split between three cultivars. Cultivars were selected to represent a purple variety (Sakura) and two orange-fleshed varieties (Orleans, Beauregard) that are more difficult to differentiate by visual inspection. Tubers were between 300 and 800 grams, free from visible surface defects. Tubers were individually tagged based on a barcode system to improve future sample handling and identification and were immediately assigned to one of three storage units. Samples were evenly split and stored for a total of 31 days at 5 °C (below-optimal), 15 °C (optimal) or 25 °C (above-optimal) at 80-90% relative humidity, mimicking three different real-life storage scenarios: fridge, basement (cool)-storage and room temperature storage, respectively. Storage temperature and humidity were monitored using a CAEN RT0013 Dual Frequency Rain/NFC Data Logger Tag (CAEN RFID, Viareggio, Italy) and a Voltcraft DL-121TH multi-data logger (Conrad Electronic, Berlin, Germany). There were a total of 8 samplings (measurement days) with increasing frequency as the storage progressed. In each sampling, samples were randomly selected but stratified to evenly represent all three types and all three storage conditions. Samples were removed from the storage units 2 hours prior to measurement to account for temperature differences.
2.2. Chemical/Physical Reference Measurements
Reference measurements were performed on 9 samples (3 types x 3 storage conditions) for each measurement day, except for the first day (measurement 1) with only 3 samples, since separate storage conditions were not yet applicable, totaling 66 samples with a reference value. Samples were cut, frozen, freeze-dried and powdered in a blender in preparation for subsequent chemical analysis.
2.2.1. Moisture Content Determination
50-60 g of cut and peeled sweet potato (evenly selected from all parts of a given tuber) was measured into Petri-dishes and was freeze dried (SCANVAC, CoolSafe, LaboGene, Lillerød, Denmark). The moisture content was determined gravimetrically by measuring the initial and final weight of the samples.
2.2.2. Total Phenolic Content (TPC)
The total phenolic content of the samples was assessed based on the method described by Franková and colleagues [39], with a few modifications. For the extraction, 5 g of lyophilized and powdered sweet potato was weighed in centrifuge tubes, followed by the addition of 10 mL of 80% methanol. The samples were mixed in a horizontal shaker (IKA HS-501, IKA-Werke GmbH & Co. KG, Staufen, Germany) for 12 hours, after which they were centrifuged at 6000 rpm for 10 minutes (MPW 260R, MPW MED. INSTRUMENTS, Warsaw, Poland). 1.25 mL of Folin–Ciocalteu reagent was added to 0.25 mL sample aliquots with the subsequent addition of 1 mL of sodium carbonate to provide an alkaline environment required for the reaction. Samples were incubated in 50 °C water bath for 5 minutes prior to spectroscopic assessment at 760 nm (Thermo Scientific Genesys 10S UV-Vis Spectrophotometer, Thermo Fisher Scientific Inc., Waltham, Massachusetts, USA). The average results of three replicates/sample were expressed in gallic acid equivalent (GAE mg/g).
2.2.3. Total Starch Content (α-Amylase/Amyloglucosidase)
The total starch content was determined using a commercial enzymatic assay kit (Total Starch Assay Kit, Megazyme, Bray, Ireland) according to the manufacturer’s instructions based on the internationally recognized AOAC Method 996.11. The method revolves around the quantitative enzymatic hydrolysis of starch to glucose using amylase and amyloglucosidase enzymes following gelatinization. The released glucose is then measured following the addition of glucose oxidase/peroxidase (GOPOD) reagent, spectroscopically at 510 nm (Thermo Scientific Genesys 10S UV-Vis Spectrophotometer, Thermo Fisher Scientific Inc., Waltham, Massachusetts, USA). Starch values were calculated based on the absorbance values using the conversion factors provided by the manufacturer and expressed in g/100g. Moisture content of the samples was considered to obtain the final values. All analytical procedures, including sample preparation, enzymatic incubation conditions, reagent volumes, and calculation of results, were performed strictly according to the manufacturer’s protocol without modification (“b” sub-version—“determination of total starch content of samples containing resistant starch”) [40].
2.3. NIR Spectral Acquisition
NIR spectra of samples were recorded prior to/during sample preparation for reference measurements in different arrangements. At any given measurement session, all available tuber samples were surface scanned at three areas (“top”, “middle”, “bottom”) with three consecutives using a NIR-S-G1 (InnoSpectra Co., Hsinchu, Taiwan) handheld spectrometer in the 900-1700 nm wavelength range with a resolution of 3 nm. Samples selected for reference measurements were cut horizontally at the “top”, “middle”, “bottom” sections and the cut surfaces were scanned using the same handheld device. Cut-surface scans were performed through a 0.5 mm polyethylene layer in three positions progressing from the edge to the center, each with three consecutives, resulting in a total of 27 recorded spectra for each tuber.
Cut surfaces were also scanned using a Bruker MPA FT-NIR benchtop spectrometer (Bruker Optik GmbH, Ettlingen, Germany) in the 12500—3600 cm-1 wavenumber range, for comparative reasons. A single measurement (average of 64 scans) was performed per cut surface (“top”, “middle” and “bottom”) through the same polyethylene layer, totaling three spectra per tuber.
Spectra of the powdered samples were also taken with both devices: spectra with the handheld instrument were recorded through low density polyethylene (LDPE) plastic bags by forming a layer of the powdered sample and using a gold reflector to minimize the loss of spectral information due to transmission; spectra with the benchtop device were acquired using a glass cuvette without a reflector. Three repacks were performed for each sample with both devices. Additionally, 10 consecutive scans were performed per repack for the handheld device to better match the spectra number recorded at the cut-surface measurements. Across all devices and arrangements, a total of 12756 spectra were recorded in this experiment.
The experimental design with a summary of the spectral measurements is summarized in Table 1.
2.4. Statistical Methods
2.4.1. Univariate Statistical Methods for Reference Measurements
All statistical analyses and data visualization were performed in R version 4.5.0 using RStudio with the tidyverse, car, agricolae, emmeans, and rstatix packages for data handling, assumption testing, post-hoc comparisons, and effect size estimation. The dataset comprises 66 observations from three sweet potato cultivars (Beauregard, Orleans, Sakura), three storage temperatures (5, 15, and 25 °C), and eight storage times (measurement 1–8). Note: measurement 1 had no separate storage conditions, hence the 66 total observations (instead of 72). Three continuous chemical responses were analyzed separately: Moisture (%), Total Phenolic Content (TPC; mg GA/g), Total Starch (TS; g/100g). Cultivar, temperature, and time were treated as fixed factors; descriptive statistics were first used to summarize central tendency and dispersion across groups. Model assumptions were assessed using Shapiro-Wilk tests on residuals for normality and Levene’s test for homogeneity of variances.
A two-way ANOVA was fitted for cultivar and temperature, followed by a three-way ANOVA including cultivar, temperature, and storage time to test main effects, two-way interactions, and the three-way interaction. Where significant effects were identified, pairwise comparisons were performed using Tukey’s Honestly Significant Difference (HSD) with a family-wise error control at α = 0.05. Effect sizes were reported as partial eta-squared (η2p) with 95% confidence intervals. For responses showing heteroscedasticity, sensitivity analyses using Kruskal-Wallis tests were performed to confirm the robustness of the parametric results.
Assumption testing supported the ANOVA framework for moisture and total starch but was less satisfactory for total phenolic content. Residuals for moisture content and total starch did not deviate significantly from normality, (W = 0.970, p = 0.1128) and (W = 0.983, p = 0.7928) respectively according to the Shapiro-Wilk test. Their homogeneity of variances was also supported by Levene’s test: moisture content (F = 0.7992, p = 0.6057) and total starch (F = 0.2809, p = 0.9697). In contrast, total phenolic content violated both the normality assumption (W = 0.9218, p = 0.0004811) and homoscedasticity (F = 3.4498, p = 0.002636). To address this, non-parametric Kruskal-Wallis tests were conducted, which confirmed the same pattern of significance observed in the parametric ANOVA (χ2(2) = 42.31, p < 0.001).
2.4.2. Exploratory Analysis of the NIR Spectroscopic Data
For each sub-dataset, raw spectra were visualized to identify prominent wavelength regions, obvious outliers and scattering/instrument artifacts. These observations were used to truncate the spectral region of focus and to select the adequate spectral pretreatments. Principal component analysis (PCA), a multivariate technique often used to compress datasets with high dimensionality [41], was utilized to recognize patterns in the spectral data, help with further outlier removal and verify the selected pretreatment combination. Mathematical pretreatments are often used to reduce unwanted information in spectral data prior to supervised modelling [42]. Accordingly, to mitigate the effects of spectral noise, light scattering and physical variance, different combinations of pretreatment methods were tested, namely Savitzky-Golay (SG) filter with 2nd order polynomial and 11-31 smoothing points, multiplicative scattering correction (MSC), standard normal variate (SNV), second derivative (SD) and detrending (DT). The pretreatment combination that best mitigated the baseline shift and curvature differences of the raw spectra and provided the clearest separation of measurement points on PCA score plots was selected for further modelling. This selection was revised during the modelling phase and adjusted if needed to achieve more robust models for a specific parameter.
2.4.2. Supervised Classification Modelling to Separate Cultivars and Storage Conditions Using Linear Discriminant Analysis
Models to classify cultivars and storage conditions were built using principal component analysis-based linear discriminant analysis (PCA-LDA). Each model was validated using a three-fold stratified cross-validation method. Consecutive spectra (involving repacks where applicable) were always assigned to the same fold to avoid information leakage. Folds were generated in a way that the distribution of the classification groups across folds was preserved to avoid uneven group representation. Consequently, each sample was used for both training and validation. Model performance was visualized as score plots and confusion matrices and was quantitatively expressed as average correct recognition (calibration) and prediction (cross-validation) percentage values. The correct number of components (PCs) were selected using modified scree plots; generally, the component number that resulted in the highest correct prediction value and simultaneously had the smallest difference from correct recognition values was selected. This approach was used to minimize the risk of both under- and overfitting. Variable importance was estimated by projecting the LDA coefficients back into the original spectral space using the PCA loading matrix. These vectors were also used to identify the inclusion of noise by applying too many components during modelling.
2.4.3. Regression Modelling to Predict Reference Values Using Partial Least Squares Regression
Regression models to predict storage time, total phenolic content and total starch content were built using partial least square regression (PLSR). A 10-fold cross-validation was applied to help model optimization. During validation, similarly to LDA, consecutive spectra belonging to the same sample were always kept together when validation folds were created. Model optimization involved adjusting the number of latent variables applied while observing error and regression vector plots. This procedure was necessary as using too few latent variables could underfit the model causing sub-optimal predictive performance; while using too many would increase the risk of overfitting, making the model too specific for the given dataset, reducing robustness. In general, latent variable numbers were increased as long as (I) the cross-validation error decreased, (II) the difference between calibration and cross-validation errors did not sharply increase, (III) there was no substantial loss of clear structure of regression vectors that could imply the inclusion of unwanted variance during modelling [45,46].
Test-set prediction was performed after cross-validation to further evaluate model reliability by applying a representatively selected 20% of the dataset (covering the entire concentration range) as a prediction set, repeated thrice with a different sampling.
Performance of regression models was evaluated based on performance metrics, namely root mean square error of calibration (RMSEC), root mean square error of cross-validation (RMSECV), root mean square error of test-set prediction (RMSEP), determination coefficient of calibration (R2C), determination coefficient of cross-validation (R2CV) and determination coefficient of test-set prediction (R2P). Since modelling was always repeated with a different sampling, model metrics were averaged with standard deviations calculated to serve as additional information regarding repeatability. All spectral data evaluation and visualization were achieved using R-project (v. 4.3.0, 2023, The R Foundation for Statistical Computing, Vienna, Austria; using R package: aquap2 [47]).
3. Results
3.1. Evaluation of the Reference Data Describing Sweet Potato Composition
3.1.1. Evaluation of the Reference Data (Moisture, Total Starch, Total Phenolic Content) of Sweet Potato Samples Using Descriptive Statistics
Descriptive statistics revealed clear cultivar-dependent differences across all measured quality parameters. Moisture content (Figure 1) ranged from 71.12% to 85.82% with Orleans exhibiting the highest mean moisture (82.05%) and Sakura the lowest (75.13%). Total phenolic content (Figure 2) ranged from 0.14 to 3.97 mg GA/g, and Sakura having the highest mean value (2.58 mg GA/g) relative to Beauregard (0.46 mg GA/g) and Orleans (0.48 mg GA/g). Total starch content (Figure 3) ranged from 2.97 to 11.74 g/100 g, with Sakura again showing the highest mean value (8.39 g/100 g) followed by Beauregard (6.41 g/100g) and Orleans (5.12 g/100g). These descriptive patterns already suggest strong cultivar-dependent differences across all response variables, with Sakura having a distinctly different compositional profile, combining lower moisture with higher phenolic and starch contents. Regarding the values across the storage conditions, samples exhibited the lowest mean moisture content on 5 °C as 78.64%, with slightly higher mean values at 15 °C (79.08%) and 25 °C (79.18%). Mean total phenolic content values were very close as 1.14, 1.10 and 1.17 mg GA/g on 5, 15 and 25 °C, respectively. Total starch values showed an incremental tendency as the temperature increased with mean values of 6.10, 6.75 and 7.15 for 5, 15 and 25 °C, respectively. Note that this latter tendency was only true (and very prominent) for the Sakura cultivar, as for the other cultivars, the highest average starch value was measured at 15 °C.
In general, however, there was a lack of clear pattern in the change of parameters as the storage progressed in most cases.
3.1.2. Evaluation of the Reference Data (Moisture, Total Starch, Total Phenolic Content) of Sweet Potato Samples Using ANOVA
The two-way ANOVA revealed that cultivar was the dominant source of variation for all three responses. For moisture content, Type (cultivar) showed a very strong effect (F = 95.786, p < 2e-16, η2p = 0.77) and explained most of the variance, storage temperature alone had no detectable main effect (F = 0.810, p = 0.4498, η2p = 0.03). However, the Type × Temperature interaction was significant (F = 4.575, p = 0.00284, η2p = 0.24) meaning that the influence of storage temperature on moisture was cultivar-specific rather than general. Tukey HSD post hoc testing confirmed that all three varieties differed significantly from each other, ranking as Orleans > Beauregard > Sakura for moisture content. Post -hoc Tukey HSD tests for Temperature revealed no significant differences among any of the three temperature levels (all p > 0.46) suggesting that storage temperature, when averaged across cultivars, was not sufficient to shift moisture substantially.
Total phenolic content showed the clearest and most consistent cultivar separation. The ANOVA showed a highly significant Type effect (F = 109.784, p < 2e-16, η2p = 0.79), but in contrast, Temperature (F = 0.408, p = 0.667, η2p = 0.01) and Type × Temperature interaction (F = 0.159, p = 0.958, η2p = 0.01), were both negligible. Tukey HSD tests showed that Sakura had markedly higher phenolic content than both Beauregard (p < 0.001), and Orleans (p < 0.001), while Beauregard and Orleans did not differ from one another (Δ = 0.0241 mg GA/g, p = 0.988). Neither storage temperature nor its interaction with cultivar altered this conclusion, suggesting that TPC was relatively stable over the tested storage range.
Total Starch followed a more complex pattern. Type again had a large effect (F = 41.843, p < 0.001, η2p = 0.59), but so did Temperature (F = 5.489, p = 0.00661, η2p = 0.16), and the Type × Temperature interaction (F = 3.975, p = 0.00651, η2p = 0.22). This could thus be summarized that starch content was shaped both by genetic background and by storage environment, with the temperature response depending on cultivar identity. Tukey HSD tests showed that Sakura had significantly higher starch content than Beauregard (Δ = 1.98 g/100g, p < 0.001) and Orleans (Δ = 3.26 g/100g, p < 0.001). Temperature comparisons further showed that starch at 5 °C was significantly lower than at 25 °C, while intermediate contrasts were not significant at the 0.05 level.
The three-way ANOVA incorporating cultivar, storage temperature, and storage time and their interactions, was used to assess the temporal dimension of the data, although the non-replicated structure meant that inference from the highest-order model was interpreted cautiously. In this setting, the relative mean squares are informative, but F-tests and p-values could not be computed at the full three-factor level. For moisture content, Type remained the dominant source of variation (mean square: 272.95), but the Type × Temperature (mean square: 13.04), Type × Day (mean square: 4.15), and Type × Temperature × Day (mean square: 2.53) components were all non-trivial. This pattern was consistent with the two-way interaction and suggests that moisture behavior was not static across the storage period.
For TPC, Type again accounted for the largest share of variation (64.87), but Day (3.14), Type × Day (7.37), Temp × Day (2.34), and the three-way interaction (3.99) showed that phenolic content was not entirely stable over storage, even though temperature had little effect in the reduced two-way model.
Total starch showed the most interaction-rich profile. Substantial contributions from Type (118.94), Temperature (15.60), Day (16.96), Type × Temperature (22.60), Type × Day (18.49), Temperature × Day (14.66), and Type × Temperature × Day (30.90) provided evidence that starch content changed dynamically over storage conditions and that its trajectory depended on the combined action of cultivar and storage temperature.
Overall, the data indicates that Sakura is the most compositionally distinct cultivar, combining low moisture with high phenolic content and high starch, whereas Orleans is characterized by higher moisture and lower solids, and Beauregard occupies an intermediate position for most traits.
To evaluate whether storage duration induced any significant changes in the chemical parameters, we compared the first day (Day 0) versus the middle of the storage (Day 15) and the last storage day (Day 31) for each cultivar using independent t-tests (Figure 4, Figure 5 and Figure 6). Over the 31-day storage period, most of chemical parameters remained relatively stable, although cultivar-specific differences were observed across storage intervals. Moisture content differed significantly (p < 0.05) only in Sakura, and only between the middle and end of storage period. For starch content, Beauregard was the only cultivar showing a significant difference (p < 0.05), again between the middle and end of storage period. Total phenolic content however, showed greater variability with Beauregard and Orleans differing significantly between the start and middle of storage, whereas Sakura showed significant differences both between the start and end and between the middle and end of storage. Overall, changes in chemical composition of the sweet potato samples were limited and appeared to depend on both cultivar and storage period.
3.2. Exploratory Evaluation of the NIR Spectroscopic Data
Raw spectra of the different sub-datasets with the initially applied pretreatment combinations are summarized in Figure 7. A small truncation was necessary for the handheld device (to 950-1650 nm) for all sub-datasets due to instrument artifacts, while the higher wavelength region (part of first overtone + combination bands) for the benchtop cut-surface measurements also showed substantial noise and a strong influence of water—hence this region was also omitted. The potential influence of the PE intermediate material was only visible at around 2350–2400 nm with two well-resolved, sharp peaks for the benchtop spectra (cut surface) and potentially at ~1220 nm for the handheld device (powder). These peaks have previously been assigned as characteristic of PE polymer, with no regard to matrix [48], while it was also verified that this phenomenon had negligible effect on modelling [46], hence the spectra were not corrected specifically to mitigate this variance.
In general, baseline variation was the least noticeable for the spectra of powdered samples, with the most substantial variation, as expected, for the through-skin measurements using the handheld device. In most cases a sizeable curvature difference was also observed. Upon initial observations, detrending was successful to account for both the baseline and the curvature differences in most cases, hence it was used as a starting point for subsequent modelling.
For the cut-surface and through-skin datasets, unsurprisingly, a clear dominance of the water band in the second overtone region was visible, with an additional region of interest in the 1100-1300 nm domain mostly representing CH, CH2 and CH3 containing compounds. For the benchtop dataset recorded on powdered samples, several prominent regions were visible outside of the water-dominant peaks around 1350 and 1950 nm (denotable to acids and esters), mostly in the combination bands. The prominent peak at ~2100 nm could stand for polysaccharides, primary amids or alcohols [49], which would imply a variance in carbohydrate and protein content and a potential conversion of sugar to alcohols. This latter would not be impossible, as fungal presence was visible for the 25 °C group in later stages of the storage. The region at 2200-2400 nm region had several prominent peaks that could stand for CH, CH2, CH3, CHO and primary amines, signaling the potential importance of the longer wavelength region in the subsequent modelling phase. This region is also known to highlight the presence of various carbohydrates (monomers to polymers) [50] that could be a primary source of variance in the samples.
Since the presumably best-performing sub-dataset was the benchtop one recorded on powdered samples, in-depth PCA results were only included for that part of the dataset. PCA results to separate measurement points belonging to the different cultivars are summarized in Figure 8. By observing the score plots for the entire sub-dataset (Figure 8/A), some heavily overlapping separation was visible along the second principal component accounting for 17.41% of the total variance. Upon observing the loadings vector, outside of the previously noted prominent region at 2200-2400 nm, the ~1700 nm region primarily attributed to C-H, C-H2, C-H3 seemed also important. Figure 8/B-D illustrates the separation patterns when only a single storage condition was observed. While group overlaps and inter-group spread of the measurement points were still visible, some additional features could be noted. Group separation along the 2nd principal component was still prominent on 5 and 25 °C, while the effect of the 1st principal component (accounting for 43.84% of variance) was more obvious on the 15 °C split, highlighting the increased importance of the water bands for this separation in the first and second overtone regions. On 5 °C, points belonging to Orleans showed a more notable inter-group variance along the 2nd PC, while a similar pattern could be observed on 25 °C for the measurement points of the Sakura cultivar. This latter observation is in good agreement with the chemical results (Figure 1, Figure 3). The results imply that chemical change was more visible in the spectral data for Orleans and Sakura on 5 °C and 25 °C, respectively, while on the “correct” storage condition (15 °C) differences in moisture were relatively more pronounced.
Figure 9 shows the PCA results for the different storage conditions. Although the groups heavily overlapped, in most cases, the intra-group separation was more pronounced along the 1st PC, while inter-group separation was more visible along the 2nd PC. When looking at the entire sub-dataset (Figure 9/A), the 5 °C group had the clearest separation along the 1st PC, showing notable intra-group variance along both PC1 and PC2, while the 15 and 25 °C groups were not clearly separable. A similar tendency was visible while focusing on just the Sakura cultivar (Figure 9/B), which was even more pronounced, while for the Orleans cultivar (Figure 9/C) the 25 °C had the most notable intra-group spread involving both PCs. Looking at just the Beauregard cultivar, (Figure 9/D) there was no clear pattern for the spread of the measurement points.
3.3. Classification of Sweet Potato Cultivars and Storage Conditions Based on NIR Spectroscopic Data
Table 2 shows the LDA results to classify the different sweet potato cultivars using bench top and handheld devices at different wavelength ranges and tested pretreatments for the pooled dataset. Relevant confusion matrices were attached to Appendix A. The highest average correct recognition and prediction was reached for the benchtop-powder sub-dataset with 89.39 and 84.35%, respectively, with misclassification mainly happening between Beauregard and Orleans, which was expected (Table A1). Following cross-validation, Beauregard was 75.77% correctly classified with 19.68% misclassification as Orleans, while correct classification was 78.77% for Orleans, with a 21.33% misclassification as Beauregard. Sakura was correctly predicted in 98.50% of the cases.
The second-best results were reached with the handheld-skin sub-dataset with an 80.15% average correct recognition and 79.25% average correct prediction, surpassing all cut-surface arrangements. Confusion matrices (Table A2) showed that misclassification was more evenly distributed than in the case of the powdered samples; with Beauregard 79.60% correctly predicted and misclassified as Orleans and Sakura 9.76% and 10.64% of the cases, respectively. Orleans, on the other hand, was 82.49% correctly predicted with the majority of the misclassification as Sakura (13.99%). Similarly, Sakura was 75.66% correctly predicted with a 19.12% misclassification as Orleans. In general, through-skin measurements provided better classification models to separate the two physically similar cultivars than powder measurements.
Table 3 presents the LDA classification performance for discriminating sweet potato samples according to storage conditions using the benchtop MPA FT-NIR and handheld NIR-S-G1 spectrometers under different sample arrangements. Overall, the highest classification performance was achieved using powdered samples analyzed with the benchtop MPA FT-NIR instrument. Following detrending (DT) preprocessing, the model employed 11 principal components and achieved an average recognition rate of 87.05% and an average prediction accuracy of 71.83%. In accordance with the observations during exploratory analysis (Figure 6), the 5 °C storage temperature separated by far the most with an 84.14% correct prediction and a misclassification of 11.10% and 4.76% as 15 °C and 25 °C, respectively (Table A3). Most of the overlap happened between the 15 and 25 °C groups.
Contrary to the cultivar-based models, classification performance declined substantially for intact samples. The handheld-skin measurements generally resulted in poor predictive performance with a 54.46% average correct recognition and a 53.11% average correct prediction. The 5 °C and 25 °C groups were correctly classified in 64.47% and 60.36% of the cases, respectively, while the 15 °C was heavily misclassified as both 5 °C and 25 °C (Table A4).
The second-best preforming model was achieved with the handheld-powder sub-dataset with a 67.03% average correct recognition and a 62.10% average correct prediction, while also using notably fewer principal components (4). While the 5 and 15 °C groups were predicted with higher accuracies of 74.62 and 58.33%, worse performance was obtained to classify the 25 °C group at 53.35% (Table A5)—following the trend observed for the benchtop-powder dataset, just with inferior metrics.
The greater difference between calibration and cross-validation accuracies, that was visible for most sub-datasets, implies a lower generalization ability of these models. Overall, for the classification of samples belonging to different temperature conditions, only the benchtop-powder sub-dataset provided a feasible model.
The two best-performing sub-datasets during cultivar classification were further evaluated by focusing on a single storage temperature at a time and by visualizing LDA score plots, summarized in Figure 10. Relevant confusion matrices were attached to Appendix B. The best predictive accuracy to classify cultivars was reached using the benchtop-powder sub-dataset and only the 5 °C storage condition, with a 100% average correct recognition and 85.71% average correct prediction (Table A6). Orleans was a 100% correctly predicted following cross-validation, with most of the miss-classification happening between Sakura and Beauregard. At 25 °C (Table A7), however, Sakura samples showed the best separation with an 85.71% correct prediction; while the weakest overall separation was observed at 15 °C (Table A8). Overall, following the temperature-based split, sample sizes were limited with the benchtop data to build robust classification models, which was reflected in the difference between recognition and prediction accuracies. Through-skin measurements with the handheld device (Figure 10/A-C/2) did not have this limitation, allowing the use of additional components to capture more of the total variance without risking model overfitting during modelling. Classification accuracies of models built on the handheld-skin sub-dataset following the temperature-based split had comparable results to that of the benchtop device, with both at 5 °C and 15 °C reaching above an 80% average correct prediction. At both temperatures, the Orleans cultivar had the highest ratio of correct classification reaching up to an 88.21% of correct prediction, followed by Sakura with an up to 83.38% correct prediction (Table A9 and Table A10). Beauregard proved to be the most difficult to classify on these temperatures with an up to 77.25% correct prediction, evenly miss-classified as either Orleans or Sakura. Classification at 25 °C (Table A11) was more difficult with the handheld device data. The highest correct prediction (77.65%) was reached for the Orleans cultivar with most of the miss-classification as Sakura (17.32%). Beauregard samples were once again the most difficult to correctly classify with a 68.46% correct prediction and an almost even misclassification as either Orleans or Sakura.
Conclusively, while the powdered samples recorded with the benchtop device provided more accurate (but less robust) models for the incorrect storage conditions (5 °C, 25 °C), the optimally stored samples (15 °C) were by far the best classifiable using through-skin measurements and the handheld device. On this temperature, a much lower amount of misclassification was also observed between the physically similar cultivars compared to the model based on the benchtop-powder sub-dataset (Table A10).
3.4. Predicting Reference Values Using NIR Spectroscopic Data and PLSR
Regression models to predict storage time and moisture content of the sweet potato samples can be seen in Table 4. Overall, models had poor to medium predictive performance. Storage time was best predicted using the benchtop device on cut surface, resulting in an average R2P of 0.65 ± 0.07 and an RMSEP of 107.95 ± 16.54 h, meaning that the storage time of the samples was predicted with an average error of ~4.5 days. These metrics were considerably worse for all other arrangements, with the least feasible results obtained using the powdered samples. The model predicting moisture content had slightly better performance (R2P = 0.66 ± 0.07; RMSEP = 1.88 ± 0.11%), using the handheld device on cut surface compared to the benchtop using the same arrangement (R2P = 0.64 ± 0.09; RMSEP = 1.88 ± 0.11%), with a more notably difference in cross-validation model metrics. The through-skin measurements using the handheld device, however, did not result in a feasible model.
Out of the models predicting total phenolic content, good correlation was only achieved using the benchtop-powder sub-dataset, with an R2P of 0.80 ± 0.13 and an RMSEP of 1.92 ± 0.73 mg GA/g. Similarly, the only feasible model to predict total starch content was reached using the same benchtop-powder arrangement with an R2P of 0.79 ± 0.06 and an RMSEP of 2.34 ± 0.38 g/100g. As it was observed during the exploratory data evaluation, the combination band region contained most of the important variance to set up models predicting the chemical parameters, which could only be utilized for the benchtop-powder sub-dataset.
To further observe this statement, regression vectors for the best performing PLSR models were summarized in Figure 9. For the prediction of storage time (Figure 9/A), numerous peaks were observed in the selected wavelength region with similar weights. Outside of the several water bands (e.g., ~961 nm, 1409 nm and 1441 nm), the C-H peak at ~1223 nm in the second overtone region could stand for lipids [51]; the ~1377–1390 nm peaks in the first overtone of C-H combinations and aromatic O-H could signal the presence of aliphatic hydrocarbons or phenols [49]; the peak at 1638 nm could stand for an aryl group signaling the potential presence of aromatic hydrocarbons; while the peaks in ~1700-1850 nm region could highlight the presence of various macromolecules, including proteins [52]. Based on this, predicting the storage time required many distinctive features in the dataset. Important to note that the water-dominant ~1400-1450 nm region had a noticeable amount of high frequency oscillations for the benchtop device on all regression vectors, that was also visible on PCA loadings (Figure 8 and Figure 9) and the raw spectra (Figure 7). The phenomenon could have been induced by the leakage of moisture from the samples onto the polyethylene layer and/or the polyethylene layer’s slight movement during and between measurements, creating scattering artifacts. This was also visible at the other water-dominant region at ~1900-1950 nm. Alternatively, since this phenomenon was similarly visible for the benchtop-powder sub-dataset (Figure 11/C-D) where samples were measured through a glass cuvette, this could also imply subtle changes in water molecular structure that result in the alteration of these bands [53]. This would imply that water structure was a major predictor of storage time.
For the prediction of total phenolic content (Figure 11/C), the regression vector showed a sharp peak at 1669 nm associated with (aromatic) C–H first overtones and a number of additional peaks in the aromatic C–H/C–O combination bands region (~2250–2350 nm), consistent with the presence of phenolic compounds. However, these regions also overlap substantially with absorptions from carbohydrates and other plant constituents, so these assignments are not unique [49,54]. The peaks in the 1360-1390 nm range around the aromatic O-H band could further strengthen the model’s specificity towards phenolic compounds, although this region should be interpreted cautiously due to the potential artifact effects discussed above.
Similar important regions could be identified by looking at the regression vectors of the model predicting total starch content (Figure 11/D), signaling that both models, rather than relying on a few specific areas or analytes, leverage many correlated variables to make these predictions. The region that stood out the most for this model, however, was around 2100-2350 nm with bands involving C-H, C-O and O-H vibrations, mostly denoted to carbohydrates such as starch [49]. This implies that the model was indeed using meaningful chemical information to make these predictions and also explains why the models based on the limited wavelength range of the handheld device failed to do so.
4. Discussion
The present study compared three widely available sweet potato cultivars based on their physical-chemical parameters and spectral features. Significant differences were found in the physical and chemical attributes of the cultivars that were most prominent between the orange-fleshed Orleans and the purple-fleshed Sakura. The purple variety having more than 5 times the total phenolic content was in good agreement with previous research measuring a 2-8-fold difference between these flesh-colors [55].
Both moisture and starch content values could fit in the range described by previous studies [56,57] and was in good agreement with a report on higher dry matter (lower moisture) content for purple-fleshed varieties compared to Orleans and Beauregard [58]. A somewhat contradictory finding was that the total starch generally increased with the temperature, as literature suggests that higher temperatures would promote saccharification and the decline of total starch content [26]. While starch synthetization can happen in response to heat in sweet potatoes during storage [24], there’s little evidence that storage at 25 °C could promote such conversion.
While cultivar (more prominent) and storage temperature-related (less prominent) differences could be identified, a clear direction of change in the reference data as the storage progressed was missing, which could be attributed to the limited storage time compared to some of the previous literature [26]. Despite the narrow range of reference values, chemical and moisture-related variance was well reflected in spectral data in most cases.
The spectral plots in Figure 7 show that storage temperature produced relatively small changes in the overall spectral profile of the tubers. The major absorption features remained in the same wavelength regions, while the differences among storage temperatures were expressed mainly through changes in spectral intensity. This is consistent with the gradual changes in moisture, starch and sugars that occur during sweet potato storage rather than the appearance of entirely new chemical constituents [59,60,61]. Similar NIR studies on sweet potato have shown that starch, reducing sugars and moisture are major contributors to spectral variation and can be monitored non-destructively during storage and quality assessment [62]. The close similarity of the raw spectra also explains why visual inspection alone was insufficient to distinguish either cultivars or storage conditions and highlights the importance of chemometric analysis for extracting subtle information that may be embedded within the spectra.
The PCA plots in Figure 8 show that cultivar-related variation was more pronounced than the variation introduced by storage. The three cultivars occupied different regions of the PCA plot, with the distinction changing according to the storage temperature in focus. The loading profiles point to several wavelength regions associated primarily with water and carbohydrate absorptions, particularly around 1200 nm, 1450 nm, 1700–1760 nm, 1900–1950 nm and 2100–2300 nm. These regions are commonly attributed to O–H and C–H overtone and combination vibrations arising from water, starch and soluble carbohydrates, which are the major constituents governing sweet potato composition [62,63,64]. The same regions remained important across the different storage temperatures suggesting that storage changed the intensity of these chemical signals rather than the main chemical differences between cultivars. The 15 °C temperature group was the most distinctive in this regard with a different (more even) distribution of variance between the principal components, shifting the importance from chemically associated bonds to physical ones, like moisture. Furthermore, on this temperature, there was no cultivar to stand out notably, implying that the “incorrect” storage conditions facilitate cultivar-specific (chemical) changes that are well reflected in spectral data. This indeed was also visible during descriptive statistics, as the smallest variance between cultivars was observed on 15 °C, most notably in the case of total starch content Figure 3.
The LDA results in Table 2 and Table 3 and Figure 10 confirm the pattern observed in PCA. Cultivar classification was consistently better than storage-condition classification, showing that genotype produced stronger and more reproducible spectral differences. The best accuracy was obtained from powdered samples analyzed with the benchtop FT-NIR instrument, which was not surprising because homogenization reduces physical variability and gives a spectrum that is more representative of the average root composition. Furthermore, the reduction in moisture content could reduce the distortion of weaker absorption features of other constituents [65] resulting in the utilization of additional bands holding meaningful information for modelling. On the other hand, the observation of high frequency oscillations around the water-dominated regions in Figure 7, Figure 8, Figure 9 and Figure 11 could mean that water, or more precisely its structural changes, could in fact heavily contribute to model building. Recent sweet potato NIR studies have similarly reported strong performance when compositional traits such as starch, sugars and other quality attributes were measured using prepared or homogenized samples [62,63,66].
The more important result, however, is the performance obtained through the intact skin of the samples. Using the handheld NIR-S-G1, cultivar prediction reached 79.25% without peeling, cutting or grinding the roots. This is significant because intact-root measurements are more affected by surface roughness, peel thickness, pigmentation, sampling position and scattering than measurements on homogenized material. Even with these limitations, recent work has shown that portable NIR instruments can extract useful information from intact tubers and roots. Portable NIR has been successfully applied to potato quality assessment, intact sweet potato chilling-injury prediction, and most recently to handheld measurement of Brix and moisture in sweet potatoes during growth and storage [60,67,68]. Since none of these studies focused on cultivar or storage condition classification, the feasible through-skin classification results are one of the strongest contributions of the present study.
Most other sweet potato NIRS-related work has focused on powdered, sliced or otherwise prepared samples, or on quantitative prediction of individual quality traits [63,64]. Demonstrating that cultivar information can still be recovered from spectra acquired directly through the peel moves the application closer to the conditions under which the technology would actually be used. For breeding programmes, germplasm screening, storage facilities and commercial grading, the ability to classify intact roots rapidly is more useful than obtaining slightly higher accuracies from destructive laboratory measurements. Recent developments in handheld sweet potato NIR support this direction and reinforce the need for future calibration sets that include wider cultivar, season and storage variability [62,67].
The PLSR results in Table 4 and Table 5 and Figure 11 highlight some of the limitations of the current study. The limited sample size and storage time of the current study might have caused a dominant effect for tuber-to-tuber biological variance over the gradual change of chemical composition due to storage. This was further limited by that, unlike for classification, models could only be built on samples with a reference value with each sampling consisting of a different set of tubers. Feasible quantitative results could only be obtained using the benchtop device and the powdered data reaching ~0.8 R2P for the chemical parameters, which is comparable to previous studies using powdered samples [63,64]. Important to note that these studies worked with several times the sample number and a much higher number of distinct cultivars to create a large variance in chemical composition, which is crucial to developing reliable regression models. A recent study by Aparatana and colleagues [69] investigated the applicability of the same handheld spectrometer to predict the Brix value of raw sweet potatoes. Among varying results, the authors could reach feasible models for certain cultivars with R2P values up to 0.86, indicating that modelling on sugar content could be a worthwhile future inclusion. Important to note however, that the study involved peeled surface scans and in a single spot for each tuber, which might not reflect real life measuring circumstances.
Beyond cultivar identification, the ability to acquire reliable spectral information directly from intact roots also provides an important foundation for digital food traceability systems. When integrated with complementary technologies such as RFID, blockchain and IoT, handheld NIR spectroscopy can enable real-time verification of cultivar identity and quality attributes throughout the supply chain, thereby strengthening product authentication, traceability and consumer confidence [70]. The method developed here could, with some refinement, be included in systems that promote supply chain-long quality assurance for strategically important food commodities, such as sweet potatoes.
Future research should focus on extending the handheld-based calibration models with additional samples and cultivars to reach a robustness that matches industrial needs. Furthermore, once a suitable sample size was obtained, modelling with more sophisticated learning algorithms that can capture potential non-linear patterns between spectral and reference data should be considered. Lastly, the models should be integrated in a previously conceptualized pilot system [4] and tested in real life scenarios.
5. Conclusions
Sweet potato, one of the most important crops in the World, is becoming more relevant for domestic production in many countries due to the considerable climate change of recent decades and an increasing demand for short supply chain products among health-conscious consumers. The growing global population and the finite resources of our planet encourage the widespread adoption of precision agriculture, which increasingly relies on the communication technologies of the 4th industrial revolution to build automatized, data-driven supply chains. NIR spectroscopy has proven its widespread applicability in the agri-food sector as a versatile, rapid and non-destructive quality assessment tool that could provide valuable digital data for such smart systems—especially due to the recent trends of device portability and miniaturization.
The present work demonstrated the feasibility of affordable handheld NIR spectrometry in the rapid and reliable identification of sweet potato cultivars during storage. While the assessment of chemical parameters remained moderate, previous works have demonstrated that given a high enough sample number and a greater variance in chemical composition, measurements with portable devices could potentially reach acceptable performance for industrial adoption. The main finding of the current study is proof that intact, through-skin measurements using a portable device can indeed be reliable in identifying even physically similar sweet potato cultivars. The developed method, once the limitations are addressed, could be integrated in semi-automatized track and tracing systems that benefit from the rapid identification of cultivars in various steps throughout the supply chain, potentially protecting domestic production from import.
Given a higher sample size with more diverse cultivars and/or a longer storage period, industrially applicable models should be a possibility to build that, given the affordability of the device used, could see wide adoption for various parties involved in sweet potato supply chains.
Author Contributions
Conceptualization, M.L., K.K., L.A., J.F. and Z.K.; methodology, M.L., E.B. and Z.K.; software, M.L., P.E., B.M.M. and Z.K; validation, Z.K., J.J.Z.Z. and J.F.; formal analysis, M.L., E.B. and B.M.M.; investigation, M.L., P.E. and E.B.; resources, Z.K., K.K. and L.A.; data curation, M.L. and Z.K.; writing—original draft preparation, M.L., B.M.M, J.J.Z.Z.; writing—review and editing, Z.K., J.J.Z.Z. and J.F; visualization, M.L. and B.M.M; supervision, Z.K., L.A. and J.F.; project administration, Z.K.; funding acquisition, M.L. and Z.K. All authors have read and agreed to the published version of the manuscript.
Funding
This research received no external funding.
Data Availability Statement
Data will be made available upon request.
Acknowledgments
This work was supported by the Doctoral School of Food Science of the Hungarian University of Agriculture and Life Sciences; the KDP-2023 Program of the Ministry for Innovation and Technology (Hungary) from the source of the National Research, Development and Innovation Fund. Authors are grateful for the material and equipment-related support of Ingatlanpáholy Kft. and Ozsváth-Agro Kft.
Conflicts of Interest
Kornel Kovacs was employed by Ingatlanpaholy Ltd. and Matyas Lukacs has received research grant from the Ministry for Innovation and Technology (Hungary) (grant number: KDP-2023). Above mentioned authors did not receive any benefit as a result of conducting the experiment discussed in this article and publishing the results.
Appendix A
Appendix A.1

Table A1.
Confusion matrices for LDA results based on the benchtop-powder sub-dataset. “B” = Beauregard; “O” = Orleans; “S” = Sakura.
Table A1.
Confusion matrices for LDA results based on the benchtop-powder sub-dataset. “B” = Beauregard; “O” = Orleans; “S” = Sakura.
| Recognition (%) | Prediction (%) | |||||
| B | O | S | B | O | S | |
| B | 85.61 | 17.43 | 0 | 75.77 | 21.23 | 0 |
| O | 14.39 | 82.57 | 0 | 19.68 | 78.77 | 1.50 |
| S | 0 | 0 | 100 | 4.55 | 0 | 98.50 |
Appendix A.2
Table A2.
Confusion matrices for LDA results based on the handheld-skin sub-dataset classifying samples belonging to the different cultivars. “B” = Beauregard; “O” = Orleans; “S” = Sakura.
Table A2.
Confusion matrices for LDA results based on the handheld-skin sub-dataset classifying samples belonging to the different cultivars. “B” = Beauregard; “O” = Orleans; “S” = Sakura.
| Recognition (%) | Prediction (%) | |||||
| B | O | S | B | O | S | |
| B | 80.82 | 2.99 | 5.12 | 79.6 | 3.52 | 5.21 |
| O | 9.59 | 83.22 | 18.48 | 9.76 | 82.49 | 19.12 |
| S | 9.59 | 13.79 | 76.40 | 10.64 | 13.99 | 75.66 |
Appendix A.3
Table A3.
Confusion matrices for LDA results based on the benchtop-powder sub-dataset classifying samples belonging to the different storage conditions.
Table A3.
Confusion matrices for LDA results based on the benchtop-powder sub-dataset classifying samples belonging to the different storage conditions.
| Recognition (%) | Prediction (%) | |||||
| 5 °C | 15 °C | 25 °C | 05 °C | 15 °C | 25 °C | |
| 5 °C | 87.31 | 0 | 2.38 | 84.14 | 4.17 | 4.76 |
| 15 °C | 7.93 | 88.90 | 12.69 | 11.10 | 69.46 | 33.33 |
| 25 °C | 4.76 | 11.10 | 84.93 | 4.76 | 26.38 | 61.90 |
Appendix A.4
Table A4.
Confusion matrices for LDA results based on the handheld-skin sub-dataset classifying samples belonging to the different storage conditions.
Table A4.
Confusion matrices for LDA results based on the handheld-skin sub-dataset classifying samples belonging to the different storage conditions.
| Recognition (%) | Prediction (%) | |||||
| 5 °C | 15 °C | 25 °C | 05 °C | 15 °C | 25 °C | |
| 5 °C | 65.68 | 42.63 | 17.81 | 64.47 | 43.94 | 16.60 |
| 15 °C | 22.59 | 35.91 | 20.42 | 23.02 | 34.51 | 23.04 |
| 25 °C | 11.73 | 21.45 | 61.77 | 12.51 | 21.55 | 60.36 |
Appendix A.5
Table A5.
Confusion matrices for LDA results based on the handheld-powder sub-dataset classifying samples belonging to the different storage conditions.
Table A5.
Confusion matrices for LDA results based on the handheld-powder sub-dataset classifying samples belonging to the different storage conditions.
| Recognition (%) | Prediction (%) | |||||
| 5 °C | 15 °C | 25 °C | 05 °C | 15 °C | 25 °C | |
| 5 °C | 77.77 | 4.85 | 9.18 | 74.62 | 8.33 | 11.65 |
| 15 °C | 15.88 | 70.83 | 38.32 | 23.81 | 58.33 | 35.00 |
| 25 °C | 6.36 | 24.31 | 52.50 | 1.57 | 33.33 | 53.35 |
Appendix B
Appendix B.1
Table A6.
Confusion matrices for LDA results based on the benchtop-powder sub-dataset, using only the 5 °C group. “B” = Beauregard; “O” = Orleans; “S” = Sakura.
Table A6.
Confusion matrices for LDA results based on the benchtop-powder sub-dataset, using only the 5 °C group. “B” = Beauregard; “O” = Orleans; “S” = Sakura.
| Recognition (%) | Prediction (%) | |||||
| B | O | S | B | O | S | |
| B | 100 | 0 | 0 | 76.14 | 0 | 14.29 |
| O | 0 | 100 | 0 | 0 | 100 | 4.71 |
| S | 0 | 0 | 100 | 23.86 | 0 | 81.00 |
Appendix B.2
Table A7.
Confusion matrices for LDA results based on the benchtop-powder sub-dataset, using only the 25 °C group. “B” = Beauregard; “O” = Orleans; “S” = Sakura.
Table A7.
Confusion matrices for LDA results based on the benchtop-powder sub-dataset, using only the 25 °C group. “B” = Beauregard; “O” = Orleans; “S” = Sakura.
| Recognition (%) | Prediction (%) | |||||
| B | O | S | B | O | S | |
| B | 83.36 | 11.93 | 0 | 57.14 | 28.57 | 0 |
| O | 7.14 | 88.07 | 4.79 | 42.86 | 71.43 | 14.29 |
| S | 9.5 | 0 | 95.21 | 0 | 0 | 85.71 |
Appendix B.3
Table A8.
Confusion matrices for LDA results based on the benchtop-powder sub-dataset, using only the 15 °C group. “B” = Beauregard; “O” = Orleans; “S” = Sakura.
Table A8.
Confusion matrices for LDA results based on the benchtop-powder sub-dataset, using only the 15 °C group. “B” = Beauregard; “O” = Orleans; “S” = Sakura.
| Recognition (%) | Prediction (%) | |||||
| B | O | S | B | O | S | |
| B | 68.75 | 18.75 | 37.5 | 62.5 | 25 | 37.5 |
| O | 12.5 | 81.25 | 2.06 | 25 | 75 | 0 |
| S | 18.75 | 0 | 60.44 | 12.5 | 0 | 62.5 |
Appendix B.4
Table A9.
Confusion matrices for LDA results based on the benchtop-powder sub-dataset, using only the 5 °C group. “B” = Beauregard; “O” = Orleans; “S” = Sakura.
Table A9.
Confusion matrices for LDA results based on the benchtop-powder sub-dataset, using only the 5 °C group. “B” = Beauregard; “O” = Orleans; “S” = Sakura.
| Recognition (%) | Prediction (%) | |||||
| B | O | S | B | O | S | |
| B | 76.24 | 1.47 | 3.27 | 74.06 | 1.59 | 4.36 |
| O | 10.93 | 89 | 11.44 | 11.66 | 88.21 | 12.26 |
| S | 12.83 | 9.52 | 85.29 | 14.28 | 10.2 | 83.38 |
Appendix B.5
Table A10.
Confusion matrices for LDA results based on the benchtop-powder sub-dataset, using only the 15 °C group. “B” = Beauregard; “O” = Orleans; “S” = Sakura.
Table A10.
Confusion matrices for LDA results based on the benchtop-powder sub-dataset, using only the 15 °C group. “B” = Beauregard; “O” = Orleans; “S” = Sakura.
| Recognition (%) | Prediction (%) | |||||
| B | O | S | B | O | S | |
| B | 78.26 | 3.19 | 4.86 | 77.25 | 3.07 | 4.86 |
| O | 10.37 | 88.18 | 11.71 | 11.71 | 87.23 | 12.57 |
| S | 11.37 | 8.63 | 83.43 | 11.04 | 9.7 | 82.57 |
Appendix B.6
Table A11.
Confusion matrices for LDA results based on the benchtop-powder sub-dataset, using only the 25 °C group. “B” = Beauregard; “O” = Orleans; “S” = Sakura.
Table A11.
Confusion matrices for LDA results based on the benchtop-powder sub-dataset, using only the 25 °C group. “B” = Beauregard; “O” = Orleans; “S” = Sakura.
| Recognition (%) | Prediction (%) | |||||
| B | O | S | B | O | S | |
| B | 71.73 | 5.45 | 5.98 | 68.46 | 5.03 | 5.05 |
| O | 10.96 | 77.51 | 18.22 | 12.69 | 77.65 | 17.55 |
| S | 17.31 | 17.04 | 75.8 | 18.84 | 17.32 | 77.4 |
References
- Vogel-Heuser, B.; Hess, D. Guest Editorial Industry 4.0–Prerequisites and Visions. IEEE Transactions on Automation Science and Engineering 2016, 13, 1–3. [CrossRef]
- Xu, X.; Lu, Y.; Vogel-Heuser, B.; Wang, L. Industry 4.0 and Industry 5.0—Inception, Conception and Perception. J. Manuf. Syst. 2021, 61, 530–535. [CrossRef]
- Bousdekis, A.; Lepenioti, K.; Apostolou, D.; Mentzas, G. Electronics A Review of Data-Driven Decision-Making Methods for Industry 4.0 Maintenance Applications. 2021. [CrossRef]
- Lukacs, M.; Toth, F.; Horvath, R.; Solymos, G.; Alpár, B.; Varga, P.; Kertesz, I.; Gillay, Z.; Baranyai, L.; Felfoldi, J.; et al. Advanced Digital Solutions for Food Traceability: Enhancing Origin, Quality, and Safety Through NIRS, RFID, Blockchain, and IoT. Journal of Sensor and Actuator Networks 2025, 14. [CrossRef]
- Getahun, S.; Kefale, H.; Gelaye, Y. Application of Precision Agriculture Technologies for Sustainable Crop Production and Environmental Sustainability: A Systematic Review. ScientificWorldJournal. 2024, 2024, 2126734.
- Sapakhova, Z.; Raissova, N.; Daurov, D.; Zhapar, K.; Daurova, A.; Zhigailov, A.; Zhambakin, K.; Shamekova, M. Sweet Potato as a Key Crop for Food Security under the Conditions of Global Climate Change: A Review. Plants 2023, 12.
- Siddiq, M.; Uebersax, M.A. Sweetpotato Production, Processing, and Nutritional Quality; 2018;
- Truong, V.D.; Avula, R.Y.; Pecota, K. V.; Yencho, G.C. Sweetpotato Production, Processing, and Nutritional Quality. In Handbook of Vegetables and Vegetable Processing; Wiley, 2018; pp. 811–838.
- OECD-FAO Agricultural Outlook 2025-2034. Internet. Available Online: Https://Openknowledge.Fao.Org/Server/Api/Core/Bitstreams/D4a81a28-4246-429d-847d-6fef53dde9ff/Content (Accessed on 12 August 2026).
- Gloria Peace Lamaro; Tsehaye, Y.; Girma, A.; Rubangakene, D. The Impact of Future Climate on Orange-Fleshed Sweet Potato Production in Arid Areas of Northern Ethiopia. A Case Study in Afar Region. Heliyon 2023, 9. [CrossRef]
- Bovell-Benjamin, A.C. Sweet Potato: A Review of Its Past, Present, and Future Role in Human Nutrition. Adv. Food Nutr. Res. 2007, 52, 1–59. [CrossRef]
- Amagloh, F.C.; Yada, B.; Tumuhimbise, G.A.; Amagloh, F.K.; Kaaya, A.N. The Potential of Sweetpotato as a Functional Food in Sub-Saharan Africa and Its Implications for Health: A Review. Molecules 2021, 26, 2971. [CrossRef]
- van Jaarsveld, P.J.; Faber, M.; Tanumihardjo, S.A.; Nestel, P.; Lombard, C.J.; Benadé, A.J.S. Beta-Carotene-Rich Orange-Fleshed Sweet Potato Improves the Vitamin A Status of Primary School Children Assessed with the Modified-Relative-Dose-Response Test. Am. J. Clin. Nutr. 2005, 81, 1080–1087. [CrossRef]
- Low, J.W.; Mwanga, R.O.M.; Andrade, M.; Carey, E.; Ball, A.-M. Tackling Vitamin A Deficiency with Biofortified Sweetpotato in Sub-Saharan Africa. Glob. Food Sec. 2017, 14, 23–30. [CrossRef]
- Li, A.; Xiao, R.; He, S.; An, X.; He, Y.; Wang, C.; Yin, S.; Wang, B.; Shi, X.; He, J. Research Advances of Purple Sweet Potato Anthocyanins: Extraction, Identification, Stability, Bioactivity, Application, and Biotransformation. Molecules 2019, 24, 3816. [CrossRef]
- Dereje, B. Functional Properties of Sweet Potato Flour and Its Role in Product Development: A Review. Int. J. Food Prop. 2020, 23, 1639–1662. [CrossRef]
- Allen, J.C.; Corbitt, A.D.; Maloney, K.P.; Butt, M.S.; Truong, V.-D. Glycemic Index of Sweet Potato as Affected by Cooking Methods. Open Nutr. J. 2012, 6, 1–11. [CrossRef]
- Zeevi, D.; Korem, T.; Zmora, N.; Israeli, D.; Rothschild, D.; Weinberger, A.; Ben-Yacov, O.; Lador, D.; Avnit-Sagi, T.; Lotan-Pompan, M.; et al. Personalized Nutrition by Prediction of Glycemic Responses. Cell 2015, 163, 1079–1094. [CrossRef]
- Picha, D.H. Weight Loss in Sweet Potatoes During Curing and Storage: Contribution of Transpiration and Respiration. Journal of the American Society for Horticultural Science 1987, 112, 593. [CrossRef]
- Shigematsu, T.; Furukawa, N.; Takaoka, R.; Hayashi, M.; Sasao, S.; Ueno, S.; Nakajima, K.; Kido, M.; Nomura, K.; Iguchi, A. Effect of High Pressure on the Saccharification of Starch in the Tuberous Root of Sweet Potato (Ipomoea batatas). Biophys. Chem. 2017, 231, 105–110. [CrossRef]
- He, H.J.; Xing, L.; Lv, M.; Qiao, H.; Wang, Y.; Bi, J.; Ou, X.; Niu, S. Machine Learning-Assisted Micro NIR for Rapidly Monitoring the Variations of Enzymatic Activity and Carbohydrates during Saccharification of Stored Sweet Potatoes. LWT 2025, 232. [CrossRef]
- Monostori T.; Szarvas A. Az Édesburgonya Termesztése. Kísérleti Eredmények És Tapasztalatok. Szegedi Tudományegyetem Mezőgazdasági Kar, Hódmezővásárhely, Hungary 2023; ISBN 9789633069479.
- Ishiguro, K.; Yahara, S.; Yoshimoto, M. Changes in Polyphenols Content and Radical-Scavenging Activity of Sweetpotato (Ipomoea Batatas L.) during Storage at Optimal and Low Temperatures. J. Agric. Food Chem. 2007, 55, 10773–10778. [CrossRef]
- Morrison, T.A.; Pressey, R.; Kays, S.J. Changes in A− A− and SS-Amylase during Storage of Sweetpotato Lines with Varying Starch Hydrolysis Potential. Journal of the American Society for Horticultural Science 1993; 118(2):236-242.
- Zhang, Z.; Wheatley, C.C.; Corke, H. Biochemical Changes during Storage of Sweet Potato Roots Differing in Dry Matter Content. Postharvest Biol. Technol. 2002, 24, 317–325. [CrossRef]
- Krochmal-Marczak, B.; Sawicka, B.; Krzysztofik, B.; Danilčenko, H.; Jariene, E. The Effects of Temperature on the Quality and Storage Stalibity of Sweet Potato (Ipomoea Batatas L. [Lam]) Grown in Central Europe. Agronomy 2020, 10. [CrossRef]
- Cantwell, M.; Suslow, T. V. Sweet Potato. Internet. Available Online: Https://Postharvest.Ucdavis.Edu/Produce-Facts-Sheets/Sweet-Potato (Accessed on 12 August 2024).
- Tumwegamire, S.; Kapinga, R.; Rubaihayo, P.R.; LaBonte, D.R.; Gruneberg, W.J.; Burgos, G.; Zum Felde, T.; Carpio, R.; Pawelzik, E.; Mwanga, R.O.M. Evaluation of Dry Matter, Protein, Starch, Sucrose, Beta-Carotene, Iron, Zinc, Calcium, and Magnesium in East African Sweetpotato [Ipomoea Batatas (L.) Lam] Germplasm. HortScience 2011, 46, 348–357.
- Tang, C.; Jiang, B.; Ejaz, I.; Ameen, A.; Zhang, R.; Mo, X.; Wang, Z. High-Throughput Phenotyping of Nutritional Quality Components in Sweet Potato Roots by near-Infrared Spectroscopy and Chemometrics Methods. Food Chem. X 2023, 20, 100916. [CrossRef]
- Wang, Y.; Chen, X.; Li, H.; Li, M. NIR Sensors Combined with Chemometric Algorithms in Intelligent Quality Evaluation of Sweetpotato Roots from “Farm” to “Table”: Progresses, Challenges, Trends and Prospects. Food Chem. X 2024, 22, 101449. [CrossRef]
- Sanchez, M.T.; De la Haba, M.J.; Benitez-Lopez, M.; Fernandez-Novales, J.; Garrido-Varo, A.; Perez-Marin, D. Applications of Imaging and Spectroscopy Techniques for Non-Destructive Quality Evaluation of Potatoes and Sweet Potatoes: A Review. Trends Food Sci. Technol. 2020, 96, 208–221. [CrossRef]
- Lu, P. Insights on the Structure and Digestibility of Sweet Potato Starch: Effect of Postharvest Storage of Sweet Potato Roots. Int. J. Biol. Macromol. 2020, 145, 694–700. [CrossRef]
- Magwaza, L.S.; Naidoo, S.I.M.; Laurie, S.M.; Laing, M.D.; Shimelis, H. Development of NIRS Models for Rapid Quantification of Protein Content in Sweetpotato [Ipomoea Batatas (L.) LAM.]. LWT—Food Science and Technology 2016, 72, 63–70. [CrossRef]
- Amankwaah, V.A.; Hale, A.L.; Gruneberg, W.J.; Truong, V.-D. Development of NIRS Calibration Curves for Sugars in Baked Sweetpotato. J. Sci. Food Agric. 2024, 104, 4801–4807. [CrossRef]
- Lu, G.; Huang, H.; Zhang, D. Application of Near-Infrared Spectroscopy to Predict Sweetpotato Starch Thermal Properties and Noodle Quality. J. Zhejiang Univ. Sci. B 2006, 7, 475–481. [CrossRef]
- Ding, X.; Ni, Y.; Kokot, S. NIR Spectroscopy and Chemometrics for the Discrimination of Pure Powdered Purple Sweet Potatoes and Their Samples Adulterated with the White Sweet Potato Flour. Chemometrics and Intelligent Laboratory Systems 2015, 144, 17–23. [CrossRef]
- Hassoun, A.; Ait-Kaddour, A.; Abu-Mahfouz, A.M.; Rathod, N.B.; Bader, F.; Barba, F.J.; Biancolillo, A.; Cropotova, J.; Galanakis, C.M.; Jambrak, A.R.; et al. The Fourth Industrial Revolution in the Food Industry-Part I: Industry 4.0 Technologies. Crit. Rev. Food Sci. Nutr. 2023, 63, 6547–6563. [CrossRef]
- Fodor, M.; Matkovits, A.; Benes, E.L.; Jókai, Z. The Role of Near-Infrared Spectroscopy in Food Quality Assurance: A Review of the Past Two Decades. Foods 2024, 13, 3501. [CrossRef]
- Franková, H.; Musilová, J.; Árvay, J.; Šnirc, M.; Jančo, I.; Lidiková, J.; Vollmannová, A. Changes in Antioxidant Properties and Phenolics in Sweet Potatoes (Ipomoea Batatas L.) Due to Heat Treatments. Molecules 2022, 27. [CrossRef]
- Total Starch (α-Amylase / Amyloglucosidase) Assay Protocol. Available Online: Https://Prod-Docs.Megazyme.Com/Documents/Assay_Protocol/K-TSTA-100A_DATA.Pdf (Accessed on 13/08/2026).
- Abdi, H.; Williams, L.J. Principal Component Analysis. Wiley Interdiscip. Rev. Comput. Stat. 2010, 2, 433–459. [CrossRef]
- Barnes, R.J.; Dhanoa, M.S.; Lister, S.J. Standard Normal Variate Transformation and De-Trending of Near-Infrared Diffuse Reflectance Spectra. Applied Spectroscopy 1989, 43, 772-777.
- Alm, E.; Bro, R.; Engelsen, S.B.; Karlberg, B.; Torgrip, R.J.O. Vibrational Overtone Combination Spectroscopy (VOCSY)-A New Way of Using IR and NIR Data. Anal. Bioanal. Chem. 2007, 388, 179–188. [CrossRef]
- de Boor, C. A Practical Guide to Splines; Springer New York: New York, NY, 1978; Vol. 27; ISBN 978-0-387-90356-9.
- Gowen, A. A; Downey, G.; Esquerre, C.; O’Donnell, C. P. Preventing Over-Fitting in PLS Calibration Models of near-Infrared (NIR) Spectroscopy Data Using Regression Coefficients. J. Chemom. 2011, 25, 375–381. [CrossRef]
- Lukacs, M.; Vitalis, F.; Bardos, A.; Tormási, J.; Bec, K.B.; Grabska, J.; Gillay, Z.; Tömösközi-Farkas, R.A.; Abrankó, L.; Albanese, D.; et al. Comparison of Multiple NIR Instruments for the Quantitative Evaluation of Grape Seed and Other Polyphenolic Extracts with High Chemical Similarities. Foods 2024, 13. [CrossRef]
- Kovacs, Z.; Pollner, B. Aquaphotomics Course Data Analysis and Software. In Proceedings of the Aquaphotomics: Understanding Water in Biology—2nd International Symposium. Kobe, Japan, 26–29 November 2016.
- Bec, K.B.; Grabska, J.; Pfeifer, F.; Siesler, H.W.; Huck, C.W. Rapid On-Site Analysis of Soil Microplastics Using Miniaturized NIR Spectrometers: Key Aspect of Instrumental Variation. J. Hazard. Mater. 2024, 480. [CrossRef]
- Workman, J.; Weyer, L. Practical Guide and Spectral Atlas for Interpretive Near-Infrared Spectroscopy; 2012; ISBN 9780429110511.
- Gergely, S.; Salgó, A. Changes in Carbohydrate Content during Wheat Maturation—What Is Measured by near Infrared Spectroscopy? J. Near Infrared Spectrosc. 2005, 13, 9–17. [CrossRef]
- Mhaddolkar, N.; Koinig, G.; Vollprecht, D.; Astrup, T.F.; Tischberger-Aldrian, A. Effect of Surface Contamination on Near-Infrared Spectra of Biodegradable Plastics. Polymers (Basel). 2024, 16. [CrossRef]
- Rogel-Castillo, C.; Boulton, R.; Opastpongkarn, A.; Huang, G.; Mitchell, A.E. Use of Near-Infrared Spectroscopy and Chemometrics for the Nondestructive Identification of Concealed Damage in Raw Almonds ( Prunus Dulcis ). J. Agric. Food Chem. 2016, 64, 5958–5962. [CrossRef]
- Segtnan, V.H.; Šašić, Š.; Isaksson, T.; Ozaki, Y. Studies on the Structure of Water Using Two-Dimensional near-Infrared Correlation Spectroscopy and Principal Component Analysis. Anal. Chem. 2001, 73, 3153–3161. [CrossRef]
- Ozaki, Y.; Mcclure, W.F.; Christy, A. Near-Infrared Spectroscopy in Food Science and Technology; 2006;
- Cartier, A.; Woods, J.; Sismour, E.; Allen, J.; Ford, E.; Githinji, L.; Xu, Y. Physiochemical, Nutritional and Antioxidant Properties of Fourteen Virginia-Grown Sweet Potato Varieties. Journal of Food Measurement and Characterization 2017, 11, 1333–1341. [CrossRef]
- Xu, X.; Wu, S.; Chen, K.; Zhang, H.; Zhou, S.; Lv, Z.; Chen, Y.; Cui, P.; Cui, Z.; Lu, G. Comprehensive Evaluation of Raw Eating Quality in 81 Sweet Potato (Ipomoea Batatas (L.) Lam) Varieties. Foods 2023, 12. [CrossRef]
- Walter, , W. M.; Truong, V.D.; Wiesenborn, D.P.; Carvajal, P. Rheological and Physicochemical Properties of Starches from Moist- and Dry-Type Sweetpotatoes. J. Agric. Food Chem. 2000, 48, 2937–2942. [CrossRef]
- Abd El-Aal, M.; Abouzeid, R.; Koo, M.S.; Shayan, M.; Picha, D.H.; Wu, Q. Physicochemical and Structural Properties of Starches from Diverse Sweetpotato Genotypes Grown in Louisiana, United States. ACS Food Science and Technology 2025, 5, 3563–3576. [CrossRef]
- He, H.-J.; Wang, Y.; Wang, Y.; Al-Maqtari, Q.A.; Liu, H.; Zhang, M.; Ou, X. Towards Rapidly Quantifying and Visualizing Starch Content of Sweet Potato Based on NIR Spectral and Image Data Fusion. Int. J. Biol. Macromol. 2023, 242, 124748. [CrossRef]
- Lee, J.H.; Park, D.; Tae, S.H.; Chang, S.M.; Baek, M.W.; Tilahun, S.; Jeong, C.S. Prediction of Chilling Injury and Key Indicator Parameters in Sweet Potatoes Using VNIR Spectroscopy. Postharvest Biol. Technol. 2025, 222, 113389. [CrossRef]
- Kim, D.-S.; Choi, M.-H.; Shin, H.-J. Estimation of Starch Hydrolysis in Sweet Potato (Beni Haruka) Based on Storage Period Using Nondestructive Near-Infrared Spectrometry. Agriculture 2021, 11, 135. [CrossRef]
- Wang, Y.; Xing, L.; He, H.-J.; Zhang, J.; Chew, K.W.; Ou, X. NIR Sensors Combined with Chemometric Algorithms in Intelligent Quality Evaluation of Sweetpotato Roots from Farm to Table: Progresses, Challenges, Trends, and Prospects. Food Chem. X 2024, 22, 101449. [CrossRef]
- Tang, C.; Jiang, B.; Ejaz, I.; Ameen, A.; Zhang, R.; Mo, X.; Wang, Z. High-Throughput Phenotyping of Nutritional Quality Components in Sweet Potato Roots by near-Infrared Spectroscopy and Chemometrics Methods. Food Chem. X 2023, 20, 100916. [CrossRef]
- He, H.-J.; Wang, Y.; Zhang, M.; Wang, Y.; Ou, X.; Guo, J. Rapid Determination of Reducing Sugar Content in Sweet Potatoes Using NIR Spectra. Journal of Food Composition and Analysis 2022, 111, 104641. [CrossRef]
- Alander, J.T.; Bochko, V.; Martinkauppi, B.; Saranwong, S.; Mantere, T. A Review of Optical Nondestructive Visual and Near-Infrared Methods for Food Quality and Safety. Int. J. Spectrosc. 2013, 2013, 1–36. [CrossRef]
- Amankwaah, V.; Williamson, S.; Reynolds, R.; Ibrahem, R.; Truong, V.-D.; Carey, E.; Yencho, G.C. Development of NIRS Calibration Curves for Sugars in Baked Sweetpotato. J. Sci. Food Agric. 2024, 104, 4801–4807. [CrossRef]
- Aparatana, K.; Tsuji, H.; Taira, E.; Ishiguro, K. Feasibility of Rapid Brix Prediction in Sweet Potatoes Using a Handheld Near-Infrared Spectrometer. Engineering in Agriculture, Environment and Food 2026, 19, 111–118. [CrossRef]
- Müller-Maatsch, J.; van Ruth, S.M. Handheld Devices for Food Authentication and Their Applications: A Review. Foods 2021, 10, 2901. [CrossRef]
- Aparatana, K.; Tsuji, H.; Taira, E.; Ishiguro, K. Feasibility of Rapid Brix Prediction in Sweet Potatoes Using a Handheld Near-Infrared Spectrometer; 2026; Vol. 19;
Figure 1.
Effects of sweet potato variety (Beauregard, Orleans, Sakura), storage temperature (5 °C, 15 °C, 25 °C), and storage duration (Days 1-8) on moisture content (%).
Figure 1.
Effects of sweet potato variety (Beauregard, Orleans, Sakura), storage temperature (5 °C, 15 °C, 25 °C), and storage duration (Days 1-8) on moisture content (%).
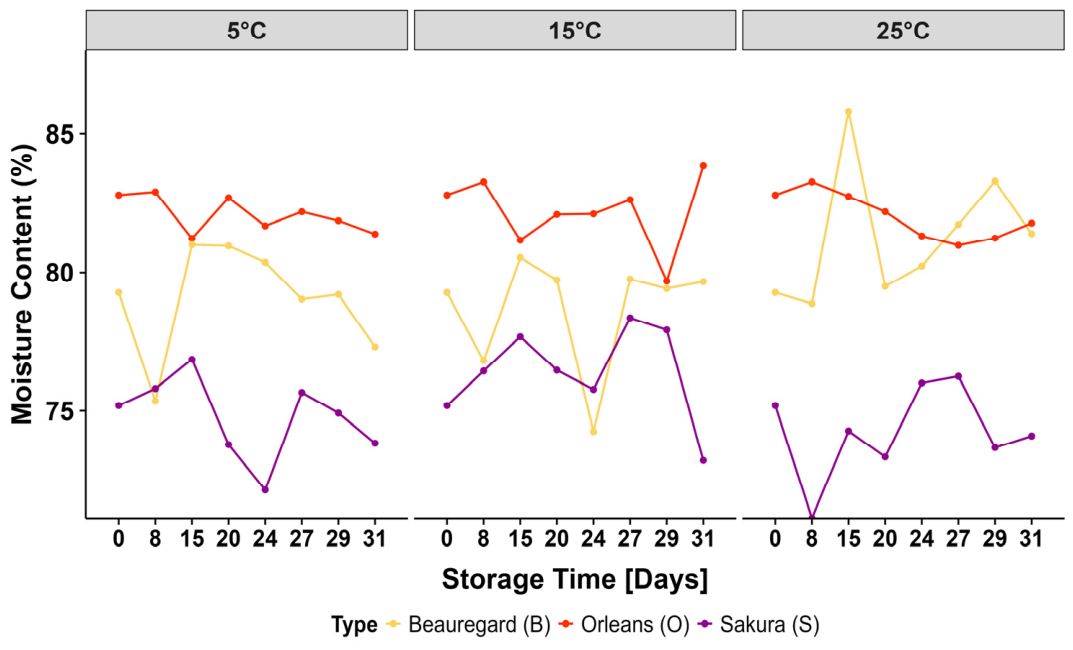
Figure 2.
Effects of sweet potato variety (Beauregard, Orleans, Sakura), storage temperature (5 °C, 15 °C, 25 °C), and storage duration (Days 1-8) on total phenolic content (mg GA/g).
Figure 2.
Effects of sweet potato variety (Beauregard, Orleans, Sakura), storage temperature (5 °C, 15 °C, 25 °C), and storage duration (Days 1-8) on total phenolic content (mg GA/g).
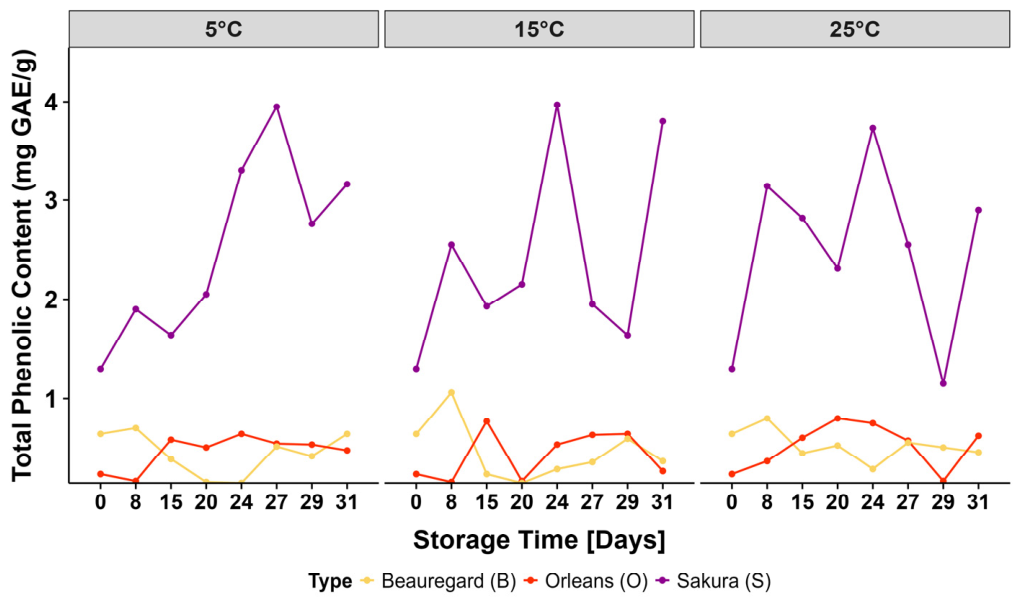
Figure 3.
Effects of sweet potato variety (Beauregard, Orleans, Sakura), storage temperature (5 °C, 15 °C, 25 °C), and storage duration (Days 1-8) on total starch content (g/100g).
Figure 3.
Effects of sweet potato variety (Beauregard, Orleans, Sakura), storage temperature (5 °C, 15 °C, 25 °C), and storage duration (Days 1-8) on total starch content (g/100g).
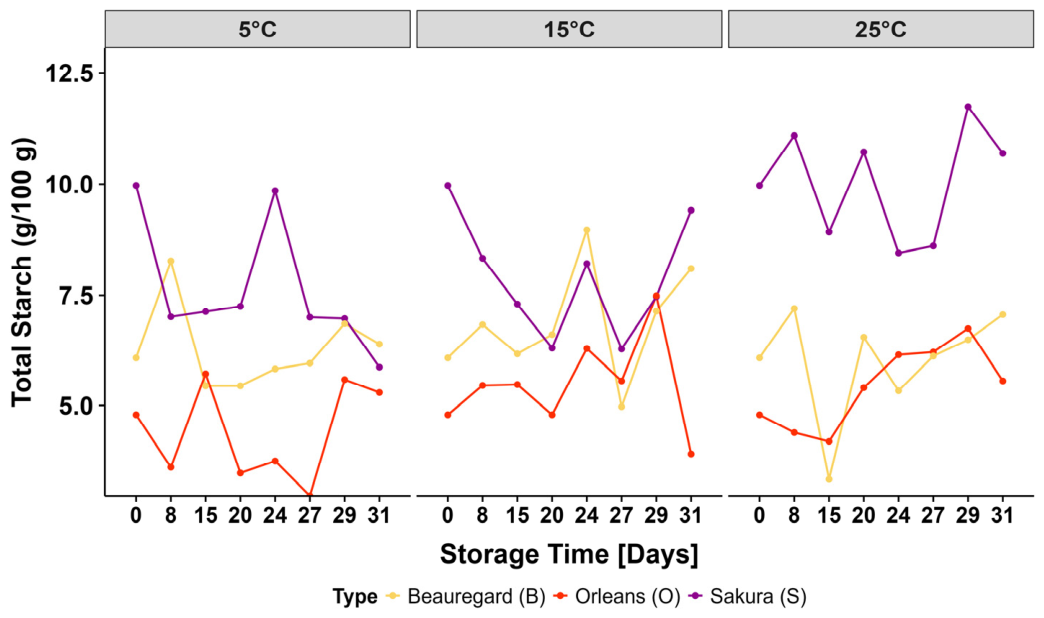
Figure 4.
Effects of storage time (Day 0, Day 15 and Day 31) on moisture content (%) of sweet potato samples, across three cultivars (Beauregard, Orleans, Sakura). Data were pooled across storage temperatures (5, 15, and 25 °C). Pairwise comparisons between storage periods were performed using t-tests with Holm adjustment; significant differences were highlighted using letters (p<0.05). Where no letters are presented, there was no significant difference between the groups.
Figure 4.
Effects of storage time (Day 0, Day 15 and Day 31) on moisture content (%) of sweet potato samples, across three cultivars (Beauregard, Orleans, Sakura). Data were pooled across storage temperatures (5, 15, and 25 °C). Pairwise comparisons between storage periods were performed using t-tests with Holm adjustment; significant differences were highlighted using letters (p<0.05). Where no letters are presented, there was no significant difference between the groups.
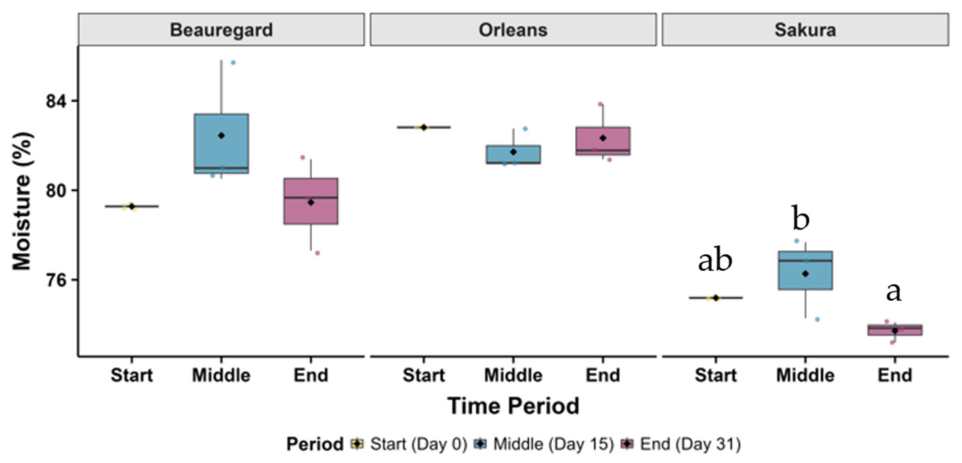
Figure 5.
Effects of storage time (Day 0, Day 15 and Day 31) on total phenolic content (mg GA/g) of sweet potato samples, across three cultivars (Beauregard, Orleans, Sakura). Data were pooled across storage temperatures (5, 15, and 25 °C). Pairwise comparisons between storage periods were performed using t-tests with Holm adjustment; significant differences were highlighted using letters (p<0.05).
Figure 5.
Effects of storage time (Day 0, Day 15 and Day 31) on total phenolic content (mg GA/g) of sweet potato samples, across three cultivars (Beauregard, Orleans, Sakura). Data were pooled across storage temperatures (5, 15, and 25 °C). Pairwise comparisons between storage periods were performed using t-tests with Holm adjustment; significant differences were highlighted using letters (p<0.05).
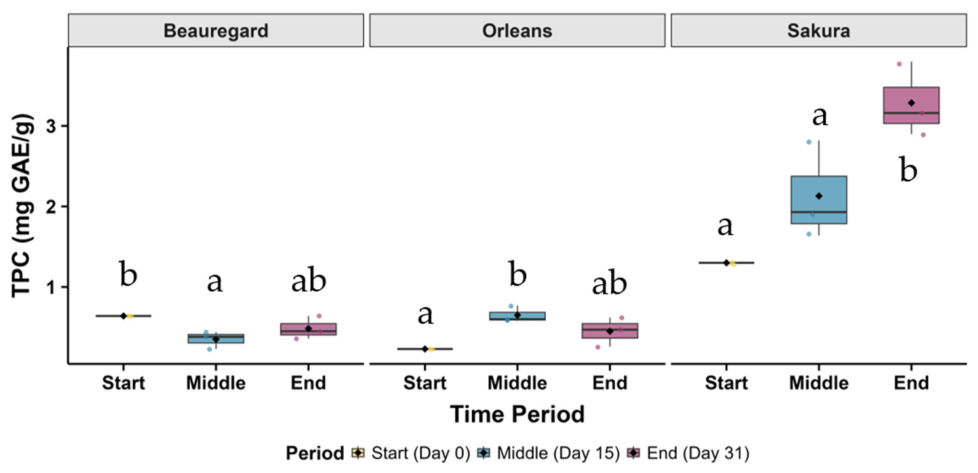
Figure 6.
Effects of storage time (Day 0, Day 15 and Day 31) on total total starch content (g/100g) of sweet potato samples, across three cultivars (Beauregard, Orleans, Sakura). Data were pooled across storage temperatures (5, 15, and 25 °C). Pairwise comparisons between storage periods were performed using t-tests with Holm adjustment; significant differences were highlighted using letters (p<0.05). Where no letters are presented, there was no significant difference between the groups.
Figure 6.
Effects of storage time (Day 0, Day 15 and Day 31) on total total starch content (g/100g) of sweet potato samples, across three cultivars (Beauregard, Orleans, Sakura). Data were pooled across storage temperatures (5, 15, and 25 °C). Pairwise comparisons between storage periods were performed using t-tests with Holm adjustment; significant differences were highlighted using letters (p<0.05). Where no letters are presented, there was no significant difference between the groups.
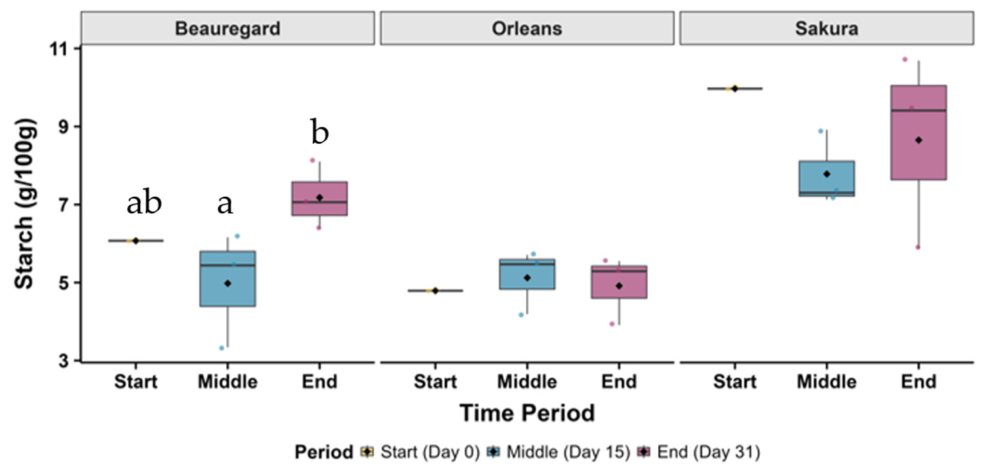
Figure 7.
Raw (left) and treated spectra of the sweet potato samples. Coloring by storage temperature. A = spectra recorded with benchtop device on powdered samples; B = spectra recorded with handheld device on powdered samples; C = spectra recorded with benchtop device on cut surface; D = spectra recorded with handheld device on cut surface; E = spectra recorded with handheld device through skin. DT = detrending, SG = Savitzky-Golay filter, SNV = standard normal variate.
Figure 7.
Raw (left) and treated spectra of the sweet potato samples. Coloring by storage temperature. A = spectra recorded with benchtop device on powdered samples; B = spectra recorded with handheld device on powdered samples; C = spectra recorded with benchtop device on cut surface; D = spectra recorded with handheld device on cut surface; E = spectra recorded with handheld device through skin. DT = detrending, SG = Savitzky-Golay filter, SNV = standard normal variate.
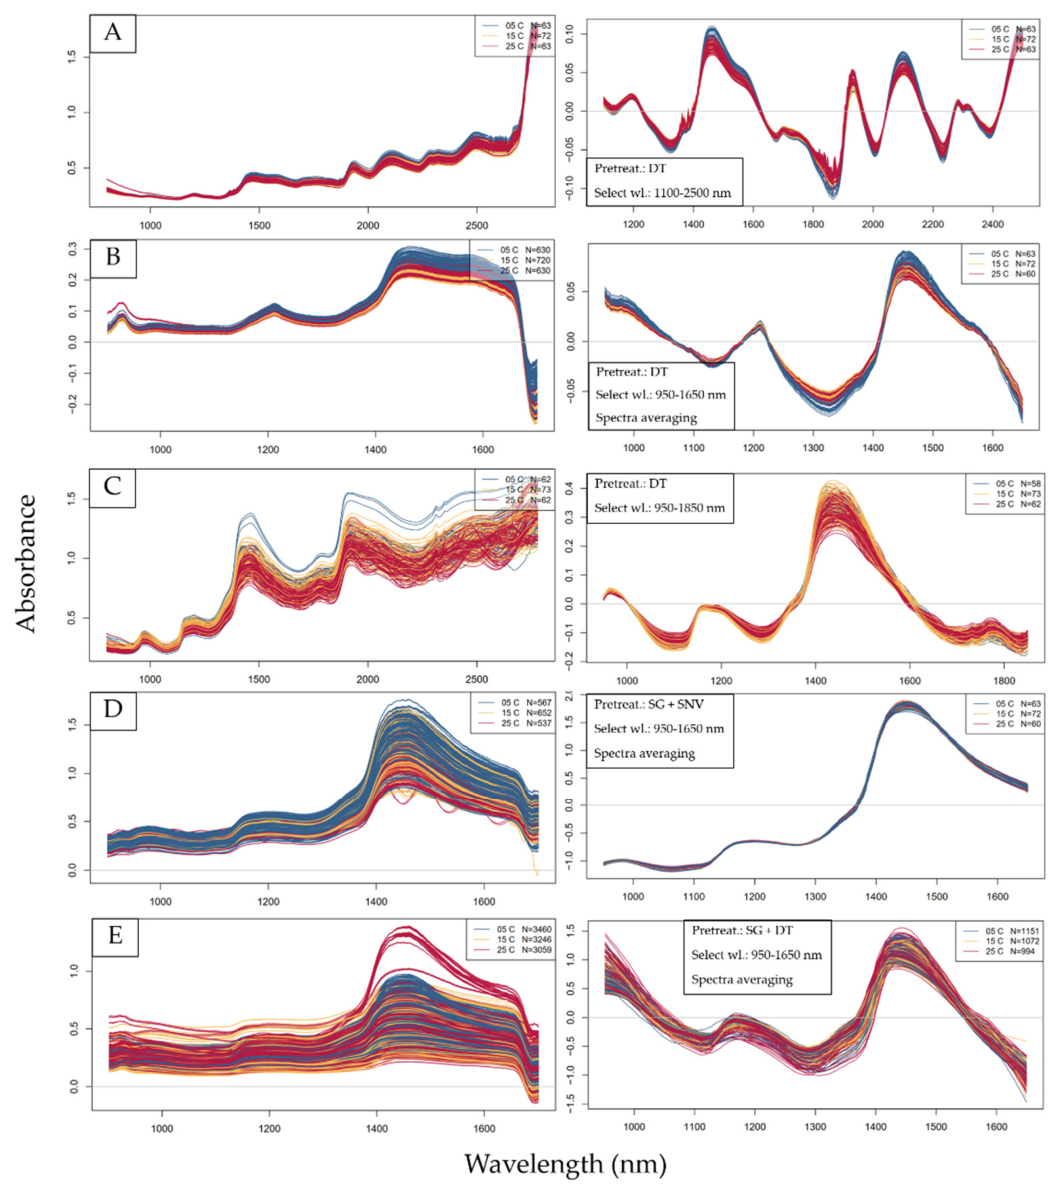
Figure 8.
PCA score plots to observe measurement points belonging to the different sweet potato cultivars with corresponding loadings vectors. Spectra recorded on powdered samples with the benchtop device. Detrending as pretreatment. A = entire dataset; B = samples stored at 5 °C; C = samples stored at 15 °C; D = samples stored at 25 °C.
Figure 8.
PCA score plots to observe measurement points belonging to the different sweet potato cultivars with corresponding loadings vectors. Spectra recorded on powdered samples with the benchtop device. Detrending as pretreatment. A = entire dataset; B = samples stored at 5 °C; C = samples stored at 15 °C; D = samples stored at 25 °C.
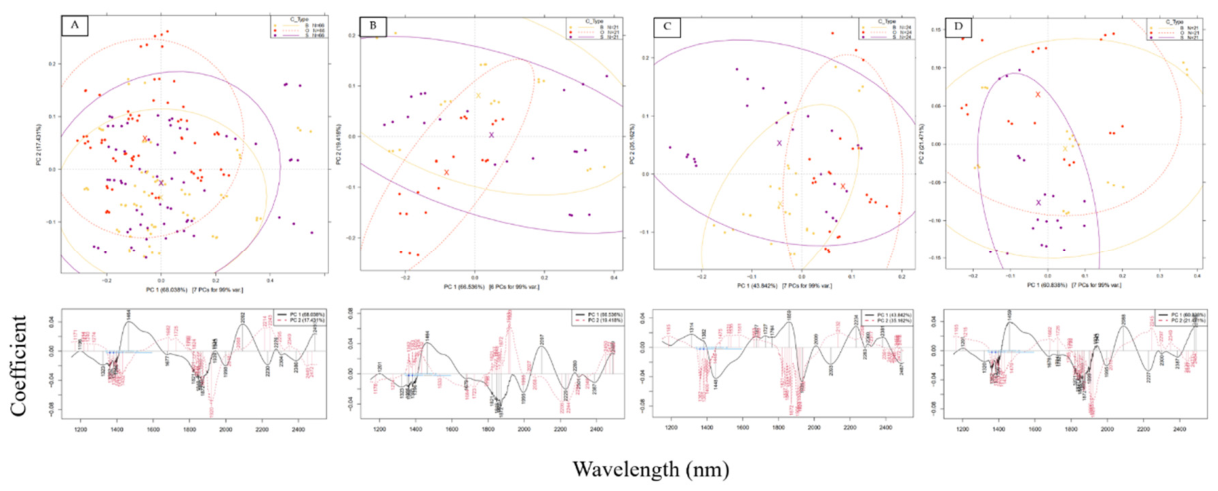
Figure 9.
PCA score plots to observe measurement points belonging to the different storage temperatures with corresponding loadings vectors. Spectra recorded on powdered samples with the benchtop device. Detrending as pretreatment. A = entire dataset; B = only samples of the Sakura cultivar; C = only samples of the Orleans cultivar; D = only samples of the Beauregard cultivar.
Figure 9.
PCA score plots to observe measurement points belonging to the different storage temperatures with corresponding loadings vectors. Spectra recorded on powdered samples with the benchtop device. Detrending as pretreatment. A = entire dataset; B = only samples of the Sakura cultivar; C = only samples of the Orleans cultivar; D = only samples of the Beauregard cultivar.
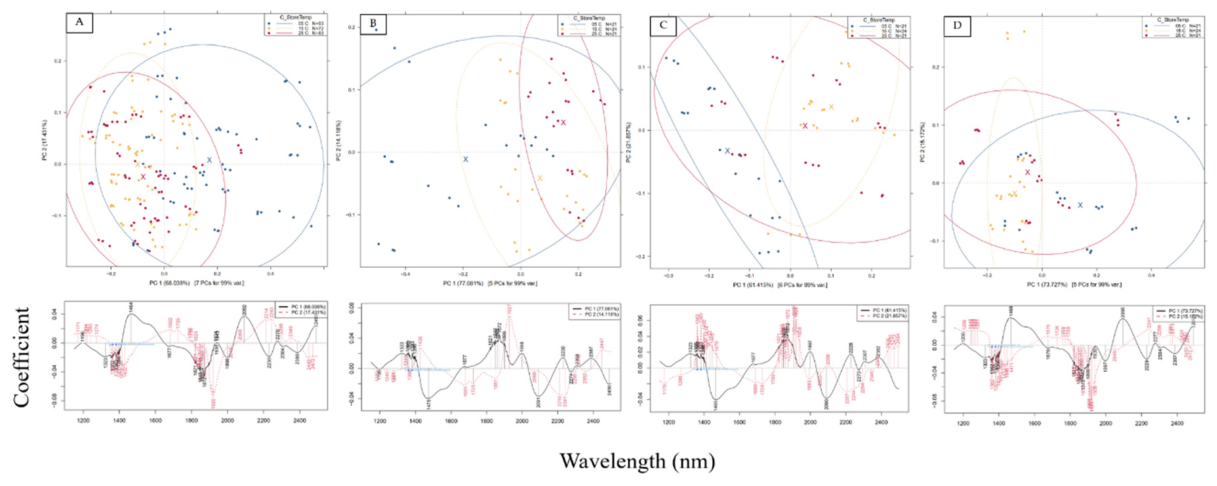
Figure 10.
LDA results to classify sweet potato cultivars stored at different temperatures. A = 5 °C storage; B = 15 °C storage; C = 25 °C storage. 1 (upper row) = benchtop device; 2 (lower row) = handheld device. PC = number of components used for modelling.
Figure 10.
LDA results to classify sweet potato cultivars stored at different temperatures. A = 5 °C storage; B = 15 °C storage; C = 25 °C storage. 1 (upper row) = benchtop device; 2 (lower row) = handheld device. PC = number of components used for modelling.
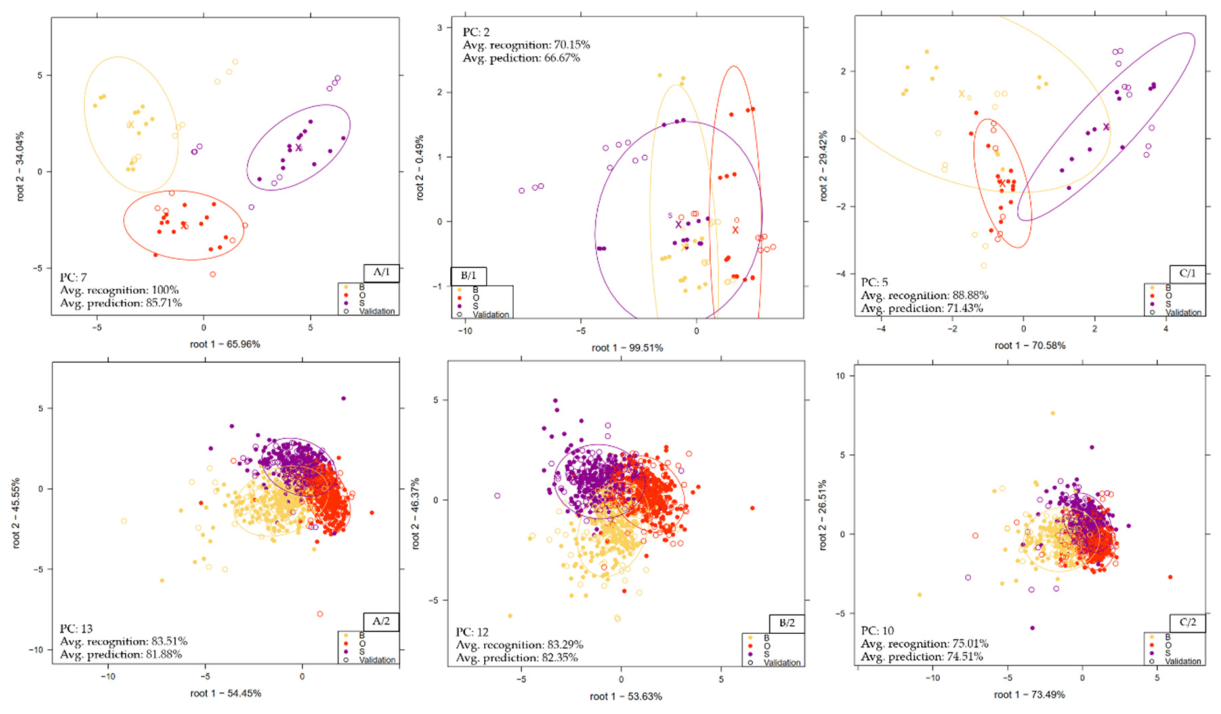
Figure 11.
Regression vectors of the best performing models for each predicted reference parameter. A = storage time with the benchtop cut-surface sub-dataset; B = moisture content; C = total phenolic content with the benchtop powder sub-dataset; D = total starch content with the benchtop powder sub-dataset.
Figure 11.
Regression vectors of the best performing models for each predicted reference parameter. A = storage time with the benchtop cut-surface sub-dataset; B = moisture content; C = total phenolic content with the benchtop powder sub-dataset; D = total starch content with the benchtop powder sub-dataset.
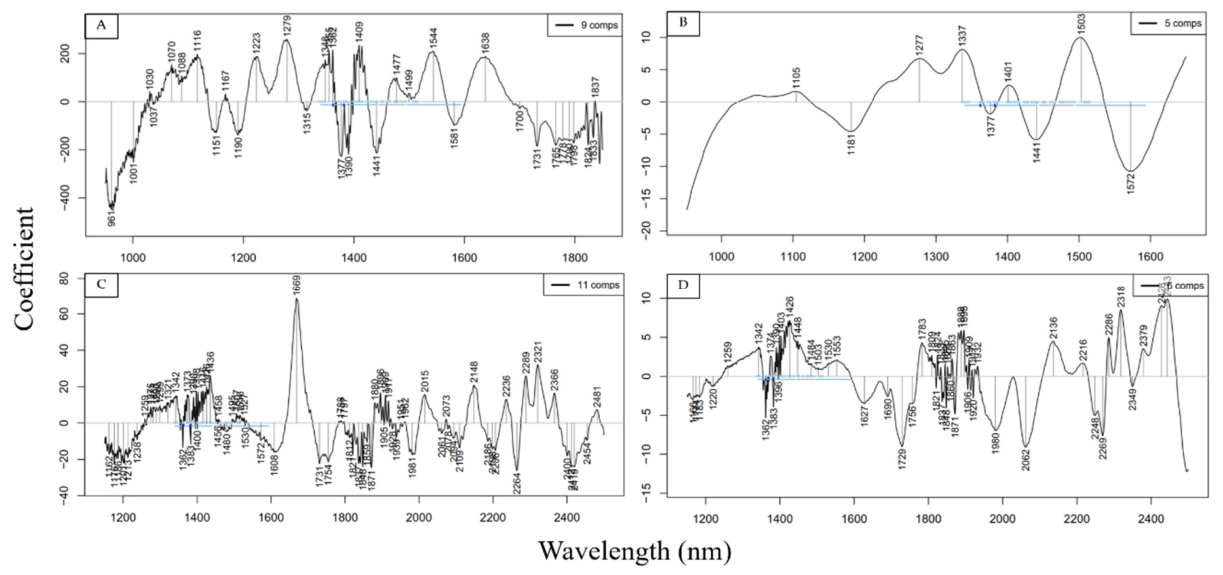
Table 1.
Summary of the measurements through the experimental period.
| Measurement sessions | ||||||||
| 1 | 2 | 3 | 4 | 5 | 6 | 7 | 8 | |
| Storage time (day) | 0 | 8 | 15 | 20 | 24 | 27 | 29 | 30 |
| Sweet potato type | 3 | 3 | 3 | 3 | 3 | 3 | 3 | 3 |
| Environmental condition | 1 | 3 | 3 | 3 | 3 | 3 | 3 | 3 |
| Total samples for reference | 3 | 9 | 9 | 9 | 9 | 9 | 9 | 9 |
| Total samples for NIRS skin scans | 156 | 153 | 144 | 135 | 126 | 117 | 108 | 99 |
| Benchtop NIRS cut surface scans | 9 | 27 | 27 | 27 | 27 | 27 | 27 | 27 |
| Benchtop NIRS powder scans | 9 | 27 | 27 | 27 | 27 | 27 | 27 | 27 |
| Handheld NIRS cut surface scans | 81 | 243 | 243 | 243 | 243 | 243 | 243 | 243 |
| Handheld NIRS powder scans | 30 | 90 | 90 | 90 | 90 | 90 | 90 | 90 |
| Handheld NIRS skin scans | 1404 | 1377 | 1296 | 1215 | 1134 | 1053 | 972 | 891 |
Table 2.
LDA results in classifying the different sweet potato cultivars using both devices and all arrangements. PC = number of principal components used.
Table 2.
LDA results in classifying the different sweet potato cultivars using both devices and all arrangements. PC = number of principal components used.
| Powder | Cut surface | Skin | |||
| Instrument | MPA FT-NIR | NIR-S-G1 | MPA FT-NIR | NIR-S-G1 | NIR-S-G1 |
| Range (wl) | 1150-2500 | 950-1650 | 950-1850 | 950-1650 | 950-1650 |
| Spectra averaging | No | Yes | No | Yes | Yes |
| Pre-treat. | SD | DT | DT | SG + SNV | SG + DT |
| PC | 9 | 7 | 8 | 8 | 15 |
| Avg. recognition (%) | 89.39 | 78.52 | 78.05 | 71.09 | 80.15 |
| Avg. prediction (%) | 84.35 | 72.89 | 51.40 | 62.87 | 79.25 |
Table 3.
LDA results in classifying samples belonging to different storage conditions using both devices and all arrangements. PC = number of principal components used.
Table 3.
LDA results in classifying samples belonging to different storage conditions using both devices and all arrangements. PC = number of principal components used.
| Powder | Cut surface | Skin | |||
| Instrument | MPA FT-NIR | NIR-S-G1 | MPA FT-NIR | NIR-S-G1 | NIR-S-G1 |
| Range (wl) | 1150-2500 | 950-1650 | 950-1850 | 950-1650 | 950-1650 |
| Spectra averaging | No | Yes | No | Yes | Yes |
| Pre-treat. | DT | DT | DT | DT | SG + DT |
| PC | 11 | 4 | 7 | 6 | 11 |
| Avg. recognition (%) | 87.05 | 67.03 | 64.96 | 57.72 | 54.46 |
| Avg. prediction (%) | 71.83 | 62.10 | 54.79 | 53.06 | 53.11 |
Table 4.
PLSR results to predict reference parameters (storage time, moisture content) based on sweet potato spectra, using both devices and all arrangements. LV = number of latent variables used; NF = not feasible/no correlation; N/A = not applicable.
Table 4.
PLSR results to predict reference parameters (storage time, moisture content) based on sweet potato spectra, using both devices and all arrangements. LV = number of latent variables used; NF = not feasible/no correlation; N/A = not applicable.
| Storage time (h) | Moisture (%) | ||||||||||||
| Powder | Cut surface | Skin | Powder | Cut surface | Skin | ||||||||
| Instrument | MPA FT-NIR | NIR-S-G1 | MPA FT-NIR | NIR-S-G1 | NIR-S-G1 | N/A | N/A | MPA FT-NIR | NIR-S-G1 | NIR-S-G1 | |||
| Range (wl) | 1150-2500 | 950-1650 | 950-1850 | 950-1650 | 950-1650 | N/A | N/A | 950-1850 | 950-1650 | 950-1650 | |||
| Spectra averaging | No | Yes | No | Yes | Yes | N/A | N/A | Yes | No | Yes | |||
| Pre-treat. | DT | DT | SG + SNV | DT | SG + DT | N/A | N/A | SG + SNV | SG + SNV | SG + DT | |||
| Reference range | 1–744 | 1–744 | 1–744 | 1–744 | 1–744 | N/A | N/A | 71.12–85.82 | 71.12–85.82 | 71.12–85.82 | |||
| LV | 8 | 6 | 9 | 5 | 12 | N/A | N/A | 7 | 5 | 15 | |||
| RMSEC | 127.54 ± 2.20 | N/F | 91.44 ± 2.76 | 131.32 ± 2.52 | 152.26 ± 0.85 | N/A | N/A | 2.05 ± 0.04 | 1.69 ± 0.02 | N/F | |||
| R2C | 0.65 ± 0.01 | N/F | 0.82 ± 0.01 | 0.63 ± 0.02 | 0.61 ± 0.00 | N/A | N/A | 0.64 ± 0.02 | 0.76 ± 0.01 | N/F | |||
| RMSECV | 169.33 ± 10.60 | N/F | 117.08 ± 6.03 | 150.49 ± 1.74 | 155.48 ± 0.87 | N/A | N/A | 2.45 ± 0.03 | 1.88 ± 0.02 | N/F | |||
| R2CV | 0.38 ± 0.08 | N/F | 0.71 ± 0.03 | 0.52 ± 0.01 | 0.6 ± 0.00 | N/A | N/A | 0.49 ± 0.03 | 0.7 ± 0.01 | N/F | |||
| RMSEP | 144.57 ± 6.78 | N/F | 107.95 ± 16.54 | 126.23 ± 5.72 | 160.89 ± 0.87 | N/A | N/A | 1.88 ± 0.11 | 1.88 ± 0.11 | N/F | |||
| R2P | 0.42 ± 0.03 | N/F | 0.65 ± 0.07 | 0.54 ± 0.05 | 0.56 ± 0.01 | N/A | N/A | 0.64 ± 0.09 | 0.66 ± 0.07 | N/F | |||
Table 5.
PLSR results to predict reference parameters (total phenolic content, total start content) based on sweet potato spectra, using both devices and all arrangements. LV = number of latent variables used; NF = not feasible/no correlation.
Table 5.
PLSR results to predict reference parameters (total phenolic content, total start content) based on sweet potato spectra, using both devices and all arrangements. LV = number of latent variables used; NF = not feasible/no correlation.
| Total phenolic content (mg GA/g) | Total starch content (g/100g) | |||||||||
| Powder | Cut surface | Skin | Powder | Cut surface | Skin | |||||
| Instrument | MPA FT-NIR | NIR-S-G1 | MPA FT-NIR | NIR-S-G1 | NIR-S-G1 | MPA FT-NIR | NIR-S-G1 | MPA FT-NIR | NIR-S-G1 | NIR-S-G1 |
| Range (wl) | 1150-2500 | 950-1650 | 950-1850 | 950-1650 | 950-1650 | 1150-2500 | 950-1650 | 950-1850 | 950-1650 | 950-1650 |
| Spectra averaging | Yes | No | Yes | No | Yes | Yes | No | Yes | No | Yes |
| Pre-treat. | DT | DT | SG + SNV | DT | SG + DT | DT | DT | SG + SNV | DT | SG + DT |
| Reference range | 0.14–3.97 | 0.14–3.97 | 0.14–3.97 | 0.14–3.97 | 0.14–3.97 | 2.97–11.74 | 2.97–11.74 | 2.97–11.74 | 2.97–11.74 | 2.97–11.74 |
| LV | 11 | 11 | 10 | 6 | 13 | 6 | 8 | 10 | 5 | 13 |
| RMSEC | 1.39 ± 0.15 | 1.94 ± 0.22 | 0.74 ± 0.05 | 0.72 ± 0.06 | 0.72 ± 0.02 | 1.87 ± 0.11 | 2.47 ± 0.08 | 0.98 ± 0.04 | 1.11 ± 0.04 | NF |
| R2C | 0.89 ± 0.02 | 0.79 ± 0.04 | 0.56 ± 0.05 | 0.59 ± 0.05 | 0.58 ± 0.03 | 0.88 ± 0.01 | 0.78 ± 0.02 | 0.72 ± 0.02 | 0.67 ± 0.03 | NF |
| RMSECV | 2.03 ± 0.28 | 3.13 ± 0.50 | 1 ± 0.12 | 0.83 ± 0.08 | 0.91 ± 0.03 | 2.3 ± 0.14 | 3.2 ± 0.11 | 1.26 ± 0.09 | 1.24 ± 0.05 | NF |
| R2CV | 0.76 ± 0.06 | 0.45 ± 0.15 | 0.19 ± 0.20 | 0.46 ± 0.08 | 0.33 ± 0.05 | 0.82 ± 0.02 | 0.63 ± 0.03 | 0.54 ± 0.08 | 0.58 ± 0.04 | NF |
| RMSEP | 1.92 ± 0.73 | 3 ± 1.20 | 0.88 ± 0.25 | 0.82 ± 0.31 | 0.97 ± 0.15 | 2.34 ± 0.38 | 3.53 ± 0.49 | 1.45 ± 0.25 | 1.36 ± 0.15 | NF |
| R2P | 0.8 ± 0.13 | 0.49 ± 0.31 | 0.37 ± 0.29 | 0.46 ± 0.32 | 0.28 ± 0.29 | 0.79 ± 0.06 | 0.43 ± 0.13 | 0.25 ± 0.47 | 0.45 ± 0.12 | NF |
Disclaimer/Publisher’s Note: The statements, opinions and data contained in all publications are solely those of the individual author(s) and contributor(s) and not of MDPI and/or the editor(s). MDPI and/or the editor(s) disclaim responsibility for any injury to people or property resulting from any ideas, methods, instructions or products referred to in the content. |
© 2026 by the authors. Licensee MDPI, Basel, Switzerland. This article is an open access article distributed under the terms and conditions of the Creative Commons Attribution (CC BY) license (http://creativecommons.org/licenses/by/4.0/).
Copyright: This open access article is published under a Creative Commons CC BY 4.0 license, which permit the free download, distribution, and reuse, provided that the author and preprint are cited in any reuse.