
Submitted:
08 September 2026
Posted:
08 September 2026
You are already at the latest version
Abstract
In this study, impact compression tests were conducted on sandstone, shale, and conglomerate using a split Hopkinson pressure bar (SHPB) apparatus to investigate their mechanical responses and constitutive relationships under dynamic loading. Stress–strain curves at different strain rates were obtained, and the strain-rate enhancement effect, failure mode, and fragmentation fractal characteristics of each rock type were systematically analyzed. Based on continuum damage mechanics and statistical strength theory, a dynamic statistical damage constitutive model for rocks was developed, and the model parameters were identified and validated using experimental data. The results indicate that the proposed model effectively simulates the dynamic mechanical behavior of rocks under impact loading, with theoretical curves showing good agreement with experimental results. The dynamic compressive strength of rocks exhibits significant strain-rate sensitivity, and the fragment size distribution follows a distinct fractal law. This study provides theoretical support and experimental evidence for dynamic hazard warning and protective design in deep rock mass engineering.
Keywords:
SHPB test
; impact loading
; strain rate
; fractal dimension
; damage constitutive model
1. Introduction
As underground engineering extends to greater depths, the stress state and dynamic disturbance intensity of rock masses have significantly increased. Consequently, the frequency and magnitude of various impact loads acting on rock structures, such as blasting excavation, mechanical vibration, and transient tectonic stress changes, have continuously risen [1,2,3]. Under high strain-rate loading, the mechanical behavior of rocks changes markedly, exhibiting significant strain-rate dependence, diversified failure modes, and strongly nonlinear damage evolution [4]. In-depth investigation of the dynamic mechanical response of rocks under impact loading holds important theoretical value and engineering significance for tunnel support design, high-slope stability analysis, dynamic response assessment of geological structures, and underground space safety control [5,6,7].
The split Hopkinson pressure bar (SHPB) technique, due to its superior performance in testing the dynamic response of materials under high strain-rate loading, has become an essential experimental tool for studying the impact mechanical behavior of rock-like materials [8]. Chinese scholars such as Li Xibing [9] and Zhu Jingjing et al. [10] have conducted a series of dynamic tests on granite, limestone, and concrete using this technique, revealing the strength variation laws and failure characteristics of rocks under high strain rates. The SHPB test method provides effective support for in-depth research on the dynamic mechanical responses of various rock types, including sandstone, conglomerate, and shale [11,12,13].
Furthermore, the geometric characteristics of rock fragmentation products often exhibit a typical fractal structure, with the fractal dimension D effectively characterizing the degree of fragmentation and fracture mechanism [14]. Since the establishment of fractal geometry theory, Gao Feng et al. [15] were the first to apply this method to the study of rock fragment size distribution, finding a power-law relationship between fragment size and fractal dimension. Zhang Ying et al. [16] systematically measured the fractal dimensions of basalt and limestone under different impact energies using SHPB tests, revealing the variation pattern of fractal dimension with impact energy. As a geometric parameter characterizing the complexity of fragmentation, the fractal dimension has been widely used to describe the spatial structural evolution during dynamic rock fracture [17,18,19].
In the field of dynamic constitutive modeling, traditional static models struggle to accurately describe the nonlinear mechanical behavior of rocks under high strain rates. Therefore, dynamic damage models that can reflect strain-rate effects have been gradually developed [20,21,22]. Cochard et al. [23] established a damage model based on microstructural evolution, starting from the initiation and propagation of microcracks. Wang et al. [24,25,26] proposed a viscoelastic-damage coupled ZWT model to describe the relationship between loading rate and hysteretic damage. Domestically, Shan Renliang et al. [27] combined the Weibull distribution with statistical strength theory to construct a nonlinear constitutive model considering microscopic randomness and damage evolution. Xie Lixiang et al. [28] further introduced a strain-rate influence factor, improving the model’s ability to respond to changes in loading and unloading paths. While these models exhibit good adaptability in characterizing rate-dependent strengthening, dynamic strength enhancement, and brittle transition of materials, certain limitations remain in achieving unified modeling of different lithologies [29,30,31,32].
Sandstone, shale, and conglomerate, as typical representatives of sedimentary rocks, are widely distributed in the Sichuan Basin, North China Rift Valley, and South China Tectonic Belt [33,34,35]. These three rock types differ significantly in diagenesis, structural characteristics, and mechanical properties, leading to essential differences in their response mechanisms to high-strain-rate impact disturbances [36]. Sandstone has a relatively dense skeletal structure, exhibiting high and stable compressive strength. Shale possesses well-developed bedding planes and is prone to splitting failure along weak surfaces. Conglomerate, containing various types of large heterogeneous particles, displays complex failure modes [37,38,39,40]. Conducting systematic experiments on the dynamic mechanical response and damage constitutive modeling of these three rock types within a unified theoretical framework not only helps to deeply reveal the dynamic failure mechanisms of different lithologies but also provides theoretical support for engineering mechanical prediction and model applicability optimization under diverse tectonic settings [41,42,43].
Therefore, this study selected three typical rocks—sandstone, shale, and conglomerate—as research subjects. Using an SHPB impact compression test system, the study systematically analyzed the stress–strain evolution laws, dynamic mechanical parameter characteristics, and fractal distribution of post-impact fragments under different strain rates. Combining statistical damage theory with continuum mechanics, a unified dynamic damage constitutive model capable of characterizing the dynamic response characteristics of multiple lithologies was developed, followed by parameter inversion and model validation. The research findings aim to provide a solid theoretical foundation and experimental support for impact resistance analysis and dynamic modeling of typical rock strata.
2. Experimental Scheme
2.1. Specimen Preparation
This study focuses on the dynamic mechanical environment faced by reservoir rocks during oil and gas development. In deep oil and gas extraction, hydraulic fracturing, and unconventional resource development, reservoir rocks are often subjected to dynamic loads such as drilling disturbances, stress concentration release, or fracturing impacts. Their dynamic compressive strength and damage characteristics directly affect extraction efficiency and engineering safety. Therefore, three typical rock types were selected: tight sandstone from the Ordos Basin (SY), shale from the Longmaxi Formation in Yibin, Sichuan (YY), and conglomerate from Jimsar, Xinjiang (LY). All specimens were drilled from intact block cores, with specimens of the same type taken from the same rock slab to ensure lithological consistency and representativeness.
Considering the influence of stress wave propagation characteristics and specimen geometric parameters on test results during impact loading, specimen preparation strictly followed the recommended methods of the International Society for Rock Mechanics (ISRM) and relevant domestic test specifications [44]. Sandstone, shale, and conglomerate specimens were uniformly machined into cylinders with a diameter of 50 mm and a height of 25 mm to ensure loading stability and comparability of results. Standard drilling, cutting, and end-face grinding processes were used for specimen machining, with the unevenness error of the end faces controlled within 0.02 mm. To minimize the influence of anisotropy on the mechanical response of shale specimens, the bedding plane direction was parallel to the cylinder axis. For sandstone and conglomerate specimens, rock blocks with uniform structure and no obvious cracks were selected.
To accurately measure the deformation process of the specimens, two sets of high-frequency resistance strain gauges (accuracy 1 με) were circumferentially attached to the middle of each specimen. Before attachment, the specimen surface was polished, cleaned of dust, and degreased. After attachment, the gauges were cured for 24 hours, and their resistance values were checked to ensure that the signal-to-noise ratio and test accuracy met the requirements [45]. At least six qualified specimens were prepared for each rock type, numbered, and sealed in a desiccator to prevent weathering or moisture absorption from affecting mechanical properties.
In the experimental design, the impact pressure and bullet impact velocity were set based on clear mechanical considerations and engineering context. Two levels of impact pressure were set for the dynamic compression tests: 0.276 MPa and 0.325 MPa, corresponding to average bullet impact velocities of 7.36 m/s and 8.69 m/s, respectively. This velocity range corresponds to medium strain rate (approximately 1–10² s⁻¹) loading conditions, which is a key range for studying the dynamic strength, fragmentation characteristics, and energy absorption behavior of rocks. Selecting two significantly different impact energy levels aims to systematically reveal the influence of impact intensity on the dynamic mechanical behavior of rocks and establish a quantitative relationship between impact parameters and material response. Three specimens of each lithology were tested at each pressure level, completing a total of 18 impact loading tests. Specimen installation is shown in Figure 1.
2.2. Test Apparatus
This study used a split Hopkinson pressure bar (SHPB) test system to conduct rock impact compression tests. The experimental setup is shown in Figure 2. The SHPB system consisted of a pneumatic launcher, a launch tube, an incident bar, a transmission bar, and an energy absorption system. The bar diameter was 50 mm, and both the incident and transmission bars were 2 m long. Impact loading was achieved by launching a bullet using the pneumatic system, with bullet velocity being stable and controllable. The system comprised a pneumatic launcher, a striker bar, an incident bar, a transmission bar, an absorption bar, and a high-speed data acquisition system. The bar material was high-strength martensitic stainless steel, offering good elasticity and wave impedance matching.
To generate a stable half-sine incident stress wave and avoid high-frequency oscillation interference, a specially designed conical nose was used at the front end of the striker bar [46]. After the gas gun drove the striker bar to impact the end of the incident bar, a stress wave in the form of a single pulse was generated in the incident bar. Upon propagating to the rock specimen, part of the wave was transmitted, and part was reflected, forming complete incident, reflected, and transmitted wave signals.
To capture the stress wave signals, strain gauges were attached to the middle surfaces of both the incident and transmission bars, forming a strain measurement bridge circuit. The strain signals were converted into voltage signals and recorded by a TDS-540 high-speed data acquisition system with a sampling frequency of 10 MHz. The system was pre-calibrated; the stress wave propagation velocity in the pressure bars was approximately 5200 m/s, and the waveforms were clear, satisfying the one-dimensional elastic stress wave assumption [47]. Based on one-dimensional elastic wave theory, the strain signals of the incident, reflected, and transmitted waves can be used to inversely derive the evolution curves of stress, strain, and strain rate of the rock specimen over time, providing fundamental data for subsequent constitutive model analysis.
2.3. Test Equilibrium Verification
Stress equilibrium is fundamental to ensuring data reliability in SHPB tests. Only when stress wave propagation is balanced across the rock specimen ends—meaning the specimen is in a quasi-static stress state throughout loading—can the obtained stress–strain relationship accurately reflect its true dynamic behavior [46]. This study used the waveform superposition method to verify stress balance during testing [48]. According to one-dimensional stress wave theory, when stress equilibrium is achieved at both ends of the rock specimen, the sum of the incident wave and reflected wave should equal the transmitted wave.
Before formal testing, multiple no-load and loaded tests were conducted to debug the system and correct waveforms. Representative waveforms were selected from the tests for waveform superposition processing. Figure 3 shows typical strain waveform results from the tests. It can be observed that the superposition curve of the incident and reflected waves essentially coincides with the transmitted wave during the main pulse action phase, with consistent waveform amplitudes and trends, indicating that dynamic stress equilibrium was achieved at both ends of the rock specimen [45].
Furthermore, the incident wave pulse in the waveform was intact, the reflected and transmitted waves showed no significant distortion, and no secondary wave reflection interference was observed, further verifying good specimen-bar interface contact and axial alignment, satisfying the basic assumptions of SHPB tests [47]. Verification of waveforms from multiple tests on the three rock types (sandstone, shale, conglomerate) showed that stress equilibrium could be achieved during the main loading phase, demonstrating good reliability of the test results and providing effective assurance for subsequent stress–strain curve acquisition and constitutive model fitting.
3. Test Results and Analysis
To systematically study the dynamic response characteristics and failure mechanisms of rocks under impact loading, the test results were analyzed from multiple perspectives. First, based on the complete stress–strain curves, the deformation and strength evolution laws of rocks under different lithologies and strain rates were analyzed. Then, by extracting dynamic mechanical parameters, the strain-rate effect and energy dissipation characteristics were quantitatively evaluated. Finally, through fractal analysis of fragment size distribution, the relationship between macroscopic fragmentation patterns and meso-structure was revealed, thereby comprehensively characterizing the dynamic mechanical behavior and failure characteristics of rocks.
3.1. Stress–Strain Evolution Characteristics of Specimens
3.1.1. Characteristics of Stress–Strain Curve Evolution
Figure 4 shows the stress–strain curve characteristics of the three rock types under impact pressures of 0.276 MPa and 0.325 MPa, reflecting the influence of the above parameter variations on the dynamic response of the rocks. The curves for sandstone and conglomerate exhibited a large slope at the initial loading stage, indicating high initial stiffness. The shale curve was relatively gentle, reflecting its lower initial modulus. Under higher impact pressure, the curves for all three rock types shifted upward as a whole, with increased peak stress, steeper curves, more rapid failure, and enhanced brittleness. The peak strain of sandstone increased slightly from 0.0135 to 0.015, indicating some ductility. In contrast, the peak strain of shale decreased from 0.0141 to 0.0114, and that of conglomerate decreased from 0.0097 to 0.0067, exhibiting more typical brittle contraction characteristics.
From the above results, it can be seen that the strain-rate effect significantly influences the dynamic compressive strength of rocks; the higher the strain rate, the stronger the rock’s ability to resist impact damage. The dynamic elastic modulus, however, remained largely unchanged with strain rate, indicating that the initial deformation stiffness of the rock is primarily determined by the material’s inherent properties rather than the loading rate. This feature is consistent in rock dynamics research. Furthermore, different lithologies responded differently to impact loading. The strength increase rate of shale under high strain rates was higher than that of sandstone and conglomerate, indicating its more pronounced dynamic brittleness. Conglomerate, due to its rigid skeleton, exhibited more stable resistance to impact.
3.1.2. Characteristics of Stress–Time Curve Evolution
Figure 5 shows the stress–time curve evolution characteristics of the three rock types under impact pressures of 0.276 MPa and 0.325 MPa. Overall, the stress–time curves of all three rock types exhibited obvious unimodal pulse characteristics. As the impact pressure increased from 0.276 MPa to 0.325 MPa, the peak stress generally shifted upward, the rising edge of the pulse became steeper, and the duration of the main pulse shortened, reflecting a significant strain-rate enhancement effect. Quantitatively, the average peak stress for the three rock types increased from 216.10 MPa (sandstone), 205.80 MPa (shale), and 230.89 MPa (conglomerate) at 0.276 MPa to 261.93 MPa, 240.22 MPa, and 266.44 MPa, respectively, at 0.325 MPa. The strength increase was most significant for sandstone (21.2%). In terms of timing, the peak stress occurred earliest for sandstone, followed by shale, and latest for conglomerate. Notably, only conglomerate showed a delay in peak occurrence at 0.325 MPa compared to the lower pressure, while the peaks for sandstone and shale occurred earlier under high pressure.
The post-peak attenuation morphology showed significant lithological differences. Under 0.276 MPa impact pressure, the stress–time curve of conglomerate showed the steepest post-peak attenuation, with stress dropping rapidly. The attenuation rates for sandstone and shale were significantly faster than under static conditions but slower than for conglomerate, reflecting dynamic brittleness characteristics. When the impact pressure increased to 0.325 MPa, conglomerate still maintained the steepest attenuation characteristics, indicating the most obvious brittle failure. The attenuation processes for sandstone and shale were relatively more gradual but still much faster than under quasi-static loading conditions, reflecting the combined effect of energy release and damage evolution inside the material under high-energy impact.
3.1.3. Characteristics of Strain–Time Curve Evolution
Figure 6 shows the strain–time curves of the three specimen types, which are monotonically increasing overall but rich in morphological details. As the pressure increased from 0.276 MPa to 0.325 MPa, the slope of the curves increased significantly, indicating a marked increase in the average strain rate, with shale showing the largest increase in strain rate. Additionally, significant lithological differences existed in curve morphology. For sandstone under high pressure (especially in case SY-4), a bimodal structure appeared with an apparent plateau before the second peak, suggesting a process of progressive damage accumulation, crack closure and reopening, or particle rearrangement before failure.
Shale also exhibited a distinct plateau under high pressure, though the bimodal feature was not evident, and post-peak strain growth was relatively slow, reflecting a deformation mechanism involving frictional slip along bedding planes and slow energy release under high-pressure impact. Conglomerate showed no obvious plateau; the curves were relatively smooth and uniform, but the timing of the high-pressure curve lagged behind the low-pressure curve peak, indicating a buffering and lagging response of the gravel-matrix system during dynamic deformation. Furthermore, the strain–time curves for all three rock types at 0.325 MPa occurred earlier than those at 0.276 MPa, meaning that the strain developed faster and took less time to reach the peak under high pressure, further confirming the accelerating effect of loading rate on the deformation process.
Synthesizing the observations from Figure 4, Figure 5 and Figure 6, the following conclusions can be drawn: Increasing impact energy generally enhances peak strength and accelerates deformation rate while also amplifying response differences among lithologies. Sandstone exhibits the fastest response and maintains some ductility under high pressure, showing bimodal behavior/plateaus. Shale shows the greatest strain-rate sensitivity, with concentrated failure and the most rapid post-peak attenuation. Conglomerate, although its peak strength increases, shows a delay in peak timing, gentle post-peak attenuation, and no obvious plateau, reflecting the lagging failure and energy dissipation effect of its gravel skeleton under impact loading. The timing information in Figure 5 and morphological details in Figure 6 collectively indicate that during impact failure, rocks exhibit both rate-dependent overall strength enhancement and progressive damage evolution and timing lags caused by microstructural heterogeneity. These features provide direct parameterization and mechanistic guidance for establishing constitutive models that can realistically reproduce the dynamic failure process.
3.2. Analysis of Dynamic Mechanical Performance Parameters of Specimens
Table 1 lists the dynamic mechanical parameters of three typical rocks—sandstone (SY), shale (YY), and conglomerate (LY)—under impact pressures of 0.276 MPa and 0.325 MPa, including strain rate, dynamic compressive strength, and dynamic elastic modulus.
When the impact pressure increased from 0.276 MPa to 0.325 MPa, the average strain rates for sandstone, shale, and conglomerate increased from 138.56 s⁻¹, 114.01 s⁻¹, and 121.92 s⁻¹ to 179.14 s⁻¹, 203.76 s⁻¹, and 147.79 s⁻¹, respectively. Shale exhibited the largest increase in strain rate (78.7%), followed by sandstone (29.3%) and conglomerate (21.2%). Under increased pressure, shale showed a more drastic deformation rate, indicating its structure is more prone to high strain-rate responses under impact energy.
The average compressive strengths of sandstone, shale, and conglomerate under 0.276 MPa impact pressure were 216.10 MPa, 205.80 MPa, and 230.90 MPa, respectively. When the pressure increased to 0.325 MPa, the average compressive strengths increased to 261.95 MPa, 240.2 MPa, and 266.35 MPa, respectively. The strength increase amplitudes for the three rock types were 21.2%, 16.7%, and 15.4%, respectively. It can be seen that sandstone showed the most significant strength enhancement under increased loading rate, exhibiting stronger strain-rate sensitivity.
The average dynamic elastic moduli of sandstone, shale, and conglomerate under 0.276 MPa impact pressure were 26.41 GPa, 21.51 GPa, and 24.98 GPa, respectively. When the pressure increased to 0.325 MPa, these values increased to 27.44 GPa, 25.25 GPa, and 39.63 GPa, respectively, with increases of 3.9%, 17.4%, and 58.6%. Conglomerate showed the most significant increase in modulus, reflecting its rapid stiffening under high-speed impact conditions, possibly due to the rapid locking of its gravel skeleton and suppression of matrix deformation at higher strain rates.
3.3. Fractal Characteristics of Impact Fragmentation
The evolution of microcracks within rock specimens, from microscopic damage accumulation to macroscopic fracture coalescence, exhibits significant fractal characteristics. The fragmentation fractal dimension can serve as a quantitative indicator to effectively characterize the degree of fragmentation and energy dissipation level. Figure 7 shows the fragmentation morphology of the three types of rock specimens after impact testing. After the experiment, all fragments from each specimen were collected, and the mass distribution of fragments in each size range was statistically analyzed using the sieving method, as shown in Table 2.
According to fragment fractal fragmentation theory, the cumulative mass distribution satisfies the following fractal relationship:
where b represents the slope of the linear function of lg(MR/Mr) - lnR, MR is the mass of fragments corresponding to characteristic size R, and Mr is the total mass of rock fragments.
Linear fitting was performed on the lg(MR/Mr) - lnR bilogarithmic data for different rock specimens in Table 3, with results shown in Figure 8 and Table 4. The fragment size distribution of rocks under impact loading exhibits significant fractal characteristics. The size-mass distribution of all specimens shows good linearity in the bilogarithmic coordinate system, with fitting correlation coefficients R² all above 0.92, indicating that the fragmentation process has obvious statistical self-similarity and scale invariance. This result suggests that the fragmentation behavior of rocks under dynamic impact is not random but jointly controlled by the distribution law of internal micro-defects and the energy dissipation mechanism. The high degree of fitting reflects both the statistical consistency of the rocks’ microstructures and the similarity of stress wave propagation and fragmentation patterns across different scales under impact loading. Therefore, the fractal dimension can serve as a reliable indicator for quantitatively evaluating the dynamic fragmentation degree and energy dissipation characteristics of rocks and providing a geometrical basis for establishing damage constitutive models based on microstructural evolution.
4. Establishment and Validation of Dynamic Constitutive Model for Rock Specimens
In recent years, the rate-dependent damage constitutive behavior of rock-like materials under dynamic loading has become an important topic in engineering mechanics and rock dynamics. Rocks typically contain numerous randomly distributed microcracks and micropores, and their damage process mainly manifests as the initiation, propagation, and coalescence of these defects. Due to the random distribution of micro-defects, rocks are often considered isotropic damage materials at the macroscopic level and can be described using scalar damage variables. However, when damage exhibits significant anisotropy or complex defect distribution, tensor-form damage variables must be introduced for more accurate characterization.
Although various dynamic damage constitutive models have been established, most still have obvious limitations. Some models rely on too many assumptions or oversimplifications, making it difficult to accurately reflect the true mechanical behavior of rocks under medium to high strain rates. Others have complex structures and numerous parameters, making determination difficult and practical applicability poor, leading to significant deviations between predictions and experiments under high strain-rate conditions. Therefore, more systematic and in-depth research is still needed on the constitutive relationships of rock-like materials under dynamic loading, including theoretical modeling, parameter identification, and model validation.
4.1. Basic Concepts of Damage Mechanics
4.1.1. Damage Variable
The damage variable is a core parameter in damage mechanics for quantitatively describing the evolution of internal micro-defects in materials. Its rational definition directly affects the accuracy and applicability of the constitutive model. The damage variable definition method based on the strain equivalence hypothesis proposed by Lemaitre [49] holds an important position in describing damage in rock-like materials. This damage variable can be expressed as:
where ε is the axial strain (tensile strain positive, compressive strain negative), εa is a material parameter, and n is a material brittleness parameter; a larger value of n indicates stronger material brittleness.
For rock materials, damage evolution strongly depends on changes in strain state. As shown in the above equation, the damage variable can be expressed as a function of strain, indicating that damage behaviors such as initiation, propagation, and coalescence of internal microcracks during loading are driven by strain development. Simultaneously, the accumulation of damage significantly alters the stiffness and strength properties of the rock, thereby affecting subsequent strain response, forming a nonlinear coupling relationship. Therefore, when constructing damage constitutive models for rocks, a damage evolution equation is usually first established under one-dimensional conditions to clarify the quantitative relationship between damage and strain. Then, through energy equivalence or geometric tensor generalization, it is extended to three-dimensional stress states to more comprehensively characterize damage anisotropy and evolution laws under complex stresses.
4.1.2. Strain Equivalence Hypothesis
One of the core issues in damage mechanics theory concerns its fundamental assumptions, which form the basis for defining damage variables and establishing damage constitutive relationships. Therefore, before constructing a damage constitutive model, the mechanical behavior of the damaged body must be reasonably simplified.
Lemaitre and Chaboche [49] proposed the classic strain equivalence hypothesis, which states that the strain of a damaged material under nominal stress is equal to the strain produced in the undamaged material under effective stress.
Under one-dimensional stress conditions, this hypothesis allows the constitutive relationship of the damaged material to be expressed as:
whererepresents the effective elastic modulus of the material in the damaged state.
According to the strain equivalence hypothesis, the strain produced by stress σ in the damaged state is equal to the strain produced by effective stress σ acting on the undamaged material’s constitutive relationship. Therefore, the constitutive relationship of the damaged material can also be expressed as:
where the effective stress
Substituting Equation (5) into Equation (4) yields:
Comparing Equation (3) and Equation (6), we obtain:
Thus, under the strain equivalence hypothesis, the effective elastic modulus of an isotropic damaged material can be expressed as (1-D) times the elastic modulus of the undamaged material.
4.2. Establishment of Dynamic Constitutive Model for Rock Specimens
4.2.1. Basic Assumptions
Assume that rock is composed of a large number of micro-elements. Each micro-element is geometrically large enough to contain a sufficient number of microscopic defects but, at the same time, small enough in mechanical characterization to be approximately regarded as a material point in a continuum. The basic structure of this micro-element model is shown in Figure 9, consisting of a damage body and a viscous body connected in parallel within any spatial cross-section [50]. The following basic assumptions are proposed:
(1) The rock is macroscopically isotropic, and its damage behavior can be described by an isotropic damage model.
(2) The viscous body itself has no damage characteristics and does not respond mechanically under static loading conditions, acting as a transparent element. However, under high loading rates, the viscous body is activated and exhibits viscous behavior. Its constitutive relationship is described by the following expression:
where σb is the stress of the viscous body, and η is the viscosity coefficient, reflecting the viscous characteristics of the rock. Generally, the viscosity coefficient η for rocks ranges from 0.1 to 0.5.
(3) The micro-element is in the linear elastic stage before failure, and its mechanical behavior follows Hooke’s law. Once failure occurs, it completely loses its load-bearing capacity.
(4) The strength of the damage body in each micro-element follows a Weibull distribution, and its probability density function can be expressed as:
where F represents the distribution variable of micro-element strength, and m and F0 are Weibull distribution parameters reflecting the mechanical properties of rock-like materials.
4.2.2. Statistical Damage Variable
Based on the assumption that micro-element strength follows a statistical distribution, as the external load continues to increase, the micro-elements will fail successively according to their strength thresholds [51]. To describe this progressive damage process, a statistical damage variable can be used. If the macroscopic failure of the rock material is regarded as the result of cumulative failure of micro-elements, and the number of failed micro-elements at a certain load level is Nf and the total number of micro-elements is N, the statistical damage variable D can be defined as:
When the load level is within the interval [F,F+dF], the number of failed micro-elements can be expressed as N·p(y)dy. When the external load increases to a specific level F, the total number of failed micro-elements is:
Substituting Equations (9) and (11) into Equation (10) yields the damage variable D:
4.2.3. Micro-Element Strength
From the above definition of the damage variable, its evolution process is closely related to the strength distribution of rock micro-elements, and the strength of micro-elements is significantly influenced by the stress state. To reflect the changes in rock strength characteristics under complex stress conditions, an appropriate failure criterion must be introduced. It is assumed that the failure criterion for rock micro-elements is [52]:
where k0 is a constant related to the material’s internal friction angle and cohesion.
Considering that this failure criterion has a concise form and can well describe the strength characteristics of rock materials, the strength of rock micro-elements can be expressed as:
Where , φ is the internal friction angle of the rock, I1 is the first invariant of the effective stress tensor, and J2 is the second invariant of the deviatoric effective stress tensor. Then:
where σ1、σ2、σ3are the effective principal stresses. The corresponding nominal stresses σ1、σ2、σ3 can be determined by pseudo-triaxial tests on rocks. From Hooke’s law:
Combining the above equations yields:
Substituting Equations (20) and (21) into Equation (14) gives the expression for rock micro-element strength. Under one-dimensional stress conditions, σ2=σ3=0,ε1=ε, and the rock micro-element strength can be expressed as:
4.2.4. Establishment of Constitutive Model
As shown in Figure 9, assuming an impact load is applied horizontally to the micro-element model. According to the mechanical characteristics of the parallel connection, the strains of the damage body and the viscous body are equal, and the total strain is consistent with the strain of each component. Simultaneously, the total stress of the combination is the sum of the stresses borne by the damage body and the viscous body [53], i.e.:
From the strain equivalence hypothesis, the constitutive relationship of the damage body is:
Substituting Equation (24) into Equation (23) yields the constitutive relationship of the combination:
4.2.5. Calculation of Model Parameters
According to the constitutive relationship of the model, the core of establishing the constitutive model lies in determining the key parameters F₀ and m. Although determining these parameters by linearizing the constitutive equation and then fitting the test curve is mathematically simple, it leads to unclear physical meanings of the parameters themselves, and significant deviations often exist between the final fitted curve and the experimentally measured curve [54].
In impact tests, the peak stress σmax and its corresponding strain εm on the stress–strain curve can usually be measured. Based on these two key experimental data points, relationships between the model parameters and these data points can be established, thereby enabling the determination of the model parameters.
According to the theory of extreme values for multivariate functions, at the peak point (σmax, εm) of the stress–strain curve, the following condition should be satisfied:
Differentiating both sides of Equation (25) yields:
From Equations (26) and (27), we obtain:
Substituting Equation (28) into Equation (25) gives:
Thus, for uniaxial impact tests, using the peak point (σmax, εm)on the stress–strain curve, the experimental strain rate , and known rock material constants E,η,φ, the analytical expressions for the corresponding damage model parameters m and F₀ under that test condition can be uniquely determined.
4.3. Validation of Dynamic Constitutive Model for Rock Specimens
Using the above dynamic statistical damage constitutive model, fitting analysis was performed on the experimental data of this study, and the corresponding model parameters for each rock specimen were determined. The fitting results are shown in Table 5.
The elastic modulus E was determined from the slope of the initial linear segment of the dynamic loading curve or static test values. The internal friction angle φ was referenced to empirical values from static triaxial tests (shale ~30°, sandstone 35°, conglomerate 40°). The viscosity coefficient η was estimated based on the hysteresis response characteristics between the elastic segment and the loading segment of the dynamic test curve (shale: 0.15, sandstone: 0.20, conglomerate: 0.25).
From Table 5, it can be seen that for the same rock type under different strain-rate conditions, the distribution parameters m and F₀ exhibit certain differences. In the overall trend, as the strain rate increases, the parameter m gradually decreases, while F₀ increases correspondingly. This phenomenon indicates that under high strain-rate conditions, the strength distribution of rock micro-elements tends to become more dispersed, with increased variability, but the overall strength level improves. This is consistent with the actual response characteristics of such rocks under impact loading, where damage development is more severe and ultimate bearing capacity is enhanced.
Taking SY-1, SY-3, YY-1, YY-3, LY-1, and LY-3 as examples, Figure 10 shows typical comparisons between theoretical curves calculated by the above constitutive model and experimental curves for shale, sandstone, and conglomerate specimens. As shown in Figure 10, the model curves essentially coincide with the experimental curves in the elastic stage. The predictions of peak strength and corresponding strain are also relatively accurate, and the post-peak stress decline trend matches the experimental data well. Notably, the model effectively captures the changes in peak values and stiffness differences of the curves at different strain rates.
This indicates that the dynamic statistical damage constitutive model established in this study can effectively simulate the complete mechanical response of rocks under impact loading. Physically, the model captures the strain-rate strengthening effect through the introduction of the viscous element and describes the material stiffness degradation and nonlinear deformation process through statistical damage, thus simultaneously characterizing the “strength enhancement effect” and “damage evolution effect” of rocks. Compared to purely empirical constitutive relationships, the model parameters in this study are clearly defined, have physical meaning, and the parameter calibration method is simple and reliable.
In summary, by combining damage mechanics and viscoelastic mechanics, a dynamic damage constitutive model for rocks considering the rate effect was established. The model parameters were identified and validated using experimental results. The good agreement between model calculations and measured values demonstrates the rationality and effectiveness of the model.
5. Conclusions
This study systematically investigated the dynamic mechanical response characteristics and constitutive model of rocks under impact loading, drawing the following main conclusions:
(1) Sandstone, shale, and conglomerate all exhibit significant strain-rate effects under impact loading. Dynamic compressive strength and stiffness increase with loading rate. Obvious differences exist among the three lithologies in peak occurrence timing and failure characteristics. Post-impact fragments show good fractal characteristics, and the fractal dimension can quantify the degree of fragmentation and energy dissipation.
(2) The dynamic constitutive model established based on statistical damage theory and viscoelastic elements can effectively fit the stress–strain curves of the three rock types, accurately reflecting the laws of strength enhancement and stiffness degradation. The variation trends of the model parameters are consistent with experimental observations, validating the rationality and applicability of the model.
References
- Ji, J. J.; Li, H. T.; Wu, F. M.; et al. Fractal characteristics of rock fragmentation under impact loading[J]. J. Vib. Shock 2020, 39(13), 176–183+214. [Google Scholar]
- Fang, Z. F.; Zou, F.; Tang, X. Energy dissipation and damage evolution law of limestone under impact loading[J]. Chin. J. Undergr. Space Eng. 2020, 16(02), 475–483. [Google Scholar]
- Wu, W. R.; Yao, Y.; Liu, Z. Damage model and experimental study of central-hole rock under high-frequency impact[J]. J. Cent. South Univ. (Science and Technology) 2019, 50(08), 1876–1882. [Google Scholar]
- Chen, J. Y.; Pei, X. J.; Du, R. F.; et al. Dynamic characteristics and energy consumption law of sandstone under impact loading[J]. Sci. Technol. Eng. 2019, 19(31), 304–310. [Google Scholar]
- Yuan, P.; Ma, Q. Y. End-face disconnection correction of rock specimens in SHPB test[J]. Explos. Shock Waves 2017, 37(05), 929–936. [Google Scholar]
- Yang, R. S.; Li, W. Y.; Li, Y. L.; et al. Experiments and comparative analysis of dynamic tensile mechanical properties of three rocks[J]. J. China Coal Soc. 2020, 45(09), 3107–311. [Google Scholar]
- Zhang, J. F.; Zhou, F. W.; Zhou, H. W. Dynamic characteristics and constitutive model of coal rock under impact loading[J]. Saf. Coal Mines 2021, 52(03), 84–89. [Google Scholar]
- Ou, X. F.; Zhang, X. M.; Zhang, C.; et al. Bedding effect on compression failure and damage constitutive model of slate under impact loading[J]. Chin. J. Rock Mech. Eng. 2019, 38(S2), 3503–3511. [Google Scholar]
- Li, X. B.; Lai, H. H.; Zhu, C. Z. Horizontal impact test method for studying impact fragmentation and dynamic characteristics of ores and rocks[J]. J. Cent. South Inst. Min. Metall. 1988, (05), 492–499. [Google Scholar]
- Zhu, J. J.; Li, X. B.; Gong, F. Q.; et al. Dynamic characteristics and damage model of rock under uniaxial cyclic impact[J]. Chin. J. Geotech. Eng. 2013, 35(03), 531–539. [Google Scholar]
- Li, X. F. Fracture and fragmentation mechanism of rock materials under strong impact loading[J]. Chin. J. Rock Mech. Eng. 2021, 40(02), 432. [Google Scholar]
- Ping, Q.; Wu, M. J.; Yuan, P.; et al. Experimental study on dynamic mechanical properties of high-temperature sandstone under impact loading[J]. Chin. J. Rock Mech. Eng. 2019, 38(04), 782–792. [Google Scholar]
- Yang, G. L.; Bi, J. J.; Zhang, Z. F.; et al. Effect of bedding angle on dynamic strength and energy consumption of shale under passive confining pressure[J]. J. Min. Sci. Technol. 2021, 6(02), 188–195. [Google Scholar]
- Zhang, L. D.; Wang, T. T.; Zhao, W. C.; et al. Study on pore-fissure structure characteristics of shale based on multifractal theory[J]. Zhongzhou Coal 2016, (08), 122–126. [Google Scholar]
- Gao, F.; Xie, H. P. Statistical strength theory of brittle materials based on fractal[J]. Chin. J. Solid Mech. 1996, (03), 239–245. [Google Scholar]
- Zhang, Y.; Lu, Y.; Yao, Y. Research on fashion commodity price prediction based on fractal theory[J]. J. Shenyang Univ. Technol. (Social Science Edition) 2008, (02), 148–150+175. [Google Scholar]
- Suo, Y. C. Study on mechanical properties and damage mechanism of coal-rock mass under dynamic load[D]; China University of Mining and Technology, 2023. [Google Scholar]
- Li, X. B.; Zhou, Z. L.; Wang, W. H. Constructing ideal indenter for SHPB device using finite element method and neural network[J]. Chin. J. Rock Mech. Eng. 2005, (23), 4215–4218. [Google Scholar]
- Wang, Y. B.; Wang, Z. Y.; Fu, D. R.; et al. Visualization and quantitative characterization method of post-blast rock fracture structure[J]. J. China Coal Soc. 2024, 49(03), 1388–1402. [Google Scholar]
- Wang, Y.; Fu, J. X.; Wang, J. Uniaxial loading rate effect on mechanical properties and fracture meso-mechanism of single-fracture rock[J]. Min. Res. Dev. 2020, 40(08), 66–74. [Google Scholar]
- Ping, Q.; Su, H. P.; Ma, D. D.; et al. Experimental study on physical and dynamic properties of limestone after different high-temperature treatments[J]. Rock Soil Mech. 2021, 42(04), 932–942+953. [Google Scholar]
- Liu, X. Y.; Zhang, X. W.; Yue, H. Z.; et al. SHPB experimental study on dynamic impact performance of granite residual soil[J]. Rock Soil Mech. 2020, 41(06), 2001–2008+2020. [Google Scholar]
- Cochard, A.; Rice, J. R. Fault rupture between dissimilar materials: Ill-posedness, regularization, and slip-pulse response[J]. J. Geophys. Res. Solid Earth 2000, 105(B11), 25891–25907. [Google Scholar] [CrossRef]
- Wang, L. L.; Dong, X. L.; Sun, Z. J. Dynamic constitutive behavior of materials considering damage evolution at high strain rates[J]. Explos. Shock Waves 2006, (03), 193–198. [Google Scholar]
- Zhu, Z. X.; Hu, S. S.; Lu, J.; et al. Study on elastic-viscoplastic stress-strain relationship of steel-lead laminate under impact loading[J]. Explos. Shock Waves 1989, (01), 1–10. [Google Scholar]
- Wang, L. L.; Ren, H. Q.; Yu, J. L.; et al. Development and application of nonlinear stress wave propagation theory[J]. Chin. J. Solid Mech. 2013, 34(03), 217–240. [Google Scholar]
- Shan, R. L.; Xue, Y. S.; Zhang, Q. Time-dependent damage constitutive model of rock dynamic failure[J]. Chin. J. Rock Mech. Eng. 2003, (11), 1771–1776. [Google Scholar]
- Xie, L. X.; Zhao, G. M.; Meng, X. R. Study on overstress constitutive model of rock under impact loading[J]. Chin. J. Rock Mech. Eng. 2013, 32(S1), 2772–2781. [Google Scholar]
- Zhang, H.; Ping, Q.; Su, H. P. SHPB experimental study on dynamic compression of limestone with different length-diameter ratios[J]. Coal Sci. Technol. 2018, 46(08), 38–43. [Google Scholar]
- Liu, J. Z.; Xu, J. Y.; Lv, X. C.; et al. Experimental study on dynamic mechanical properties of amphibolite under impact compression loading[J]. Chin. J. Rock Mech. Eng. 2009, 28(10), 2113–2120. [Google Scholar]
- Xu, Z. S.; Bian, Z.; Liu, Y.; et al. Influence of combined cracks and their dip angles on rock mechanical properties and failure characteristics[J]. Min. Res. Dev. 2022, 42(11), 140–145. [Google Scholar]
- Li, D. Y.; Wan, Q. R.; Zhu, Q. Q.; et al. Experimental study on mechanical properties and failure laws of rock with pre-existing cracks under different loading methods[J]. J. Min. Saf. Eng. 2021, 38(05), 1025–1035. [Google Scholar]
- Zhao, G. Y.; Li, Z. Y.; Wu, H.; et al. Study on dynamic failure characteristics of sandstone containing non-penetrating cracks[J]. Rock Soil Mech. 2019, 40(S1), 73–81. [Google Scholar]
- Li, C. J.; Xu, Y.; Zhang, Y. T.; et al. Energy evolution and fractal characteristics of cracked coal-rock combination under impact loading[J]. Chin. J. Rock Mech. Eng. 2019, 38(11), 2231–2241. [Google Scholar]
- Liu, H. Y.; Deng, Z. D.; Wang, X. S.; et al. SHPB similar material experimental study on dynamic failure of jointed rock mass[J]. Rock Soil Mech. 2014, 35(03), 659–665. [Google Scholar]
- Li, D. Y.; Hu, C. W.; Zhu, Q. Q. Experimental study on mechanical properties and failure laws of pre-cracked granite under coupled static and dynamic loads[J]. Chin. J. Rock Mech. Eng. 2020, 39(06), 1081–1093. [Google Scholar]
- Li, M.; Qiao, L.; Li, Q. W. Energy dissipation analysis of SHPB splitting test on rock with pre-existing single joint under high strain rate[J]. Chin. J. Geotech. Eng. 2017, 39(07), 1336–1343. [Google Scholar]
- Zhang, Y. F.; Li, J. C.; Yan, Y. T.; et al. Study on dynamic damage characteristics of rough joint surface based on SHPB test[J]. Rock Soil Mech. 2021, 42(02), 491–500. [Google Scholar]
- Bai, J.; Yuan, C. Simulation experimental study on influence of crack geometric characteristics on rock mass mechanical properties[J]. Saf. Coal Mines 2023, 54(07), 188–195. [Google Scholar]
- Jiang, H. P.; Jiang, A. N.; Yang, X. R. Statistical damage constitutive model of high-temperature rock based on Weibull distribution and its verification[J]. Rock Soil Mech. 2021, 42(07), 1894–1902. [Google Scholar]
- Du, W. H.; Zhang, D. M.; Yu, B. C. Mechanical and fractal characteristics of sandstone with preexisting fissures of different lengths under varying impact loads in SHPB tests[J]. Theor. Appl. Fract. Mech. 2023, 125. [Google Scholar] [CrossRef]
- Qiu, J. D.; Li, D. Y.; Li, X. B.; et al. Dynamic Fracturing Behavior of Layered Rock with Different Inclination Angles in SHPB Tests[J]. Shock Vib. 2017. [Google Scholar] [CrossRef]
- Tang, J.; Yang, S.; Elsworth, D.; et al. Three-Dimensional Numerical Modeling of Grain-Scale Mechanical Behavior of Sandstone Containing an Inclined Rough Joint[J]. Rock Mech. Rock Eng. 2020, 54(2). [Google Scholar] [CrossRef]
- Xia, K.; Zhou, Y.; Yao, W.; et al. ISRM Suggested Methods for Determining the Rate-Dependent Shear Strength and Mode II Fracture Toughness of Rock Materials Using the Split Hopkinson Pressure Bar (SHPB)[J]. Rock Mech. Rock Eng. (prepublish). 2025, 1–17. [Google Scholar] [CrossRef]
- Yi, L.; Feng, D.; Lu, D.; et al. Experimental Investigation on the Fatigue Mechanical Properties of Intermittently Jointed Rock Models Under Cyclic Uniaxial Compression with Different Loading Parameters[J]. Rock Mech. Rock Eng. 2018, 51(1), 47–68. [Google Scholar] [CrossRef]
- Xu, Y.; Dai, F.; Xu, N. W.; et al. Numerical investigation of dynamic rock fracture toughness determination using a semi-circular bend specimen in split Hopkinson pressure bar testing[J]. Rock Mech. Rock Eng. 2016, 49(3), 731–745. [Google Scholar] [CrossRef]
- Li, D. Y.; Ma, J. Y.; Zhu, Q. Q.; et al. Research of Dynamic Tensile Properties of Five Rocks under Three Loading Modes Based on SHPB Device[J]. Materials 2022, 15(23), 8473–8473. [Google Scholar] [CrossRef] [PubMed]
- Liao, Z. Y.; Zhu, J. B.; Xia, K. W.; et al. Determination of dynamic compressive and tensile behavior of rocks from numerical tests of split Hopkinson pressure and tension bars[J]. Rock Mech. Rock Eng. 2016, 49(10), 3917–3934. [Google Scholar] [CrossRef]
- Xie, H. P.; Peng, R. D.; Ju, Y. Energy dissipation analysis of rock deformation and failure process[J]. Chin. J. Rock Mech. Eng. 2004, (21), 3565–3570. [Google Scholar]
- Chen, Y. F.; Zhang, H. D.; Zhao, G. C. Experimental study on deformation, failure and crack propagation of end-jointed rock bridge under different loading rates[J]. J. Yangtze River Sci. Res. Inst. 2021, 38(07), 66–72. [Google Scholar]
- Bai, J.; Yuan, C. Simulation experimental study on influence of crack geometric characteristics on rock mass mechanical properties[J]. Saf. Coal Mines 2023, 54(07), 188–195. [Google Scholar]
- Hong, L. Size effect study on rock strength and fragmentation energy consumption characteristics under impact loading[D]; Central South University, 2008. [Google Scholar]
- Zhu, C. Q.; Yin, Z. Q.; Li, C. M. Initiation and propagation laws of open cracks under compression[J]. J. Liaoning Tech. Univ. (Natural Science Edition) 2016, 35(10), 1105–1110. [Google Scholar]
- Ma, Q. Y.; Su, Q. Q.; Ma, D. D.; et al. Experimental study on SHPB dynamic mechanical failure characteristics of deep roadway sandstone with different joint inclination angles[J]. Chin. J. Rock Mech. Eng. 2020, 39(06), 1104–1116. [Google Scholar]
Figure 1.
Photographs of the three types of rock specimens.
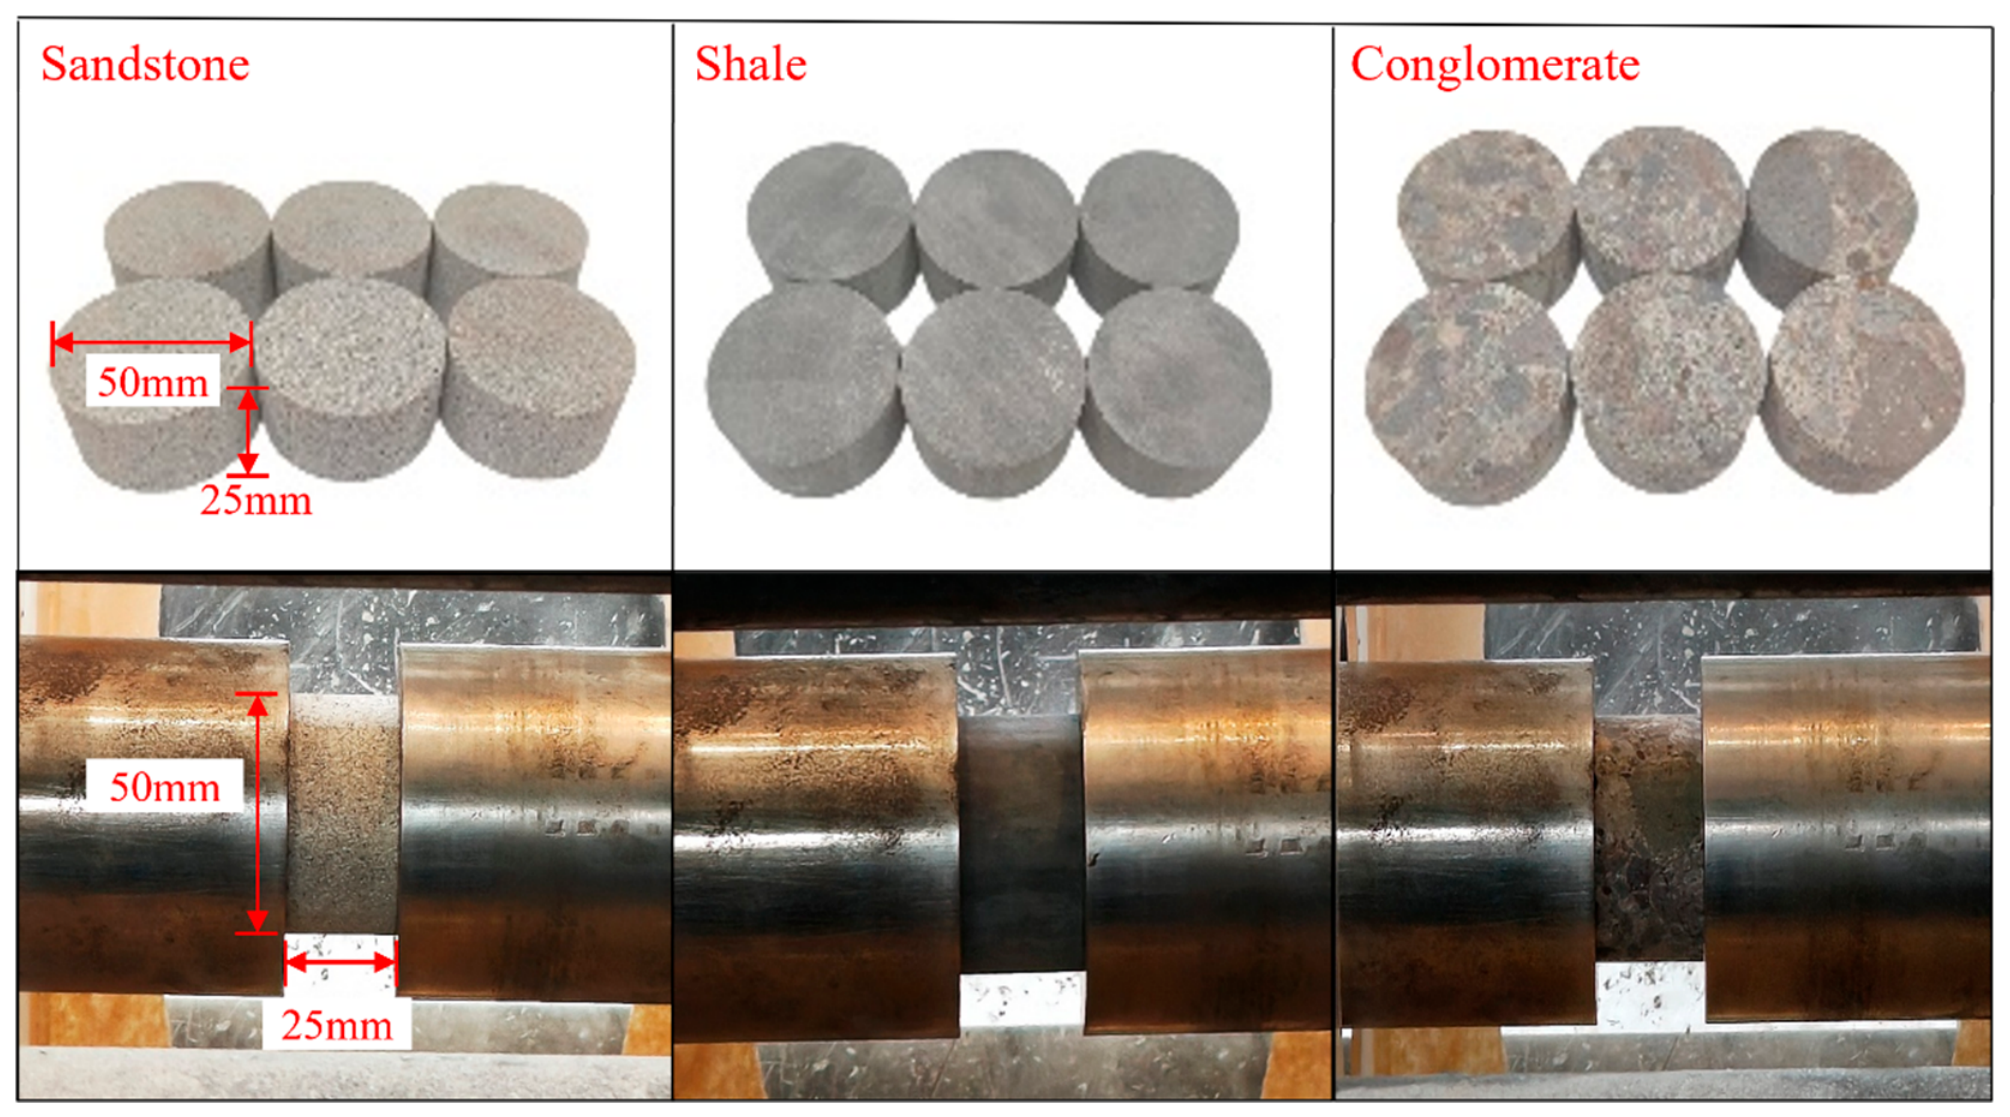
Figure 2.
SHPB experimental setup and schematic diagram.
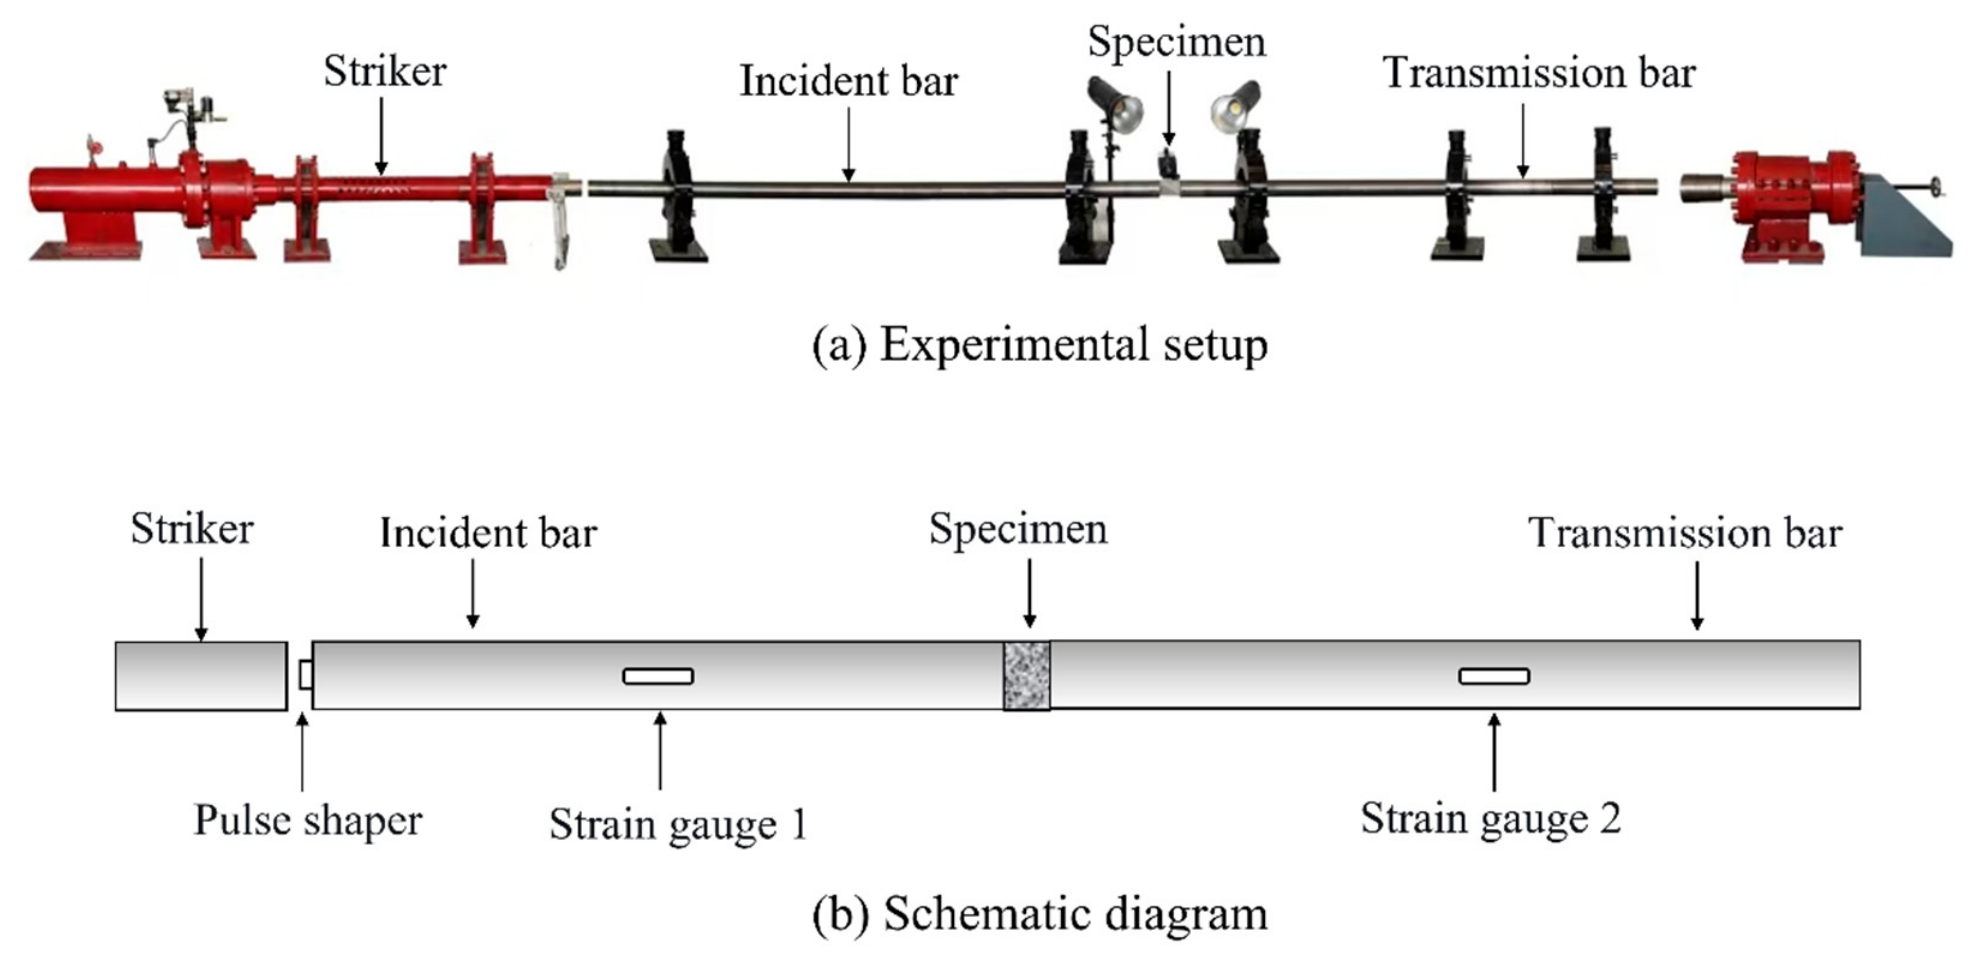
Figure 3.
Typical voltage diagram and stress waveforms of three elastic waves in SHPB impact compression test.
Figure 3.
Typical voltage diagram and stress waveforms of three elastic waves in SHPB impact compression test.
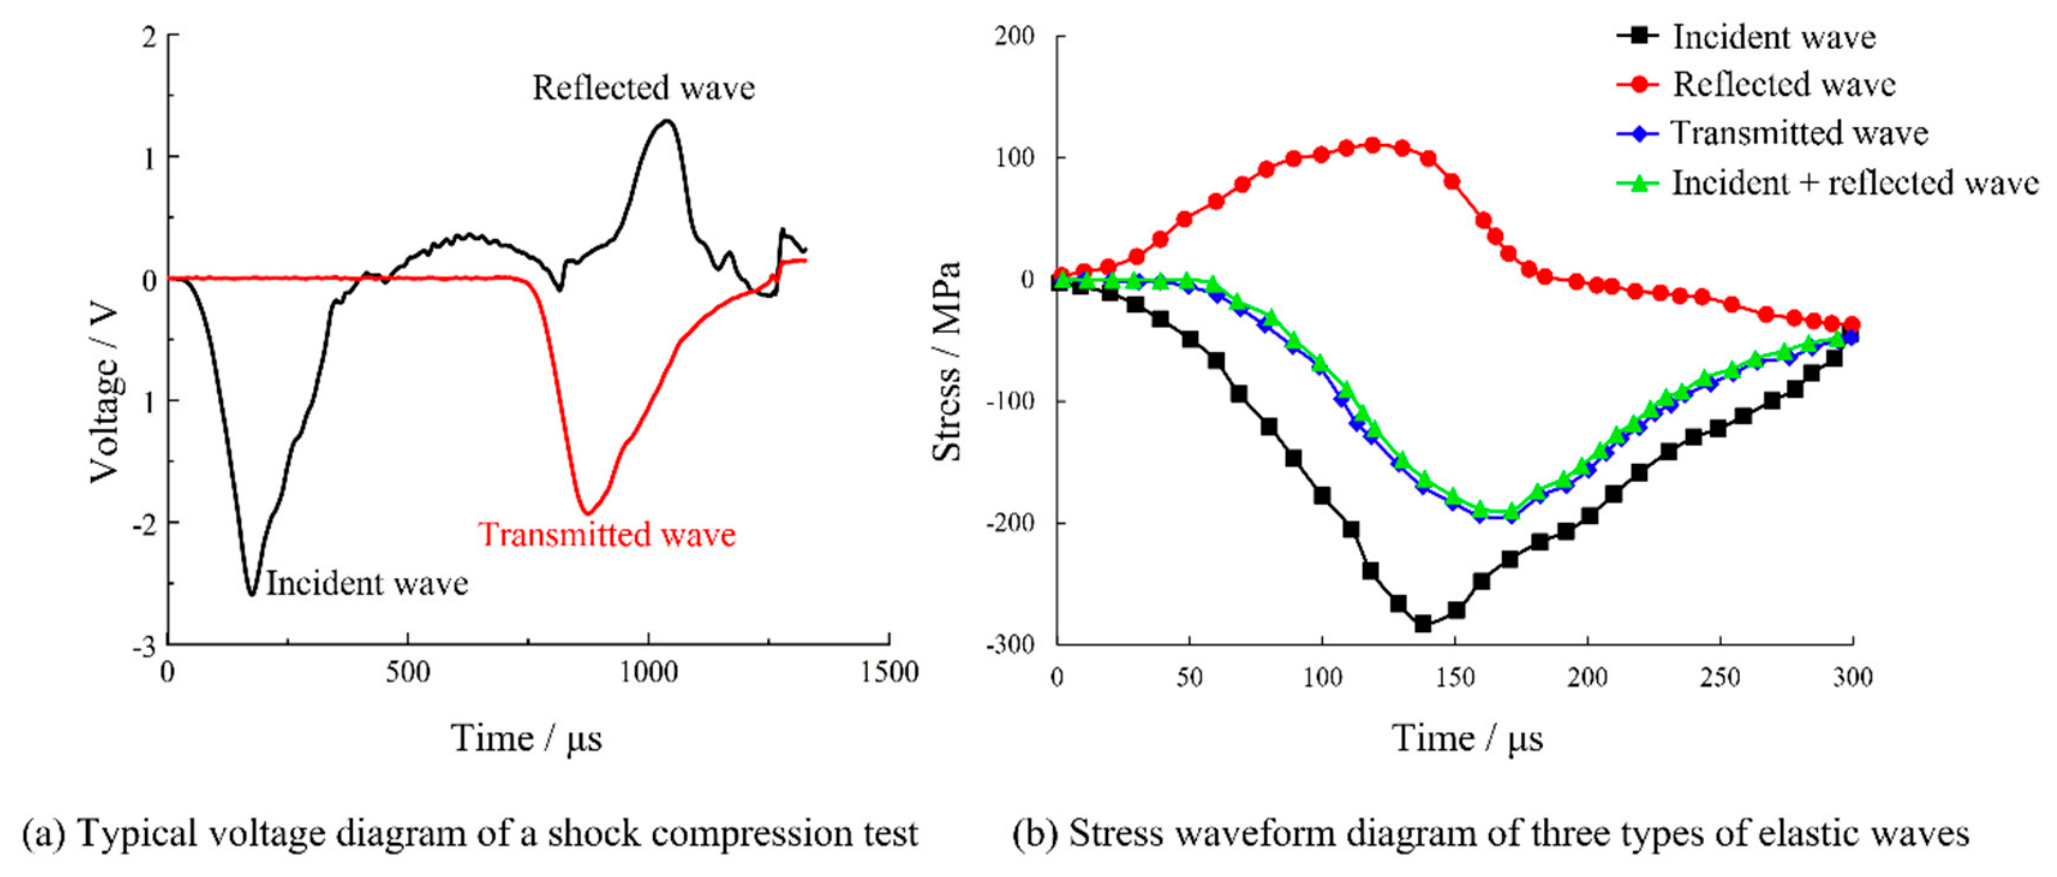
Figure 4.
Dynamic compressive stress–strain curves of the three types of rock specimens.
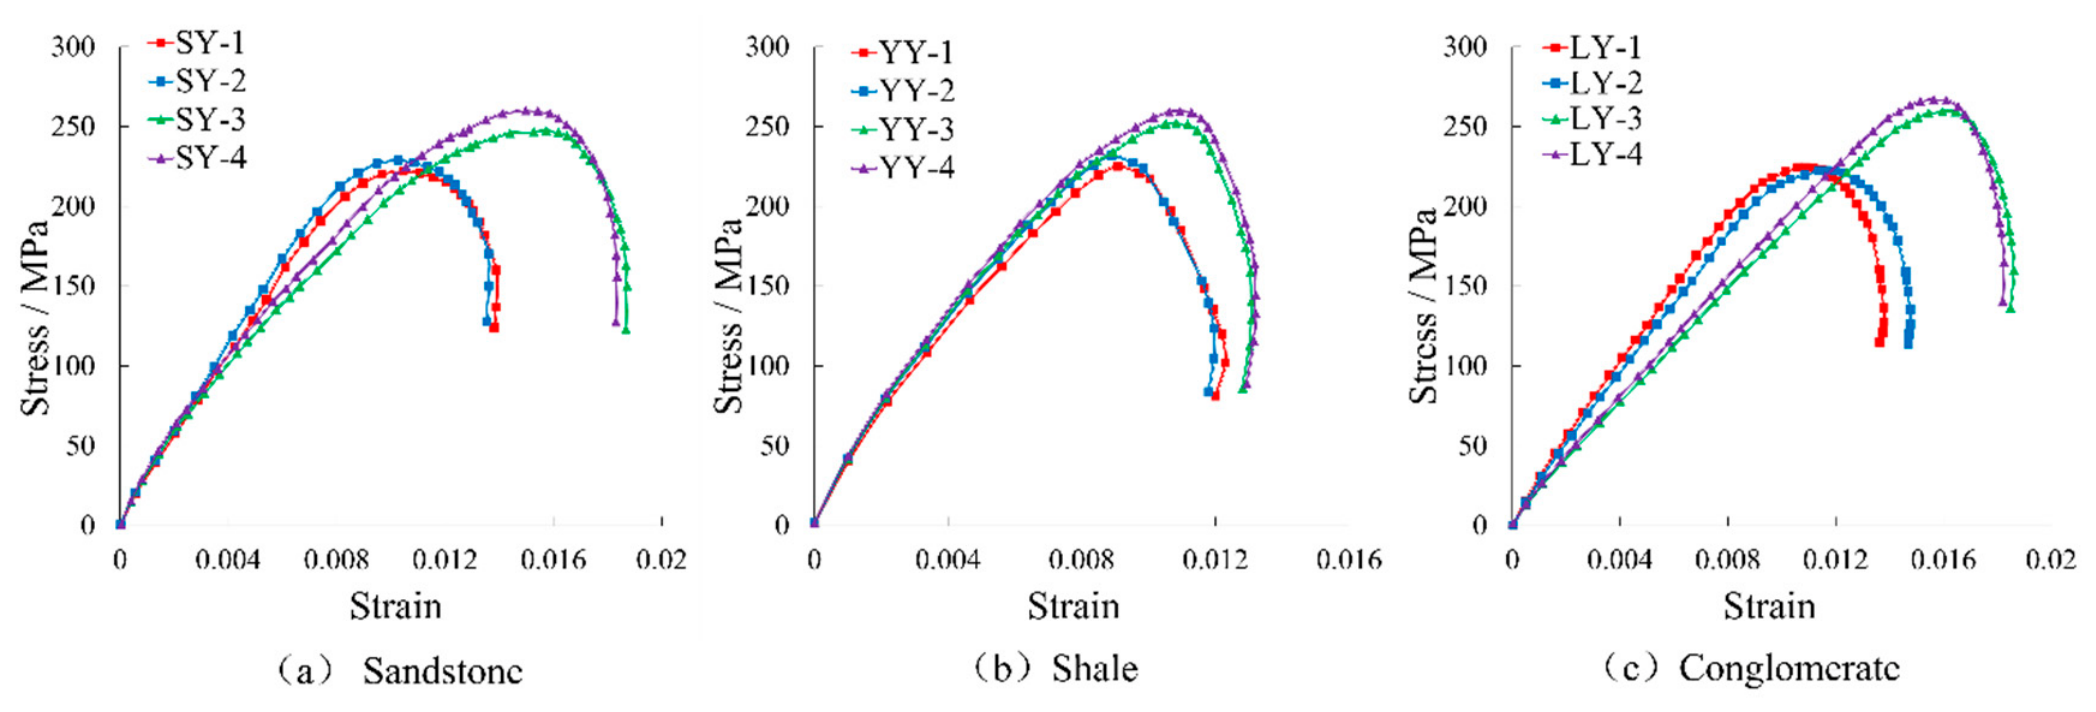
Figure 5.
Dynamic compressive stress–time curves of the three types of rock specimens.
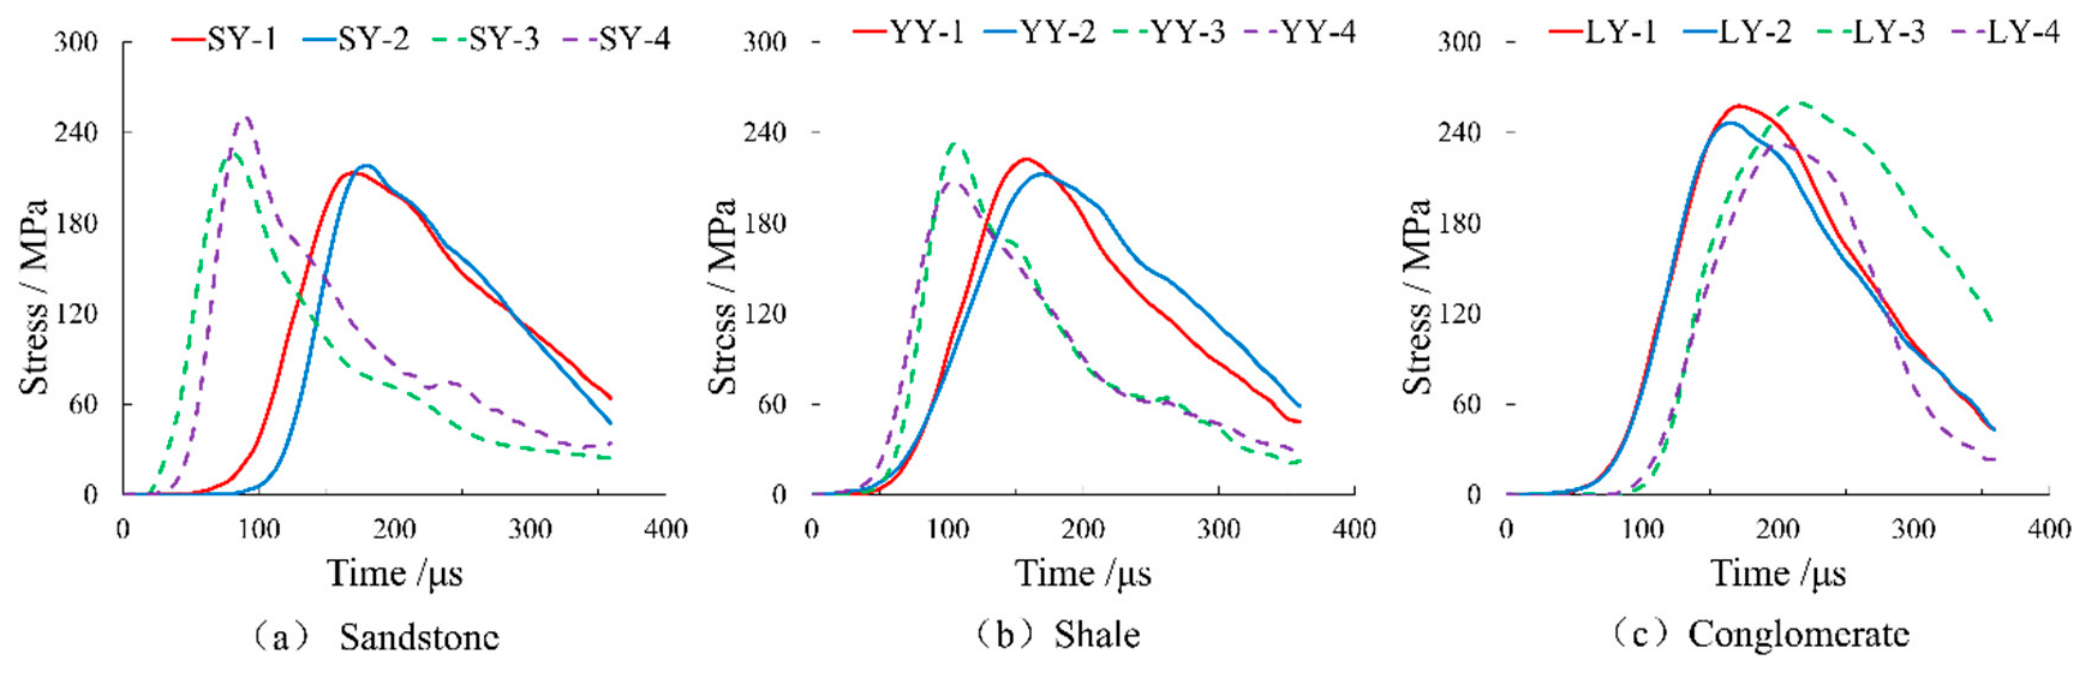
Figure 6.
Dynamic compressive strain–time curves of the three types of rock specimens.
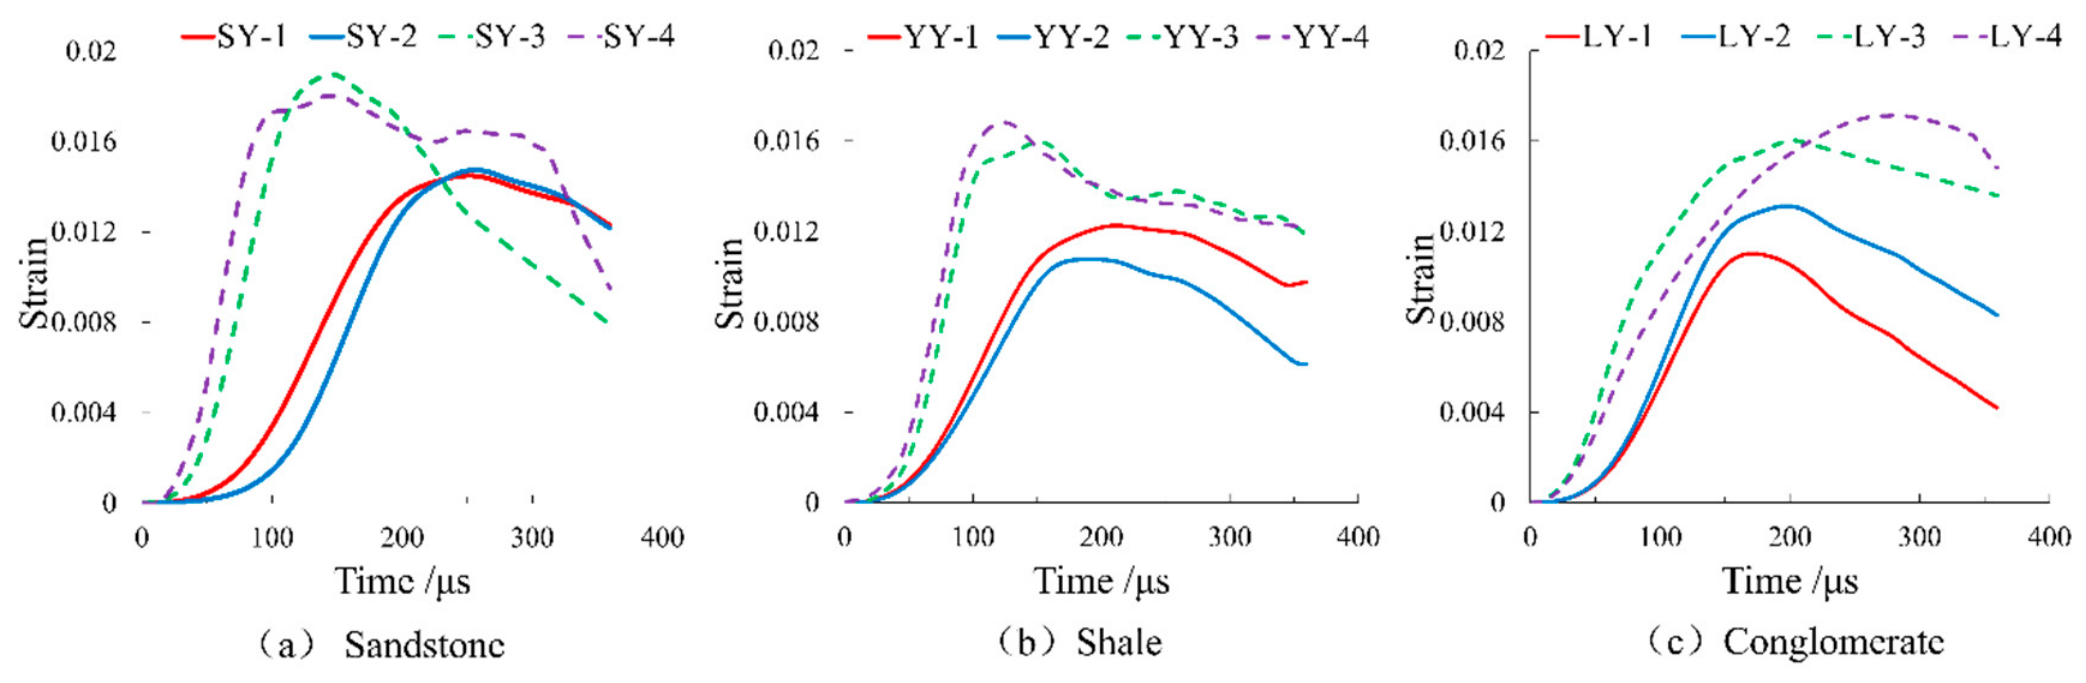
Figure 7.
Fragmentation morphologies of the three types of rock specimens.
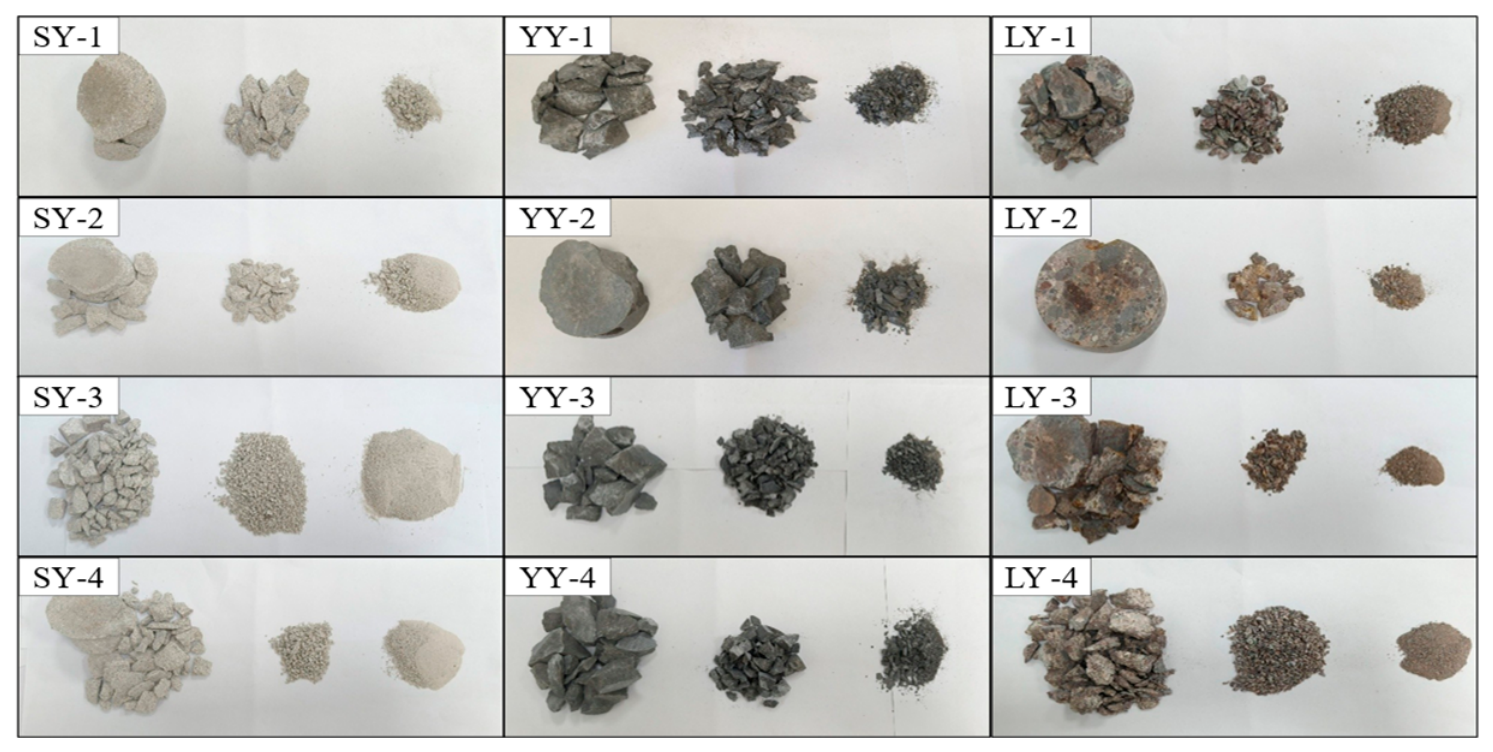
Figure 8.
Linear fitting plots of lg(MR/Mr) - lnR for specimens.
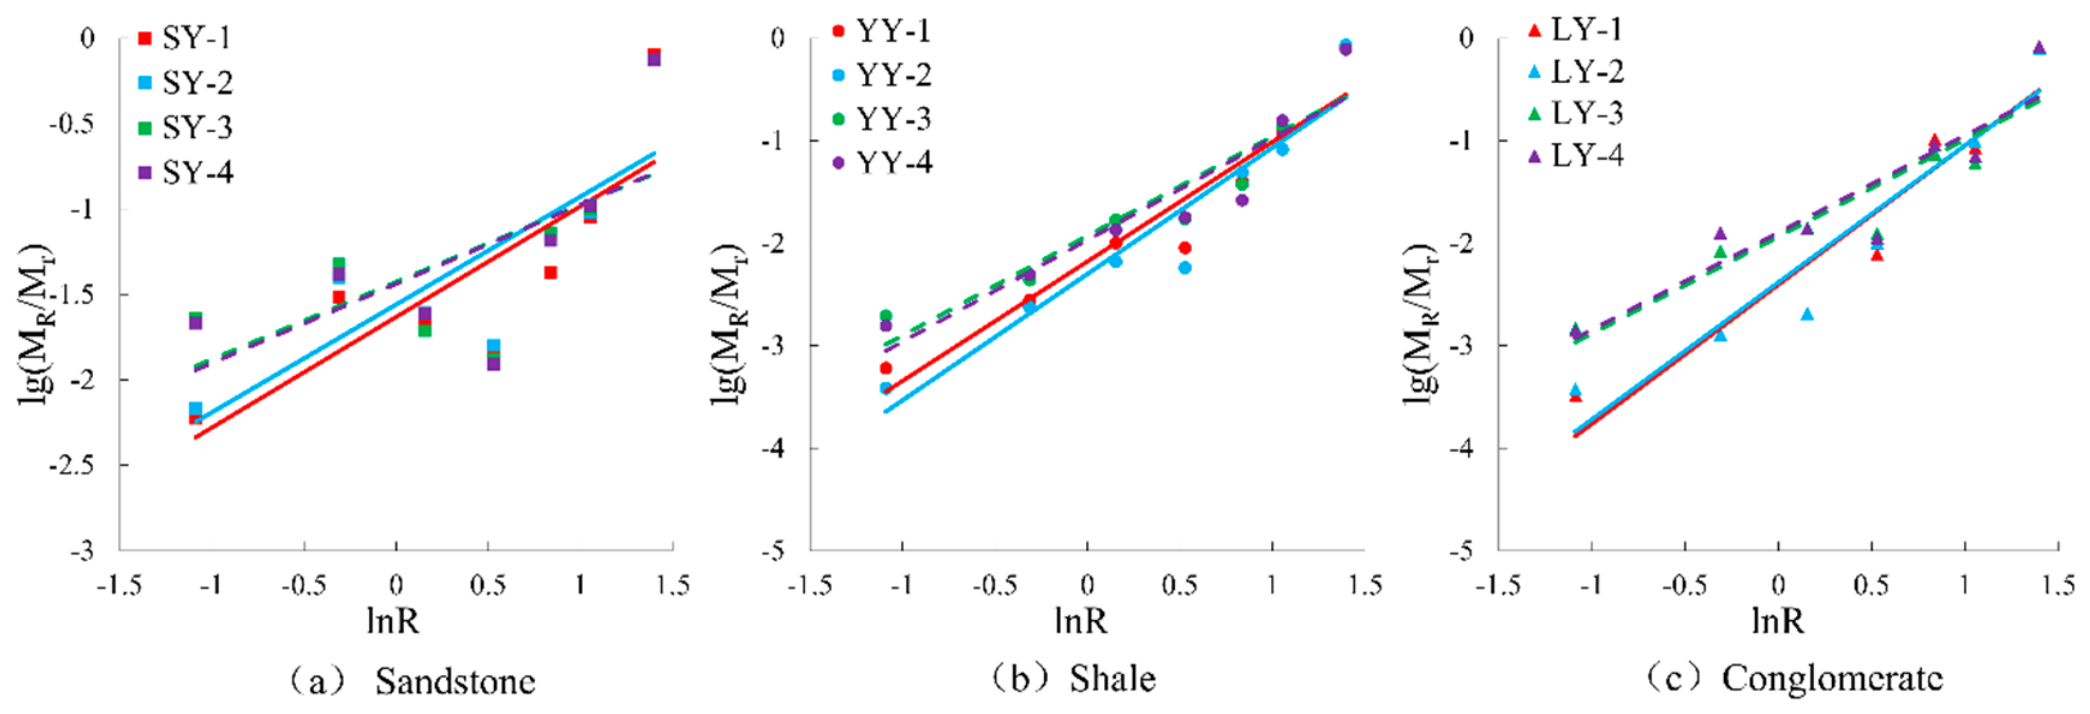
Figure 9.
Micro-element model diagram.
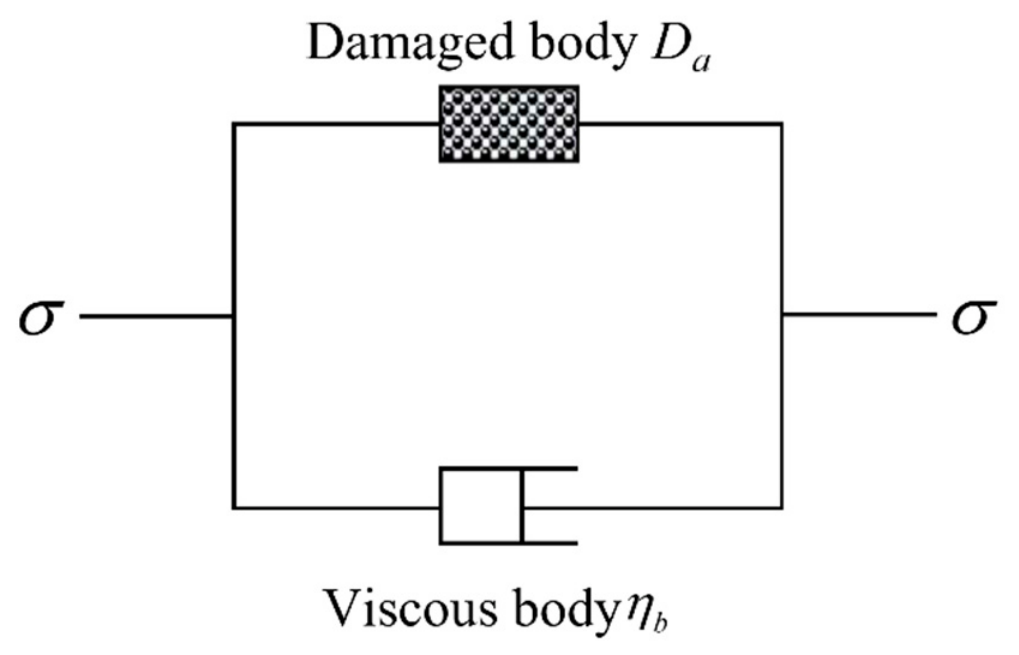
Figure 10.
Comparison of impact test curves and model-calculated theoretical curves for rock specimens.
Figure 10.
Comparison of impact test curves and model-calculated theoretical curves for rock specimens.
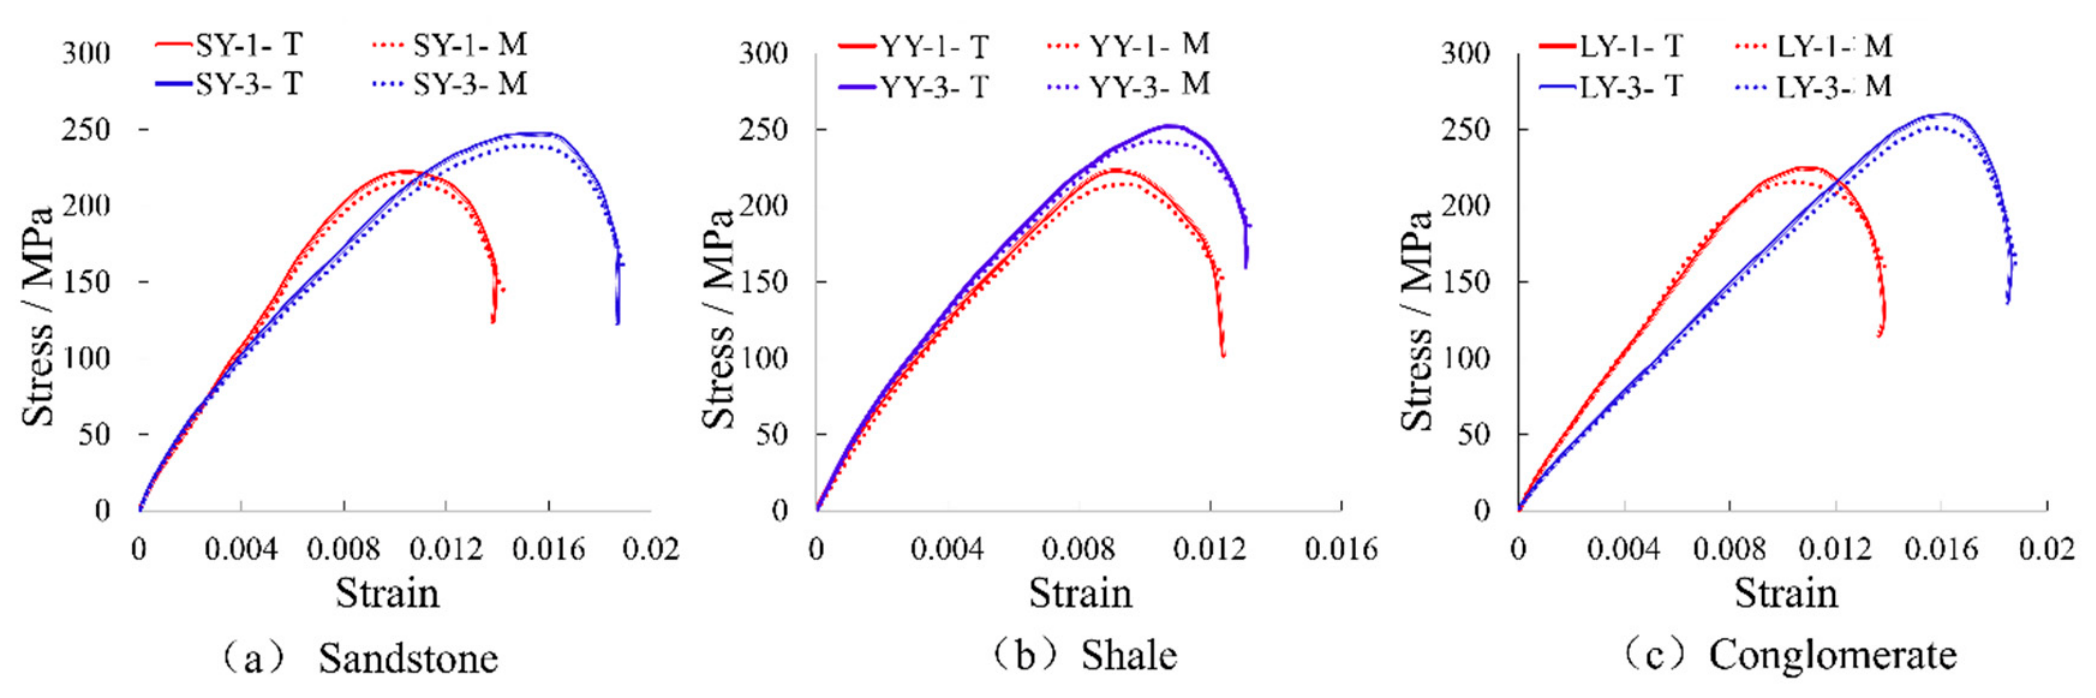

Table 1.
Dynamic compressive mechanical parameters of the three types of rock specimens.
| Specimen ID | Diameter (mm) | Thickness (mm) | Impact velocity (m/s) | Impact pressure (MPa) | Strain rate (s-1) | Dynamic compressive strength (MPa) | Dynamic elastic modulus (GPa) |
|---|---|---|---|---|---|---|---|
| SY-1 | 50.34 | 25.16 | 7.27 | 0.276 | 133.68 | 212.40 | 26.37 |
| SY-2 | 50.35 | 25.15 | 7.42 | 0.276 | 143.43 | 219.80 | 26.45 |
| SY-3 | 50.31 | 25.12 | 8.74 | 0.325 | 171.03 | 258.60 | 27.51 |
| SY-4 | 50.34 | 25.15 | 8.63 | 0.325 | 187.24 | 265.26 | 27.37 |
| YY-1 | 50.15 | 25.19 | 7.37 | 0.276 | 119.06 | 202.23 | 20.96 |
| YY-2 | 50.12 | 25.23 | 7.34 | 0.276 | 108.96 | 209.36 | 22.06 |
| YY-3 | 50.10 | 25.20 | 8.57 | 0.325 | 199.83 | 236.92 | 25.21 |
| YY-4 | 50.04 | 25.21 | 8.64 | 0.325 | 207.69 | 243.51 | 25.28 |
| LY-1 | 50.40 | 25.10 | 7.48 | 0.276 | 120.79 | 228.63 | 24.90 |
| LY-2 | 50.46 | 25.03 | 7.70 | 0.276 | 123.04 | 233.15 | 25.06 |
| LY-3 | 50.24 | 25.16 | 8.63 | 0.325 | 145.84 | 263.77 | 39.07 |
| LY-4 | 50.26 | 25.02 | 8.64 | 0.325 | 149.74 | 269.10 | 40.19 |
(Note: The table lists representative test data for each rock type under two typical impact conditions; for the same rock type under the same impact pressure, specimen IDs with more stable results are shown. SY = sandstone, YY = shale, LY = conglomerate.).
Table 2.
Mass distribution of fragments in different size ranges for the three rock types.
| Specimen ID | Sieve aperture (mm) | Total mass (g) | Average fragment size (mm) | ||||||
|---|---|---|---|---|---|---|---|---|---|
| 0.038 | 0.125 | 0.85 | 2 | 4.75 | 9.5 | 13.2 | |||
| SY-1 | 0.74 | 3.76 | 2.75 | 1.79 | 5.27 | 10.99 | 98.64 | 123.94 | 11.60 |
| SY-2 | 0.81 | 4.74 | 2.94 | 1.89 | 8.26 | 11.24 | 89.44 | 119.32 | 11.18 |
| SY-3 | 2.83 | 2.34 | 2.38 | 1.61 | 8.93 | 12.24 | 93.05 | 123.38 | 11.29 |
| SY-4 | 0.51 | 4.89 | 2.89 | 1.46 | 7.74 | 12.35 | 89.25 | 119.09 | 11.24 |
| YY-1 | 0.04 | 1.17 | 3.34 | 3.00 | 4.20 | 15.80 | 106.00 | 133.55 | 11.82 |
| YY-2 | 0.05 | 0.31 | 0.86 | 0.75 | 6.37 | 10.70 | 112.40 | 131.44 | 12.31 |
| YY-3 | 0.01 | 1.12 | 2.17 | 2.23 | 4.82 | 18.25 | 101.36 | 129.96 | 11.85 |
| YY-4 | 0.20 | 0.63 | 1.72 | 2.28 | 3.36 | 20.31 | 100.37 | 128.87 | 11.95 |
| LY-1 | 0.04 | 0.14 | 0.25 | 0.96 | 12.66 | 10.49 | 98.54 | 123.08 | 11.88 |
| LY-2 | 0.24 | 1.57 | 3.16 | 1.93 | 9.14 | 2.36 | 104.65 | 123.05 | 11.82 |
| LY-3 | 0.18 | 1.02 | 1.72 | 1.51 | 8.99 | 7.35 | 102.36 | 123.13 | 11.92 |
| LY-4 | 0.75 | 4.89 | 8.47 | 6.86 | 11.21 | 8.65 | 82.36 | 123.19 | 10.10 |
Table 3.
Logarithms of the percentage of fragment mass to total mass at different characteristic sizes for the three rock types.
Table 3.
Logarithms of the percentage of fragment mass to total mass at different characteristic sizes for the three rock types.
| Characteristic size R(mm) | 0.082 | 0.488 | 1.425 | 3.375 | 6.875 | 11.350 | 25.000 |
|---|---|---|---|---|---|---|---|
| lnR | -1.089 | -0.312 | 0.154 | 0.528 | 0.837 | 1.055 | 1.398 |
| SY-1 | -2.224 | -1.518 | -1.654 | -1.840 | -1.371 | -1.052 | -0.099 |
| SY-2 | -2.168 | -1.401 | -1.608 | -1.800 | -1.160 | -1.026 | -0.125 |
| SY-3 | -1.639 | -1.322 | -1.715 | -1.884 | -1.140 | -1.003 | -0.123 |
| SY-4 | -1.668 | -1.387 | -1.615 | -1.912 | -1.187 | -0.984 | -0.125 |
| YY-1 | -3.224 | -2.557 | -2.002 | -2.049 | -1.402 | -0.927 | -0.090 |
| YY-2 | -3.420 | -2.627 | -2.184 | -2.244 | -1.315 | -1.089 | -0.068 |
| YY-3 | -2.714 | -2.365 | -1.777 | -1.766 | -1.431 | -0.853 | -0.108 |
| YY-4 | -2.809 | -2.311 | -1.875 | -1.752 | -1.584 | -0.802 | -0.109 |
| LY-1 | -3.488 | -2.900 | -2.692 | -2.108 | -0.988 | -1.070 | -0.097 |
| LY-2 | -3.430 | -2.894 | -2.690 | -2.005 | -1.129 | -1.016 | -0.090 |
| LY-3 | -2.835 | -2.082 | -1.855 | -1.911 | -1.137 | -1.224 | -0.080 |
| LY-4 | -2.855 | -1.901 | -1.863 | -1.954 | -1.041 | -1.154 | -0.075 |
Table 4.
Fractal dimensions of the three types of rock specimens.
| Specimen ID | Slope of linear function b | Correlation coefficient R2 | Fractal dimension D |
|---|---|---|---|
| SY-1 | 0.648 | 0.969 | 2.352 |
| SY-2 | 0.631 | 0.981 | 2.369 |
| SY-3 | 0.514 | 0.936 | 2.486 |
| SY-4 | 0.595 | 0.951 | 2.405 |
| YY-1 | 1.270 | 0.925 | 1.730 |
| YY-2 | 1.232 | 0.958 | 1.768 |
| YY-3 | 0.988 | 0.934 | 2.012 |
| YY-4 | 0.991 | 0.980 | 2.009 |
| LY-1 | 1.364 | 0.946 | 1.636 |
| LY-2 | 1.294 | 0.968 | 1.707 |
| LY-3 | 0.946 | 0.961 | 2.054 |
| LY-4 | 0.826 | 0.980 | 2.174 |
Table 5.
Fitted parameter results for the constitutive models of the three rock types.
| Specimen ID | E/GPa | φ/° | η | m | F0 | |
|---|---|---|---|---|---|---|
| SY-1 | 26.37 | 35 | 0.20 | 1.64 | 357.41 | 133.68 |
| SY-2 | 26.45 | 35 | 0.20 | 1.68 | 355.10 | 143.43 |
| SY-3 | 27.51 | 35 | 0.20 | 1.38 | 387.57 | 171.03 |
| SY-4 | 27.37 | 35 | 0.20 | 1.30 | 380.59 | 187.24 |
| YY-1 | 21.96 | 30 | 0.15 | 2.71 | 304.15 | 119.06 |
| YY-2 | 22.06 | 30 | 0.15 | 2.63 | 305.47 | 108.96 |
| YY-3 | 25.21 | 30 | 0.15 | 1.47 | 384.22 | 199.83 |
| YY-4 | 25.28 | 30 | 0.15 | 1.47 | 387.32 | 207.69 |
| LY-1 | 25.40 | 40 | 0.25 | 2.39 | 370.03 | 120.79 |
| LY-2 | 24.96 | 40 | 0.25 | 2.45 | 364.00 | 123.04 |
| LY-3 | 40.70 | 40 | 0.25 | 0.88 | 467.59 | 145.84 |
| LY-4 | 39.09 | 40 | 0.25 | 0.91 | 465.13 | 149.74 |
Disclaimer/Publisher’s Note: The statements, opinions and data contained in all publications are solely those of the individual author(s) and contributor(s) and not of MDPI and/or the editor(s). MDPI and/or the editor(s) disclaim responsibility for any injury to people or property resulting from any ideas, methods, instructions or products referred to in the content. |
© 2026 by the authors. Licensee MDPI, Basel, Switzerland. This article is an open access article distributed under the terms and conditions of the Creative Commons Attribution (CC BY) license (http://creativecommons.org/licenses/by/4.0/).
Copyright: This open access article is published under a Creative Commons CC BY 4.0 license, which permit the free download, distribution, and reuse, provided that the author and preprint are cited in any reuse.