

Submitted:
06 September 2026
Posted:
08 September 2026
You are already at the latest version
Abstract
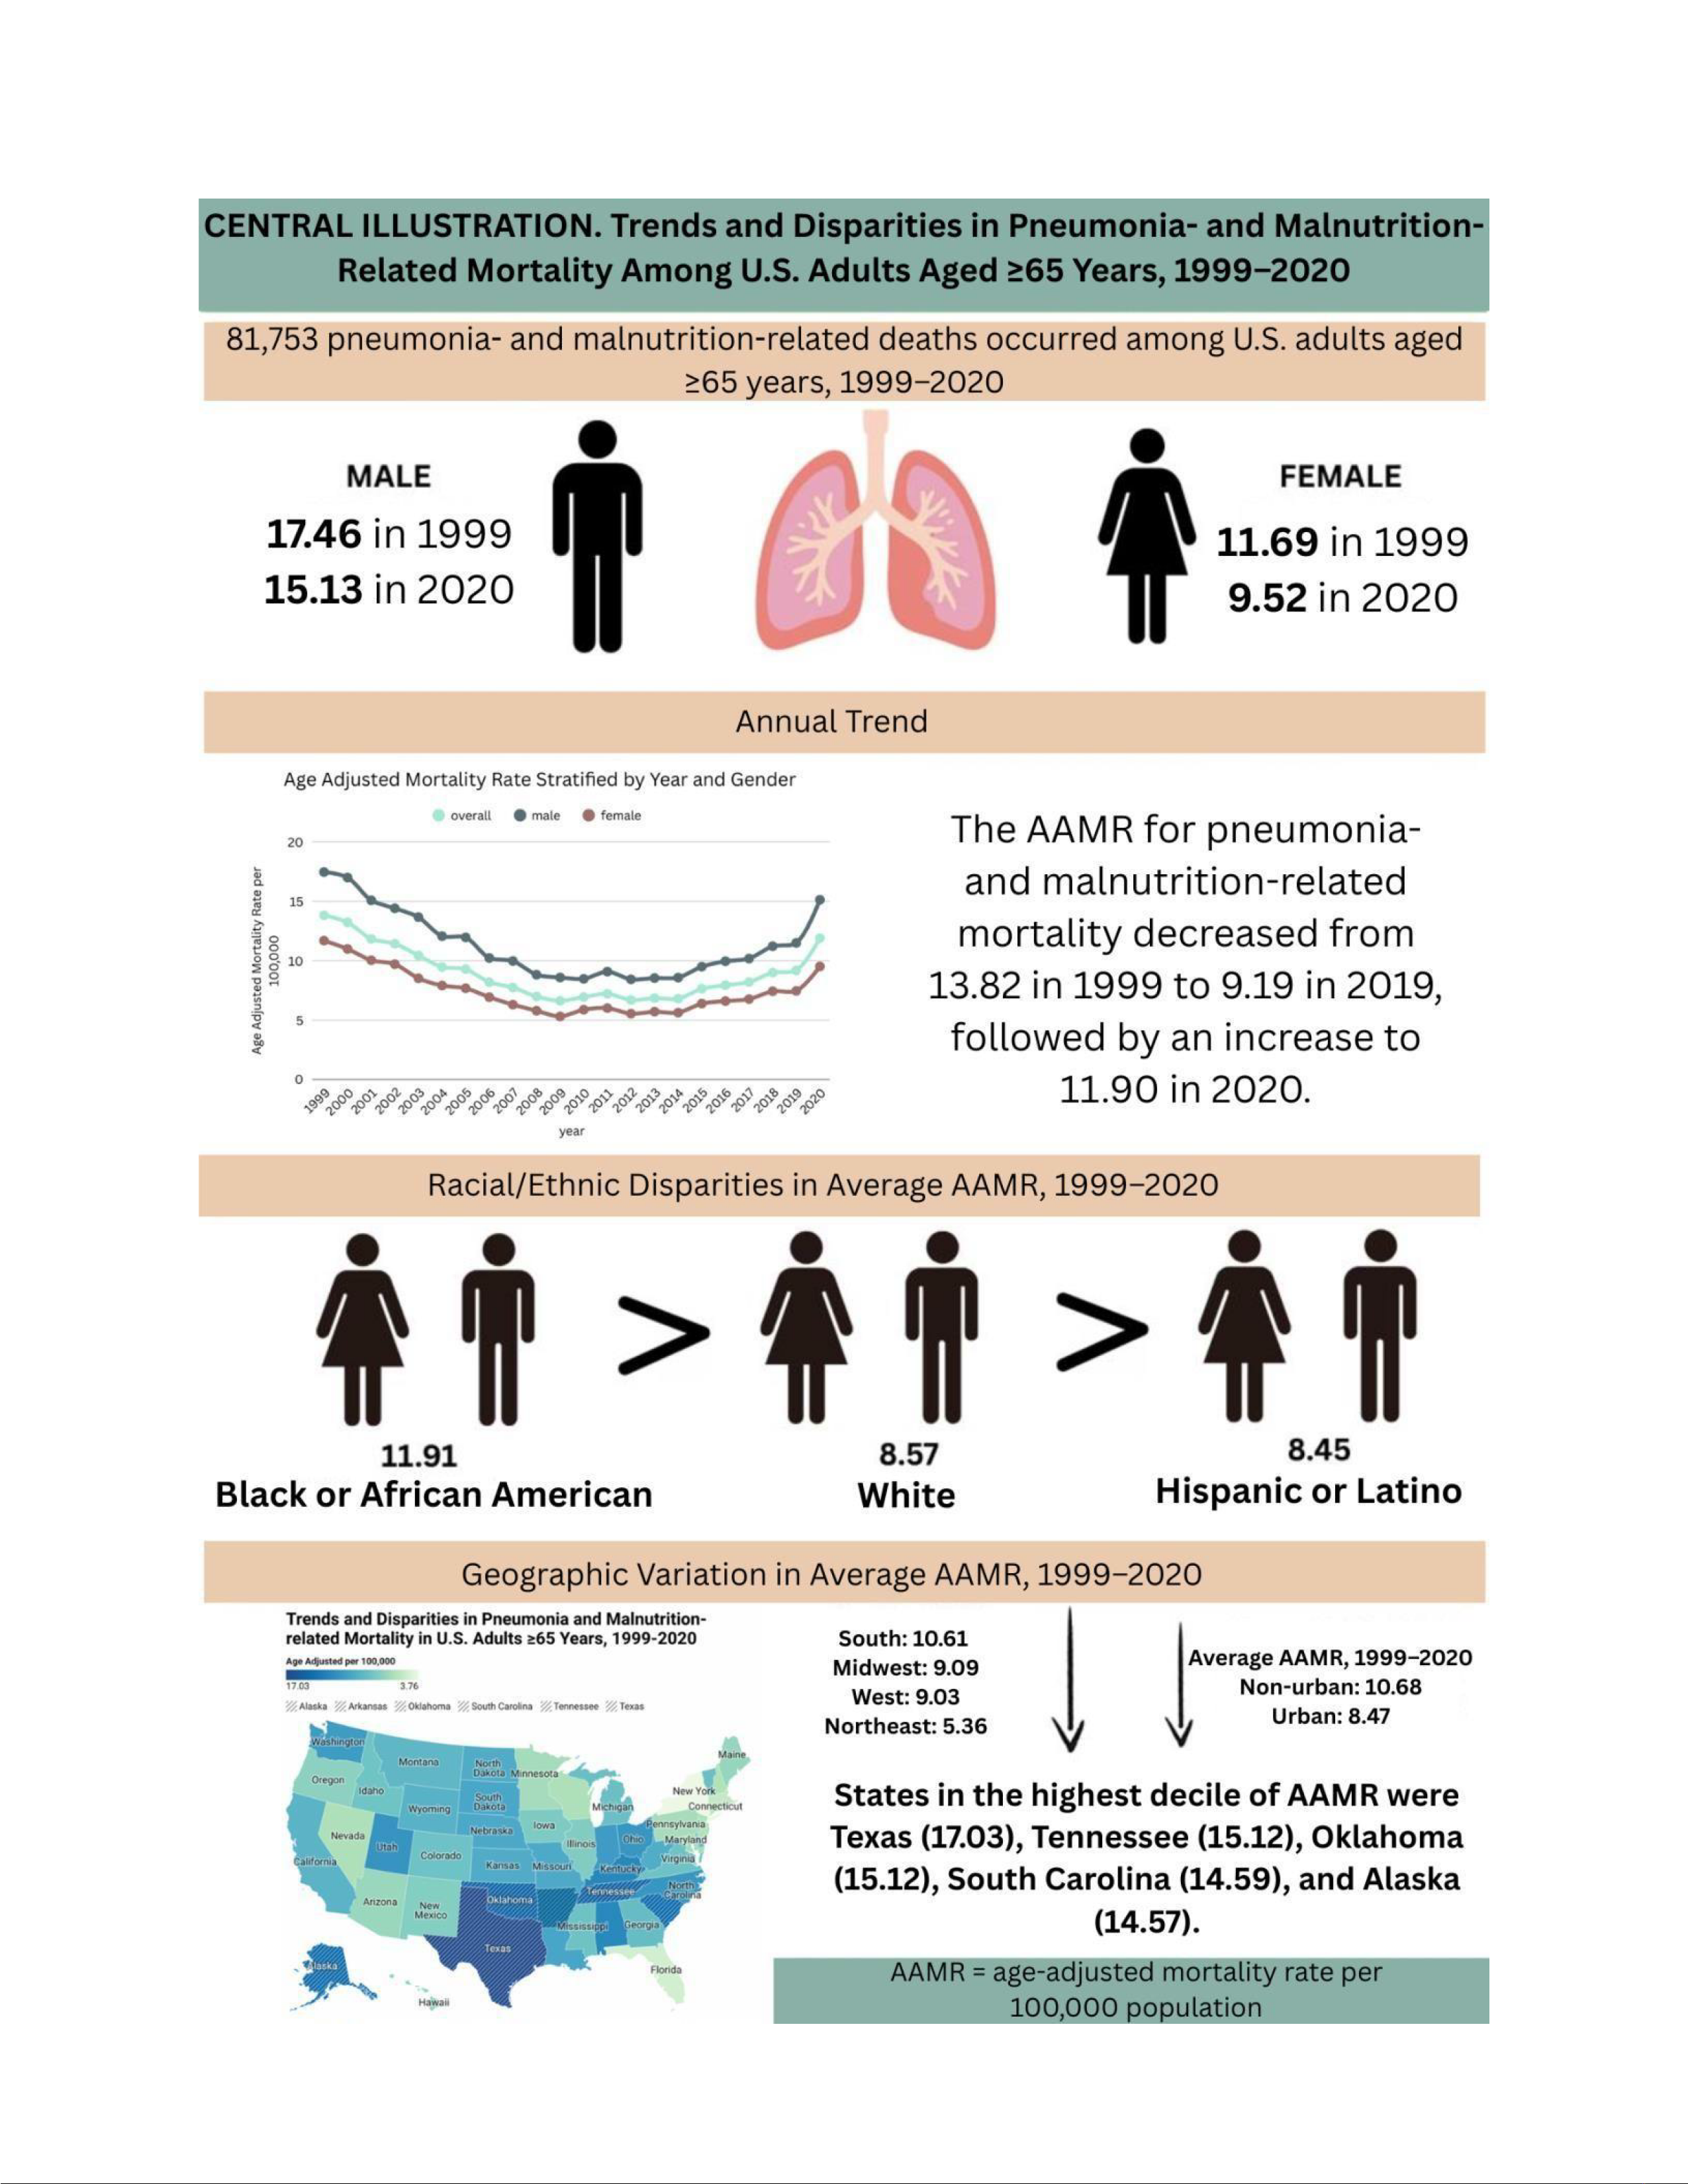
Pneumonia and malnutrition are major contributors to mortality among older adults, yet their combined population-level burden remains poorly defined. We examined national trends and sociodemographic disparities in pneumonia and malnutrition-associated mortality among adults aged 65 years and older in the United States by analyzing data from the CDC WONDER Multiple Cause of Death database from 1999 to 2020. Age-adjusted mortality rates (AAMR) per 100,000 population were calculated, and temporal trends were assessed using Joinpoint regression. Between 1999 and 2020, 81,753 deaths involving both conditions occurred. The overall AAMR declined from 13.82 to 11.90 per 100,000, though a sharp increase occurred from 2017 to 2020. Mortality rates were higher among males, adults aged 85 and older, American Indian/Alaska Native and Black individuals, nonmetropolitan populations, and residents in the South, with Texas exhibiting the highest state-level rate. Pneumonia and malnutrition-associated mortality among older U.S. adults declined over much of the study period but increased substantially in recent years. Persistent demographic and geographic disparities suggest that vulnerable older adults remain at elevated risk, highlighting the need for integrated pneumonia prevention, nutritional screening, and targeted early interventions.
Keywords:
pneumonia
; malnutrition
; mortality trends
; older adults
; CDC WONDER
; joinpoint regression
; health disparities
; United States
1. Introduction
Among older adults, pneumonia and malnutrition frequently coexist in a mutually reinforcing and potentially fatal cycle. Age-related immunosenescence, frailty, and declining physiological reserve increase susceptibility to acute respiratory infections, while malnutrition accelerates skeletal muscle loss, promotes sarcopenia, and impairs immune function [1,3]. Once pneumonia develops, the associated inflammatory and hypermetabolic response often worsens anorexia, disrupts swallowing function, and further depletes nutritional reserves, thereby amplifying functional decline and vulnerability [2,4]. In this setting, disease-related malnutrition is not merely a secondary comorbidity, but both a marker of baseline physiologic frailty and an active contributor to poor outcomes during acute respiratory illness [5]. Despite this biologic interplay, the combined mortality burden of pneumonia and malnutrition remains insufficiently characterized at the population level, particularly among older adults who face increasing agerelated vulnerability and persistent healthcare disparities.
To address this gap, we analyzed national mortality trends among U.S. adults aged 65 years and older using the CDC WONDER Multiple Cause of Death database from 1999 through 2020. We evaluated age-adjusted mortality patterns associated with co-occurring pneumonia and malnutrition and examined disparities across sex, age group, race and ethnicity, urbanization status, census region, state, and place of death. By identifying disproportionately affected populations, this study aims to provide an epidemiologic foundation for integrating respiratory infection prevention strategies with early nutritional assessment and intervention in older adults.
2. Methods
In this study, we focused on the mortality trend and disparities of pneumonia and malnutrition in older adults aged 65 years or above, using data from the CDC WONDER website, where data were examined from 1999–2020 [6]. The study included only adults above 65 years due to the greater susceptibility to infections and nutritional deficiencies, along with longer exposure to age-related comorbidities, thereby representing the burden of these conditions in older populations.
Deaths related to pneumonia and malnutrition were identified using ICD-10 codes for pneumonia (J10.0, J11.0, J12–J18, J69) and malnutrition (E40–E46) [7]. The Multiple Cause-of-ofDeath public-use data from death certificates were studied to identify cases where both pneumonia and malnutrition were reported in the multiple cause of death (MCD) fields.
This study fell under exemption from Institutional Review Board (IRB) approval because it used a de-identified government-issued public use dataset and adhered to the STROBE (Strengthening the Reporting of Observational Studies in Epidemiology) guidelines for reporting[8].
Data Extraction
The data for age group, race, sex, state, place of death, census region, and 2013 urbanization were examined. Individuals aged 65 years and older were divided into 10-year age groups. Race and ethnicity were classified as American Indian or Alaska Native, Asian or Pacific Islander, Black or African American, and White; Hispanic or Latino origin was analyzed separately, consistent with CDC WONDER, which codes Hispanic ethnicity independently of race.
The extracted data were from all 50 U.S. states, U.S. territories, and the District of Columbia.
Place of death included medical facilities (including outpatient, inpatient, emergency, death at arrival, or status unknown), decedent's home, hospice facility, nursing home or long-term care, and other locations.
Census regions were classified using CDC WONDER codes CENS-R1 to CENS-R4, corresponding to the Northeast, Midwest, South, and West. Levels of urbanization included Large Central Metro, Large Fringe Metro, Medium Metro, Small Metro, Micropolitan (Nonmetro), and NonCore (Nonmetro) [9].
Statistical Analysis
Crude mortality rates (CMRs) and age-adjusted mortality rates (AAMRs) were calculated to examine national temporal trends. CMRs were derived by dividing the number of pneumonia and malnutrition-related deaths by the corresponding U.S. population for each year. AAMRs were calculated by standardizing the mortality counts to the 2000 U.S. standard population [9].
Trends in both crude and age-adjusted mortality rates were assessed using the Joinpoint Regression Program (Version 4.9.0.0, National Cancer Institute), which fits log-linear regression models composed of consecutive linear segments connected by joinpoints where significant temporal changes occur [10].
Autocorrelation was checked by the Joinpoint Regression Program, and default permutation tests were used to determine the number of joinpoints [10]. This approach has been used extensively in population-level mortality analyses and identifies statistically significant turning points in long-term trends.
Annual percent change (APC) estimates with 95% confidence intervals (CIs) were generated, and trends were considered increasing or decreasing if the corresponding slope deviated markedly from zero based on two-sided t-tests. A P value of <0.05 was considered statistically significant.
3. Results
Pneumonia- and malnutrition-related mortality among adults aged ≥65 years accounted for 81,753 deaths in the United States between 1999 and 2020. Among these deaths, 41,851 (51.19%) occurred in females, while 39,902 (48.81%) occurred in males. (Supplemental Table1).
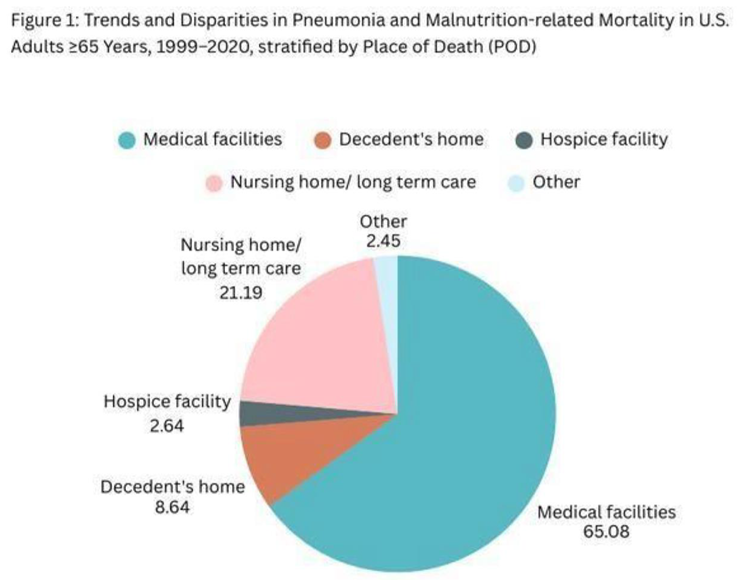
Regarding the location of death, the majority occurred in medical facilities during inpatient care, accounting for 53,210 deaths (65.08%). This was followed by nursing home or long-term care facilities, which accounted for 17,325 deaths (21.19%), and decedents homes, accounting for 7,062 deaths (8.64%). (Supplemental Table 2, Figure 1).
3.1. Overall Trend for AAMR.
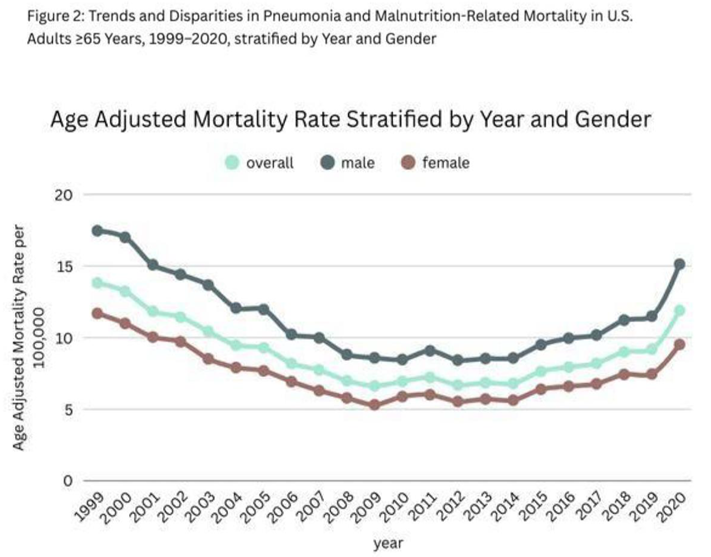
Over this period, the AAMR decreased from 13.82 in 1999 to 11.90 in 2020. Trend analysis demonstrated a significant decline from 1999 to 2009 [APC: -7.27%; 95% CI: -8.28 to -6.26; P < 0.001], followed by a significant rise from 2009 to 2017 [APC: 2.17%; 95% CI: 0.17 to 4.22; P = 0.036]. Subsequently, a significant increase was observed from 2017 to 2020 [APC: 13.25%; 95% CI: 6.96 to 19.90; P < 0.001] (Supplemental Tables 3 and 4; Figure 2).
3.2. Demographic Differences
3.2.1. Sex-Stratified Analysis
Throughout the study period, males consistently had higher AAMRs than females. From 1999 to 2020, the AAMR among males decreased from 17.46 in 1999 to 15.13 in 2020. Trend analysis demonstrated a significant decrease from 1999 to 2010 [APC: -6.94%; 95% CI: -7.67 to -6.21; P < 0.001] followed by a significant increase from 2010 to 2018 [APC: 3.40%; 95% CI: 1.82 to 5.00; P < 0.001], and a sharp significant increase between 2018 and 2020 [APC: 18.16%; 95% CI: 8.11 to 29.14; P < 0.001].
From 1999 to 2020, the AAMR among females decreased from 11.69 in 1999 to 9.52 in 2020.
There was a significant decrease from 1999 to 2009 [APC: -7.46%; 95% CI: -8.44 to -6.48; P <0.001], followed by a significant increase between 2009 and 2017 [APC: 2.34%; 95% CI: 0.36 to4.36; P = 0.024], and a significant rise between 2017 and 2020 [APC: 11.64%; 95% CI: 5.04 to18.64; P = 0.002] (Supplemental Tables 3 and 4; Figure 2).
3.2.2. Race-Stratified Analysis
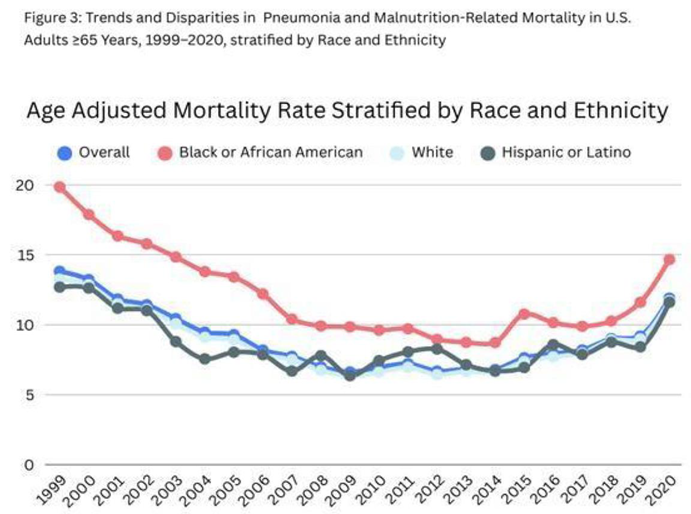
At baseline in 1999, the highest AAMR was observed among American Indian or Alaska Native individuals; however, by 2020, the highest AAMR was observed among Black or African American individuals, followed by American Indian or Alaska Native, White, Hispanic or Latino, and Asian or Pacific Islander individuals.
Among Asian or Pacific Islander individuals, the AAMR demonstrated a significant decline from 12.23 in 1999 to 6.21 in 2008 [APC: −5.64%; 95% CI: −8.55 to −2.63; P = 0.001], followed by a significant increase from 2008 to 2020, reaching 9.31 in 2020 [APC: 2.66%; 95% CI: 1.14 to 4.19; P = 0.002].
Among American Indian or Alaska Native individuals, the AAMR showed a significant decline from 23.78 in 1999 to 7.93 in 2014 [APC: −6.88%; 95% CI: −8.99 to −4.71; P < 0.001], followed by a statistically non-significant increase from 2014 to 2020, reaching 12.23 in 2020 [APC:6.11%; 95% CI: −1.51 to 14.31; P = 0.111].
Among Black or African American individuals, the AAMR declined significantly from 19.85 in 1999 to 9.61 in 2010 [APC: −6.68%; 95% CI: −7.67 to −5.68; P < 0.001], followed by a statistically non-significant increase from 9.61 in 2010 to 10.27 in 2018 [APC: 1.41%; 95% CI: −0.78 to 3.65; P = 0.190]. A sharp and statistically significant increase occurred between 2018 and 2020, reaching 14.66 in 2020 [APC: 19.24%; 95% CI: 4.99 to 35.42; P = 0.010].
Among White individuals, the AAMR declined significantly from 13.26 in 1999 to 6.31 in 2009 [APC: −7.40%; 95% CI: −8.42 to −6.36; P < 0.001], followed by a significant increase from 6.31 in 2009 to 7.97 in 2017 [APC: 2.39%; 95% CI: 0.27 to 4.56; P = 0.029]. A further significant increase was observed from 2017 to 2020, reaching 11.71 in 2020 [APC: 13.71%; 95% CI: 7.24 to 20.58; P < 0.001].
Among Hispanic or Latino individuals, the AAMR declined significantly from 12.69 in 1999 to 6.69 in 2007 [APC: −7.50%; 95% CI: −10.54 to −4.35; P < 0.001], followed by a statistically nonsignificant increase from 2007 to 2018, reaching 8.75 in 2018 [APC: 1.37%; 95% CI: −0.68 to 3.45; P = 0.175]. A further statistically non-significant increase was observed from 2018 to 2020, reaching 11.61 in 2020 [APC: 17.47%; 95% CI: −2.73 to 41.86; P = 0.089] (Supplemental Tables 3 and 5; Figure 3).
3.2.3. Age Group-Stratified Analysis
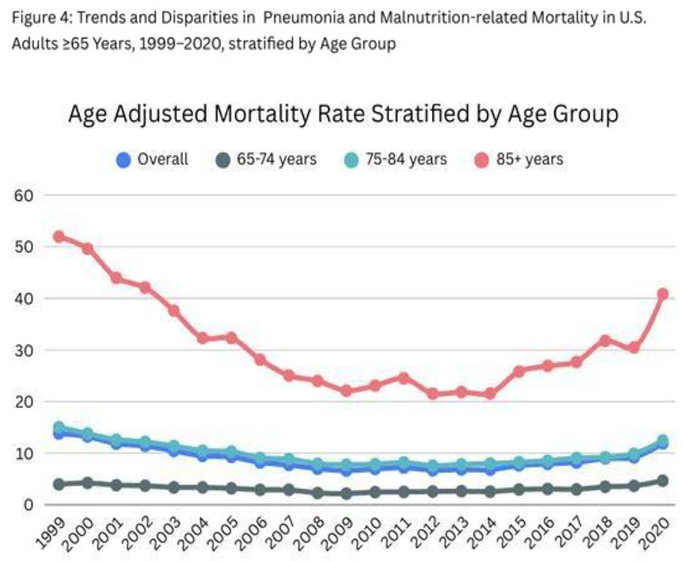
When stratified into 10-year age groups, the ≥85-year age group consistently exhibited the highest AAMR, followed by the 75–84 years and 65–74 years age groups.
Among individuals aged 65–74 years, the AAMR increased from 3.96 in 1999 to 4.67 in 2020.
Trend analysis demonstrated a significant decline from 3.96 in 1999 to 2.18 in 2009 [APC: −5.86%; 95% CI: −7.21 to −4.51; P < 0.001], followed by a significant increase from 2009 to 2017, reaching 2.99 in 2017 [APC: 3.05%; 95% CI: 0.68 to 5.48; P = 0.015], which accelerated significantly from 2017 to 2020, reaching 4.67 in 2020 [APC: 14.32%; 95% CI: 7.13 to 22.00; P < 0.001].
Among individuals aged 75–84 years, the AAMR decreased from 15.05 in 1999 to 12.46 in 2020. The AAMR declined significantly from 15.05 in 1999 to 7.76 in 2009 [APC: −6.49%; 95% CI: −7.10 to −5.87; P < 0.001], followed by a significant increase from 2009 to 2018 reaching 9.22 in 2018 [APC: 1.75%; 95% CI: 0.72 to 2.80; P = 0.003], and a marked significant rise from 2018 to 2020, reaching 12.46 in 2020 [APC: 17.30%; 95% CI: 8.75 to 26.53; P < 0.001].
Among individuals aged ≥85 years, the AAMR declined from 51.93 in 1999 to 40.81 in 2020.
The AAMR decreased significantly from 51.93 in 1999 to 24.00 in 2008 [APC: −8.68%; 95% CI: −10.19 to −7.15; P < 0.001], followed by a statistically non-significant decline from 2008 to 2014, reaching 21.58 in 2014 [APC: −1.13%; 95% CI: −5.65 to 3.62; P = 0.612]. However, the trend reversed with a significant increase from 2014 to 2020, reaching 40.81 in 2020 [APC: 9.44%; 95% CI: 6.44 to 12.53; P < 0.001] (Supplemental Tables 3 and 6; Figure 4).
3.3. Regional Variations
3.3.1. Stratified by Urbanization
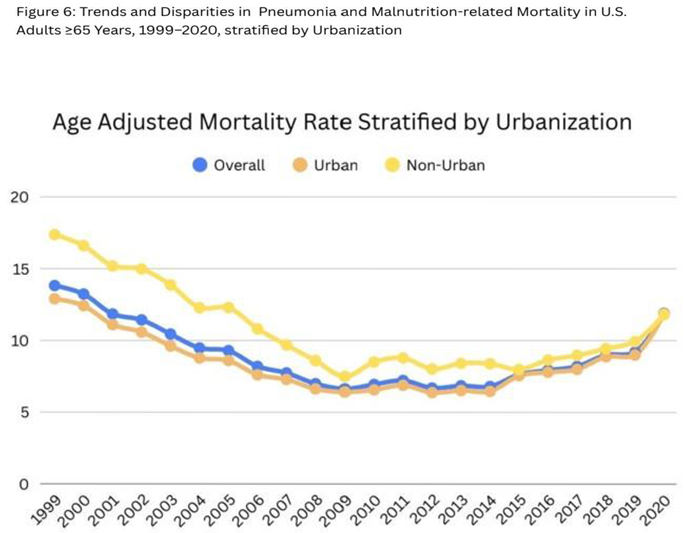
The AAMR decreased in both metro and non-metro areas between 1999 and 2020.
In metro areas, mortality declined significantly from 12.90 in 1999 to 6.41 in 2009 [APC:−7.17%; 95% CI: −8.30 to −6.01; P < 0.001], followed by a significant increase from 2009 to 2017, reaching 8.00 in 2017 [APC: 2.71%; 95% CI: 0.49 to 4.98; P = 0.020]. A further sharp and significant increase was observed from 2017 to 2020, reaching 11.86 in 2020 [APC: 13.93%; 95% CI: 6.93 to 21.40; P < 0.001].
3.3.2. Stratified by Census Region
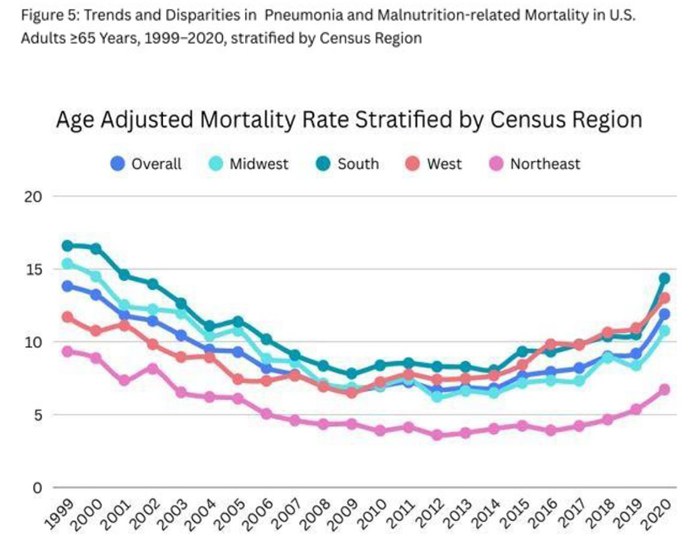
Across census regions, AAMR generally declined between 1999 and 2020.
In the Northeast, AAMR declined significantly from 9.33 in 1999 to 3.90 in 2010 [APC: −7.86%; 95% CI: −8.94 to −6.78; P < 0.001], followed by a statistically non-significant increase from 2010 to 2017 reaching 4.22 in 2017 [APC: 0.91%; 95% CI: −2.57 to 4.50; P = 0.590], and a significant increase from 2017 to 2020, reaching 6.72 in 2020 [APC: 17.12%; 95% CI: 7.85 to 27.73; P =0.001].
In the Midwest, AAMR declined significantly from 15.36 in 1999 to 6.22 in 2012 [APC: −6.93%; 95% CI: −7.92 to −5.94; P < 0.001], followed by a significant increase from 2012 to 2020, reaching 10.76 in 2020 [APC: 6.25%; 95% CI: 3.85 to 8.70; P < 0.001].
In the South, AAMR declined significantly from 16.59 in 1999 to 7.82 in 2009 [APC: −7.52%; 95% CI: −8.41 to −6.62; P < 0.001], followed by a significant increase from 2009 to 2018, reaching 10.36 [APC: 2.39%; 95% CI: 0.99 to 3.82; P = 0.003], and a sharper significant increase from 2018 to 2020, reaching 14.35 in 2020 [APC: 19.13%; 95% CI: 7.90 to 31.54; P =0.002].
In the West, AAMR declined significantly from 11.70 in 1999 to 6.50 in 2009 [APC: −6.00%; 95% CI: −7.43 to −4.54; P < 0.001], followed by a significant increase from 2009 to 2020, reaching 13.01 in 2020 [APC: 5.98%; 95% CI: 4.80 to 7.19; P < 0.001] (Supplemental Tables 3 and 7; Figure 5).
3.3.3. Stratified by State
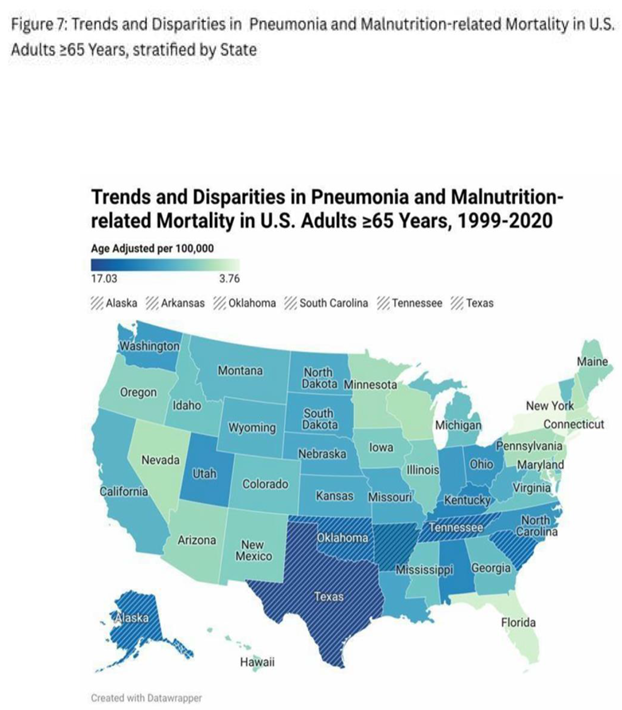
Substantial state-level variation in age-adjusted mortality rates (AAMRs) for malnutrition and pneumonia was observed. Mortality ranged from a low of 3.76 (95% CI: 3.61–3.92) in New York to a high of 17.03 (95% CI: 16.69–17.38) in Texas. States within the highest 90th percentile included Texas (AAMR: 17.03, 95% CI: 16.69–17.38), Tennessee (15.12, 95% CI: 14.56–15.69), Oklahoma (15.12, 95% CI: 14.40–15.85), South Carolina (14.59, 95% CI: 13.93–15.24), and Alaska (14.57, 95% CI: 12.19–16.95), reflecting markedly elevated mortality burdens. In contrast, states within the lowest 10th percentile included New York (3.76, 95% CI: 3.61–3.92), Florida (4.80, 95% CI: 4.65–4.96), Massachusetts (5.34, 95% CI: 5.00–5.64), Connecticut (5.70,95% CI: 5.27–6.12), and the District of Columbia (5.88, 95% CI: 4.76–7.19), indicating comparatively lower mortality rates. Overall, the highest-burden state exhibited more than a fourfold higher AAMR compared with the lowest-burden state across the United States during the study period (Supplemental Table 9, Figure 7).
4. Discussions
Overall
The trend in age-adjusted mortality rates (AAMR) for pneumonia and malnutrition from 1999 to 2020 demonstrates a pronounced U-shaped trajectory, reflecting the reversal of earlier public health gains. Between 1999 and 2009, AAMR declined substantially, supported by expanded primary care [11], increased vaccination coverage [12], and sustained advances in healthcare delivery and biomedical innovation [15,16]. Post-recession economic recovery further contributed to reductions in all-cause mortality among older adults [13,14]. However, this trajectory reversed after 2009, with mortality rates increasing prior to the COVID-19 pandemic, particularly during 2017–2019. This pre-pandemic rise suggests that widening health disparities, an increasing burden of comorbidities [17], and deterioration in pneumonia-related outcomes were already eroding earlier clinical gains. In parallel, malnutrition mortality among individuals aged ≥75 years increased markedly over the period 2000–19, rising from 19.5 (95% uncertainty interval [UI]: 18.8–20.1) to 49.2 [18], reflecting a sustained and progressive vulnerability in older populations.
This worsening trajectory has been further compounded by systemic inefficiencies in healthcare delivery, particularly fragmented care pathways and suboptimal coordination of inpatient and post-acute services [20]. Although preventive coverage, including influenza vaccination, expanded substantially by 2014 [21], improvements in preventive uptake have not been matched by equivalent gains in inpatient care quality or nutritional support. Malnourished patients consistently experience prolonged hospitalization, higher healthcare expenditure, and increased in-hospital complications [19]. Similarly, hospital-acquired pneumonia remains a major driver of inpatient morbidity, with incidence rates ranging from 6 to 8.6 cases per 1000 admissions in high-income settings, and substantially higher rates observed in resource-limited health systems [22], underscoring persistent gaps in infection prevention and control.
Place of Death
Most deaths from pneumonia and malnutrition occur in medical facilities (65.08%), followed by nursing homes or long-term care settings (21.19%), while a smaller proportion occur at home (8.64%). While pneumonia is a leading cause of hospital admission in the United States, it also carries a substantial global burden, accounting for approximately 6.8 million hospitalizations and 1.1 million deaths annually among individuals over 65 years of age [23,24]. The high in-hospital mortality observed reflects the clinical severity of the illness, with a significant proportion of patients requiring intensive care; approximately 23% are admitted to the ICU [25].
Nursing homes–acquired pneumonia (NHAP) remains a major concern in older adults, particularly given the increasing population residing in long-term care facilities [26]. Advanced age, multiple comorbidities, and malnutrition serve as key factors contributing to poorer clinical outcomes in these settings. In contrast, deaths occurring at home are less frequent, likely due to limited access to intensive monitoring and advanced medical interventions outside of institutional care [27].
Overall, these patterns highlight the concentration of severe pneumonia-related mortality within healthcare institutions. This underscores the critical need for improved preventive strategies, early intervention, and targeted nutritional support for high-risk populations, particularly within hospitals and long-term care facilities [28].
Sex
While females account for a slightly higher absolute number of deaths (51.19%), males consistently exhibit higher mortality rates overall. This discrepancy is likely driven in part by differences in healthcare utilization, as women are more likely than men to engage in preventive and non-acute health services [29]. For example, men show significantly lower uptake of influenza vaccination (OR 0.71, 95% CI 0.67–0.76), reflecting broader patterns of reduced preventive care engagement [30].
Beyond behavioral factors, biological sex differences in immune function may further contribute to mortality disparities. Females generally demonstrate stronger innate and adaptive immune responses, which confer enhanced protection against bacterial, viral, and parasitic infections, particularly during reproductive years [31]. This immunological advantage may partially explain lower infection-related mortality in women across multiple settings.
In addition, sex differences in lifestyle exposures and comorbidity profiles likely amplify male vulnerability. Historically higher smoking prevalence among men, who constitute the majority of global smokers, contributes to a disproportionate burden of cardiovascular and chronic respiratory disease [32]. These comorbidities significantly increase the risk of severe outcomes from infectious diseases such as pneumonia, thereby compounding male mortality risk [33].
Conversely, female mortality remains elevated in specific contexts where structural and nutritional vulnerabilities are more pronounced. In some populations, higher rates of malnutrition among women increase susceptibility to adverse health outcomes and may offset biological advantages in immunity [34]. Collectively, these findings highlight that sex differences in mortality arise from interacting behavioral, biological, and structural determinants, underscoring the need for integrated and sex-sensitive public health interventions [35].
Age Groups
The rising mortality burden among older adults reflects the convergence of biological aging processes, functional decline, and entrenched structural inequities. At the biological level, frailty, multimorbidity, and immune senescence collectively erode physiological resilience, reducing adaptive capacity and increasing susceptibility to adverse health outcomes [36]. These vulnerabilities are frequently compounded by functional impairments, particularly those affecting nutrition; for instance, age-related tooth loss impairs mastication and contributes to reduced dietary diversity and subsequent micronutrient deficiencies [37]. Nutritional risk is further shaped by socioeconomic gradients, where lower educational attainment is associated with poorer nutritional status due to limited health literacy, reduced dietary quality, and constrained capacity to implement appropriate food practices [38]. Consequently, approximately 25% of older adults are either malnourished or at high nutritional risk, underscoring a substantial and preventable public health burden [39,40]. Addressing this requires upstream structural interventions, including income security policies, expanded community-based nutritional and social support for isolated individuals (particularly those who are widowed, single, or divorced), and strengthened lifelong health and food literacy initiatives [41].
Beyond individual determinants, systemic barriers within healthcare delivery further exacerbate risk and delay timely intervention. Older adults disproportionately face financial constraints, reduced mobility, geographic inaccessibility, and digital exclusion, all of which collectively impede access to essential healthcare services [42]. These barriers are further intensified by social isolation and caregiver dependence, increasing the likelihood of delayed treatment seeking and worsened clinical trajectories. In parallel, rising vaccine hesitancy contributes to suboptimal immunization coverage, heightening vulnerability to preventable infectious diseases within this high-risk population [43]. Mitigating these intersecting risks requires a shift away from fragmented, episodic care toward integrated, person-centered models. Comprehensive geriatric assessment, interdisciplinary coordination, and shared decision-making frameworks are therefore essential to managing multimorbidity, improving functional outcomes, and reducing avoidable mortality among older adults [44].
Race
Racial and ethnic disparities in pneumonia and malnutrition-related mortality remain stark in the United States. Although White populations account for the highest absolute number of deaths, Black individuals experience the highest age-adjusted mortality rates, reflecting persistent systemic health inequities [45]. These disparities are strongly shaped by overlapping social determinants of health, including socioeconomic status [46], insurance coverage [47], barriers to primary care [45,48], and sub-optimal vaccination uptake [49].
Conversely, Hispanic populations generally exhibit lower mortality rates—a phenomenon historically termed the “Hispanic Paradox” and attributed to robust social support networks and behavioral patterns [50]. However, this relative advantage has narrowed in recent years, underscoring how shifting structural and social conditions continue to drive unequal health outcomes.
Urbanization
Age-adjusted mortality rates (AAMR) for pneumonia and malnutrition declined in both metropolitan and non-metropolitan areas between 1999 and 2020, though the overall decrease was statistically significant only in non-metropolitan regions. Both areas experienced steady reductions from 1999 to 2009, followed by a notable resurgence in mortality after 2016–2017, a trend particularly pronounced in metropolitan regions. Paradoxically, while urban older adults report greater familial cohesion [51], major cities also face higher rates of food insecurity [52]. These geographic disparities are heavily shaped by underlying socioeconomic status, race/ethnicity, and modifiable lifestyle factors [53], underscoring the critical need for targeted public health interventions tailored to both urban and rural populations.
Census and States
From 1999 to 2020, age-adjusted mortality rates (AAMR) for pneumonia and malnutrition among adults aged 65 and older declined nationally, although clear regional disparities persisted. The Northeast and Midwest experienced statistically significant improvements, whereas the South consistently recorded the highest AAMR with only a non-significant decline, suggesting a persistent burden potentially linked to socioeconomic disadvantage and food insecurity [55]. In contrast, the West showed a non-significant overall increase in mortality [54].
At the state level, disparities were substantial, with the highest-burden states exhibiting more than fourfold higher mortality rates than the lowest-burden states. These differences likely reflect variation in socioeconomic conditions, comorbidity profiles, and healthcare infrastructure. Importantly, greater primary care physician supply is associated with lower mortality, with each additional 10 primary care physicians per 100,000 population linked to a 0.9% - 1.4% reduction in respiratory deaths [55]. This underscores the importance of strengthening primary care access to reduce geographic disparities in outcomes.
5. Limitations
This study has several limitations. It relies on death certificate data, which may underreport or inconsistently record malnutrition, particularly among older adults. The lack of detailed individual-level information, such as socioeconomic status, comorbidities, or care setting, prevents adjustment for key risk factors. Regional trends may mask important local variations, and changes in coding practices or clinical recognition over time could have influenced observed patterns. Additionally, the analysis does not distinguish between types or causes of malnutrition, making it difficult to identify specific drivers of higher mortality.
Additional limitations warrant mention. Because the study period includes 2020, the first year of the COVID-19 pandemic, the post-2017 increase, and particularly the sharp rise in 2020—is likely confounded by COVID-19, which is frequently coded with pneumonia (e.g., J12.x) and which disrupted nutritional support and continuity of care. In addition, multiple cause-of-death data cannot establish the temporal or causal direction between pneumonia and malnutrition. Finally, comparisons across states, regions, and population subgroups are ecological and may not reflect individual-level risk.
6. Conclusion
Pneumonia and malnutrition-related mortality among older adults in the United States followed a pronounced U-shaped trajectory from 1999 to 2020, with substantial declines in the early 2000s followed by a reversal after 2017, prior to the full impact of the COVID-19 pandemic that accelerated sharply in 2020, the first year of the COVID-19 pandemic. This resurgence suggests that earlier gains in prevention and clinical management were not sustained and highlights persistent vulnerabilities among older adults, particularly males, individuals aged ≥85 years, and Black/African American populations, who experienced the highest mortality burden. The concentration of deaths in hospitals and nursing facilities underscores the complex interaction between frailty, nutritional decline, and infectious disease in advanced age, as well as potential gaps in care coordination across acute and long-term care settings. These findings support the need for integrated public health strategies that combine pneumonia prevention and treatment with routine nutritional screening, long-term nutritional support, and improved continuity of care, while also addressing structural determinants such as food insecurity, inequitable healthcare access, and fragmented chronic care services to reduce preventable mortality among vulnerable older adults.
Supplementary Materials
The supplementary information can be downloaded at the website of this paper posted on Preprints.org
Funding
The author(s) declare that no financial support was received for the research of this article.
Institutional Review Board Statement
Ethical review and approval were waived for this study because it was a retrospective secondary analysis of publicly available, de-identified data obtained from the Centers for Disease Control and Prevention (CDC) databases. The dataset contains no personally identifiable information, and the study did not involve direct interaction or intervention with human participants. Therefore, according to applicable ethical guidelines and institutional requirements, formal Institutional Review Board (IRB) approval was not required.
Informed Consent Statement
Patient consent was waived because this study utilized publicly available, fully anonymized CDC data. Individual informed consent had been obtained by the CDC during the original data collection process, and all publicly released datasets were de-identified prior to access. Consequently, additional informed consent was not required for this secondary data analysis.
Data Availability
Publicly available datasets were used in this study. The data can be accessed through the CDC WONDER platform, including the Multiple Cause of Death database available at: https://wonder.cdc.gov/mcd.html.
Conflicts of Interest
The authors declare no competing interests that could have influenced the objectivity or outcome of this research.
Generative AI statement
The author(s) declare that no Generative AI was used in the creation of this manuscript.
References
- Maeda K, Akagi J. Muscle mass loss is a potential predictor of 90-day mortality in older adults with aspiration pneumonia. J Am Geriatr Soc. 2017;65(1):e18-e22. [CrossRef] [PubMed]
- Maeda K, Murotani K, Kamoshita S, Horikoshi Y, Kuroda A. Nutritional management in inpatients with aspiration pneumonia: a cohort medical claims database study. Arch Gerontol Geriatr. 2021;95:104398. [CrossRef] [PubMed]
- Landi F, Camprubi-Robles M, Bear DE, Cederholm T, Malafarina V, Welch AA, et al. Muscle loss: the new malnutrition challenge in clinical practice. Clin Nutr. 2019;38(5):2113-2120. [CrossRef] [PubMed]
- Sato S, Takahashi H. Assessment of the risk of malnutrition due to aspiration pneumonia and oral feeding difficulty. Nutr Hosp. 2020;37(4):723-729. [CrossRef] [PubMed]
- Norman K, Pichard C, Lochs H, Pirlich M. Prognostic impact of disease-related malnutrition. Clin Nutr. 2008;27(1):5-15. [CrossRef] [PubMed]
- Centers for Disease Control and Prevention, National Center for Health Statistics. Multiple Cause of Death 1999-2020 on CDC WONDER Online Database. Atlanta (GA): Centers for Disease Control and Prevention; cited 2026 May 20. Available from: http://wonder.cdc.gov/mcd-icd10.html.
- World Health Organization. International Statistical Classification of Diseases and Related Health Problems, 10th Revision (ICD-10). Geneva: World Health Organization; 2019. Available from: ICD-10 Version:2019.
- von Elm E, Altman DG, Egger M, Pocock SJ, Gøtzsche PC, Vandenbroucke JP, et al. The Strengthening the Reporting of Observational Studies in Epidemiology/STROBE statement: guidelines for reporting observational studies. Lancet. 2007;370(9596):1453-1457. [CrossRef] [PubMed]
- Ingram DD, Franco SJ. 2013 NCHS urban-rural classification scheme for counties. Vital Health Stat 2. 2014;(166):1-73. [PubMed]
- Surveillance Research Program, National Cancer Institute. Joinpoint Regression Program, version 4.9.0.0. Bethesda (MD): National Cancer Institute; 2026. Available from: https://surveillance.cancer.gov/joinpoint /.
- World Health Organization. Primary health care: now more than ever. Geneva: World Health Organization; 2008. Available from: https://iris.who.int/server/api/core/bitstreams/cff98f24-bb31-42ff-9cb31afced2c070e/content.
- Haber M, Barskey A, Baughman W, Barker L, Whitney CG, Shaw KM, et al. Herd immunity and pneumococcal conjugate vaccine: a quantitative model. Vaccine. 2007;25(29):5390-5398. [CrossRef] [PubMed]
- Benach J, Padilla-Pozo Á, Martínez-Herrera E, Molina-Betancur JC, Gutiérrez M, Pericàs JM, et al. What do we know about the impact of economic recessions on mortality inequalities? A critical review. Soc Sci Med. 2022;301:114983. [CrossRef]
- Hanna SD, Yuh Y, Chatterjee S. The increasing financial obligations burden of US households: who is affected? Int J Consum Stud. 2012;36(5):588-594. [CrossRef]
- Institute of Medicine (US) Committee to Evaluate the Artificial Heart Program of the National Heart, Lung, and Blood Institute; Hogness JR, VanAntwerp M, editors. The Artificial Heart: Prototypes, Policies, and Patients. Washington (DC): National Academies Press (US); 1991. Chapter 9, Roles of government and industry in medical technology research, development, and use. Available from: https://www.ncbi.nlm.nih.gov/books/NBK234438/.
- Institute of Medicine (US) Committee on the US Commitment to Global Health. The US Commitment to Global Health: Recommendations for the New Administration. Washington (DC): National Academies Press (US); 2009. A prominent role for health in U.S. foreign policy. Available from: https://www.ncbi.nlm.nih.gov/books/NBK32621/.
- Yousufuddin M, Shultz J, Doyle T, Rehman H, Murad MH. Incremental risk of long-term mortality with increased burden of comorbidity in hospitalized patients with pneumonia. Eur J Intern Med. 2018;55:23-27. [CrossRef] [PubMed]
- Camargo JT, Machuca JO, Hinerman AS, Rodriquez EJ, Alvarez CS, Mensah GA, et al. Malnutrition mortality among older adults by county and race and/or ethnicity in the United States, 2000-2019. J Am Geriatr Soc. 2025;73(9):28682877. [CrossRef] [PubMed]
- Chambers R, Bryan J, Jannat-Khah D, Russo E, Merriman L, Gupta R. Evaluating gaps in care of malnourished patients on general medicine floors in an acute care setting. Nutr Clin Pract. 2019;34(2):313-318. [CrossRef] [PubMed]
- Arensberg MB, Gahche JJ, Dwyer JT, Mosey A, Terzaghi D. Malnutrition-related conditions and interventions in US state/territorial Older Americans Act aging plans. BMC Geriatr. 2022;22(1):664. [CrossRef] [PubMed]
- American Lung Association Epidemiology and Statistics Unit. Trends in pneumonia and influenza morbidity and mortality. Chicago (IL): American Lung Association; 2015. Available from: https://www.lung.org/getmedia/98f088b5-3fd7- 4c43-a490-ba8f4747bd4d/pi-trend-report.pdf.pdf.
- Esperatti M, Torres Marti A. Pneumonia. In: International Encyclopedia of Public Health. Amsterdam: Elsevier; 2008. p. 535-542. [CrossRef]
- Jain S, Self WH, Wunderink RG, Fakhran S, Balk R, Bramley AM, et al. Community-acquired pneumonia requiring hospitalization among U.S. adults. N Engl J Med. 2015;373(5):415-427. [CrossRef] [PubMed]
- Obianyo CM, Muoghalu N, Adjei EM, Njoku AN, Okoro NL, Sulaiman OB, et al. Trends and disparities in pneumonia-related mortality in the U.S. population: a nationwide analysis using the CDC WONDER data. Cureus. 2025;17(5):e83371. [CrossRef] [PubMed]
- Cavallazzi R, Furmanek S, Arnold FW, Beavin LA, Wunderink RG, Niederman MS, et al. The burden of community-acquired pneumonia requiring admission to ICU in the United States. Chest. 2020;158(3):1008-1016. [CrossRef] [PubMed]
- Kim SJ, Medina M, Zhong L, Chang J. Factors associated with in-hospital death among pneumonia patients in US hospitals from 2016-2019. Int J Health Policy Manag. 2023;12:7390. [CrossRef] [PubMed]
- Jayaraman J, Joseph KS. Determinants of place of death: a population-based retrospective cohort study. BMC Palliat Care. 2013;12:19. [CrossRef] [PubMed]
- Wunderle C, Gomes F, Schuetz P, Stumpf F, Austin P, Ballesteros-Pomar MD, et al. ESPEN practical guideline: nutritional support for polymorbid medical inpatients. Clin Nutr. 2024;43(3):674-691. [CrossRef] [PubMed]
- Golinelli D, Sanmarchi F, Guarducci G, Palombarini J, Benetti P, Rosa S, et al. Gender differences in healthcare utilization across Europe: evidence from the European Health Interview Survey. Health Policy. 2025;162:105448. [CrossRef] [PubMed]
- Vaidya V, Partha G, Karmakar M. Gender differences in utilization of preventive care services in the United States. J Womens Health (Larchmt). 2012;21(2):140145. [CrossRef] [PubMed]
- Pennell LM, Galligan CL, Fish EN. Sex affects immunity. J Autoimmun. 2012;38(2-3):J282-J291. [CrossRef] [PubMed]
- IARC Working Group on the Evaluation of Carcinogenic Risks to Humans. Tobacco smoking. In: Personal Habits and Indoor Combustions. Lyon (FR): International Agency for Research on Cancer; 2012. p. 43-211. Available from: https://www.ncbi.nlm.nih.gov/books/NBK304374/.
- Wang Y, Yang J, Tong X, Hu C, Zhang J, Long Y, et al. Sex differences in onset and prevalence of 108 diseases and multimorbidity across lifespan in Yichang, China: quantitative analysis of real-world linked electronic health records. BMJ Open. 2025;15(7):e101439. [CrossRef] [PubMed]
- Sheean P, Farrar IC, Sulo S, Partridge J, Schiffer L, Fitzgibbon M. Nutrition risk among an ethnically diverse sample of community-dwelling older adults. Public Health Nutr. 2019;22(5):894-902. [CrossRef] [PubMed]
- Holland E, Abdul Jabbar AB, Asghar MS, Asghar N, Mistry K, Mirza M, et al. Demographic and regional trends of pneumonia mortality in the United States, 1999 to 2022. Sci Rep. 2025;15(1):10103. [CrossRef] [PubMed]
- Yu W, Yu Y, Sun S, Lu C, Zhai J, Lei Y, et al. Immune alterations with aging: mechanisms and intervention strategies. Nutrients. 2024;16(22):3830. [CrossRef] [PubMed]
- Hickson M. Malnutrition and ageing. Postgrad Med J. 2006;82(963):2-8. [CrossRef] [PubMed]
- Donini LM, Scardella P, Piombo L, Neri B, Asprino R, Proietti AR, et al. Malnutrition in elderly: social and economic determinants. J Nutr Health Aging. 2013;17(1):9-15. [CrossRef] [PubMed]
- Dent E, Wright ORL, Woo J, Hoogendijk EO. Malnutrition in older adults. Lancet. 2023;401(10380):951-966. [CrossRef] [PubMed]
- Johansson Y, Bachrach-Lindström M, Carstensen J, Ek AC. Malnutrition in a home-living older population: prevalence, incidence and risk factors. A prospective study. J Clin Nurs. 2009;18(9):1354-1364. [CrossRef] [PubMed]
- Besora-Moreno M, Llauradó E, Tarro L, Solà R. Social and economic factors and malnutrition or the risk of malnutrition in the elderly: a systematic review and meta-analysis of observational studies. Nutrients. 2020;12(3):737. [CrossRef] [PubMed]
- Cabañero-Garcia E, Martinez-Lacoba R, Pardo-Garcia I, Amo-Saus E. Barriers to health, social and long-term care access among older adults: a systematic review of reviews. Int J Equity Health. 2025;24(1):72. [CrossRef] [PubMed]
- Reiter PL, Katz ML. Vaccine hesitancy among midlife and older adults in the United States. Vaccine. 2025;72:128054. [CrossRef] [PubMed]
- Wu J, Zhang H, Shao J, Chen D, Xue E, Huang S, et al. Healthcare for older adults with multimorbidity: a scoping review of reviews. Clin Interv Aging. 2023;18:1723-1735. [CrossRef] [PubMed]
- Williams DR, Rucker TD. Understanding and addressing racial disparities in health care. Health Care Financ Rev. 2000;21(4):75-90. [PubMed]
- Barakat C, Konstantinidis T. A review of the relationship between socioeconomic status change and health. Int J Environ Res Public Health. 2023;20(13):6249. [CrossRef] [PubMed]
- Patterson A, Robinson TJ, Roberts ET. Racial and ethnic disparities in insurance coverage among US adults aged 60 to 64 years. JAMA Netw Open. 2022;5(4):e229406. [CrossRef] [PubMed]
- Cordoba E, Aiello AE. Social determinants of influenza illness and outbreaks in the United States. N C Med J. 2016;77(5):341-345. [CrossRef] [PubMed]
- Kramarow EA, Elgaddal N. Vaccinations among adults age 65 and older: United States, 2024. NCHS Data Brief. 2026;(547):1-10. [CrossRef] [PubMed]
- Chen Y, Freedman ND, Rodriquez EJ, Shiels MS, Napoles AM, Withrow DR, et al. Trends in premature deaths among adults in the United States and Latin America. JAMA Netw Open. 2020;3(2):e1921085. [CrossRef] [PubMed]
- Bromell L, Cagney KA. Companionship in the neighborhood context: older adults' living arrangements and perceptions of social cohesion. Res Aging. 2014;36(2):228-243. [CrossRef] [PubMed]
- US Department of Agriculture, Economic Research Service. Food security in the U.S. Washington (DC): US Department of Agriculture. Available from: https://www.ers.usda.gov/topics/food-nutrition-assistance/food-security-in-the-us/.
- Rees-Punia E, Deubler E, Patel AV, Diver WR, Hodge JM, Islami F, et al. The role of individual-level factors in rural mortality disparities. AJPM Focus. 2022;1(1):100013. [CrossRef] [PubMed]
- Dhawan N, Pandya N, Khalili M, Bautista M, Duggal A, Bahl J, et al. Predictors of mortality for nursing home-acquired pneumonia: a systematic review. Biomed Res Int. 2015;2015:285983. [CrossRef] [PubMed]
- Basu S, Berkowitz SA, Phillips RL, Bitton A, Landon BE, Phillips RS. Association of primary care physician supply with population mortality in the United States, 2005-2015. JAMA Intern Med. 2019;179(4):506-514. [CrossRef] [PubMed]
Disclaimer/Publisher’s Note: The statements, opinions and data contained in all publications are solely those of the individual author(s) and contributor(s) and not of MDPI and/or the editor(s). MDPI and/or the editor(s) disclaim responsibility for any injury to people or property resulting from any ideas, methods, instructions or products referred to in the content. |
© 2026 by the authors. Licensee MDPI, Basel, Switzerland. This article is an open access article distributed under the terms and conditions of the Creative Commons Attribution (CC BY) license (http://creativecommons.org/licenses/by/4.0/).
Copyright: This open access article is published under a Creative Commons CC BY 4.0 license, which permit the free download, distribution, and reuse, provided that the author and preprint are cited in any reuse.