

Submitted:
05 September 2026
Posted:
08 September 2026
You are already at the latest version
Abstract
Global Navigation Satellite System (GNSS) radio occultation (RO) has evolved into a heterogeneous multi-mission observing system that combines national, partner, and commercial constellations. This review and outlook synthesize NOAA/STAR assessments of GNSS RO commercial data, including Spire and PlanetiQ, and compares their quality with those of national missions, COSMIC-2, MetOp, and other missions. We emphasize the results in the neutral atmosphere. To examine heterogeneous multiple RO missions, we organized the comparisons along a pathway from i) orbit and viewing geometry through antenna gain and received signal, ii) examining their signal-to-noise ratio (SNR) and penetration, iii) quantifying the phase quality, retrieval bias and uncertainty, iv) demonstrating their impacts on numerical weather prediction (NWP), and climate and environmental applications. The reviewed comparisons show that higher SNR generally improves tracking and lower-tropospheric penetration but does not by itself remove biases and uncertainty arising from water-vapor irregularity, multipath, super-refraction, departures from spherical symmetry, or processing choices. Spire and PlanetiQ retrievals are broadly compatible with COSMIC-2 and partner missions in the principal atmospheric layers, and their additional profiles improve spatiotemporal sampling and provide incremental value for global and tropical-cyclone prediction. For long-term environmental records, however, operational usefulness is not sufficient: common processing, inter-mission stability assessment, sampling correction, and mission-specific uncertainty characterization are required. Multi-mission RO observations support upper-troposphere and lower-stratosphere temperature records, tropospheric water-vapor variability and trend analyses, and planetary-boundary-layer height estimates when these conditions are met. The synthesis yields an application-conditioned evaluation framework that separates signal quality, retrieval quality, usable observation yield, sampling complementarity, and downstream impact. The principal outlook priorities are uncertainty-aware quality control and error specification, improved treatment of super-refraction and lower-tropospheric retrievals, sustained multi-mission reprocessing and intercomparison, and observing-system design that balances measurement quality with coverage.
Keywords:
GNSS radio occultation
; COSMIC-2
; commercial radio occultation
; multi-mission consistency
; signal-to-noise ratio
; numerical weather prediction
; climate monitoring
; planetary boundary layer
; observation uncertainty
; outlook
1. Introduction
Global Navigation Satellite System (GNSS) radio occultation (RO) has entered a heterogeneous multi-mission era. Between 2016 and August 2026, at least eight RO missions or mission series were launched: COSMIC-2, Spire, PlanetiQ, GeoOptics, Sentinel-6, YunYao, Fengyun-3, and Tianmu. As of August 2026, approximately 100 GNSS RO sensors were operating in orbit and tracking signals from GPS, GLONASS, Galileo, BeiDou, QZSS, NavIC/IRNSS, and GPS III. These all-weather observations support atmospheric science, numerical weather prediction (NWP), extreme-weather detection, environmental monitoring, and space-weather studies [1,2,3,4,5].
NOAA has included GNSS RO among its key observables since 2006 [6,7,8]. Since then, NCEP has assimilated data from partner missions, including MetOp-A/-B/-C, KOMPSAT-5, PAZ, TerraSAR-X, and the Taiwan-U.S. FORMOSAT-3/Constellation Observing System for Meteorology, Ionosphere, and Climate mission (COSMIC-1, see Figure 1). COSMIC-2 is the follow-on mission to COSMIC-1 [7,9]. In 2019, NCEP began assimilating approximately 5,000 COSMIC-2 RO profiles into its global NWP system.
To incorporate additional GNSS RO observations into the NCEP NWP system, NOAA began planning commercial RO procurement in 2016. In addition to nationally funded missions such as COSMIC-2 and the MetOp series, commercial RO observations are provided by CubeSat constellations (e.g., Spire) and SmallSat constellations (e.g., PlanetiQ). From 2016 to 2019, NOAA conducted two pilot studies under the Commercial Weather Data Program (CWDP), acquiring RO data from GeoOptics and Spire Global. Based on these studies, NOAA initiated the Radio Occultation Data Buy (RODB) delivery orders. As of August 2026, NOAA purchases up to 10,000 RO profiles per day—7000 from PlanetiQ and 3000 from Spire—under RODB-2 (Table 1 and Figure 1). Table 1 summarizes the commercial RO data examined during the pilot studies and RODB delivery periods. NOAA began purchasing PlanetiQ RO data under RODB-1 and continued these purchases under RODB-2.
However, commercial and nationally funded missions differ in orbital and viewing geometry, which may affect the antenna gain pattern and lead to differences in measurement uncertainty (i.e., signal-to-noise ratio (SNR)) and, in turn, retrieval uncertainty. These differences have raised concerns within the RO community about whether commercial-mission data quality differs from that of nationally funded missions and whether these differences present additional challenges for using GNSS RO data in NWP and atmospheric applications. The primary questions are:
- (1)
- What evaluation pathway can we use to examine the current heterogeneous multiple RO missions, from viewing geometry and signal sampling through SNR, tracking, penetration, and retrieval bias?
- (2)
- Under what conditions do commercial and partner-mission observations provide usable and complementary information for global and regional NWP?
- (3)
- What additional consistency, uncertainty, and stewardship requirements apply to the use of multi-mission RO observations for environmental monitoring and climate records?
In this review, we use the evaluation framework in Figure 2 to compare the performance of commercial RO data with that from national missions. Previous studies have addressed individual components of the evaluation framework. For example, commercial-mission evaluations indicate that SNR, receiver characteristics, occultation geometry, atmospheric conditions, and processing choices jointly affect penetration and retrieval statistics, although their individual contributions are rarely isolated [8,10,11,12,13,14,15]. Data-assimilation experiments also show that commercial observations can improve global and regional forecasts when the observations pass quality control, complement the existing observing system, and are assigned appropriate observation errors and forward operators [16,17,18,19,20]. For environmental monitoring and climate applications, however, short-term retrieval agreement alone is insufficient. These applications also require common processing, intermission overlap, sampling correction, structural-uncertainty characterization, version control, and sustained data stewardship [4,21,22,23]. Thus, the literature provides substantial evidence for individual links in the observing chain but does not yet provide a unified, cross-mission basis for consistently addressing all three questions above.
NOAA/NESDIS established a GNSS RO program at the Center for Satellite Applications and Research (STAR) around 2018 to support operational processing, global environmental monitoring, and NWP. STAR has used this evaluation pathway to examine the measurement characteristics and retrieval quality of COSMIC-2 and other RO missions [9,24,25,26,27,28,29]. STAR also evaluated their impact on Atlantic hurricane forecasts [17,29]. We also developed independent capabilities for excess-phase-to-bending-angle and refractivity processing and one-dimensional variational retrievals [9,15,30,31]. These activities provide NOAA/STAR with a basis for examining the three questions above for commercial GNSS RO data.
This article is a selective narrative review, not a systematic review. It synthesizes peer-reviewed studies together with clearly identified operational, technical, and conference evidence available through August 2026. In this study, we emphasize neutral-atmosphere observations evaluated or processed by NOAA/STAR, along with complementary results from other centers. We interpret each line of evidence according to the quantity evaluated: signal characteristics, retrieval quality, quality-controlled usable yield, sampling complementarity, or application impact. Conclusions are restricted to the reported missions, periods, processing chains, and applications.
Our review is organized into five linked evaluation levels: (1) mission and signal characteristics; (2) retrieval quality and uncertainty; (3) quality-controlled usable yield; (4) spatiotemporal sampling complementarity; and (5) application-specific value. Level 5 branches into operational NWP and environmental or climate applications because these uses require different evidentiary standards. Section 2 reviews observation characteristics from mission design through retrieval uncertainty. Section 3 assesses global NWP and tropical-cyclone applications; Bai et al. [32] provide complementary context in their recent review of tropical-cyclone assimilation. Section 4 examines environmental and climate applications. Section 5 identifies remaining challenges and testable priorities, and Section 5 presents the conclusions.
2. Review of Observation Characteristics: From Mission Design to Retrieval Uncertainty
In this section, we reviewed commercial RO data characteristics (the first 5 columns of Figure 2) and compared them with those from national missions.
2.1. Mission Coverage, Antenna Design, and Viewing Geometry
2.1.1. Global and Local-Time Coverage
Mission orbits determine the spatial and temporal coverage of RO observations. Except for COSMIC-2, Spire, PlanetiQ, and most other RO missions use sun-synchronous orbits that sample specific local times. Figure 3 shows the spatial and hourly local-time distributions of RO sample counts in 5° latitude bins for Spire, COSMIC-2, and PlanetiQ. Because most Spire and PlanetiQ satellites operate at high inclinations, these two missions, together with MetOp, provide coverage from nearly 90°S to 90°N. Spire observations mainly cover 02–03, 09–10, 14–15, and 21–22 local time, whereas PlanetiQ observations cover 01–04, 09–10, and 21–22 local time.
Unlike PlanetiQ and Spire, the six-satellite COSMIC-2 constellation has an inclination of approximately 24° and samples most local times in the tropics and midlatitudes. Each COSMIC-2 satellite has one forward-looking and one backward-looking antenna, with viewing directions of 0° and 180°, respectively, relative to the flight direction. Consequently, COSMIC-2 observations outside 24°S–24°N are collected at larger antenna zenith angles, which are associated with lower SNR, as discussed below. COSMIC-2 observations are concentrated between 45°S and 45°N, and more than 70% occur within 24°S–24°N.
2.1.2. SNR Distribution and Its Relationship to Viewing Geometry
Here, SNR is defined as the magnitude of the RO signal divided by the receiver noise level and is expressed in voltage-to-voltage units (V/V). The magnitude and distribution of SNR depend on GNSS transmitter power, receiver intermediate-frequency bandwidth, RO antenna design and gain pattern, viewing geometry, and occultation azimuth relative to true north [8]. These mission- and processing-dependent factors must be considered when comparing SNR distributions.
Consistent with its larger antenna and higher gain, Figure 4 shows that COSMIC-2 L1 SNR is approximately 2–3 times that of Spire. In this comparison, PlanetiQ SNR is comparable to COSMIC-2 SNR.
Table 2 shows that COSMIC-2 and PlanetiQ use higher signal sampling rates than Spire and MetOp. COSMIC-2 and PlanetiQ generally sample at 100 Hz, whereas Spire and MetOp sample at 50 Hz; PlanetiQ Galileo data are sampled at 125 Hz. However, signal sampling rate alone does not determine the atmospheric structure resolved in a retrieved profile; receiver bandwidth, tracking, smoothing, wave-optics processing, and vertical sampling also contribute. Table 2 summarizes the receivers, RO antennas, tracked GNSS constellations, signal sampling rates, and Precise Orbit Determination (POD) antenna characteristics for the missions examined.
Although COSMIC-2 has a higher mean SNR than Spire, its SNR distribution depends strongly on viewing geometry. Unlike nadir-viewing infrared and microwave sounders, GNSS RO missions observe limb signals through dedicated forward- and backward-looking antennas. COSMIC-2 uses a 3 × 4 phased-array helical antenna design to enhance tropical SNR coverage [33]. Each flight module carries two Tri-GNSS Radio Occultation System (TGRS) RO antennas: a forward-looking antenna (+X; approximately 23°–66°) and a backward-looking antenna (−X; approximately 115°–158°). The sample distributions peak near 24° and 157° for the forward- and backward-looking antennas, respectively.
The latitudinal distribution of COSMIC-2 SNR is closely associated with its antenna viewing geometry. Figure 5a and Figure 5b show the COSMIC-2 antenna zenith angle and corresponding SNR. Given its low inclination, COSMIC-2 has the highest mean SNR near 24°S and 24°N. Mean SNR decreases toward the equator and the outer limits of the latitude coverage as antenna zenith angle increases. For the distributions shown, antenna zenith angle is strongly negatively correlated with SNR, with correlation coefficients of −0.97, −0.92, −0.91, −0.91, and −0.94 for 45°S–30°S, 30°S–10°S, 10°S–10°N, 10°N–30°N, and 30°N–45°N, respectively. Figure 5c and Figure 5d show the corresponding Spire antenna zenith-angle and SNR distributions. These correlations provide strong evidence of an observed association between viewing geometry and SNR.
2.2. Penetration Depth, Precision, and Uncertainty Among Missions
2.2.1. Relationship Between SNR and RO Penetration Depth
Penetration depth is also an indicator of GNSS RO data quality [6,8,34]. The cited studies indicate that, across missions, antenna design and viewing geometry influence the magnitude and distribution of SNR, which in turn are associated with RO penetration and data quality. COSMIC-2 SNR is lower in the midlatitudes and higher in 10°N–30°N and 10°S–30°S (Figure 5b), whereas the Spire and PlanetiQ SNR distributions (not shown) are more spatially uniform. Schreiner et al. [34] and Ho et al. [6,8] found that the lowest RO tracking penetration height is usually associated with SNR and atmospheric dryness. Figure 6a–c show the lowest monthly mean penetration height in each 5° × 5° grid for COSMIC-2, Spire, and PlanetiQ. Table 3 summarizes the lowest penetration height corresponding to 80% of the profiles for each mission and latitude zone.
Figure 6 and Table 3 indicate that RO observations generally penetrate deeper in drier atmospheres and that the relationship between SNR and penetration varies with latitude and mission. COSMIC-2 penetrates slightly lower than Spire in some subtropical zones. At tropical latitudes and near the outer limits of COSMIC-2 coverage, however, Spire and PlanetiQ penetrate lower than COSMIC-2, consistent with the latitude-dependent COSMIC-2 SNR distribution. Accordingly, higher mission-mean SNR does not ensure uniformly deeper penetration at all latitudes.
2.2.2. Precision in the Neutral Atmosphere Among RO Missions
Several studies [6,8,27] used coplanar profile pairs from the same mission but different receivers to assess whether higher SNR is associated with improved RO precision from the surface to the UTLS. At the same latitude, the lower inclination of COSMIC-2 is associated with longer ray paths through tropical regions than for COSMIC-1, Spire, and PlanetiQ. The standard deviation of COSMIC-2 coplanar pairs is larger than that of COSMIC-1–COSMIC-1 and Spire–Spire pairs (Figure 7c), especially in the lower troposphere.
In the UTLS and above 25 km, however, the higher-SNR COSMIC-2 observations have slightly smaller coplanar-pair standard deviations than COSMIC-1 and Spire. Available studies indicate that although Spire has lower SNR than COSMIC-2, its penetration, precision, accuracy, and uncertainty are comparable to those of higher-SNR missions, including COSMIC-2 and PlanetiQ [8,35,36].
2.3. Relationship Between Higher SNR and Lower-Tropospheric Retrievals
To examine the relationship between SNR and COSMIC-2 retrievals, Figure 8 shows fractional bending-angle departures from ERA5, defined as 100 × (COSMIC-2 − ERA5)/ERA5, for different L1 SNR groups and heights above mean sea level. The SNR-dependent pattern occurs mainly below 5 km. Below 2 km, the lower-SNR groups have more negative departures than the groups with SNR above 1500 V/V. These negative departures are consistent with super-refraction and other moist lower-tropospheric retrieval limitations. A similar SNR-dependent pattern is found for PlanetiQ but is not shown.
Several studies [8,36] indicate that Spire and PlanetiQ retrievals are broadly consistent with COSMIC-2. SNR is a useful indicator of signal tracking and penetration, especially when interpreted together with atmospheric dryness and viewing geometry. However, higher SNR alone does not resolve water-vapor variability along the ray path, departures from spherical symmetry, turbulence, multipath, and processing-related effects. Consequently, higher-SNR observations do not necessarily have smaller lower-tropospheric retrieval biases or uncertainties [7,8,37].
In summary, the reviewed comparisons in Section 2 show that higher SNR generally improves tracking and lower-tropospheric penetration, but does not by itself remove biases and uncertainties arising from atmospheric conditions like water-vapor irregularity, multipath tracking, and super-refraction. Spire and PlanetiQ retrievals are broadly compatible with COSMIC-2 and partner missions in the principal atmospheric layers. In addition, antenna gain and viewing geometry affect SNR, supporting signal tracking and penetration. However, transmitter power, receiver bandwidth, atmospheric moisture structure, and ray-path geometry also play a role.
3. Review of Commercial RO Applications in Weather Forecasting
This section reviews the effects of assimilating commercial RO observations using three complementary results: Forecast Sensitivity to Observation Impact (FSOI), observing-system experiments (OSEs), and regional tropical-cyclone studies. It also summarizes results obtained using the Ensemble of Data Assimilations approach [35,38]. Because Spire observations have been evaluated over a longer period than PlanetiQ observations, the published evidence reviewed here is weighted toward Spire.
3.1. Commercial RO Data Assimilation Impacts on Global NWP
3.1.1. Forecast Sensitivity to Observation Impact Studies
Although Spire uses a smaller antenna and generally has lower SNR than COSMIC-2, its bending-angle accuracy is broadly comparable in the principal assimilation layers [8]. Forecast Sensitivity to Observation Impact (FSOI) is an adjoint-based diagnostic that quantifies the contribution of assimilated observations to a 24-h forecast-error metric [39,40,41]. In the ECMWF system, the relative FSOI contribution of GNSS RO increased after COSMIC-2 was assimilated and increased further after approximately 5000 Spire profiles per day were added (Figure 9; see [42]). FSOI percentages depend on the observing system, evaluation period, forecast-error norm, data volume, and normalization. Therefore, the results indicate the incremental value of additional RO coverage rather than establishing a universal ranking of observation types.
3.1.2. Observing System Experiments Evaluating RO Data
Global NWP centers began assimilating COSMIC-2 data in late 2019 and early 2020 [43,44]. Many studies have used OSEs to assess the impact of assimilated RO data on global weather forecasts by comparing forecast errors across cycled DA experiments that turn assimilation of selected observation datasets on and off. For example, NCEP reported that quality controls (QCs) in its global NWP model reject most RO data below 700–800 hPa. Evaluations of NCEP’s current Global Forecast System (GFS) indicate that assimilating COSMIC-2 primarily affects the upper troposphere and lower stratosphere, consistent with earlier findings for COSMIC-1.
Several global operational centers conducted DA experiments to assess whether Spire RO data provide information beyond other RO missions and improve NWP. Bowler [16] evaluated innovation statistics and forecast impacts from Spire GNSS RO bending angles assimilated in the UK Met Office (UKMET) global model from September to December 2019. The Control run assimilated operational RO bending angles, mostly from MetOp; COSMIC-2 assimilation had not yet been implemented. The Spire experiment assimilated a dataset approximately 2.5 times larger than the MetOp dataset. The experiment produced statistically significant root-mean-square-deviation (RMSD) reductions relative to ECMWF analyses for most forecast times, meteorological fields, and height layers evaluated in the Northern Hemisphere, Southern Hemisphere, and tropics. Bowler [16] also varied the number of assimilated Spire observations and found that the overall forecast RMSD reduction across a range of variables, verified against both ECMWF analyses and observations, was roughly proportional to the logarithm of the total number of assimilated GNSS RO observations. This result is consistent with Harnisch et al. [45].
Lonitz et al. [38] evaluated the effects of assimilating COSMIC-2 bending angles, with and without additional Spire RO data, on ECMWF and UKMET global forecasts from January 1 to March 31, 2020. COSMIC-2 DA improved ECMWF and UKMET forecasts of temperature, humidity, and wind. In these experiments, adding Spire observations to COSMIC-2 further improved these fields in certain regions. Substantial improvements occurred in upper-tropospheric temperature, where RO data have the lowest uncertainty [46]. For example, assimilating COSMIC-2 and Spire observations improved UKMET forecast-temperature fits to tropical radiosondes by approximately 15% relative to a Control that withheld both observation sets.
Together, these studies indicate that commercial Spire observations can improve global and regional NWP when they supplement other assimilated RO missions. The magnitude of the benefit depends on the number and distribution of assimilated profiles, quality control, observation-error specification, forward operator, model system, verification reference, region, and forecast variable. Thus, the results support the incremental value of additional commercial RO observations rather than a universal ranking of missions.
3.2. Impacts of Spire and ROMEX Data Assimilation on Tropical Cyclone Forecasts
Tropical cyclone (TC) genesis and intensification can be strongly sensitive to lower- to mid-tropospheric water vapor near the storm [47,48,49,50]. With their all-sky observability and fine vertical resolution—typically sub-kilometer but dependent on variable altitude sampling and retrieval processing—GNSS RO profiles can provide useful water-vapor information for NWP model TC forecasts [1,3,51]. Teng et al. [52] compared WRF forecasts of 32 western North Pacific TC precursor disturbances from 2019, initialized after 72 h of cycled DA in two configurations: “GTS,” which assimilated only conventional observations, and “EPH,” which also assimilated GNSS RO refractivity, mostly from COSMIC-2, using a nonlocal forward operator. In these experiments, cycled RO DA improved TC cyclogenesis detection in WRF, with 19% higher accuracy for the 9 cases that developed into TCs and a 20% lower false-alarm rate for the 23 observed non-developing cases.
Compared with GTS, EPH produced stronger lower-tropospheric cyclonic vorticity for developing cases and weaker vorticity for non-developing cases (Figure 10a and Figure 10c). These differences are consistent with the interpretation that the water vapor and temperature information from COSMIC-2 RO observations assimilated in EPH improved WRF’s low-level wind representation through dynamical coupling during the 72-h cycled DA spin-up. Chen et al. [53] showed a similar result when evaluating COSMIC-1 observation assimilation in a regional model. Consistent with previous COSMIC-1 DA impact studies [50,53,54], COSMIC-2 assimilation also increased water vapor in a deep layer near developing TC disturbances in the WRF initial conditions and forecasts (Figure 10b).
Miller et al. [17] conducted data-denial experiments using four 2022 Atlantic hurricanes to evaluate the impact of assimilating Spire bending angle data in HWRF. The Control forecasts withheld COSMIC-2 and Spire, whereas the C2 and C2Spire experiments added COSMIC-2 alone and COSMIC-2 plus Spire, respectively. Although COSMIC-2 assimilation helped reduce Control’s minimum central sea-level pressure (PMIN) over-intensification bias in medium-to-long range forecasts, adding the Spire data led to a more substantial ~15- 35% PMIN bias improvement (Figure 11). Short-range C2Spire temperature and specific-humidity RMSDs against dropsondes were 5%–10% smaller compared to Control. These results indicate a beneficial incremental Spire impact for the cases examined, although the four-storm sample limits broader generalization.
Miller et al. [20] evaluated the impact of assimilating EUMETSAT-processed commercial GNSS RO bending-angle observations in Hurricane Analysis and Forecasting System (HAFS) forecasts of four 2022 Atlantic hurricanes. Their study supported the multi-center Radio Occultation Modeling Experiment (ROMEX) [35], which investigated the effects of assimilating a large commercial RO observation dataset on forecasts from major operational centers worldwide. The ROMEX dataset included approximately 17,000 Spire and 3,000 PlanetiQ RO bending angles per day globally. Miller et al. [20] found that, compared with a Control that assimilated COSMIC-2 and other operational RO platforms, a ROMEX configuration that additionally assimilated Spire and PlanetiQ reduced average TC PMIN intensity errors by about 10% during the first 30 forecast hours. The ROMEX-assimilating experiment also produced a statistically significant reduction in HAFS medium-range forecast specific-humidity RMSD relative to ERA5 in the 900–500 hPa layer (Figure 12).
3.3. Observation-Error Estimates and Lower-Tropospheric Use
The effective use of observations in data assimilation depends on an appropriate observation-error matrix, which controls the relative weighting of observations and the model background. For RO bending angles, the effective error includes instrument and retrieval uncertainty, forward-operator error, atmospheric representativeness, and reference or background error. These components vary with altitude, atmospheric water-vapor structure, viewing geometry, processing, and NWP-model resolution.
Recent approaches estimate profile- or regime-dependent RO uncertainty from observation and environmental diagnostics and use bending-angle uncertainty or local spectral width to support more adaptive quality control and error weighting [55,56,57].
Figure 13a shows the altitude-dependent bending-angle observation errors used by ECMWF. Expressing the error as a percentage of observed bending angle yields larger specified absolute errors in the moist lower troposphere, where bending angles are larger. However, this specification does not explicitly represent horizontal water-vapor gradients or mission-dependent retrieval uncertainty. Figure 13b and Figure 13c show COSMIC-2 bending-angle uncertainty estimated with the three-cornered-hat method using ERA5 and MERRA-2 as comparison datasets [58,59,60]. The diagnosed uncertainty is larger in latitude bands with greater lower-tropospheric water-vapor inhomogeneity. These estimates combine observation, comparison-data, and representativeness effects and depend on the assumptions of the three-cornered-hat method. More complete observation-error models should account for atmospheric structure, retrieval uncertainty, vertical error correlation, and forward-operator limitations.
In summary, the reviewed FSOI, global OSE, and regional tropical cyclone DA impact experiment results consistently indicate that additional commercial RO profiles can provide incremental forecast value. The OSE impact depends on accepted profile volume, geographic and local-time distribution, quality control, and observation-error specification. The lower troposphere remains one of the most challenging areas among GNSS RO applications.
4. Review of Environmental and Climate Applications
Consistently processed products from multiple RO missions available since 2006 support nearly two decades of environmental monitoring. Section 4.1 summarizes event-scale atmospheric applications, whereas Section 4.2, Section 4.3 and Section 4.4 review the distinct consistency requirements for upper-troposphere and lower-stratosphere (UTLS) temperature, tropospheric water-vapor variability and trends, and planetary-boundary-layer height records.
4.1. Detecting Atmospheric Variations Using RO Data
GNSS RO provides high-resolution, all-weather observations of the neutral atmosphere and is well suited to detecting vertically localized atmospheric variations [1,3]. The literature reviewed by Ho et al. [7] and Bonafoni et al. [61] includes gravity waves, tropical tides, cloud-related structures, extreme events, and UTLS temperature perturbations. These studies illustrate the value of RO as a vertically resolved complement to passive infrared and microwave observations rather than as a replacement.
With improved spatial and temporal coverage from recently available RO missions (Figure 1 and Figure 3), Babu and Liou [62] demonstrated that RO profiles can detect UTLS temperature anomalies caused by volcanic eruptions. By combining Microwave Limb Sounder (MLS) water-vapor measurements with collocated RO data, Randel et al. [63] identified water-vapor overshooting into the UTLS due to a volcanic eruption. These studies indicate that combining RO data with infrared and microwave satellite measurements can provide atmospheric information not available from the individual datasets.
4.2. Construction of a UTLS Temperature Environmental Data Record from Consistently Processed Multi-Mission RO Data
Many studies have assessed the consistency and long-term stability of RO observations and indicate that RO records can be used to estimate climate trends in the UTLS [3,4,7,64,65,66]. GNSS RO has also been widely used to estimate upper-air temperature trends, with evaluations against infrared and microwave soundings and several model systems [67,68,69,70,71,72,73]. A long-term monthly zonal-mean record is important for climate monitoring and intercomparison among data sources.
Several RO processing centers have applied consistent processing to construct long-term RO climatologies. For example, the RO Meteorology Satellite Application Facility (ROM SAF) generated a multi-mission environmental data record from MetOp, COSMIC-1, CHAMP, and GRACE, covering 2001–2016 [71]. Additionally, the STAR GNSS RO Science Data Center (SDC, https://gpsmet.umd.edu/gnssro/index.php) has used a reconfigured ROPP (STAR ROPP; see STAR-ROPP ATBD V1.0 at ) to process data from multiple RO missions since 2006. These products were validated against results from the STAR Full Spectrum Inversion (FSI) algorithm [28,30,74]. Using consistently processed RO data, the STAR SDC developed a UTLS temperature environmental data record spanning September 2006–July 2023 [22]. https://gpsmet.umd.edu/star_gnssro/img/ATBD_STAR_ROPP_final.pdf
Before combining RO missions into an environmental data record, their consistency and long-term stability must be assessed. Figure 14 compares collocated COSMIC-1, COSMIC-2, and Spire temperatures with MetOp-A/-B/-C in the 20–30 km layer [22]. MetOp has the longest common mission record in this comparison and is used as the reference. The median and central 68% range characterize the differences. This comparison assesses inter-mission consistency and does not treat MetOp as error-free.
Figure 14 shows the seasonal structure of differences between COSMIC-2 and MetOp GRAS temperatures in the 20–30 km layer, particularly in the COSMIC-2 midlatitude domains (45°N–20°N and 20°S–45°S). Both the mean temperature difference and the standard deviation for COSMIC-2–MetOp pairs increase with altitude from 15 to 30 km (Figure 15).
Because the COSMIC-2–MetOp differences have seasonal and height-dependent structure, COSMIC-2 was excluded from the STAR-ROPP multi-mission environmental data record examined by Zhou et al. [22]. This decision illustrates that a mission may be valuable for NWP but require further consistency assessment before inclusion in a long-term climate record. Figure 16 compares vertical temperature trends from the STAR-ROPP record with those from ERA5, JRA-55, and MERRA-2; the records generally have similar vertical trend structures.
4.3. Tropospheric Water-Vapor Variability and Trends from COSMIC-1 RO
GNSS RO water-vapor products are retrieved by separating the dry-air and water-vapor contributions to refractivity using a priori atmospheric information. Shao et al. [75] evaluated UCAR COSMIC-1 WETPrf retrievals against collocated ERA5 water vapor at 300, 500, and 850 hPa from 2007 to 2018. The two datasets generally agreed in their large-scale spatial and temporal variability; COSMIC-1 was slightly drier than ERA5 at 500 and 850 hPa and had regional and latitude-dependent differences.
Using sampling-error-adjusted time series, Shao et al. [75] reported positive global COSMIC-1 water-vapor trends of 3.47 ± 1.77, 3.25 ± 1.25, and 2.03 ± 0.65% decade−1 at 300, 500, and 850 hPa, respectively. Regional differences between COSMIC-1 and ERA5 were larger in some tropical and subtropical areas, especially at 850 hPa in convection- and stratocumulus-affected regions. These results indicate that RO-derived water-vapor records can complement reanalyses by resolving vertical and regional variability. However, climate interpretation requires a consistent retrieval configuration, explicit control of changing sampling, attention to lower-tropospheric super-refraction and background dependence, and independent comparison [75].
4.4. Monitoring PBLH Variations Using Multi-Mission RO Data
Studies [76,77,78] indicate that high-resolution profiles from multiple RO missions provide consistent PBL-height estimates. Figure 17 compares gridded COSMIC-2 and Spire PBLH over three marine stratocumulus regions during June–August 2022. RO PBLH estimates have also been compared with radiosonde, lidar, CALIOP, and reanalysis estimates [78,79,80,81,82]. The COSMIC-2–Spire agreement provides evidence of cross-mission consistency for the examined period and regions; however, constructing a climate-quality record also requires long-term stability, sampling correction, and independent validation.
In summary, the reviewed applications indicate that a common retrieval chain can reveal coherent temperature, moisture, and boundary-layer variability across missions. However, careful inter-mission stability assessment, sampling correction, and mission-specific uncertainty characterization are required before combining all RO missions into a climate data record.
5. Remaining Challenges and Research Outlook
5.1. Adaptive Processing Cutoffs and Retention of Lower-Atmospheric Information
The cutoff height for GNSS RO excess-phase processing determines how much lower-atmospheric signal is retained for bending-angle and refractivity retrievals. SNR generally decreases as the signal traverses denser atmospheric layers, but a low-SNR threshold alone cannot distinguish recoverable lower-atmospheric information from noise or multipath. The appropriate cutoff also depends on receiver sensitivity, mission altitude, viewing geometry, atmospheric conditions, sampling, and processing.
The research need is to develop an adaptive, mission-aware balance between retaining lower-atmospheric information and limiting retrieval noise and bias. Impact-parameter filtering can reduce inversion noise but may remove useful subsignals with larger bending angles [83,84], whereas empirical approaches can relate cutoff selection to observed SNR and bending-angle noise [85]. Operational Sentinel-6A assessments further indicate that cutoff strategy and processor changes can materially alter tropospheric data retention [86]. Future evaluations should compare alternative cutoff strategies using common reference data, matched atmospheric regimes, and downstream NWP or PBL metrics rather than judge them only by the number of profiles that penetrate to a specified height.
STAR uses the Full Spectrum Inversion method to retrieve bending-angle and refractivity profiles [28,30,74]. Applying this capability across missions provides a controlled basis for separating receiver and sampling differences from processing effects. Inter-center comparisons indicate that retrieval-algorithm choices can affect lower-tropospheric refractivity and penetration [87]. Matched tests are therefore needed to determine whether a cutoff strategy preserves useful lower-tropospheric information without increasing bias or uncertainty.
5.2. Water-Vapor Retrievals Under Super-Refraction and Ducting
Despite successful RO-based PBL-height detection in many regions, accurate retrieval of lower-tropospheric thermal and moisture structure remains challenging because super-refraction and ducting can produce negative refractivity biases, especially over the subtropical eastern oceans [85,88,89,90,91]. Proposed correction strategies use collocated precipitable-water information from microwave radiometers [92] or grazing signals from the same RO event [93]. Further evaluation is needed to assess not only individual corrections but also their robustness across missions, viewing geometries, atmospheric regimes, and processing systems, using independent validation and explicit uncertainty estimates.
5.3. Uncertainty-Aware Quality Control and Observation-Error Models
Large background departures may reflect observation error, forward-operator limitations, atmospheric representativeness, or model error. In super-refractive layers, where the vertical refractivity gradient exceeds the critical magnitude, conventional Abel inversion becomes nonunique [94]. Current systems use background refractivity gradients and other quality-control procedures to identify affected observations, but this treatment can reject potentially useful information below and near the PBL. A priority is to move from largely altitude- and platform-based error specifications toward uncertainty-aware weighting that also reflects atmospheric structure, viewing geometry, retrieval diagnostics such as LSW or DBAOE, vertical error correlation, and forward-operator limitations. Such models must be calibrated and tested within data-assimilation systems rather than inferred solely from departures from one reference.
5.4. Multi-Mission Climate Continuity, Reprocessing, and Stewardship
Long-term records face a different risk: changes in mission mix, sampling, receiver characteristics, or processing can appear as geophysical change. The review therefore supports sustained reprocessing with a common algorithmic framework, routine overlap comparisons, and mission-specific stability monitoring. Inter-mission differences should be evaluated as functions of height, latitude, season, local time, and relevant viewing geometry before a mission transition is included in a climate record.
A climate-ready archive also requires reproducible processing, retained quality-control and uncertainty metadata, transparent versioning, and periodic comparison with independent observations and reanalyses. Uncertainty must be propagated from individual profiles through sampling and aggregation to gridded atmospheric fields [23]. These practices link operational stewardship with scientific traceability and allow future reprocessing when improved retrieval algorithms become available.
5.5. NOAA Readiness for an Operational Expanding Multi-Mission Observing System
Like other satellite observations, NESDIS supports GNSS RO through operational processing, science development, user support, archiving, and stewardship. The STAR GNSS RO program (https://gpsmet.umd.edu/gnssro/index.php) serves as a science and data center for NESDIS in-house processing, enterprise algorithm development, and applications. Its independent inversion packages and routinely processed products provide both an operational capability and a reference pathway for cross-mission evaluation (Table 4; https://gpsmet.umd.edu/gnssro/download.php).
NOAA has committed to the continued purchase of commercial GNSS RO data. In September 2025, NOAA NESDIS CDP announced the purchase of 10,000 GNSS RO profiles and 2,500 TEC ionospheric measurements per day, with unlimited data rights, to support weather forecasting and space-weather applications. Over the next 5–10 years, additional GNSS RO and GNSS reflectometry sensors, together with more signals from GPS III, Galileo, Beidou, GLONASS, IRNSS, QZSS, and other systems, will expand the volume and heterogeneity of available observations. Operational readiness will therefore depend on scalable processing, automated quality monitoring, traceable metadata, and rapid mission-to-mission intercomparison.
Current missions have led to follow-on systems, including EUMETSAT MetOp Second Generation, Sentinel-6B, PlanetiQ GNOMES, new Spire missions, and the YunYao, Fengyun-3, and Tianmu series. These systems increase the number of receivers, tracked GNSS signals, sampling patterns, and processing requirements. NOAA also plans future satellite systems [95]. The central design question is how to balance per-profile measurement quality, observation volume, geographic and local-time coverage, latency, processing consistency, and long-term continuity across this mixed architecture.
5.6. Priorities for the Next Phase
The preceding review identifies five linked priorities. Table 5 frames them as testable questions and evaluation criteria so that future mission, processing, and application studies can be compared on a common basis. Each priority targets an intervening link in the pathway and is evaluated by its effect on retrieval quality, usable yield, or application value.
6. Conclusions
This review supports evaluating multi-mission GNSS RO as an observing system rather than as a set of missions ranked by a single instrument metric. The evidence supports an evaluation pathway in which antenna design, orbit, viewing geometry, signal sampling, and SNR relate to tracking and penetration; atmospheric structure and processing contribute to retrieval bias and uncertainty; retrieval quality and quality control determine usable yield; and usable yield and sampling complementarity influence application value. The reviewed comparisons show that higher SNR generally improves tracking and lower-tropospheric penetration but does not by itself remove biases and uncertainty arising from water-vapor irregularity, multipath, super-refraction, departures from spherical symmetry, or processing choices.
Current results indicate that commercial Spire and PlanetiQ observations are broadly compatible with COSMIC-2 and partner missions in the atmospheric layers and that their additional sampling can benefit global and regional NWP. Consistently processed multi-mission observations also support UTLS temperature records, tropospheric water-vapor variability and trend analyses, and PBL-height estimates.
The next phase should prioritize adaptive lower-atmospheric processing, improved treatment of super-refraction, uncertainty-aware quality control and observation-error models, sustained common reprocessing and intercomparison, and observing-system design that jointly considers quality, volume, coverage, latency, and continuity. This evaluation pathway framework offers a practical basis for NOAA/STAR and the wider GNSS RO community to evaluate new commercial and partner missions without conflating signal strength, retrieval performance, and scientific or operational value.
Author Contributions
All authors contributed to the preparation, review, and editing of the manuscript. All authors have read and agreed to the published version of the manuscript.
Funding
The contributions of authors affiliated with the Cooperative Institute for Satellite Earth System Studies at the University of Maryland/ESSIC were supported by the National Oceanic and Atmospheric Administration under grant NA19NES4320002.
Data Availability Statement
The STAR GNSS RO program processed dry-temperature profiles from multiple GNSS RO missions; these products are publicly available at https://gpsmet.umd.edu/gnssro/download.php. The ROM SAF environmental data record is available at https://preop.romsaf.org/product_archive.php. ERA5 data are available at https://cds.climate.copernicus.eu/datasets/reanalysis-era5-pressure-levels. UCAR data are available at https://cdaac-www.cosmic.ucar.edu/cdaac/products.html. The HWRF simulation datasets and software used in the cited STAR studies are stored on NOAA research and development high-performance computing systems and University of Maryland Linux servers and are available upon request.
Conflicts of Interest
The authors declare no conflicts of interest.
Generative AI Disclosure
Generative AI tools were used to improve clarity, correct grammatical errors, and format the references.
References
- Anthes, R. A.; et al. The COSMIC/FORMOSAT-3 Mission: Early Results. Bull. Am. Meteorol. Soc. 2008, 89, 313–334. [Google Scholar] [CrossRef]
- Anthes, R. A. Exploring Earth’s Atmosphere with Radio Occultation: Contributions to Weather, Climate, and Space Weather. Atmos. Meas. Tech. 2011, 4, 1077–1103. [Google Scholar] [CrossRef]
- Ho, S.-P.; Anthes, R. A.; Ao, C. O.; Healy, S.; Horányi, A.; Hunt, D.; Mannucci, A. J.; Pedatella, N.; Randel, W. J.; Simmons, A.; Steiner, A.; Xie, F.; Yue, X.; Zeng, Z. The COSMIC/FORMOSAT-3 Radio Occultation Mission after 12 Years: Accomplishments, Remaining Challenges, and Potential Impacts of COSMIC-2. Bull. Am. Meteorol. Soc. 2020, 101, E1107–E1136. [Google Scholar] [CrossRef]
- Steiner, A. K.; Ladstädter, F.; Ao, C. O.; Gleisner, H.; Ho, S.-P.; et al. Consistency and Structural Uncertainty of Multi-Mission GPS Radio Occultation Records. Atmos. Meas. Tech. 2020, 13, 2547–2575. [Google Scholar] [CrossRef]
- Scherllin-Pirscher, B.; et al. Tropical Temperature Variability in the UTLS: New Insights from GPS Radio Occultation Observations. J. Clim. 2021, 34, 2813–2838. [Google Scholar] [CrossRef]
- Ho, S.-P.; Zhou, X.; Shao, X.; Zhang, B.; Adhikari, L.; Kireev, S.; He, Y.; Yoe, J. G.; Xia-Serafino, W.; Lynch, E. Initial Assessment of the COSMIC-2/FORMOSAT-7 Neutral Atmosphere Data Quality in NESDIS/STAR using in situ and satellite data. Remote Sens. 2020, 12, 4099. [Google Scholar] [CrossRef]
- Ho, S.-P.; Pedatella, N.; Foelsche, U.; Healy, S.; Weiss, J.-P.; Ullman, R. Using Radio Occultation Data for Atmospheric Numerical Weather Prediction, Climate Sciences, and Ionospheric Studies and Initial Results from COSMIC-2, Commercial RO Data, and Recent RO Missions. Bull. Am. Meteorol. Soc. 2022, 103, E2506–E2512. [Google Scholar] [CrossRef]
- Ho, S.-P.; Zhou, X.; Shao, X.; Chen, Y.; Jing, X.; Miller, W. Using the Commercial GNSS RO Spire Data in the Neutral Atmosphere for Climate and Weather Prediction Studies. Remote Sens. 2023, 15, 4836. [Google Scholar] [CrossRef]
- Ho, S.-P.; Kireev, S.; Shao, X.; Zhou, X.; Jing, X. Processing and Validation of the STAR COSMIC-2 Temperature and Water Vapor Profiles in the Neutral Atmosphere. Remote Sens. 2022, 14, 5588. [Google Scholar] [CrossRef]
- Chang, H.; Lee, J.; Yoon, H.; Morton, Y.J.; Saltman, A. Performance Assessment of Radio Occultation Data from GeoOptics by Comparing with COSMIC Data. Earth Planets Space 2022, 74, 108. [Google Scholar] [CrossRef]
- Qiu, C.; Wang, X.; Zhou, K.; Zhang, J.; Chen, Y.; Li, H.; Liu, D.; Yuan, H. Comparative Assessment of Spire and COSMIC-2 Radio Occultation Data Quality. Remote Sens. 2023, 15, 5082. [Google Scholar] [CrossRef]
- Zhran, M.; Mousa, A.; Wang, Y.; Hasher, F.F.B.; Jin, S. Assessment of Commercial GNSS Radio Occultation Performance from PlanetiQ Mission. Remote Sens. 2024, 16, 3339. [Google Scholar] [CrossRef]
- Ganeshan, M.; Wu, D.L.; Santanello, J.A.; Gong, J.; Ao, C.; Vergados, P.; Nelson, K.J. Exploring Commercial Global Navigation Satellite System (GNSS) Radio Occultation (RO) Products for Planetary Boundary Layer Studies in the Arctic. Atmos. Meas. Tech. 2025, 18, 1389–1403. [Google Scholar] [CrossRef]
- Anthes, R.A.; Sjoberg, J.; Starr, J.; Zeng, Z. Evaluation of Biases and Uncertainties in ROMEX Radio Occultation Observations. Atmos. Meas. Tech. 2025, 18, 6997–7019. [Google Scholar] [CrossRef]
- Chen, Y.; Zhou, X.; Jing, X.; Ho, S.-P.; Shao, X.; Liu, T.-C. Processing Multiple GNSS RO Data Using FSI and ROPP: Results from the ROMEX. Atmos. Meas. Tech. 2026, 19, 3781–3800. [Google Scholar] [CrossRef]
- Bowler, N. E. An Assessment of GNSS Radio Occultation Data Produced by Spire. Q. J. R. Meteorol. Soc. 2020, 146, 3772–3788. [Google Scholar] [CrossRef]
- Miller, W.J.; Chen, Y.; Ho, S.-P.; Shao, X. Exploring the Value of Spire GNSS Radio Occultation Bending Angle Assimilation for Improving HWRF Model Forecasts of Atlantic Hurricane Intensity. Weather Forecast. 2025, 40, 809–827. [Google Scholar] [CrossRef]
- Zhang, H.; Shao, H.; Ruston, B.; Braun, J.J. Impact Study of Increased Radio Occultation Observations during the ROMEX Period Using JEDI and the GFS Atmospheric Model. Atmos. Meas. Tech. 2025, 18, 6167–6184. [Google Scholar] [CrossRef]
- Bowler, N.E.; Lewis, O. Experiments with a Large Number of GNSS-RO Observations through the ROMEX Collaboration in the Met Office NWP System. Atmos. Meas. Tech. 2026, 19, 2479–2505. [Google Scholar] [CrossRef]
- Miller, W. J.; Chen, Y.; Ho, S.-P.; Shao, X. How Does Assimilating a Large Commercial GNSS RO Dataset Impact HAFS Hurricane Forecasts? An Evaluation in Support of the ROMEX Experiment. Atmos. Meas. Tech. 2026, 19, 4833–4851. [Google Scholar] [CrossRef]
- Jing, X.; Ho, S.-P.; Shao, X.; Liu, T.-C.; Chen, Y.; Zhou, X. Spire RO Thermal Profiles for Climate Studies: Initial Comparisons of the Measurements from Spire, NOAA-20 ATMS, Radiosonde, and COSMIC-2. Remote Sens. 2023, 15, 3710. [Google Scholar] [CrossRef]
- Zhou, J.; Ho, S.-P.; Zhou, X.; Shao, X.; Gu, G.; Jing, X.; Chen, Y.; et al. Construction of Temperature Climate Data Records in the Upper Troposphere and Lower Stratosphere Using Multiple RO Missions From September 2006 to July 2023 at NESDIS/STAR. J. Geophys. Res. Atmos. 2025, 130, e2024JD041295. [Google Scholar] [CrossRef]
- Scher, S.; Ladstädter, F.; Schwärz, M.; Innerkofler, J.; Kirchengast, G. Uncertainty Propagation from Radio Occultation Profiles to Aggregated Atmospheric Gridded Fields. Earth Space Sci. 2026, 13, e2025EA004389. [Google Scholar] [CrossRef]
- Lin, C.-H.; Yang, S.-C.; Ho, S.-P.; Pedatella, N. M. Introduction to the special issue on Exploring the terrestrial and space weather using an operational radio occultation satellite constellation - A FORMOSAT-7/COSMIC-2 Special Issue after 1 year in orbit. Terr. Atmos. Ocean. Sci. 2021, 32, 921–923. [Google Scholar] [CrossRef]
- Shao, X.; Ho, S.-P.; Zhang, B.; Cao, C. Y.; Chen, Y. Consistency and Stability of SNPP ATMS Microwave Observations and COSMIC-2 Radio Occultation over Oceans. Remote Sens. 2021, 13, 3754. [Google Scholar] [CrossRef]
- Shao, X.; Ho, S.-P.; Zhang, B.; Zhou, X.-J.; Kireev, S.; Chen, Y.; Cao, C.-Y. Comparison of COSMIC-2 Radio Occultation Retrievals with RS41 and RS92 Radiosonde Humidity and Temperature Measurements. Terr. Atmos. Ocean. Sci. 2021, 32, 1015–1032. [Google Scholar] [CrossRef]
- Chen, Y.; Shao, X.; Cao, C.; Ho, S.-P. Simultaneous Radio Occultation Predictions for Inter-Satellite Comparison of Bending Angle Profiles from COSMIC-2 and GeoOptics. Remote Sens. 2021, 13, 3644. [Google Scholar] [CrossRef]
- Ho, S.-P.; et al. Lessons Learned from the Preparation and Evaluation of Multiple GNSS RO Data for the ROMEX from NOAA/STAR. In Proceedings of the IROWG ROMEX Workshop, Darmstadt, Germany, 17-19 April 2024. [Google Scholar]
- Miller, W.J.; Chen, Y.; Ho, S.-P.; Shao, X. Evaluating the Impacts of COSMIC-2 GNSS RO Bending Angle Assimilation on Atlantic Hurricane Forecasts Using the HWRF Model. Mon. Weather Rev. 2023, 151, 1821–1847. [Google Scholar] [CrossRef]
- Adhikari, L.; Ho, S.-P.; Zhou, X. Inverting COSMIC-2 Phase Data to Bending Angle and Refractivity Profiles Using the Full Spectrum Inversion Method. Remote Sens. 2021, 13, 1793. [Google Scholar] [CrossRef]
- Zhang, B.; Ho, S.-P.; Cao, C.; Shao, X.; Dong, J.; Chen, Y. Verification and Validation of the COSMIC-2 Excess Phase and Bending Angle Algorithms for Data Quality Assurance at STAR. Remote Sens. 2022, 14, 3288. [Google Scholar] [CrossRef]
- Bai, W.; Wang, G.; Huang, F.; Sun, Y.; Du, Q.; Xia, J.; Wang, X.; Meng, X.; Hu, P.; Yin, C.; Tan, G.; Wu, R. Review of Assimilating Spaceborne Global Navigation Satellite System Remote Sensing Data for Tropical Cyclone Forecasting. Remote Sens. 2025, 17, 118. [Google Scholar] [CrossRef]
- Turbiner, D.; Young, L. E.; Meehan, T. K. Phased Array GNSS Antenna for the FORMOSAT-7/COSMIC-2 Radio Occultation Mission. In Proceedings of the 25th International Technical Meeting of the Satellite Division of the Institute of Navigation (ION GNSS 2012), Nashville, TN, USA, 17-21 September 2012; pp. 915–916. [Google Scholar]
- Schreiner, W. S.; Weiss, J.-P.; Anthes, R. A.; Braun, J.; Chu, V.; Fong, J.; Hunt, D.; Kuo, Y.-H.; Meehan, T.; Serafino, W.; Sjoberg, J.; Sokolovskiy, S.; Talaat, T.; Wee, T.-K.; Zeng, Z. COSMIC-2 Radio Occultation Constellation: First Results. Geophys. Res. Lett. 2020, 47, e2019GL086841. [Google Scholar] [CrossRef]
- Anthes, R. A.; Marquardt, C.; Ruston, B.; Shao, H. Radio Occultation Modeling Experiment (ROMEX): Determining the impact of radio occultation observations on numerical weather prediction. Bull. Am. Meteorol. Soc. 2024, 105(8), E1552–E1568. [Google Scholar] [CrossRef]
- Mo, Z.; Lou, Y.; Zhang, W.; Zhou, Y.; Wu, P.; Zhang, Z. Performance assessment of multi-source GNSS radio occultation from COSMIC-2, MetOp-B/C, FY-3D/E, Spire, and PlanetiQ over China. Atmos. Res. 2024, 311, 107704. [Google Scholar] [CrossRef]
- Ao, C. O.; Wang, K.-N.; Hajj, G. A. PBL Remote Sensing with GNSS-RO. Proceedings of IROWG-10, Boulder, CO, USA, 12-18 September 2024. [Google Scholar]
- Lonitz, K.; Marquardt, C.; Bowler, N.; Healy, S. Final Technical Note of ‘Impact Assessment of Commercial GNSS-RO Data’; ESA Contract Report No. 4000131086/20/NL/FF/a, 2021. Available online: https://www.ecmwf.int/sites/default/files/elibrary/2021/20240-final-technical-note-impact-assessment-commercial-gnss-ro-data_2.pdf.
- Langland, R.H.; Baker, N. L. Estimation of observation impact using the NRL atmospheric variational data assimilation adjoint system. Tellus A 2004, 56, 189–201. [Google Scholar] [CrossRef]
- Cardinali, C. Monitoring the observation impact on the short-range forecast. Q. J. R. Meteorol. Soc. 2009, 135, 239–250. [Google Scholar] [CrossRef]
- Cardinali, C.; Healy, S. Impact of GPS radio occultation measurements in the ECMWF system using adjoint-based diagnostics. Q. J. R. Meteorol. Soc. 2014, 140, 2315–2320. [Google Scholar] [CrossRef]
- Anthes, R. A.; Marquardt, C.; Ruston, B.; Shao, H. Radio Occultation Modeling Experiment (ROMEX): Determining the impact of radio occultation observations on numerical weather prediction. Bull. Am. Meteorol. Soc. 2024, 105, E1552–E1568. [Google Scholar] [CrossRef]
- Cucurull, L. Recent Impact of COSMIC-2 with Improved Radio Occultation Data Assimilation Algorithms. Weather Forecast. 2023, 38, 1829–1847. [Google Scholar] [CrossRef]
- Ruston, B.; Healy, S. Forecast Impact of FORMOSAT-7/COSMIC-2 GNSS Radio Occultation Measurements. Atmos. Sci. Lett. 2021, 22, e1019. [Google Scholar] [CrossRef]
- Harnisch, F.; Healy, S. B.; Bauer, P.; English, S. J. Scaling of GNSS radio occultation impact with observation number using an ensemble of data assimilations. Mon. Weather Rev. 2013, 141, 4395–4413. [Google Scholar] [CrossRef]
- Kuo, Y.-H.; Wee, T.-K.; Sokolovskiy, S.; Rocken, C.; Schreiner, W.; Hunt, D.; Anthes, R.A. Inversion and Error Estimation of GPS Radio Occultation Data. J. Meteorol. Soc. Jpn. 2004, 82, 507–531. [Google Scholar] [CrossRef]
- Nolan, D. S. What Is the Trigger for Tropical Cyclogenesis? Aust. Meteorol. Mag. 2007, 56, 241–266. [Google Scholar] [CrossRef]
- Sippel, J. A.; Zhang, F. A Probabilistic Analysis of the Dynamics and Predictability of Tropical Cyclogenesis. J. Atmos. Sci. 2008, 65, 3440–3459. [Google Scholar] [CrossRef]
- Doyle, J. D.; Reynolds, C. A.; Amerault, C.; Moskaitis, J. Adjoint Sensitivity and Predictability of Tropical Cyclogenesis. J. Atmos. Sci. 2012, 69, 3535–3557. [Google Scholar] [CrossRef]
- Teng, H.-F.; Kuo, Y.-H.; Done, J. M. Importance of Midlevel Moisture for Tropical Cyclone Formation in Easterly and Monsoon Environments over the Western North Pacific. Mon. Weather Rev. 2021, 149, 2449–2469. [Google Scholar] [CrossRef]
- Zeng, Z.; Sokolovskiy, S.; Schreiner, W. S.; Hunt, D. Representation of vertical structures by radio occultation observations in the upper troposphere and lower stratosphere: Comparison to high-resolution radiosonde profiles. J. Atmos. Ocean. Technol. 2019, 36, 655–670. [Google Scholar] [CrossRef]
- Teng, H.-F.; Kuo, Y.-H.; Done, J. M. Potential Impacts of Radio Occultation Data Assimilation on Forecast Skill of Tropical Cyclone Formation in the Western North Pacific. Geophys. Res. Lett. 2023, 50, e2021GL096750. [Google Scholar] [CrossRef]
- Chen, S.-Y.; Kuo, Y.-H.; Huang, C.-Y. The Impact of GPS RO Data on Predicting Tropical Cyclogenesis Using a Nonlocal Observation Operator: An Initial Assessment. Mon. Weather Rev. 2020, 148, 2701–2717. [Google Scholar] [CrossRef]
- Liu, H.; Anderson, J.; Kuo, Y.-H. Improved Analyses and Forecasts of Hurricane Ernesto’s Genesis Using Radio Occultation Data in an Ensemble Filter Assimilation System. Mon. Weather Rev. 2012, 140, 151–166. [Google Scholar] [CrossRef]
- Sjoberg, J.; Anthes, R.; Zhang, H. Estimating individual radio occultation uncertainties using the observations and environmental parameters. J. Atmos. Ocean. Technol. 2023, 40, 1461–1474. [Google Scholar] [CrossRef]
- Liu, H.; Kuo, Y.-H.; Sokolovskiy, S.; Zou, X.; Zeng, Z.; Hsiao, L.-F.; Ruston, B.C. A Quality Control Procedure Based on Bending Angle Measurement Uncertainty for Radio Occultation Data Assimilation in the Tropical Lower Troposphere. J. Atmos. Ocean. Technol. 2018, 35, 2117–2131. [Google Scholar] [CrossRef]
- Jing, X.; Ho, S.-P.; Shao, X.; Chen, Y.; Zhou, X. Characterizing the Uncertainty of GNSS RO Bending Angles in the Lower Troposphere with the Local Spectral Width Analysis. Proceedings of IROWG-10, Boulder, CO, USA, 12-18 September 2024. [Google Scholar]
- Anthes, R. A.; Rieckh, T. Estimating Observation and Model Error Variances Using Multiple Data Sets. Atmos. Meas. Tech. 2018, 11, 4239–4260. [Google Scholar] [CrossRef]
- Anthes, R. A.; Sjoberg, J.; Feng, X.; Syndergaard, S. Comparison of COSMIC and COSMIC-2 Radio Occultation Refractivity and Bending Angle Uncertainties in August 2006 and 2021. Atmosphere 2022, 13, 790. [Google Scholar] [CrossRef]
- Sjoberg, J. P.; Anthes, R. A.; Rieckh, T. The three-cornered hat method for estimating error variances of three or more datasets. Part I: Overview and evaluation. J. Atmos. Ocean. Technol. 2021, 38, 555–572. [Google Scholar] [CrossRef]
- Bonafoni, S.; Biondi, R.; Brenot, H.; Anthes, R. Radio occultation and ground-based GNSS products for observing, understanding, and predicting extreme events: A review. Atmos. Res. 2019, 230, 104624. [Google Scholar] [CrossRef]
- Babu, S.R.; Liou, Y.-A. Day-to-Day Variability of Upper-Troposphere and Lower-Stratosphere Temperature in Response to the Taal Volcanic Eruption Inferred from COSMIC-2 RO Measurements. J. Volcanol. Geotherm. Res. 2022, 421, 107445. [Google Scholar] [CrossRef]
- Randel, W.J.; Johnston, B.R.; Braun, J.J.; Sokolovskiy, S.; Vömel, H.; Podglajen, A.; Legras, B. Stratospheric Water Vapor from the Hunga Tonga–Hunga Ha’apai Volcanic Eruption Deduced from COSMIC-2 Radio Occultation. Remote Sens. 2023, 15, 2167. [Google Scholar] [CrossRef]
- Ho, S.-P.; Kirchengast, G.; Leroy, S.; Wickert, J.; Mannucci, A.J.; Steiner, A.K.; et al. Estimating the Uncertainty of Using GPS Radio Occultation Data for Climate Monitoring: Intercomparison of CHAMP Refractivity Climate Records for 2002 to 2006 from Different Data Centers. J. Geophys. Res. Atmos. 2009, 114, D23107. [Google Scholar] [CrossRef]
- Scherllin-Pirscher, B.; Kirchengast, G.; Steiner, A. K.; Kuo, Y.-H.; Foelsche, U. Quantifying Uncertainty in Climatological Fields from GPS Radio Occultation: An Empirical-Analytical Error Model. Atmos. Meas. Tech. 2011, 4, 2019–2034. [Google Scholar] [CrossRef]
- Steiner, A. K.; Hunt, D.; Ho, S.-P.; Kirchengast, G.; Mannucci, A. J.; Scherllin-Pirscher, B.; et al. Quantification of Structural Uncertainty in Climate Data Records from GPS Radio Occultation. Atmos. Chem. Phys. 2013, 13, 1469–1484. [Google Scholar] [CrossRef]
- Khaykin, S. M.; Funatsu, B. M.; Hauchecorne, A.; et al. Post-millennium changes in stratospheric temperature consistently resolved by GPS radio occultation and AMSU observations. Geophys. Res. Lett. 2017, 44(14), 7510–7518. [Google Scholar] [CrossRef]
- Leroy, S. S.; Ao, C. O.; Verkhoglyadova, O. P. Temperature trends and anomalies in modern satellite data: Infrared sounding and GPS radio occultation. J. Geophys. Res. Atmos. 2018, 123(20), 11431–11444. [Google Scholar] [CrossRef]
- Steiner, A. K.; Ladstädter, F.; Randel, W. J.; Maycock, A. C.; Fu, Q.; Claud, C.; Gleisner, H.; Haimberger, L.; Ho, S.-P.; Keckhut, P.; Leblanc, T.; Polvani, L. M.; Santer, B. D.; Schmidt, T.; Sofieva, V.; Wing, R.; Zou, C.-Z. Observed Temperature Changes in the Troposphere and Stratosphere from 1979 to 2018. J. Clim. 2020, 33, 8165–8194. [Google Scholar] [CrossRef]
- Vergados, P.; Ao, C.O.; Mannucci, A.J.; Kursinski, E.R. Quantifying the Tropical Upper Tropospheric Warming Amplification Using Radio Occultation Measurements. Earth Space Sci. 2021, 8, e2020EA001597. [Google Scholar] [CrossRef]
- Gleisner, H.; Lauritsen, K. B.; Nielsen, J. K.; Syndergaard, S. Evaluation of the 15-year ROM SAF monthly mean GPS radio occultation climate data record. Atmos. Meas. Tech. 2020, 13(6), 3081–3098. [Google Scholar] [CrossRef]
- Gleisner, H.; Ringer, M. A.; Healy, S. B. Monitoring Global Climate Change Using GNSS Radio Occultation. npj Clim. Atmos. Sci. 2022, 5, 6. [Google Scholar] [CrossRef]
- Ladstädter, F.; Steiner, A. K.; Gleisner, H. Resolving the 21st Century Temperature Trends of the Upper Troposphere-Lower Stratosphere with Satellite Observations. Sci. Rep. 2023, 13, 1306. [Google Scholar] [CrossRef] [PubMed]
- Chen, Y.; Zhou, X.; Ho, S.-P.; Shao, X.; Liu, T.-C. Comparison of Radio Occultation Bending Angle and Refractivity Processed by Different Inversion Algorithms from Multi-RO Missions. Proceedings of IGARSS 2024-2024 IEEE International Geoscience and Remote Sensing Symposium, Athens, Greece, 7-12 July 2024; pp. 8904–8907. [Google Scholar] [CrossRef]
- Shao, X.; Ho, S.-P.; Jing, X.; Zhou, X.; Chen, Y.; Liu, T.-C.; Zhang, B.; Dong, J. Characterizing the Tropospheric Water Vapor Spatial Variation and Trend Using 2007-2018 COSMIC Radio Occultation and ECMWF Reanalysis Data. Atmos. Chem. Phys. 2023, 23, 14187–14218. [Google Scholar] [CrossRef]
- Basha, G.; Kishore, P.; Ratnam, M.V.; Babu, S.R.; Velicogna, I.; Jiang, J.H.; Ao, C.O. Global Climatology of Planetary Boundary Layer Top Obtained from Multi-Satellite GPS RO Observations. Clim. Dyn. 2019, 52, 2385–2398. [Google Scholar] [CrossRef]
- Kalmus, P.; Ao, C. O.; Wang, K.-N.; Manzi, M. P.; Teixeira, J. A High-Resolution Planetary Boundary Layer Height Seasonal Climatology from GNSS Radio Occultation. Remote Sens. Environ. 2022, 276, 113037. [Google Scholar] [CrossRef]
- Ho, S.-P.; Gu, G.; Zhou, X. The Planetary Boundary Layer Height Climatology over Oceans Using COSMIC-2 and Spire GNSS RO Bending Angles from 2019 to 2023: Comparisons to CALIOP, ERA5, MERRA2, and CFS Reanalysis. IEEE Trans. Geosci. Remote Sens. 2024, 62, 5803314. [Google Scholar] [CrossRef]
- Ao, C.O.; Waliser, D.E.; Chan, S.K.; Li, J.-L.; Tian, B.; Xie, F.; Mannucci, A.J. Planetary boundary layer heights from GPS radio occultation refractivity and humidity profiles. J. Geophys. Res. 2012, 117, D16117. [Google Scholar] [CrossRef]
- Xie, F.; Wu, D. L.; Ao, C. O.; Mannucci, A. J.; Kursinski, E. R. Advances and limitations of atmospheric boundary layer observations with GPS occultation over the southeast Pacific Ocean. Atmos. Chem. Phys. 2012, 12, 903–918. [Google Scholar] [CrossRef]
- Chan, K. M.; Wood, R. The Seasonal Cycle of Planetary Boundary Layer Depth Determined Using COSMIC Radio Occultation Data. J. Geophys. Res. Atmos. 2013, 118, 12422–12434. [Google Scholar] [CrossRef]
- Ho, S.-P.; Peng, L.; Anthes, R.A.; Kuo, Y.-H.; Lin, H.-C. Marine Boundary Layer Heights and Their Longitudinal, Diurnal, and Interseasonal Variability in the Southeastern Pacific Using COSMIC, CALIOP, and Radiosonde Data. J. Clim. 2015, 28, 2856–2872. [Google Scholar] [CrossRef]
- Gorbunov, M. E.; Lauritsen, K. B. Analysis of Wave Fields by Fourier Integral Operators and Their Application for Radio Occultations. Radio Sci. 2004, 39, RS4010. [Google Scholar] [CrossRef]
- Gorbunov, M. E.; Lauritsen, K. B.; Rhodin, A.; Tomassini, M.; Kornblueh, L. Radio Holographic Filtering, Error Estimation, and Quality Control of Radio Occultation Data. J. Geophys. Res. Atmos. 2006, 111, D10105. [Google Scholar] [CrossRef]
- Sokolovskiy, S.; Rocken, C.; Schreiner, W.; Hunt, D. On the uncertainty of radio occultation inversions in the lower troposphere. J. Geophys. Res. 2010, 115, D22111. [Google Scholar] [CrossRef]
- Paolella, S.; von Engeln, A.; Padovan, S.; Notarpietro, R.; Marquardt, C.; Sancho, F.; Rivas Boscan, V.; Morew, N.; Martin Alemany, F. Assessment of Operational Non-Time-Critical Sentinel-6A Michael Freilich Radio Occultation Data: Insights into Tropospheric GNSS Signal Cut-Off Strategies and Processor Improvements. Atmos. Meas. Tech. 2025, 18, 2825–2846. [Google Scholar] [CrossRef]
- Vannah, S.; Leroy, S.S.; Ao, C.O.; Kursinski, E.R.; Nelson, K.J.; Wang, K.-N.; Xie, F. The Impact of Differences in Retrieval Algorithms between Processing Centers on GNSS Radio Occultation Refractivity Retrievals in the Planetary Boundary Layer. Atmos. Meas. Tech. 2025, 18, 4293–4310. [Google Scholar] [CrossRef]
- Sokolovskiy, S. Effect of superrefraction on inversions of radio occultation signals in the lower troposphere. Radio Sci. 2003, 38, 1058. [Google Scholar] [CrossRef]
- Xie, F.; Wu, D. L.; Ao, C. O.; Kursinski, E. R.; Mannucci, A. J.; Syndergaard, S. Super-refraction effects on GPS radio occultation refractivity in marine boundary layers. Geophys. Res. Lett. 2010, 37, L11805. [Google Scholar] [CrossRef]
- Feng, X.; Xie, F.; Ao, C. O.; Anthes, R. A. Ducting and biases of GPS radio occultation bending angle and refractivity in the moist lower troposphere. J. Atmos. Ocean. Technol. 2020, 37, 1013–1025. [Google Scholar] [CrossRef]
- Sokolovskiy, S.; et al. Detection of Superrefraction at the Top of the Atmospheric Boundary Layer from COSMIC-2 Radio Occultations. J. Atmos. Ocean. Technol. 2024, 41, 65–78. [Google Scholar] [CrossRef]
- Wang, K.-N.; de la Torre Juárez, M.; Ao, C.O.; Xie, F. Correcting Negatively Biased Refractivity below Ducts in GNSS Radio Occultation: An Optimal Estimation Approach towards Improving Planetary Boundary Layer (PBL) Characterization. Atmos. Meas. Tech. 2017, 10, 4761–4776. [Google Scholar] [CrossRef]
- Wang, K.-N.; Ao, C. O.; de la Torre Juárez, M. GNSS-RO refractivity bias correction under ducting layer using surface-reflection signal. Remote Sens. 2020, 12, 359. [Google Scholar] [CrossRef]
- Xie, F.; Syndergaard, S.; Kursinski, E. R.; Herman, B. M. An approach for retrieving marine boundary layer refractivity from GPS occultation data in the presence of super-refraction. J. Atmos. Ocean. Technol. 2006, 23, 1629–1644. [Google Scholar] [CrossRef]
- Maier, M. W.; et al. Architecting the future of weather satellites. Bull. Am. Meteorol. Soc. 2021, 102, E589–E610. [Google Scholar] [CrossRef]
Figure 1.
Total occultation counts from in-orbit missions used by NCEP since 2006.
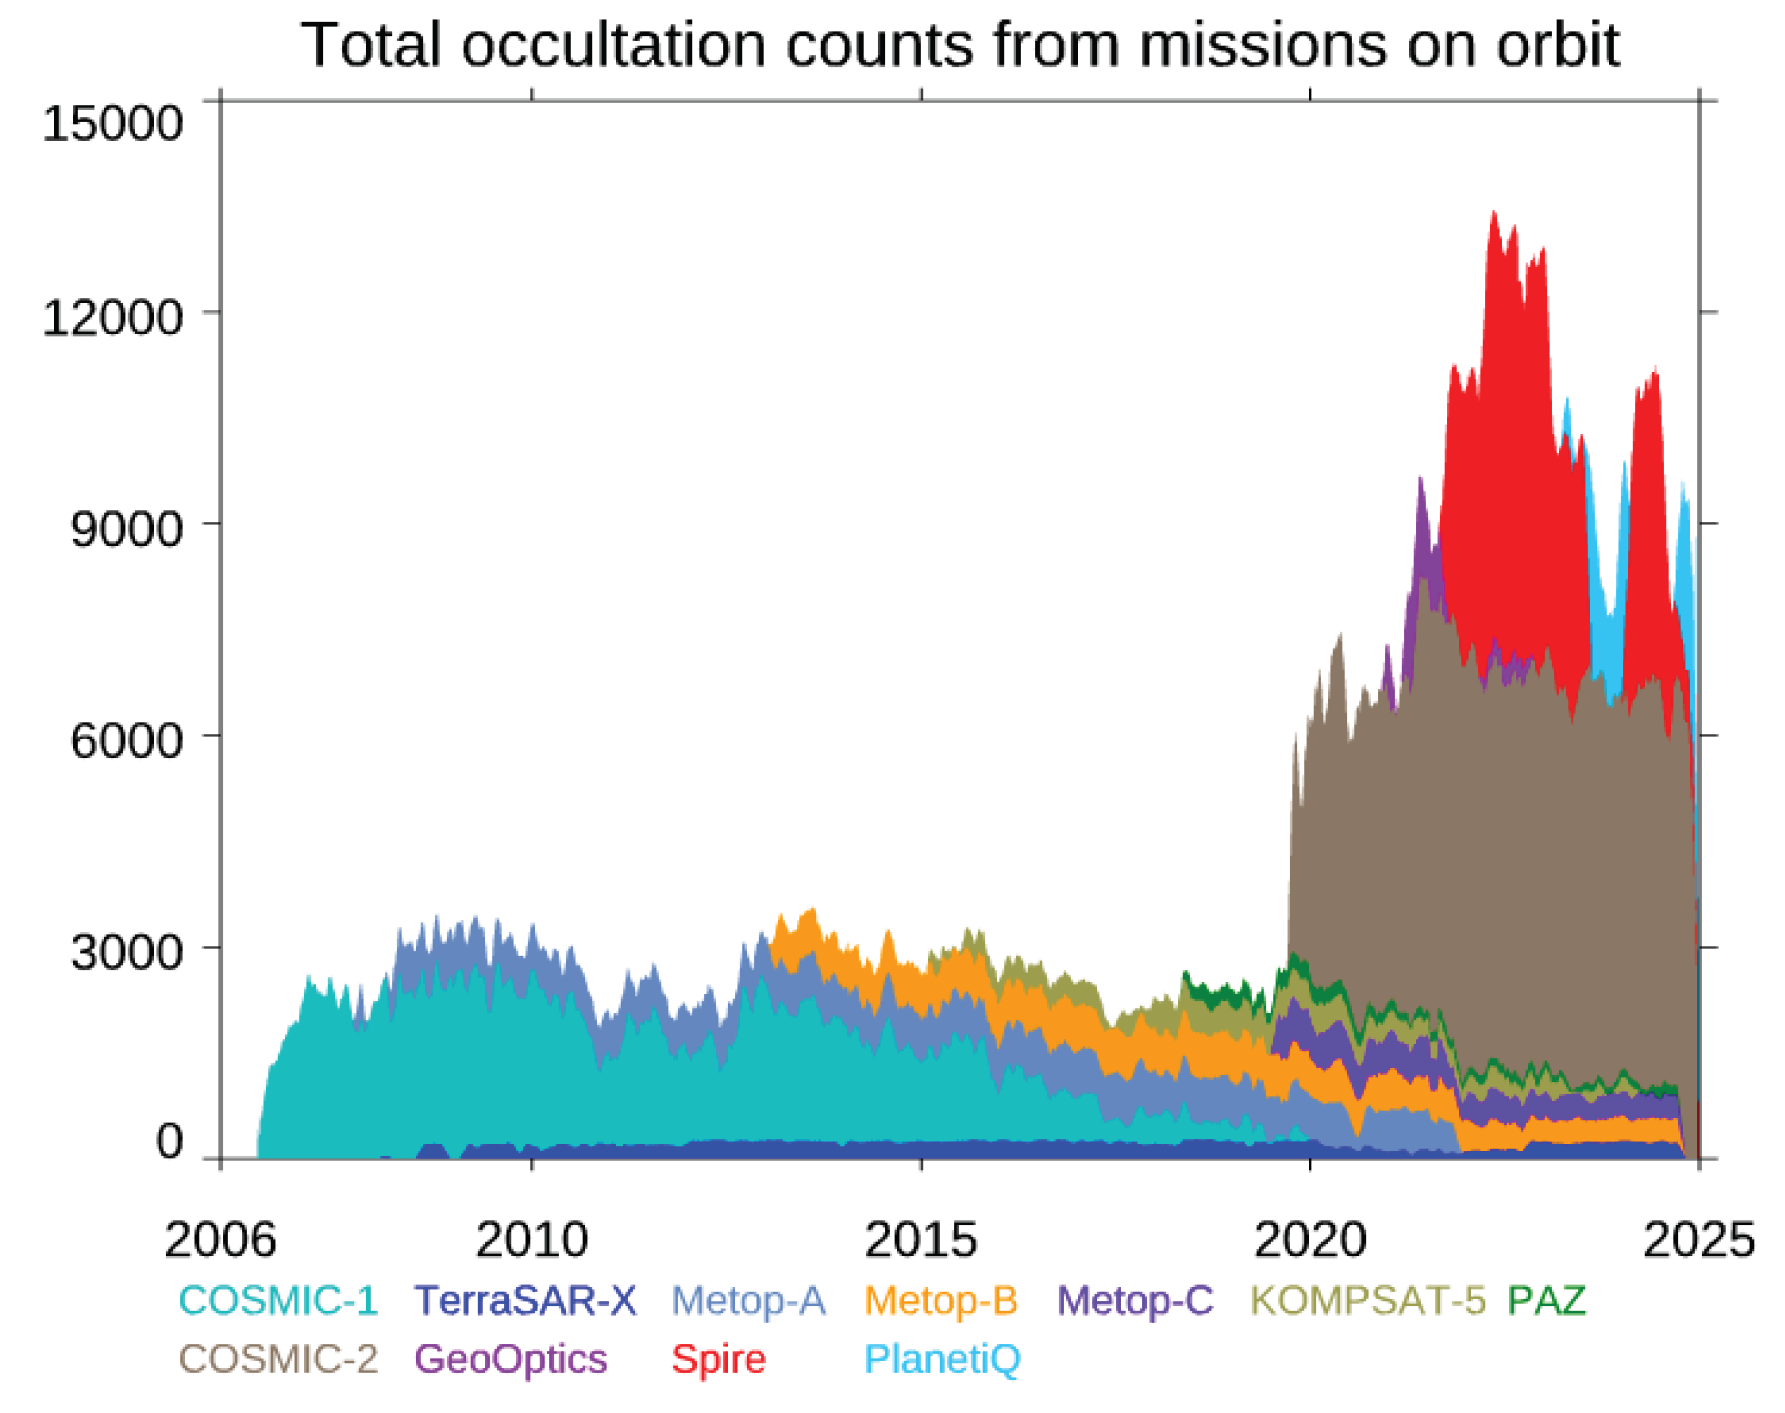
Figure 2.
Conditional causal-pathway framework for evaluating multi-mission GNSS RO observations from orbit and viewing geometry to application value.
Figure 2.
Conditional causal-pathway framework for evaluating multi-mission GNSS RO observations from orbit and viewing geometry to application value.
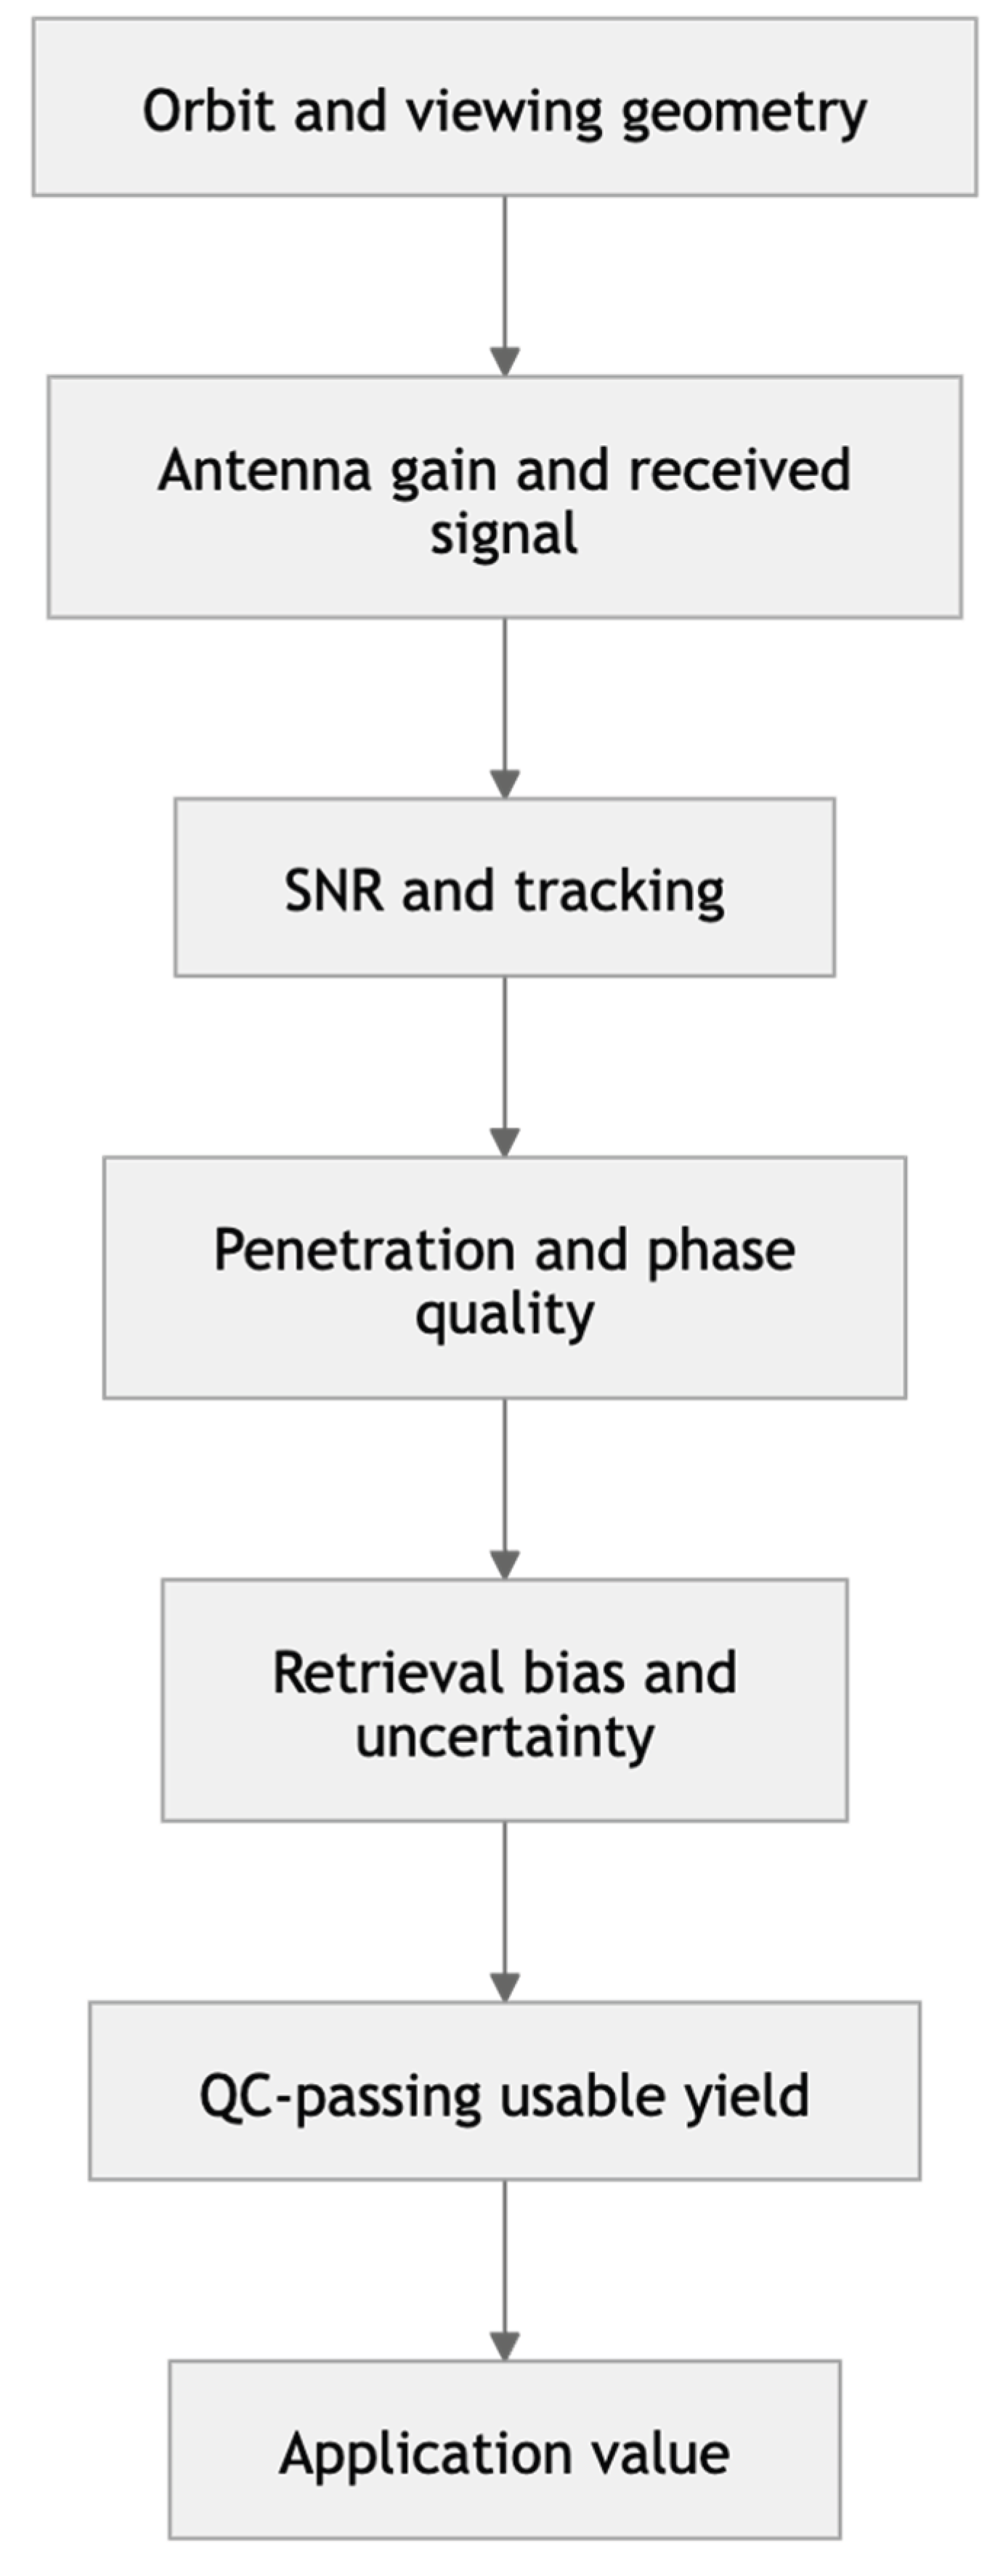
Figure 3.
Spatial and hourly local-time distributions of RO sample counts in 5° latitude bins for (a) Spire, (b) COSMIC-2, and (c) PlanetiQ. The color bar indicates the number of observations in each 5° latitude bin.
Figure 3.
Spatial and hourly local-time distributions of RO sample counts in 5° latitude bins for (a) Spire, (b) COSMIC-2, and (c) PlanetiQ. The color bar indicates the number of observations in each 5° latitude bin.
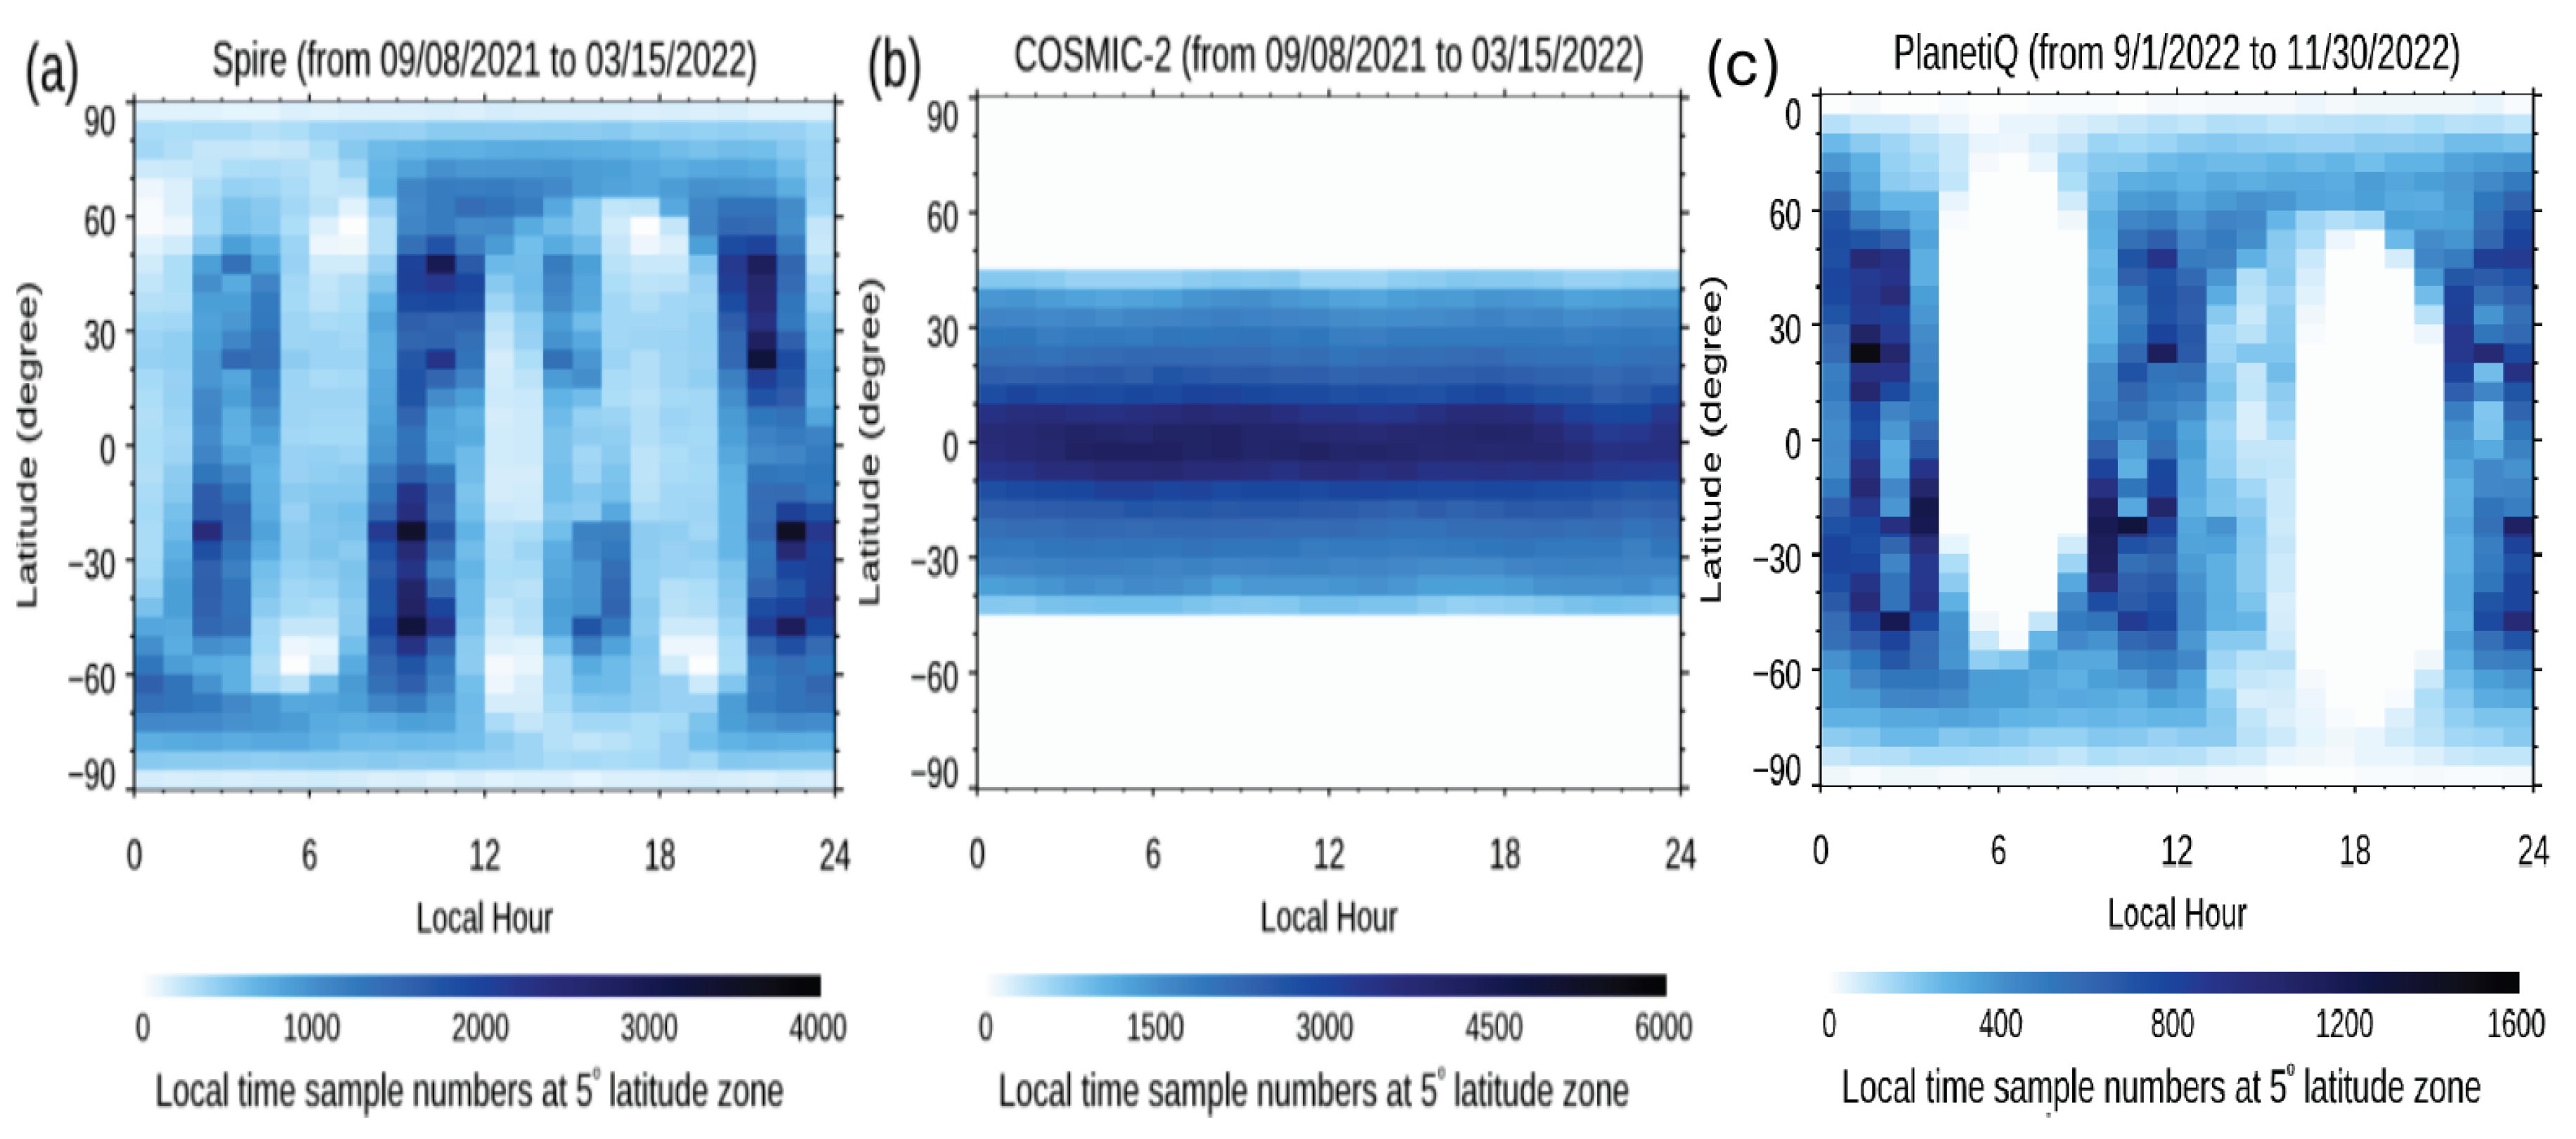
Figure 4.
Normalized SNR sample-frequency distributions (the number of samples in each SNR bin divided by the maximum number among all SNR bins) for Global Positioning System (GPS; red line), Globalnaya Navigatsionnaya Sputnikovaya Sistema (GLONASS; orange line), Galileo (blue line), and BeiDou (green line) for (a) COSMIC-2, (b) PlanetiQ, (c) Spire, and (d) MetOp-B/-C during 1–30 September 2022.
Figure 4.
Normalized SNR sample-frequency distributions (the number of samples in each SNR bin divided by the maximum number among all SNR bins) for Global Positioning System (GPS; red line), Globalnaya Navigatsionnaya Sputnikovaya Sistema (GLONASS; orange line), Galileo (blue line), and BeiDou (green line) for (a) COSMIC-2, (b) PlanetiQ, (c) Spire, and (d) MetOp-B/-C during 1–30 September 2022.
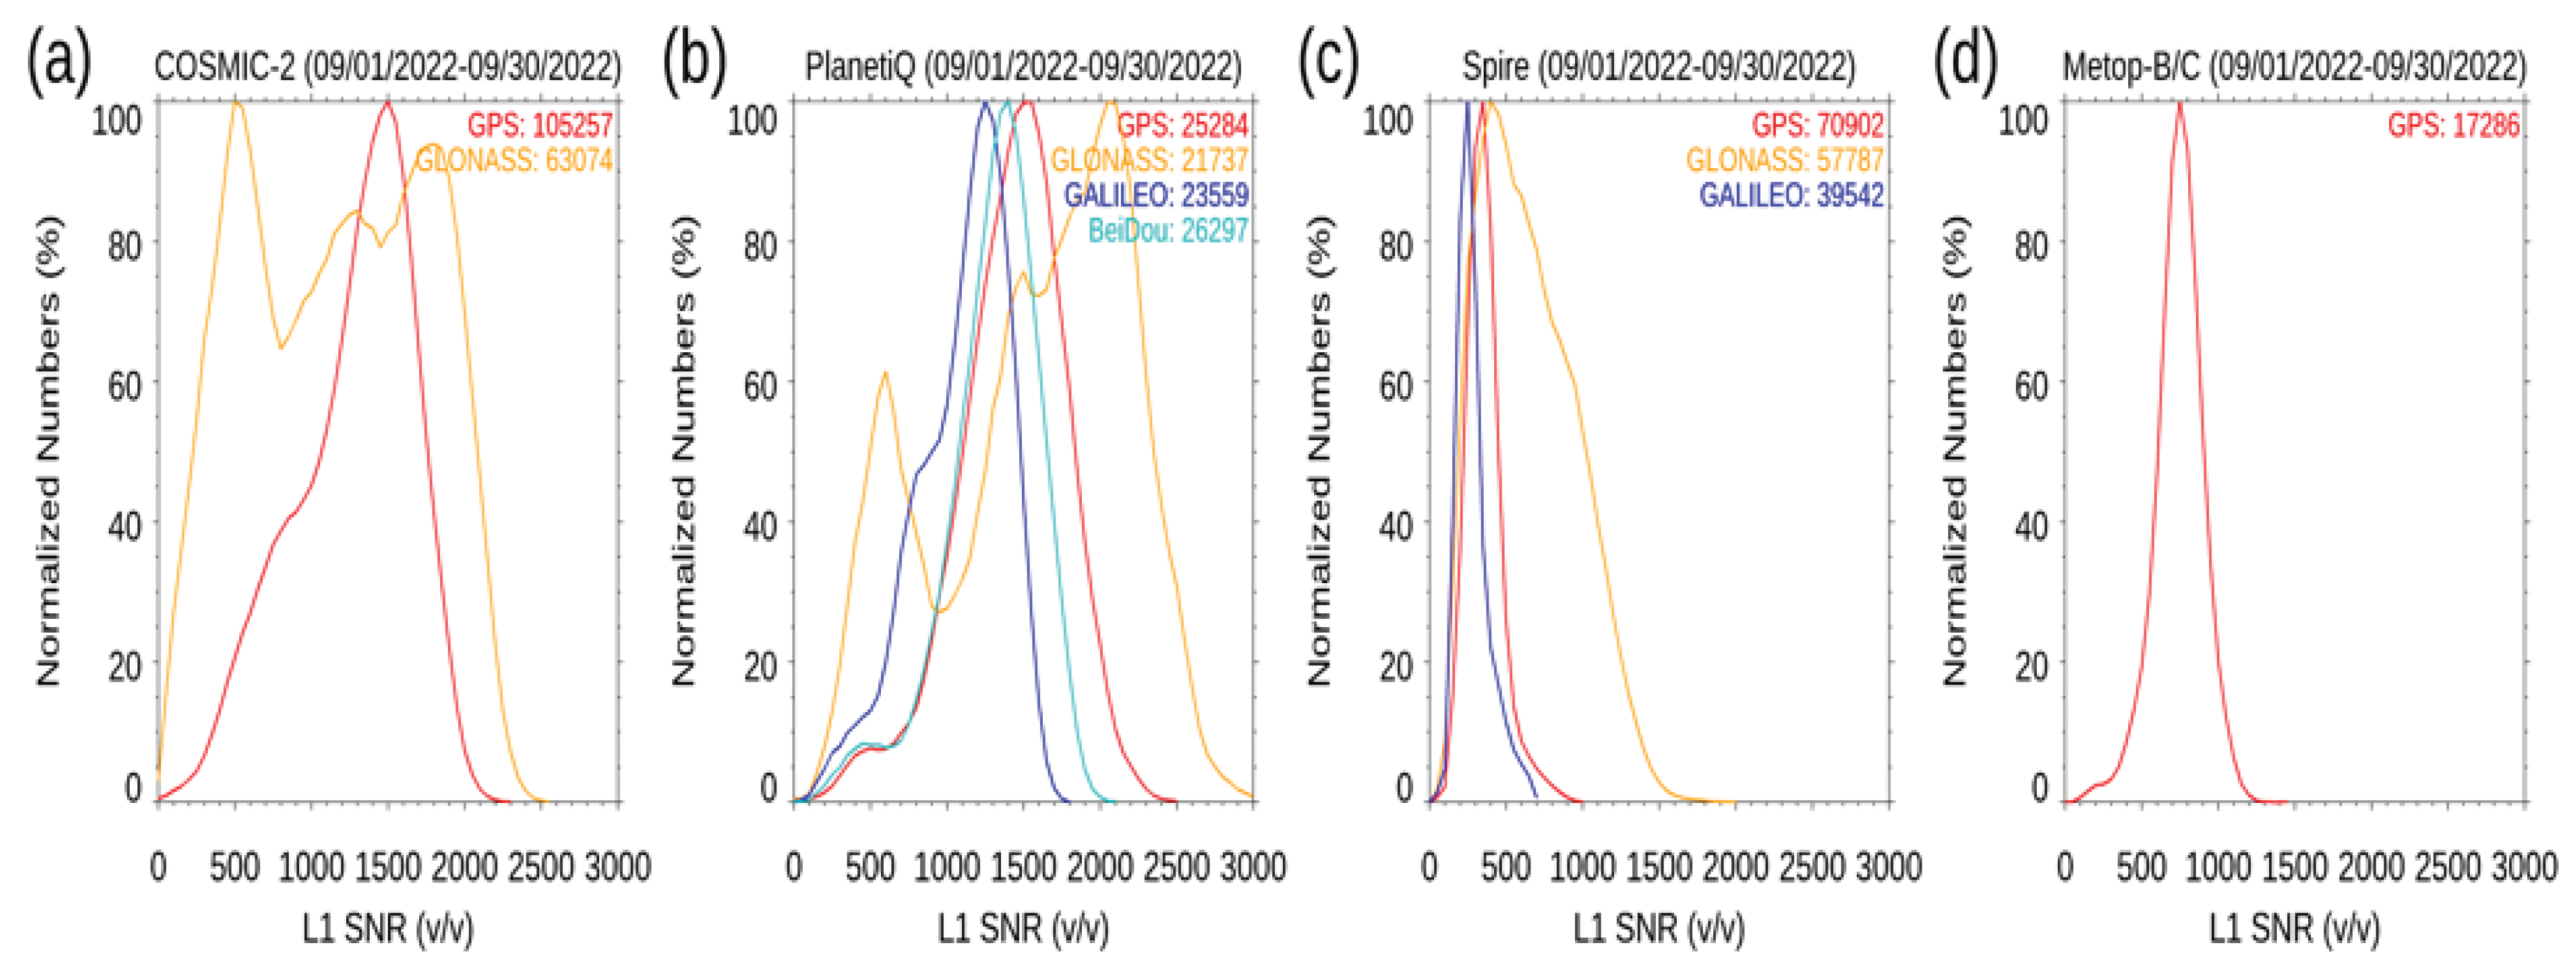
Figure 5.
Latitudinal distributions of (a) antenna zenith angle and (b) SNR for COSMIC-2, and (c) antenna zenith angle and (d) SNR for Spire.
Figure 5.
Latitudinal distributions of (a) antenna zenith angle and (b) SNR for COSMIC-2, and (c) antenna zenith angle and (d) SNR for Spire.
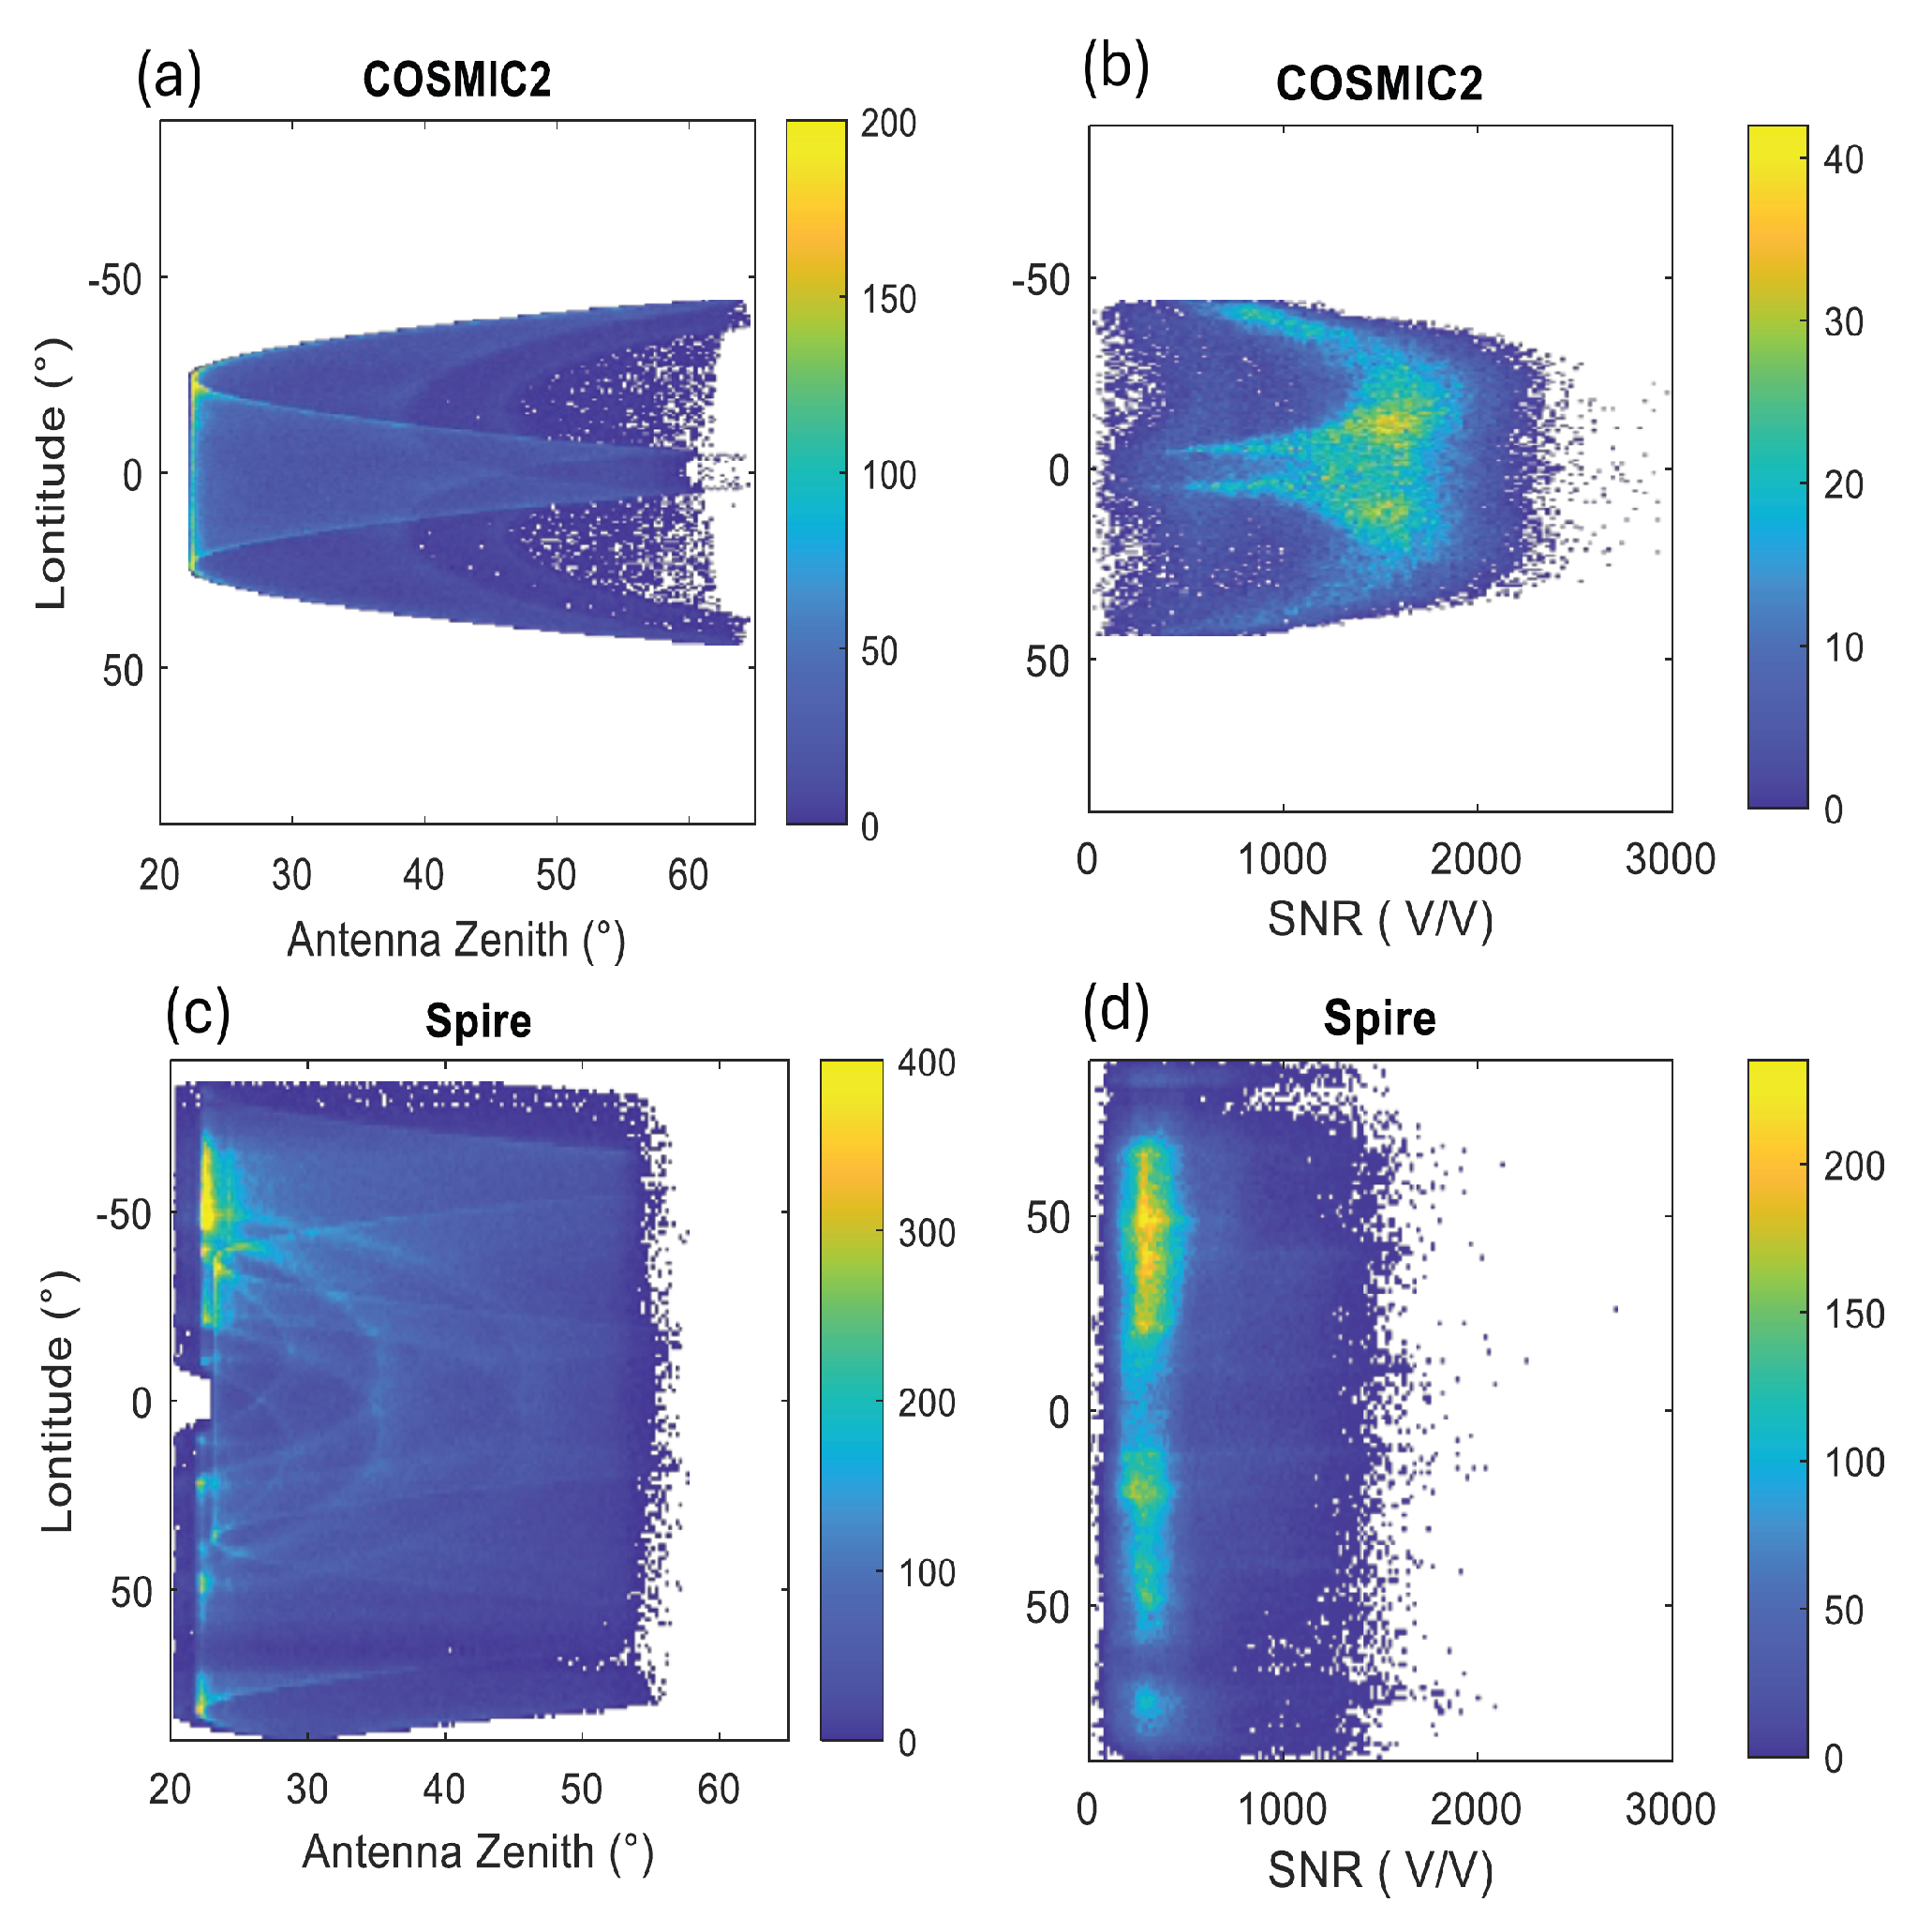
Figure 6.
Global distributions of monthly mean lowest penetration height during October–November 2022, binned on a 5° × 5° grid, for (a) COSMIC-2 (45°S–45°N), (b) Spire, and (c) PlanetiQ.
Figure 6.
Global distributions of monthly mean lowest penetration height during October–November 2022, binned on a 5° × 5° grid, for (a) COSMIC-2 (45°S–45°N), (b) Spire, and (c) PlanetiQ.
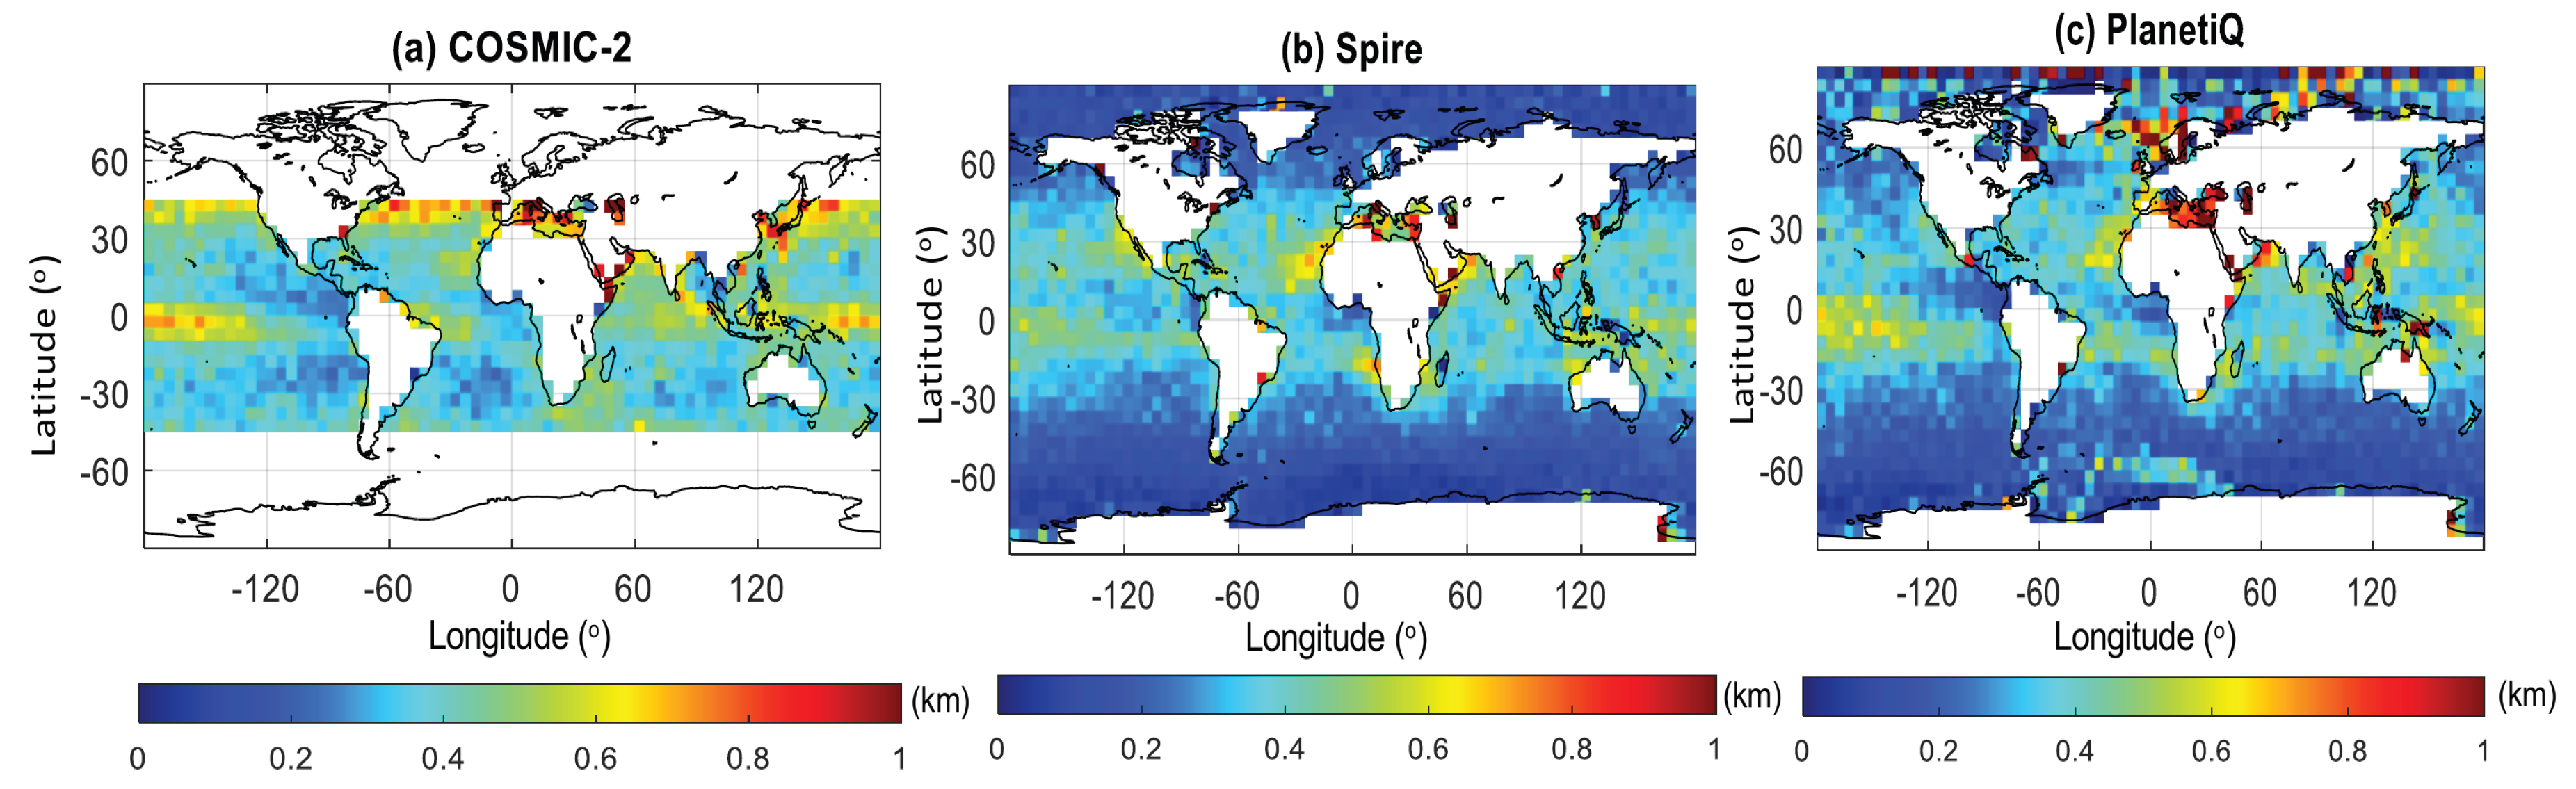
Figure 7.
Fractional BA difference, corresponding standard deviation, and sample count from the surface to 40 km for Spire (red lines), COSMIC-2 (green lines), and COSMIC-1 (blue lines) at (a) 45°S–20°S, (b) 20°S–20°N, and (c) 20°N–45°N. The standard error of the mean (SEM) is shown as a horizontal line superimposed on the mean differences.
Figure 7.
Fractional BA difference, corresponding standard deviation, and sample count from the surface to 40 km for Spire (red lines), COSMIC-2 (green lines), and COSMIC-1 (blue lines) at (a) 45°S–20°S, (b) 20°S–20°N, and (c) 20°N–45°N. The standard error of the mean (SEM) is shown as a horizontal line superimposed on the mean differences.
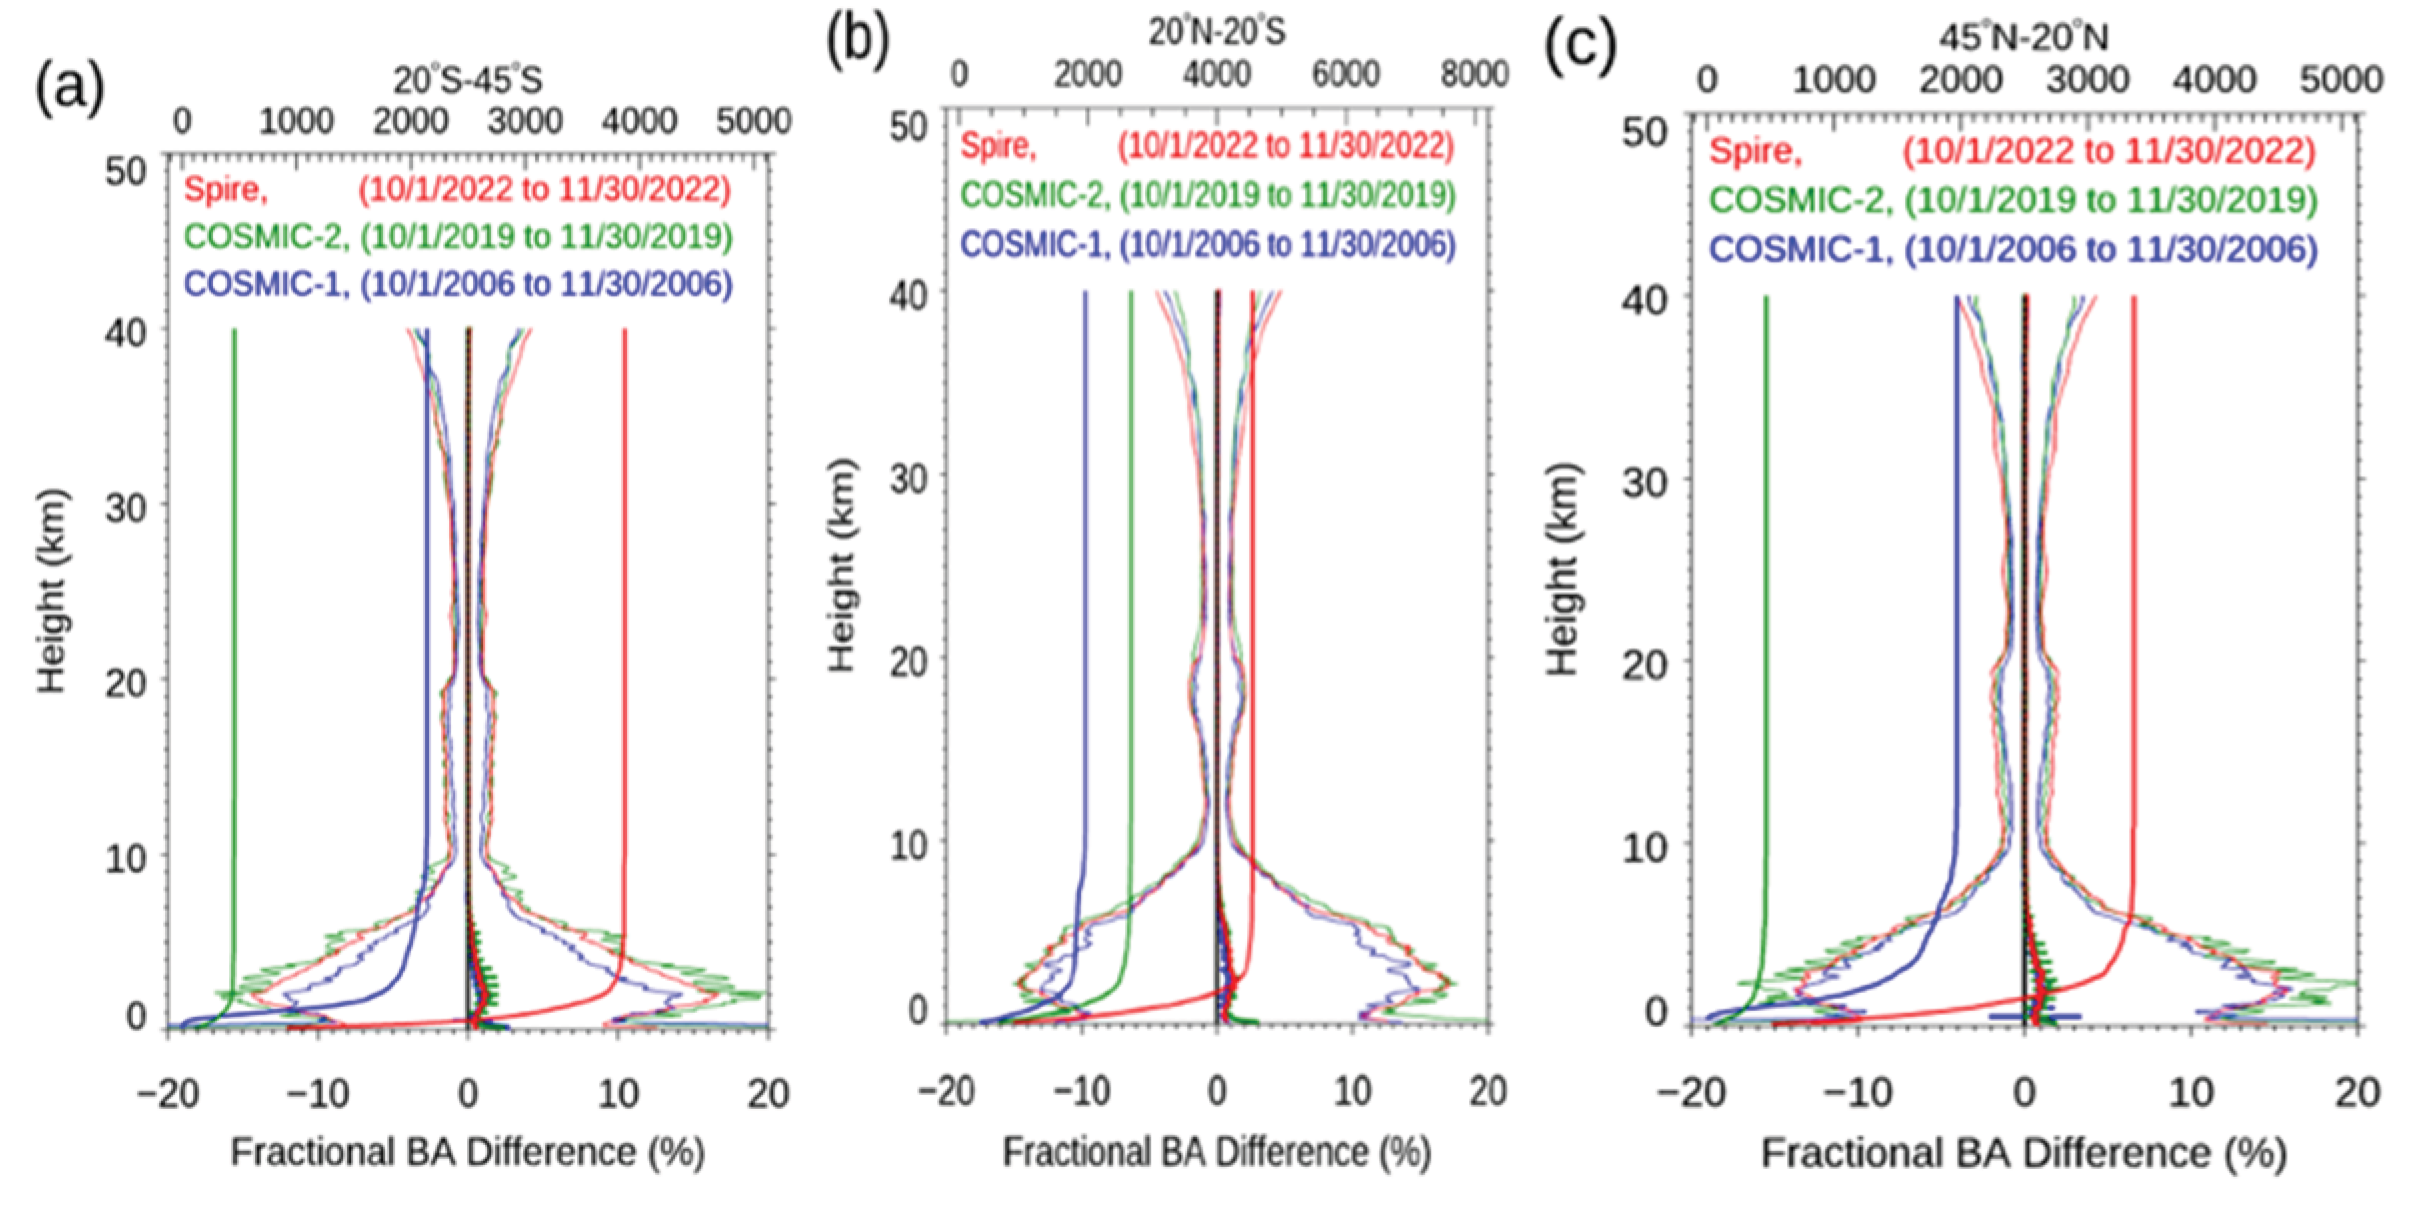
Figure 8.
COSMIC-2 fractional bending-angle departures from ERA5 for different L1 SNR groups and heights above mean sea level.
Figure 8.
COSMIC-2 fractional bending-angle departures from ERA5 for different L1 SNR groups and heights above mean sea level.
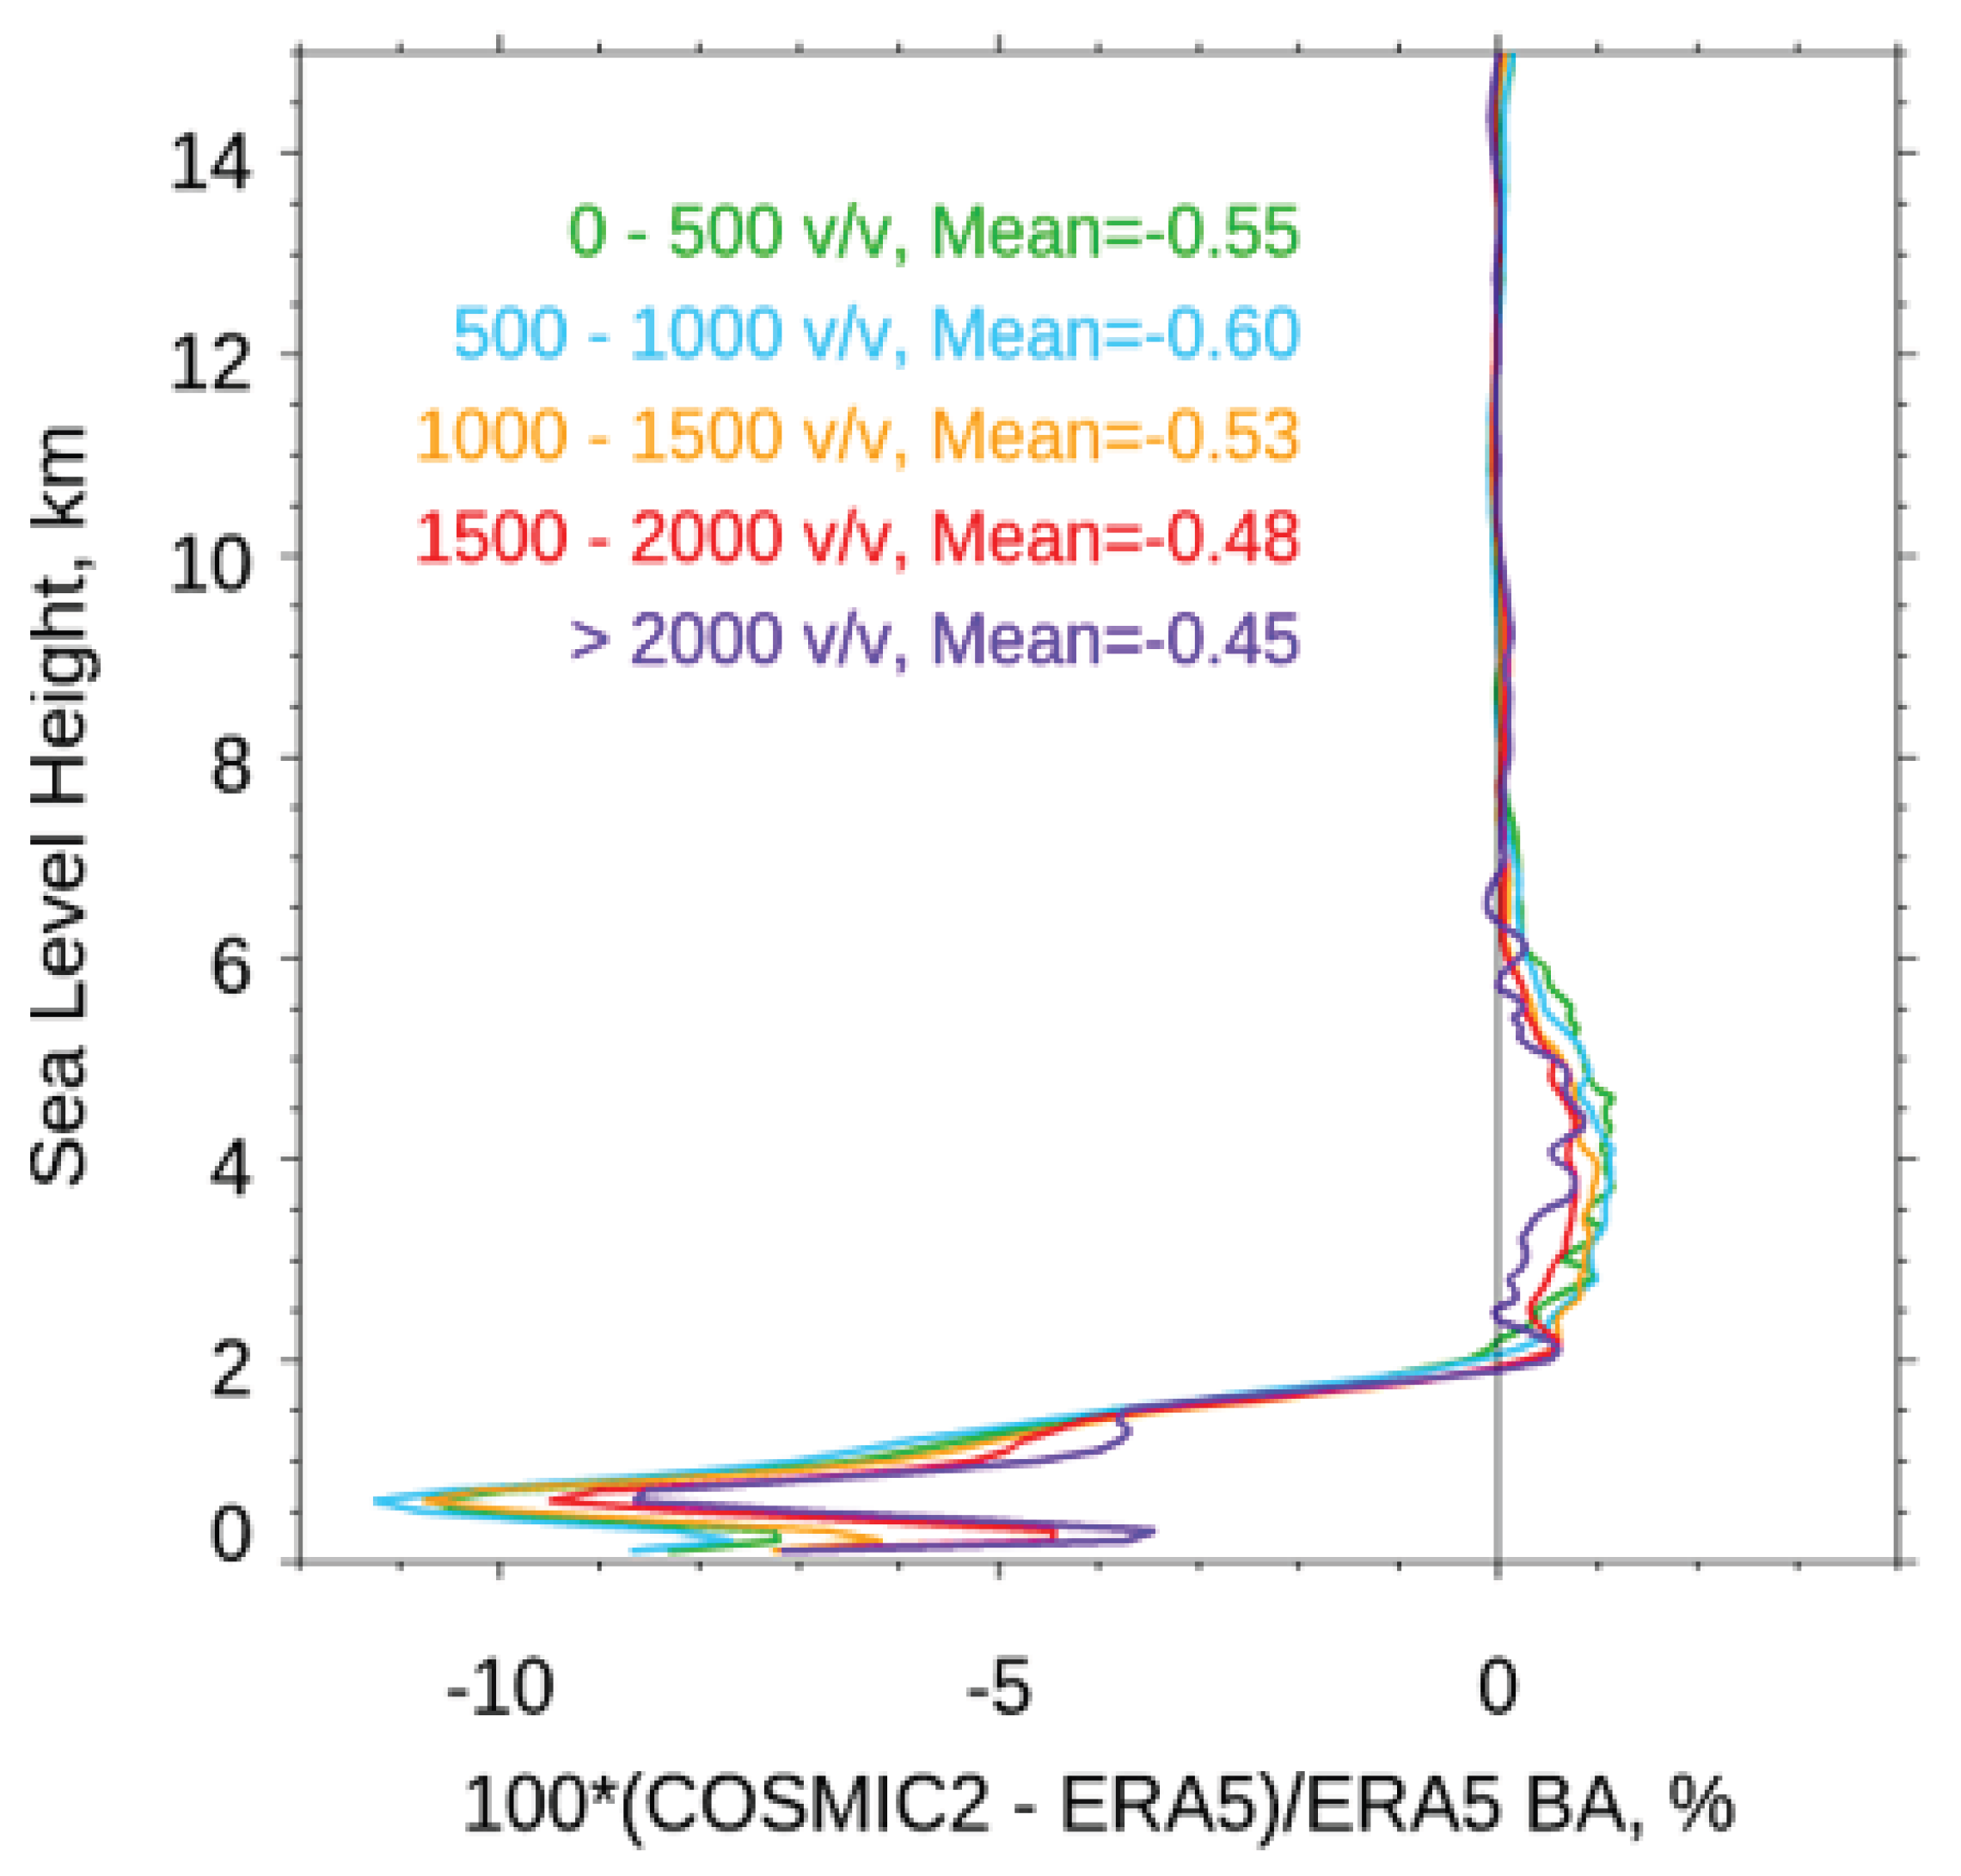
Figure 9.
Time series of ECMWF FSOI contributions from GNSS RO bending angles (solid orange line), satellite microwave radiances sensitive to water vapor, cloud, and precipitation (MWWV; black line), satellite microwave radiances sensitive to temperature (MWT; red line), satellite infrared radiances sensitive to water vapor (IRWV; blue line), and satellite infrared radiances sensitive to temperature (IRT; light green line). (source: Sean Healy, ECMWF).
Figure 9.
Time series of ECMWF FSOI contributions from GNSS RO bending angles (solid orange line), satellite microwave radiances sensitive to water vapor, cloud, and precipitation (MWWV; black line), satellite microwave radiances sensitive to temperature (MWT; red line), satellite infrared radiances sensitive to water vapor (IRWV; blue line), and satellite infrared radiances sensitive to temperature (IRT; light green line). (source: Sean Healy, ECMWF).
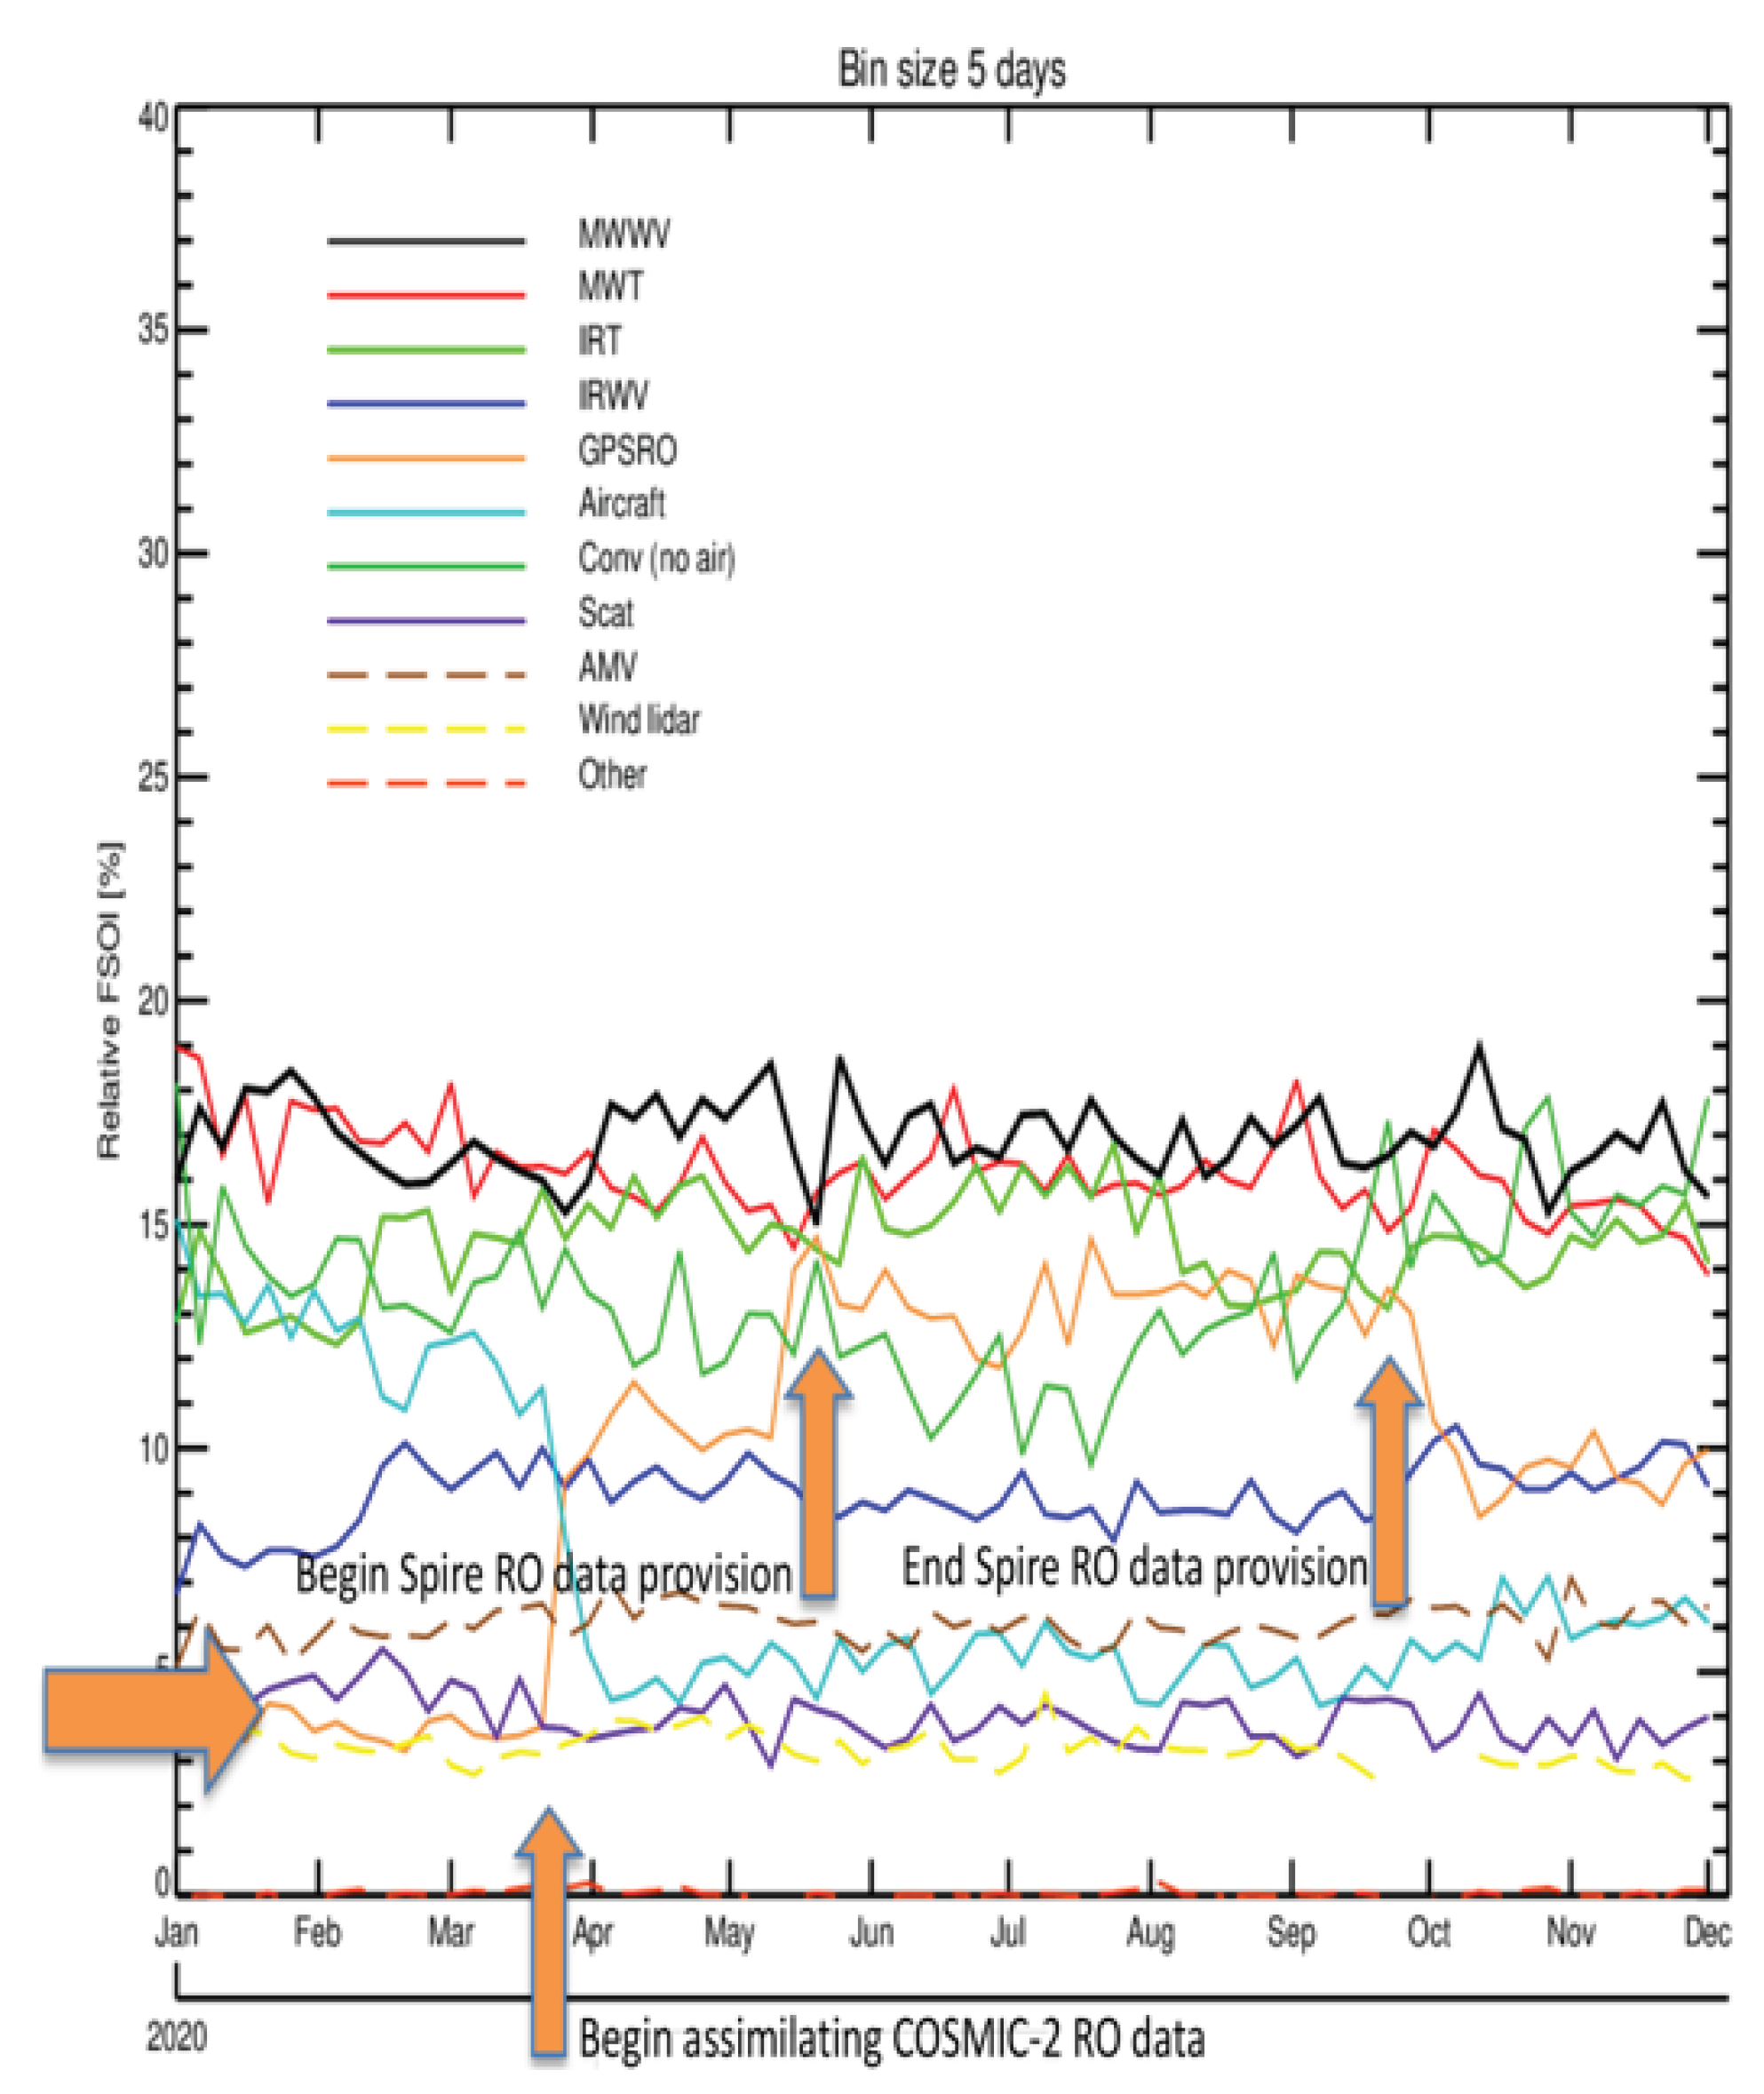
Figure 10.
(a,b) Time–height cross-sections of EPH–GTS differences in (a) relative vorticity and (b) relative humidity, averaged within a 5° radius of the tropical-disturbance center, for WRF forecast composites from 9 developing TC cases. (c,d) As in (a,b), but for composites from 23 non-developing TC cases. Dots denote differences significant at the 90% confidence level using the t-test [52].
Figure 10.
(a,b) Time–height cross-sections of EPH–GTS differences in (a) relative vorticity and (b) relative humidity, averaged within a 5° radius of the tropical-disturbance center, for WRF forecast composites from 9 developing TC cases. (c,d) As in (a,b), but for composites from 23 non-developing TC cases. Dots denote differences significant at the 90% confidence level using the t-test [52].
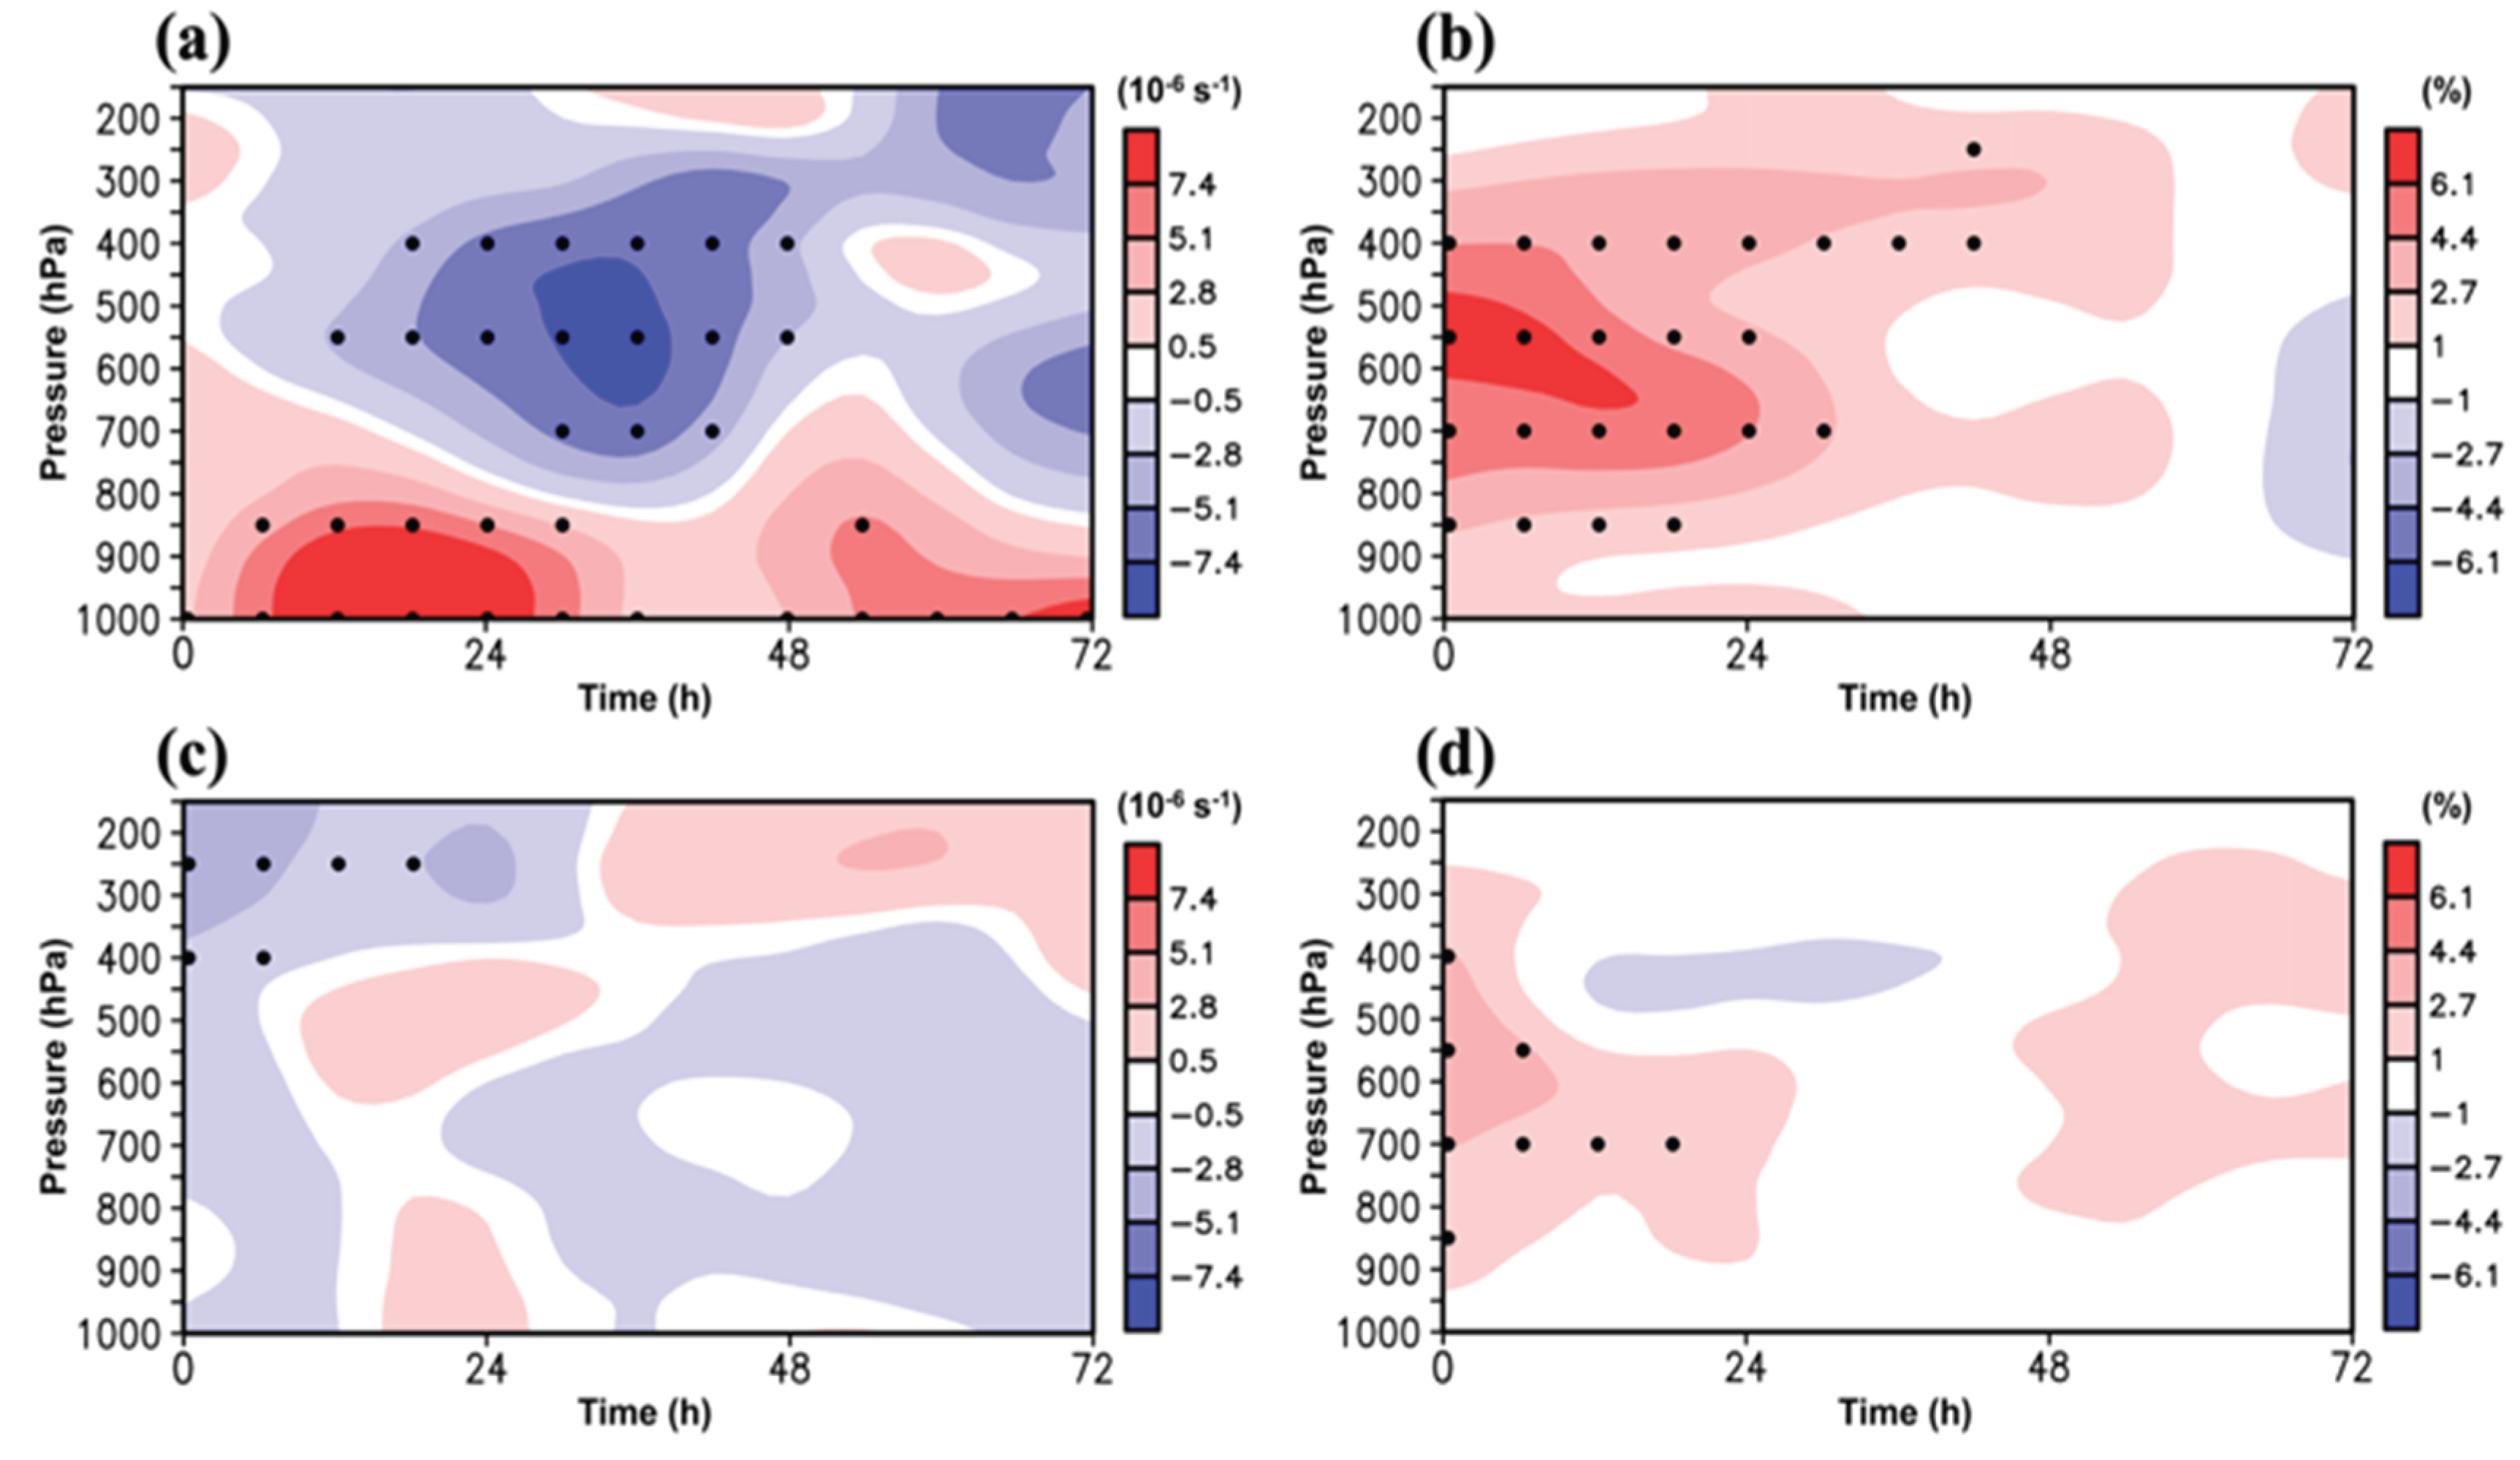
Figure 11.
Time series of the mean HWRF PMIN bias (hPa) relative to the National Hurricane Center’s best-track data for Control (black line), C2 (red line), and C2Spire (green line). The dashed blue line indicates the number of forecasts used to compute the mean.
Figure 11.
Time series of the mean HWRF PMIN bias (hPa) relative to the National Hurricane Center’s best-track data for Control (black line), C2 (red line), and C2Spire (green line). The dashed blue line indicates the number of forecasts used to compute the mean.
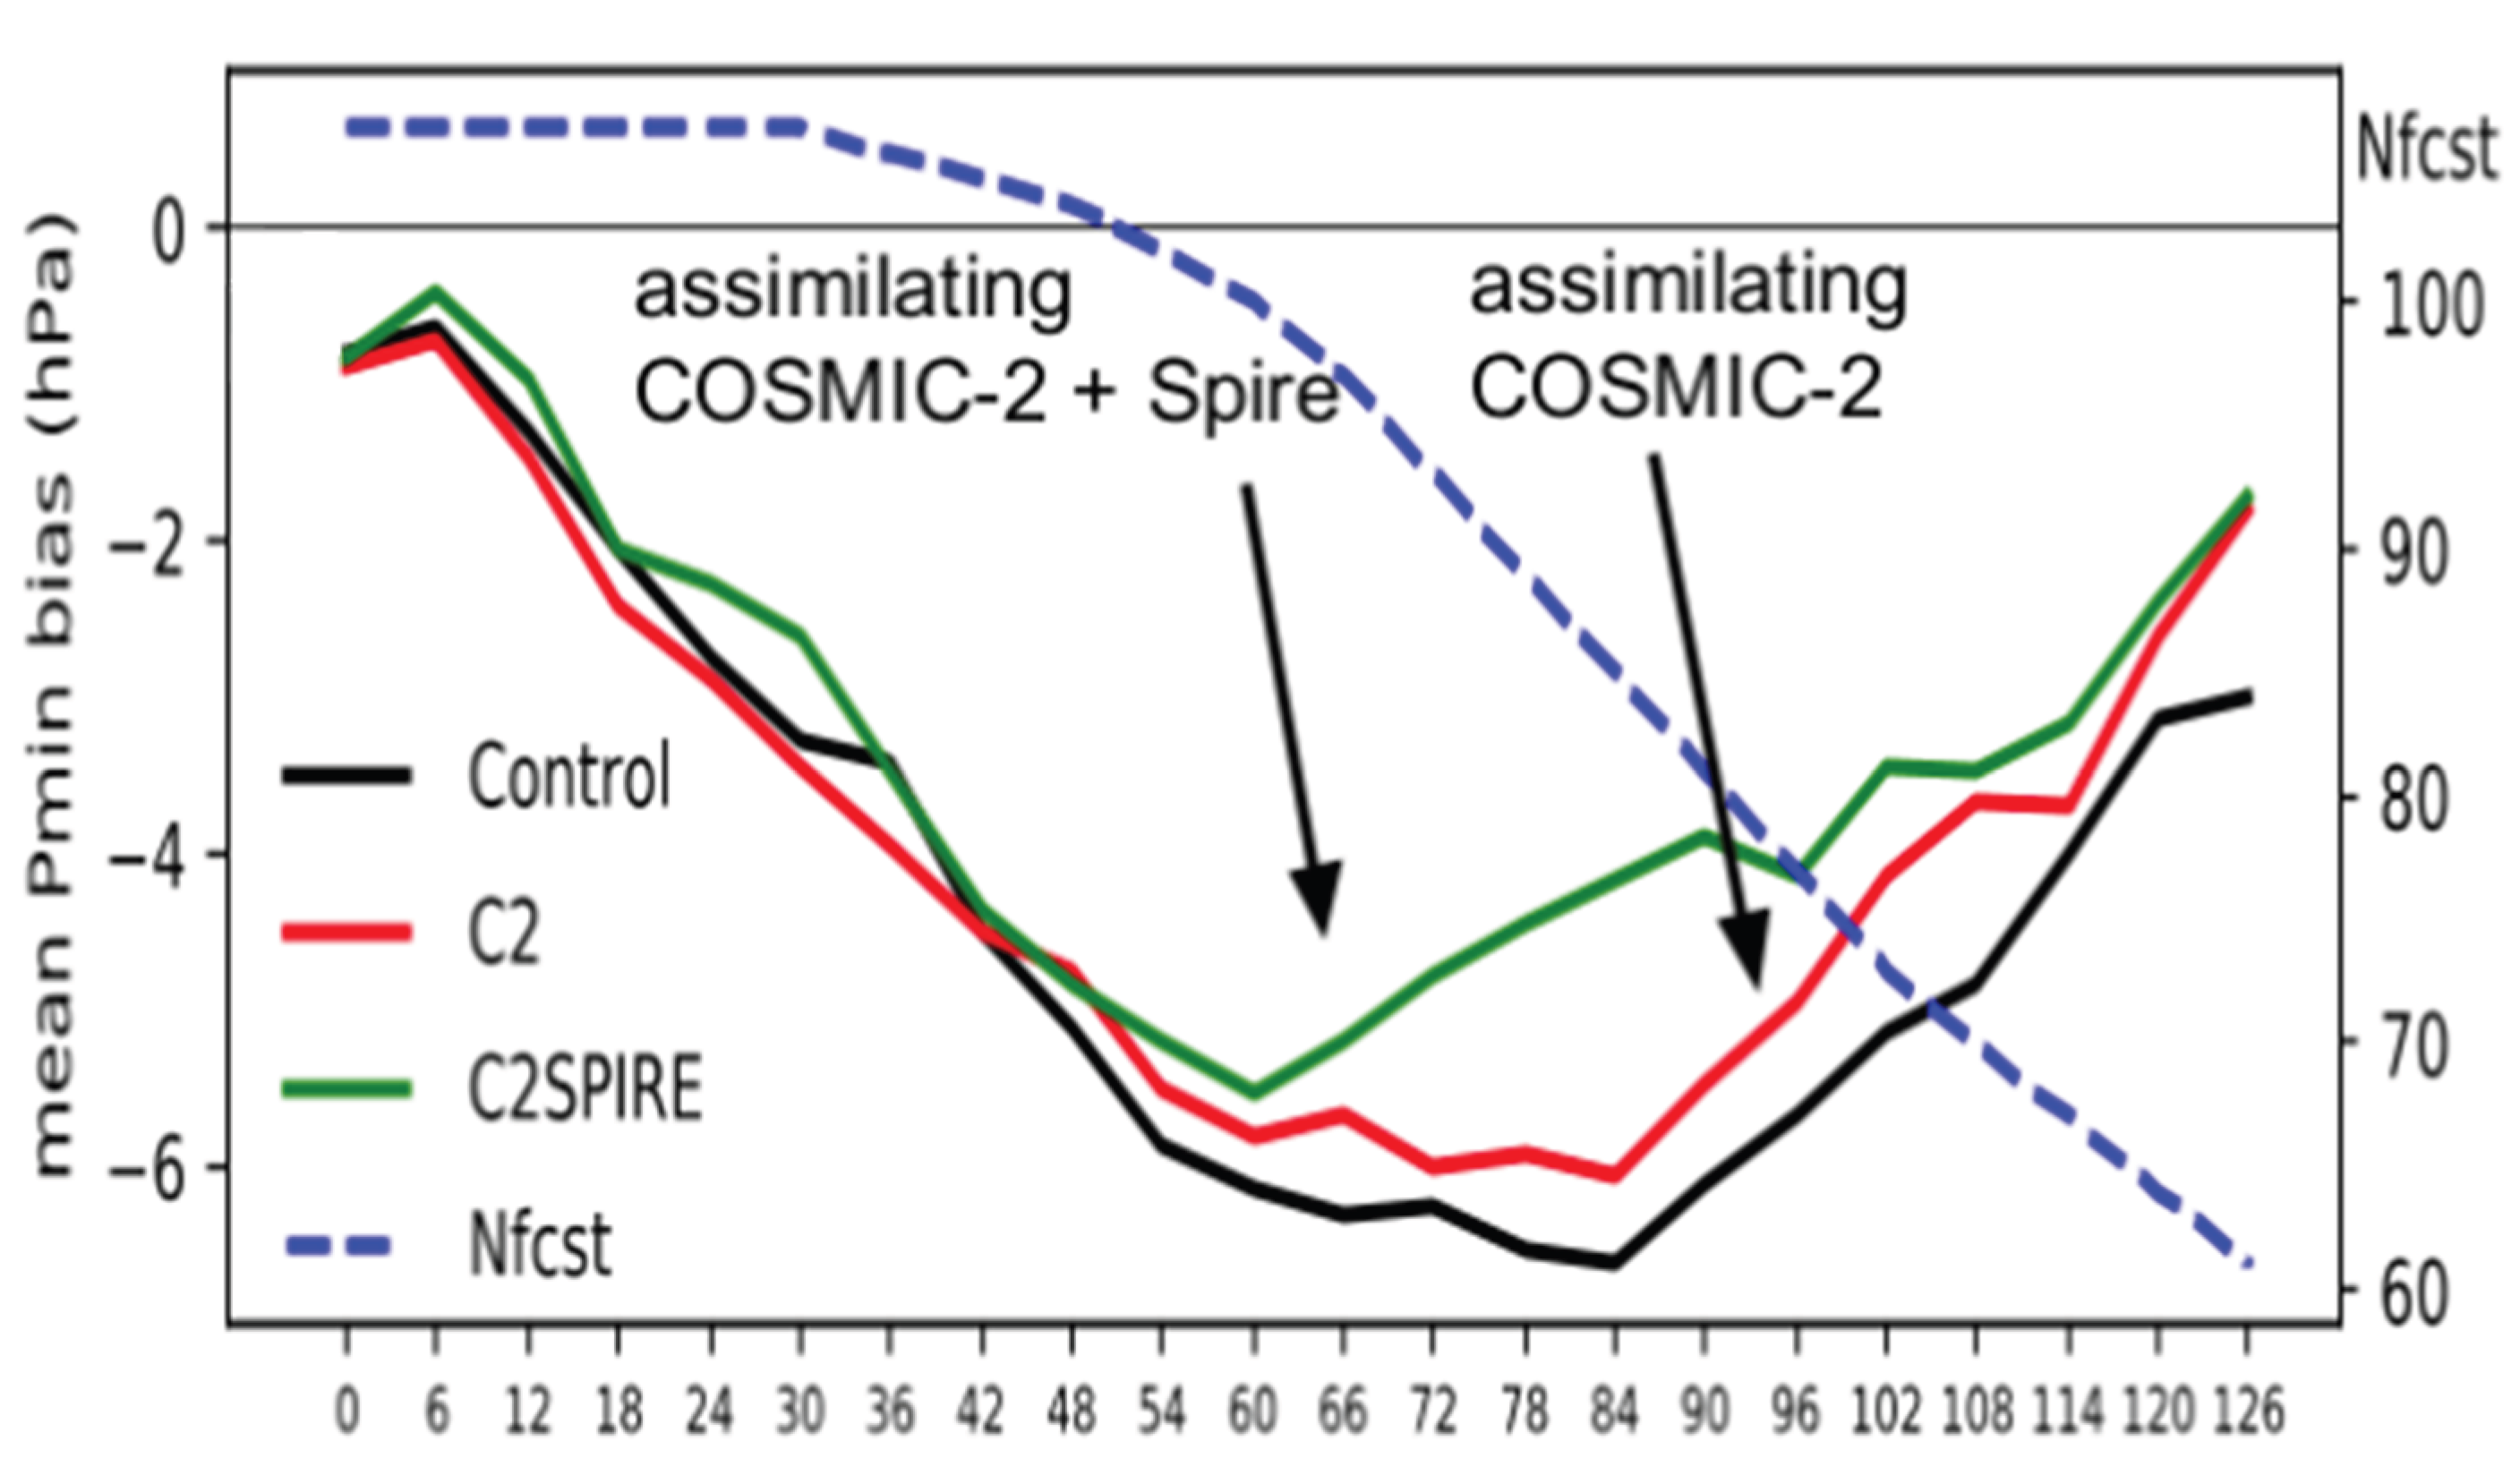
Figure 12.
Time–height plot of the HAFS forecast specific-humidity RMSD percentage ratio relative to ERA5, defined as 100 × RMSD_ROMEX/RMSD_Control, where ROMEX assimilated Spire and PlanetiQ in addition to the observations in Control. Crosses and triangles denote statistically significant RMSD differences at the 95% and 99% confidence levels, respectively. Eighty-four HAFS forecasts were used for verification.
Figure 12.
Time–height plot of the HAFS forecast specific-humidity RMSD percentage ratio relative to ERA5, defined as 100 × RMSD_ROMEX/RMSD_Control, where ROMEX assimilated Spire and PlanetiQ in addition to the observations in Control. Crosses and triangles denote statistically significant RMSD differences at the 95% and 99% confidence levels, respectively. Eighty-four HAFS forecasts were used for verification.
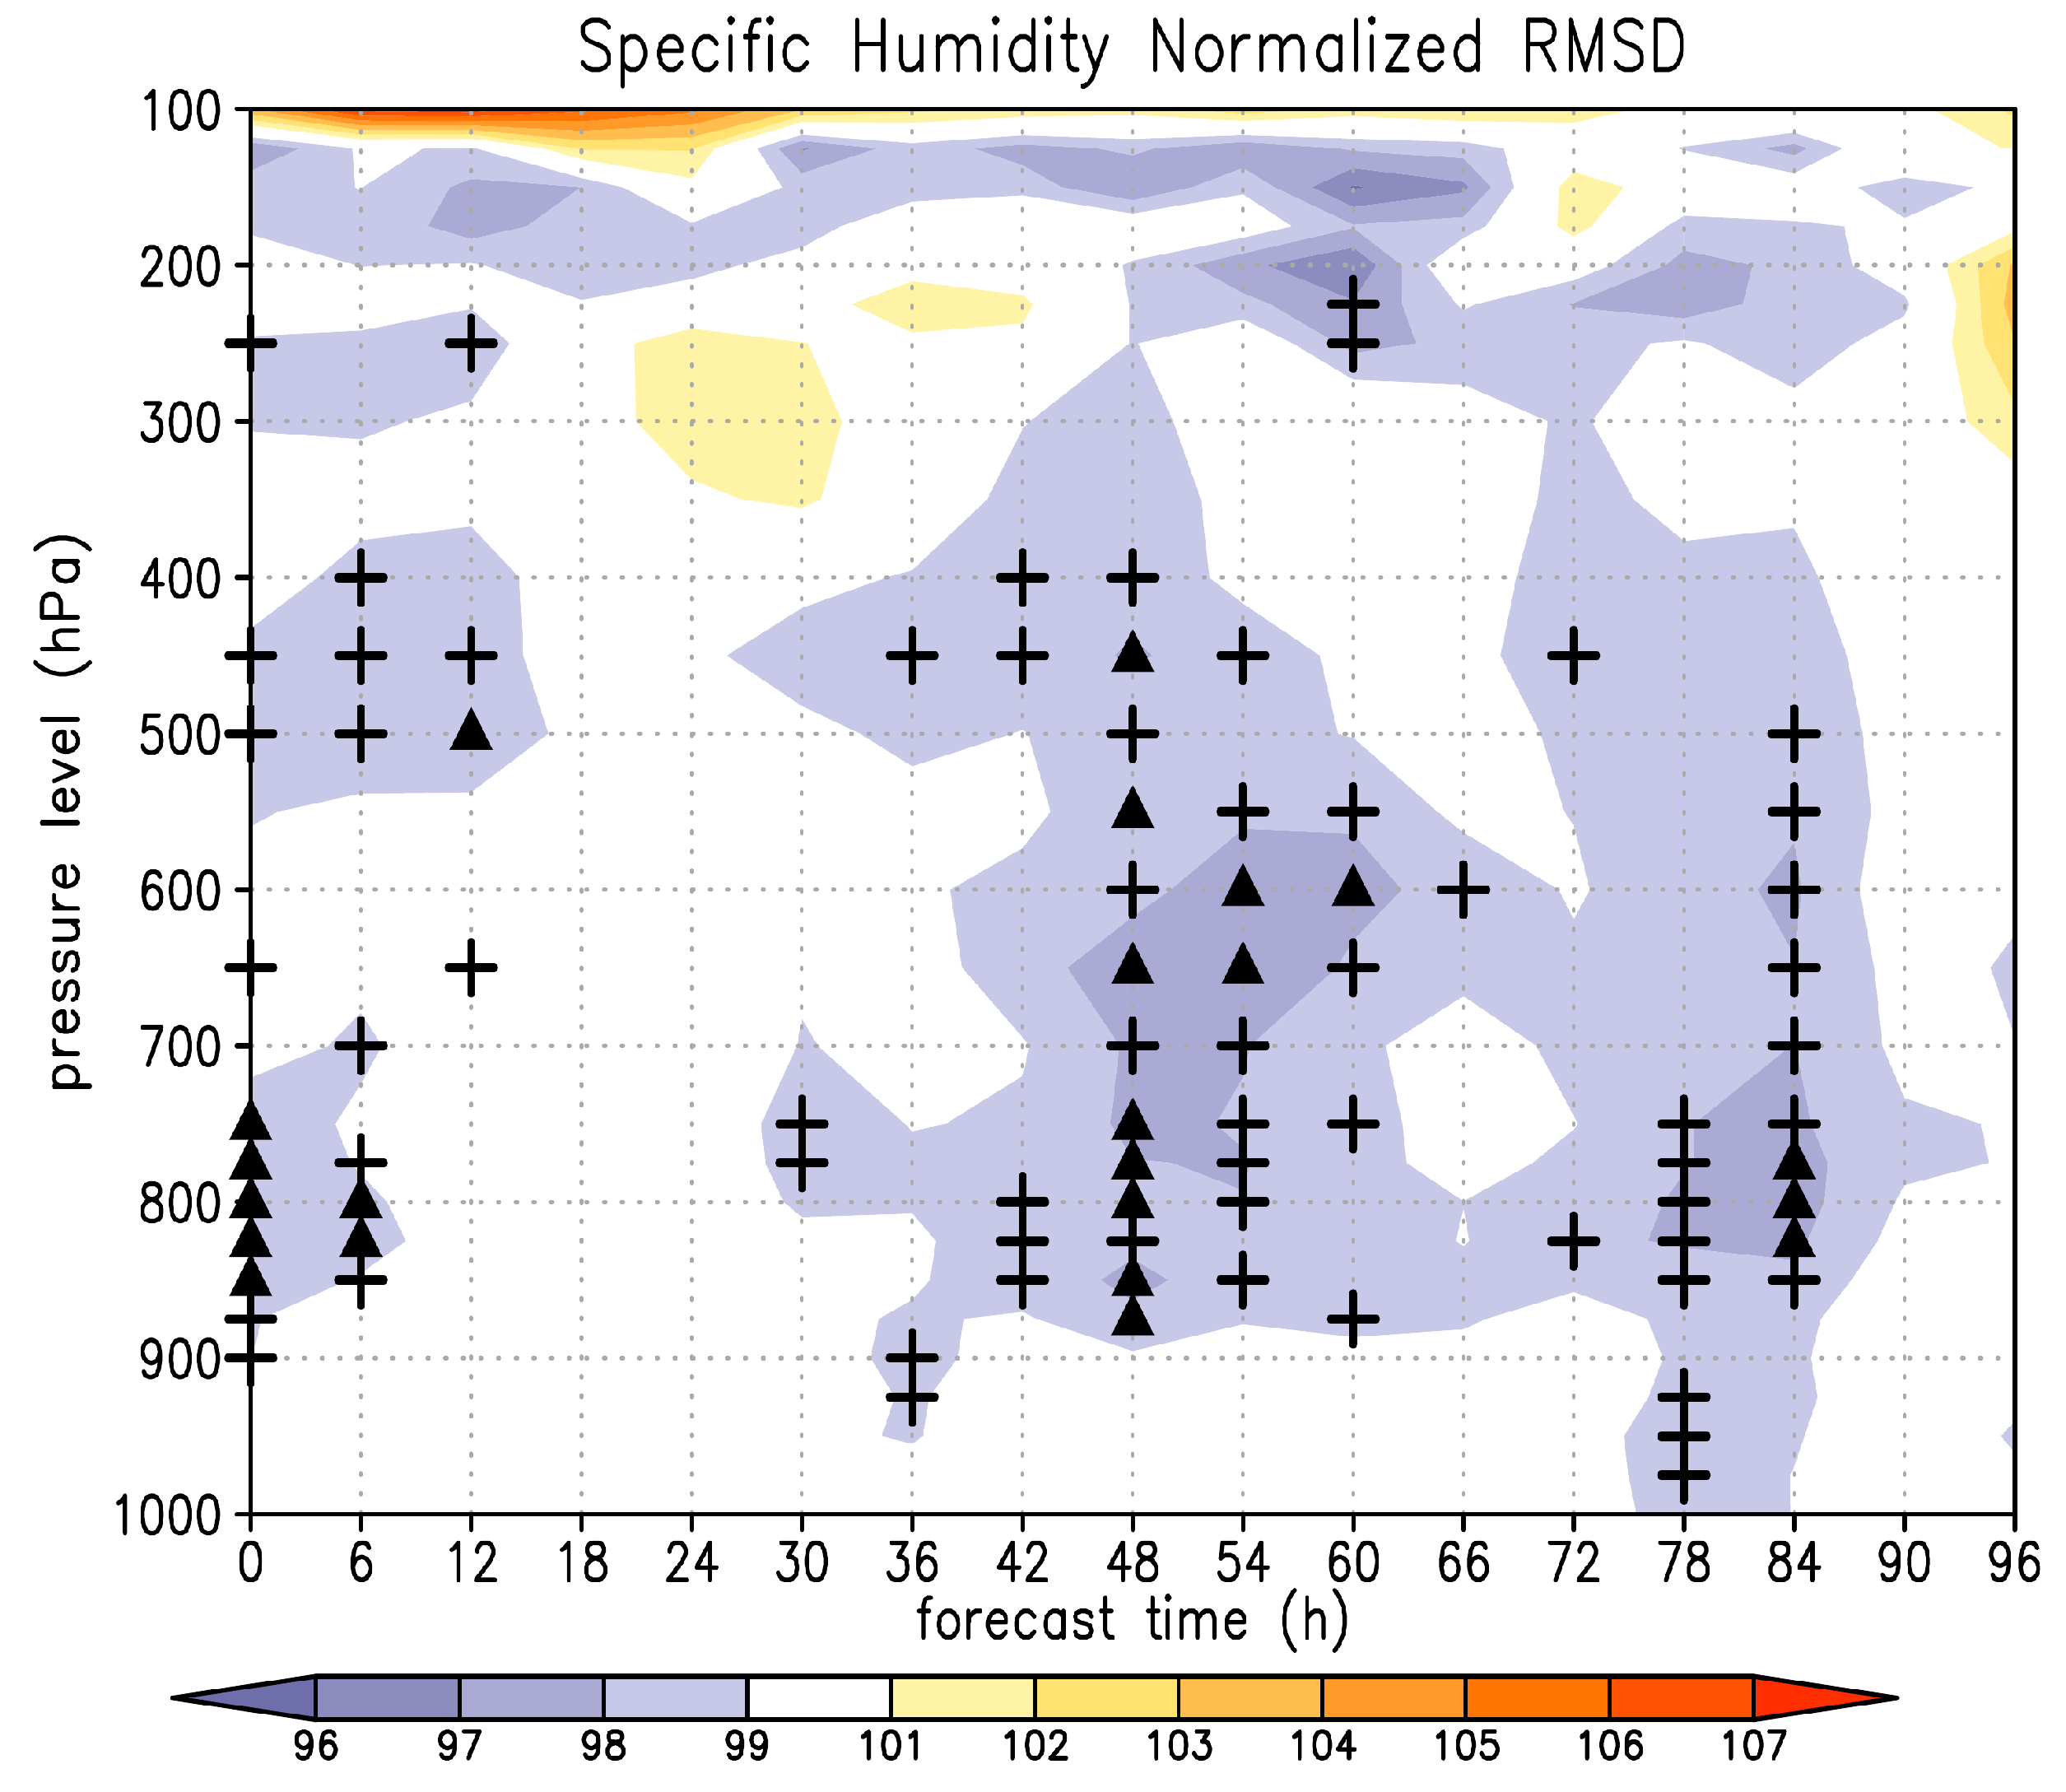
Figure 13.
(a) Bending-angle observation-error profile used for all GNSS RO platforms assimilated by ECMWF, specified as a percentage of observed bending angle. (b) COSMIC-2 bending-angle error standard-deviation profiles estimated with the three-cornered-hat (3CH) method for August 2021 and stratified into 10° latitude bands. The 3CH calculations compared COSMIC-2 observations with bending angles computed using a one-dimensional forward operator from refractivity derived from ERA5 short-term forecasts and NASA’s Modern-Era Retrospective Analysis for Research and Applications version 2 (MERRA-2) 6-h-old analyses as comparison datasets. (c) Same as (b), enlarged for the 0–10 km impact-height layer. (a) Image courtesy of ECMWF. (b,c) From Anthes et al. [59].
Figure 13.
(a) Bending-angle observation-error profile used for all GNSS RO platforms assimilated by ECMWF, specified as a percentage of observed bending angle. (b) COSMIC-2 bending-angle error standard-deviation profiles estimated with the three-cornered-hat (3CH) method for August 2021 and stratified into 10° latitude bands. The 3CH calculations compared COSMIC-2 observations with bending angles computed using a one-dimensional forward operator from refractivity derived from ERA5 short-term forecasts and NASA’s Modern-Era Retrospective Analysis for Research and Applications version 2 (MERRA-2) 6-h-old analyses as comparison datasets. (c) Same as (b), enlarged for the 0–10 km impact-height layer. (a) Image courtesy of ECMWF. (b,c) From Anthes et al. [59].
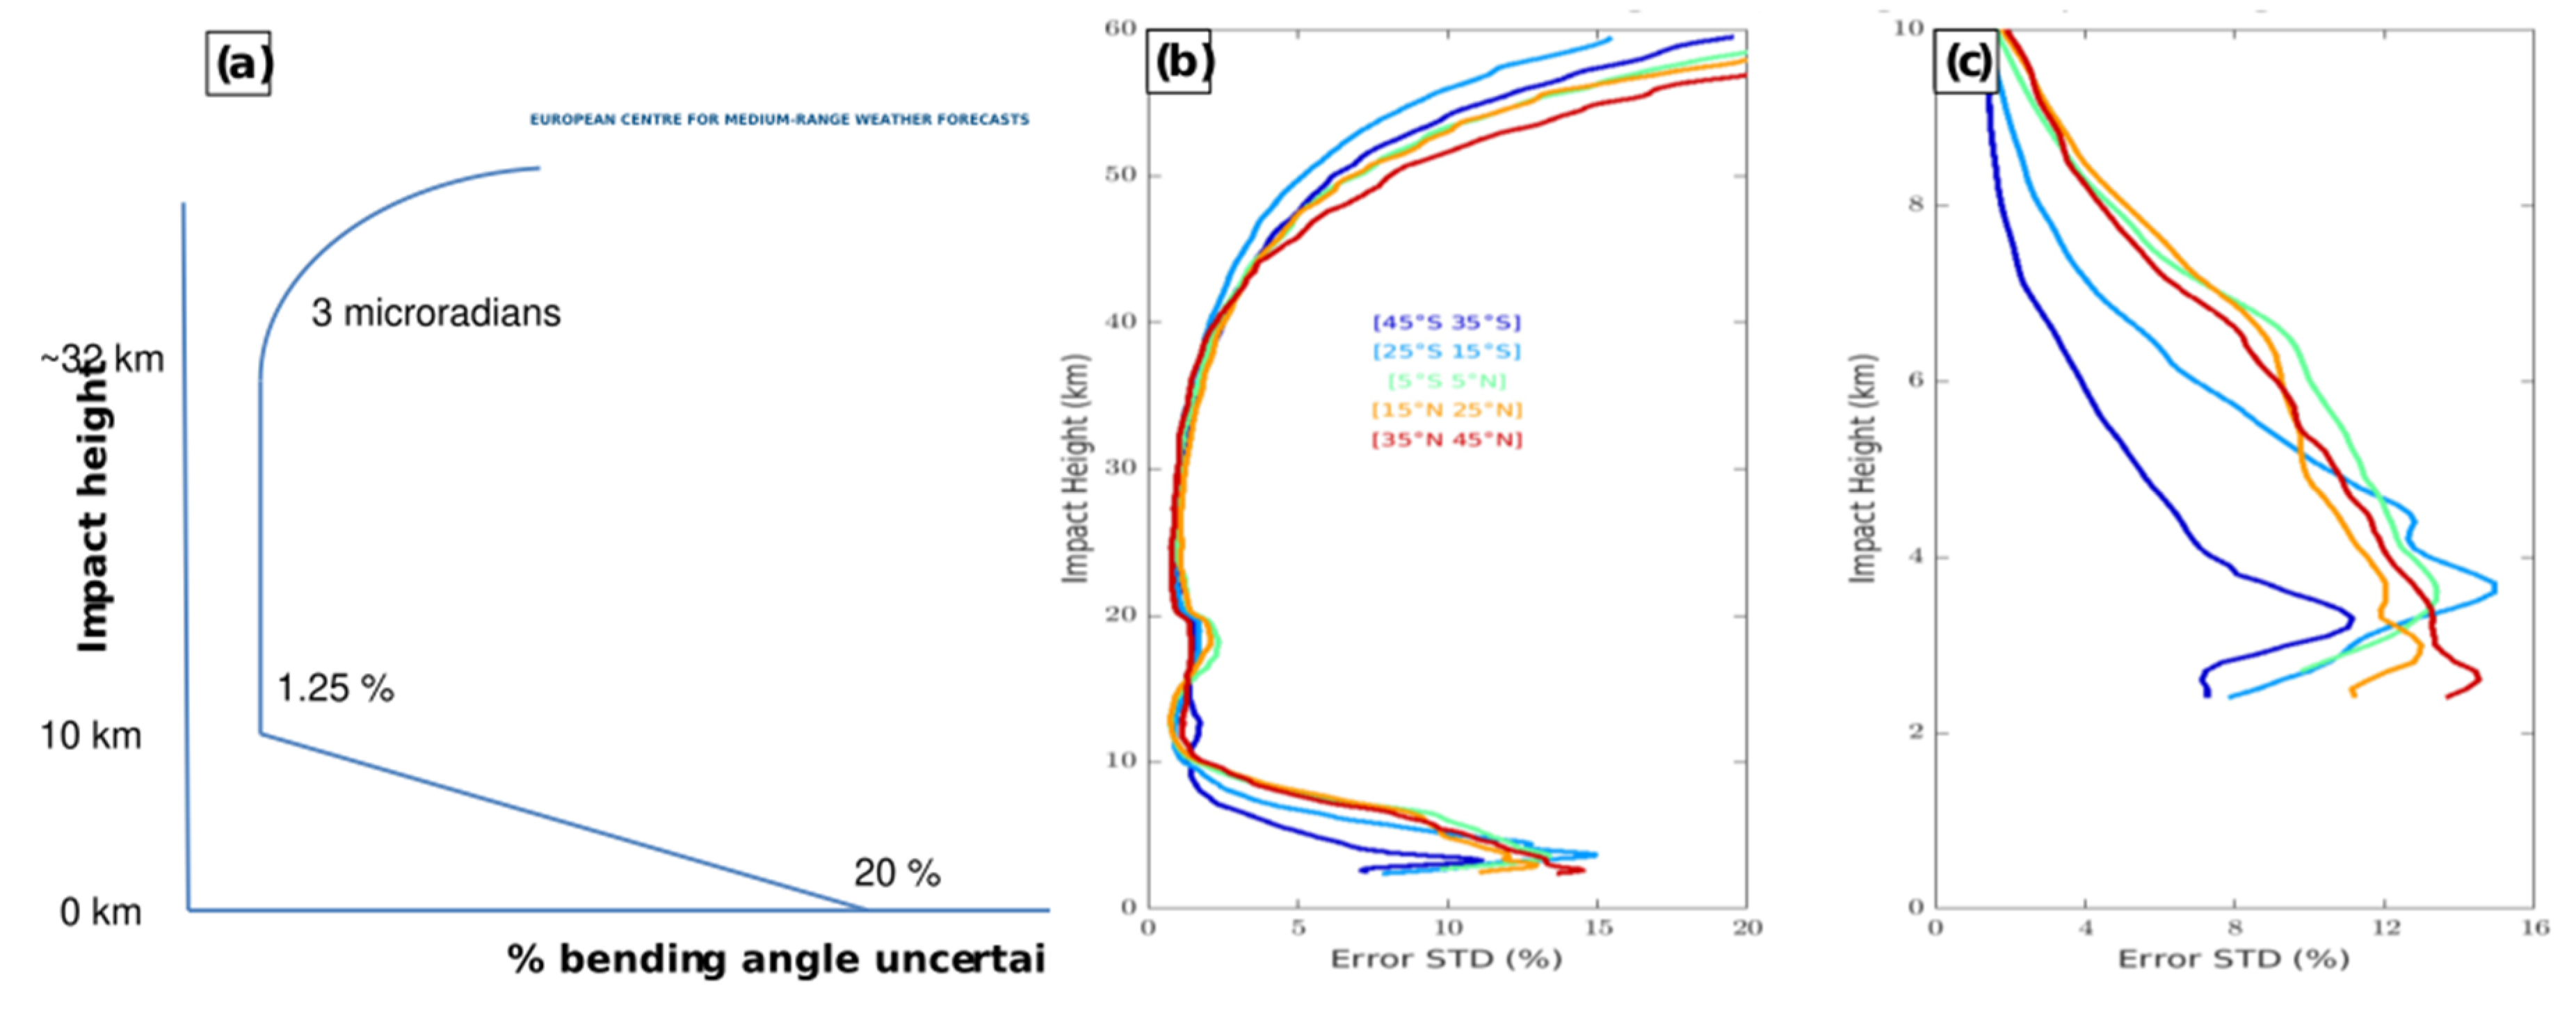
Figure 14.
Measures of temperature consistency for collocated COSMIC-1–MetOp (blue), COSMIC-2–MetOp (red), and Spire–MetOp (green) pairs in the 20–30 km layer for (a) the globe (90°N–90°S), (b) Northern Hemisphere polar region (NHP, 90°N–60°N), (c) Northern Hemisphere subtropics and midlatitudes (NHSM, 60°N–20°N), (d) tropics (TRO, 20°N–20°S), (e) Southern Hemisphere subtropics and midlatitudes (SHSM, 20°S–60°S), and (f) Southern Hemisphere polar region (SHP, 60°S–90°S). COSMIC-2 data cover 45°N–20°N in NHSM and 20°S–45°S in SHSM.
Figure 14.
Measures of temperature consistency for collocated COSMIC-1–MetOp (blue), COSMIC-2–MetOp (red), and Spire–MetOp (green) pairs in the 20–30 km layer for (a) the globe (90°N–90°S), (b) Northern Hemisphere polar region (NHP, 90°N–60°N), (c) Northern Hemisphere subtropics and midlatitudes (NHSM, 60°N–20°N), (d) tropics (TRO, 20°N–20°S), (e) Southern Hemisphere subtropics and midlatitudes (SHSM, 20°S–60°S), and (f) Southern Hemisphere polar region (SHP, 60°S–90°S). COSMIC-2 data cover 45°N–20°N in NHSM and 20°S–45°S in SHSM.
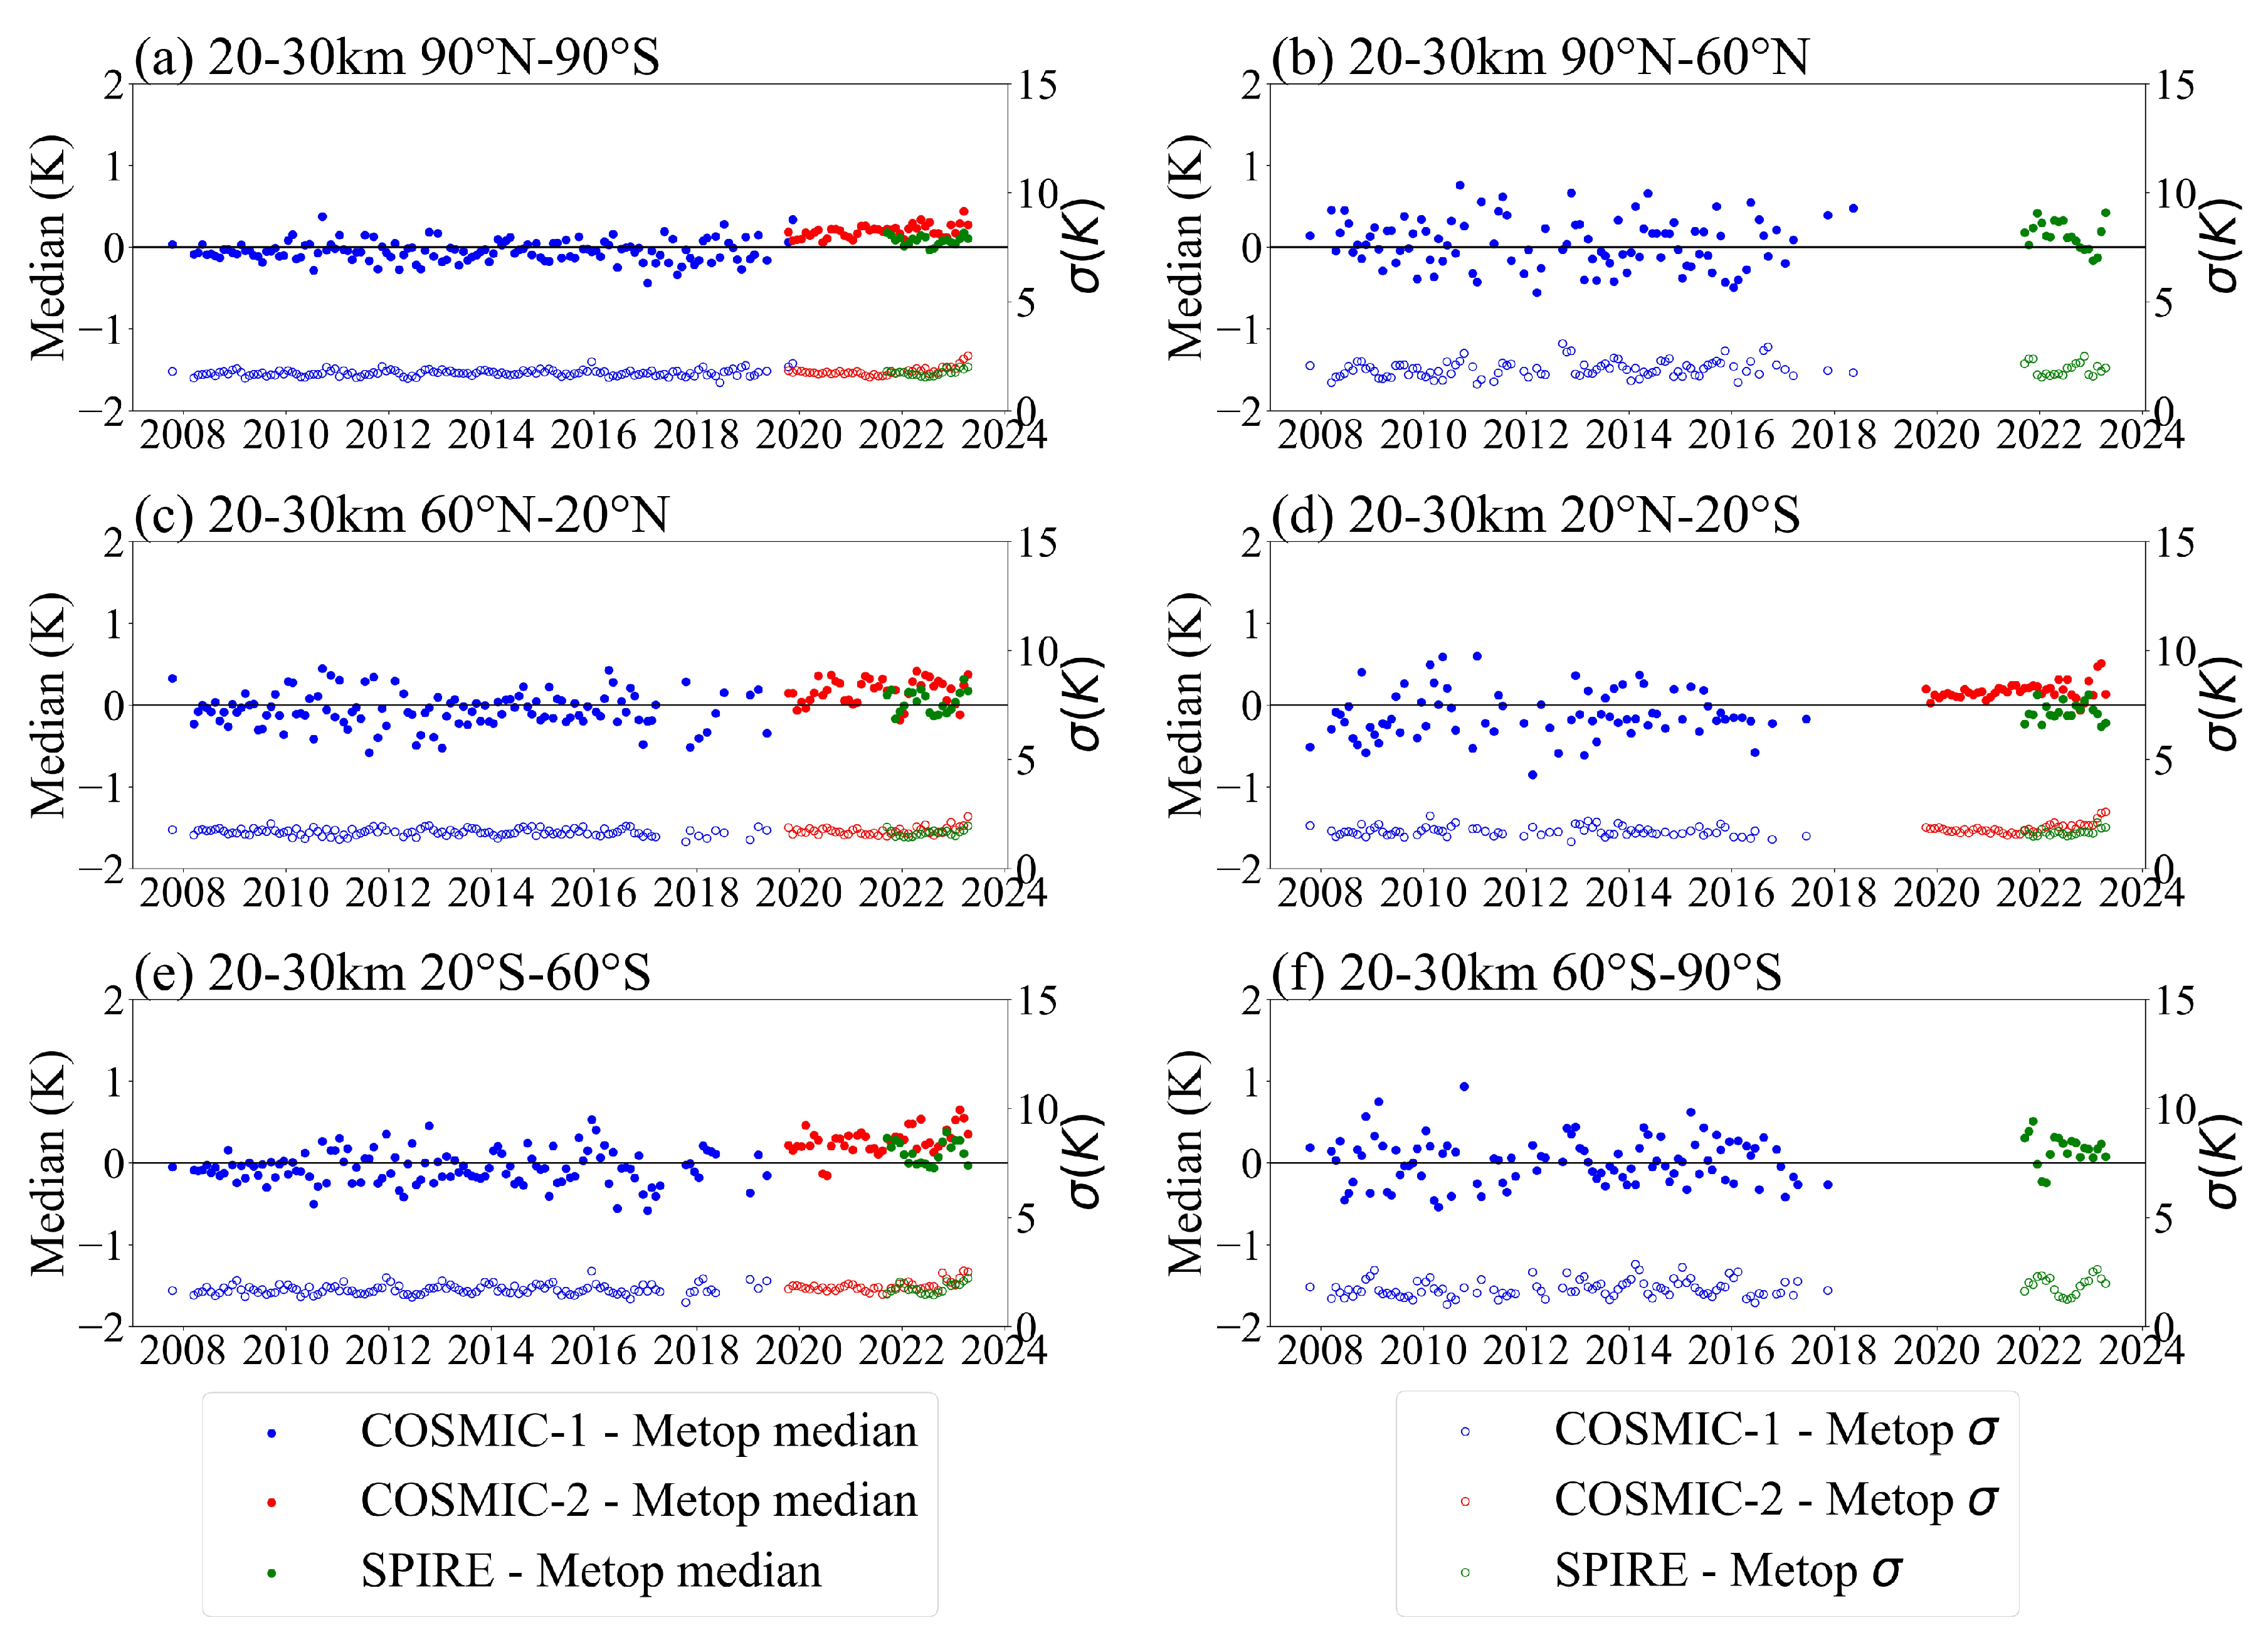
Figure 15.
Measures of consistency between collocated COSMIC-1 and MetOp (blue), Spire and MetOp (green), and COSMIC-2 and MetOp pairs (red) as a function of height for the globe and the 45°N–45°S region. The central 68% range is defined as the interval centered on the median that contains 68% of the counts, equivalent to the standard deviation for a Gaussian distribution (Figure 7 of [22]).
Figure 15.
Measures of consistency between collocated COSMIC-1 and MetOp (blue), Spire and MetOp (green), and COSMIC-2 and MetOp pairs (red) as a function of height for the globe and the 45°N–45°S region. The central 68% range is defined as the interval centered on the median that contains 68% of the counts, equivalent to the standard deviation for a Gaussian distribution (Figure 7 of [22]).
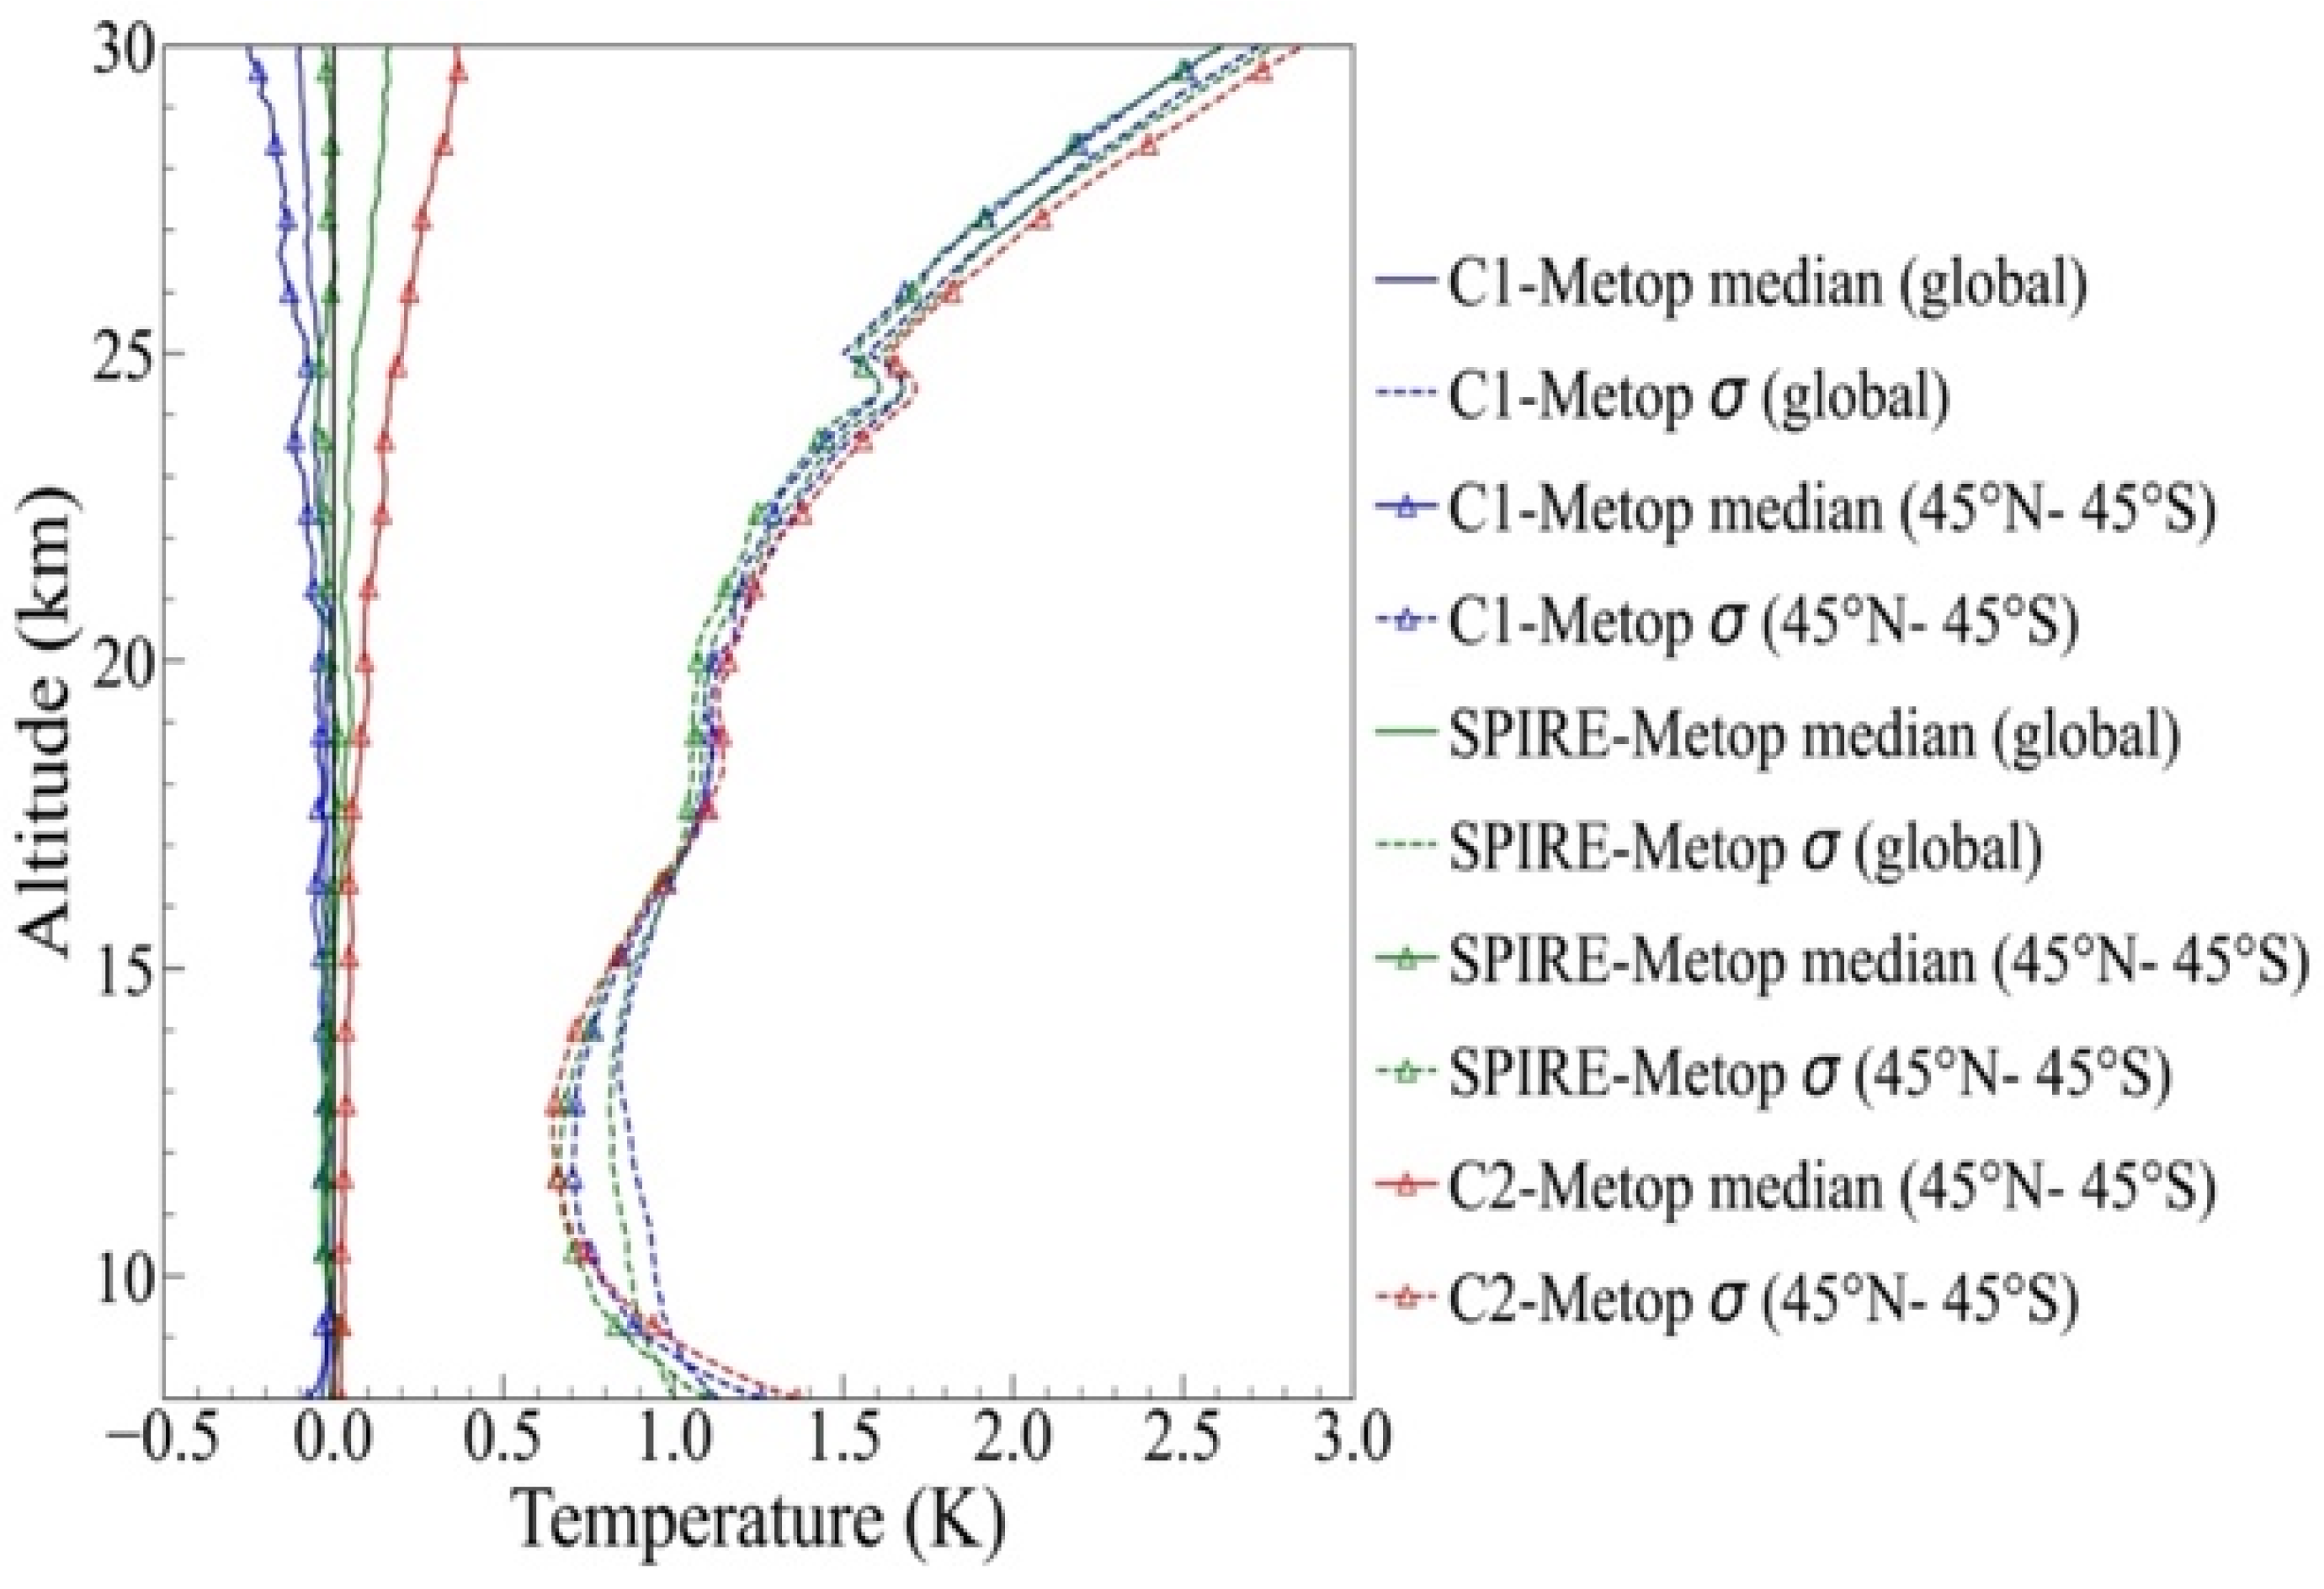
Figure 16.
Vertically resolved temperature trends for September 2006–July 2023 estimated from STAR-ROPP (red), ERA5 (black), JRA-55 (blue), and MERRA-2 (green) for (a) the globe (90°S–90°N) and (b) the tropics (TRO, 20°S–20°N). Error bars represent trend uncertainty at the 95% confidence level (Figure 14 of [22]).
Figure 16.
Vertically resolved temperature trends for September 2006–July 2023 estimated from STAR-ROPP (red), ERA5 (black), JRA-55 (blue), and MERRA-2 (green) for (a) the globe (90°S–90°N) and (b) the tropics (TRO, 20°S–20°N). Error bars represent trend uncertainty at the 95% confidence level (Figure 14 of [22]).
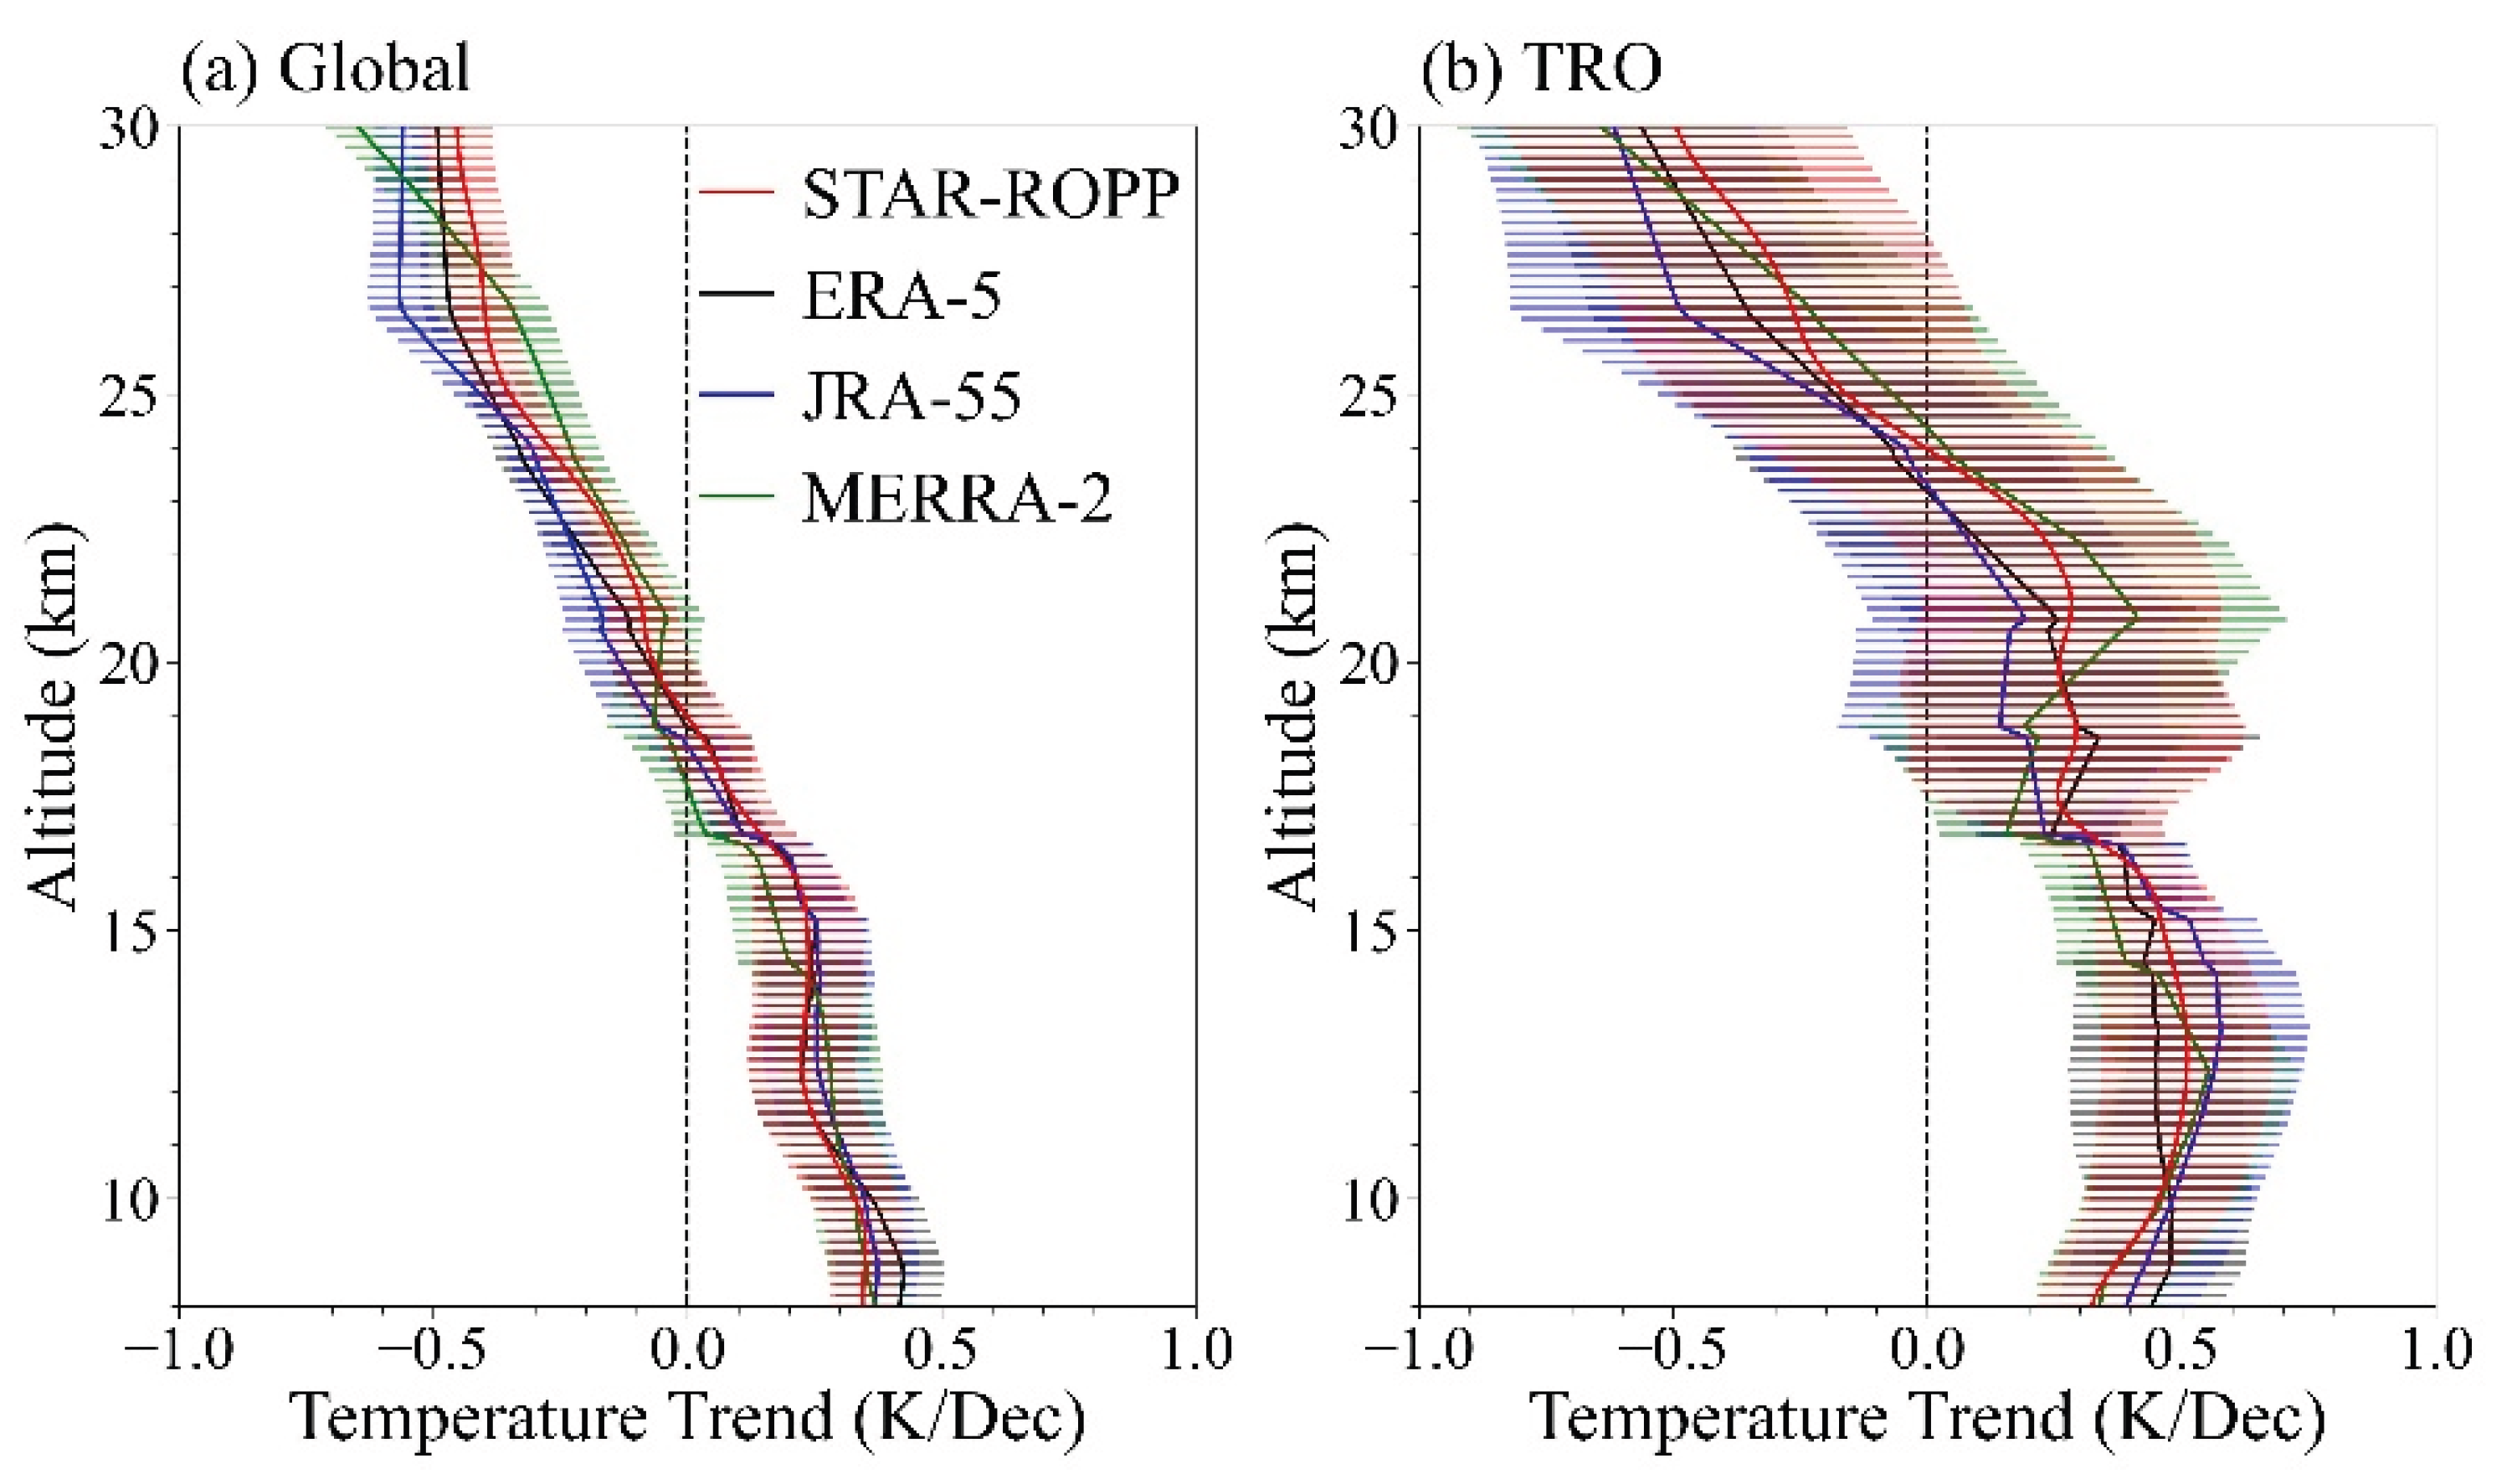
Figure 17.
Scatterplot of Spire versus COSMIC-2 mean PBLH in the three marine stratocumulus cloud-dominated regions [SE Pacific (15°–25°S, 70°–85°W), SE Atlantic (5°–25°S, 0°–20°W), and SE Indian Ocean (15°–35°S, 70°–112°E)] combined during June–August 2022 after binning to 2° × 2° global grids.
Figure 17.
Scatterplot of Spire versus COSMIC-2 mean PBLH in the three marine stratocumulus cloud-dominated regions [SE Pacific (15°–25°S, 70°–85°W), SE Atlantic (5°–25°S, 0°–20°W), and SE Indian Ocean (15°–35°S, 70°–112°E)] combined during June–August 2022 after binning to 2° × 2° global grids.
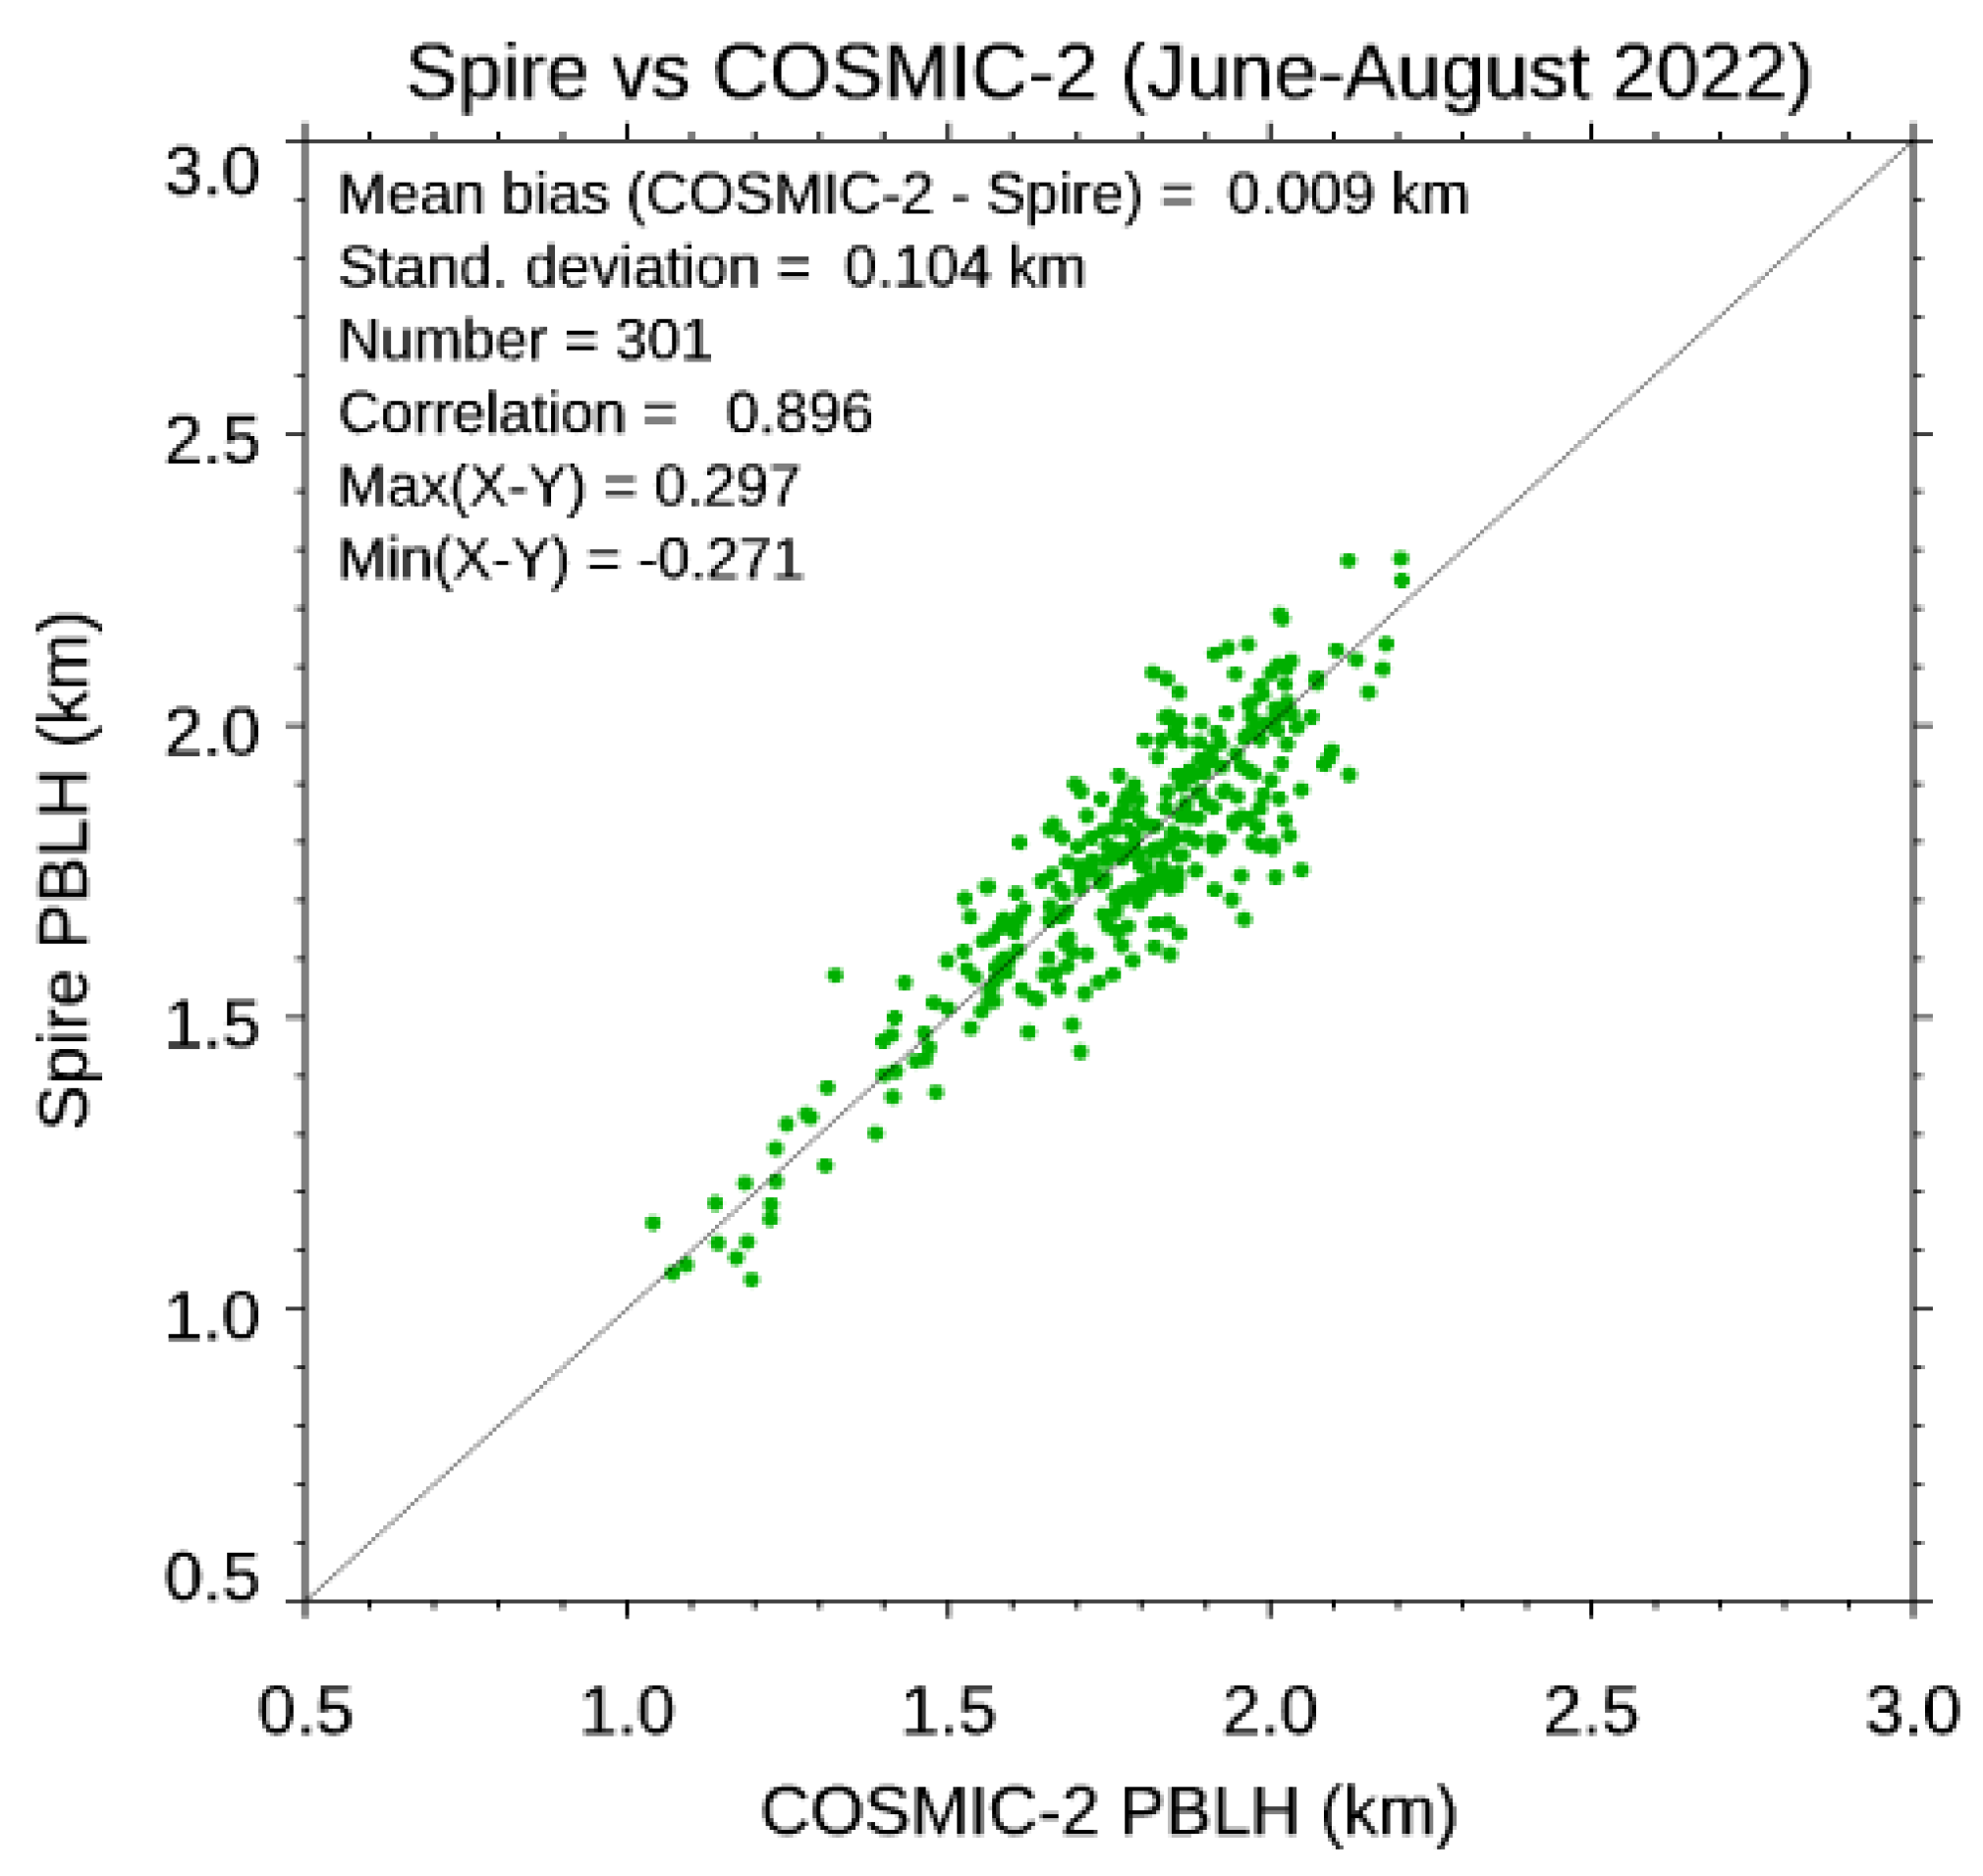

Table 1.
Timeline of NOAA commercial RO data-purchase periods.
| Program / Delivery Order (DO) | Period | Major Vendors |
| CWDP Round 1/2 | 2016–2019 | GeoOptics and Spire Global |
| RODB-1 (DO-1 to DO-4) | 2020–2022 | GeoOptics, Spire Global, and PlanetiQ |
| RODB-2 (DO-5) | 2023–2028 | Spire Global and PlanetiQ |
Table 2.
Receivers, RO antenna types, tracked GNSS constellations, signal sampling rates, and POD antenna characteristics for COSMIC-2, Spire, MetOp-B, MetOp-C, and PlanetiQ. G: GPS; R: GLONASS; E: Galileo; C: Beidou; E*: available after 09/25/2024.
Table 2.
Receivers, RO antenna types, tracked GNSS constellations, signal sampling rates, and POD antenna characteristics for COSMIC-2, Spire, MetOp-B, MetOp-C, and PlanetiQ. G: GPS; R: GLONASS; E: Galileo; C: Beidou; E*: available after 09/25/2024.
| Spire (>20) | PlanetiQ | COSMIC-2 (6) | MetOp-B/-C | |
| Receiver | STRATOS | PYXIS | TGRS | GRAS |
| RO Antenna | 2/G, R, E (50 Hz) | 2/G, R, E, C (G/R/C: 100 Hz; E: 125 Hz) | 2/G, R, E* (100 Hz) | 2/G (50 Hz) |
| POD Antenna | 1/G, 1 Hz/50 Hz | 2/G, R, 1 Hz | 2/G, R, 1 Hz only | 1/G, 1 Hz |
Table 3.
Lowest penetration heights corresponding to 80% of the profiles for different RO missions and latitude zones. An em dash indicates that COSMIC-2 did not provide coverage in the corresponding latitude band for this comparison.
Table 3.
Lowest penetration heights corresponding to 80% of the profiles for different RO missions and latitude zones. An em dash indicates that COSMIC-2 did not provide coverage in the corresponding latitude band for this comparison.
| 10°N–10°S | 30°N–10°N | 10°S–30°S | 45°N–30°N | 30°S–45°S | 60°N–45°N | 45°S–60°S | 90°N–60°N | 60°S–90°S | |
| COSMIC-2 | 0.79 | 0.64 | 0.54 | 0.99 | 0.60 | — | — | — | — |
| Spire | 0.64 | 0.71 | 0.55 | 0.58 | 0.35 | 0.38 | 0.22 | 0.18 | 0.11 |
| PlanetiQ | 0.72 | 0.73 | 0.61 | 0.59 | 0.36 | 0.38 | 0.22 | 0.24 | 0.10 |
Table 4.
Average daily numbers of RO profiles processed by the STAR GNSS RO program for the listed missions.
Table 4.
Average daily numbers of RO profiles processed by the STAR GNSS RO program for the listed missions.
| Mission | RO per day |
| COSMIC-2 | 6000 |
| PlanetiQ | 3000 |
| Spire | 3000 |
| KOMPSAT-5 | 500 |
| PAZ | 200 |
| GRAS MetOp-A | 300 |
| GRAS MetOp-B | 500 |
| GRAS MetOp-C | 500 |
| COSMIC-1 | 2500 |
| TanDEM-X | 500 |
Table 5.
Review-derived priorities for multi-mission GNSS RO research and operations.
| Priority | Research or operational question | Evaluation criterion |
| Lower-atmospheric signal retention | How should cutoff, filtering, and wave-optics processing adapt to mission design and atmospheric regime? | Greater usable penetration without increased retrieval bias or uncertainty |
| Dynamic uncertainty and quality control | Can retrieval diagnostics and environmental indicators support profile- or regime-dependent error weighting? | Calibrated departures and increased beneficial lower-tropospheric use in data assimilation |
| Super-refraction and ducting | When can auxiliary precipitable-water or grazing-signal information correct refractivity and moisture biases? | Robust improvement across missions and independent reference datasets |
| Climate continuity | How can mission transitions, sampling changes, and processing updates be prevented from contaminating long-term records? | Demonstrated stability, overlap consistency, sampling control, and reproducible reprocessing |
| Observing-system design | What balance of measurement quality, profile volume, coverage, latency, and continuity maximizes application value? | Consistent incremental impact across FSOI, OSE, regional, and environmental-product evaluations |
Disclaimer/Publisher’s Note: The statements, opinions and data contained in all publications are solely those of the individual author(s) and contributor(s) and not of MDPI and/or the editor(s). MDPI and/or the editor(s) disclaim responsibility for any injury to people or property resulting from any ideas, methods, instructions or products referred to in the content. |
© 2026 by the authors. Licensee MDPI, Basel, Switzerland. This article is an open access article distributed under the terms and conditions of the Creative Commons Attribution (CC BY) license (http://creativecommons.org/licenses/by/4.0/).
Copyright: This open access article is published under a Creative Commons CC BY 4.0 license, which permit the free download, distribution, and reuse, provided that the author and preprint are cited in any reuse.