

Submitted:
04 September 2026
Posted:
08 September 2026
You are already at the latest version
Abstract
Kill-web absorption resilience depends on whether directed mission paths remain available after disruption. This study addresses how to allocate a limited fortification budget to mission-function nodes so that an adaptive interdictor must incur the greatest possible cost to disconnect all valid mission paths. We formulate Mission-Path Cut Fortification ( MPCF), which maximizes the post-fortification minimum node-cut cost. Node-capacity splitting converts the interdiction response for a fixed fortification set into an equivalent maximum-flow minimum-cut problem. A compact mixed-integer linear program provides the primary exact solution, and an independent cut-generation formulation cross-checks the optimum in cut space. Across 135 graph-budget pairs from 45 prespecified synthetic networks, the mean optimality gaps of MPCF-Greedy and PathFrequency are 2.76% and 9.50%, respectively. Across 810 combinations under six role-composition profiles, the two exact formulations obtain identical objective values; MPCF-Greedy has a mean gap of 1.98%, whereas the best non-MPCF method under each profile has a mean gap of 8.11%–10.12%. Exact optimization also agrees with exhaustive enumeration on 72 small fortification instances and 72 capacity-interdiction instances, and cut-space verification agrees on 30 public-network instances. These results show that mission-path fortification benefits from joint optimization of the protected node set and the adaptive minimum-cut response.
Keywords:
kill web
; mission thread
; network fortification
; network interdiction
; minimum node cut
; critical nodes
; mixed-integer linear programming
; cut generation
1. Introduction
Distributed combat systems, exemplified by unmanned swarms, rely on cross-domain coordination among sensing, command and control, communications, and effectors. Kill-web nodes are heterogeneous in their physical attributes, information-processing capabilities, and mission functions, and a single piece of equipment or communication link generally cannot accomplish a mission independently. These resources must be organized according to sensing, command and control, information exchange, and effect relationships to form an end-to-end mission thread that spans mission initiation and completion. The effectiveness of a kill web therefore depends on whether heterogeneous resources can coordinate according to mission logic[1,2,3,4].
This study abstracts the connectivity relationships directly associated with a specific mission at the mission-functional level. Based on the functional activities in a mission thread, the command-and-control, communication, and equipment resources required, together with their coordination relationships, are aggregated into mission-functional nodes. Directed relationships are then established according to information transmission, command dependencies, and effect sequence, thereby forming a mission-functional graph. A valid path from a mission source to a mission sink in the graph corresponds to a feasible mission execution chain; failure of a mission-functional node indicates that the associated resources can no longer provide the prescribed function. Node criticality is jointly determined by its functional position in the mission thread, the dependencies among nodes, and alternative paths, and cannot be characterized solely by its local topological position.
Resilience is commonly described through changes in system performance over time, covering preparation before a disturbance, absorption of the disturbance, recovery, and adaptation[5,6,7]. The absorption phase concerns the ability of a system to tolerate performance loss and maintain critical functions after a disturbance. Existing studies do not use fully consistent phase boundaries for absorption, degradation, and the maintenance of a low-performance state[6]. Here, the interval from disturbance onset until recovery or dynamic reconfiguration takes effect is defined as the absorption phase, and the analysis examines the ability of the system to withstand node failures through existing redundancy, substitution relationships, and pre-emptive protection. The problem addressed by pre-emptive fortification is how to allocate limited protection resources so that critical missions remain executable before recovery measures take effect.
Mission capability during the absorption phase can be measured by whether the end-to-end mission-functional chain remains intact. As long as at least one valid directed path satisfying the constraints remains between the mission source and mission sink, the mission retains the functional basis for continuous execution; when all valid paths are blocked, the mission thread becomes fully disconnected. Given a fortification scheme, the minimum node interdiction cost required to disable all valid paths reflects the difficulty of fully disconnecting the mission. A larger value indicates that the specified protection configuration can withstand stronger node interdiction.
Conventional studies of network robustness and network dismantling describe structural degradation after node removal using metrics such as the size of the giant connected component, the size of a decycling set, or the percolation threshold[7,8,9]. Mission-functional fortification instead concerns source–sink functional connectivity for a specific mission thread, and the two settings use different performance criteria. In a kill web with directionality, functional hierarchies, and mission-endpoint constraints, the failure of a small number of mission-functional nodes may cut all valid mission paths while the overall network remains connected. Conversely, even when the overall structure undergoes substantial degradation, a given mission may continue if valid alternative paths remain. Studies of transportation and critical infrastructure likewise find that critical-node rankings can diverge from purely topological rankings when demand, flow direction, and functional dependencies are incorporated[10,11]. Pre-emptive protection during the absorption phase should therefore be evaluated in terms of the end-to-end functional connectivity defined by the mission thread.
Fortification under a limited budget also involves selecting a node set. Complete mission disconnection corresponds to a node cut that intersects all valid paths, while a fortification scheme changes the interdiction costs of multiple candidate cuts simultaneously. Once the current minimum cut is strengthened, another candidate cut may become the new minimum-cost interdiction location. The value of an individual node therefore depends on nodes in the same cut, alternative cuts, and the existing fortification set; sequential selection based on fixed node scores may leave a new low-cost route after the minimum cut switches. Pre-emptive fortification must jointly select nodes within the feasible budget region and account for node complementarity and competition among candidate cuts. Network interdiction and network fortification provide an operations-research basis for pre-emptive fortification with post-disturbance interdiction response[12,13,14], but existing models mostly target arc capacities, shortest paths, or binary immunity protection and do not simultaneously incorporate mission-functional aggregation, directed mission paths, finite node-fortification increments, and a complete-disconnection criterion.
This study investigates pre-emptive fortification of a heterogeneous kill web under a limited budget. Given a mission thread and its mission-functional graph, the interdiction and fortification costs of candidate nodes, the interdiction-cost increments produced by fortification, and the total budget, the objective is to select a node set within the budget constraint to maximize the minimum cost required to block all valid mission paths. The evaluation metric is the minimum-weight s–t node-cut value of the fortified mission network, namely, the minimum node-interdiction cost required to fully disconnect the mission source and mission sink under a given fortification configuration.
For this problem, we propose the Mission-Path Cut Fortification (MPCF) model, which jointly selects nodes within the feasible budget region and maximizes the minimum-weight s–t node-cut value. The main contributions are as follows: we construct a directed mission-functional graph for the mission thread, define mission survival and complete disconnection through source–sink connectivity, and provide a unified description of heterogeneous interdiction costs, fortification costs, and finite fortification increments; we use node splitting to transform the node-interdiction response under a fixed scheme into a maximum-flow–minimum-cut problem, then formulate a compact mixed-integer linear program (mixed-integer linear programming, MILP) and verify the optimal value through fixed-scheme recomputation, solver bounds, and a cut-generation model; under a unified mission-path metric, we compare MPCF with mission-path, centrality, network-dismantling, message-passing, and learning-based methods on the same instances, and conduct exhaustive verification, heterogeneous-cost, scalability, and public directed path-service network experiments.
2. Related Work
Mission fortification under a limited budget connects three lines of research: structure-oriented critical-node identification and network dismantling, demand- and function-driven evaluation of node criticality, and network protection optimization that accounts for optimal interdiction responses. The first two lines define how node importance is evaluated, while the third addresses node-set configuration under limited resources. Because the functional relationships in a kill web are constrained by the mission thread, these methods must be examined under a unified source–sink mission semantics.
2.1. Structure-Oriented Network Vulnerability Analysis
Degree, betweenness, eigenvector centrality, PageRank, and k-core evaluate structural node importance from local connectivity, shortest-path usage, spectral structure, and core hierarchy, respectively. These methods have low computational cost and are easy to interpret, and are widely used in network vulnerability analysis and attack-target ranking. However, a single-node score is defined for a specific structural statistic and is difficult to use to reflect the effects of node combinations on network performance directly.
Network dismantling extends the object of study from individual nodes to node sets that can cause overall structural degradation. Collective Influence (CI), Belief Propagation-guided Decimation (BPD), CoreHD, Generalized Network Dismantling (GND), and learning-based methods select nodes based on percolation thresholds, feedback vertex sets, core elimination, graph partitioning, and policy learning, respectively[8,15,16,17,18,19,20]. Common evaluation metrics include giant connected-component size, degree of decycling, partition cost, and overall fragmentation. Techniques such as dynamic reranking, node reinsertion, and graph representation learning further improve dismantling efficiency in large-scale networks[20].
The criticality identified by structural methods depends on the selected structural metric. For a kill web with mission endpoints, directionality, and functional-order constraints, overall structural degradation is not equivalent to failure of a specific mission. A node set that rapidly reduces the giant connected component may not cut all valid paths in a mission thread; a node with limited influence on global connectivity may nevertheless lie at a critical functional interface for that mission. Structural methods can therefore serve as comparison baselines, but mission fortification must also incorporate functional requirements and end-to-end mission relationships.
2.2. Function- and Demand-Driven Evaluation of Node Criticality
Function-oriented network analysis incorporates flows, demand, service capacity, and cross-network dependencies into the evaluation of node criticality. In multimodal transportation networks, critical-node rankings differ from purely topological rankings when passenger demand, transport capacity, and corridor functional contribution are considered[10]. Critical-infrastructure resilience research likewise establishes a mapping between topological connectivity and function preservation through functional dependencies and service coupling in multilayer networks[11]. These findings show that node importance depends on system functions, resource flows, and service beneficiaries.
In a kill web, functional dependencies must be grounded at the mission level. Mission engineering starts from mission objectives and mission contexts, uses mission threads to describe activities, events, and their execution order, and associates them with the systems, technologies, and organizational entities that perform the corresponding activities[1,2,3,4]. A mission architecture thereby establishes mappings among mission objectives, mission activities, and system resources, defining how resources support mission functions and how their failures affect those functions.
Accordingly, the command-and-control, communication, and equipment resources that support mission activities can be organized into mission-functional nodes, with directed relationships representing the end-to-end execution process. Node criticality depends on functional position and substitution relationships. Existing demand-aware and function-aware methods mainly support node evaluation, service-vulnerability analysis, and recovery prioritization; mission engineering focuses on mission architecture, mission metrics, and the relationship between system capabilities and mission outcomes. Pre-disturbance resource allocation must additionally determine the fortified node combination under a budget constraint so that the minimum interdiction cost required for complete mission disconnection is as high as possible.
2.3. Adversarial Network Protection Optimization under Budget Constraints
Network interdiction studies the most adverse network disruption under resource constraints. These models treat the interdictor as a decision-maker and evaluate a scheme according to the network’s optimal response after interdiction. By network function, existing work includes maximum-flow interdiction, shortest-path interdiction, connectivity interdiction, and other generalized models; common solution methods include dual reformulation, mixed-integer programming, Benders decomposition, and cut generation[12]. Unlike a prescribed attack sequence, network interdiction explicitly solves for the most adverse failure mode under resource constraints.
Moving the decision point to before the disturbance yields fortification or defender–attacker hierarchical optimization models. Critical-infrastructure protection research commonly uses two- or three-level models to describe the allocation of defensive resources, adversarial attacks, and post-attack system operation[21], and has extended these models to facilities protection, shortest paths, flow networks, and stochastic demand. Hien et al. reduce interdiction-induced demand loss by adding or protecting directed-network capacity[22]; Leitner et al. select protected assets at the upper level and use exact algorithms to solve the defender–attacker–response process[14]; Arulselvan et al. study critical-node immunization under budget constraints with node-pair connectivity after the worst-case attack as the objective[23]. Together, these models show that the value of node protection depends on the joint effect of the protection scheme and interdiction response and cannot be determined from fixed pre-disturbance node scores alone.
Increasing the minimum cut is a common objective in network fortification. Abdolahzadeh et al. study minimum s–t cut interdiction, increase arc capacities under a budget constraint to raise the minimum-cut value of a single-source, single-sink network, and analyze the complexity and solution algorithms under different cost structures[13]. Once a candidate minimum cut is strengthened, another cut may become the new minimum-cost disconnection location, so fortification decisions must constrain multiple competing cuts simultaneously. Existing minimum-cut interdiction models mostly use arc capacities as decision variables; binary fortification models generally protect assets from attack, while other models use flow loss, shortest paths, demand gaps, or global connectivity as objectives. Mission fortification in a kill web requires finite fortification increments to be represented at the mission-functional-node level, with disconnection of all valid mission paths defined as the failure event.
2.4. Research Gap and Problem Positioning
Structural vulnerability research provides methods for identifying node sets at the topological level, function-aware research links criticality to demand, flow, and system functions, and network interdiction and fortification address protection decisions and interdiction responses under limited resources. Pre-emptive fortification of a kill web requires these three lines of research to be combined under a unified mission semantics.
The fortification targets and failure event are specified by the given mission thread. A mission thread specifies end-to-end mission activities and their order, while a mission-engineering thread associates the systems and capabilities required to complete these activities[1,4]. The associated resources are aggregated into mission-functional nodes according to mission functions, and their directed relationships form feasible end-to-end execution chains. The mission impact of node failure depends on its relationships and the alternative paths that remain; the mission becomes fully disconnected when all valid paths are blocked simultaneously.
The decision object under a limited budget is a node set. Fortification changes node-interdiction costs and the relative relationships among candidate node cuts; after the cost of the current minimum cut increases, the interdictor can switch to another candidate cut. Therefore, individual node importance, path frequency, and the initial minimum cut provide only local information, while budget allocation must also account for competition among candidate cuts and node complementarity.
Existing studies have not addressed within a single model the three elements required for kill-web mission fortification: representing the mission-support relationships of heterogeneous resources as a functional connectivity structure with source–sink semantics; evaluating fortification effects by complete mission disconnection rather than overall structural degradation; and handling node-combination effects and minimum-cut switching under a limited budget. Accordingly, this study investigates the budgeted fortification problem on a mission-functional graph by using limited resources to increase the minimum cost required to block all valid mission paths.
3. Problem Definition
3.1. Construction of a Mission-Oriented Functional Graph
A kill web comprises heterogeneous resources, including sensing, command and control, communications, and effectors. Its mission capability arises from organizing and coordinating resources for a specific mission. For a given mission thread, the resources required to perform each function and their coordination relationships are aggregated into mission-functional nodes, and directed relationships are established according to information transmission, command and control, and effect relationships. A mission thread can be represented as a directed mission-functional graph
where V is the set of mission-functional nodes and E is the set of directed relationships between mission-functional nodes. Mission-functional nodes are the basic units for connectivity analysis and fortification decisions in this study; at the underlying level, each is jointly supported by the heterogeneous resources and coordination relationships required to perform the corresponding mission function.
Let the nonempty and mutually disjoint mission-source and mission-sink node sets be and , respectively, and let the set of candidate mission-functional nodes that can be interdicted and fortified be . The mission source denotes the starting point of functional effects in the mission thread, and the mission sink denotes the completion point of the intended mission effect. This study adopts a single-commodity multi-source, multi-sink connectivity model: the mission remains connected as long as at least one valid directed path exists from any to any . Each valid path composed of mission-functional nodes and their ordered functional relationships corresponds to a feasible mission execution chain that can realize the end-to-end mission function.
The mission thread depends on the feasible execution chains described above. When a candidate node fails, the mission function it performs and the associated execution relationships are interrupted; in the mission-functional graph, this corresponds to deleting the node and its incident edges. We assume that G contains at least one valid path from to and that every valid path passes through at least one candidate node. Nodes that cannot be interdicted, as specified by the mission source, mission sink, and mission boundaries, are excluded from candidate node cuts.
To characterize the heterogeneity of different mission-functional nodes under disturbance and protection, each candidate node has an interdiction cost , a fortification cost , and a post-fortification interdiction-cost increment . Here, represents the generalized interdiction resources required to disable the mission function performed by node v, represents the generalized protection resources required to fortify that mission function in advance, and represents the increment in the node’s interdiction cost after fortification. These parameters equivalently represent the underlying equipment capabilities, command-and-control and communication support, and protection investment at the mission-functional level.
Let
denote the actual fortification cost of fortification set , and let be the indicator function. Given a fortification set P, the effective interdiction cost of candidate node v is
Fortification enhances the disturbance resistance of mission-functional nodes by increasing their effective interdiction costs; fortified nodes remain in the set of candidate nodes that can be interdicted. In the default experiments, , so the effective interdiction cost of a fortified node is twice its original interdiction cost.
3.2. Mission-Path Fortification under a Limited Budget
Let be the set of all valid directed simple paths from the mission-source set to the mission-sink set in mission-functional graph G. Each corresponds to a feasible mission execution chain that can maintain the end-to-end mission function. To fully disconnect a given mission, the interdiction set must disrupt every valid mission path. Accordingly, define the node-cut family composed of candidate mission-functional nodes as
Every intersects all valid mission paths. Once the mission-functional nodes in C fail, no valid mission execution chain remains between the mission source and mission sink, resulting in complete mission disconnection.
Given a pre-emptive fortification set , the effective interdiction cost of each candidate node is determined by Equation (3). Among all node cuts that can cause complete mission disconnection, the interdictor selects the set with the minimum total interdiction cost. Its optimal response is
Here, is the minimum-weight s–t node-cut value of the fortified mission network, representing the minimum node-interdiction cost required to disable all valid mission paths under the current fortification configuration. A larger means that the interdictor must invest more minimum resources and indicates stronger end-to-end mission protection during the absorption phase provided by the fortification scheme. When all candidate nodes have unit interdiction costs and fortification increments are not considered, reduces to the minimum number of candidate mission-functional nodes that must fail to fully disconnect the mission.
Figure 1 illustrates the relationship between fortification decisions and interdiction responses. Given the mission-functional graph and node parameters, the fortifier selects a set P under the budget constraint. This set changes the effective interdiction costs of the corresponding nodes, after which the interdictor computes the minimum-cost node cut that disconnects all valid mission paths, with cut value . Different fortification sets therefore produce different interdiction responses and minimum-cut values.
Fortifying a mission-functional node increases the cost of every cut that contains the node, but the minimum-cut value is still determined by the feasible cut with the lowest cost. Once the original minimum cut is strengthened, another candidate cut may become the new minimum-cost interdiction location. The fortification effect therefore depends on the joint effect of a node set across multiple candidate cuts. MPCF compares across the complete budget-feasible region rather than evaluating individual nodes separately.
The objective of pre-emptive fortification is to increase this minimum-cut value under limited-resource constraints. Given a total fortification budget B, the Mission-Path Cut Fortification (MPCF) problem is defined as
Equation (6) selects a fortification scheme from the budget-feasible node sets to maximize the minimum cost required to disconnect all valid mission paths. Candidate sets change both the effective interdiction costs of nodes and potentially the minimum-cost node cut, so the model includes fortification-set selection and interdiction response simultaneously.
When multiple fortification sets achieve the same MPCF optimal value, the actual fortification cost is minimized as the tie-breaking criterion. Let
where is the MPCF optimal value under budget B, namely, the maximum minimum-cut value attainable by a budget-feasible fortification set, and is the minimum actual fortification cost required to attain that optimal value. We further define
as the normalized optimal-solution set that simultaneously attains the MPCF optimal value and the minimum implementation cost. This family characterizes alternative fortification configurations that may exist at the same mission-protection level and with the same actual resource consumption.
4. MPCF Optimization Method Based on Flow–Cut Equivalence
4.1. Flow–Cut Equivalent Formulation of Node Cuts
Chapter 3 defines the minimum-weight s–t node cut value of the fortified mission network as . To obtain a computational formulation of this interdiction response, this section adopts the node-splitting transformation, maps node cuts to arc cuts in the split network, and computes using the max-flow–min-cut equivalence.
For each mission-function node in the mission-function graph , an in-node , an out-node , and an internal arc connecting them are constructed. For each mission-function relation , a connecting arc is constructed in the split network. A super-source and a super-sink are further introduced: for each mission source node , is constructed, and for each mission sink node , is constructed. Thus, every valid – path in the mission-function graph corresponds to a – path in the split network.
Given a fortification set , the capacity of the internal arc corresponding to a candidate mission-function node is set to its effective interdiction cost, . The internal arcs of non-interdictable functional nodes at the mission boundary, the mission-function relation arcs, and the super-source–sink boundary arcs are all assigned a large capacity:
Since , the capacity of the internal-arc cut corresponding to interdicting all candidate mission-function nodes satisfies . Therefore, the split network always contains a – cut with capacity less than M, whereas any cut containing a large-capacity arc has capacity no less than M. Hence, a minimum-capacity cut can consist only of the internal arcs corresponding to candidate mission-function nodes. The failure of a mission-function node v is therefore equivalent to cutting its internal arc , whose arc capacity equals the effective interdiction cost of that node under the given fortification plan.
Denote the resulting split network by , the set of internal arcs corresponding to candidate mission-function nodes by , and the set of all remaining large-capacity arcs by . The node-splitting transformation thus establishes a term-by-term cost correspondence between node cuts and arc cuts in the split network.
Figure 2 illustrates node splitting and its effect on the minimum cut value. The left panel maps the interdiction cost of a single node to the capacity of an internal arc; the middle panel extends the transformation to the complete mission-function graph, where functional relation arcs have the large capacity M and a finite minimum cut can consist only of internal arcs of candidate nodes. In the example, the node cuts , , and have cut values of 8, 2, and 8, respectively. Thus, without fortification, and . After fixing the fortification set , the capacities of the two internal arcs increase from 1 to 3, and the minimum node-cut value consequently increases to 6.
The above construction establishes the equivalence between mission-function node interdiction and the maximum flow in the split network under a fixed fortification plan.
Theorem 1
(Flow–Cut Equivalence Under a Fixed Fortification Plan). For any budget-feasible fortification set , the split network has a minimum – cut value and a maximum – flow value, both of which equal the minimum-weight s–t node cut value of the mission-function graph.
Proof.
Take any node cut and let . Since C intersects every valid – path in the mission-function graph, the corresponding set of internal arcs necessarily intersects every – path in the split network. Therefore, is a – arc cut, with capacity . Hence, the minimum cut value of the split network is no greater than .
Conversely, because intersects every valid mission path, the candidate internal-arc set itself is a feasible – cut with capacity less than M. Therefore, no minimum cut in the split network contains a large-capacity arc of capacity M; it can consist only of candidate internal arcs. Let its set of candidate internal arcs be , and map it back to the mission-function node set . Since cuts all – paths, necessarily intersects all valid – paths in the mission-function graph. Thus, , and the two cuts have exactly the same cost. Therefore, the minimum cut value of the split network is no less than .
Combining the two directions shows that the minimum – cut value of the split network equals . The max-flow–min-cut theorem then implies that the maximum – flow value of the split network also equals . □
This equivalence converts node-cut computation under a fixed plan into a standard max-flow–min-cut problem. Given P, a single maximum-flow or minimum-cut computation yields the interdiction response and . In the following, the fortification set is treated as a decision variable, and a joint fortification model is established under the budget constraint.
4.2. Joint Fortification Model for Mission-Function Nodes Under a Budget Constraint
After fixing the fortification set P, setting the capacities of candidate internal arcs according to makes it possible to obtain by maximum flow. Under a finite budget, it is also necessary to determine, among all feasible sets, the node combination that maximizes . To this end, fortification states are embedded in the capacities of the split network so that set selection and minimum-cut computation are performed in a single model.
For each candidate mission-function node , define the binary fortification variable
According to Equation (3), the capacity of the internal arc corresponding to candidate node v can be written as . Therefore, the fortification decision acts directly on the minimum-cut structure of the split network by changing the capacities of candidate internal arcs. When , the internal-arc capacity is the original interdiction cost ; when , the capacity increases to . Mission-function relation arcs, the internal arcs of non-interdictable mission-function nodes, and the super-source–sink boundary arcs continue to use the large capacity M defined in Equation (9).
Let the split network be , let the set of internal arcs of candidate mission-function nodes be , and let the set of all remaining large-capacity arcs be . Denote the super-source and super-sink by and , respectively. For any , let and denote its outgoing-arc set and incoming-arc set, respectively. Let be the auxiliary flow on arc , and let F be the total auxiliary flow from to . Here, and F are defined on the split network whose capacities are interdiction costs and are used only to compute the node-cut cost; they do not represent mission traffic flow or concurrent service capacity. Combining the binary fortification variables , flow variables , and the budget constraint yields the compact mixed-integer linear program for MPCF:
In Equation (10), the flow-conservation constraints make F a feasible – flow; the capacities of candidate internal arcs vary with the fortification states; the large-capacity arcs preserve the connectivity of functional relations and non-interdictable nodes; and the budget constraint limits the implementable fortification combinations. The binary vector corresponds to the budget-feasible set , whereas, for any fixed , the subproblem defined by the continuous variables is precisely the maximum-flow problem established in Section 4.1.
The objective of this model is to maximize directly the maximum-flow value of the split network. According to the flow–cut equivalence in Section 4.1, for a fixed fortification set , the maximum-flow value equals the minimum-weight s–t node cut value after fortification. Therefore, as varies over the budget-feasible region, Equation (10) simultaneously compares the optimal interdiction responses associated with different fortification sets and selects the node combination with the highest minimum-cut value. This equivalence is stated in the following theorem.
Theorem 2
Proof.
Take any binary vector satisfying the budget constraint and let . For fixed , the capacities of candidate internal arcs in Equation (10) become , and the binary decision component is thereby fixed. The model reduces to a maximum – flow problem on the split network. According to the flow–cut equivalence theorem in Section 4.1, the optimal flow value of this subproblem is .
Conversely, the constraint makes all feasible binary vectors in Equation (10) correspond one-to-one to all fortification sets in Chapter 3 satisfying . Therefore, the optimal objective value of the joint model satisfies
Equation (10) contains binary fortification variables, while the numbers of continuous variables and flow-conservation constraints scale linearly with the size of the split network, without enumerating valid paths or node cuts. Mission paths are represented implicitly by the flow-conservation structure, and competition among candidate cuts enters the optimization through the max-flow–min-cut relation. The solution method for this compact mixed-integer linear program is referred to as MPCF-Exact.
When the optimal MPCF fortification plan is not unique, the equal-optimum solution-selection criterion defined in Chapter 3 further minimizes the actual fortification cost while keeping unchanged, thereby determining a representative plan in . The global-optimality verification of the MPCF objective, canonical representative selection, and recomputation of the interdiction response under a fixed plan are described together in Section 4.4.
Although the minimum cut value under a fixed fortification set can be obtained by a polynomial-time maximum-flow algorithm, Equation (10) must also jointly determine a discrete combination of mission-function nodes under the budget constraint. The next section further analyzes the computational complexity of this set-selection problem and the set structure of the objective function .
4.3. Computational Properties of the Joint Fortification Problem
Section 4.1 shows that, for any given fortification set P, the minimum cut value can be obtained by a single max-flow–min-cut computation on the split network. The computational complexity of MPCF primarily arises from jointly selecting a set of mission-function nodes under the budget constraint: different fortification sets change the capacity configuration of candidate internal arcs and, in turn, change the optimal node cut. To characterize the computational properties of this combinatorial decision, this section analyzes the computational complexity of MPCF and the set structure of the objective function separately.
First, consider the decision version of MPCF: given a mission-function graph, node parameters, a fortification budget B, and a threshold K, determine whether there exists a fortification set satisfying and .
Theorem 3
(Computational Complexity of MPCF). The decision version of MPCF is NP-complete, and the corresponding optimization problem is NP-hard.
Proof.
First, when node costs, the budget, and the threshold use finite binary encodings, the decision version of MPCF belongs to NP. For any given candidate fortification set P, the budget constraint can be verified in polynomial time, and can be obtained by one max-flow–min-cut computation according to the flow–cut equivalence in Section 4.1, thereby determining whether holds.
A polynomial reduction from the 0–1 knapsack decision problem is given next. Consider a 0–1 knapsack instance with n items, where the weight and value of item i are denoted by and , respectively, the knapsack capacity is B, and the target value threshold is Q. Construct a mission-function graph containing n parallel mission paths , , where each intermediate mission-function node belongs to the candidate set , and set , , and . Because the ns–t paths are mutually parallel, any node cut must contain all intermediate nodes to completely disconnect the mission. Therefore, for any fortification set P,
Let . Then, a fortification set satisfying and exists if and only if the original 0–1 knapsack instance contains a subset of items with total weight no greater than B and total value at least Q. The size of this construction is polynomial in the size of the original instance. Thus, the 0–1 knapsack decision problem can be polynomially reduced to the MPCF decision problem. Together with the fact that the MPCF decision problem belongs to NP, this proves that it is NP-complete and that the corresponding maximization problem is NP-hard. This reduction first establishes at least weak NP-hardness; it neither proves nor rules out strong NP-hardness of MPCF. □
The interdiction response under a fixed plan can be obtained in polynomial time by max-flow–min-cut, whereas budgeted fortification requires a global selection among feasible node combinations. Discrete set selection constitutes the principal computational difficulty of MPCF.
In addition to computational complexity, the minimum cut value has an important set structure. Because fortification only increases the effective interdiction costs of candidate mission-function nodes, the total interdiction cost of any node cut cannot decrease when an existing fortification set is further expanded. Therefore, for any ; that is, is monotone nondecreasing with respect to the fortification set.
However, is generally not submodular. Define the marginal gain of a node relative to the current fortification set P as . If were submodular, then would hold for any and .
Consider a serial mission path , where , and let . Either individual candidate mission-function node on this path can completely disconnect the mission. Therefore,
Take and , and consider the marginal gain of node v. Then , whereas . Therefore, , which contradicts the diminishing-marginal-gain condition for submodular functions. Hence, is generally non-submodular.
This counterexample reveals a set-complementarity effect in the fortification of mission-function nodes. On a serial path, when either u or v is fortified alone, the interdictor can choose the other non-fortified node to disconnect the mission at the same cost, so the minimum cut value remains unchanged. When both nodes are fortified, the costs of all feasible interdiction locations increase simultaneously, and the minimum-weight s–t node cut value consequently rises. More generally, in a mission-function graph with multiple alternative mission paths and multiple competing node cuts, fortifying certain nodes changes the cost ranking among different node cuts, causing the marginal value of subsequent nodes to vary with the current fortification set.
Therefore, the value of mission-function node fortification in MPCF is strongly plan-dependent. The fortification gain of a node is jointly determined by its own interdiction-cost increment, the node cuts in which it lies, and other competing node cuts, so joint fortification can produce complementary gains that cannot be captured by evaluating individual nodes separately. NP-hardness characterizes the combinatorial complexity of set selection under the budget constraint, while non-submodularity further indicates that fixed node rankings and sequential marginal selection cannot directly exploit the approximation guarantees of classical monotone submodular maximization. Based on these computational properties, the next section verifies the global optimality of MPCF solutions from three perspectives: global-bound closure of the master model, interdiction-response recomputation under a fixed plan, and an alternative cut-space formulation.
4.4. Global Optimality Recomputation and Verification
The compact MILP in Section 4.2 jointly optimizes node fortification states and split-network flows, with optimal objective value . The solution is checked in three ways: the feasible solution and global bound of the compact MILP determine the optimal value; the exact minimum node cut is recomputed after fixing the obtained fortification set; and the cut-generation model independently tightens the upper and lower bounds from the node-cut space. After is determined, minimum actual fortification cost is used as the selection criterion among tied solutions, and alternative fortification sets with minimum implementation cost are enumerated as needed.
4.4.1. Bound Closure and Blocking Recomputation for the Main Model
This paper denotes the main solution process based on Eq. (10) as MPCF-Exact. The model directly maximizes the minimum-weight s–t node-cut value of the fortified mission network. After is determined, it minimizes the actual fortification cost subject to . The selected fortification set is then fixed and its exact minimum cut is recomputed. Table 1 presents the complete procedure.
The procedure records two mutually checking results. The global bound of the MPCF MILP determines the maximum objective value within the budget-feasible region. After is fixed, the maximum-flow–minimum-cut recomputation obtains from the split network. When the MPCF global bound is closed and holds within the specified numerical tolerance, the objective value from joint optimization agrees with the actual minimum cut value under the fixed solution. Therefore, . The corresponding gives the node cut that attains this minimum blocking cost, allowing the optimal fortification solution and its worst-case blocking response to be recomputed from the same records.
4.4.2. Upper and Lower Bound Closure in the Alternative Cut-Space Formulation
The compact MILP describes MPCF in the flow space of the split network. The node-cut definition also yields a direct cut-space formulation. For any node cut and fortification variables , the blocking cost is . Because the minimum cut value equals the minimum cost among all feasible node cuts, introducing the objective variable gives, for each ,
If all node cuts are included in the model, maximizing under the budget constraint has the same optimal objective value as Eq. (6). MPCF-CG maintains the set of discovered node cuts through on-demand generation and alternately closes the global upper and lower bounds using a restricted master problem and exact minimum-cut computations under fixed solutions.
For the current cut set , the restricted master problem is
Because contains only a subset of all node cuts, Eq. (11) imposes relatively loose constraints on the minimum-cut value, and its optimal objective value forms an upper bound on the MPCF global optimum. Performing one exact minimum-cut computation for the candidate fortification set returned by the restricted master problem gives the true minimum-cut value and the corresponding optimal blocking cut . Every comes from a budget-feasible fortification solution and therefore forms a feasible lower bound on the global optimum. The newly obtained is then used to augment the cut set .
Table 2 presents the bound-closure procedure for MPCF-CG.
The upper and lower bounds of MPCF-CG have the following properties.
Theorem 4
(Validity and Finite Convergence of Cut-Generation Bounds). At any iteration of MPCF-CG, the restricted master problem objective value U is a valid upper bound on the MPCF optimum , and the best exact minimum-cut value among the evaluated budget-feasible solutions, L, is a valid lower bound; thus, . When complete exact minimum-cut separation is used, MPCF-CG reaches after finitely many iterations. When and the objective values are computed exactly, the upper and lower bounds close at .
Proof.
For any budget-feasible fortification vector , the true minimum-cut value is
Because ,
Therefore, maximizing the restricted objective based on over the budget-feasible region gives . On the other hand, L is the maximum exact over the evaluated budget-feasible fortification sets, so .
If the current bounds have not yet closed, the exact minimum cut of the restricted master problem candidate gives a node cut that can tighten the current restricted master problem and is added to . A finite mission-function graph contains finitely many candidate node cuts, so this process can generate only finitely many distinct cuts. As the cut set is progressively expanded, the restricted master problem eventually contains the active cuts required to determine the optimal value, and the bounds consequently close. □
MPCF-Exact and MPCF-CG are two formulations of the same optimization problem. The former jointly optimizes fortification variables and flow variables in the split-network flow space, whereas the latter tightens the objective upper bound through dynamic separation in the node-cut space. Both use the same inputs and solve MPCF from the flow and cut spaces, respectively. Their objective values are used for mutual verification.
4.4.3. Identification and Enumeration of the Minimum-Implementation-Cost Solution Set
When multiple fortification sets have the same MPCF optimal value , actual fortification cost is used to further distinguish resource-allocation efficiency. According to Eq. (7), canonical representative selection minimizes subject to and , and the resulting minimum cost is denoted by . In the compact MILP, this is implemented by adding and minimizing . Thus, every canonical representative solution obtained belongs to .
In the experiments, both the MPCF objective value and the actual fortification cost lie on unit grid points, that is, . Membership is tested using
both of which are less than half the spacing between the corresponding grid points. The MPCF objective value returned by the solver is first recomputed by the exact minimum cut under the fixed fortification solution. The actual fortification cost is obtained by directly summing node attributes, and the recomputed results are then mapped to the corresponding discrete grid points. This treatment applies a unified numerical decision rule to the MPCF objective value, actual fortification cost, and set membership.
For instances requiring the complete canonical optimal solution set, the model simultaneously fixes
For each binary optimal vector obtained, the no-good constraint
is added to exclude the fortification combination from the subsequent feasible region, and the search continues for a new minimum-implementation-cost solution. When the model returns infeasible after no-good constraints for all discovered solutions have been added, the currently enumerated set constitutes the complete .
The complete optimal solution set also supports analysis of node-configuration structure. Nodes that appear in every member of are mandatory fortification nodes under the current mission and budget. Nodes that appear in only some members have equivalent alternative configurations. This solution family simultaneously identifies the optimal value, mandatory nodes, and substitution relationships among nodes.
4.5. Blocking Response Model under Partial-Capacity Degradation
Complete mission-path disconnection describes failure of the end-to-end functional chain, but capacity may also decrease to different degrees during a disturbance. To evaluate fortified solutions under partial-capacity degradation, this paper assigns concurrent service capacities to mission-function nodes and computes the minimum blocking cost required to reach a specified degradation level under a remaining-capacity constraint.
4.5.1. Minimum Blocking Cost under a Capacity Threshold
After fixing a fortification set , assign each candidate mission-function node a concurrent service capacity . In the capacity split network, the capacity of an unblocked candidate internal arc is , whereas that of a blocked candidate internal arc is 0. The other unblocked internal arcs, mission-function relation arcs, and super-source–sink boundary arcs are assigned sufficiently large capacities that do not constrain the candidate cut. Let be the set of blocked mission-function nodes, and let denote the maximum integer source–sink flow achievable in this capacity network under blocking set A. The baseline mission capacity without node blocking is . Given an allowed remaining mission-capacity ratio , the maximum mission flow after blocking is required not to exceed . The minimum blocking cost under the capacity threshold is therefore defined as
denotes the minimum node-blocking cost required to reduce mission capacity to the specified threshold for a given fortification solution P. As r increases, the mission capacity allowed to remain increases, and the blocking objective progressively relaxes from complete disconnection to different degrees of capacity degradation. When , the constraint requires no residual mission flow between the mission source and mission sink. Thus, , which agrees with the complete mission-path disconnection response defined above. When , further describes the minimum blocking cost when a fortified solution faces partial mission-capacity loss.
To solve Eq. (14), let , where indicates whether mission-function node v is blocked in the capacity split network, indicates whether split-network node i lies on the source or sink side of the cut, and indicates whether the candidate internal arc crosses the cut while the corresponding mission-function node remains unblocked. Let denote the set of unblocked mission-function relation arcs in the capacity split network. The exact blocking response under the capacity threshold can then be written as
Equation (15) describes the capacity cut between the mission source and mission sink using the cut-side variables . The constraint for preserves directed connectivity through unblocked mission-function relations so that the finite-capacity cut acts on candidate mission-function nodes. Variable indicates that the candidate internal arc crosses the cut while the node remains unblocked, and its capacity contribution is . Variable selects node blocking to remove the corresponding capacity. The constraint ensures that a source–sink cut with capacity no greater than the specified threshold exists after blocking. By the maximum-flow–minimum-cut relation, the corresponding remaining maximum mission flow does not exceed . The objective function therefore selects, among all node-blocking solutions satisfying the capacity-degradation requirement, the one with the lowest total effective blocking cost, whose optimal value is .
4.5.2. Bounded Decomposition and Exact Fallback
The capacity response must be solved repeatedly for multiple fortification solutions and capacity thresholds. This paper computes using bounded decomposition and assesses convergence through a lower bound on the blocking cost and a feasible upper bound. Let and denote the current lower bound and best feasible blocking cost, respectively, let be a one-dimensional Lagrangian multiplier, let be the set of generated affine dual lines, and let be the set of discovered capacity cuts.
Given a multiplier , the decomposition solves a weighted node-cut oracle subproblem, updates the lower bound through the exact cut response, and generates a capacity cut. It then solves a finite cut-covering subproblem over the existing capacity cuts to obtain a candidate blocking set. Integer maximum-flow recomputation checks whether this set meets the capacity requirement, and solutions that meet the requirement update the upper bound using the recomputed cost. The difference between the bounds determines whether global optimality has been reached.
Table 3 presents the complete computational procedure.
The decomposition makes at most 64 subproblem calls. If the limit is reached, or if the multiplier repeats while the bounds on the objective grid remain open, the procedure switches to Eq. (15). Regardless of whether the result comes from the decomposition or the exact MILP, integer maximum-flow recomputation checks the remaining capacity, and the blocking cost is resummed using to determine and the solution status.
When , the capacity response agrees with the minimum-cut value under complete disconnection. When , denotes the minimum blocking cost corresponding to different degrees of capacity degradation. The following analysis therefore compares the performance of fortified solutions under complete disconnection and partial-capacity requirements.
5. Experimental Results and Analysis
This section evaluates the optimization performance, operating mechanism, and applicability of MPCF. Exhaustive enumeration, agreement between the flow-space and cut-space formulations, and scaling experiments establish a global-optimum reference for comparing fortification methods. Nested ablation, changes in cost, topology, and role composition, minimum-cut switching, and optimal-set-family analysis then explain the advantage of joint fortification. Capacity thresholds and public directed mission paths further examine the criterion boundary and external applicability.
5.1. Experimental Design
5.1.1. Mission Function Graph Instances
The main experiment uses three four-layer directed mission function graph topologies: centralized, modular, and distributed. Mission function nodes are organized into four functional roles, perception (S), command (C), communication relay (L), and effect (E), and directed mission relationships are established only between adjacent functional layers. The network size is . The main experiment fixes the role ratio at , corresponding at to , , and nodes, respectively. 5 prespecified random seeds are used for each topology and size, producing 45 mission function graphs in total. Each instance contains mission function relation arcs. The interdiction costs of candidate mission function nodes are balanced within each functional layer according to ; the main experiment uses and , and fortification budgets are set to 2%, 5%, and 10% of the total fortification cost of the candidate nodes. This produces 135 mission function graph–budget pairs. Because at the nominal 2% budget is insufficient to fortify any candidate node, 15 pairs are zero-effective-budget instances; results are reported both for all fixed instances and after excluding zero-effective-budget instances.
Synthetic mission function graphs are generated using deterministic rules. Each instance is generated and fixed before all algorithms are run, and node attributes, interface arc counts, and random seeds are saved. Table 4 gives the detailed generation process for the three topologies.
In addition to the main experiment, several sets of validation and mechanism-analysis instances are established. Small-scale experiments verify the MPCF optimum by enumeration and examine capacity-interdiction responses; the cost experiments vary node interdiction costs, fortification costs, and fortification increments; scaling increases the mission-function graph size to and 300; nested ablation compares the complete model with progressively simplified versions; optimal-set-family experiments examine mandatory and substitutable nodes; and capacity-threshold experiments compare fortification effects under complete disconnection and partial mission-capacity degradation. The role-composition sensitivity experiment keeps the topology type, network size, total arc count , random seeds, costs, and budget unchanged, extends the main ratio to , and constructs , , , and with a single scarce S, C, L, or E layer, respectively. Each of the five new ratios contains 45 frozen networks and 135 graph–budget pairs, which test whether the method results depend on a single role composition. In addition, 10 public directed source–sink missions are preselected from GTFS data of the Massachusetts Bay Transportation Authority (MBTA) and the Polska network in the Survivable Network Design Library (SNDlib) to test the model on external path-service relationships[24,25,26]. These are 10 missions selected from two public networks, and each mission is combined with three absolute budgets to form 30 mission–budget instances.
Table 5 summarizes the experimental objects, budgets, and sample sizes. The main performance experiment compares the minimum cut values achieved by different fortification methods. Small-scale enumeration and scaling examine exact-solution agreement and computational limits, while the cost, candidate-domain, and nested-ablation experiments identify the sources of performance. The capacity-threshold experiment changes the evaluation criterion, and the public-mission experiment tests the model on external directed-path relationships.
5.1.2. Comparison Methods
MPCF-Exact, MPCF-CG, and MPCF-Greedy solve the same MPCF objective. MPCF-Exact is the primary solution method for reporting the fortification scheme and optimal objective value; MPCF-CG solves the same integer optimization problem in the node-cut space to compare the computational results of the compact flow model and the cut-generation model; MPCF-Greedy iteratively selects the node with the largest marginal gain per unit cost to evaluate the loss of greedy selection relative to joint optimization. Network interdiction studies commonly report compact integer programming, decomposition or cut-generation algorithms, and heuristic algorithms together to distinguish the mathematical model, exact solution implementation, and rapid approximation method[12]. MPCF-CG is used below as the exact-solution comparator, and MPCF-Greedy as the heuristic comparator.
In addition to MPCF-Exact and MPCF-CG, the experiment includes 36 inexact comparison methods, including MPCF-Greedy and baselines from mission-path, classical centrality, network dismantling, message-passing, learning-based, and higher-order spectral methods. All 36 methods fully cover the 135 main-experiment pairs; methods applicable only to subsets of instances are reported separately with their coverage and are not included in the complete method ranking. Thus, the complete method set in the main experiment contains 38 methods. Table 6 retains only the method category, specific method, and source; the comparison purpose is described below in the main text.
Each ranking method first generates a node sequence on its native graph representation and then converts it into a budget-feasible set using unified cost rules. All outputs are mapped to the same mission function graph, and the exact minimum node cut from Section 4 is used to calculate the minimum cut value. The heterogeneous fortification-cost experiment compares conversion strategies such as Raw, PerCost, PrefixKnapsack, and FullKnapsack to distinguish the effects of node ranking and budget allocation rules.
MPCF-Greedy starts from the empty set and at each step selects the budget-feasible mission function node with the largest marginal gain per unit fortification cost:
If no new budget-feasible node exists, the current set is returned; if the marginal gain is zero but the budget still permits further selection, ties are handled by stable node identifiers and the budget-feasible set continues to be constructed.
5.1.3. Evaluation Metrics
For mission function graph instance i and method m, the relative optimality gap with respect to the global MPCF optimum is defined as
We report the mean, median, and attainment rates within 5% and 10% tolerances for g, and define the cumulative attainment rate as
For each instance, the largest minimum cut value among all complete non-MPCF methods is used to form the instance-wise post hoc best non-MPCF baseline envelope. This envelope describes the best in-sample result attainable by the current comparison set. Formal statistical inference treats fixed mission function graphs as paired blocks, uses the Friedman test to compare overall differences among multiple methods, and uses Holm-corrected Wilcoxon signed-rank tests for prespecified pairwise comparisons. Confidence intervals use 10,000 random graph-level bootstrap resamples with replacement, and two-sided percentile 95% intervals are reported.
Capacity-degradation analysis uses Equation (14). Here, corresponds to complete mission disconnection, whereas corresponds to partial degradation in which a certain proportion of mission capacity is retained. The capacity experiments compare the native outputs of the methods, outputs at equal actual fortification cost, and a budget-saturated MPCF-optimal representative; with and actual fortification cost fixed, is maximized to select the capacity-oriented representative.
5.2. Performance Evaluation of Mission-Path Fortification
This section first tests the consistency of the MPCF optimal reference and the solvable scale, and then compares the minimum cut values of the different methods against this reference. Algorithm verification and fortification-performance evaluation use the same mission function graphs and evaluation metrics.
5.2.1. Optimal-Value Consistency and Computational Scale
The small-scale enumeration experiment first tests the MPCF optimum. For , the 72 mission function graph–budget instances have optimal objective values from complete enumeration, MPCF-Exact, and MPCF-CG that are all identical, with a maximum objective error of 0. Table 7 also gives the corresponding running times.
For partial capacity-degradation responses, combinations of , three topologies, two absolute budgets, and are additionally used to construct 72 small-scale instances. The optimal interdiction costs obtained from Equation (15) exactly match the enumeration results for the interdiction sets in 72/72 instances, with a maximum absolute error of 0. This result directly verifies the numerical capacity-response model at an enumerable scale, so no separate results table is provided.
Over the larger set, the 135 main-experiment instances and 405 interdiction-cost–fortification-intensity sensitivity instances form 540 MPCF-Exact–MPCF-CG pairs. The MPCF optimal values from the two mathematical formulations agree for 540/540 pairs, with a maximum absolute difference of 0. This result shows that the compact MILP based on the split-network flow space and the cut-generation model based on the node-cut space provide the same global-optimum reference for the same MPCF objective.
Scaling further examines the running performance at and 300. At , MPCF-Exact and MPCF-CG both close the solver bounds directly for 27/27 graph–budget instances; at , MPCF-Exact closes 27/27 directly and MPCF-CG closes 26/27 directly, while the remaining 1 instance is shown by the discrete objective grid to contain no better value within the bound interval, yielding 27/27 closed instances in the end. At with a 10% budget, the median end-to-end running times are 61.96 s for MPCF-Exact and 134.89 s for MPCF-CG. Table 8 lists the running times at different sizes and budgets.
Figure 3 places computational cost and bound closure on the same scale. The running times of MPCF-Exact and MPCF-CG both increase with network size and budget; under most conditions, the compact model has a lower median running time, whereas the cut-generation model independently provides global bounds from the node-cut space. At , the 54 method–budget instances, and at , the 54 method–budget instances, all achieve bound closure, with some MPCF-CG results at using the discrete objective grid to show that no better value exists within the bound interval.
5.2.2. Same-Instance Comparison of Minimum Cut Values
Across the 135 main-experiment pairs, the solver bounds of MPCF-Exact are closed, and recomputation of the fixed schemes also agrees with the model objective values, so the reported objective values attain the global optimum. The mean minimum cut value of MPCF-Exact is 33.622, compared with 27.378 without fortification. Averaging the instance-wise relative increases gives an increase of 27.82%; computing the overall means first and then taking their ratio gives an increase of 22.81%.
The mean relative optimality gaps of MPCF-Greedy and PathFrequency are 2.76% and 9.50%, respectively. After selecting the best output among all non-MPCF methods for each instance, the baseline envelope still has a mean gap of 5.15%. This shows that the best instance-wise results of structural, mission-path, message-passing, and learning-based methods remain below the MPCF optimum overall.
Table 9 lists the main-experiment results for representative methods.
Figure 4 reports the absolute minimum cut values, the same-instance gains of MPCF-Exact over representative methods, and the proportions of instances in which inexact methods attain the MPCF optimum within different tolerances, in that order. Absolute values give the scale of the metric, whereas same-instance differences and performance profiles reflect paired gains and tolerance attainment rates, respectively. At 5% and 10% budgets, the gap between MPCF-Greedy and MPCF-Exact is larger than under the lower-budget condition, indicating that set selection has a greater effect on the minimum cut value as more nodes become selectable.
To test the effect of zero effective budgets on the overall statistics, at with a 2% budget, the 15 instances that cannot fortify any node are additionally excluded. The nonzero-effective-budget subset contains 120 main-experiment pairs; the mean gaps of MPCF-Greedy and PathFrequency are 3.11% and 10.68%, respectively, and the instance-wise mean increase of joint optimization relative to the unfortified state rises to 31.30%. Results for all fixed instances and the nonzero-budget subset are given in Table 10.
The complete ranking includes comparison methods covering all 135 pairs, with 36 methods in total. Centrality, network dismantling, message passing, learning-based, and higher-order structural methods all exhibit gaps of varying magnitudes relative to the MPCF optimum; dynamic updates and node reinsertion designed for native structural objectives also do not consistently improve mission-path fortification. After the prespecified method groups are compared using the Friedman test and Holm-corrected Wilcoxon paired comparisons, MPCF-Exact remains superior to the representative baselines under the main budget conditions. Figure 4 gives the metric scale, paired effects, and tolerance attainment rates; the complete results for 36 methods, coverage of condition-specific methods, and corrected test statistics are included in the reproducibility package.
5.2.3. Role-Composition Sensitivity
Role proportions affect node redundancy in each functional layer and thereby alter the weak positions of the mission function graph and the distribution of fortified nodes. To examine the sensitivity of the main-experiment results to the ratio, MPCF and the complete set of comparison methods are rerun under five additional role compositions. The six compositions form 270 mission function graphs and 810 graph–budget pairs in total; each additional composition covers the 38 methods prespecified in the original main experiment. MPCF-Exact and MPCF-CG produce identical objective values for all pairs.
Table 11 gives the sensitivity results. When one role is scarce, the mean unfortified minimum cut value decreases from 27.378 to 19.044–19.933, indicating that reduced role redundancy weakens the ability of mission paths to withstand node interdiction. The pairwise mean increase of MPCF-Exact relative to the unfortified state rises from 27.82% to 43.07%–45.97%. The mean relative optimality gap of MPCF-Greedy across the six compositions is 0.62%–2.76%, while the mean gap of the best non-MPCF method under each composition is 8.11%–10.12%.
The node-selection distribution helps explain these results. In the four single-layer-scarcity compositions, the scarce role accounts for only 14.3% of all nodes but accounts for 64.9% (S), 66.5% (C), 69.4% (L), and 73.6% (E) of the nodes selected by MPCF-Exact, corresponding to enrichment factors of 4.55–5.15. In the composition, S and E account for 42.9% of all nodes and 67.1% of the selected nodes. After the role composition changes, the MPCF fortification set moves with the weak mission cuts and shows no fixed role preference. By contrast, the mean rankings of traditional methods are more sensitive to role composition: the Spearman correlation coefficients relative to the main ratio are 0.379–0.804, with the largest changes occurring when source or effect nodes are scarce.
5.3. Mechanisms Forming the Joint-Fortification Advantage
In the main experiment, MPCF produces higher minimum cut values than multiple node-ranking methods. This section uses nested ablation to distinguish the contributions of mission information, interdiction response, and set selection, and examines the effects of changes in cost, topology, budget, and candidate domain.
5.3.1. Nested Ablation of Algorithmic Components
Nested ablation distinguishes the contributions of the mission boundary, directed paths, exact interdiction response, and global joint selection. The five versions successively use complete undirected-projection centrality, mission-related node filtering, directed mission-path frequency, exact minimum-cut marginal selection, and global joint optimization, and all ultimately calculate on the same directed mission function graph. The difference between adjacent versions represents the change after adding the current component to the existing information and solution capability.
Filtering only mission-related nodes does not change the result; the gain from directed-path frequency over traditional structural metrics is small and varies with the budget. Adding exact minimum-cut marginal selection increases the mean minimum cut value at all three budget levels. The transition from MPCF-Greedy to MPCF-Exact continues to produce a stable gain at 5% and 10% budgets.
Figure 5.
Nested ablation of mission information and optimization rules. a, mean absolute minimum cut values of complete MPCF-Exact and four progressively simplified versions at three budget levels. b, mean performance loss of each simplified version relative to complete MPCF-Exact. The five versions use the same fixed mission function graphs and budgets, and all outputs are evaluated by the exact minimum cut on the complete directed mission graph.
Figure 5.
Nested ablation of mission information and optimization rules. a, mean absolute minimum cut values of complete MPCF-Exact and four progressively simplified versions at three budget levels. b, mean performance loss of each simplified version relative to complete MPCF-Exact. The five versions use the same fixed mission function graphs and budgets, and all outputs are evaluated by the exact minimum cut on the complete directed mission graph.
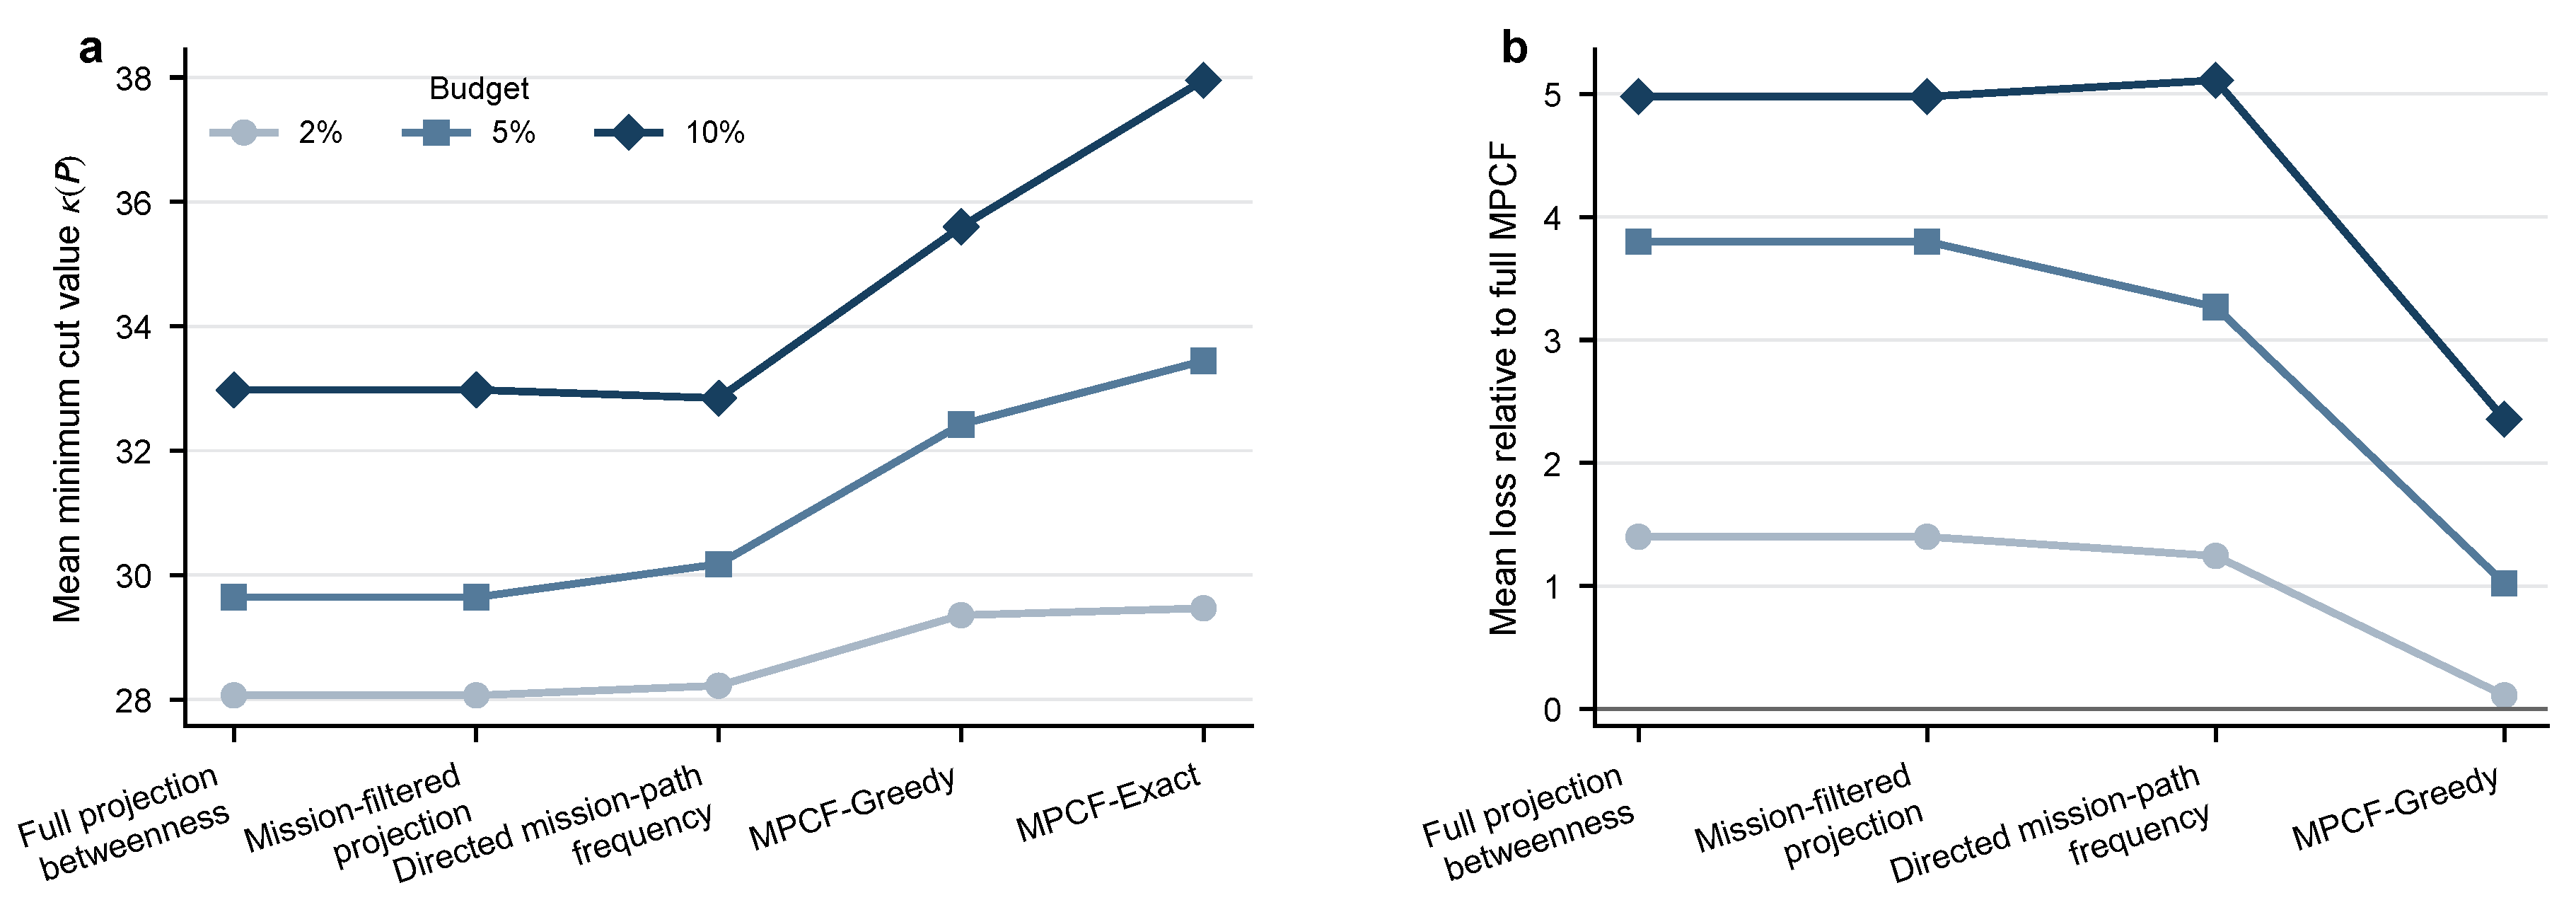
This result is consistent with the nonsubmodularity of in Section 4.3. The exact minimum cut makes node selection directly target the lowest interdiction response that completely disconnects the mission, whereas the gain of MPCF-Exact over MPCF-Greedy comes from set-level joint selection. As the fortification set expands, node marginal gains are affected by both the current minimum cut and alternative cuts, so one-step selection cannot fully represent the complementarity among subsequent nodes.
To observe this process directly, Figure 6 compares the number of minimum-cut switches within the budget with the MPCF-Greedy–MPCF-Exact gap and shows the internal structure of the minimum-implementation-cost set families. At 5% and 10% budgets, the number of minimum-cut switches is positively correlated with the MPCF-Greedy optimality gap; some centralized, modular, and distributed instances also contain multiple fortification sets with the same minimum implementation cost.
Complete enumeration of shows that the same MPCF optimal value can be achieved by different node combinations. Nodes appearing in all optimal sets are mandatory fortification nodes under the current mission and budget, whereas nodes appearing in only some sets form alternative configurations. The protective value of a node therefore includes both mandatory and substitutable aspects.
5.3.2. Stable Performance under Cost and Structural Conditions
Changes in node interdiction cost, fortification effectiveness, topology, and size are used to test the sensitivity of the main-experiment results to experimental conditions. Figure 7 shows that, across homogeneous costs and two heterogeneous cost profiles, three fortification-increment multipliers, and all topology–size strata, MPCF-Exact continues to produce a positive minimum-cut gain relative to the comparison baseline; the magnitude of the gap varies with the budget, cost heterogeneity, and competing mission-path structure.
The heterogeneous fortification-cost experiment examines the conversion of node rankings into budget sets. When , ranking by score/cost or using 0–1 knapsack improves budget utilization efficiency, but the results remain below joint optimization. The mean relative optimality gaps of Degree-FullKnapsack at 2%, 5%, and 10% budgets are 6.91%, 11.04%, and 14.35%, respectively. MPCF-Greedy–MPCF-Exact gaps occur in centralized, modular, and distributed mission function graphs, and generally widen as the budget increases. Cost awareness can improve budget conversion for a given node score, but it cannot handle the combinatorial relationships among multiple candidate node cuts.
Taken together, the ablation and sensitivity results show that the MPCF gain mainly comes from consistency between the mission failure objective and the evaluation metric, together with joint selection within the budget-feasible domain. Cost awareness, an expanded candidate set, and improved structural ranking can improve some baseline results, but they do not address competition among candidate node cuts or minimum-cut switching. This difference persists as the bottleneck moves among the four functional layers.
5.4. Boundaries of the Mission-Performance Criterion and External Mission Validation
The preceding experiments use complete mission disconnection as the primary failure criterion. Using defined in Section 4.5, the minimum interdiction cost of a given fortification set can also be compared under partial mission-capacity degradation. All 21,888 capacity-response records achieve integer bound closure and pass maximum-flow recomputation; among them, the records with , numbering 5,472, agree with the node-cut results under complete-disconnection conditions.
Figure 8 compares the capacity responses of six representative methods at . As r increases from 0, the evaluation objective gradually shifts from complete disconnection to partial capacity reduction, and the relative ranking of methods changes accordingly.

Table 12.
Representative results for native fortification sets under capacity thresholds.
| Method | Mean actual consumption | ||||
|---|---|---|---|---|---|
| MPCF-Exact | 3.726 | 33.622 | 15.496 | 7.296 | 3.074 |
| MPCF-CG | 3.807 | 33.622 | 15.489 | 7.326 | 3.096 |
| MPCF-Greedy | 3.889 | 32.459 | 16.141 | 7.585 | 3.148 |
| PathFrequency | 3.889 | 30.415 | 15.615 | 7.437 | 3.178 |
| BPDReference | 3.889 | 29.474 | 15.815 | 7.896 | 3.311 |
The native outputs of different methods may use different actual fortification costs, so an equal-cost comparison is also needed to separate the effects of budget usage and node selection. At the same actual cost as MPCF-Exact, at MPCF-Greedy is lower by 1.207 on average and at it is higher by 0.622, 0.274, and 0.074, respectively. BPDReference and Betweenness show similar changes at some partial-capacity thresholds. Complete disconnection and capacity retention represent different mission requirements and produce different fortification preferences.
Table 13.
Capacity-threshold differences at equal actual fortification cost and gains of the capacity-oriented representative within the MPCF-optimal solution set.
Table 13.
Capacity-threshold differences at equal actual fortification cost and gains of the capacity-oriented representative within the MPCF-optimal solution set.
| Comparison | ||||
|---|---|---|---|---|
| MPCF-Greedy − MPCF-Exact | ||||
| BPDReference − MPCF-Exact | ||||
| Betweenness − MPCF-Exact | ||||
| Capacity-oriented representative − Saturated representative | – |
With and actual fortification cost held constant, is further maximized to select a capacity-oriented representative from the tied optimal solutions. Relative to the budget-saturated MPCF-optimal representative, at , respectively, this scheme achieves mean increases of 0.822, 0.496, and 0.185, with cumulative counts of 128 wins, 277 ties, and 0 losses (Figure 8c). This result shows that a specific implementation scheme can still be selected from the MPCF-optimal solution set according to different mission-performance requirements.
The public-data experiment examines the applicability of MPCF to external directed-path structures. MBTA GTFS and SNDlib Polska each provide 5 missions satisfying source-path consistency and endpoint-connectivity requirements, yielding 10 public missions. Each mission uses an absolute budget , forming 30 validation instances. All 30 optimal objective values from MPCF-Exact are independently verified by MPCF-CG in the cut space.
For the 15 absolute-budget pairs from MBTA, MPCF-Exact, MPCF-Greedy, and PathFrequency obtain the same minimum cut values; for SNDlib Polska, the mean gap of PathFrequency relative to the global MPCF optimum is 8.00%. The public missions test whether the mission-path semantics, node-cut model, and objective-value consistency of the two exact formulations remain valid for external directed-path relationships.
5.5. Integrated Discussion of Mission-Level Preemptive Fortification
The protective value of mission function nodes is jointly determined by mission threads and the failure criterion. Centrality, network dismantling, message-passing, and learning-based methods identify nodes according to different structural properties, and their optimization objectives do not coincide with the disconnection of all valid source–sink paths. In the main experiment, the best non-MPCF result selected for each instance still differs from the MPCF optimum; nested ablation shows that the main performance improvement appears after exact node-cut evaluation is adopted. These results indicate that preemptive fortification should be evaluated on the basis of mission function relationships and the corresponding failure criterion.
The fortification value of mission-function nodes also depends on the selected set. Section 4.3 proves that is monotone but generally nonsubmodular, and the experimental gain of MPCF-Exact over MPCF-Greedy occurs mainly at medium and high budgets, where more nodes can be selected. After the current weak cut is strengthened, an alternative cut may become the new minimum cut, and the marginal value of subsequent nodes changes with the existing set. The number of minimum-cut switches, the MPCF-Greedy gap, and the mandatory and substitutable nodes in the optimal set families show that mission-level protection configuration must account for the joint effects of node combinations on multiple candidate cuts.
and the optimal fortification sets provide different decision information. The former gives the maximum minimum cut value attainable under the current mission and budget and can serve as a common reference for heuristic and structural methods; describes the set of configurations that attain this value at minimum implementation cost. When multiple equivalent sets exist, a specific scheme can be selected according to resource availability, deployment conditions, and capacity requirements. The capacity experiments show that, after fixing the MPCF optimum and actual cost, selecting a representative according to partial-capacity metrics can further improve the corresponding capacity performance.
Role composition changes the weak positions of mission paths and the role distribution of optimal fortification sets. Under the four single-layer-scarcity compositions, the scarce role, which accounts for approximately one-seventh of the nodes, receives approximately two-thirds to three-quarters of the fortification selections; the advantage of MPCF over mission-path and structural methods remains. MPCF identifies bottlenecks from the node-cut structure of the current mission function graph and adjusts the fortification locations as the resource composition changes.
Different mission-performance criteria correspond to different protection objectives. This paper treats the complete disconnection of all valid paths as the primary failure event in the absorption stage, so MPCF maximizes . If the mission must maintain a certain concurrent capacity under disturbance, , , and produce different fortification rankings. The definition of critical performance at the mission-engineering stage determines the optimization objective of the preemptive-fortification model.
This paper uses a deterministic, static mission-function graph and a node-level interdiction model, which are suitable for absorption-capability analysis under given mission threads, equivalent node-interdiction costs, and limited preemptive-fortification resources. Validation on public mission paths confirms the applicability of the flow–cut formulation and objective-value consistency to external directed-path relationships. Future work can study dynamic mission-function graphs, introduce node-disablement probabilities, cascading effects, online mission reconfiguration, and recovery processes, and calibrate interdiction costs, fortification costs, and capacity parameters using physical or hardware-in-the-loop data.
6. Conclusions
This paper proposes MPCF to maximize the minimum node-cut value of a fortified directed mission network under a limited budget. Node splitting transforms the problem into a mixed-integer linear program; small-scale enumeration, minimum-cut recomputation for fixed schemes, and the cut-generation model all produce consistent objective values.
Across the 135 main-experiment graph–budget pairs, the mean optimality gaps of MPCF-Greedy and PathFrequency are 2.76% and 9.50%, respectively. After the role composition is expanded to six ratios, MPCF-Exact and MPCF-CG produce identical objective values for 810 pairs; the mean cross-composition gap of MPCF-Greedy is 1.98%, and its fortified-node distribution changes with the bottleneck locations among S, C, L, and E. The 30 absolute-budget instances on public networks likewise produce consistent flow-space and cut-space results. The experiments show that, under a deterministic static mission model, set-level optimization under a budget constraint can increase the minimum node-cut value of mission paths.
Author Contributions
Conceptualization, Huang Zhijie; methodology, Huang Zhijie; software, Huang Zhijie; validation, Li Xiaobo; formal analysis, Wang Tao; data curation, Huang Zhijie; writing–original draft preparation, Huang Zhijie; writing–review and editing,Li Xiaobo, Wang Tao, Bai Liang; visualization, Li Xiaobo. The authors have read and agreed to the published version of the manuscript.
Funding
This work was supported by the National Natural Science Foundation of China (No. 72471234) and the National Defense Basic Scientific Research Program (JCKY2022204A001).
Institutional Review Board Statement
Not applicable. This study does not involve human participants or animal experiments.
Informed Consent Statement
Not applicable.
Data Availability Statement
Synthetic networks, public-data mappings, method-coverage tables, instance-level results, and solver-status, bound, and recomputation records are organized in a reproducibility archive. Persistent repository links and version numbers will be added before submission.
Acknowledgments
The authors thank the open-source NetworkDismantling/review project for providing unified implementations and source information for network-dismantling methods.
Conflicts of Interest
The authors declare no conflict of interest.
Abbreviations
| MPCF | Mission-Path Cut Fortification |
| MILP | Mixed-Integer Linear Programming |
| CG | Cut Generation |
| CI | Collective Influence |
| BPD | Belief Propagation-guided Decimation |
| GND | Generalized Network Dismantling |
| MBTA | Massachusetts Bay Transportation Authority |
| GTFS | General Transit Feed Specification |
| SNDlib | Survivable Network Design Library |
References
- Office of the Under Secretary of Defense for Research and Engineering. Mission Engineering Guide, Version 2.0; U.S. Department of Defense: Washington, DC, USA, 2023; Available online: https://ac.cto.mil/wp-content/uploads/2023/11/MEG_2_Oct2023.pdf.
- Hernandez, A.S.; Pollman, A.G. Characterizing Integration Challenges in Mission Engineering to Form Solution Strategies. Syst. Eng. 2022, 25, 404–418. [Google Scholar] [CrossRef]
- Martin, J.N. Using the Unified Architecture Framework in Support of Mission Engineering Activities. INCOSE Int. Symp. 2023, 33, 1156–1172. [Google Scholar] [CrossRef]
- Moreland, J.; Ambler, N.; LaMar, C.; Nix, M.; Sawyer, C. Accelerating Mission Engineering: Evidence of a Stratified Landscape and a Path toward Unified Practice. Syst. Eng. 2026, e70076, early view. [Google Scholar] [CrossRef]
- Bruneau, M.; Chang, S.E.; Eguchi, R.T.; Lee, G.C.; O’Rourke, T.D.; Reinhorn, A.M.; Shinozuka, M.; Tierney, K.; Wallace, W.A.; von Winterfeldt, D. A Framework to Quantitatively Assess and Enhance the Seismic Resilience of Communities. Earthq. Spectra 2003, 19, 733–752. [Google Scholar] [CrossRef]
- Poulin, C.; Kane, M.B. Infrastructure Resilience Curves: Performance Measures and Summary Metrics. Reliab. Eng. Syst. Saf. 2021, 216, 107926. [Google Scholar] [CrossRef]
- Artime, O.; Grassia, M.; De Domenico, M.; Gleeson, J.P.; Makse, H.A.; Mangioni, G.; Perc, M.; Radicchi, F. Robustness and Resilience of Complex Networks. Nat. Rev. Phys. 2024, 6, 114–131. [Google Scholar] [CrossRef]
- Morone, F.; Makse, H.A. Influence Maximization in Complex Networks through Optimal Percolation. Nature 2015, 524, 65–68. [Google Scholar] [CrossRef]
- Braunstein, A.; Dall’Asta, L.; Semerjian, G.; Zdeborová, L. Network Dismantling. Proc. Natl. Acad. Sci. USA 2016, 113, 12368–12373. [Google Scholar] [CrossRef]
- Wang, L.; Zhang, S.; Szucs, G.; Wang, Y. Identifying the Critical Nodes in Multi-Modal Transportation Network with a Traffic Demand-Based Computational Method. Reliab. Eng. Syst. Saf. 2024, 244, 109956. [Google Scholar] [CrossRef]
- Wang, Y.; Zhao, O.; Zhang, L. Multiplex Networks in Resilience Modeling of Critical Infrastructure Systems: A Systematic Review. Reliab. Eng. Syst. Saf. 2024, 250, 110300. [Google Scholar] [CrossRef]
- Smith, J.C.; Song, Y. A Survey of Network Interdiction Models and Algorithms. Eur. J. Oper. Res. 2020, 283, 797–811. [Google Scholar] [CrossRef]
- Abdolahzadeh, A.; Aman, M.; Tayyebi, J. Minimum st–Cut Interdiction Problem. Comput. Ind. Eng. 2020, 148, 106708. [Google Scholar] [CrossRef]
- Leitner, M.; Ljubić, I.; Monaci, M.; Sinnl, M.; Tanınmış, K. An Exact Method for Binary Fortification Games. Eur. J. Oper. Res. 2023, 307, 1026–1039. [Google Scholar] [CrossRef]
- Mugisha, S.; Zhou, H.-J. Identifying Optimal Targets of Network Attack by Belief Propagation. Phys. Rev. E 2016, 94, 012305. [Google Scholar] [CrossRef]
- Zdeborová, L.; Zhang, P.; Zhou, H.-J. Fast and Simple Decycling and Dismantling of Networks. Sci. Rep. 2016, 6, 37954. [Google Scholar] [CrossRef]
- Ren, X.-L.; Gleinig, N.; Helbing, D.; Antulov-Fantulin, N. Generalized Network Dismantling. Proc. Natl. Acad. Sci. USA 2019, 116, 6554–6559. [Google Scholar] [CrossRef]
- Fan, C.; Zeng, L.; Sun, Y.; Liu, Y.-Y. Finding Key Players in Complex Networks through Deep Reinforcement Learning. Nat. Mach. Intell. 2020, 2, 317–324. [Google Scholar] [CrossRef]
- Grassia, M.; De Domenico, M.; Mangioni, G. Machine Learning Dismantling and Early-Warning Signals of Disintegration in Complex Systems. Nat. Commun. 2021, 12, 5190. [Google Scholar] [CrossRef]
- Wandelt, S.; Chen, X.; Sun, X. Recent Advances in Network Dismantling: A Comprehensive Review and List of Recommendations for Future Work. Chaos Solitons Fractals 2025, 199, 116673. [Google Scholar] [CrossRef]
- Brown, G.; Carlyle, M.; Salmerón, J.; Wood, K. Defending Critical Infrastructure. Interfaces 2006, 36, 530–544. [Google Scholar] [CrossRef]
- Hien, L.T.K.; Sim, M.; Xu, H. Mitigating Interdiction Risk with Fortification. Oper. Res. 2020, 68, 348–362. [Google Scholar] [CrossRef]
- Arulselvan, A.; Chinchuluun, A.; Pardalos, P.M. A Bilevel Critical Node Detection Problem. Optim. Lett. online first. 2025. [Google Scholar] [CrossRef]
- General Transit Feed Specification: Schedule Reference. Available online: https://gtfs.org/documentation/schedule/reference/.
- MBTA GTFS Documentation. Available online: https://github.com/mbta/gtfs-documentation.
- Orlowski, S.; Wessály, R.; Pióro, M.; Tomaszewski, A. SNDlib 1.0: Survivable Network Design Library. Networks 2010, 55, 276–286. [Google Scholar] [CrossRef]
- Morone, F.; Min, B.; Bo, L.; Mari, R.; Makse, H.A. Collective Influence Algorithm to Find Influencers via Optimal Percolation in Massively Large Social Media. Sci. Rep. 2016, 6, 30062. [Google Scholar] [CrossRef]
- Ren, X.-L.; Antulov-Fantulin, N. Ensemble Approach for Generalized Network Dismantling. In Complex Networks and Their Applications VIII; Cherifi, H., Gaito, S., Mendes, J.F., Moro, E., Rocha, L.M., Eds.; Springer: Cham, Switzerland, 2020; pp. 783–793. [Google Scholar] [CrossRef]
- Clusella, P.; Grassberger, P.; Pérez-Reche, F.J.; Politi, A. Immunization and Targeted Destruction of Networks Using Explosive Percolation. Phys. Rev. Lett. 2016, 117, 208301. [Google Scholar] [CrossRef]
- Grassia, M.; Mangioni, G. CoreGDM: Geometric Deep Learning Network Decycling and Dismantling. In Complex Networks XIV; Teixeira, A.S., Botta, F., Mendes, J.F., Menezes, R., Mangioni, G., Eds.; Springer: Cham, Switzerland, 2023; pp. 86–94. [Google Scholar] [CrossRef]
- Ghavasieh, A.; Stella, M.; Biamonte, J.; De Domenico, M. Unraveling the Effects of Multiscale Network Entanglement on Empirical Systems. Commun. Phys. 2021, 4, 129. [Google Scholar] [CrossRef]
- Huang, Y.; Wang, H.; Ren, X.-L.; Lü, L. Identifying Key Players in Complex Networks via Network Entanglement. Commun. Phys. 2024, 7, 19. [Google Scholar] [CrossRef]
Figure 1.
The fortification–interdiction decision structure of MPCF. The left side shows the mission-functional graph and the interdiction costs, fortification costs, and fortification increments of candidate mission-functional nodes; the middle shows how the fortifier forms different candidate fortification sets under the budget constraint and computes, for each given set, the minimum-cost node cut that disconnects all valid mission paths; the right side shows how the fortification scheme that maximizes the minimum-weight s–t node-cut value is selected from the budget-feasible set. – are representative budget-feasible sets, and red circles indicate fortified mission-functional nodes.
Figure 1.
The fortification–interdiction decision structure of MPCF. The left side shows the mission-functional graph and the interdiction costs, fortification costs, and fortification increments of candidate mission-functional nodes; the middle shows how the fortifier forms different candidate fortification sets under the budget constraint and computes, for each given set, the minimum-cost node cut that disconnects all valid mission paths; the right side shows how the fortification scheme that maximizes the minimum-weight s–t node-cut value is selected from the budget-feasible set. – are representative budget-feasible sets, and red circles indicate fortified mission-functional nodes.
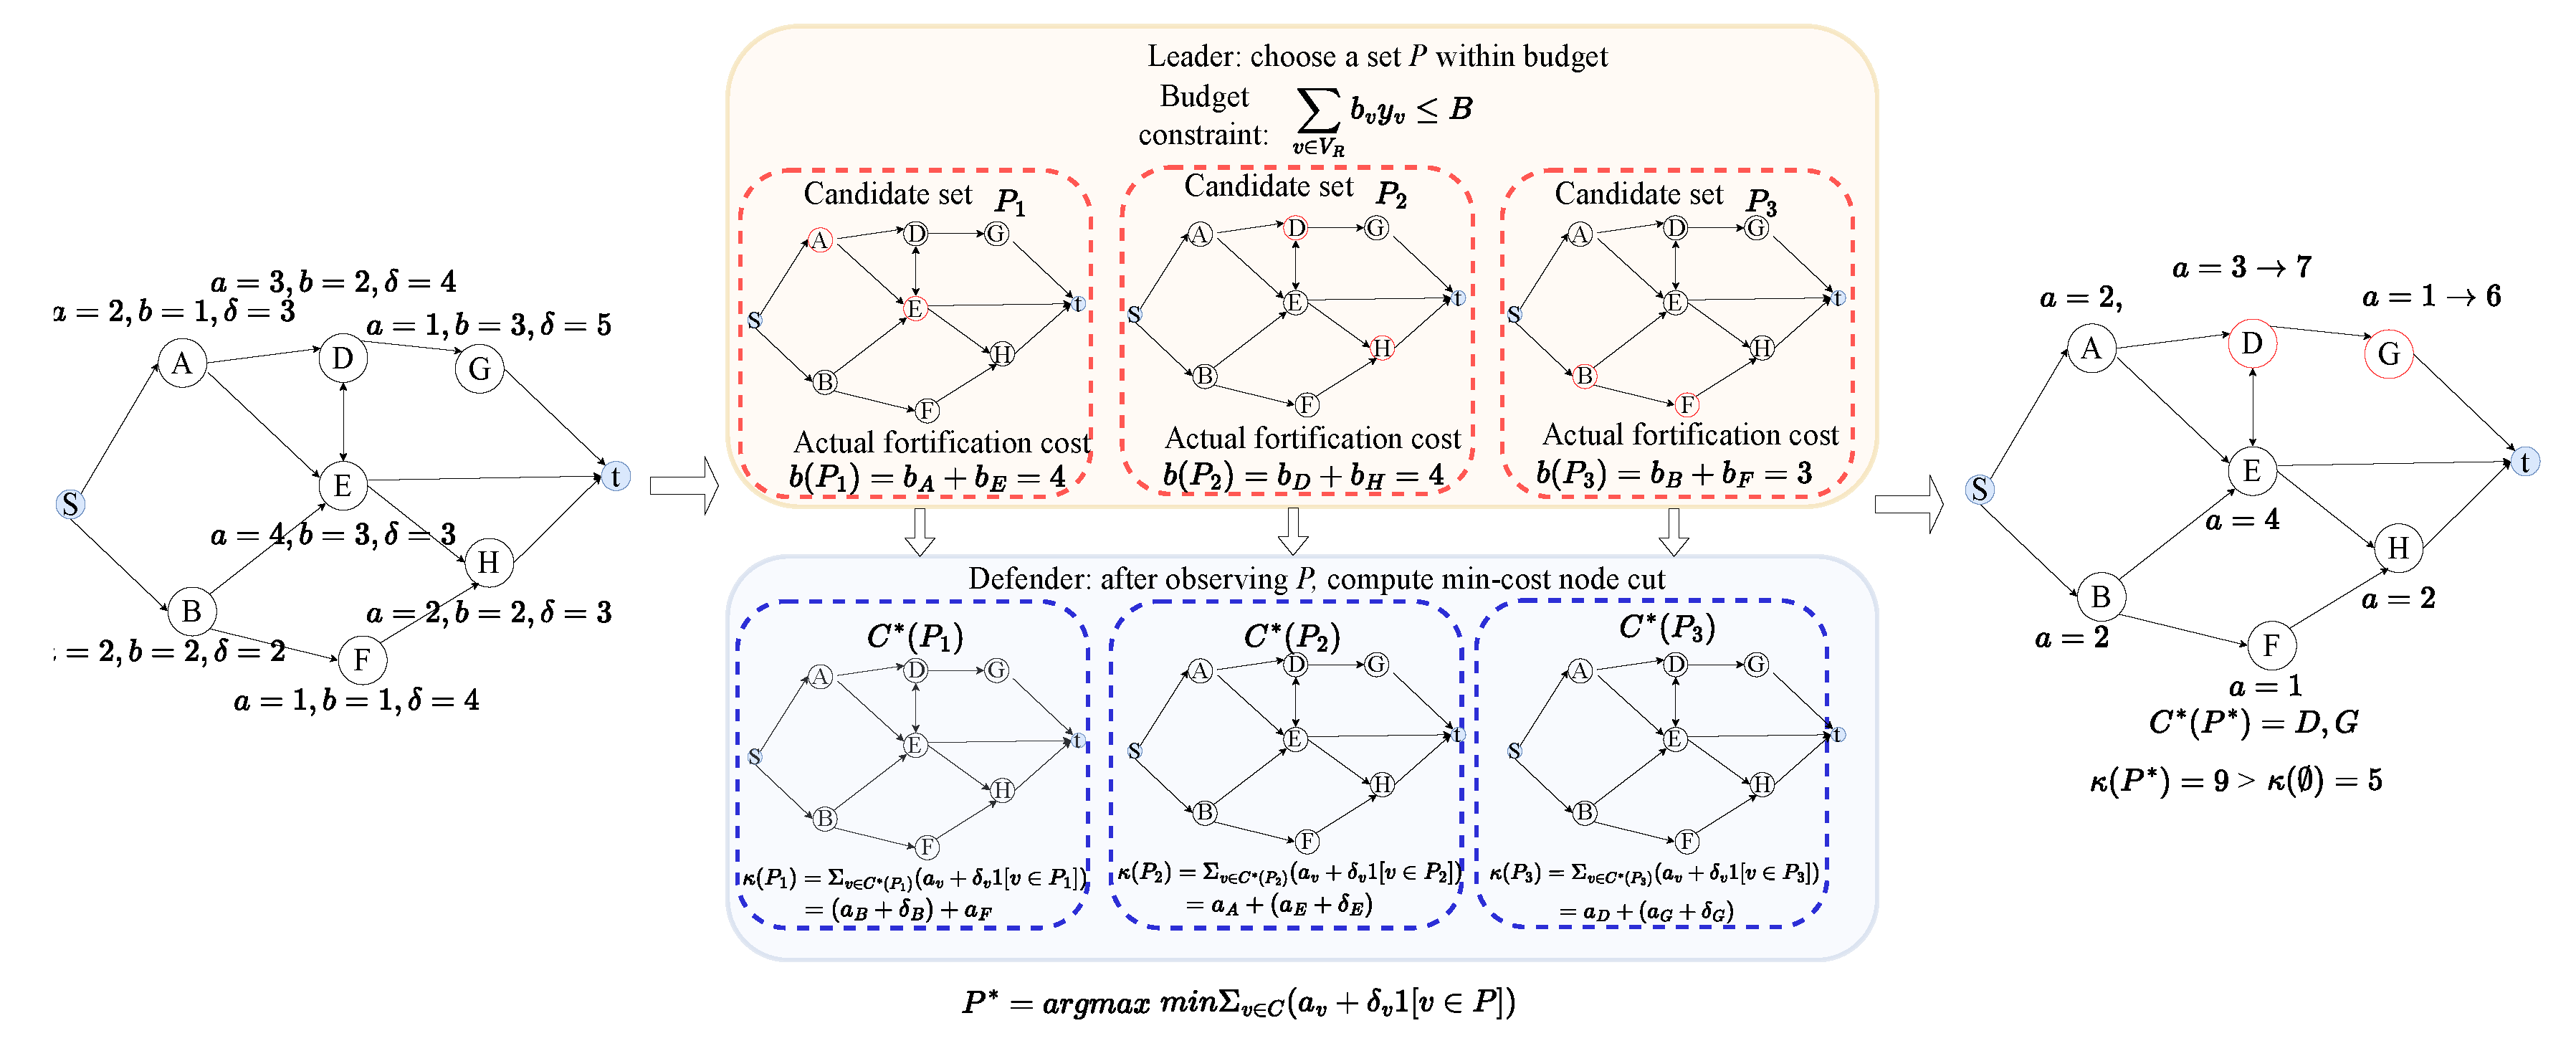
Figure 2.
Node splitting of mission-function nodes and the flow–cut equivalence. The left panel converts a mission-function node into an internal arc and represents its effective interdiction cost by the internal-arc capacity; the middle panel extends this transformation to the mission-function graph, where a node cut corresponds to a candidate internal-arc cut in the split network and its minimum cut value can be computed using the max-flow–min-cut equivalence; the right panel illustrates the change in internal-arc capacities and the increase in the minimum cut value after fixing the fortification set . In the example, the minimum cut value increases from 2 to 6.
Figure 2.
Node splitting of mission-function nodes and the flow–cut equivalence. The left panel converts a mission-function node into an internal arc and represents its effective interdiction cost by the internal-arc capacity; the middle panel extends this transformation to the mission-function graph, where a node cut corresponds to a candidate internal-arc cut in the split network and its minimum cut value can be computed using the max-flow–min-cut equivalence; the right panel illustrates the change in internal-arc capacities and the increase in the minimum cut value after fixing the fortification set . In the example, the minimum cut value increases from 2 to 6.
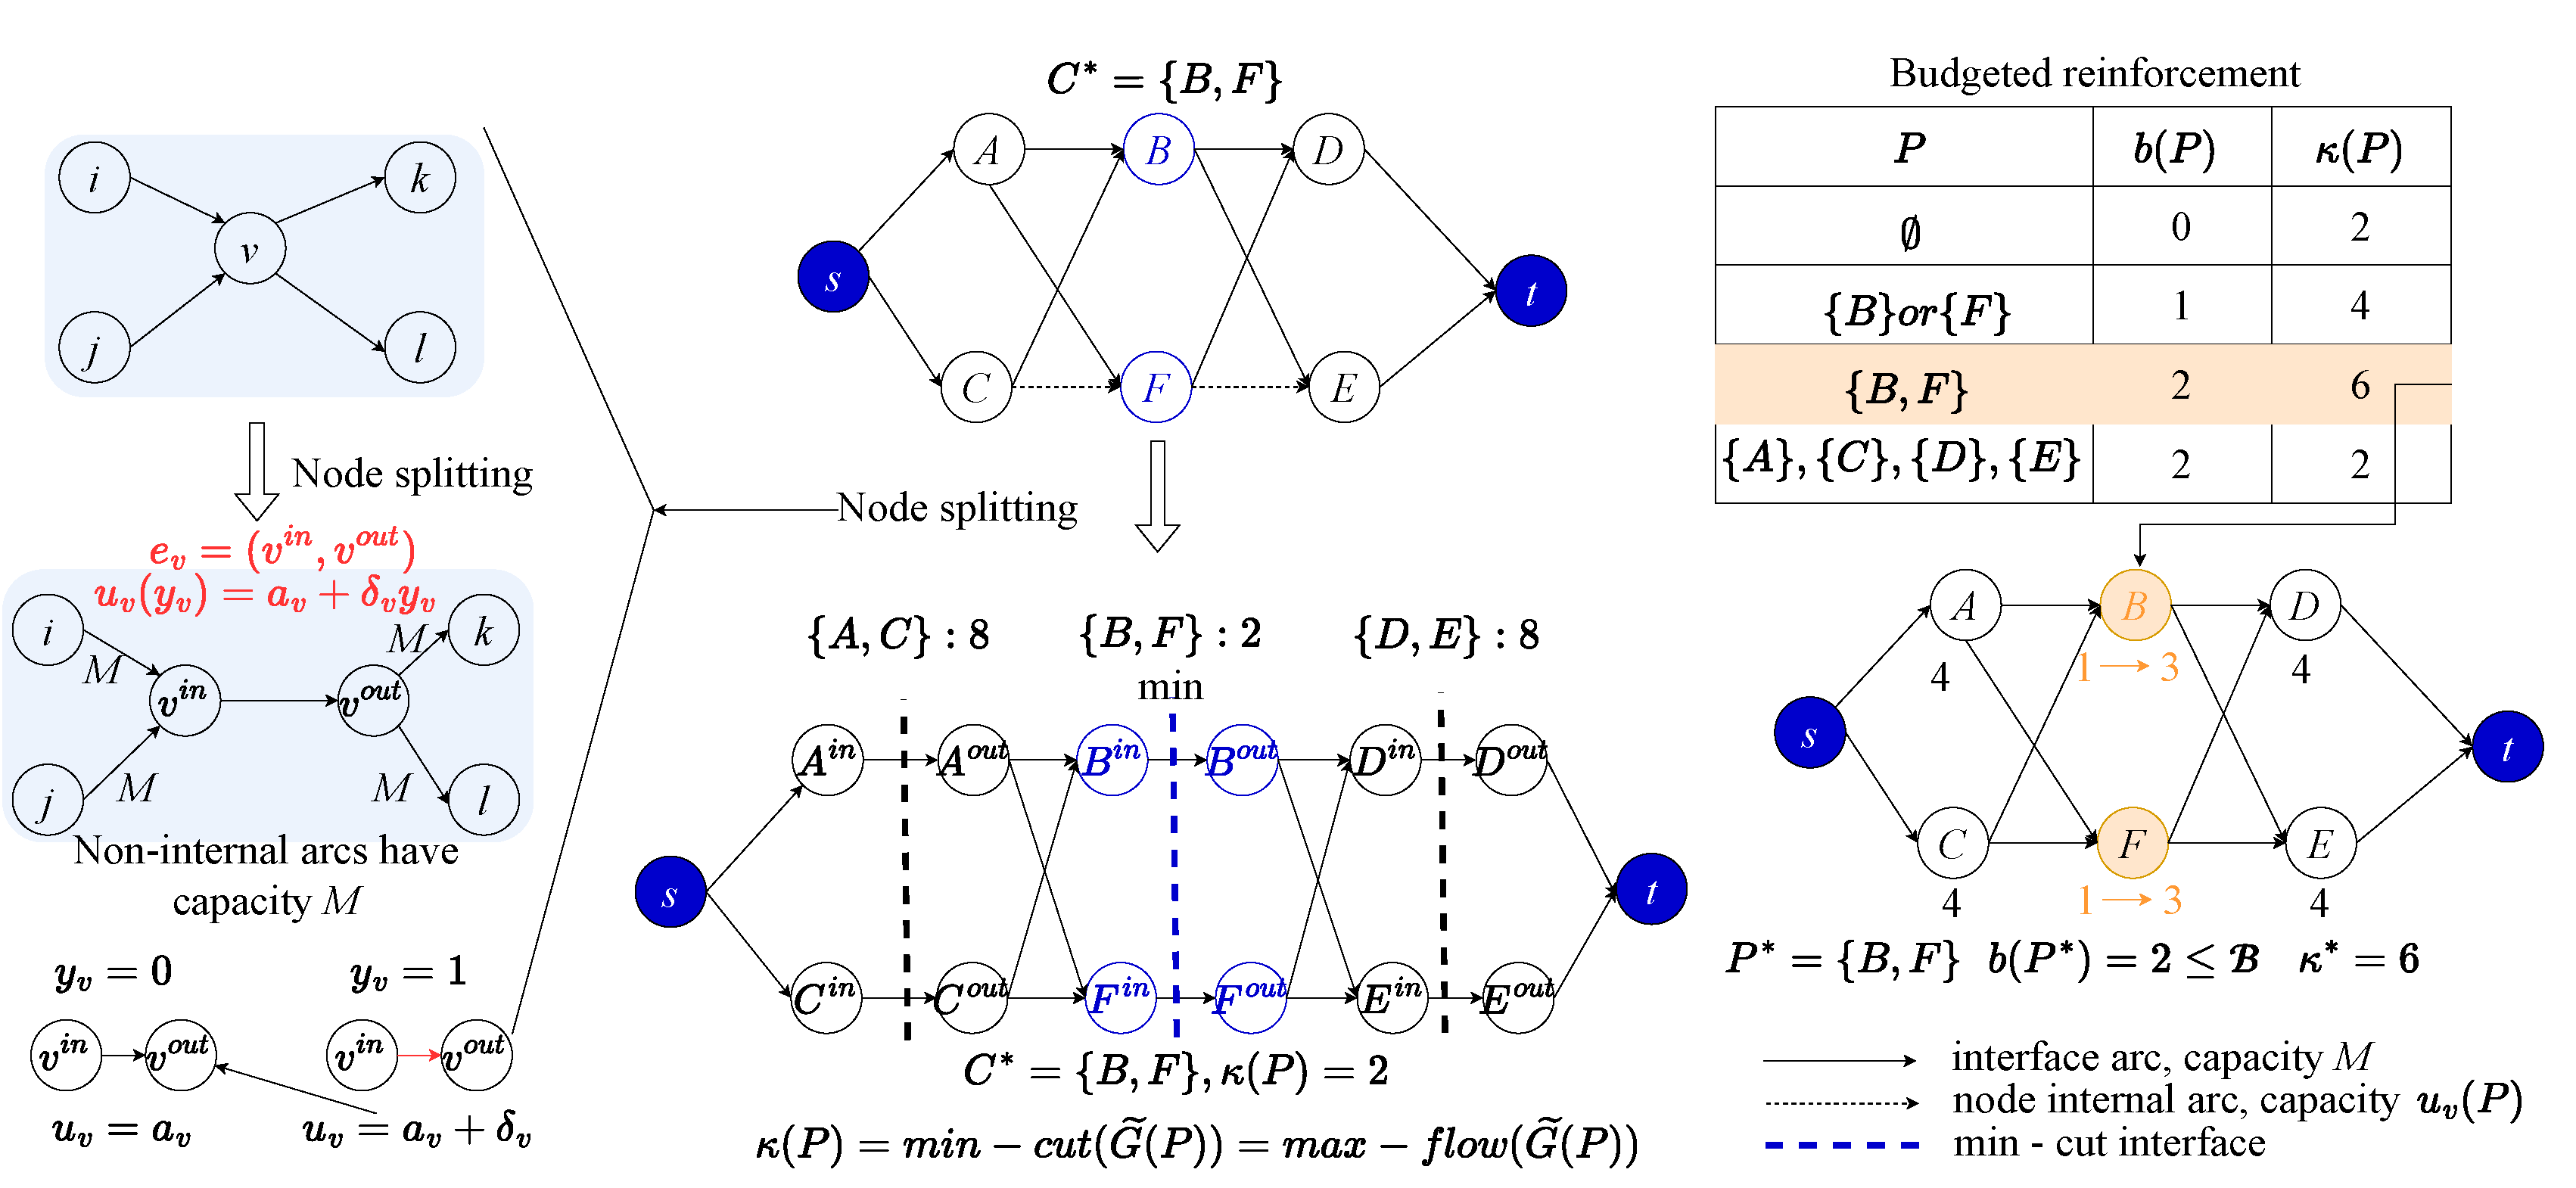
Figure 3.
Computational scale and bound closure for exact MPCF optimization. a, median end-to-end running times of MPCF-Exact and MPCF-CG at –300 and three budget levels; line styles distinguish solvers, and colors and symbols distinguish budgets. b, ratio of median running times, MPCF-CG/MPCF-Exact, under the same size–budget conditions. c, bound-closure modes and instance counts in the and 300 scaling experiments. In the main experiment, the two formulations produce identical MPCF objective values for 135/135 instances, with a maximum absolute difference of 0.
Figure 3.
Computational scale and bound closure for exact MPCF optimization. a, median end-to-end running times of MPCF-Exact and MPCF-CG at –300 and three budget levels; line styles distinguish solvers, and colors and symbols distinguish budgets. b, ratio of median running times, MPCF-CG/MPCF-Exact, under the same size–budget conditions. c, bound-closure modes and instance counts in the and 300 scaling experiments. In the main experiment, the two formulations produce identical MPCF objective values for 135/135 instances, with a maximum absolute difference of 0.
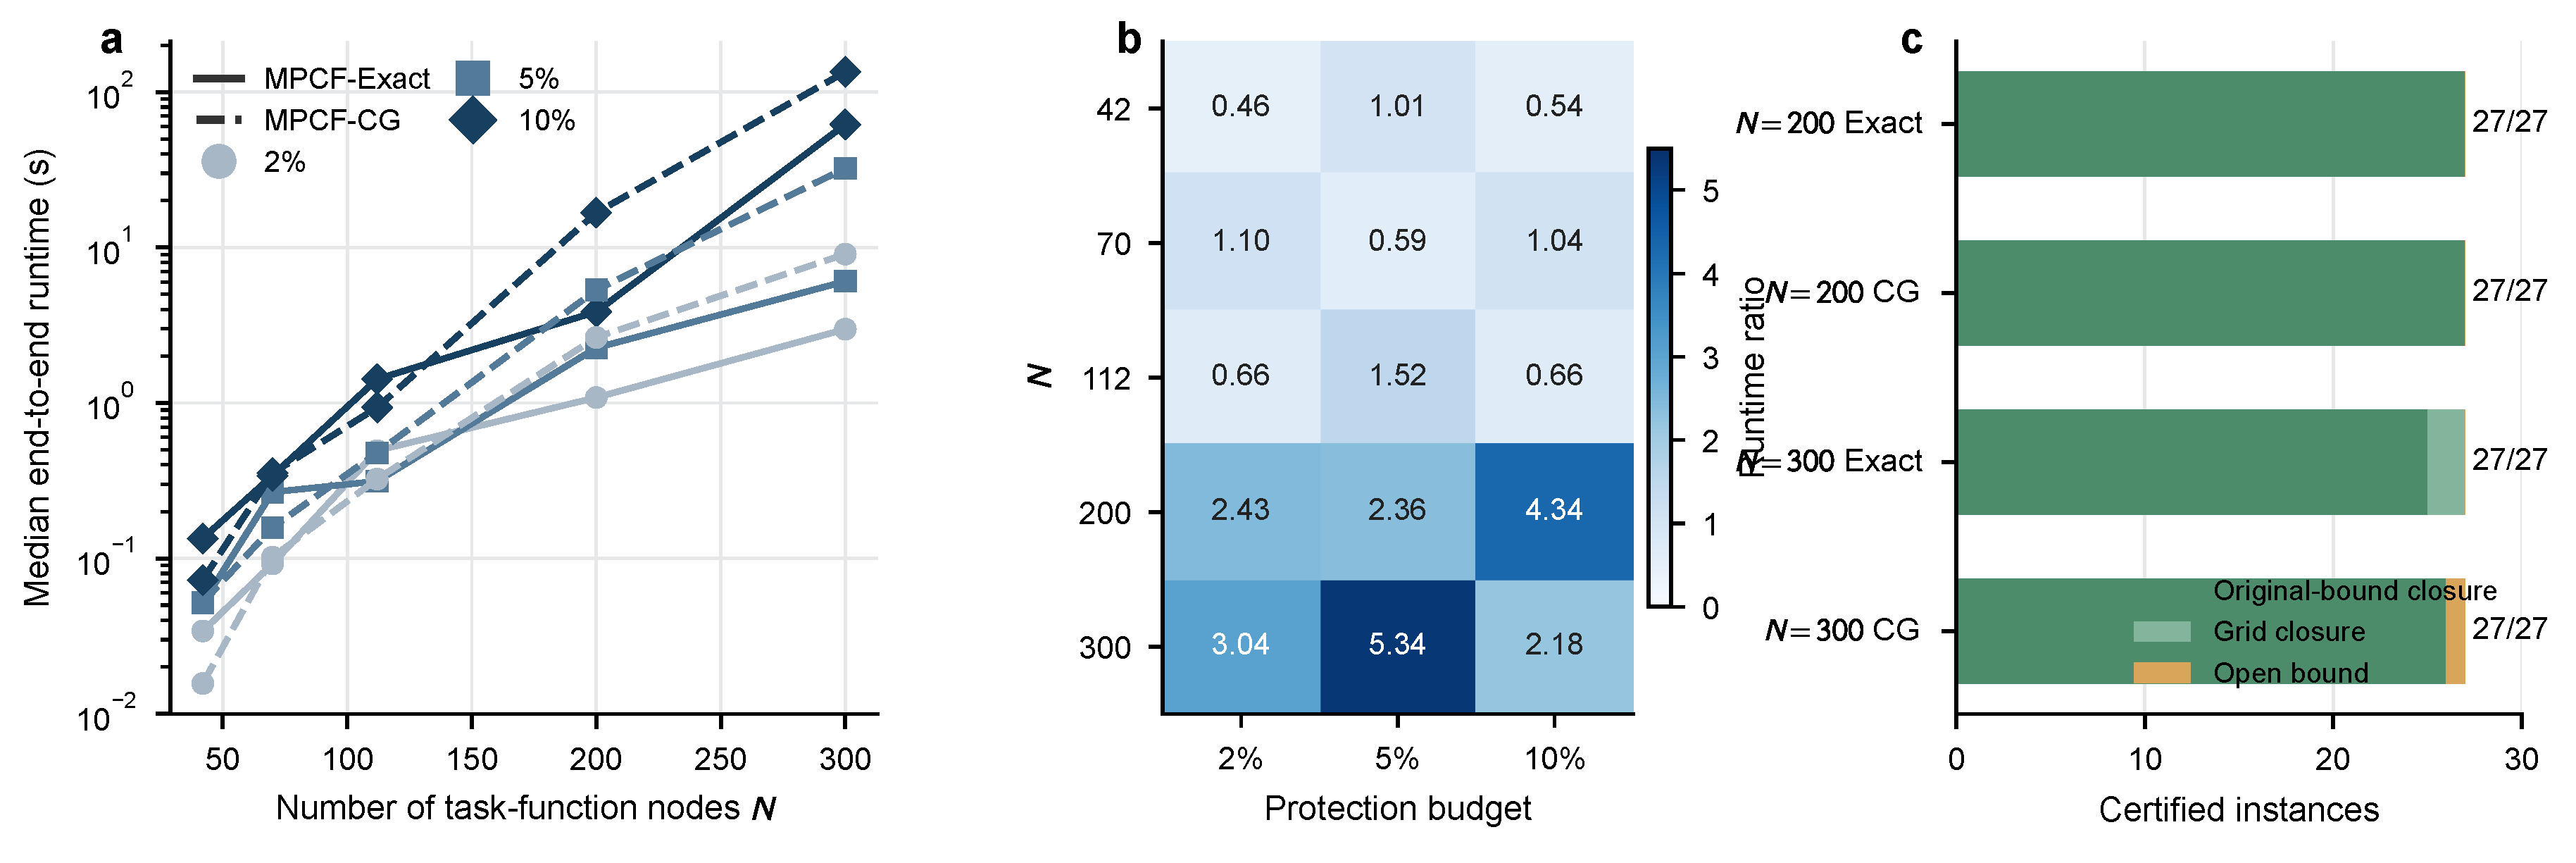
Figure 4.
Absolute objective values and same-instance comparisons in the main experiment. a, mean absolute minimum cut value of MPCF-Exact and five representative methods at three budget levels; error bars are bootstrap 95% confidence intervals obtained by resampling frozen graphs. b, same-instance objective gain of MPCF-Exact relative to each method and 95% confidence intervals. c, performance profiles of inexact methods, namely the proportions of instances whose relative optimality gap does not exceed a given tolerance; the red dashed line denotes the global MPCF optimum.
Figure 4.
Absolute objective values and same-instance comparisons in the main experiment. a, mean absolute minimum cut value of MPCF-Exact and five representative methods at three budget levels; error bars are bootstrap 95% confidence intervals obtained by resampling frozen graphs. b, same-instance objective gain of MPCF-Exact relative to each method and 95% confidence intervals. c, performance profiles of inexact methods, namely the proportions of instances whose relative optimality gap does not exceed a given tolerance; the red dashed line denotes the global MPCF optimum.
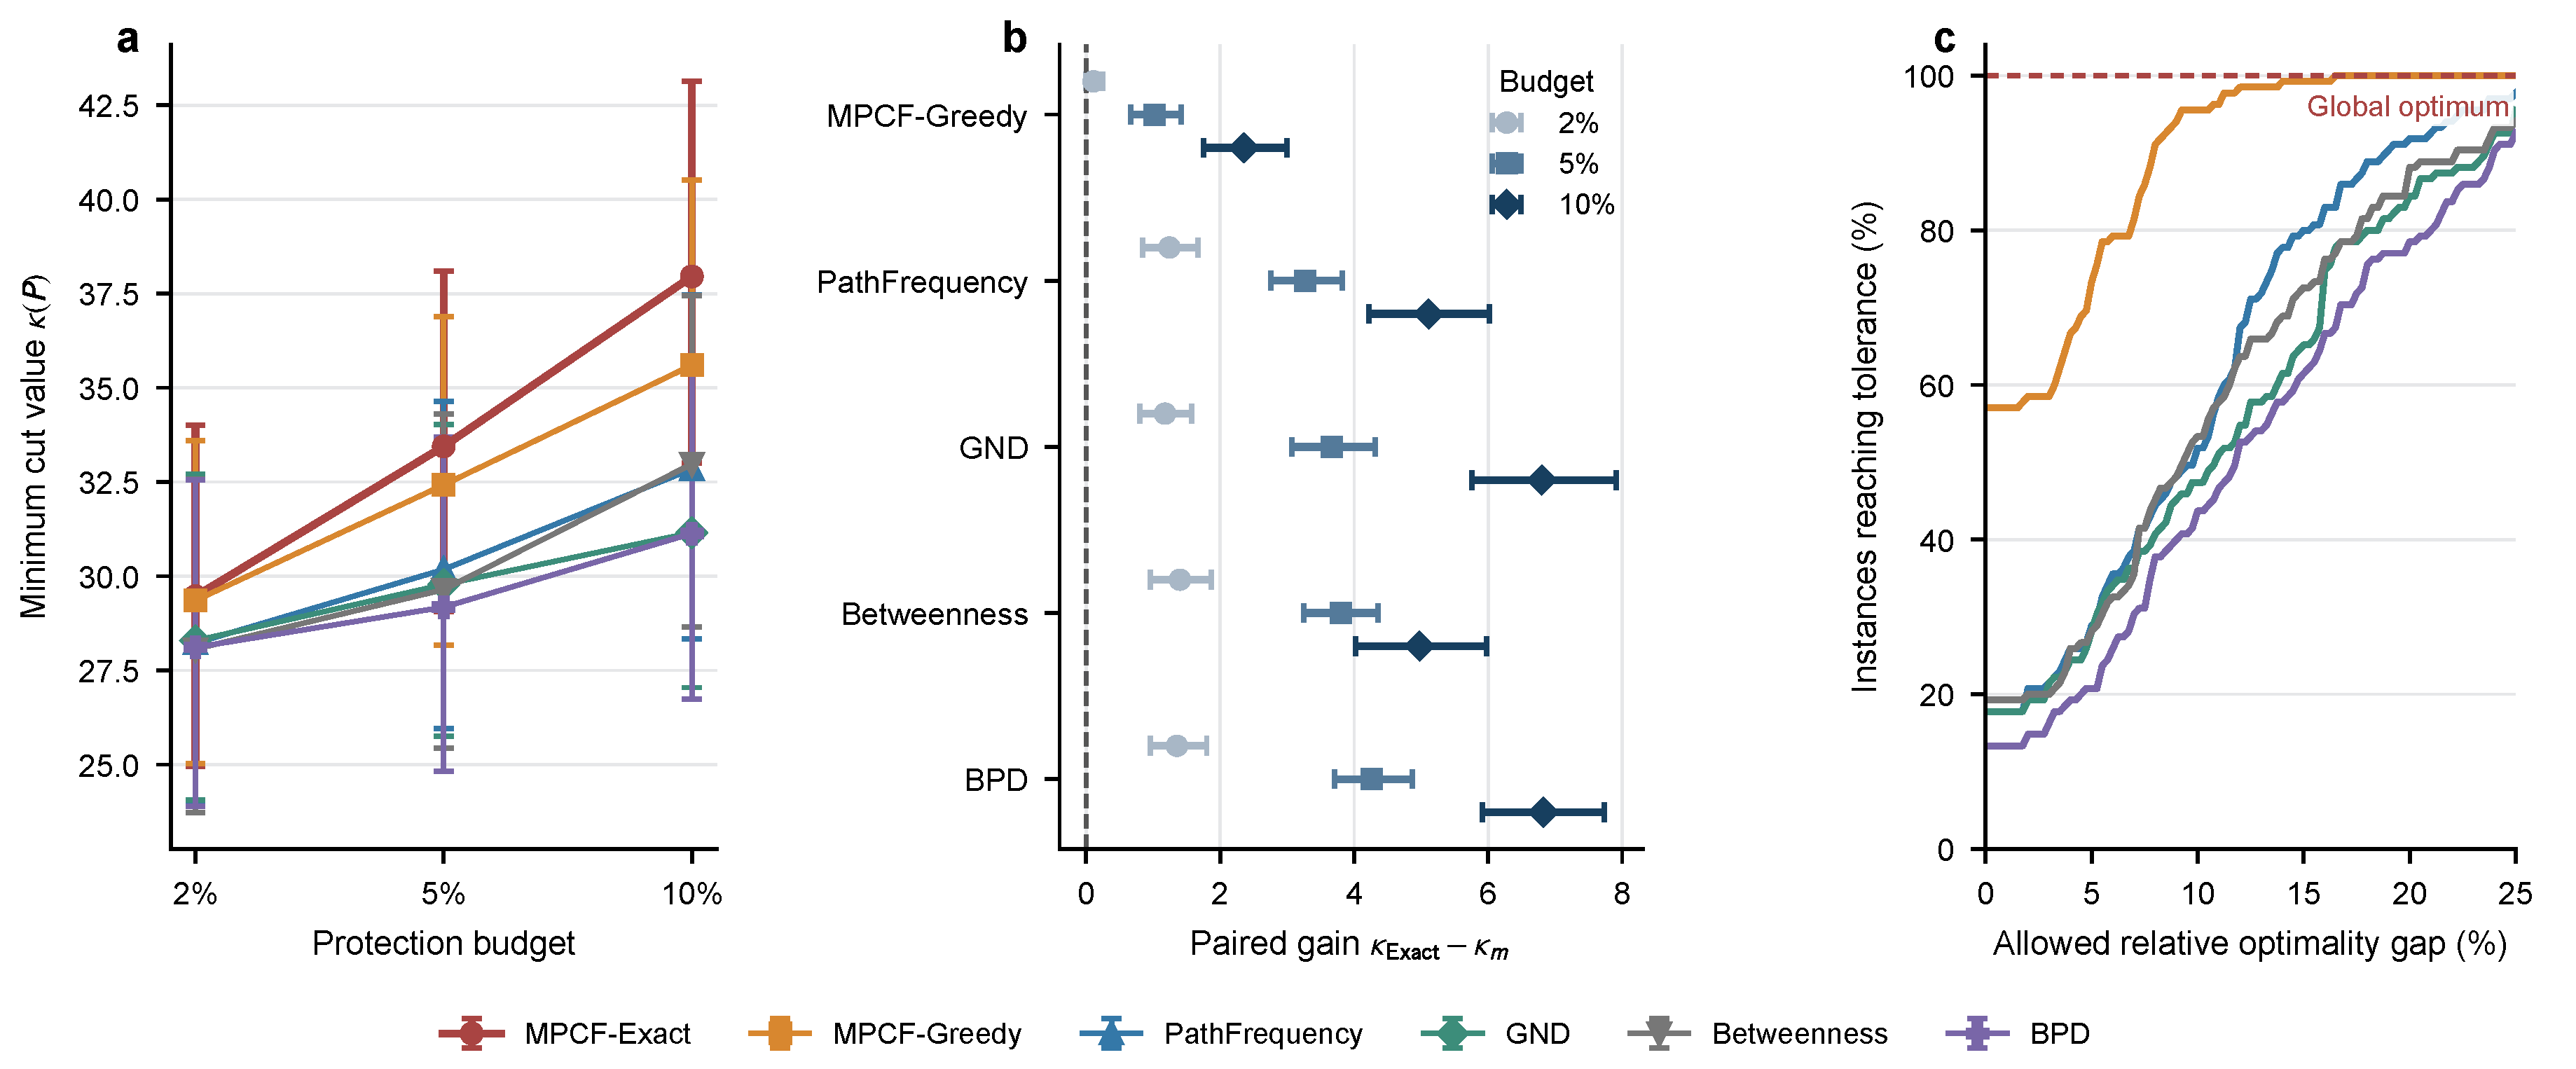
Figure 6.
Competing minimum cuts and optimal fortification set families. a, relationship between the number of minimum-cut switches during MPCF-Greedy selection and its relative optimality gap at three budget levels; the in-figure annotations give the within-budget Spearman correlation coefficient and test result. b, mandatory mission function nodes, substitutable nodes, and the number of complete enumerated sets in six representative cases.
Figure 6.
Competing minimum cuts and optimal fortification set families. a, relationship between the number of minimum-cut switches during MPCF-Greedy selection and its relative optimality gap at three budget levels; the in-figure annotations give the within-budget Spearman correlation coefficient and test result. b, mandatory mission function nodes, substitutable nodes, and the number of complete enumerated sets in six representative cases.
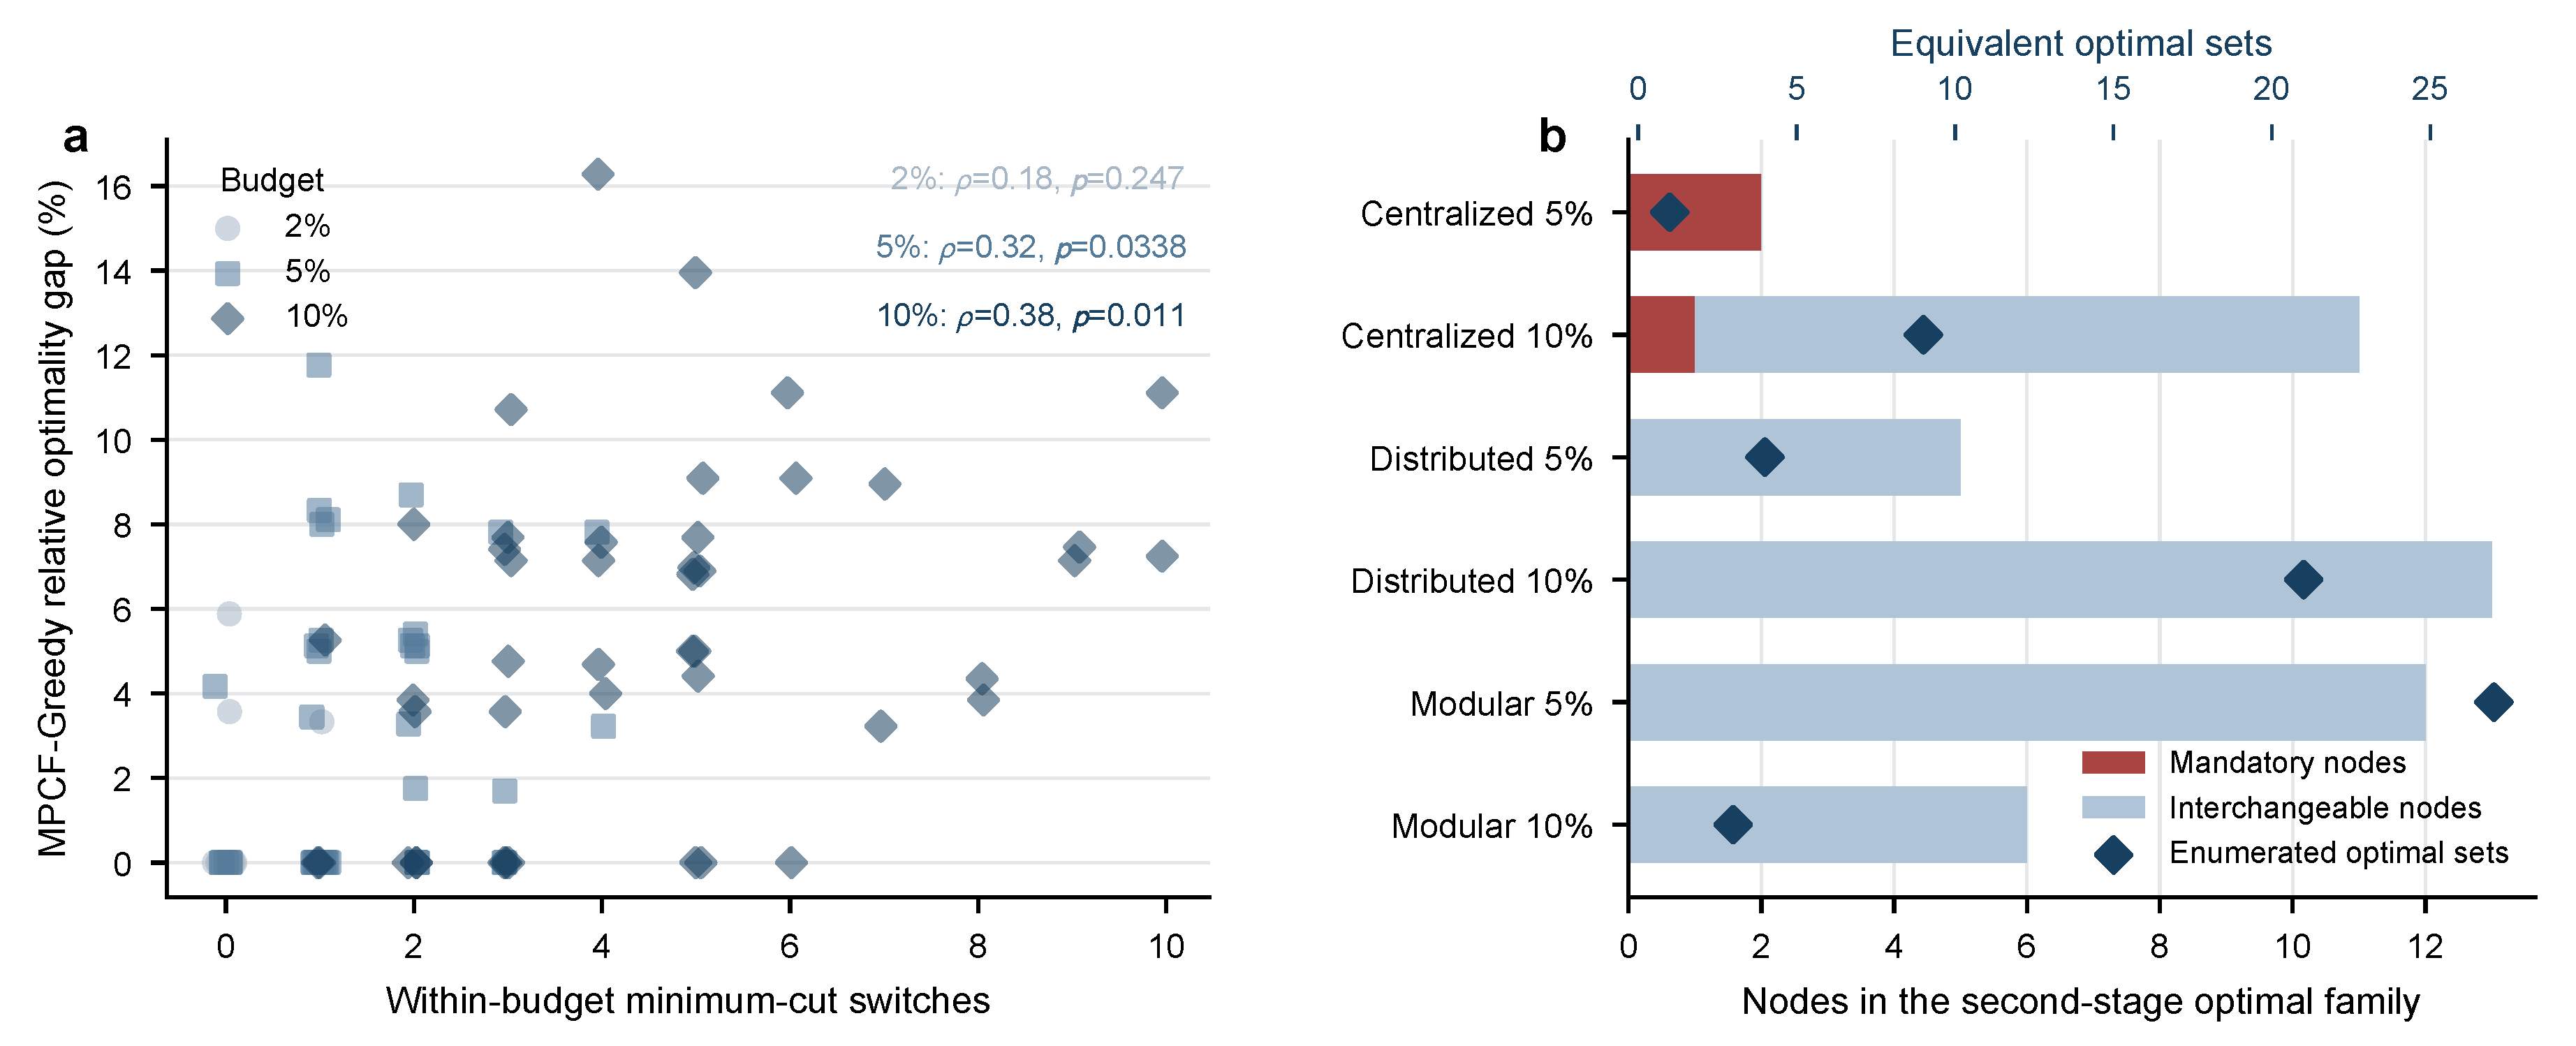
Figure 7.
Robustness under cost, budget, topology, and size conditions. a, mean minimum-cut gain of MPCF-Exact relative to the post hoc best non-MPCF baseline envelope under three node-interdiction cost profiles and three fortification-increment multipliers. b, variation of this gain with budget and cost heterogeneity; error bars are graph-level bootstrap 95% confidence intervals. c,d, gaps between MPCF-Greedy and MPCF-Exact stratified by topology and size.
Figure 7.
Robustness under cost, budget, topology, and size conditions. a, mean minimum-cut gain of MPCF-Exact relative to the post hoc best non-MPCF baseline envelope under three node-interdiction cost profiles and three fortification-increment multipliers. b, variation of this gain with budget and cost heterogeneity; error bars are graph-level bootstrap 95% confidence intervals. c,d, gaps between MPCF-Greedy and MPCF-Exact stratified by topology and size.
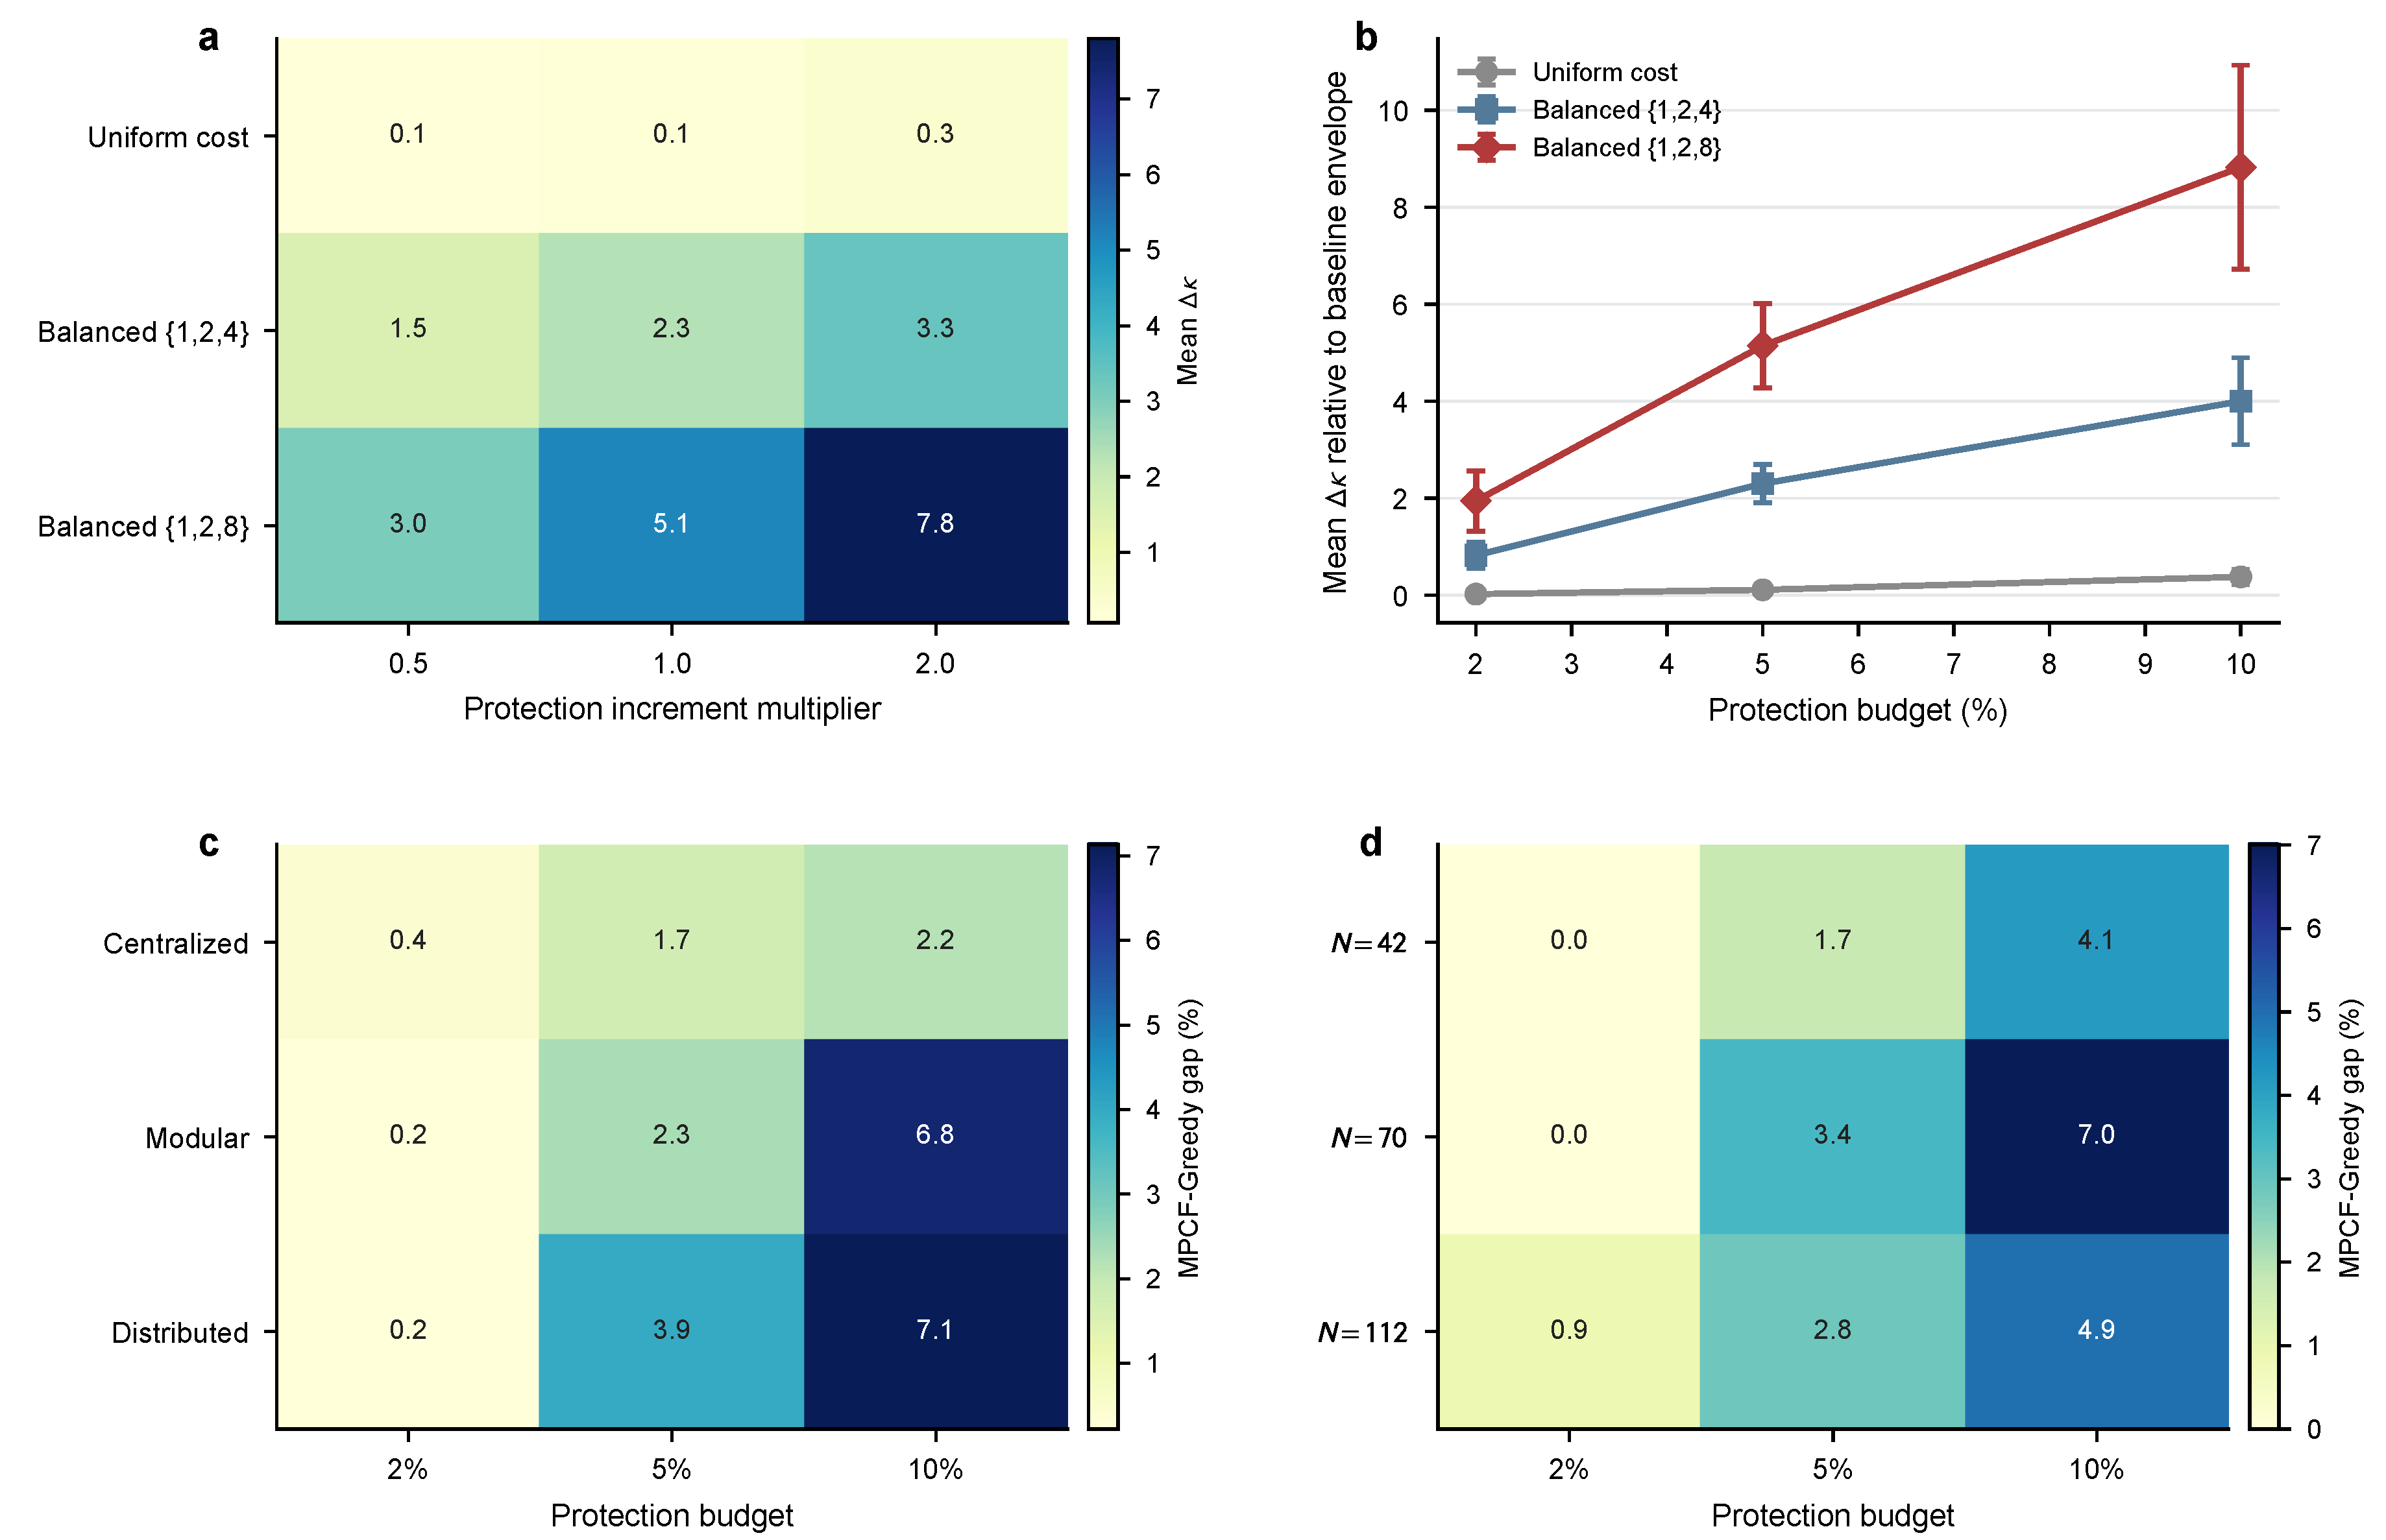
Figure 8.
Relationship between the complete-disconnection objective and the partial-capacity-threshold objective. a, mean minimum interdiction cost of the native outputs of six representative methods at different r. b, differences in between MPCF-Greedy, BPDReference, and Betweenness and MPCF-Exact at equal actual fortification cost, with graph-level bootstrap 95% confidence intervals. c, mean gain of the capacity-oriented representative relative to the budget-saturated MPCF-optimal representative after fixing and actual fortification cost; the counts of wins/ties/losses are annotated above the bars.
Figure 8.
Relationship between the complete-disconnection objective and the partial-capacity-threshold objective. a, mean minimum interdiction cost of the native outputs of six representative methods at different r. b, differences in between MPCF-Greedy, BPDReference, and Betweenness and MPCF-Exact at equal actual fortification cost, with graph-level bootstrap 95% confidence intervals. c, mean gain of the capacity-oriented representative relative to the budget-saturated MPCF-optimal representative after fixing and actual fortification cost; the counts of wins/ties/losses are annotated above the bars.
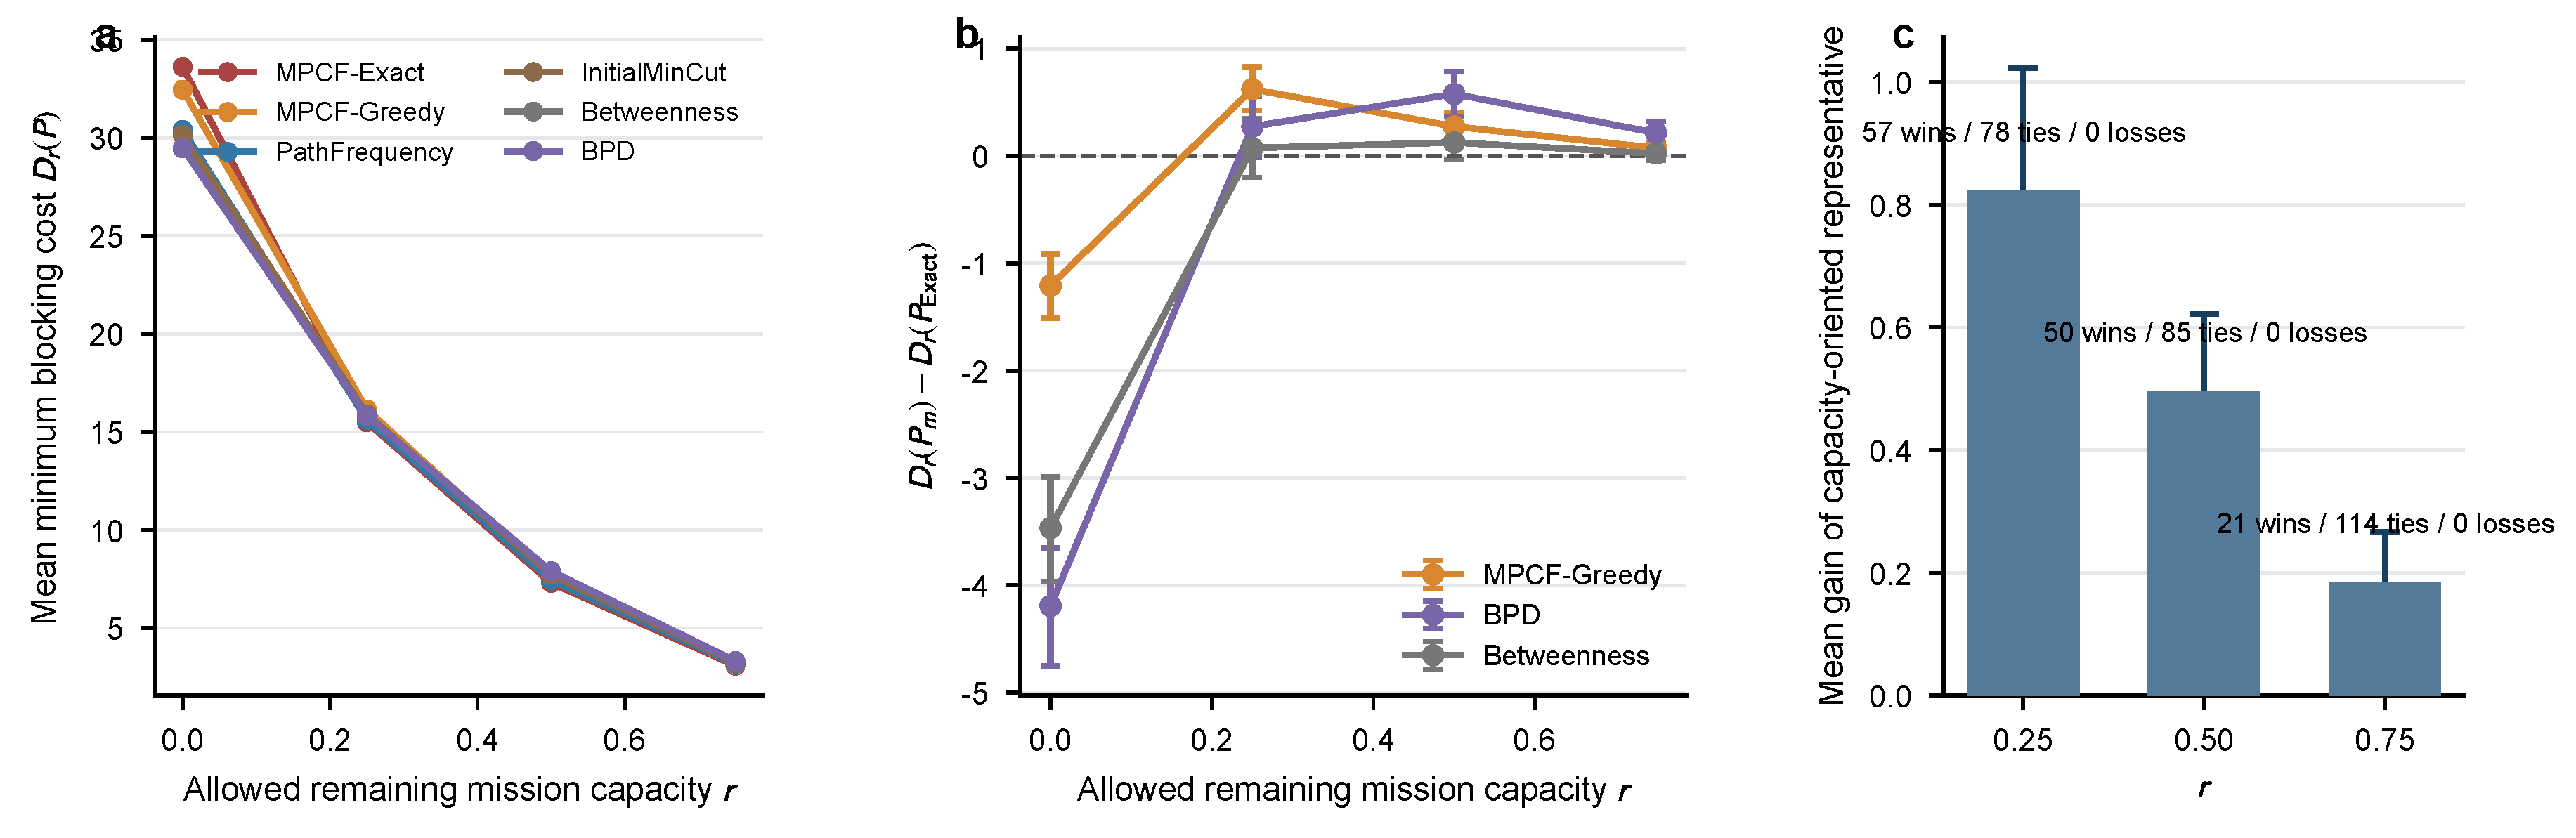
Figure 9.
Validation of public directed mission paths on MBTA GTFS and SNDlib Polska. a, mission-level optimality gaps of PathFrequency relative to MPCF-Exact for 10 missions and three absolute budget levels. b, mean relative gaps of MPCF-Exact and five candidate methods stratified by dataset, with mission-level bootstrap 95% confidence intervals; the zero-gap point of MPCF-Exact provides the global-optimum reference. MPCF-Exact and MPCF-CG have identical MPCF objective values for all 30 mission–budget instances.
Figure 9.
Validation of public directed mission paths on MBTA GTFS and SNDlib Polska. a, mission-level optimality gaps of PathFrequency relative to MPCF-Exact for 10 missions and three absolute budget levels. b, mean relative gaps of MPCF-Exact and five candidate methods stratified by dataset, with mission-level bootstrap 95% confidence intervals; the zero-gap point of MPCF-Exact provides the global-optimum reference. MPCF-Exact and MPCF-CG have identical MPCF objective values for all 30 mission–budget instances.
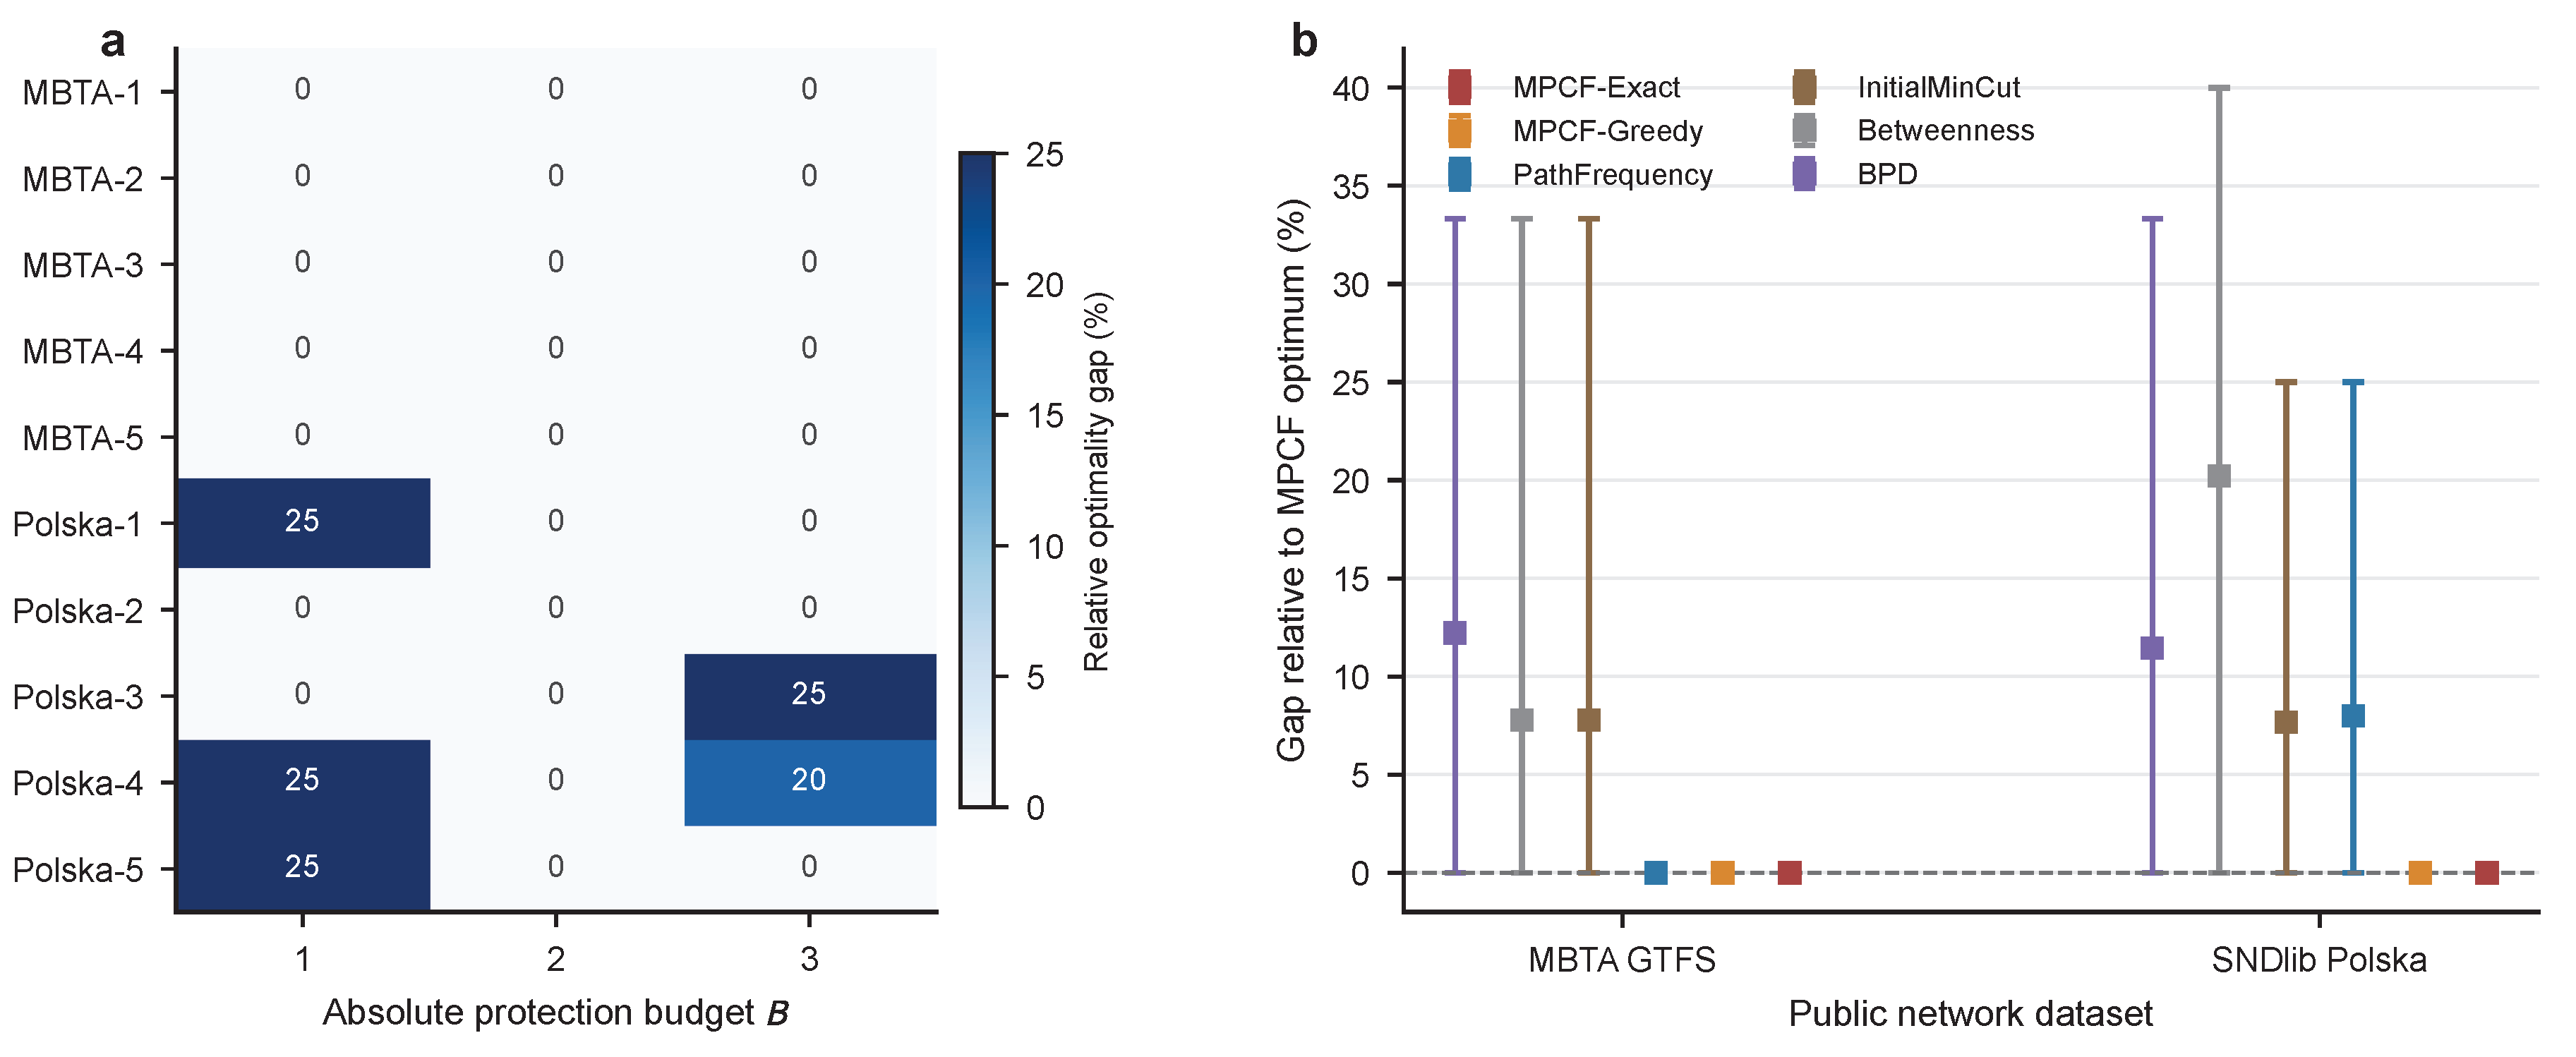
Table 1.
Main solution and global optimality verification procedure for MPCF-Exact.
| Stage | Operation |
|---|---|
| Input | Mission-function graph , mission source–sink node sets , candidate mission-function node set , node parameters , fortification budget B, and tolerances . |
| Output | Optimal fortification set , MPCF optimal value , optimal blocking cut under the fixed solution, and verification record . |
| 1. Input checks | Verify , , and , confirm that at least one valid mission path exists from to , and confirm that every valid path contains a candidate mission-function node. |
| 2. Flow–cut transformation | Split the mission-function nodes according to Section 4.1, set the capacities of candidate internal arcs, high-capacity mission-function relation arcs, and super-source–sink boundary arcs according to Eq. (9), and construct the split network . |
| 3. Joint optimization | Formulate and solve Eq. (10), jointly determine the fortification variables and network flows within the budget-feasible region, and obtain the MPCF objective value , fortification vector , and solver global bound. |
| 4. Canonical representative selection | Add to the feasible region of the MPCF model, minimize , and obtain the minimum implementation cost and representative fortification set . |
| 5. Blocking-response recomputation | Fix , reset the capacities of candidate internal arcs according to , and perform an exact maximum-flow–minimum-cut computation to obtain and . |
| 6. Results summary | Verify budget feasibility, MPCF global-bound closure, and , and write the fortification set, blocking cut, objective value, global bound, optimality gap, solution status, and runtime parameters to the verification record . |
Table 2.
Upper and lower bound closure in the cut-space formulation of MPCF-CG.
| Stage | Operation |
|---|---|
| Input | The same mission-function graph, endpoint sets, candidate mission-function node parameters, and fortification budget as for MPCF-Exact, together with convergence tolerance . |
| Output | Candidate fortification set , global lower bound L, global upper bound U, active node-cut set , and bound-closure status. |
| 1. Initialization | Compute the exact minimum node cut for the unfortified solution, and set , , and . |
| 2. Restricted master problem | Under the budget constraint and all cut constraints corresponding to the current , solve Eq. (11) to obtain the candidate fortification set and the restricted master problem objective value U. |
| 3. Exact separation | Fix and compute the exact minimum node cut to obtain and . If , update L and store the corresponding fortification set. |
| 4. Bound closure | If , output the closed global upper and lower bounds. Otherwise, add the newly obtained to and return to Stage 2. |
Table 3.
Bounded decomposition and exact fallback procedure for the capacity-threshold blocking response.
Table 3.
Bounded decomposition and exact fallback procedure for the capacity-threshold blocking response.
| Step | Operation and bound information |
|---|---|
| 1 | Form an initial feasible blocking solution and upper bound by blocking all positive-capacity candidate mission-function nodes, and set , , and . |
| 2 | Solve the weighted node-cut oracle subproblem exactly at the current . Add newly discovered capacity cuts to , add the corresponding affine dual lines to , and update the valid lower bound using the true oracle value. |
| 3 | Solve the finite cut-covering subproblem exactly over the current capacity-cut set to obtain a candidate mission-function node-blocking set, and perform integer maximum-flow replay on the corresponding mission-function graph. If , recompute the solution cost according to the effective node-blocking cost and update . Tied solutions are selected by stable node numbering. |
| 4 | If , or the recomputed rational node-blocking cost grid shows that no better feasible objective value exists in the interval , output the current capacity blocking response and the upper and lower bound closure result. |
| 5 | If the bounds have not yet closed, solve the one-dimensional restricted master problem over the current affine dual-line set . Its optimal multiplier gives for the next oracle call. The bound information from the restricted master problem is used to continue tightening the current bound interval. |
| 6 | Repeat Steps 2–5, with at most 64 oracle subproblem calls. If the bounds remain open after the preset call limit is reached, solve Eq. (15) with zero relative optimality gap and record the closure mode as exactfallback. |
Table 4.
Deterministic generation procedure for synthetic mission function graphs.
| Stage | Deterministic rule |
|---|---|
| Nodes and attributes | Fixed identifiers are generated in S/C/L/E functional-role order; attribute levels are independently shuffled within each role using the seed-role namespace, after which interdiction and fortification costs are assigned according to the declared cost profiles. |
| Centralized relationships | The nodes on both sides of each adjacent functional-layer interface are shuffled separately, and hub relationships on both sides are constructed from the first nodes; relationships between nodes and the hub on the opposite side are established first, and the prescribed number of directed relationships is then completed according to the shuffled rank sum, maximum rank, and seeded tie-breaking values. |
| Modular relationships | The number of modules is ; nodes in each functional role are shuffled by seed and assigned to modules cyclically, and candidate mission relationships are ranked first by circular module distance and then by seeded tie-breaking values. When the number of nodes is not divisible by the number of modules, the first few cyclic positions naturally receive one additional node. |
| Distributed relationships | The nodes on the left and right of each adjacent functional-layer interface are shuffled by seed separately; cyclic matching with offsets is applied in sequence, and the prescribed number of mission relationships is retained. |
| Mission-chain preservation | Before the algorithms are run, one node is selected from each functional role using an independent seed; for modular instances, the node is selected from module 0. If the corresponding three functional relationships do not yet exist, they replace the candidate relationships at the end of the corresponding interface ranking, ensuring that every instance contains at least one complete mission path while keeping the total number of arcs equal to . |
| Reproducibility rules | Each mission function graph is generated only once, and the generator version, interface arc counts, hub or module information, guaranteed mission chain, and node attributes are saved; ties among nodes and sets are handled uniformly by stable node identifiers. |
Table 5.
Experimental settings and sample sizes.
| Experiment | Mission function graph/size | Budget | Sample size |
|---|---|---|---|
| Main performance | 3 topologies, | 2%, 5%, 10% | 45 graphs, 135 pairs |
| Role-composition sensitivity | Main ratio and 5 controlled ratios, | 2%, 5%, 10% | 270 graphs, 810 pairs (including the main experiment) |
| Small-scale enumeration | Fortification: ; capacity response: | Absolute budgets 1, 2 | 72 fortification instances + 72 capacity-response instances |
| Effective budget | 3 topologies, | 3%, 5%, 10% | 15 graphs, 45 pairs |
| Cost sensitivity | 3 topologies, | 2%, 5%, 10% | 405 conditions |
| Heterogeneous fortification costs | 45 fixed mission function graphs, | 2%, 5%, 10% | 1890 rows |
| Full-candidate cost strategies | 45 fixed mission function graphs, | 2%, 5%, 10% | Same-instance analysis |
| Nested ablation | 45 fixed mission function graphs, 5 algorithmic levels | 2%, 5%, 10% | 675 rows |
| Optimal set families | 3 topologies, | 5%, 10% | 6 complete-enumeration cases |
| Scaling | 2%, 5%, 10% | 9 graphs at each size | |
| Capacity threshold | 2%, 5%, 10% | 21,888 responses | |
| Equal-cost capacity comparison | 45 fixed mission function graphs | 2%, 5%, 10% | 135 pairs |
| Cut competition and candidate domain | Three sizes; near-cut analysis limited to | 2%, 5%, 10% | 135 pairs |
| Public-mission validation | MBTA GTFS, SNDlib Polska | Absolute and proportional budgets | 10 missions, 30 mission–budget instances |
Table 6.
Comparison methods and literature sources. The dynamic, static, and reinsertion suffixes denote different execution modes of the same original method.
Table 6.
Comparison methods and literature sources. The dynamic, static, and reinsertion suffixes denote different execution modes of the same original method.
| Category | Method | Source |
|---|---|---|
| Primary solution method | MPCF-Exact | Sections 4.2 and 4.4 of this paper |
| Exact-solution comparator | MPCF-CG | Section 4.4 of this paper |
| Heuristic comparator | MPCF-Greedy | Equation (16) of this paper |
| Mission-path methods | PathFrequency, InitialMinCut | Mission-aligned baselines constructed in this paper |
| Message passing | BPDReference [15] | Belief-propagation-guided decimation |
| Classical centrality | Degree, Betweenness, k-core, PageRank, Eigenvector [7] | Classical centrality and core decomposition |
| Network dismantling | CI [27], CoreHD [16], Min-Sum [9], GND/GNDR [17], EGND [28], EI [29] | Network dismantling and reinsertion variants |
| Learning-based dismantling | FINDER [18], GDM [19], CoreGDM [30] | Learning-based network dismantling |
| Higher-order/spectral methods | Network Entanglement [31], Vertex Entanglement [32] | Multiscale spectral structure metrics |
Table 7.
Enumeration verification of the objective and mean running time for small-scale fortification problems. , , and denote the MPCF optima obtained by enumeration, MPCF-Exact, and MPCF-CG, respectively.
Table 7.
Enumeration verification of the objective and mean running time for small-scale fortification problems. , , and denote the MPCF optima obtained by enumeration, MPCF-Exact, and MPCF-CG, respectively.
| N | Instances | Maximum |
Maximum |
Enumeration time/s |
MPCF-Exact time/s |
MPCF-CG time/s |
|---|---|---|---|---|---|---|
| 8 | 18 | 0 | 0 | 0.057 | 0.017 | 0.012 |
| 12 | 18 | 0 | 0 | 0.102 | 0.024 | 0.008 |
| 16 | 18 | 0 | 0 | 0.327 | 0.019 | 0.012 |
| 20 | 18 | 0 | 0 | 1.060 | 0.043 | 0.034 |
Table 8.
Running times and global-bound closure in the scaling experiments.
| Size | Budget | MPCF-Exact time/s | MPCF-CG time/s | ||
|---|---|---|---|---|---|
| Median | Maximum | Median | Maximum | ||
| 200 | 2% | 1.08 | 3.35 | 2.64 | 5.57 |
| 200 | 5% | 2.26 | 13.17 | 5.33 | 14.32 |
| 200 | 10% | 3.86 | 321.02 | 16.75 | 133.85 |
| 300 | 2% | 2.98 | 12.51 | 9.07 | 118.44 |
| 300 | 5% | 6.06 | 25.24 | 32.31 | 5724.90 |
| 300 | 10% | 61.96 | 1801.31 | 134.89 | 76744.24 |
Table 9.
Representative results from the main experiment. g denotes the gap relative to the MPCF optimum; boldface indicates the best result in each column.
Table 9.
Representative results from the main experiment. g denotes the gap relative to the MPCF optimum; boldface indicates the best result in each column.
| Category | Method | Mean | Mean g (%) | (%) |
|---|---|---|---|---|
| Joint optimization | MPCF-Exact | 33.622 | 0 | 100.0 |
| Marginal fortification | MPCF-Greedy | 32.459 | 2.76 | 73.3 |
| Mission path | PathFrequency | 30.415 | 9.50 | 28.9 |
| Centrality | Betweenness | 30.230 | 10.54 | 28.1 |
| Network dismantling | GND | 29.741 | 11.18 | 28.1 |
| Learning-based | CoreGDM | 29.889 | 11.37 | 28.1 |
| Message passing | BPDReference | 29.474 | 12.74 | 20.7 |
| Control | NoProtection | 27.378 | 19.29 | 14.1 |
Table 10.
Analysis of zero effective budgets and results for the nonzero-budget subset.
| Sample range | Number of pairs | MPCF-Exact Mean |
No fortification Mean |
Pairwise increase |
MPCF-Greedy g |
PathFrequency g |
|---|---|---|---|---|---|---|
| All fixed instances | 135 | 33.622 | 27.378 | 27.82% | 2.76% | 9.50% |
| Nonzero effective budget | 120 | 35.550 | 28.525 | 31.30% | 3.11% | 10.68% |
Table 11.
Mission-path fortification results under different role compositions. The increase is calculated for each pair relative to the unfortified state; g denotes the mean gap relative to the MPCF optimum.
Table 11.
Mission-path fortification results under different role compositions. The increase is calculated for each pair relative to the unfortified state; g denotes the mean gap relative to the MPCF optimum.
| S:C:L:E | MPCF-Exact mean | Unfortified mean | MPCF-Exact increase | MPCF-Greedy g | Best non-MPCF method and g |
|---|---|---|---|---|---|
| 33.622 | 27.378 | 27.82% | 2.765% | PathFrequency, 9.497% | |
| 31.741 | 25.844 | 29.78% | 2.595% | InitialMinCut, 9.616% | |
| 27.615 | 19.556 | 44.05% | 2.161% | InitialMinCut, 10.124% | |
| 28.193 | 19.933 | 43.07% | 2.191% | PathFrequency, 9.663% | |
| 28.363 | 19.933 | 43.47% | 1.544% | InitialMinCut, 8.742% | |
| 27.615 | 19.044 | 45.97% | 0.622% | InitialMinCut, 8.105% |
Table 14.
Mission construction and core results for the public datasets.
| Dataset | Prespecified missions | Subgraph range | MPCF-Exact–MPCF-CG | Mean gap relative to the global MPCF optimum |
|---|---|---|---|---|
| MBTA GTFS | 5 | 12–132 nodes, 18–134 arcs, 4–8 paths | 15/15 objectives agree | PathFrequency 0; no fortification 14.44% |
| SNDlib Polska | 5 | 10–12 nodes, 14–17 arcs, all with 7 paths | 15/15 objectives agree | PathFrequency 8.00%; no fortification 31.78% |
| Total | 10 | Endpoint-node connectivity for each item | 30/30 objectives agree | Post hoc complete non-MPCF envelope gap is 0 |
Disclaimer/Publisher’s Note: The statements, opinions and data contained in all publications are solely those of the individual author(s) and contributor(s) and not of MDPI and/or the editor(s). MDPI and/or the editor(s) disclaim responsibility for any injury to people or property resulting from any ideas, methods, instructions or products referred to in the content. |
© 2026 by the authors. Licensee MDPI, Basel, Switzerland. This article is an open access article distributed under the terms and conditions of the Creative Commons Attribution (CC BY) license (http://creativecommons.org/licenses/by/4.0/).
Copyright: This open access article is published under a Creative Commons CC BY 4.0 license, which permit the free download, distribution, and reuse, provided that the author and preprint are cited in any reuse.