

Submitted:
06 September 2026
Posted:
08 September 2026
You are already at the latest version
Abstract
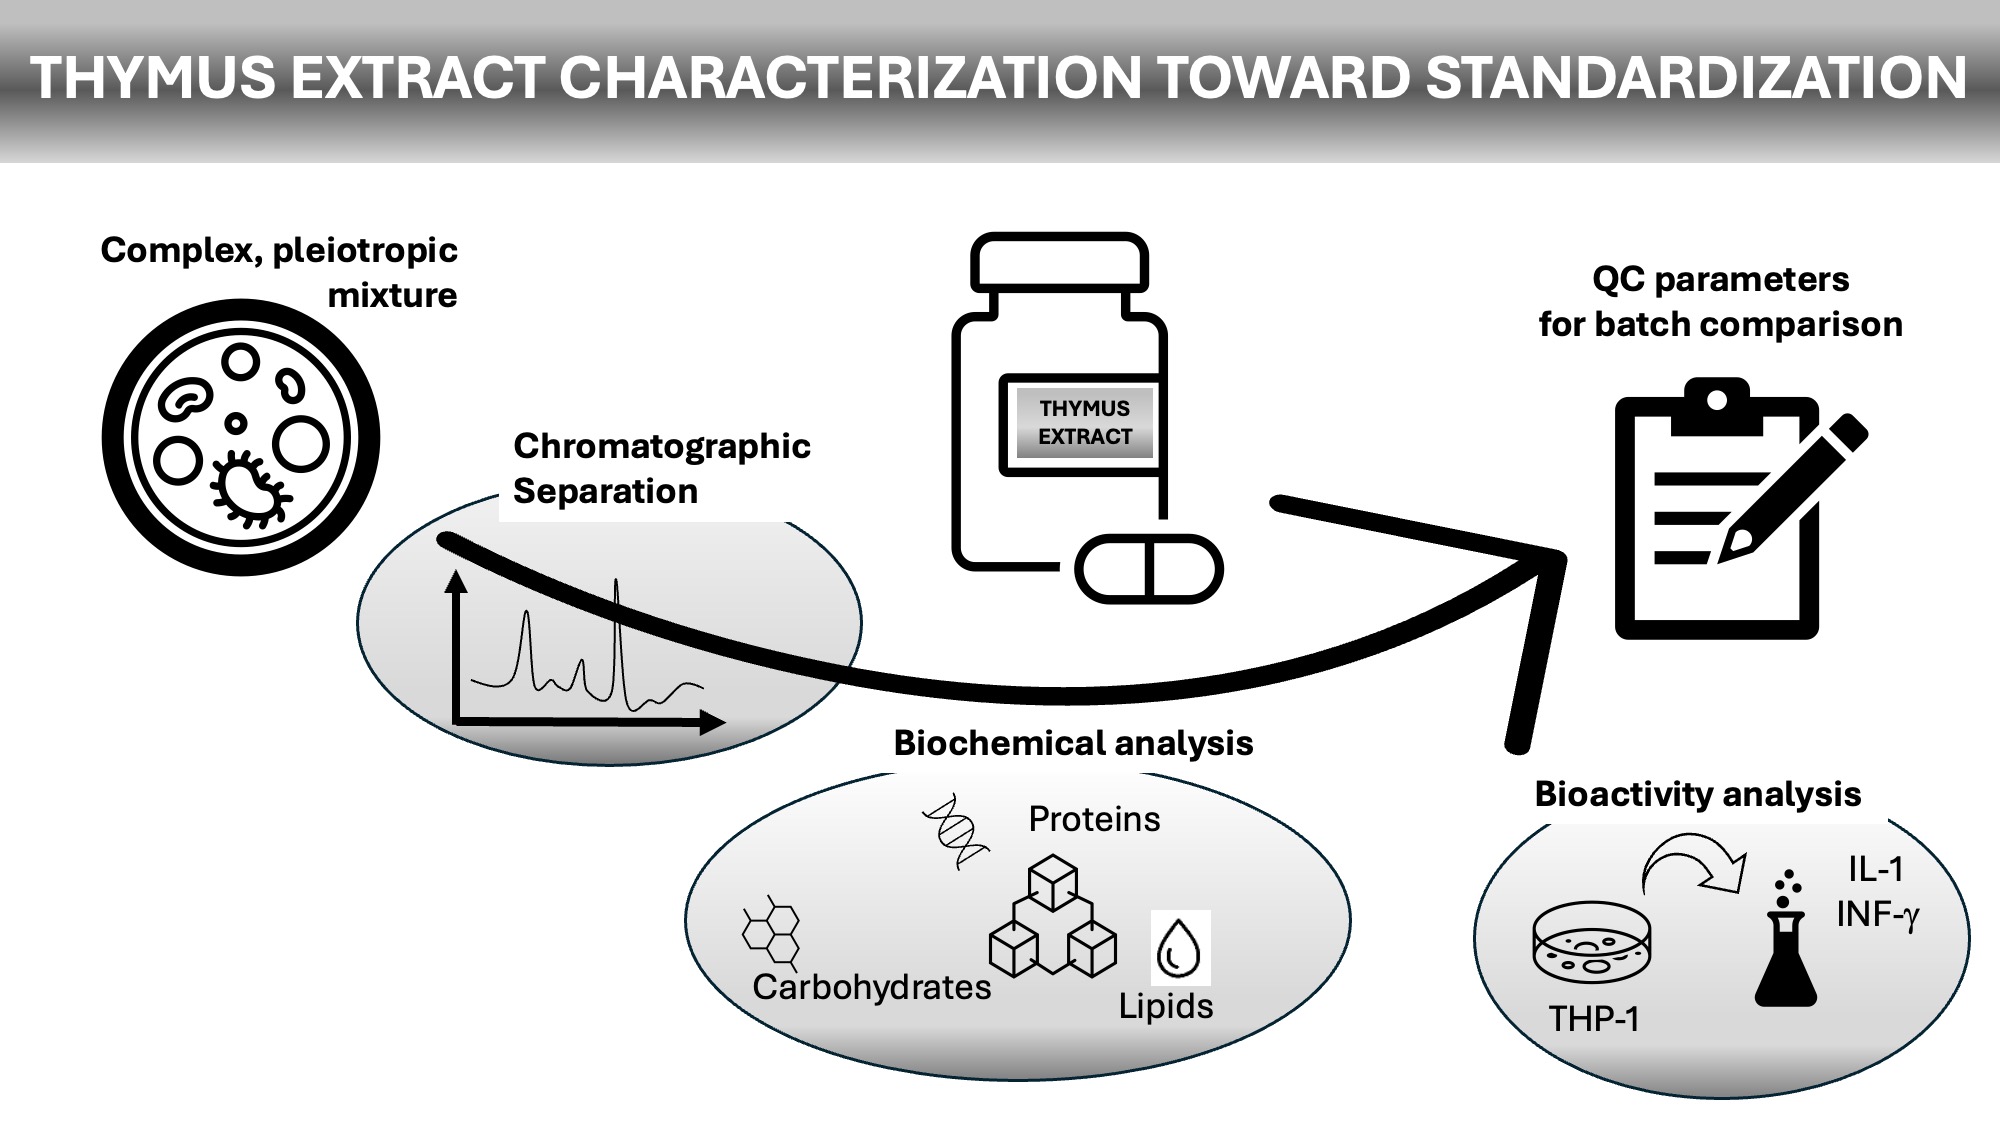
Bovine thymus extracts have attracted medical interest for over 50 years due to their pleiotropic activity. Drug formulations and dietary supplements contain synthetic and natural thymus components. We characterized the biochemical properties of individual bovine thymus extracts and proposed preliminary analytical benchmarks, including water solubility (up to 450 mg/mL) and ~41% protein content, as typical for the tested material. The liquid chromatography profile and SDS-PAGE showed mostly polypeptides with molecular mass < 37 kDa. Using ELISA, we quantified the presence of thymosin β4 as one of the reactive components, while mass spectrometry sequences revealed homologues to additional immunologically active peptides. The cytokine quantification (TNF-α and IL-1β) in the THP-1-derived macrophage model was implemented. The minimum standard for characterization of thymus extract is proposed including its chromatography profile at 215 nm, protein/carbohydrate/lipid composition, and cytokine induction as a form of confirmation of biological activity. These findings support the use of combined physicochemical, chromatographic, and cell-based assays as candidate quality-control tools, although broader batch-to-batch validation, more specific bioactive-marker assays, and microbiological safety testing are still required.
Keywords:
thymus extract
; immunomodulatory compounds
; size exclusion chromatography
; quality control
1. Introduction
The thymic gland is mainly responsible for hemopoiesis, the process of T-cell differentiation, maturation, and selection, being the environment for the development of immunity and tolerance. Peptide hormones secreted by the thymus, like thymosin alpha-1, beta-4, beta-10 (Tα1, Tβ4, Tβ10), thymulin, and thymopoetin, together with cytokines, are involved in the process. The highest thymopoietic activity occurs in the 3rd trimester of pregnancy and in early childhood, with continuous physiological involution of the gland later in life. It is suggested that, as a result, age-related immunosenescence is associated with higher susceptibility to infectious diseases and cancer in the elderly [1].
Thymus extracts gained interest in the early 1980s of the 20th century following the description of their biological activity [2,3]. Numerous studies have been published over the years documenting immunomodulatory properties of those preparations and their use in supportive therapy in different disorders. Primary use in immune deficiencies related to both infectious diseases and immune depression [4,5,6,7] as well as age-related immunity decrease [8,9,10] was further extended to parasitic infestation [11,12], autoimmune diseases, allergies, and cancer [13,14,15].
Different methods of preparation were used to obtain the best biological activity, including aqueous or organic solvent extraction, fractionation, and purification. Depending on the procedures employed, various products were obtained, starting with crude non-purified extracts, through solutions enriched in small proteins and peptides, nucleic acids, or lipid fraction [2,16,17,18].
Several forms of thymus-derived preparations, available currently and in the past (e.g., TFX, Biomodulina T), were formulated as pharmaceutical drugs for intramuscular or subcutaneous route of administration. Also in medical use are thymic hormone pharmaceutical formulations, containing mainly single Tα1, where a synthetic peptide with well-documented properties is an active ingredient (e.g., Zadaxin, Thymalfasin) [19]. In contrast to whole extract formulations, the single-ingredient products are well-defined in terms of composition, production methods, quality specifications, and precise medical applications. There are also many products with crude bovine thymus extract or its derivatives in the form of dietary supplements, under different regulations, making it more accessible (e.g., ThymUvocal, Thymus Factor, Thymomed). Due to the growing interest and rapidly developing supplements sales market, there is currently a wide discussion on the appropriate quality control of the active components [20,21]. In patients’ and doctors’ opinion, it is important and desired to control dietary supplements and develop guidelines for their use, which in consequence could increase the credibility of recommended products [22]. Despite the gaps in regulations in this area, supplement manufacturers implement such actions to fulfil market expectations.
It is a challenging task to standardize methods for animal tissue extract analysis due to the complex characteristics of naturally acquired materials. Depending on the source and manufacturing process used, the composition and properties of the active component may differ. Raw material used in the production process can also introduce an additional aspect of variability. In the case of bovine thymus extracts, this could include the age or clinical status of donor animals. Therefore, it is important to develop methods that allow for comparison and confirmation of biochemical characteristics, which, in the further context, grant a repeatable product of high quality. Thus, we conducted the study to characterize the physicochemical and biochemical properties of a commercially sourced, available bovine thymus extract and to evaluate candidate analytical methods that could be useful and additionally easily implemented for future quality-control standardization.
2. Results
2.1. Physico-Chemical Properties of Thymus Extract
Bovine thymus extract is produced in a tissue processing without the use of alcohol or other solvents. It appears as a yellowish, highly hygroscopic powder, easily soluble in water and PBS. The water solution of 1 mg/mL shows a mean of pH 5.7. The solubility in water and in PBS is similar and reaches 450 mg/mL (solubility limit). The concentrated solution (300 mg/mL) is transparent and presents a yellow colour (Figure 1A), while at low concentration (1 mg/mL) it is colourless. (Figure 1B).
The recorded spectrum of a 1 mg/mL water solution showed intensive absorbance within a wavelength range of 230 – 280 nm (Figure 2A), which is typical for protein-containing material and not surprising for a solution consisting of more than 40% protein. In the absorbance spectrum, there was also a noticeable peak observed at ~360 nm, although with weak intensity.
The analysis of fluorescence within the range of 400 – 750 nm revealed an intense emission maximum at 460 nm when the mixture was excited with light of 360 nm (Figure 2B).
The obtained results show fingerprint characteristics of the bovine thymus extract, which are worth further, more detailed investigation towards specific absorbance and fluorescence biomarkers.
2.2. Protein, Carbohydrate, and Lipid Content of Thymus Extract
Nutritional composition of consumed products, especially protein, carbohydrate, and lipid levels, are considered in standardization guidelines for recommended uptake, including food supplements [23]. These nutrients are present in animal tissue derived food products in various levels, depending on the tissue type, i.e. meat (75% water, 19% protein, 2.5% lipid, 1% carbohydrate, 1.5% non-protein nitrogenous compounds, 1% inorganic matter) [24]. Thus, the analyses of 3 important organic components were performed to characterize the bovine thymus extract. The analysis of dry thymus extract (presenting loss on drying 2.1% within 4 hours at 105°C) was performed to determine composition of individual nutrition that was referred to the dry mass of samples. The summarized data is shown in Table 1.
The Kjeldahl method has been formerly accepted and standardized by regulatory agencies for protein content analysis in food matrices as a reference method [25,25]. It is based on measuring the total nitrogen content, which is used as an indicator of protein quantification in organic material. We used this method to characterize the thymus extract and showed that protein makes up 40.69% of its composition. As a complementary method, the measurement at 280 nm was performed with NanoDrop, returning protein content at 40.16%.
Carbohydrates level is utilized for the characterization of marketed products aimed for human consumption, including wine [26] or cereals [27]. The thymus extract studied in this manuscript thymus extract showed 10.07% of carbohydrate content (reducing sugars) as determined by analysis employing Luff-Schoorl reagent.
Finally, lipid analysis, assessed employing Soxhlet extraction, showed negligible <1% amount in the thymus tissue extract.
2.3. Characterization of the Proteins Present in the Thymus Extract
At first, the thymus extract was analyzed by SDS-PAGE. The tested material consisted mainly of proteins and peptides migrating as molecules with a molecular weight below 37 kDa (Figure 3, lane 2). The major band visible on the Coomassie-stained gel showed a protein smaller than 10 kDa.
Size exclusion chromatography was next used to confirm the composition of the thymus extract. The column was calibrated with a mixture containing standards including protein of known molecular weight (ranging from 1.35 to 670 kDa) and eluting from the column within 40 – 170 mL (Figure 4A, orange chromatogram). The loaded thymus extract consisted of molecules eluting within 40 and 180 mL, similarly to the employed molecular standards of mass below 44 kDa. (Figure 4A, blue chromatogram). The protein nature of the material eluted between 26 and 80 ml was confirmed in the individual fractions on the polyacrylamide gel stained with Coomassie Blue (Figure 4B, lanes 2 – 11). In contrast, fractions eluted between 80 and 128 mL (Figure 4B, lanes 12 – 19) and further up to 200 mL contained molecules migrating out the 15% polyacrylamide gel.
In addition to proteins, there was also a substantial amount of material corresponding to small molecules with a size less than 1.35 kDa (Figure 4A, blue chromatogram). It likely consists of short peptides, amino acids, carbohydrates, and lipids detected in biochemical analyses (Table 1). Moreover, the repeatable pattern was observed for consecutive chromatographic runs (Figure 4C). We have collected the material eluted within 44 – 115 mL and pooled into 4 fractions, namely FR1: 44 – 49 mL, FR2: 50 – 70 mL, FR3: 71 – 97 mL, FR4: 98 – 115 mL (indicated on chromatogram in Figure 4C). FR1 – FR4 contained polypeptides retained on the 20% gel with no distinct protein bands, suggesting complex mixtures of compounds (Figure 4D).
It is important to notice, that chromatographic separation was carried out in native conditions (using PBS as an elution buffer) allowing for the retention of existing aggregates of molecules migrating on the column as larger compounds (Figure 4A, elution volume 38 – 80 mL, corresponding to elution of standard proteins of 670 – 17 kDa), while electrophoresis run in reducing conditions revealed smaller molecules migrating as bands of ~30 – 10 kDa (Figure 4B, lane 4 – 11).
2.4. Biological Activity of the Thymus Extract
We have performed several complementary assays, i.e., Western Blotting, ELISA, and mass spectrometry, to identify and quantify the immune regulatory factors known to be generated by thymus tissue. In addition, the functional assays were also performed to verify the activity of the thymus extract to induce cellular response by quantification of the released cytokines, like TNF-α and IL-1β, in the in vitro assays.
In an attempt to confirm the presence of components with known biological activity in the separated fractions, immunochemical methods were employed for the determination of the most well-known thymic immunomodulators, like thymosins. At least two antibodies for the specific target were tested in Western Blot analysis for Tα1, Tβ4, and Tβ10 level assessment. Unfortunately, we faced difficulties in reliably determining these molecules All attempts returned negative results for the identification of both reference samples, i.e., the commercially acquired, pure thymosins as well as the whole bovine thymus extract. These surprising results were observed, although the reference peptides and the tested antibody were obtained from the same supplier.
We have also tested several commercially available ELISA kits from different vendors targeting thymosin of interest, including Tα1, Tβ4, and Tβ10. With this approach, the conclusive, reliable, and repeatable results were obtained only for β4. However, none of the tests were able to quantify samples of commercially acquired, pure, standard thymosin. The highest level of Tβ4 in the tested samples of bovine thymus extract was found in FR3 with 27.73 ng/mL (+/- 6.23 ng/mL), followed by FR4 with 5.53 ng/mL (+/- 3.79 ng/mL). The original thymus extract solution (10 mg/mL) contained 3.6 ng/mL of Tβ4 as assessed based on the ELISA calibration curve derived from the reference included in the ELISA kit. Several attempts to determine Tα1 and Tβ10 using the commercial ELISA kits of different origins generated no conclusive results.
In the next step, we extended the analysis of the thymus extract to track bioactive components by employing untargeted mass spectrometry. The analysis was weakened by the fact that the analyzed extract originally contained fragmented proteins. Therefore, our strategy was to compare the obtained results with bovine (Table S1) and extend it for mammalian (Table S2) protein databases. In results several species-specific (Bos taurus) proteins with prevalent presence of tissue scaffold elements like collagen, elastin, and keratin, as well as basic metabolism proteins like Perm 1 (PGC-1 and ERR-induced regulator in muscle) or lanosterol synthase were observed. On the other hand, when the results were checked against a wider mammalian database, the hits corresponding to the homologous proteins with immunological activity, namely immunoglobulin heavy (Homo sapiens, Mus musculus) and light (Mus musculus) chains or myeloperoxidase (Mus musculus) were also reported. The sequences corresponding to human dermicidin and collectin-12 homologs, as proteins involved in the innate immune response, were also identified in the tested material. The complete results are included in the Figure S1. Surprisingly, there were no hits corresponding to thymosins with well-known immunomodulatory properties. Thus, the current data supports the presence of a complex protein/peptide mixture, instead of a thymosin-rich composition.
As 1. cell line [28]. The cells treated with varying concentrations (0.1 – 5.0 mg/mL) of thymus extract were analyzed for cytokine secretion, including tumor necrosis factor alpha (TNF-α) and interleukin 1 beta (IL-1β), to confirm immune activation. In three independent experiments, the analyzed thymus extract induced production of TNF-α and IL-1β in a concentration-dependent manner (Figure 5). Highest values obtained for the cells stimulation with 5 mg/mL concentration were 2295.3 +/- 1052.3 and 2237.3 +/- 275.1 pg/mL for TNF-α and IL-1β, respectively. The results also indicated that high concentrations of thymus extract show a stronger positive impact on TNF-α secretion by macrophages derived from THP-1 cells than bacterial LPS (103 EU/mL), which induced, on average 1949.5 +/- 1267.6 pg/mL of this cytokine. In addition, minimal impact on cell viability (8.5% decrease) has been confirmed by MTT assay on the same THP-1 cells treated with the thymus extract at 0.1 – 5.0 mg/mL (Figure S2).
3. Discussion
Bovine thymus extract has attracted medical interest for more than 50 years due to its pleiotropic biological activity and natural origin, making it a promising candidate for diverse clinical applications. While previous studies have extensively investigated its mechanisms of action and biological effects [7,15], further progress requires standardized production methods and robust quality control procedures for active ingredients and final products. Such methods should provide reliable, reproducible, and cost-effective results.
The heterogeneous composition of thymus extracts resulting from different extraction procedures underscores the need for rapid and reliable characterization methods. A major limitation of this study is that only a single source of thymus extract was available, precluding batch-to-batch comparisons. Nevertheless, our analyses confirmed that the extract contained low levels of lipids and carbohydrates and a high protein content, as determined by the Kjeldahl method. In contrast, the Bradford assay, routinely used in our laboratory [29], did not produce reliable results. This likely reflects the assay's dependence on interactions with proteins rich in basic amino acids and its limited sensitivity toward peptides and proteins with molecular masses below 3 kDa. Although electrophoresis demonstrated the presence of proteins in the 10–20 kDa range, the abundance of smaller peptides may have interfered with Bradford measurements. Therefore, protein quantification by NanoDrop spectrophotometry (A280) was evaluated as a simpler alternative. The close agreement between NanoDrop and Kjeldahl results (Table 1) indicates that absorbance-based measurements can be successfully implemented for routine determination of protein content in thymus extracts.
In addition, our data show that size exclusion chromatography fractionation is repeatable (Figure 4C) and therefore can be utilized for batch-to-batch comparison. The elution profile of the sample can be compared with previous results of compatible material as well as with commercial standards to establish a reference for future preparations.
The observed discrepancy in chromatographic and electrophoretic migration of the compounds present in the separated thymus extract might be explained by the methodological conditions, i.e. allowing for native aggregates retention (Figure 4A) or reducing conditions, resulting in dissociation of aggregates into single molecules that migrate on the gel in the form of low molecular weight peptides (Figure 4B). Since the compounds eluted from the column with a volume higher than 80 ml (molecules of molecular mass < 1.35 kDa) were not visible on SDS-PAGE, further investigation is required to determine if these are low molecular size peptides or other type of compounds present in the thymus extract.
Spectroscopy approach, especially absorbance and fluorescence analysis, is a suitable method for characterization of dairy-derived food [30] and food supplement ingredients. It can be considered when tracking the stability of the biological components of thymus tissue preparations, especially by monitoring changes in characteristic absorbance maximum seen at 360 nm (Figure 2A) and fluorescence emission at 460 nm observed under excitation at 360 nm. Since protein-derived material, especially collagen, was identified as the most abundant component of thymus extract (Table S1 and Table S2), it is not surprising to observe the absorbance maximum at 280 nm and characteristic fluorescence emission at ~460 nm (Ex=360 nm) resulting from tryptophan residues [31] like in other animal proteins [32]. However, the observed intensity of the non-tryptophan fluorescence beyond 440 nm visible in the fluorescence spectrum of the thymus extract should be considered for monitoring, like numerous posttranslational protein modifications, including advanced glycation end-products [33] and kynurenine-derived modifications [34,35].
The analysis of the thymus extract also generated significant difficulties in immunochemical analyses used within this study, namely in Western Blot and ELISA. We have tested several antibodies and commercially available ELISAs. The only thymosin that we were able to confirm was Tβ4. Most of the conducted experiments could not detect the presence of other thymosins, like Tα1 and Tβ10 in the thymus extract powder. Therefore, as the immunoassay-based detection of thymosins was not sufficiently validated under the present experimental conditions, it should be interpreted with caution.
The extensive protein fragmentation occurring during the extraction process may eliminate epitopes required for recognition by antibodies used in commercial ELISA kits. Notably, none of the tested assays detected commercially available thymosin reference proteins, regardless of whether they were synthetic or tissue-derived. It therefore remains unclear whether the negative results reflect the absence of target analytes or inadequate antibody recognition. Potential explanations include epitope masking, degradation, or aggregation of the reference peptides. Furthermore, limited information provided by manufacturers hindered the evaluation of assay suitability. These findings highlight the need for improved analytical methods and well-characterized immunochemical tools to enable reliable detection and quantification of thymosins in biological samples and commercial products.
To further characterize the protein composition of the thymus extract, untargeted mass spectrometry was performed as a qualitative, unbiased approach to establish a reference profile for future comparisons with extracts from other sources. The workflow was not optimized for identification of specific proteins, allowing detection of homologous mammalian sequences. However, several factors limited protein identification, including extensive fragmentation during extraction, the presence of abundant structural proteins, and additional fragmentation during sample preparation. Consequently, some identified peptide sequences matched proteins from other species, likely reflecting sequence homology rather than their true presence. The analysis identified proteins related to tissue structure and immune function but did not detect thymic hormones. Although this appears inconsistent with the Tβ4 ELISA results, the mass spectrometry workflow was designed to assess overall protein composition rather than targeted thymosin detection. Future studies should employ targeted mass spectrometry without trypsin digestion and incorporate sample enrichment strategies, such as immunoprecipitation, to improve thymosin identification.
Interestingly, data comparison with the mammalian protein database revealed similarity of peptides within the thymus extract sample with human proteins associated with immune response, i.e., immunoglobulins, dermicidin, and collectin-12. These factors should be considered for standardization of thymus extracts. Our results are in agreement with Muller et al. research, where combined mass spectrometry and sequencing analysis of thymic peptides purified from a dietary supplement showed high similarity of sequences with human histone and collagen proteins [7]. On the other hand, Surzenko et al. confirmed, by ELISA approach, the presence of neuronal and glial antigens in crude thymic extract as well as in cytoplasmic and nuclear fractions of the thymus gland [16] available as a nutritional supplement. Those authors point in the direction of yet another route of biological action of thymic extracts in anti-viral or neuroprotective applications. Although thymic extract and its fractions were studied for years for their protein composition, new methods are still needed to extend our knowledge on the presence of biologically active components [36]. This is of importance in the quality assurance of dietary supplements.
Regardless of the precise identification of the complete protein composition, the biological activity of the thymus extract was also reported in our research. We propose the bioactivity assay to be used in standard quality testing of raw material and finished product. It can be determined by cytokine secretion (TNF-α and IL-1β) using well accepted THP-1-derived macrophage model cells [28] in vitro (Fig. 5) induced by the active components of thymus extract.
Finally, strong considerations should be made on safety issues regarding products dedicated for consumption. Thus, testing of microbial contamination must not be omitted in the QC process. Several parameters can be proposed for the complementary QC pipeline, including endotoxin level, microbial limits, pathogen bioburden, and potentially residual DNA or species authentication.
4. Materials and Methods
4.1. Chemicals
All chemicals, acids, bases or buffers were purchased from Sigma Aldrich (St. Louis, IL, USA) unless otherwise stated.
4.2. Biochemical composition analysis of thymus extract
Protein content of bovine thymus extract (Biofac A/S, Kastrup, Denmark) was determined by the standard Kjeldahl method [37] following the standardized method CLB/PSO/13/2019/v4/04.03.2019.
In addition, an alternative method to determine protein concentration was employed based on absorbance measurements at 280 nm using NanoDrop One (Thermo Fisher Scientific Inc., Waltham, MA, USA).
The content of reducing carbohydrates in thymus extract sample was assessed with Luff-Schorl method [38], following standardized protocol (CLB/PSO/51/2019/v2/04.03.2019).
Lipid content was determined according to standardized procedure CLB/PSO/10/2019/v6/04.03.2019, including hexane extraction carried for up to 5 hours, following the Soxhlet test [39]. Lipid content was calculated as (%) in the initial sample.
All analyses were performed using an external service at the Central Research Laboratory, University of Life Sciences, Lublin, Poland. Detailed procedure is described in Supplementary materials 1.1
4.3. Absorbance and Fluorescence Analyses
The absorbance spectrum of 1 mg/mL thymus extract solution in milliQ water was recorded within a range of 230 – 750 nm wavelength with a 10 nm interval using SpectraMax iD3 (Molecular Devices, San Jose, CA, USA). The same device was used for the analysis of fluorescence properties of the thymus extract solution dissolved in the MilliQ water to a concentration of 1 mg/mL. The fluorescence emission was recorded within 400 – 750 nm with a 10 nm interval upon exposure to the light of 360 nm wavelength. Each analysis was performed twice (n=2).
4.4. SDS Polyacrylamide Gel Electrophoresis (SDS-PAGE)
The protein pattern of thymus extract was assessed using SDS polyacrylamide gel electrophoresis according to the standard Laemmli method [40] described in Supplementary materials 1.2.
4.5. Size Exclusion Chromatography
Aqueous solution of thymus extract was analyzed on HiLoad Superdex 75 16/600 column (Cytiva, Uppsala, Sweden) by loading a 2 mL sample of 50 mg/mL solution in phosphate-buffered saline pH 7.4 as a mobile phase. A flow rate of 1 mL/min was applied during a separation employing the ÄKTA GO system (Cytiva, Marlborough, MA, USA). Absorbance at 215 nm characteristic for molecules containing peptide bonds was recorded to monitor eluted molecules with high sensitivity. The separated mixture was abundant in short peptides, some potentially lacking tryptophan, thus undetectable at 280 nm wavelength.
Gel filtration standard (Bio-Rad Laboratories, Hercules, CA, USA), containing bovine thyroglobulin (670 kDa), bovine γ-globulin (158 kDa), chicken ovalbumin (44 kDa), horse myoglobin (17 kDa), and vitamin B12 (1.35 kDa), was used to estimate the protein mass of the eluted molecules based on the elution volume. The material was recovered by collecting 3.0 mL samples within the range of 40 to 115 mL of elution volume and pooled into 4 fractions (44 – 49 mL – FR1; 50 – 70 mL – FR2; 71 – 97 mL – FR3; 98 – 115 mL – FR4). Next, the pooled fractions were ten-fold concentrated on Centricon Plus-70 Centrifugal Filter, 3 kDa cutoff (Merck KGaA, Darmstadt, Germany) and stored at -20°C until further analysis.
4.6. ELISA for the Determination of Thymosins and Cytokines
The thymosin β4 (Tβ4) level in thymus extract was quantified using an ELISA kit (G-Bioscience, St. Louis, IL, USA). The commercial ELISA for Tβ10, Tα1, pro- Tα1, claimed for human or bovine specificity provided by several vendors (BlueGene, G-Bioscience, Assay Genie/ELISA Genie, CloudClone, MyBioSource, Cusabio) were used in this study.
Cytokine quantification (tumor necrosis factor alpha and interleukin 1 beta) was performed with Quantikine™ ELISA (R&D Systems, Minneapolis, MN, USA). The commercial assays were performed according to the manufacturer's instructions with details described in Supplementary materials 1.3.
4.7. In vitro Bioactivity Assay
Human monocytic THP-1 TIB-202 cell line (American Tissue Culture Collection, Manassas, VA, USA) was used to assess the biological activity of the thymus extract. Cells were cultured in RPMI 1640 medium (PanBiotech GmbH, Aidenbach, Germany) supplemented with 10% heat-inactivated FBS (v/v) (PanBiotech GmbH, Aidenbach, Germany) at 37°C, in 5% CO2 atmosphere. When required, the culture density was assessed. Next, cells were centrifuged at 200 xg, 5 min, room temp. and reconstituted in complete growth medium containing 320 nM PMA (phorbol 12-myristate 13-acetate) (InvivoGen, San Diego, CA, USA). Next, cells were seeded on 6-well plates at a density of 1.4 x 10⁶ cells/well and incubated for 48 h at 37°C, in 5% CO2, to allow differentiation toward macrophages. On the day of the experiment, medium from each well was discarded, and the cells were washed with the culture medium warmed to 37°C. Dilutions of thymus extract in complete growth medium were prepared in concentrations of 0.1, 1.0, and 5.0 mg/mL and applied to macrophage cultures (2.8 mL per well). Lipopolysaccharide (LPS, E. coli 0111:B4) (InvivoGen, San Diego, CA, USA) solution in growth medium (103 EU/mL) was used as the positive control of macrophage stimulation, and complete growth medium as the culture control. Experimental plates containing cells were further incubated for 72 h (37°C, 5% CO2). Finally, the growth medium was collected and centrifuged at 4,600 xg for 15 min to remove cell debris. Supernatant was aliquoted and stored at -80°C for further analysis of TNF-α and IL-1β levels by ELISA.
5. Conclusions
Due to the growing number and variety of dietary supplements available on the market, there is a need to set up control tests to ensure the quality, safety, and consistency of products. As was shown in the presented research, the selection of appropriate analytical methods for raw material analysis is a challenging task, especially for natural, complex matrices such as bovine thymus extract. We have identified a set of candidate analytical and functional assays that may support future quality control of bovine thymus as an active component of dietary supplements. Protein, carbohydrate, and lipid content, together with the elution profile of the material acquired with size exclusion chromatography, may be used as bases. These results can be then supported with spectroscopic (for tryptophan and posttranslational modifications) as well as bioactivity assessment of the preparations based on in vitro cytokine release. However, broader validation across batches and suppliers, together with more specific identification of bioactive constituents will be required before robust standardization criteria can be established. Further experiments are needed to verify batch-to-batch variability and to establish acceptability criteria for quality control methods. New immunochemical tools, i.e., specific antibodies and analytical methods, are warranted for getting more reliable information and better standardization of the results.
Supplementary Materials
The supplementary information can be downloaded at the website of this paper posted on Preprints.org
Author Contributions
AM was responsible for conceptualization, investigation, formal analysis, and writing—original draft preparation; MS was responsible for funding acquisition, conceptualization, methodology, formal analysis, data curation, supervision, writing—review and editing. All authors have read and agreed to the published version of the manuscript.
Funding
This study was supported by funds from the European Union – European Regional Development Fund RPLU.01.02.00-06-0015/20.
Acknowledgments
The authors are grateful to Paulina Sarzyńska, Magdalena Ozga, Aleksandra Antos, and Dariusz Lenart for their excellent technical assistance and help with data acquisition. Agnieszka-Topolska-Woś and Marcin Woś are thanked for their work on method development. Special thanks to dr Agata Malinowska from the Mass Spectrometry Laboratory, Institute of Biochemistry and Biophysics, for her help. The: authors thank Gabriel Staniszewski for linguistic correction.
Conflicts of Interest
Agata Mitura and Magdalena Staniszewska declare previous financial support from Biotarget Sp. z o.o.; Magdalena Staniszewska is the company shareholder.
References
- Palmer, S.; Albergante, L.; Blackburn, C.C.; Newman, T.J. Thymic involution and rising disease incidence with age. Proc. Natl. Acad. Sci. U. S. A. 2018, 115. [Google Scholar] [CrossRef]
- Goldstein, A.L.; Slater, F.D.; White, A. Preparation, assay, and partial purification of a thymic lymphocytopoietic factor (thymosin). Proc. Natl. Acad. Sci. U. S. A. 1966, 56. [Google Scholar] [CrossRef]
- Klein, J.J.; Goldstein, A.L.; White, A. EFFECTS OF THE THYMUS LYMPHOCYTOPOIETIC FACTOR. Ann. N. Y. Acad. Sci. 1966, 135. [Google Scholar] [CrossRef]
- Hymos; Grywalska, E.; Klatka, J.; Klatka, M.; Korona-Głowniak, I.; Roliński, J. Thymicpeptides reverse immune exhaustion in patients with reactivated human alphaherpesvirus1 infections. Int. J. Mol. Sci. 2020, 21. [Google Scholar] [CrossRef]
- Longo, F.; Lepore, L.; Agosti, E.; Panizon, F. Evaluation of the effectiveness of thymomodulin in children affected by recurrent respiratory infections. Pediatr. Medica E Chir. 1988, 10. [Google Scholar]
- Maiorano, V.; Chianese, R.; Fumarulo, R.; Costantino, E.; Contini, M.; Carnimeo, R.; Cazzola, P. Thymomodulin increases the depressed production of superoxide anion by alveolar macrophages in patients with chronic bronchitis. Int. J. Tissue React. 1989, 11. [Google Scholar]
- Müller, H.; Mayer, G.; Behnke, B.; Heimüller, E.; Hamscher, G.; Immler, D.; Siethoff, C.; Meyer, H.E.; Schreiber, M. Enhancing of anti-viral activity against HIV-1 by stimulation of CD8+ T cells with thymic peptides. Clin. Exp. Immunol. 1999, 117. [Google Scholar] [CrossRef]
- Calsini, P.; Mocchegiani, E.; Fabris, N. The pharmacodynamics of thymomodulin in elderly humans. Drugs Exp. Clin. Res. 1985, 11. [Google Scholar]
- Braga, P.C.; Dal Sasso, M.; Maci, S.; Piatti, G.; Palmieri, R.; Bruno, L.; Albanese, C. Restoration of polymorphonuclear leukocyte function in elderly subjects by thymomodulin. J. Chemother. 1994, 6. [Google Scholar] [CrossRef]
- Porzio, G.; Lapenta, M.; Morlando, L.; Russo, P. TIMOMODULINA IN PAZIENTI ANZIANI: COMPORTAMENTO DELL’ATTIVITA’ ANTICORPALE. Eur. Rev. Med. Pharmacol. Sci. 1984, 6. [Google Scholar]
- Iwanow, M. Parasitological appraisal of TFX-thymomodulin effect on the course of intestinal and muscular invasion in mice infected with Trichinella spiralis. Wiad. Parazytol. 1994, 40. [Google Scholar]
- Kociecka, W.; Skrzypińska, K.; Machowska, L. The effect of thymus factor X (TFX Polfa) on the clinical course of human trichinellosis. Wiad. Parazytol. 1989, 35. [Google Scholar]
- Murray, M. 38 - Glandular Therapy. In Textbook of Natural Medicine, Fifth Edition; Elsevier Inc, 2021; pp. 301–306. [Google Scholar]
- Skotnicki, A.B. Therapeutic application of calf thymus extract (TFX). Med. Oncol. Tumor Pharmacother. 1989, 6. [Google Scholar] [CrossRef]
- Meneses, G.; Delgado, M.A.; Perez-Machado, M.A.; Prieto, A.; Alonso, R.; Carrion, F.; Lanzos, E.; Alvarez-Mon, M. Thymostimulin increases natural cytotoxic activity in patients with breast cancer. Int. J. Immunopharmacol. 1997, 19. [Google Scholar] [CrossRef]
- Surzenko, N.; Bastidas, J.; Reid, R.W.; Curaba, J.; Zhang, W.; Bostan, H.; Wilson, M.; Dominique, A.; Roberson, J.; Ignacio, G.; Komarnytsky, S.; Sanders, A.; Lambirth, K.; Brouwer, C.R.; El-Khodor, B.F. Functional recovery following traumatic brain injury in rats is enhanced by oral supplementation with bovine thymus extract. FASEB J. 2024, 38. [Google Scholar] [CrossRef]
- Colic, M.; Popovic, R.; Mrdakovic, D.; Radeta, M.; Novakovic, J.; Pavlovic, B.; Vucevic, D. Evaluation of the immunomodulatory properties of a calf lipid thymus extract and standardization of a method for quantification of its biological activity. Am. J. Immunol. 2007, 3. [Google Scholar] [CrossRef]
- Skotnicki, A.B.; Dabrowska-Bernstein, B.K.; Dabrowski, M.P.; Gorski, A.; Czarnecki, J.; Aleksandrowicz, J. Biological Properties and Clinical Use of Calf Thymus Extract TFX-Polfa. In Thymic Hormones and Lymphokines; 1984. [Google Scholar] [CrossRef]
- Dominari, D.H., III; Pandav, K.; Matos, W.; Biswas, S.; Reddy, G.; Thevuthasan, S.; Khan, M.A.; Mathew, A.; Makkar, S.S.; Zaidi, M.; Fahem, M.M.M.; Beas, R.; Castaneda, V.; Paul, T.; Halpern, J.; Baralt, D. Thymosin alpha 1: A comprehensive review of the literature. World J. Virol. 2020, 9. [Google Scholar] [CrossRef]
- Kuszak, A.J.; Hopp, D.C.; Williamson, J.S.; Betz, J.M.; Sorkin, B.C. Approaches by the US National Institutes of Health to support rigorous scientific research on dietary supplements and natural products. Drug Test. Anal. 2016, 8. [Google Scholar] [CrossRef]
- Garrido, B.C.; Souza, G.H.M.F.; Lourenço, D.C.; Fasciotti, M. Proteomics in quality control: Whey protein-based supplements. J. Proteom. 2016, 147. [Google Scholar] [CrossRef]
- Wagner, S.; Eickmann, S.; Baurecht, H.; Herrmann, A. A cross-sectional study exploring general practitioners’ views on dietary supplements. BMC Prim. Care 2024, 25, 401–408. [Google Scholar] [CrossRef]
- FDA, Food Labeling Guide, Guidance for Industry. 2013.
- Keeton, J.T.; Eddy, S. CHEMICAL AND PHYSICAL CHARACTERISTICS OF MEAT | Chemical Composition. In Encyclopedia of Meat Sciences; 2004. [Google Scholar] [CrossRef]
- Barbano, D.M.; Lynch, J.M. Major advances in testing of dairy products: Milk component and dairy product attribute testing. J. Dairy Sci. 2006, 89. [Google Scholar] [CrossRef]
- Kirchert, S.; Kaiser, R.E.; Morlock, G.E. In-process quality control of wine by planar chromatography versus micro planar chromatography. J. Chromatogr. A 2019, 1588. [Google Scholar] [CrossRef]
- Garro-Mellado, L.; Guerra-Hernández, E.; García-Villanova, B. Sugar Content and Sources in Commercial Infant Cereals in Spain. Children 2022, 9. [Google Scholar] [CrossRef]
- Liu, T.; Huang, T.; Li, J.; Li, A.; Li, C.; Huang, X.; Li, D.; Wang, S.; Liang, M. Optimization of differentiation and transcriptomic profile of THP-1 cells into macrophage by PMA. PLoS ONE 2023, 18. [Google Scholar] [CrossRef]
- Antos; Topolska-Woś, A.; Woś, M.; Mitura, A.; Sarzyńska, P.; Lipiński, T.; Kurylcio, A.; Ziółkowski, P.; Świtalska, M.; Tkaczuk-Włach, J.; Gamian, A.; Polkowski, W.P.; Staniszewska, M. The unique monoclonal antibodies and immunochemical assay for comprehensive determination of the cell-bound and soluble HER2 in different biological samples. Sci. Rep. 2024, 14. [Google Scholar] [CrossRef]
- Liu, X.; Metzger, L.E. Application of fluorescence spectroscopy for monitoring changes in nonfat dry milk during storage. J. Dairy Sci. 2007, 90. [Google Scholar] [CrossRef]
- Karoui, R.; Blecker, C. Fluorescence Spectroscopy Measurement for Quality Assessment of Food Systems-a Review. In Food Bioproc. Tech.; 2011; p. 4. [Google Scholar] [CrossRef]
- Millington, K.R. Anomalous fluorescence of white hair compared to other unpigmented keratin fibres. Int. J. Cosmet. Sci. 2020, 42. [Google Scholar] [CrossRef]
- Gostomska-Pampuch, K.; Wiśniewski, J.R.; Sowiński, K.; Gruszecki, W.I.; Gamian, A.; Staniszewska, M. Analysis of the Site-Specific Myoglobin Modifications in the Melibiose-Derived Novel Advanced Glycation End-Product. Int. J. Mol. Sci. 2022, 23, 13036. [Google Scholar] [CrossRef]
- Staniszewska, M.; Nagaraj, R.H.R.H. Detection of kynurenine modifications in proteins using a monoclonal antibody. J. Immunol. Methods 2007, 324, 63–73. [Google Scholar] [CrossRef]
- Staniszewska, M.M.; Nagaraj, R.H. 3-Hydroxykynurenine-mediated modification of human lens proteins: Structure determination of a major modification using a monoclonal antibody. J. Biol. Chem. 2005, 280. [Google Scholar] [CrossRef]
- Hannappel, E.; Iavarone, F.; Castagnola, M. Thymosin fraction 5 re-evaluated after 35 years by high-resolution mass spectrometry. Expert Opin. Biol. Ther. 2018, 18. [Google Scholar] [CrossRef]
- Sáez-Plaza, P.; Navas, M.J.; Wybraniec, S.; Michałowski, T.; Asuero, A.G. An Overview of the Kjeldahl Method of Nitrogen Determination. Part II. Sample Preparation, Working Scale, Instrumental Finish, and Quality Control. Crit. Rev. Anal. Chem. 2013, 43. [Google Scholar] [CrossRef]
- Asquieri, E.R.; de Moura e Silva, A.G.; Mendes, D. de C.S.; Batista Dias, R. Comparison of titulometric and spectrophotometric approaches towards the determination of total soluble and insoluble carbohydrates in foodstuff. Carpathian J. Food Sci. Technol. 2019, 11. [Google Scholar] [CrossRef]
- Peanparkdee, M.; Iwamoto, S. Bioactive compounds from by-products of rice cultivation and rice processing: Extraction and application in the food and pharmaceutical industries. Trends Food Sci. Technol. 2019, 86. [Google Scholar] [CrossRef]
- Laemmli, U.K. Cleavage of structural proteins during the assembly of the head of bacteriophage T4. Nature 1970, 227, 680–5. [Google Scholar] [CrossRef]
Figure 1.
Solubility and appearance of the bovine thymus extract. The solution in PBS at 300 mg/mL (A) and 1 mg/mL (B) is shown.
Figure 1.
Solubility and appearance of the bovine thymus extract. The solution in PBS at 300 mg/mL (A) and 1 mg/mL (B) is shown.
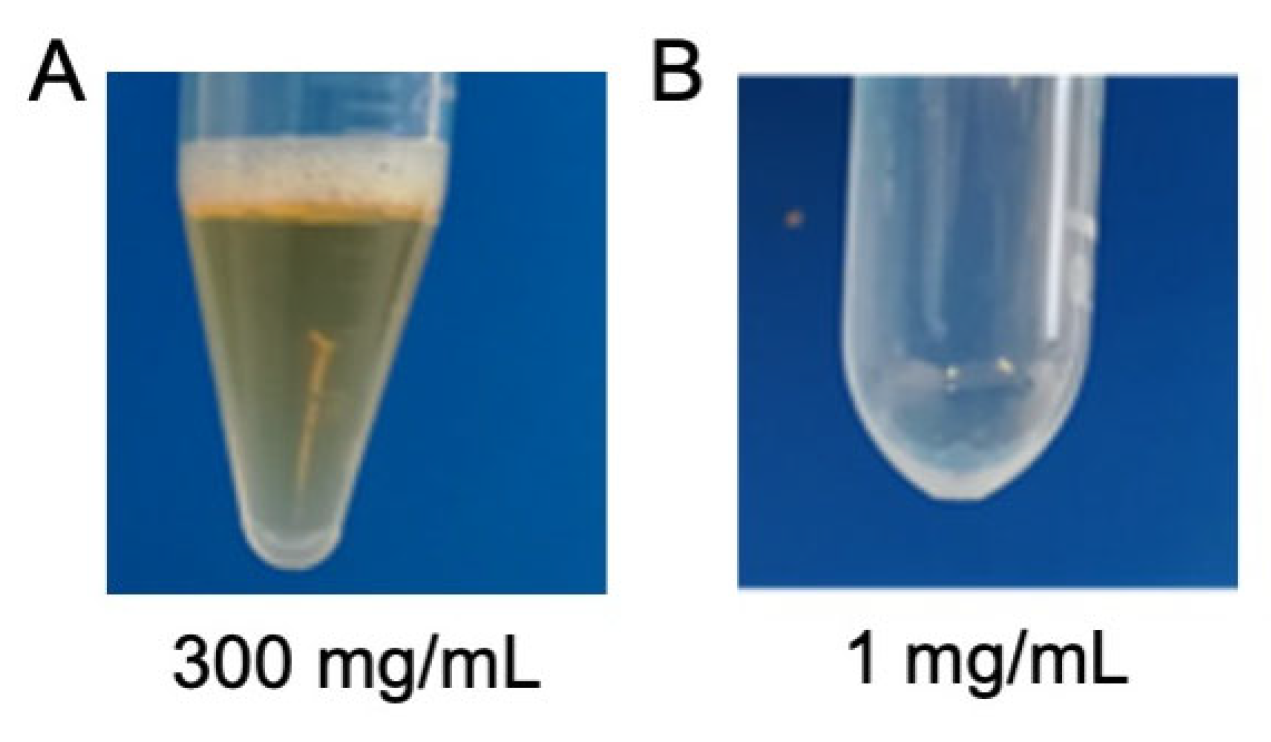
Figure 2.
Spectroscopic analysis of the bovine thymus extract. The water solution at 1 mg/mL concentration was analysed for absorbance within 230 nm – 750 nm (A) and fluorescence emission within 400 – 750 nm at excitation of 360 nm (B).
Figure 2.
Spectroscopic analysis of the bovine thymus extract. The water solution at 1 mg/mL concentration was analysed for absorbance within 230 nm – 750 nm (A) and fluorescence emission within 400 – 750 nm at excitation of 360 nm (B).
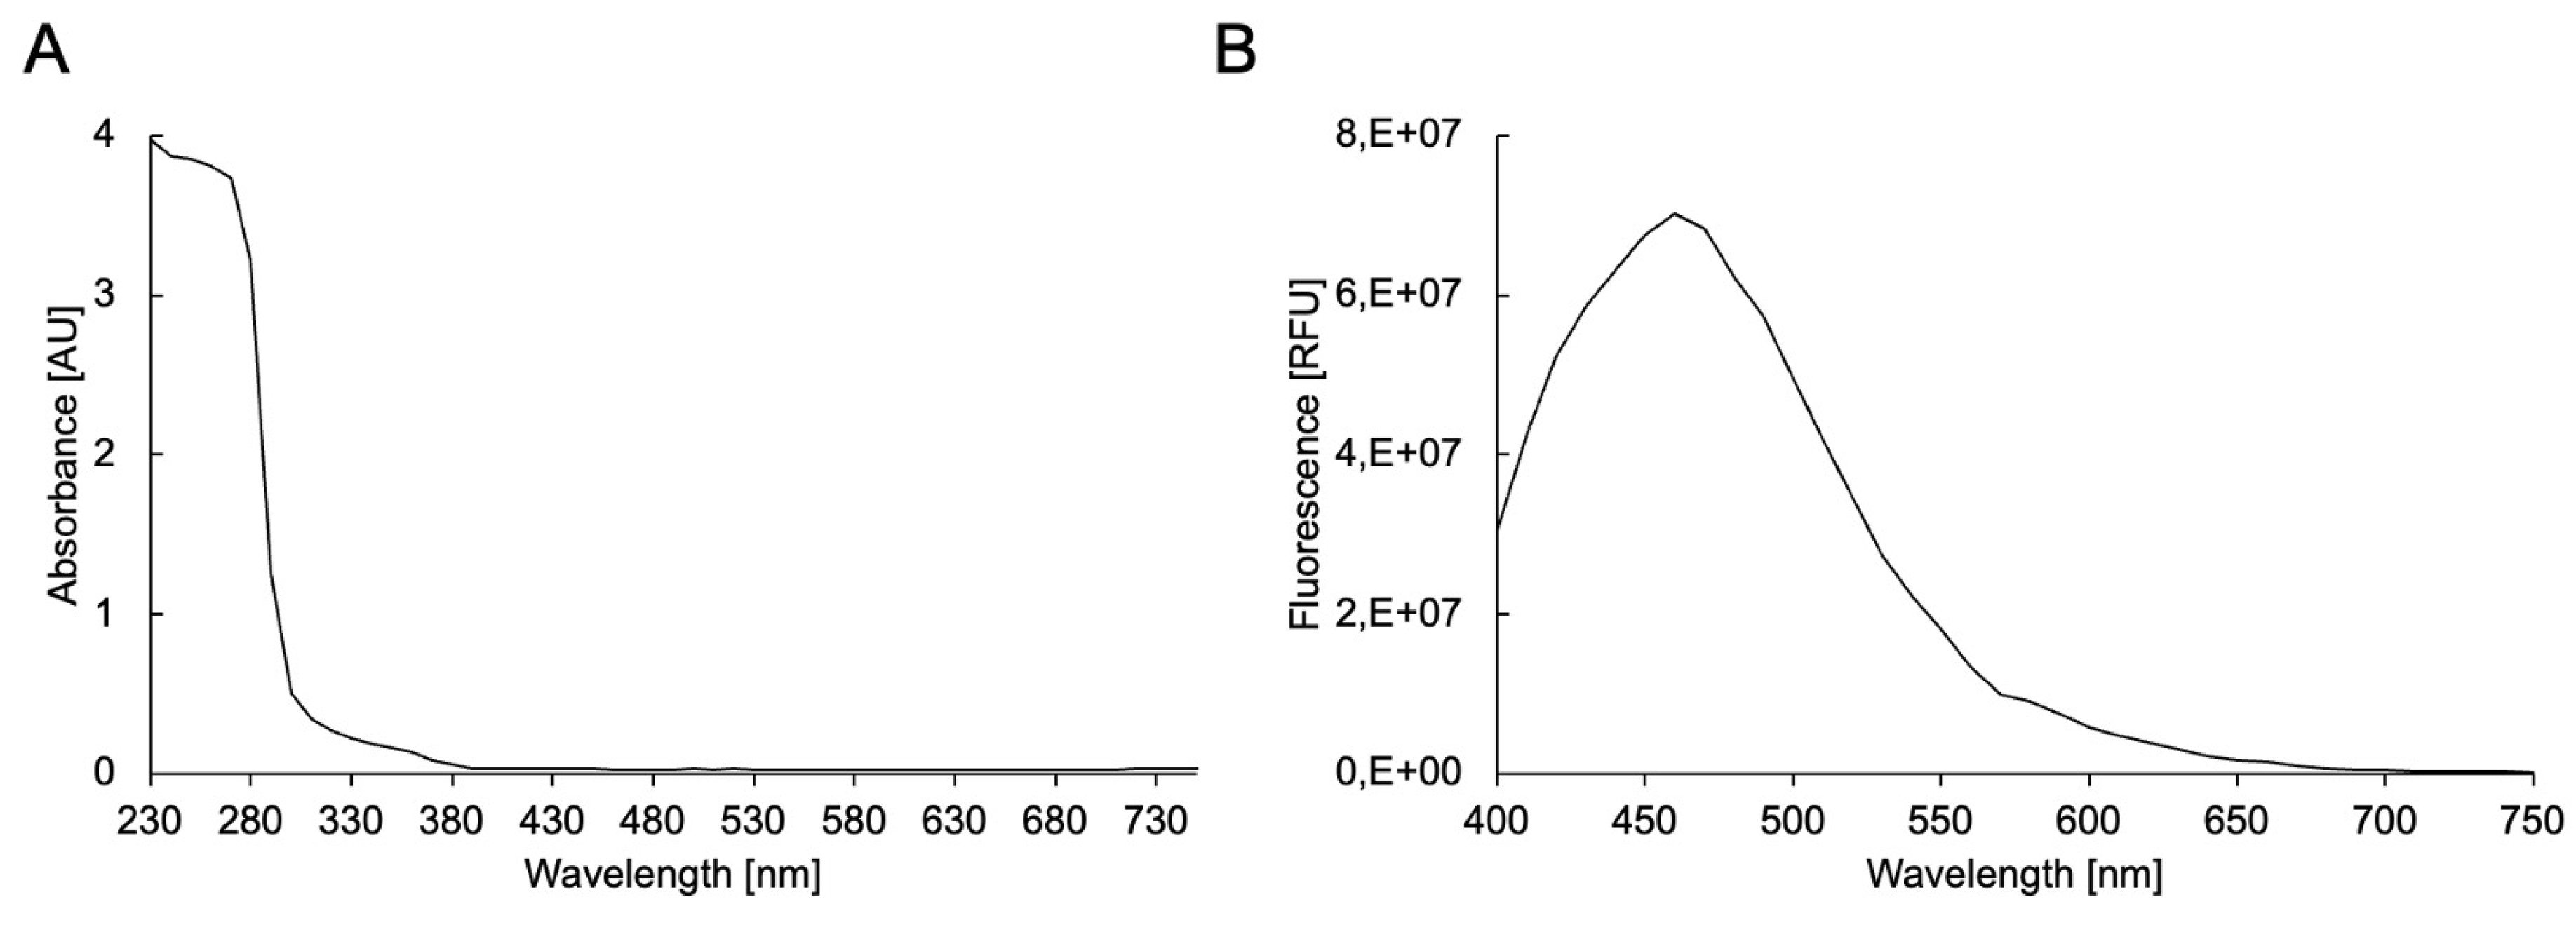
Figure 3.
Electrophoretic analysis of thymus extract. The protein standard (lane 1) was subjected to SDS-PAGE on a 15 % polyacrylamide gel along with 1 mg/mL of the initial thymus extract solution (lane 2). The gel was photographed after stainin g with Coomassie Blue.
Figure 3.
Electrophoretic analysis of thymus extract. The protein standard (lane 1) was subjected to SDS-PAGE on a 15 % polyacrylamide gel along with 1 mg/mL of the initial thymus extract solution (lane 2). The gel was photographed after stainin g with Coomassie Blue.
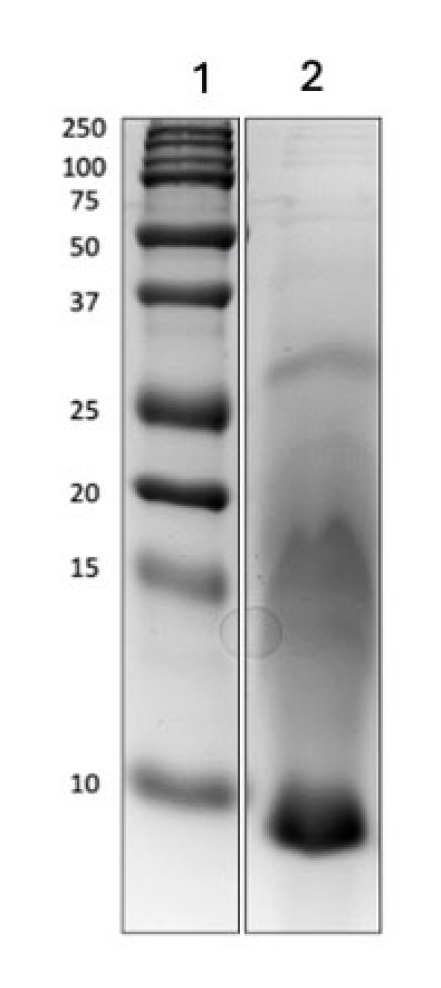
Figure 4.
Chromatographic separation and electrophoretic analysis of thymus extract fractions. The thymus extract solution was loaded on a HiLoad® 6/600 Superdex® 75 pg column calibrated using a mixture of standard compounds with defined molecular mass within 1.35 – 670 kDa (A). The material luted at 26 ml (lane 2), 32 ml (lane 3), 38 ml (lane 4), 44 ml (lane 5), 50 ml (lane 6), 56 ml (lane 7), 62 ml (lane 8), 68 ml (lane 9), 74 ml (lane 10), 80 ml lane 11), 86 ml (lane 12), 92 ml (lane 13), 98 ml (lane 14), 104 ml (lane 15), 110 ml (lane 16), 116 ml (lane 17), 122 ml (l ane 18), and 128 ml (lane 19) was nalysed on 15 % gel along with the molecular mass standard (lane 1) (B). Four independent batches were separated by chromatography and compared or stability of the elution profile (C). The material pooled into fractions FR1 – FR4 (as indicated by dashed lines) was concentrated on Centricon filters nd analysed by SDS-PAGE on 20 % gel (D), lane 1: molecular mass standard; lane 2: FR1; lane 3: FR2; lane 4: FR3; lane 5: FR4;.
Figure 4.
Chromatographic separation and electrophoretic analysis of thymus extract fractions. The thymus extract solution was loaded on a HiLoad® 6/600 Superdex® 75 pg column calibrated using a mixture of standard compounds with defined molecular mass within 1.35 – 670 kDa (A). The material luted at 26 ml (lane 2), 32 ml (lane 3), 38 ml (lane 4), 44 ml (lane 5), 50 ml (lane 6), 56 ml (lane 7), 62 ml (lane 8), 68 ml (lane 9), 74 ml (lane 10), 80 ml lane 11), 86 ml (lane 12), 92 ml (lane 13), 98 ml (lane 14), 104 ml (lane 15), 110 ml (lane 16), 116 ml (lane 17), 122 ml (l ane 18), and 128 ml (lane 19) was nalysed on 15 % gel along with the molecular mass standard (lane 1) (B). Four independent batches were separated by chromatography and compared or stability of the elution profile (C). The material pooled into fractions FR1 – FR4 (as indicated by dashed lines) was concentrated on Centricon filters nd analysed by SDS-PAGE on 20 % gel (D), lane 1: molecular mass standard; lane 2: FR1; lane 3: FR2; lane 4: FR3; lane 5: FR4;.
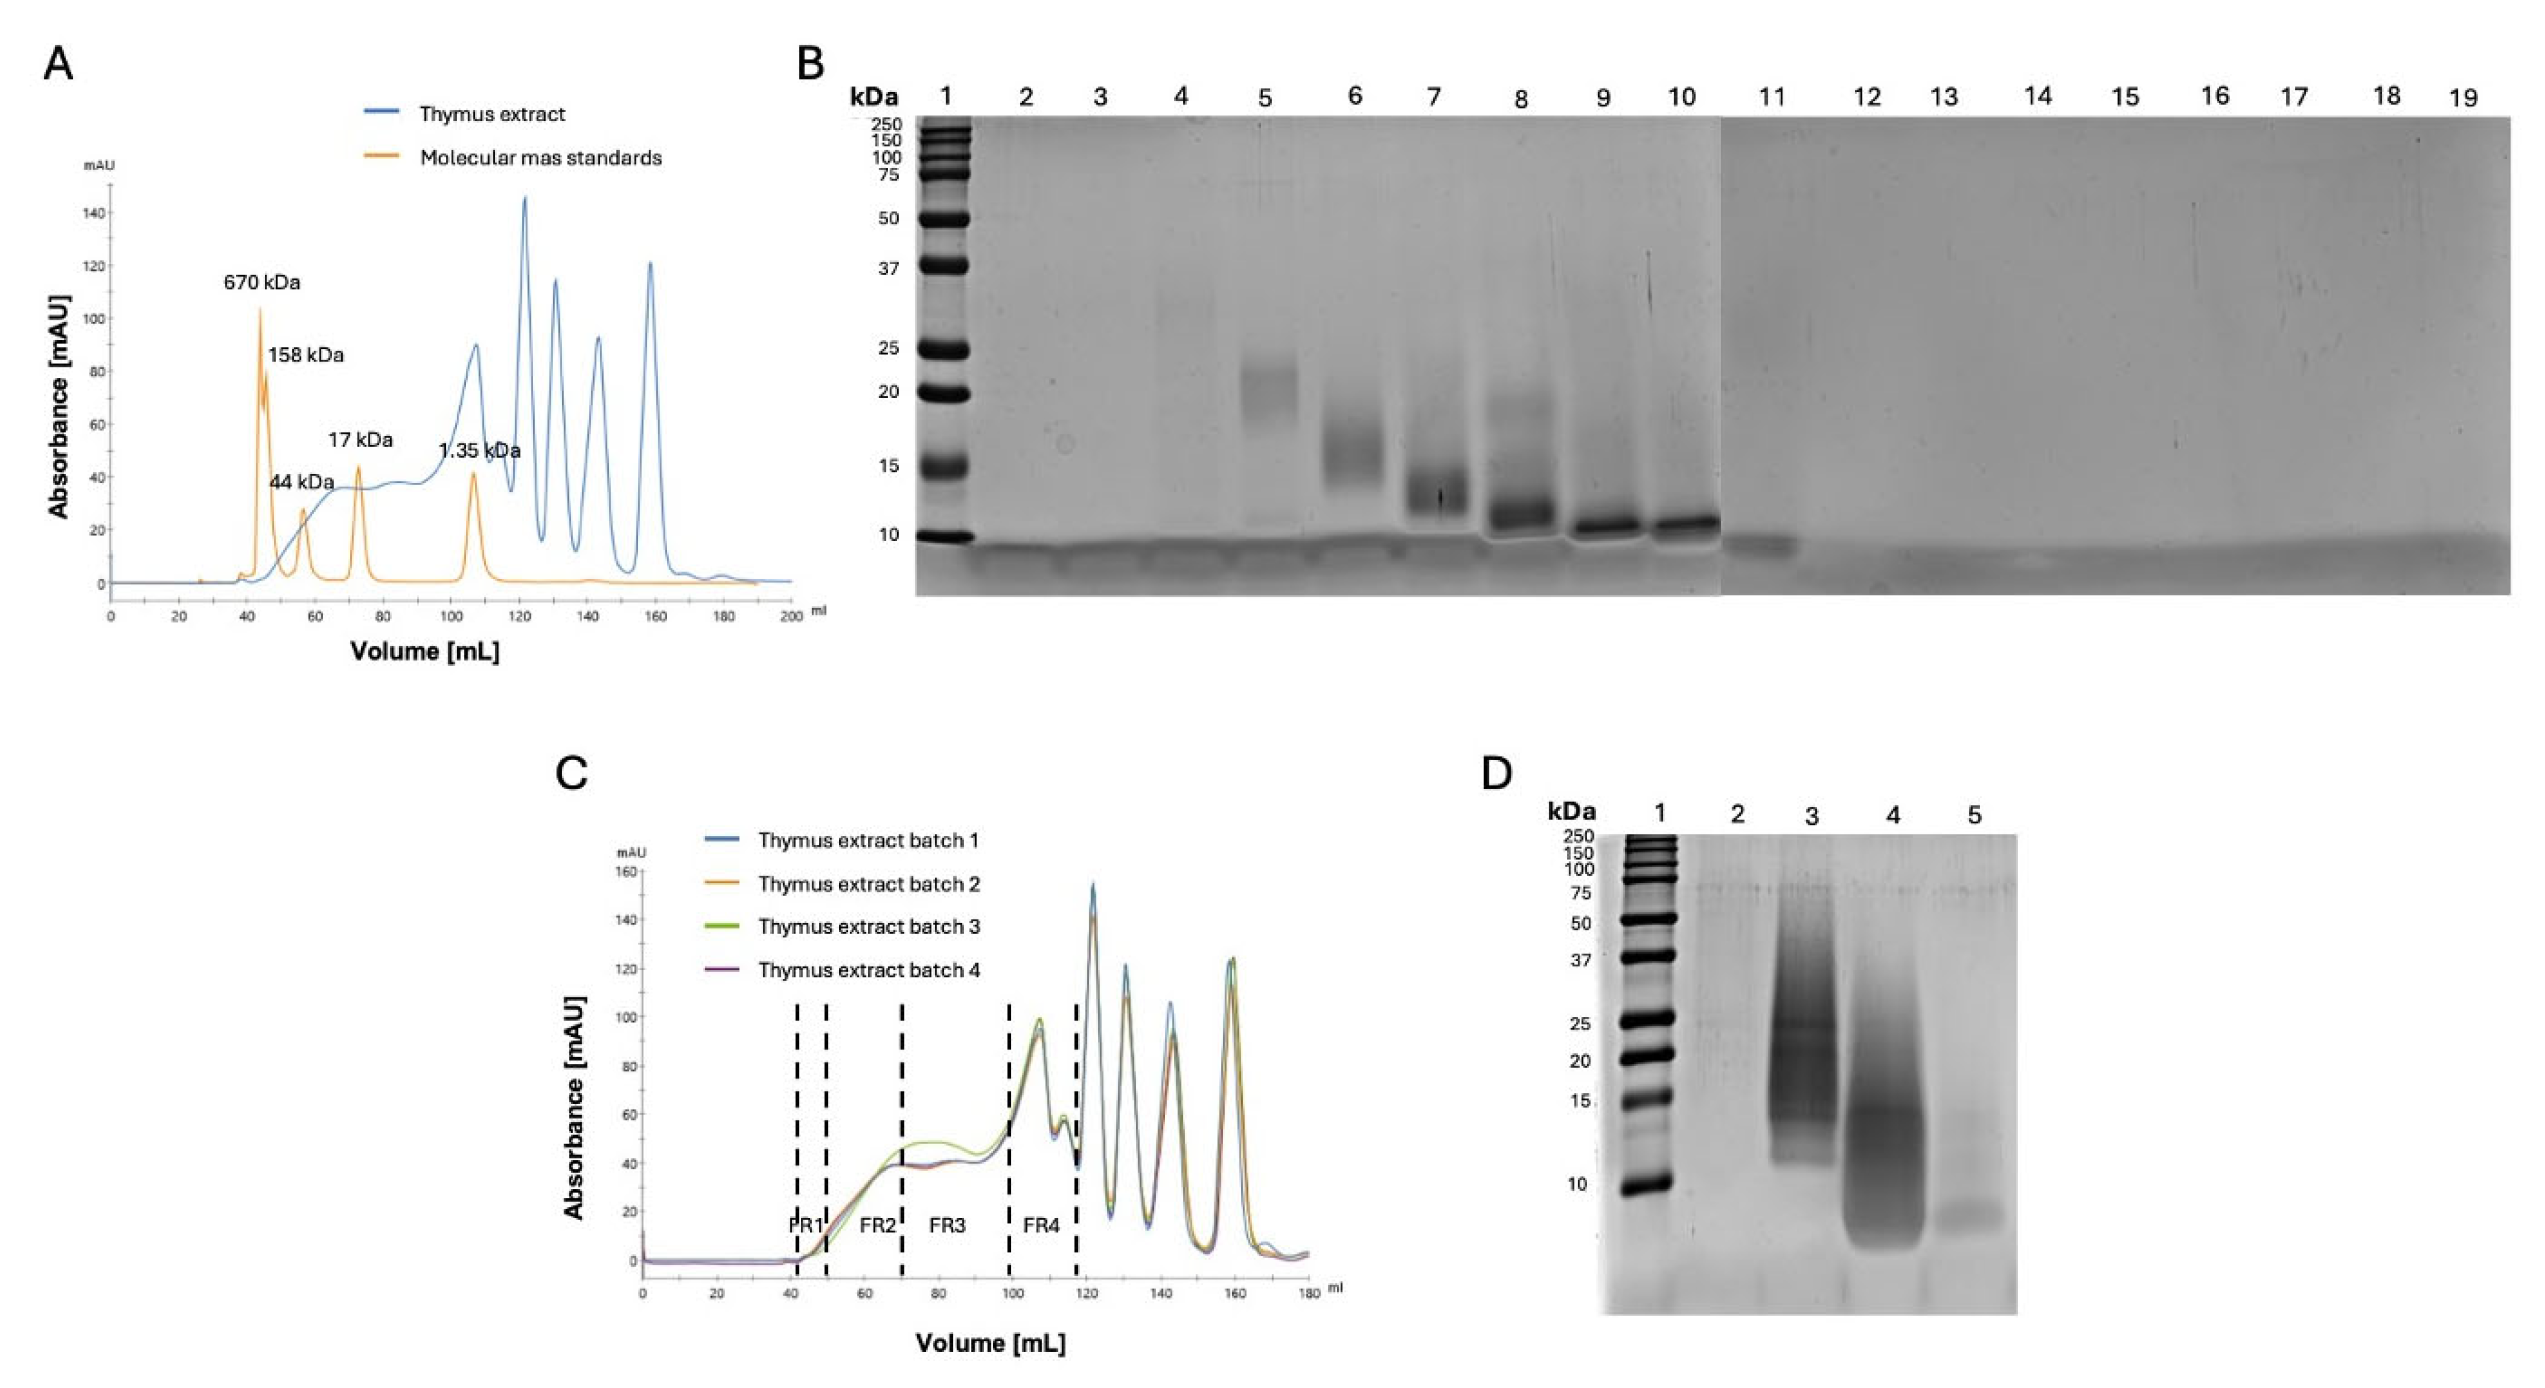
Figure 5.
Effect of thymus extract on the level of TNF-α (A) and IL-1β (B) secreted into culture medium by THP-1-derived macrophages.The cells were incubated for 72 h with different concentrations of thymus extract (0 – 5.0 mg/mL) and compared with cells incubated in the presence of bacterial LPS (103 EU/mL). Two-way ANOVA analysis was performed, **** indicates p<0.0001, * indicates p<0.05, n=6.
Figure 5.
Effect of thymus extract on the level of TNF-α (A) and IL-1β (B) secreted into culture medium by THP-1-derived macrophages.The cells were incubated for 72 h with different concentrations of thymus extract (0 – 5.0 mg/mL) and compared with cells incubated in the presence of bacterial LPS (103 EU/mL). Two-way ANOVA analysis was performed, **** indicates p<0.0001, * indicates p<0.05, n=6.
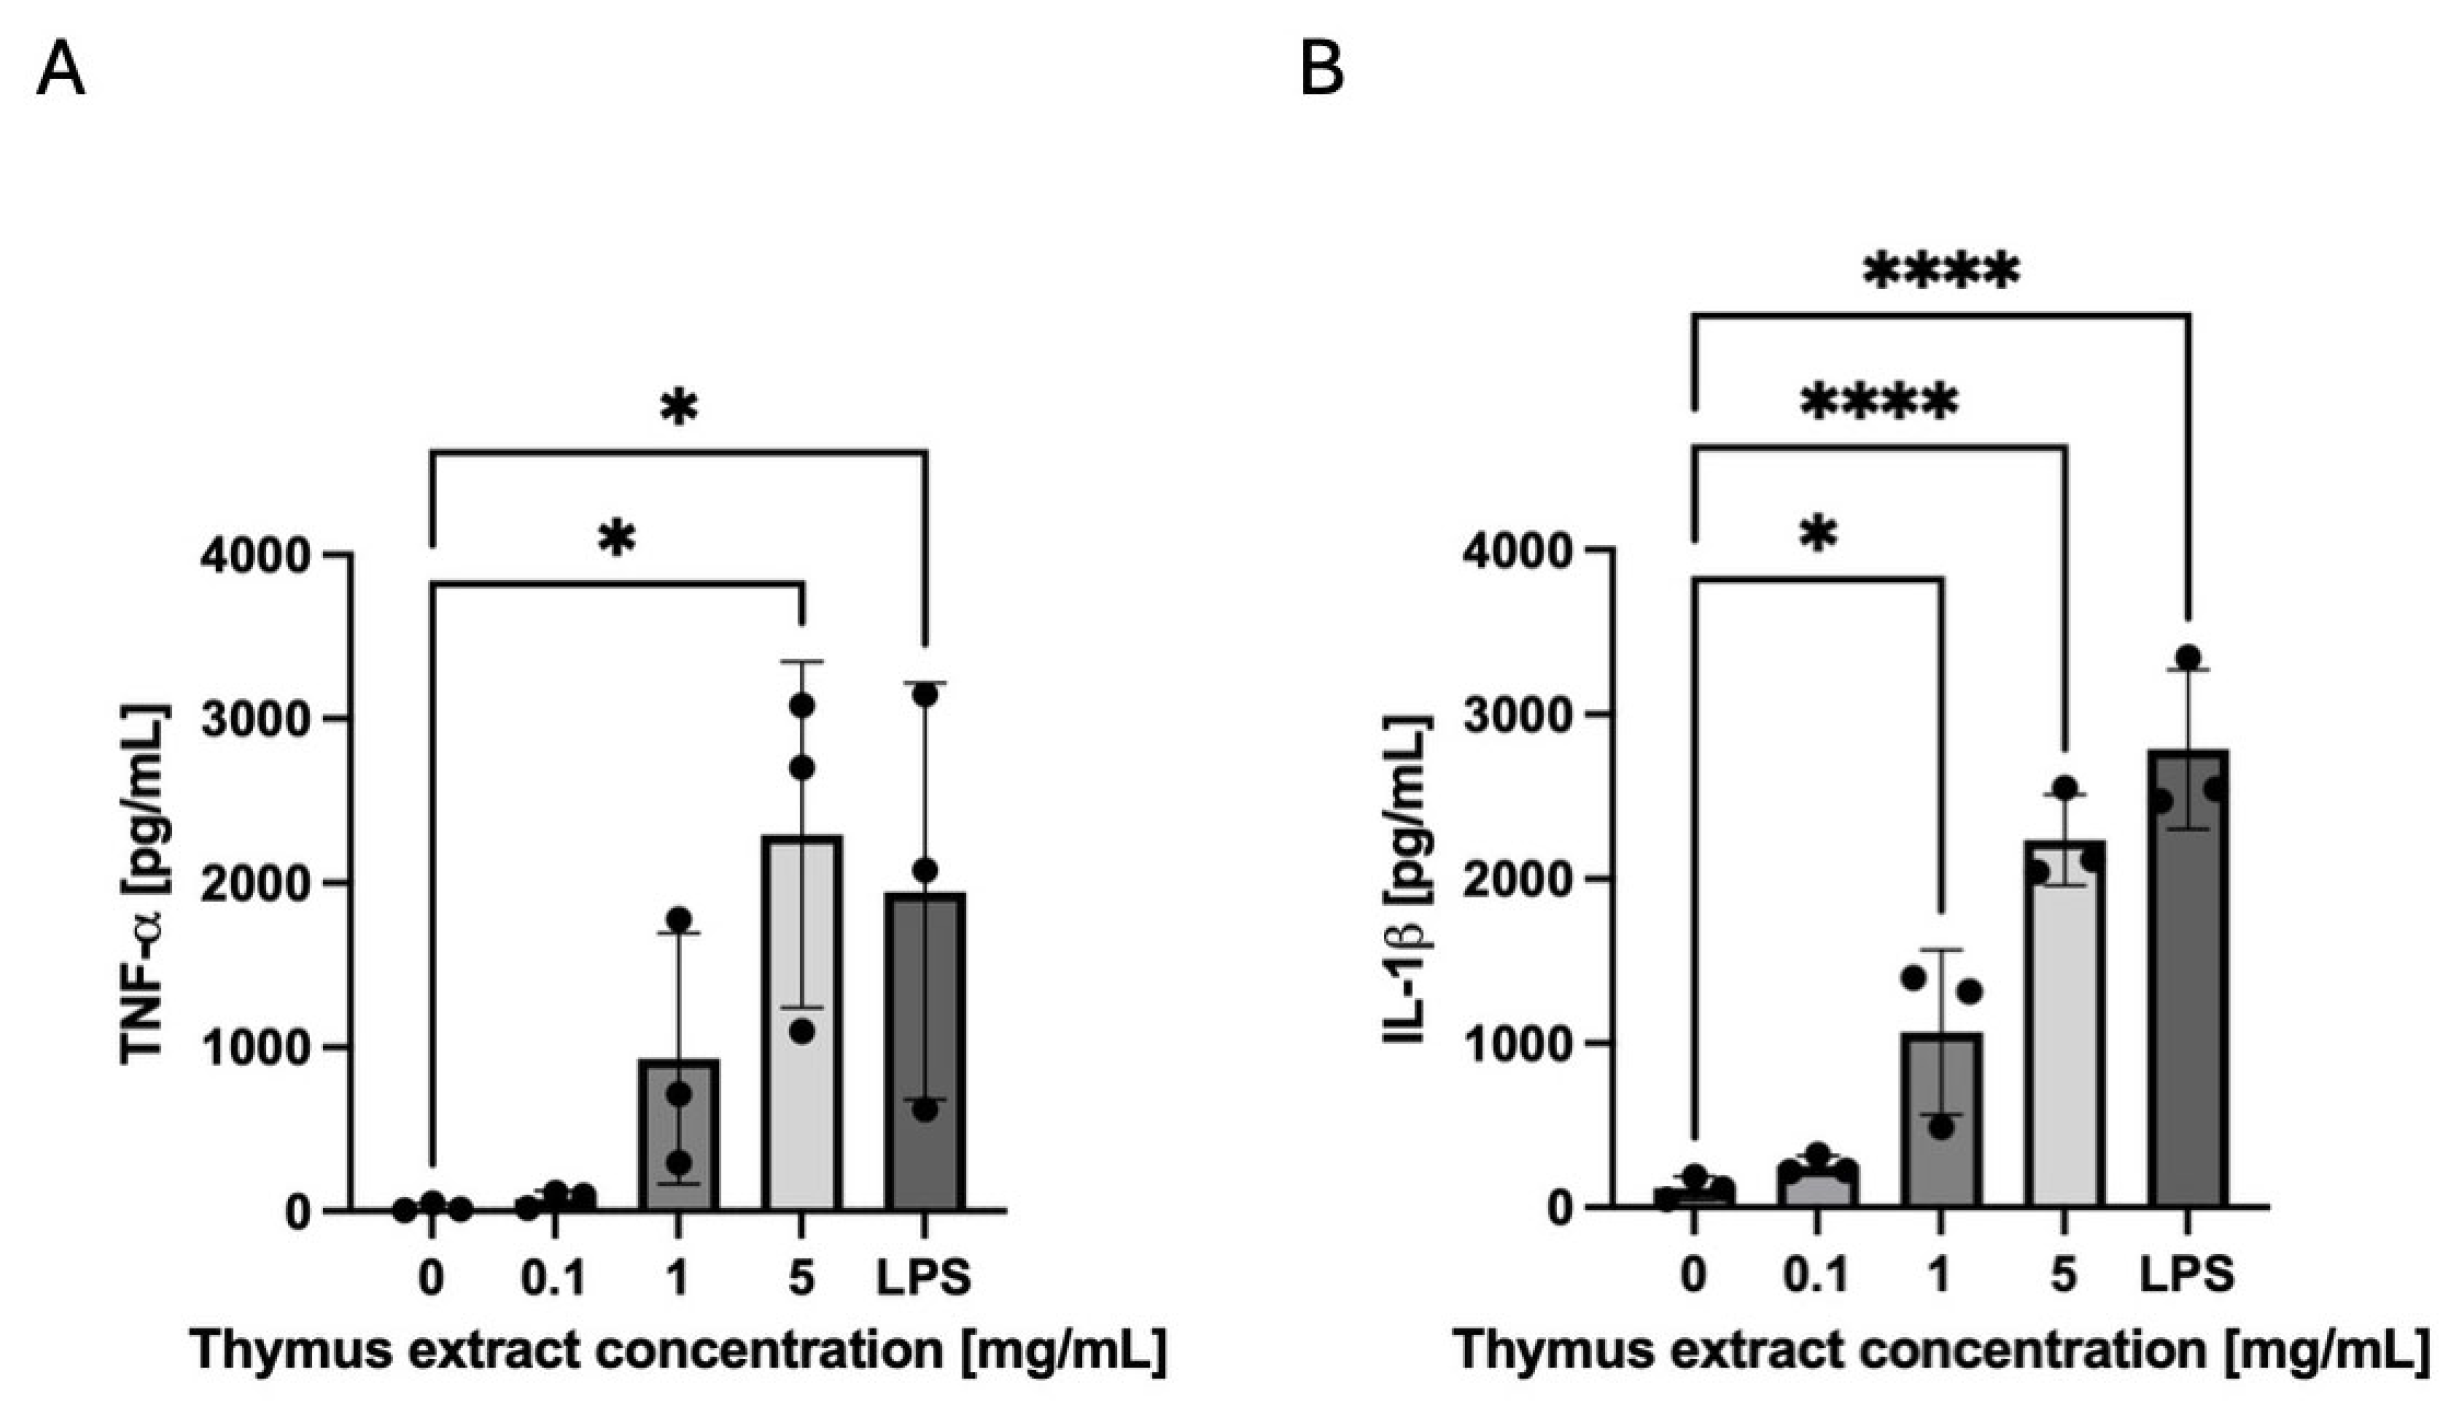

Table 1.
Summary of biochemical parameters.
| Specification (tested parameter) | Result | |
| Appearance | yellowish to light brown powder | |
| pH (1 mg/mL in H2O) | 5.70 (+/- 0.01) | |
| Solubility [mg/mL] | ≤450 | |
| Protein content [%] | Kjeldahl method | 40.69 (+/-0.05) * |
| NanoDrop | 40.16 (+/-0.78) # | |
| Carbohydrates [%] | 10.07 (+/-2.64) # | |
| Lipids [%] | 0.07 (+/-0.07) * | |
*based on 2 measurements; #based on 3 measurements.
Disclaimer/Publisher’s Note: The statements, opinions and data contained in all publications are solely those of the individual author(s) and contributor(s) and not of MDPI and/or the editor(s). MDPI and/or the editor(s) disclaim responsibility for any injury to people or property resulting from any ideas, methods, instructions or products referred to in the content. |
© 2026 by the authors. Licensee MDPI, Basel, Switzerland. This article is an open access article distributed under the terms and conditions of the Creative Commons Attribution (CC BY) license (http://creativecommons.org/licenses/by/4.0/).
Copyright: This open access article is published under a Creative Commons CC BY 4.0 license, which permit the free download, distribution, and reuse, provided that the author and preprint are cited in any reuse.