

Submitted:
07 September 2026
Posted:
07 September 2026
You are already at the latest version
Abstract
Hantaviruses cause haemorrhagic fever with renal syndrome and hantavirus cardiopulmonary syndrome, together responsible for more than 200,000 cases annually, but no specific antiviral therapy is approved. We developed a three-stage computational framework for systematic drug repurposing. Transcriptomic analysis of Hantaan virus-infected human umbilical vein endothelial cells (GEO GSE133751) identified 203 differentially expressed genes dominated by interferon-stimulated genes. A STRING protein–protein interaction network (176 nodes, 3,210 edges) and composite master-regulator centrality score identified 15 hubs, including ISG15, IRF1, CXCL10, STAT1, and DDX58. Open Targets analysis identified six druggable hubs and 12 repurposing candidates in four priority tiers. An ordinary differential equation model of type I interferon signalling then evaluated eight drug perturbations. Early IFN-β achieved the fastest viral clearance (3.5 days) with reduced CXCL10 immunopathology. Early JAK inhibition delayed clearance (4.9 days) and increased CXCL10, an effect that follows from modelling CXCL10 as an IRF1-driven rather than STAT1-driven output. Combining IFN-β with an anti-CXCL10 monoclonal antibody produced the best balance between antiviral efficacy and immunopathology control, although in the present model the antiviral gain of this combination derives entirely from its interferon component. This mechanistically grounded, evidence-ranked framework prioritises candidate therapies and phase-specific combinations for preclinical hantavirus studies.
Keywords:
hantavirus
; drug repurposing
; interferon signalling
; network medicine
; ISG15
; STAT1
; CXCL10
; RIG-I
; JAK inhibitors
; ODE modelling
1. Introduction
Hantaviruses (family Hantaviridae, order Bunyavirales) are enveloped, negative-sense single-stranded RNA viruses with a tripartite genome encoding the nucleocapsid protein (N), glycoproteins (Gn/Gc), and the RNA-dependent RNA polymerase (RdRp) [1]. Transmitted primarily through inhalation of aerosolised excreta from infected rodent reservoirs, they cause two life-threatening clinical syndromes: haemorrhagic fever with renal syndrome (HFRS), prevalent in Europe and Asia and caused principally by Hantaan (HTNV), Seoul, Puumala, and Dobrava viruses; and hantavirus cardiopulmonary syndrome (HCPS), endemic in the Americas and caused by Sin Nombre, Andes, and related viruses [2]. Collectively, these syndromes account for more than 200,000 human cases annually, with case-fatality rates ranging from 1% (HFRS) to 40% (HCPS) [1]. Despite this substantial public-health burden, clinical management remains largely supportive, and no specific antiviral therapy has received regulatory approval [3].
The host innate immune response is the primary determinant of disease outcome. Hantavirus infection triggers robust activation of the type I interferon (IFN-I) pathway through cytosolic pattern-recognition receptors, particularly RIG-I (encoded by DDX58) and MDA5 (encoded by IFIH1), which detect viral RNA and initiate signalling cascades culminating in IFN- secretion and the transcription of hundreds of interferon-stimulated genes (ISGs) [4,5]. Key ISG effectors, among them ISG15, MX1, OAS1, IFIT1, and GBP1, collectively suppress viral replication through ISGylation, GTPase-mediated particle trapping, RNase L activation, translation inhibition, and membrane disruption [6]. Paradoxically, excessive or dysregulated activation of this same pathway, in particular sustained STAT1 phosphorylation and IRF1-driven CXCL10 secretion, contributes to the immunopathology and vascular leakage that characterise severe disease [7,8]. This dual role of the IFN-I axis creates a therapeutic dilemma: interventions that enhance antiviral immunity risk exacerbating immunopathology, while those that suppress inflammation risk impairing viral control.
Network medicine offers a principled framework for navigating this dilemma by identifying the most influential nodes in host–pathogen interaction networks and translating them into prioritised therapeutic targets [9,10]. By integrating transcriptomic data with protein–protein interaction (PPI) networks and druggability databases, it is possible to rank targets by both biological centrality and pharmacological tractability. This approach has been successfully applied to SARS-CoV-2 [9] and other viral infections, but has not been systematically combined with molecular simulation for hantavirus.
Critically, the question of when to intervene is as important as what to target. A recent study demonstrated that JAK inhibitors can facilitate viral propagation when administered during active replication [11], underscoring the need for phase-specific treatment strategies. Ordinary differential equation (ODE) models of signalling cascades provide a tractable framework for exploring such timing-dependent effects in silico before committing to costly animal experiments or clinical trials [12,13].
Here we present a three-stage computational framework: (i) transcriptomic characterisation of the HTNV host response; (ii) PPI network analysis and druggability assessment to identify and prioritise 12 repurposing candidates; and (iii) ODE-based molecular what-if simulations of eight drug perturbation scenarios, providing mechanistic insight into the timing and combination strategies most likely to achieve both antiviral efficacy and immunopathology control.
2. Materials and Methods
2.1. Transcriptomic Data and Differential Expression Analysis
RNA-seq data from HTNV-infected human umbilical vein endothelial cells (HUVECs) were obtained from the Gene Expression Omnibus (GEO accession GSE133751; n = 3 infected and n = 3 mock, 72 h post-infection, MOI = 1) [14]. Raw count matrices were processed using DESeq2 (R/Bioconductor). Genes were considered differentially expressed at two thresholds: (i) a stringent Benjamini–Hochberg adjusted p < 0.05 with |log₂FC| ≥ 1, yielding 10 upregulated and 1 downregulated gene (11 total); and (ii) a nominal p < 0.05 with |log₂FC| ≥ 1, yielding 184 upregulated and 19 downregulated genes (203 total). The nominal threshold was used for network construction and enrichment analysis to capture the broader IFN-I response consistent with the original study [14], which reported 788 DE mRNAs at q < 0.05. The volcano plot (Figure 1) displays −log₁₀(BH-adjusted p-value) on the y-axis. Pathway enrichment analysis was performed using Enrichr [15] against the Reactome and Gene Ontology Biological Process (GO:BP) databases. Complete DESeq2 results for all 203 DEGs are provided in Table S1.
2.2. PPI Network Construction
A protein–protein interaction (PPI) network was constructed by querying the STRING database (v12.0) [16] with all 203 DEGs as seed proteins. Only interactions with a combined confidence score were retained. The resulting network comprised 176 nodes and 3,210 edges (mean degree 36.5; clustering coefficient 0.71). Network topology was computed using the NetworkX Python library (v3.x).
2.3. Network Centrality and Hub Ranking
Three standard centrality metrics were computed for each node: degree centrality (), betweenness centrality (), and closeness centrality (). A composite master-regulator (MR) score was defined as:
where denotes the min–max normalised value of centrality metric for node . Nodes were ranked in descending order of MR score, and the top 15 were designated as hub proteins for downstream druggability analysis.
2.4. Druggability Assessment
Druggability of the top 15 hub proteins was assessed using two complementary approaches. First, each protein was queried against the Open Targets Platform (v24.x) [17] via its GraphQL API, retrieving tractability scores for small-molecule and antibody modalities (range 0–4). Second, a systematic literature search was conducted in PubMed using gene-specific queries combined with terms “drug target”, “inhibitor”, “antiviral”, and “hantavirus”.
2.5. Drug Repurposing Framework
Repurposing candidates were identified by cross-referencing druggable hub proteins with approved and investigational compounds in DrugBank, ChEMBL, and the primary literature. Candidates were stratified into four priority tiers:
- FDA-approved antivirals with direct antiviral mechanism or prior use in viral haemorrhagic fevers.
- FDA-approved immunomodulators targeting hub proteins in the JAK–STAT pathway.
- Investigational agents with direct hantavirus evidence in cell culture or animal models.
- Investigational broad-spectrum antivirals or biologics targeting hub proteins.
2.6. Molecular What-If ODE Model
To assess the molecular consequences of drug interventions on the IFN-I signalling cascade, we developed a phenomenological ODE model comprising six state variables representing key nodes of the pathway:
- : normalised viral load (range 0–1)
- : RIG-I/DDX58 activity
- : IRF1/IRF3 transcription factor activity
- : STAT1 phosphorylation level
- : composite ISG expression (ISG15, MX1, OAS1, IFIT1, GBP1)
- : CXCL10 secretion level
The ODE system is defined as:
Viral replication (Eq. 2) follows logistic growth suppressed by ISG effectors (, representing MX1-like antiviral activity). RIG-I activation (Eq. 3) follows Hill kinetics with coefficient , capturing the cooperative sensing of viral RNA. IRF1 (Eq. 4) is activated by RIG-I and drives both STAT1 phosphorylation (Eq. 5, via the IFN- autocrine loop) and CXCL10 secretion (Eq. 7) directly. STAT1 drives ISG expression (Eq. 6). The JAK inhibitor term reduces STAT1 phosphorylation without affecting the IRF1–CXCL10 axis, consistent with the known pharmacology of baricitinib and ruxolitinib. Because this term is saturating, a value of 0.8 corresponds to a 44% reduction in STAT1 input rather than 80%. Baseline parameter values are listed in Table 1.
Initial conditions were set to (small viral inoculum) and (uninfected host baseline). The system was integrated over 14 days using the Runge–Kutta RK45 method as implemented in SciPy [18] (relative tolerance ).
2.6.1. Drug Perturbation Scenarios
Eight drug scenarios were defined as parameter multipliers applied at either (early intervention) or days (late intervention, representing clinical presentation after symptom onset). For two-phase scenarios, the ODE system was integrated separately over and , with the state vector at serving as the initial condition for the second phase. The eight scenarios are summarised in Table 2.
Outcome metrics computed for each scenario were: (i) peak viral load ; (ii) viral clearance time (first at which ); (iii) peak CXCL10 ; (iv) ISG area under the curve ; and (v) peak STAT1 .
3. Results
3.1. Transcriptomic Landscape of HTNV-Infected Endothelial Cells
Differential expression analysis of GSE133751 identified 11 DEGs at the stringent FDR-corrected threshold (BH-adjusted p < 0.05, |log₂FC| ≥ 1; 10 upregulated, 1 downregulated) and 203 DEGs at the nominal threshold (p < 0.05, |log₂FC| ≥ 1; 184 upregulated, 19 downregulated) in HTNV-infected HUVECs relative to mock-infected controls. The volcano plot (Figure 1) illustrates the distribution of fold changes and statistical significance. The upregulated programme was dominated by ISGs. The strongest signals included CMPK2, CXCL10, CXCL11, MX2, and DDX58/RIG-I (exact log₂FC and FDR in Table S1). The sole FDR-significant downregulated gene was EIF4B, a translation initiation factor, consistent with viral suppression of host cap-dependent translation. Pathway enrichment of the 184 nominally upregulated genes confirmed strong activation of interferon signalling (Reactome, p = 1.3×10⁻⁶³) and defence response to virus (GO:BP, p = 3.8×10⁻⁵⁸), with concurrent enrichment for ribosomal translation among the 19 downregulated genes.
3.2. Active Pathways and Network Architecture
3.2.1. IFN-I Induction Axis
Hantavirus genomic RNA is sensed by the cytosolic helicase RIG-I (DDX58) and, to a lesser extent, MDA5 (IFIH1), both of which are strongly upregulated in infected HUVECs (MR ranks 11 and 23, respectively). Upon RNA binding, RIG-I undergoes conformational activation and signals through the mitochondrial adaptor MAVS, triggering downstream phosphorylation of IRF3 and IRF7 and nuclear translocation of the IRF3 dimer, which drives de novo IFN- transcription [4,5]. The long non-coding RNA NEAT1 has been shown to act as a positive feedback amplifier of this axis in hantavirus-infected cells [5].
3.2.2. JAK–STAT Axis and ISG Effector Layer
Secreted IFN- binds the IFNAR1/IFNAR2 receptor complex and activates JAK1 and TYK2, leading to phosphorylation of STAT1 and STAT2. The phosphorylated STAT1–STAT2–IRF9 heterotrimer (ISGF3) translocates to the nucleus and drives transcription of ISGs through interferon-stimulated response elements (ISREs) [19]. The ISG effector layer identified in our network includes:
- ISG15 (MR rank 1, degree 100): a ubiquitin-like modifier that is conjugated to hundreds of host and viral proteins (ISGylation), broadly suppressing viral replication and modulating immune signalling.
- MX1 (MR rank 7, degree 88): a dynamin-like GTPase that physically traps viral ribonucleoprotein complexes, preventing transcription of the viral genome.
- OAS1 (MR rank 49, degree 82): activates RNase L upon binding double-stranded RNA, leading to degradation of both viral and cellular RNA and triggering apoptosis in infected cells.
- IFIT1 (MR rank 25, degree 82): sequesters viral 5’-triphosphate RNA and inhibits eIF3-dependent translation initiation.
- GBP1 (MR rank 8, degree 84): a guanylate-binding protein that disrupts viral membranes and activates the NLRP3 inflammasome.
- RSAD2/Viperin (MR rank 50, degree 79): remodels lipid droplets and produces the antiviral nucleotide ddhCTP, inhibiting viral RdRp.
3.2.3. Immunopathology Axis
IRF1 (MR rank 2, degree 92) is a transcription factor activated both by RIG-I–MAVS signalling and by STAT1, creating a feed-forward loop that amplifies ISG transcription. Critically, IRF1 also directly drives the expression of CXCL10 (IP-10) and CXCL11, potent chemoattractants for CXCR3-expressing T cells and NK cells [7]. Elevated CXCL10 levels correlate with disease severity in HFRS patients and are thought to contribute to the T-cell-mediated vascular leakage that defines severe disease [7,8]. In our model formulation, CXCL10 production is linked directly to primary RIG-I–IRF1 activation (Equation 7). This design isolates early, transcription-factor-mediated chemokine release triggered directly by viral sensing from downstream interferon feedback. Under this parameterization, JAK inhibition selectively dampens STAT1-dependent ISGs without blunting the upstream IRF1-driven chemokine branch, allowing us to evaluate the specific consequences of uncoupling viral clearance from chemokine induction.
3.2.4. NF-
B Axis
Parallel to the IRF3/IRF7 pathway, MAVS activates TRAF3 and TRAF6, which phosphorylate the IKK complex and release NF-B from its inhibitor IB. Nuclear NF-B drives transcription of pro-inflammatory cytokines (TNF-, IL-6, IL-8) and co-stimulatory molecules, amplifying the inflammatory response. Several NF-B target genes (BIRC3, TNFAIP3, VCAM1, ICAM1) are present in the DEG set, consistent with endothelial activation.
3.2.5. Protein Quality Control Axis
Valosin-containing protein (VCP/p97), an AAA-ATPase involved in endoplasmic-reticulum-associated degradation (ERAD) and autophagy, was recently shown to interact directly with the hantavirus nucleocapsid protein and to be required for efficient viral replication [20]. Although VCP is not among the top-15 MR-ranked hubs (it is not a DEG in the transcriptomic dataset), it represents a mechanistically validated host-dependency factor and is included as a Tier 3 drug target.
The PPI network with hub proteins highlighted is shown in Figure 2. The network displays a densely connected core of ISGs centred on STAT1, IRF1, and ISG15, consistent with the known architecture of the IFN-I regulatory network.
). Node size is proportional to degree centrality. The top 15 hub proteins (highest composite MR score) are highlighted in amber and labelled; rank badges (#1–#15) are shown inside each hub node. Amber-to-brown gradient encodes MR score magnitude. Salmon/steel-blue nodes: secondary proteins (degree ); pale tints: peripheral proteins. Network constructed from STRING v12.0 [16].
3.3. Druggable Hub Proteins
Open Targets tractability analysis identified six of the 15 hub proteins as druggable (score ; Table 3). CXCL10 achieved the highest tractability score (4), reflecting clinical-stage evidence for anti-CXCL10 biologics in inflammatory diseases. STAT1, MX1, GBP1, and DDX58 each scored 2, indicating strong preclinical or early clinical evidence. ISG15 scored 1, reflecting biochemical tractability without advanced clinical validation. OAS1 also scored 1 but ranks 49th by MR score and therefore lies outside the top-15 hub set; it enters the repurposing analysis as an ISG effector rather than as a hub.
3.4. Drug Repurposing Candidates
Cross-referencing druggable hub proteins with approved and investigational compounds yielded 12 repurposing candidates (Table 4). The drug–target interaction network (Figure 3) and heatmap (Figure 4) visualise the coverage of hub proteins by each candidate. The bipartite network comprised 23 nodes (12 drugs + 11 targeted hub proteins) and 35 edges (density 0.27). IRF1 was the most targeted hub (9/12 drugs), reflecting its central position downstream of both RIG-I and IFN- signalling. STAT1 was targeted by six agents. Direct-acting antivirals (remdesivir, favipiravir) inhibit the viral RdRp; in these network mappings (Figure 3), they are connected to DDX58 and IRF1 to represent their indirect functional attenuation of viral RNA-mediated pattern recognition receptor sensing.
Tier 1 – FDA-Approved Antivirals. Ribavirin is a nucleoside analogue with broad-spectrum antiviral activity used off-label for HFRS and HCPS [21]. Remdesivir has demonstrated inhibitory activity against Sin Nombre and Puumala hantaviruses in primary human endothelial cells [22]. Favipiravir synergises with ribavirin in reducing Hantaan virus titres in cell culture [23]. Interferon- and interferon- potently induce ISG expression and have shown anti-hantaviral activity in combination with ribavirin [21,24].
Tier 2 – FDA-Approved Immunomodulators. JAK1/JAK2 inhibitors baricitinib and ruxolitinib, and the JAK1/JAK3 inhibitor tofacitinib, suppress STAT1 phosphorylation and downstream ISG transcription [25]. Their rationale for use in hantavirus infection is to attenuate the excessive interferon-driven immunopathology that contributes to vascular leakage in severe disease. However, their use carries a critical caveat: JAK inhibitors can facilitate viral propagation if administered during the early replication phase [11].
Tier 3 – Investigational, Hantavirus-Specific. CB-5083 is a first-in-class inhibitor of VCP/p97 that reduced hantavirus titres by in cell culture [20], establishing VCP as a validated host-directed antiviral target.
Tier 4 – Investigational, Broad-Spectrum. SB9200 and RGT100 are small-molecule RIG-I agonists that reached early clinical testing. Development of SB9200 (inarigivir soproxil) was halted after hepatotoxicity and a patient death in a Phase 2b chronic hepatitis B trial, so it is retained here as a mechanistic exemplar of RIG-I agonism rather than as a near-term clinical candidate. An anti-CXCL10 monoclonal antibody in preclinical/Phase 1 development targets the immunopathology axis directly [7].
3.5. Molecular What-If Analysis
The ODE model was integrated over 14 days for all eight drug scenarios and the drug-free baseline. Figure 5 shows the time courses of viral load (), ISG composite (, normalised), CXCL10 (, normalised), and STAT1 (, normalised) for each scenario. Summary metrics are reported in Table 5.
Early IFN-(S1) achieves the fastest viral clearance. Tripling the STAT1 phosphorylation rate at reduces peak viral load by 27% (0.294 vs. 0.402) and accelerates clearance by 0.8 days relative to baseline. The ISG AUC increases by 85% (164.0 vs. 88.8), reflecting the amplified antiviral effector response. CXCL10 is reduced by 40% relative to baseline (2.495 vs. 4.163), because faster viral clearance shortens the duration of IRF1 activation.
Late IFN-(S2) provides modest benefit. When IFN- is administered at days (after peak viral load), viral clearance improves only marginally (4.0 vs. 4.3 days). The ISG AUC is paradoxically higher (243.0) because the prolonged viral replication phase generates more IRF1 activity before the drug takes effect, and the subsequent IFN boost then drives a large but belated ISG response.
Early JAK inhibition (S3) is counterproductive. Applying at reduces STAT1 phosphorylation and ISG expression (AUC 62.0 vs. 88.8), impairing the antiviral effector response. Peak viral load increases to 0.470 and clearance is delayed to 4.9 days. Critically, CXCL10 rises to 5.315 (vs. 4.163 at baseline) because prolonged viral replication drives more IRF1 activity, which feeds CXCL10 independently of STAT1. The direction of this result matches the observation of Ravlo et al. [11] that JAK inhibition can facilitate viral propagation, although the mechanisms differ: their effect arises from loss of interferon-stimulated gene expression in uninfected bystander cells, which a single-compartment model cannot represent.
Late JAK inhibition (S4) is safer but provides limited benefit. Delaying JAK inhibition to days preserves the early antiviral ISG response. Viral clearance is only marginally delayed (4.5 vs. 4.3 days), and STAT1 is reduced after the drug onset. However, CXCL10 remains virtually unchanged (4.217 vs. 4.163). In this model framework, where chemokine output reflects upstream IRF1 activity rather than secondary STAT1 signaling, JAK inhibition alone cannot extinguish the inflammatory signal once primary viral sensing has occurred.
RIG-I agonists (S5) accelerate clearance but amplify CXCL10. Boosting RIG-I sensing () reduces peak viral load (0.310) and accelerates clearance (3.6 days), comparable to early IFN-. However, the enhanced RIG-I–IRF1 signalling also drives a large CXCL10 response (6.822 vs. 4.163 at baseline), representing a significant immunopathology risk. This trade-off suggests that RIG-I agonists should be combined with CXCL10 neutralisation in severe disease.
Anti-CXCL10 mAb (S6) selectively suppresses immunopathology. Increasing the CXCL10 decay rate () reduces peak CXCL10 by 73% (1.109 vs. 4.163) without affecting viral dynamics (clearance 4.3 days, identical to baseline). Because CXCL10 does not feed back onto any other state variable, this invariance is a structural property of the model rather than an emergent result. Within this framework CXCL10 neutralisation acts only on the immunopathology axis and must be combined with an antiviral agent for therapeutic benefit.
Combination S7 (IFN-+ anti-CXCL10) is the optimal strategy. Scenario 7 achieves the best overall profile: fastest viral clearance (3.5 days, tied with S1), lowest peak CXCL10 (0.671, an 84% reduction from baseline), and high ISG AUC (164.0). By simultaneously boosting antiviral ISG expression and neutralising the immunopathological CXCL10 signal, this combination addresses both arms of the therapeutic dilemma. The antiviral metrics of S7 are identical to those of S1 by construction, so the incremental value of the combination lies entirely on the chemokine axis.
Sequential RIG-I agonistJAK inhibitor (S8) does not suppress CXCL10. Despite the sequential design intended to boost early antiviral immunity and then dampen late inflammation, CXCL10 remains elevated (6.825) throughout the simulation. This is because the JAK inhibitor, applied at days, reduces STAT1 but does not affect the IRF1–CXCL10 axis. The RIG-I agonist applied in the first phase has already driven substantial IRF1 activity, and the subsequent JAK inhibition cannot reverse this. This result highlights a key therapeutic constraint: when intense early PRR sensing drives an initial burst of IRF1, downstream intervention at the JAK–STAT node leaves this upstream chemokine drive intact. For pathologies driven heavily by primary viral sensing, direct effector neutralization (such as anti-CXCL10 antibodies) provides more targeted control than pathway-level kinase inhibition.
4. Discussion
4.1. The IFN-I Axis as the Primary Therapeutic Landscape
The transcriptomic and network analyses converge on the type I interferon signalling axis as the dominant host response to HTNV infection. The top-ranked hub proteins (ISG15, IRF1, CXCL10, STAT1, MX1, DDX58) are all components or effectors of this pathway. This is consistent with prior studies showing that hantavirus infection induces a strong but delayed IFN response, and that the magnitude of ISG induction correlates with both viral control and immunopathology [8,14]. The dual role of the IFN-I axis creates a therapeutic dilemma that cannot be resolved by targeting a single node: any intervention that broadly suppresses IFN signalling risks impairing antiviral immunity, while any intervention that broadly amplifies it risks exacerbating immunopathology.
Our ODE simulations make this dilemma quantitatively explicit. Early IFN- (S1) achieves the best antiviral outcome but does not eliminate CXCL10 (peak 2.495 vs. 4.163 at baseline). RIG-I agonists (S5) achieve comparable antiviral efficacy but drive CXCL10 to 6.822, a 64% increase over baseline. The only strategy that resolves the dilemma is combination therapy targeting both arms simultaneously (S7).
4.2. Timing Is Everything: The JAK Inhibitor Paradox
The most striking finding of the what-if analysis is the qualitative difference between early (S3) and late (S4) JAK inhibition. Early JAK inhibition is counterproductive: it delays viral clearance by 14% and paradoxically elevates CXCL10 by 28% relative to baseline. This result is mechanistically explained by the IRF1–CXCL10 axis: JAK inhibitors suppress STAT1-driven ISG transcription but do not affect IRF1 activity, which is driven by RIG-I upstream of the JAK–STAT cascade. When ISG-mediated viral suppression is impaired, viral replication continues longer, driving more RIG-I and IRF1 activity, and therefore more CXCL10. This is consistent in direction with Ravlo et al. [11], but it is not mechanistically equivalent, since their pro-viral effect is driven by loss of interferon-stimulated gene expression in uninfected bystander cells.
Late JAK inhibition (S4) avoids viral rebound by allowing the early antiviral ISG response to mature before kinase blockade is introduced. However, its capacity to attenuate immunopathology in this framework is limited. While JAK inhibitors downregulate STAT1-dependent CXCL10 expression in vivo, our model emphasizes that they leave the primary, RIG-I–IRF1-driven branch uninhibited. If high viral titers or lingering viral RNA continue to engage cytosolic sensors, upstream chemokine expression persists. Direct chemokine neutralization via anti-CXCL10 monoclonal antibodies circumvents this signaling split entirely, dampening the pathogenic chemoattractant gradient regardless of which upstream transcriptional program sustains it.
4.3. Combination Strategies: Antiviral Plus Immunomodulatory
The combination of IFN- with anti-CXCL10 mAb (S7) achieves the optimal profile across all five outcome metrics. This strategy mirrors the combination approach used in COVID-19 (remdesivir plus baricitinib). Complementarity between the antiviral and anti-inflammatory arms is imposed by the model structure rather than demonstrated by it, and it requires experimental testing. The practical implementation of S7 would require careful monitoring of CXCL10 levels to guide the timing and dose of the anti-CXCL10 component, as premature neutralisation before viral clearance could theoretically impair T-cell recruitment to the infected endothelium.
The sequential RIG-I agonist JAK inhibitor strategy (S8) is less effective than S7 because it fails to suppress CXCL10. This finding has a clear mechanistic explanation and a practical implication: if the goal is to reduce immunopathology in hantavirus, the therapeutic target should be CXCL10 itself (or its receptor CXCR3), not the JAK–STAT pathway.
4.4. VCP/CB-5083: A Mechanism-Independent Alternative
The VCP inhibitor CB-5083 represents a qualitatively different therapeutic strategy: rather than modulating the host immune response, it targets a host-dependency factor required for viral replication [20]. This approach is in principle advantageous in immunocompromised patients, in whom IFN-based therapies may be less effective. Two caveats limit near-term translation: the Phase 1 oncology programme for CB-5083 was terminated for off-target effects on visual function, and VCP inhibition in vivo has been reported to delay viral clearance and to cause muscle toxicity in a lymphocytic choriomeningitis virus model. Host-dependency targeting therefore carries its own safety and timing trade-offs rather than escaping them. VCP is not modelled in the current ODE system because it acts upstream of the IFN-I cascade (at the level of viral assembly/egress), but its inclusion in a future extended model would be straightforward.
4.5. Limitations
Several limitations should be acknowledged. First, the transcriptomic data derive from a single cell type (HUVECs) and a single hantavirus species (HTNV); generalisation to other hantaviruses and cell types requires validation. Second, the ODE model is phenomenological: parameters are estimated from qualitative literature evidence rather than fitted to quantitative experimental data. Specifically, Equation 7 models CXCL10 production solely as a function of IRF1 activity to isolate primary pattern-recognition signaling. While biologically CXCL10 transcription also receives substantial input from STAT1 via the IFNAR autocrine loop, omitting secondary STAT1-to-CXCL10 coupling allowed us to cleanly model the hazard of upstream PRR overactivation. Future multi-compartment models should incorporate dual IRF1/STAT1 promoter kinetics to evaluate partial kinase-mediated chemokine suppression. Equation 7 is not the only simplification of this kind: Equation 4 omits the STAT1 to IRF1 arm described in Section 3.2.3, even though IRF1 is itself an interferon-stimulated gene, and including it would lower IRF1 activity under JAK inhibition and could reverse the direction of the CXCL10 effect reported for S3. The model captures the topology and directionality of the IFN-I cascade but does not represent individual protein concentrations, post-translational modifications, or spatial compartmentalisation. Third, the model does not include pharmacokinetic/pharmacodynamic (PK/PD) components; drug onset is modelled as an instantaneous parameter switch rather than a concentration-time profile. Fourth, the drug–target interactions are based on known pharmacology and may not fully reflect hantavirus-specific biology. Fifth, the model does not represent adaptive immunity (T cells, B cells, antibodies), which plays a critical role in hantavirus disease outcome. Future work should incorporate PK/PD modelling, adaptive immune compartments, and parameter fitting to hantavirus-specific experimental data.
5. Conclusions
We present a three-stage computational framework for systematic drug repurposing in hantavirus infection. Network centrality analysis of the HTNV transcriptomic response identified 15 hub proteins in the IFN-I signalling cascade, of which six are druggable, yielding 12 repurposing candidates across four priority tiers. ODE-based molecular what-if simulations of eight drug perturbation scenarios reveal that: (i) early IFN- administration achieves the fastest viral clearance; (ii) under the assumption that CXCL10 is driven by IRF1 rather than by STAT1, early JAK inhibition is counterproductive, delaying clearance and elevating CXCL10; (iii) anti-CXCL10 monoclonal antibody selectively suppresses immunopathology without affecting viral dynamics; and (iv) the combination of IFN- with anti-CXCL10 mAb (Scenario 7) achieves the optimal balance of antiviral efficacy and immunopathology control. These findings provide a mechanistically grounded, evidence-ranked roadmap for hantavirus drug development, with immediate implications for the design of preclinical studies and phase-specific clinical trial protocols.
Supplementary Materials
The following supporting information can be downloaded at the website of this paper posted on Preprints.org. Supplementary Table S1: DESeq2 results for GSE133751 (HTNV vs mock HUVECs; n = 3 per group). Columns: gene, log₂ fold change, nominal p, BH-adjusted p, mean expression (HTNV, mock), FDR call (UP/DOWN/NS), and significance threshold. FDR DEGs: padj < 0.05 and |log₂FC| ≥ 1 (n = 11). Nominal set used for network analysis: p < 0.05 and |log₂FC| ≥ 1 (n = 203).
Author Contributions
Conceptualization, P.H.G., P.V., and F.M.G.; methodology, P.H.G.; software, P.H.G. and F.M.G.; validation, P.H.G. and F.B.; formal analysis, P.H.G.; investigation, P.H.G. and F.M.G.; resources, P.H.G. and P.V.; data curation, P.H.G.; writing—original draft preparation, P.H.G. and F.M.G.; writing—review and editing, P.H.G., F.B., P.V., and F.M.G.; visualization, P.H.G. and F.M.G.; supervision, P.H.G., F.B., P.V., and F.M.G.; project administration, P.H.G., F.B., P.V., and F.M.G.; funding acquisition, P.H.G. All authors have read and agreed to the published version of the manuscript.
Funding
This research received no external funding.
Institutional Review Board Statement
Not applicable.
Informed Consent Statement
Not applicable.
Data Availability Statement
The transcriptomic data used in this study are publicly available from the Gene Expression Omnibus (GEO accession GSE133751).
Conflicts of Interest
The authors declare no conflicts of interest.
Abbreviations
The following abbreviations are used in this manuscript:
| DEG | Differentially expressed gene |
| GEO | Gene Expression Omnibus |
| GO:BP | Gene Ontology Biological Process |
| HCPS | Hantavirus cardiopulmonary syndrome |
| HFRS | Haemorrhagic fever with renal syndrome |
| HTNV | Hantaan virus |
| HUVEC | Human umbilical vein endothelial cell |
| IFN-I | Type I interferon |
| ISG | Interferon-stimulated gene |
| mAb | Monoclonal antibody |
| MR | Master regulator |
| ODE | Ordinary differential equation |
| PPI | Protein-protein interaction |
| RdRp | RNA-dependent RNA polymerase |
| RIG-I | Retinoic acid-inducible gene I |
| VCP | Valosin-containing protein |
References
- Jonsson, C.B.; Figueiredo, L.T.M.; Vapalahti, O. A global perspective on hantavirus ecology, epidemiology, and disease. Clin. Microbiol. Rev. 2010, 23, 412–441. [Google Scholar] [CrossRef] [PubMed]
- Vial, P.A.; Ferrés, M.; Vial, C.; Klingström, J.; Ahlm, C.; López, R.; Le Corre, N.; Mertz, G.J. Hantavirus in humans: a review of clinical aspects and management. Lancet Infect. Dis. 2023, 23, e371–e382. [Google Scholar] [CrossRef] [PubMed]
- Klingström, J.; Smed-Sörensen, A.; Maleki, K.T.; Rosendal, E.; Björkström, N.K.; Gredmark-Russ, S.; Stoltz, M.; Ahlm, C. Innate and adaptive immune responses against human Puumala virus infection: immunopathogenesis and suggestions for novel treatment strategies for severe hantavirus-associated syndromes. J. Intern. Med. 2019, 285, 510–523. [Google Scholar] [CrossRef] [PubMed]
- Kell, A.M.; Hemann, E.A.; Turnbull, J.B.; Gale, M., Jr. RIG-I-like receptor activation drives type I IFN and antiviral signaling to limit Hantaan orthohantavirus replication. PLoS Pathog. 2020, 16, e1008483. [Google Scholar] [CrossRef] [PubMed]
- Ma, H.; Han, P.; Ye, W.; Chen, H.; Zheng, X.; Cheng, L.; Zhang, L.; Yu, L.; Wu, X.; Xu, Z.; Lei, Y.; Zhang, F. The long noncoding RNA NEAT1 exerts antihantaviral effects by acting as positive feedback for RIG-I signaling. J. Virol. 2017, 91, e02250-16. [Google Scholar] [CrossRef] [PubMed]
- Schoggins, J.W. Interferon-stimulated genes: What do they all do? Annu. Rev. Virol. 2019, 6, 567–584. [Google Scholar] [CrossRef] [PubMed]
- Zhang, Y.; Liu, B.; Ma, Y.; Yi, J.; Zhang, C.; Zhang, Y.; Xu, Z.; Wang, J.; Yang, K.; Yang, A.; Zhuang, R.; Jin, B. Hantaan virus infection induces CXCL10 expression through TLR3, RIG-I, and MDA-5 pathways correlated with the disease severity. Mediat. Inflamm. 2014, 2014, 697837. [Google Scholar] [CrossRef] [PubMed]
- Si, Y.; Zhang, H.; Zhou, Z.; Zhu, X.; Yang, Y.; Liu, H.; Zhang, L.; Cheng, L.; Wang, K.; Ye, W.; Lv, X.; Zhang, X.; Hou, W.; Zhao, G.; Lei, Y.; Zhang, F.; Ma, H. RIPK3 promotes hantaviral replication by restricting JAK-STAT signaling without triggering necroptosis. Virol. Sin. 2023, 38, 741–754. [Google Scholar] [CrossRef] [PubMed]
- Guzzi, P.H.; Mercatelli, D.; Ceraolo, C.; Giorgi, F.M. Master regulator analysis of the SARS-CoV-2/human interactome. J. Clin. Med. 2020, 9, 982. [Google Scholar] [CrossRef] [PubMed]
- Barabási, A.-L.; Gulbahce, N.; Loscalzo, J. Network medicine: a network-based approach to human disease. Nat. Rev. Genet. 2011, 12, 56–68. [Google Scholar] [CrossRef] [PubMed]
- Ravlo, E.; Ianevski, A.; Skipperstøen, M.N.; Lysvand, H.; Schjølberg, J.-O.; Solheim, O.; Wang, W.; Kissova, M.; Vestvik, M.; Vapalahti, O.; et al. JAK inhibitors remove innate immune barriers facilitating viral propagation. NAR Mol. Med. 2025, 2, ugaf017. [Google Scholar] [CrossRef] [PubMed]
- Kirschner, D.E.; Hunt, C.A.; Marino, S.; Fallahi-Sichani, M.; Linderman, J.J. Tuneable resolution as a systems biology approach for multi-scale, multi-compartment computational models. WIREs Syst. Biol. Med. 2014, 6, 289–309. [Google Scholar] [CrossRef] [PubMed]
- Chakraborty, A.K. A perspective on the role of computational models in immunology. Annu. Rev. Immunol. 2017, 35, 403–439. [Google Scholar] [CrossRef] [PubMed]
- Lu, S.; Zhu, N.; Guo, W.; Wang, X.; Li, K.; Yan, J.; Jiang, C.; Han, S.; Xiang, H.; Wu, X.; Liu, Y.; Xiong, H.; Chen, L.; Gong, Z.; Luo, F.; Hou, W. RNA-seq revealed a circular RNA–microRNA–mRNA regulatory network in Hantaan virus infection. Front. Cell. Infect. Microbiol. 2020, 10, 97. [Google Scholar] [CrossRef] [PubMed]
- Kuleshov, M.V.; Jones, M.R.; Rouillard, A.D.; Fernandez, N.F.; Duan, Q.; Wang, Z.; Koplev, S.; Jenkins, S.L.; Jagodnik, K.M.; Lachmann, A.; et al. Enrichr: a comprehensive gene set enrichment analysis web server 2016 update. Nucleic Acids Res. 2016, 44, W90–W97. [Google Scholar] [CrossRef] [PubMed]
- Szklarczyk, D.; Kirsch, R.; Koutrouli, M.; Nastou, K.; Mehryary, F.; Hachilif, R.; Gable, A.L.; Fang, T.; Doncheva, N.T.; Pyysalo, S.; et al. The STRING database in 2023: protein–protein association networks and functional enrichment analyses for any sequenced genome of interest. Nucleic Acids Res. 2023, 51, D638–D646. [Google Scholar] [CrossRef] [PubMed]
- Ochoa, D.; Hercules, A.; Carmona, M.; Suveges, D.; Baker, J.; Malangone, C.; Lopez, I.; Miranda, A.; Cruz-Castillo, C.; Fumis, L.; et al. The next-generation Open Targets Platform: reimagined, redesigned, rebuilt. Nucleic Acids Res. 2023, 51, D1353–D1359. [Google Scholar] [CrossRef] [PubMed]
- Virtanen, P.; Gommers, R.; Oliphant, T.E.; Haberland, M.; Reddy, T.; Cournapeau, D.; Burovski, E.; Peterson, P.; Weckesser, W.; Bright, J.; et al. SciPy 1.0: fundamental algorithms for scientific computing in Python. Nat. Methods 2020, 17, 261–272. [Google Scholar] [CrossRef] [PubMed]
- Ivashkiv, L.B.; Donlin, L.T. Regulation of type I interferon responses. Nat. Rev. Immunol. 2014, 14, 36–49. [Google Scholar] [CrossRef] [PubMed]
- Royster, A.; Ren, S.; Ali, S.; Mir, S.; Mir, M. Modulations in the host cell proteome by the hantavirus nucleocapsid protein. PLoS Pathog. 2024, 20, e1011925. [Google Scholar] [CrossRef] [PubMed]
- Huggins, J.W.; Hsiang, C.M.; Cosgriff, T.M.; Guang, M.Y.; Smith, J.I.; Wu, J.O.; LeDuc, J.W.; Zheng, Z.M.; Meegan, J.M.; Wang, Q.N.; et al. Prospective, double-blind, concurrent, placebo-controlled clinical trial of intravenous ribavirin therapy of hemorrhagic fever with renal syndrome. J. Infect. Dis. 1991, 164, 1119–1127. [Google Scholar] [CrossRef] [PubMed]
- Spengler, J.R.; Welch, S.R.; Genzer, S.C.; Coleman-McCray, J.D.; Harmon, J.R.; Nichol, S.T.; Spiropoulou, C.F. Remdesivir inhibits Sin Nombre and Puumala hantavirus replication in primary human lung microvascular endothelial cells. Antivir. Res. 2019, 169, 104541. [Google Scholar] [CrossRef] [PubMed]
- Mayor, J.; Engler, O.; Rothenberger, S. Antiviral efficacy of ribavirin and favipiravir against Hantaan virus. Microorganisms 2021, 9, 1306. [Google Scholar] [CrossRef] [PubMed]
- Tamura, M.; Asada, H.; Kondo, K.; Takahashi, M.; Yamanishi, K. Effects of human and murine interferons against hemorrhagic fever with renal syndrome (HFRS) virus (Hantaan virus). Antivir. Res. 1987, 8, 171–178. [Google Scholar] [CrossRef]
- Stebbing, J.; Krishnan, V.; de Bono, S.; Ottaviani, S.; Casalini, G.; Richardson, P.J.; Monteil, V.; Mirazimi, A.; Youhanna, S.; Lauschke, V.M.; et al. Mechanism of baricitinib supports artificial intelligence-predicted testing in COVID-19 patients. EMBO Mol. Med. 2020, 12, e12697. [Google Scholar] [CrossRef] [PubMed]
Figure 1.
Volcano plot of differentially expressed genes in HTNV-infected HUVECs. Each point represents one gene; the x-axis shows log₂ fold change (HTNV vs. mock) and the y-axis shows −log₁₀(BH-adjusted p-value). Red: upregulated DEGs (padj < 0.05, |log₂FC| ≥ 1); blue: downregulated DEGs; grey: non-significant. Selected ISGs are labelled. Dashed lines indicate padj = 0.05 (horizontal) and |log₂FC| = 1 (vertical). Data from GEO accession GSE133751 (n = 3 per group) [14].
Figure 1.
Volcano plot of differentially expressed genes in HTNV-infected HUVECs. Each point represents one gene; the x-axis shows log₂ fold change (HTNV vs. mock) and the y-axis shows −log₁₀(BH-adjusted p-value). Red: upregulated DEGs (padj < 0.05, |log₂FC| ≥ 1); blue: downregulated DEGs; grey: non-significant. Selected ISGs are labelled. Dashed lines indicate padj = 0.05 (horizontal) and |log₂FC| = 1 (vertical). Data from GEO accession GSE133751 (n = 3 per group) [14].
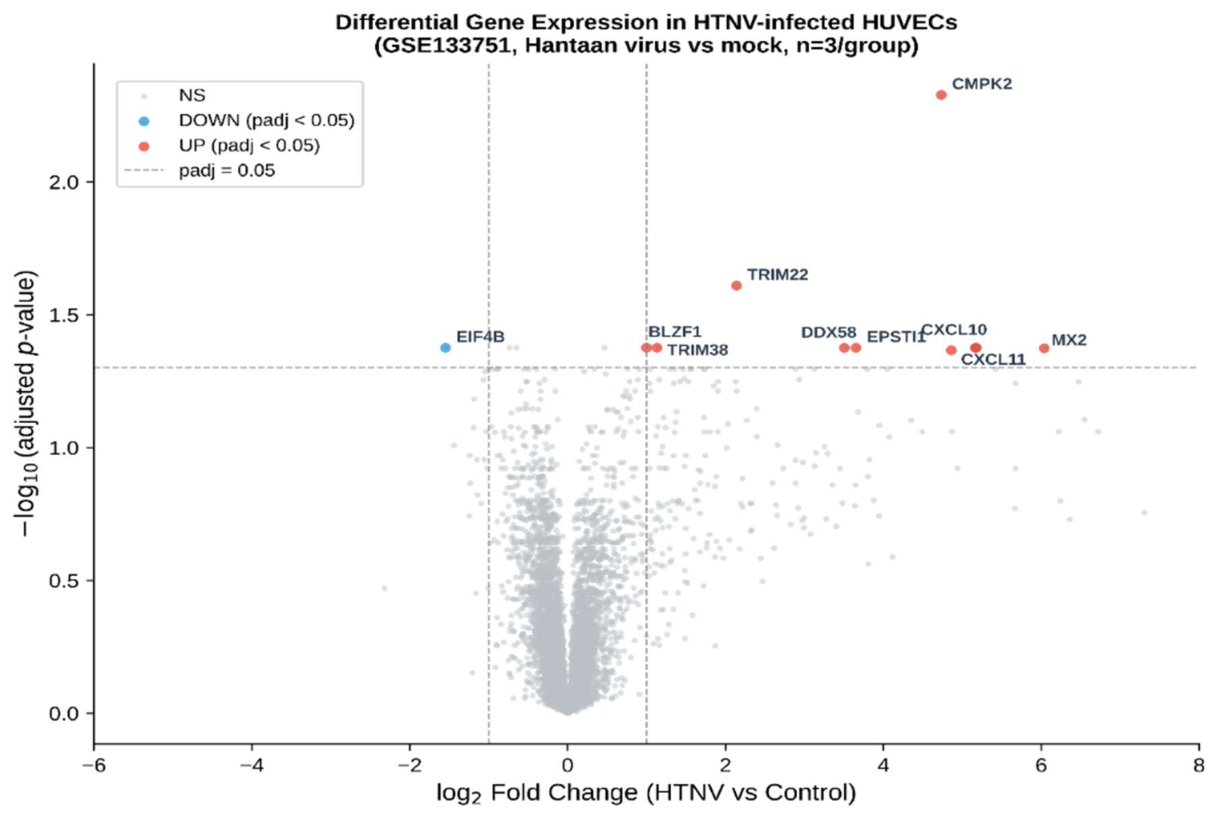
Figure 2.
PPI network of HTNV-responsive genes. Nodes represent proteins encoded by DEGs; edges represent STRING interactions (confidence
Figure 2.
PPI network of HTNV-responsive genes. Nodes represent proteins encoded by DEGs; edges represent STRING interactions (confidence
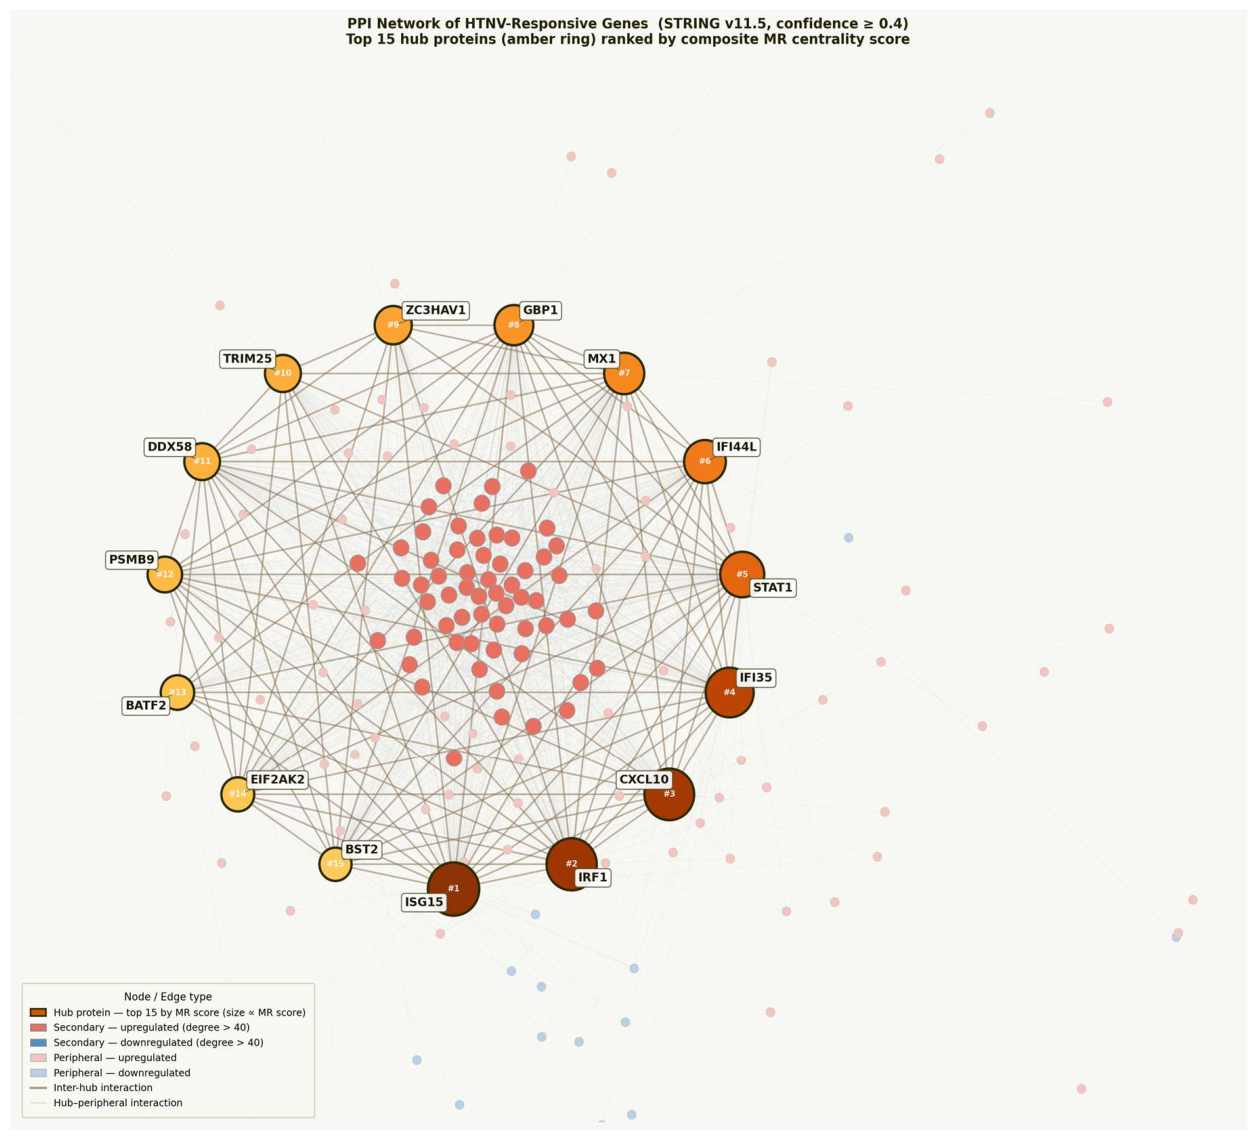
Figure 3.
Bipartite drug–target interaction network. Left nodes (squares) represent the 12 drug repurposing candidates, coloured by priority tier (Tier 1: dark blue; Tier 2: teal; Tier 3: orange; Tier 4: red). Right nodes (circles) represent the 11 targeted hub proteins. Edges connect each drug to its known or predicted molecular targets. Node size is proportional to the number of connections.
Figure 3.
Bipartite drug–target interaction network. Left nodes (squares) represent the 12 drug repurposing candidates, coloured by priority tier (Tier 1: dark blue; Tier 2: teal; Tier 3: orange; Tier 4: red). Right nodes (circles) represent the 11 targeted hub proteins. Edges connect each drug to its known or predicted molecular targets. Node size is proportional to the number of connections.
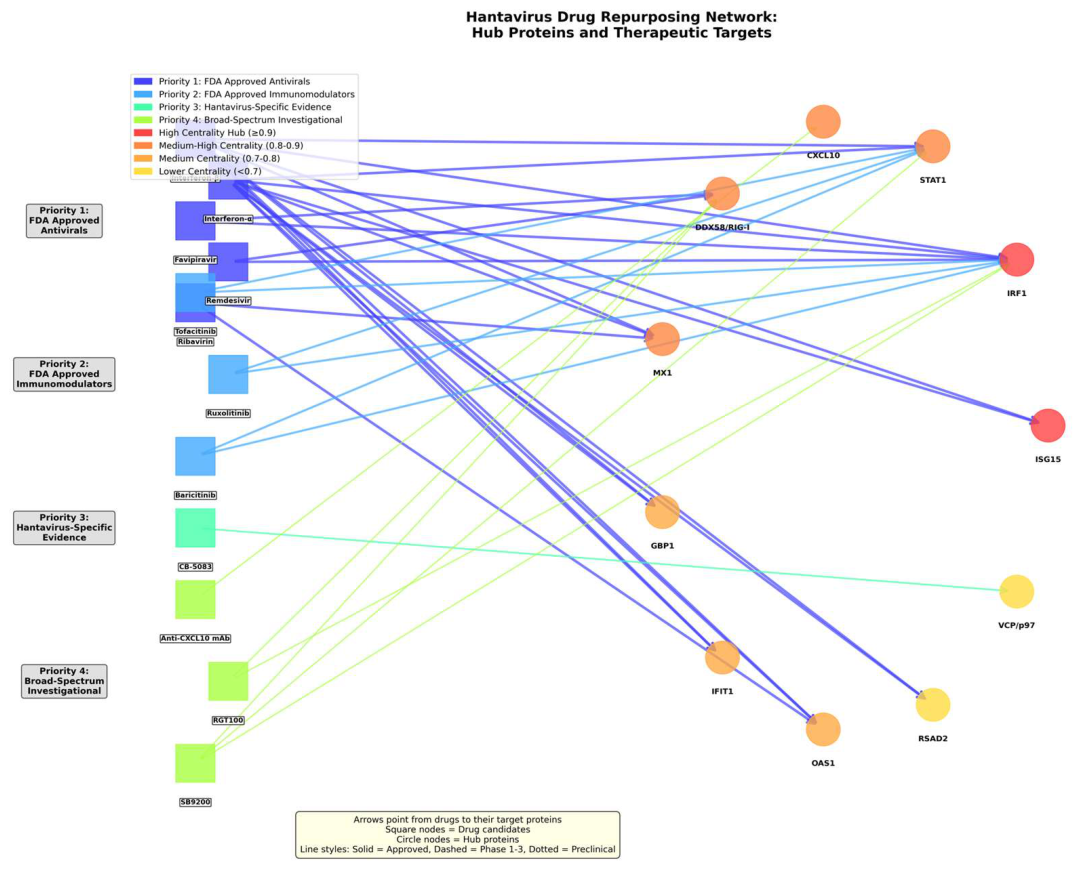
Figure 4.
Drug–target interaction heatmap. Rows represent the 12 drug repurposing candidates (grouped by priority tier); columns represent hub proteins. Filled cells indicate a known or predicted interaction. Row colour bars indicate priority tier. The heatmap highlights the broad coverage of the interferon axis (ISG15, IRF1, STAT1, MX1, OAS1, IFIT1) by Tier 1 agents and the selective targeting of STAT1 by Tier 2 JAK inhibitors.
Figure 4.
Drug–target interaction heatmap. Rows represent the 12 drug repurposing candidates (grouped by priority tier); columns represent hub proteins. Filled cells indicate a known or predicted interaction. Row colour bars indicate priority tier. The heatmap highlights the broad coverage of the interferon axis (ISG15, IRF1, STAT1, MX1, OAS1, IFIT1) by Tier 1 agents and the selective targeting of STAT1 by Tier 2 JAK inhibitors.
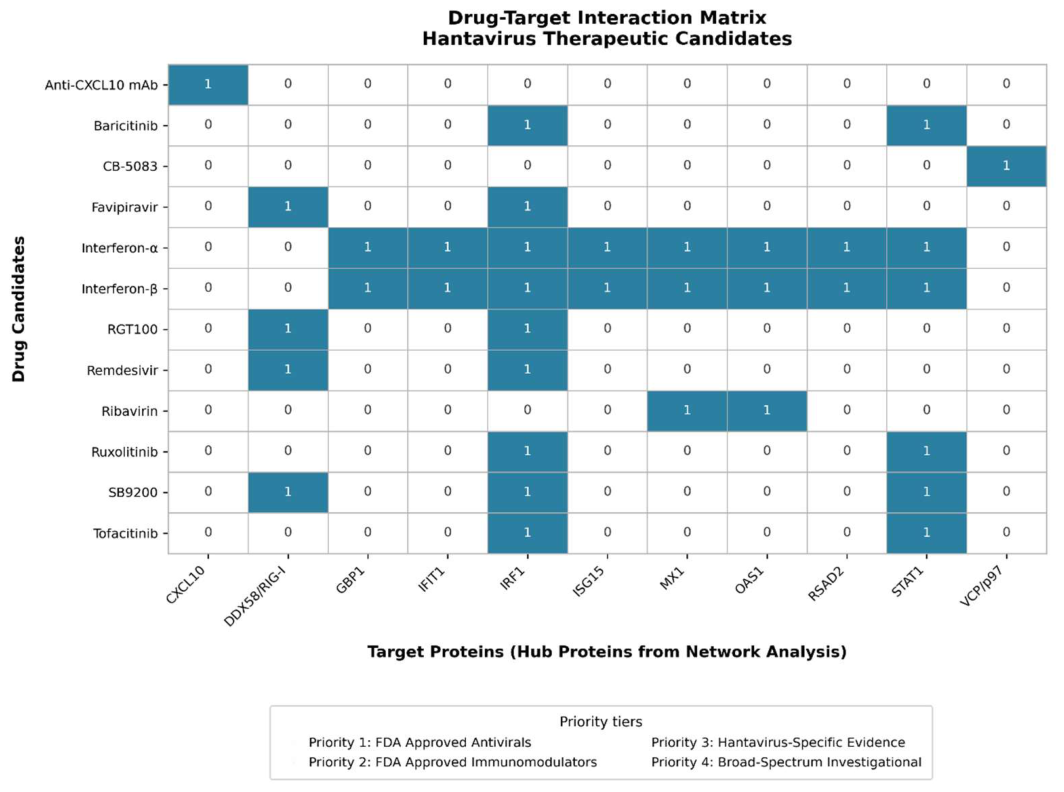
Figure 5.
Molecular what-if analysis: drug effects on the IFN-I signalling cascade. Each panel shows the time course of viral load (red), ISG composite (blue, normalised), CXCL10 (orange, normalised), and STAT1 (green dash-dot, normalised) for one drug scenario. Grey dashed lines show the drug-free baseline. Vertical dashed lines indicate drug onset at days (Scenarios S2, S4, S8). Red dotted vertical lines mark viral clearance time (). Panels A–H correspond to Scenarios S1–S8 as defined in Table 2.
Figure 5.
Molecular what-if analysis: drug effects on the IFN-I signalling cascade. Each panel shows the time course of viral load (red), ISG composite (blue, normalised), CXCL10 (orange, normalised), and STAT1 (green dash-dot, normalised) for one drug scenario. Grey dashed lines show the drug-free baseline. Vertical dashed lines indicate drug onset at days (Scenarios S2, S4, S8). Red dotted vertical lines mark viral clearance time (). Panels A–H correspond to Scenarios S1–S8 as defined in Table 2.
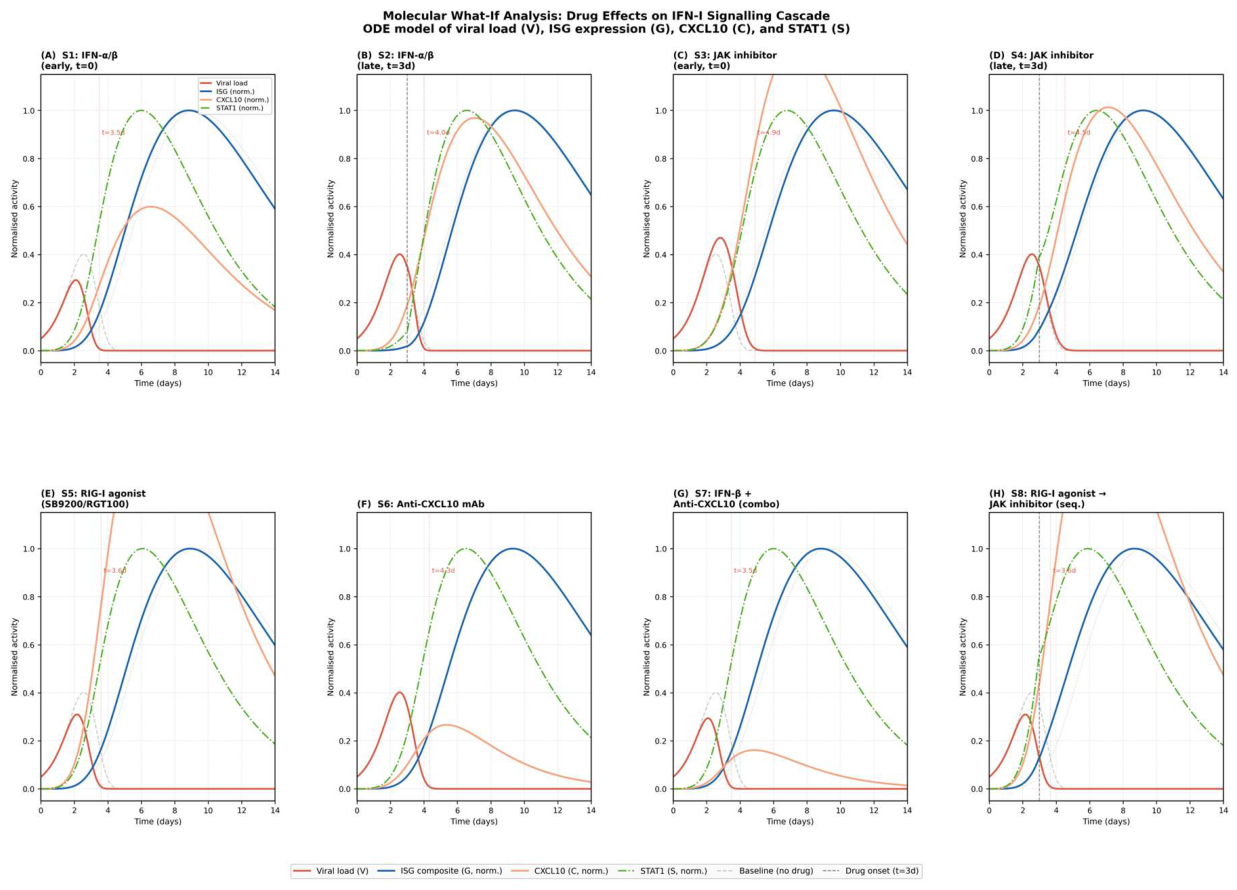

Table 1.
Baseline ODE model parameters. All parameters are dimensionless or in units of day−1 unless otherwise noted.
Table 1.
Baseline ODE model parameters. All parameters are dimensionless or in units of day−1 unless otherwise noted.
| Parameter | Symbol | Value | Interpretation |
| Viral replication rate | 1.2 | Logistic growth rate | |
| ISG antiviral suppression | 2.5 | MX1-like viral clearance | |
| RIG-I induction rate | 1.8 | Viral RNA sensing | |
| RIG-I half-activation | 0.3 | Hill constant | |
| Hill coefficient | 2.0 | Cooperative sensing | |
| RIG-I decay | 0.4 | Protein turnover | |
| IRF1 activation rate | 1.5 | RIG-I IRF1 | |
| IRF1 decay | 0.5 | Protein turnover | |
| STAT1 phosphorylation | 1.2 | IFN- autocrine loop | |
| JAK inhibitor effect | 0.0 | 0 = no drug | |
| STAT1 dephosphorylation | 0.6 | Phosphatase activity | |
| ISG induction rate | 1.0 | STAT1 ISG | |
| ISG decay | 0.3 | mRNA/protein turnover | |
| CXCL10 induction rate | 0.8 | IRF1 CXCL10 | |
| CXCL10 decay | 0.4 | Secretion/clearance |
Table 2.
Drug perturbation scenarios for the molecular what-if analysis. Parameter changes are applied as multipliers to baseline values. reduces STAT1 phosphorylation without affecting the IRF1–CXCL10 axis.
Table 2.
Drug perturbation scenarios for the molecular what-if analysis. Parameter changes are applied as multipliers to baseline values. reduces STAT1 phosphorylation without affecting the IRF1–CXCL10 axis.
| ID | Drug / Intervention | Mechanism | Parameter change | Onset |
|---|---|---|---|---|
| S1 | Boost STAT1 activation | |||
| S2 | Boost STAT1 activation | d | ||
| S3 | Baricitinib / Ruxolitinib | JAK1/2 inhibition | ||
| S4 | Baricitinib / Ruxolitinib | JAK1/2 inhibition | d | |
| S5 | SB9200 / RGT100 (RIG-I agonist) | Boost RIG-I sensing | ||
| S6 | Anti-CXCL10 mAb | CXCL10 neutralisation | ||
| S7 | + anti-CXCL10 mAb | Dual: ISG boost + CXCL10 block | ||
| S8 | JAK inhibitor | Sequential: boost then dampen | d) | d |
Table 3.
Top 15 hub proteins ranked by composite MR centrality score. Degree: number of interaction partners in the STRING network. MR score: composite min–max normalised score (Equation 1). Druggability: Open Targets tractability score (0–4).
Table 3.
Top 15 hub proteins ranked by composite MR centrality score. Degree: number of interaction partners in the STRING network. MR score: composite min–max normalised score (Equation 1). Druggability: Open Targets tractability score (0–4).
| Gene | Rank | Degree | Betweenness | Closeness | MR Score | Druggability |
| ISG15 | 1 | 100 | 0.0383 | 0.676 | 0.936 | 1 |
| IRF1 | 2 | 92 | 0.0384 | 0.663 | 0.912 | 0 |
| CXCL10 | 3 | 86 | 0.0394 | 0.639 | 0.902 | 4 |
| IFI35 | 4 | 96 | 0.0340 | 0.663 | 0.866 | 0 |
| STAT1 | 5 | 114 | 0.0229 | 0.726 | 0.791 | 2 |
| IFI44L | 6 | 67 | 0.0323 | 0.597 | 0.750 | 0 |
| MX1 | 7 | 88 | 0.0246 | 0.651 | 0.722 | 2 |
| GBP1 | 8 | 84 | 0.0242 | 0.632 | 0.703 | 2 |
| ZC3HAV1 | 9 | 49 | 0.0312 | 0.543 | 0.674 | 0 |
| TRIM25 | 10 | 51 | 0.0292 | 0.550 | 0.657 | 0 |
| DDX58 | 11 | 99 | 0.0162 | 0.676 | 0.652 | 2 |
| PSMB9 | 12 | 64 | 0.0242 | 0.581 | 0.636 | 0 |
| BATF2 | 13 | 36 | 0.0303 | 0.515 | 0.621 | 0 |
| EIF2AK2 | 14 | 76 | 0.0192 | 0.616 | 0.613 | 0 |
| BST2 | 15 | 70 | 0.0199 | 0.601 | 0.603 | 0 |
Table 4.
Drug repurposing candidates for hantavirus infection. Drugs are grouped by priority tier. Approval: regulatory status as of 2026.
Table 4.
Drug repurposing candidates for hantavirus infection. Drugs are grouped by priority tier. Approval: regulatory status as of 2026.
| Drug | Class | Mechanism | Impacted Network Proteins | Approval | Tier |
| Ribavirin | Nucleoside analogue | Viral RNA synthesis inhibitor | OAS1, MX1 | FDA approved | 1 |
| Remdesivir | Nucleoside analogue | RNA polymerase inhibitor | DDX58, IRF1 | FDA approved | 1 |
| Favipiravir | Pyrazine carboxamide | RNA polymerase inhibitor | DDX58, IRF1 | Approved (some countries) | 1 |
| Interferon- | Protein therapeutic | Type I IFN receptor agonist | ISG15, IRF1, STAT1, MX1, OAS1, IFIT1 | FDA approved | 1 |
| Interferon- | Protein therapeutic | Type I IFN receptor agonist | ISG15, IRF1, STAT1, MX1, OAS1, IFIT1 | FDA approved | 1 |
| Baricitinib | Small molecule | JAK1/JAK2 inhibitor | STAT1 | FDA approved | 2 |
| Ruxolitinib | Small molecule | JAK1/JAK2 inhibitor | STAT1 | FDA approved | 2 |
| Tofacitinib | Small molecule | JAK1/JAK3 inhibitor | STAT1 | FDA approved | 2 |
| CB-5083 | Small molecule | VCP/p97 inhibitor | VCP | Phase 1, terminated | 3 |
| SB9200 | Small molecule | RIG-I agonist | DDX58 | Discontinued (Phase 2) | 4 |
| RGT100 | Small molecule | RIG-I agonist | DDX58 | Phase 1 | 4 |
| Anti-CXCL10 mAb | Monoclonal antibody | CXCL10 neutralisation | CXCL10 | Preclinical/Phase 1 | 4 |
Table 5.
Summary metrics for the eight molecular what-if scenarios. Peak viral load: maximum of over 14 days. Clearance: first time at which . Peak CXCL10: maximum of . ISG AUC: . Peak STAT1: maximum of . Baseline values shown in the first row. Best value in each column is bold.
Table 5.
Summary metrics for the eight molecular what-if scenarios. Peak viral load: maximum of over 14 days. Clearance: first time at which . Peak CXCL10: maximum of . ISG AUC: . Peak STAT1: maximum of . Baseline values shown in the first row. Best value in each column is bold.
| Scenario | Peak viral | Clearance | Peak CXCL10 | ISG AUC | Peak STAT1 |
| load | (days) | (norm.) | (norm.) | ||
| Baseline (no drug) | 0.402 | 4.3 | 4.163 | 88.8 | 4.689 |
| ) | 0.294 | 3.5 | 2.495 | 164.0 | 8.454 |
| d) | 0.402 | 4.0 | 4.033 | 243.0 | 13.381 |
| ) | 0.470 | 4.9 | 5.315 | 62.0 | 3.319 |
| d) | 0.402 | 4.5 | 4.217 | 53.3 | 2.696 |
| S5: RIG-I agonist (SB9200/RGT100) | 0.310 | 3.6 | 6.822 | 148.9 | 7.702 |
| S6: Anti-CXCL10 mAb | 0.402 | 4.3 | 1.109 | 88.8 | 4.689 |
| + anti-CXCL10 (combo) | 0.294 | 3.5 | 0.671 | 164.0 | 8.454 |
| JAK inh. (seq.) | 0.310 | 3.6 | 6.825 | 90.6 | 4.463 |
Disclaimer/Publisher’s Note: The statements, opinions and data contained in all publications are solely those of the individual author(s) and contributor(s) and not of MDPI and/or the editor(s). MDPI and/or the editor(s) disclaim responsibility for any injury to people or property resulting from any ideas, methods, instructions or products referred to in the content. |
© 2026 by the authors. Licensee MDPI, Basel, Switzerland. This article is an open access article distributed under the terms and conditions of the Creative Commons Attribution (CC BY) license (http://creativecommons.org/licenses/by/4.0/).
Copyright: This open access article is published under a Creative Commons CC BY 4.0 license, which permit the free download, distribution, and reuse, provided that the author and preprint are cited in any reuse.